an improved silver ion hplc combined with capillary … · it ought to be emphasized that the...
TRANSCRIPT
An Improved Silver Ion HPLC Combined with CapillaryGas Chromatography of cis/trans Fatty Acids in AlimentaryFats and Human Milk Fat
Andrzej Stolyhwo & Jarosława Rutkowska
Received: 2 January 2012 /Accepted: 4 June 2012 /Published online: 19 June 2012# The Author(s) 2012. This article is published with open access at Springerlink.com
Abstract A technique of analysis is described using a silverion-loaded HPLC (Ag+/HPLC) column, gradient elution,and a laser light scattering detector followed by capillarygas chromatography (GC) for the determination of the fattyacid methyl ester (FAME) composition of rapeseed oil, therespective hydrogenated fat, some dietary fats, and humanmilk fat. With the use of Ag+/HPLC, FAMEs were separatedinto the following classes: saturated, trans-monounsaturated,cis-monounsaturated, trans–trans-di-unsaturated, trans–cis-di-unsaturated, cis–cis-di-unsaturated, and higher unsaturatedFAMEs. Within each class, partial separation of positionalisomers was also possible. Fractions of the eluate containingtrans and cis C18:1 were separately collected and re-analyzedby GC in order to quantitate the positional isomers eight transand nine cis in rapeseed oil and in human milk fat. Theprofiles of eight trans positional isomers in human milkfat and in hydrogenated rapeseed oil were alike but entirelydifferent from that of six C18:1 trans isomers in bovinemilk fat. Out of nine C18:1 cis isomers found in hydrogenatedfat, only C18:1-9c and C18:1-11c were found in bothhuman and bovine milk fat which may indicate somediscrimination which occurs for certain isomers in fattyacid metabolism.
Keywords trans fatty acids . Gas chromatography . Silverion-loaded HPLC . Laser light scattering detector .
Cold-pressed rapeseed oil . Hydrogenated fats . Humanmilk
Introduction
The Codex Alimentarius Commission 2004 has adopted adefinition proposed by the Danish delegations which is“trans fatty acids are defined as all the geometrical isomersof monounsaturated and polyunsaturated fatty acids (FAs)having nonconjugated (interrupted by at least one methylenegroup (–CH2–CH2–) carbon–carbon double bonds in thetrans configuration”. This includes the trans monoenes(mainly steroisomers of elaidic acid) and the trans isomersof polyunsaturated FAs (e.g., trans dienes, trans trienes etc.)with non-conjugated carbon–carbon double bonds, producedthrough hydrogenation of oils and fats (both vegetable andanimal/marine origin) in the presence of a suitable chemicalcatalyst. The definition, however, excludes conjugated transFAs present naturally in animal fats and their products thatinclude conjugated linoleic acid. The US FDA defined transFA as “unsaturated FAs that contain one or more isolated (i.e.,nonconjugated) double bonds in a trans configuration (Handaet al. 2010; USFDA 2010). In 2004, Denmark was the firstcountry that introduced a limitation on the content ofindustrially produced trans FAs in foods. USA andCanada were the first two countries to introduce themandatory declaration of trans FAs (CFIA 2008;USFDA 2010).
Following the abovementioned regulations, industrypractices regarding unsaturated fat hydrogenation changedover last 10 years. In practice, several temperature pointsexist near which critical effects in the reaction course are tobe expected. For example, a low-temperature (120 °C)
A. StolyhwoDepartment of Dietetics, University of Bydgoszcz,Unii Lubelskiej St. 4c,85-059 Bydgoszcz, Poland
J. Rutkowska (*)Department of Instrumental Analysis, Faculty of Human Nutritionand Consumer Sciences, Warsaw University of Life Sciences,Nowoursynowska St. 159c,02-776 Warsaw, Polande-mail: [email protected]
Food Anal. Methods (2013) 6:457–469DOI 10.1007/s12161-012-9454-y
hydrogenation may result in less than 20 % of trans FA.However, the so obtained fats would not meet the requirementsof baking, confectionery, and frying processes. Fats for bakingrequire a long plastic range. One of the approaches isthe so-called trans-suppressive hydrogenation in whichthe melting point is being approached gradually and, inconsequence, the solid fat content or solid fat indexcurves are flatter than normal as required of a shortening orof baking fats. In that approach, a fresh or nearly fresh nickelcatalyst is used at the usual nickel/oil level (0.05–0.15 %), thepressure of up to 5 at and temperature up to 160 °C. In case thetexture of that fat does not meet the requirements, fullyhardened vegetable oil (3–5 %) is being added. On theother hand, hydrogenation above 160 °C renders bestfunctional properties of confectionery fats due to anincreased content of trans-isomers (Patterson 2009).
The principal structural changes of hydrogenated fats areas follows:
& Structural (positional) isomerization of FAs whichinvolve the migration of double bonds from the mostabundant Δ-9 or Δ-11 positions along the hydrocarbonchain of unsaturated FA
& Geometrical isomerization in which the cis isomers ofFAs (exclusively present in plant oils) are convertedduring hydrogenation to their trans analogs. The processis associated with structural (positional) isomerization
Physiological Consequences of trans-Fatty Acids Intake
The use of hydrogenated fats for human consumptionprovokes controversial discussions, between nutritionistsand representatives of the fat industry, regarding thehealth effects of trans-isomers of unsaturated FAs (Wolf1995; Lichtenstein 1993; Applewhite 1993; Haumann1994; Mensink and Katan 1990; Willet et al. 1993; Juddet al. 1994; Lopez-Garcia et al. 2005), one of the effectsbeing a negative impact on prostacyclin synthesis.Namely, trans FAs contained in hydrogenated fats cannot serveas precursors for prostacyclin synthesis and, additionally,inhibit that synthesis. Moreover, trans FAs get incorporatedinto the membrane lipids of blood vessels and muscles, thusdisplacing the essential linoleic, linolenic, and arachidonicacids (Kummerow et al. 2004).
At present, partially hydrogenated fats are one of themain components of different spreads, margarine blends,creamers, etc. They are also hidden in considerable quantitiesin bakery products, French fries, and other commercialproducts. Consequently, their occurrence may be expected inhuman structural lipids. trans FA isomers detected in humanmilk (Wolff 1995; Chen et al. 1995; Picciano and Perkins1977; Koletzko et al. 1988); Craig-Schmidt et al. (1984)
reported a linear correlation between the trans isomer contentsin human milk and in dietary fat, the content of trans FAisomers in human milk ranging from 1.3 to 7 % (Chen et al.1995).
The significance of an early intake of trans FAs wasreviewed by Larqué et al. (2001). Infant tissues incorporatetrans FAs from maternal milk thus raising the level of linoleicacid and relatively decreasing those of arachidonic anddocosahexaenoic acids. This suggests an inhibitory effect oftrans FAs on liver Δ-6 fatty-acid desaturase activity. Incontrast to blood and liver, the brain appears to be protectedfrom the trans fatty acid accumulation in experimentalanimals but no data have yet been reported for humannewborns. Further investigations in human beings areneeded to definitively establish the potential physiologicalconsequences of trans FA intake during the neonatal period(Larque et al. 2001).
Determination of trans-Fatty Acids in Alimentary Fats
In order to determine the composition of hydrogenated fatsand their suitability for human consumption, the analyticalmethods used should be capable of determining allchanges in the molecular structures of FAs and triacyl-glycerols, the products of industrial hydrogenation ofplant oils. It ought to be emphasized that the officialAOAC methods 985.21 or 965.35 are not selective orprecise enough for characterizing structural changes inhydrogenated fats (AOAC 1990a, b).
Delmonte and Rader (2007) focused on some criticalaspects of trans FA quantitation by current methodologiesdescribed in AOAC Official Method 996.06 and AOCSmethod Ce 1h-05. The cited authors concluded that in asmuch those methods were based on 100 m highly polarcapillary columns and, preferably, hydrogen as a carrier,several FAs belonging to different classes (i.e., saturated,trans FAs, and mono- and polyunsaturated) are still notadequately separated. Fractionation by liquid chromatographyprior to gas chromatography (GC) analysis can eliminate theco-elution of FAs belonging to different classes but incorrectpractices might lead to greater analytical errors than thosecaused by those co-elution procedures that affect direct GCanalysis (AOCS 2005; AOAC 2005; Delmonte and Rader2007). Some modifications of the abovementioned standardGC methods that enable separation of C18:1 12-t andC18:1 13-t isomers occurring in significant levels but oftenremaining unresolved from the C18:1 9-cis peak, wereproposed by Philllips et al. (2010).
Ratnayake and Beare-Rogers (1990) showed that in gas–liquid chromatography (GLC) even the use of a long fusedsilica column (60 m×0.25 mm ID) coated with a 50-μm filmof SP-2340 (biscyanopropylphenylpolysiloxane) is not
458 Food Anal. Methods (2013) 6:457–469
sufficient for an adequate separation of positional andgeometric isomers of monounsaturated FA in margarinescontaining hydrogenated fats. As a remedy, more selec-tive separations of FA isomers became possible with theuse of argentation chromatography, in particular withthe introduction of stable ion-exchange HPLC columnsloaded with silver ions (Christie 1987; Stefanow et al.1988; Christie et al. 1988). Christie and Breckenridge(1989) successfully used such columns for the separation offenacyl derivatives of geometrical and positional (partialseparation) isomers of FAs, as well as for a completeseparation of the molecular species of triacylglycerolswith different stereospecific structures (Christie 1988,1991). Application of silver-loaded columns requires,however, the use of a gradient elution technique whichcreates problems in detection of the separated FAs ortriacylglycerols. A prefractionation of cis and trans FAscould be performed by silver-ion thin-layer chromatography.Destaillats et al. (2007) compared that technique with the pre-separation by RP-HPLC (according to Juanéda 2002), directquantification by gas–liquid chromatography and with theestimation by applying triacyloglycerols formulas to milkfat. They reported that accurate measurement of total transC18:1 and of vaccenic acid, the principal trans C18:1 isomerin milk fat, can be performed by direct GLC under optimumchromatographic conditions (Golay et al. 2006). The analysisof isomeric distribution of trans C18:1 could not be achievedby direct GLC analysis since a fractionation step was required.RP-HPLC fractionation does not allow minor trans C18:1isomers, such as trans 4/5 C18:1 isomers, to be isolated(Destaillats et al. 2007).
Lipids, in general, are known not to absorb UV radiationover 220 nm. In contrast, solvents that could preferentiallybe used for HPLC-gradient elution of fatty acid methyl ester(FAME) and triacyloglycerols are not UV-transparent below220 nm. The laser light scattering detector (LLSD)described earlier (Stolyhwo et al. 1983, 1984, 1985, 1987)with several recent technical modifications, appears to be avery useful detecting device for use with both silver-loaded orRP columns in gradient elution HPLC. The merits ofLLSD detectors were emphasized in the AOCS Ce 1g-96 instruction for detecting trans-isomers by silver ion-exchange HPLC. In this study, a split-flow device wasplaced before the detector and fraction collection wasmonitored by the detector which enabled collectingpeaks free of impurities (AOCS 2009).
The aim of the study was to adapt the methods of capillarygas chromatography and silver ion chromatography combinedwith the modified laser light scattering detector (Ag+/HPLC/LLSD) for the determination of structural changes of fattyacids in hydrogenated fats and for monitoring the presenceand content of structural and geometric isomers of FAs indietary fats and in human milk.
Material and Methods
Samples and Reagents
Virgin rapeseed oil was obtained in the laboratory bycold-pressing fresh rapeseeds in a stainless steel, laboratory-scale hydraulic press. Samples of palm oil were obtained fromthe Institute de Corp Gras (Pessac, France). Samples ofhydrogenated rapeseed oil and fat for baking came fromthe Olivit factory (Gdansk, Poland). Samples of stickmargarine were purchased at a grocery store. Frenchfries were purchased at a fast food restaurant in Warsaw(Poland). Samples of human milk were collected undercontrolled conditions and kindly donated by one of ourfriends who nourished her baby. Samples of bovinemilk originated from a farm located in central Poland.
Acetonitrile, hexane, and dichloromethane wereLiChrosolv grade (E. Merck, Darmstadt, Germany). Acetoneand 2-propanol (AR grade) were obtained from PolishChemical Reagents (Gliwice, Poland). Before use, the lattertwo solvents were filtered using a 0.2-μm filter and distilled.Before and during analyses all solvents were sparked withhelium. FAMEs and their cis/trans isomer standards werepurchased from Sigma Aldrich (Poland).
Fat Extraction
Fat was extracted from milk samples according to the methodof Rose-Gottlieb (AOACmethod no. 905.02) (AOAC 1990c).Crushed French fries were dried and then extracted in aSoxhlet extractor with hexane–methylene chloride 50/50 v/v.After filtration, the solvents were evaporated under vacuum.FAMEs were prepared by saponification of samples with0.5 N sodium hydroxide in methanol. The resulting soapswere converted directly to the FAME with 14 % BF3 solutionin methanol according to AOAC Method 969.33 (AOAC1990d). Isomerization of rapeseed oil was carried out by theuse of nitrous oxides. A diluted solution of sodium nitritewas vigorously shaken with the oil followed by drop-wise addition of diluted nitric acid while shaking.
Instrumentation and Procedures
GC analyses were carried out on a Hewlett-Packard Model6890 GC using split-injection (120:1), flame ionizationdetector, and Rtx 2330 column (Restek Corp. Bellefonte, PA;105m×0.25mm filledwith fused silica and containing 0.20μmfilm of biscyanopropylphenylpolysiloxane). The initial columntemperature (150 °C) was kept for 25 min, then increased at arate of 2 °C/min up to 205 °C; FID range was 16 pA.
HPLC analyses for the separation of FAME isomersutilized a silver-loaded column (ChromSpher 5 Lipids,250×4.6 mm ID, Chrompack, Middelburg, the Netherlands).
Food Anal. Methods (2013) 6:457–469 459
The following solvents were used: hexane–methylene chloride90/10 v/v, methylene chloride/acetone 10/90 v/v, and acetoneand acetone/acetonitrile 20/80. Gradient elution: t (min)00,100 % A; t08.0, 88 %A/12 %B; t028.0, 85 %A/15 %B; t036.0, 72 %A/28 %B; t056.0, 52 %A/28 %B/20 %C; t070.0,1 %B/98 %C/1 %D; and t090.0, 80 %C/20 %D. A Hewlett-Packard pump (model 1050), HP 3396 integrator andthe LLSD prepared at the laboratory were used forHPLC.
The previously reported experimental design of LLSD(Stolyhwo et al. 1983, 1984) was substantially modified. Inbrief, a laser diode (5 mW at 670 nm; Toshiba, Japan) wasused at a controlled working temperature (40±2 °C) in placeof a He–Ne laser. A 4-mm wide glass fiber optics (GlassWorks, Bialystok, Poland) for transmission of scattered radi-ation and a photomultiplier (R-372HA, Hammamatsu, Japan)were used together with a chopper-stabilized operational am-plifier (CMOS). The essential difference between the ELSD(Varex Corp. USA) and the locally made LLSD (Stolyhwo etal. 1983, 1984, 1985, 1987) consisted of optimizing the LLSDfor the lowest possible work temperature at which the eluatefrom the column was nebulized and the solvents evaporated.That aim was accomplished by restricting the maximum flowrate to the nebulizer to 0.2 mL/min (stream splitter withcontrolled resistance to flow used before the nebulizer). Lim-itation of the eluate flow reduced the amount of heat (hencenebulizer and drift tube temperature) supplied to the nebulizerfor solvent vaporization. Consequently, the geometry andmechanical dimensions of the LLSD were optimized. Thereduced eluent flow rate and optimized geometry of the LLSDimproved its quantitative characteristics. At present, the LLSDenables detecting methyl laurate C12:0 in acetone at thetemperature of the nebulizer and drift not exceeding 30 °C.
For the isolation of fractions from the HPLC column, theeluate containing individual peaks or groups of peaks wascollected manually into a tapered borosilicate vials (ClearGOLD, Chromacol Ltd., Welwyn Garden, Great Britain) usinga stream splitter installed just before the nebulizer of the LLSD.In order to confirm the identification of individually collectedFAMEs, their fractions from the HPLC were then re-injectedinto the GC. Retention times (RT) of separated peaks werecompared with those of corresponding standards. Quantitativecharacteristics of the LLSD detector were reported earlier(Stolyhwo et al. 1984).
Results and Discussion
Separation of Structural and Geometric Isomers of FattyAcids from Cold-Pressed Rapeseed Oil
The FAMEs of cold-pressed rapeseed oil may be separatedinto individual components by capillary GC on the Rtx 2330
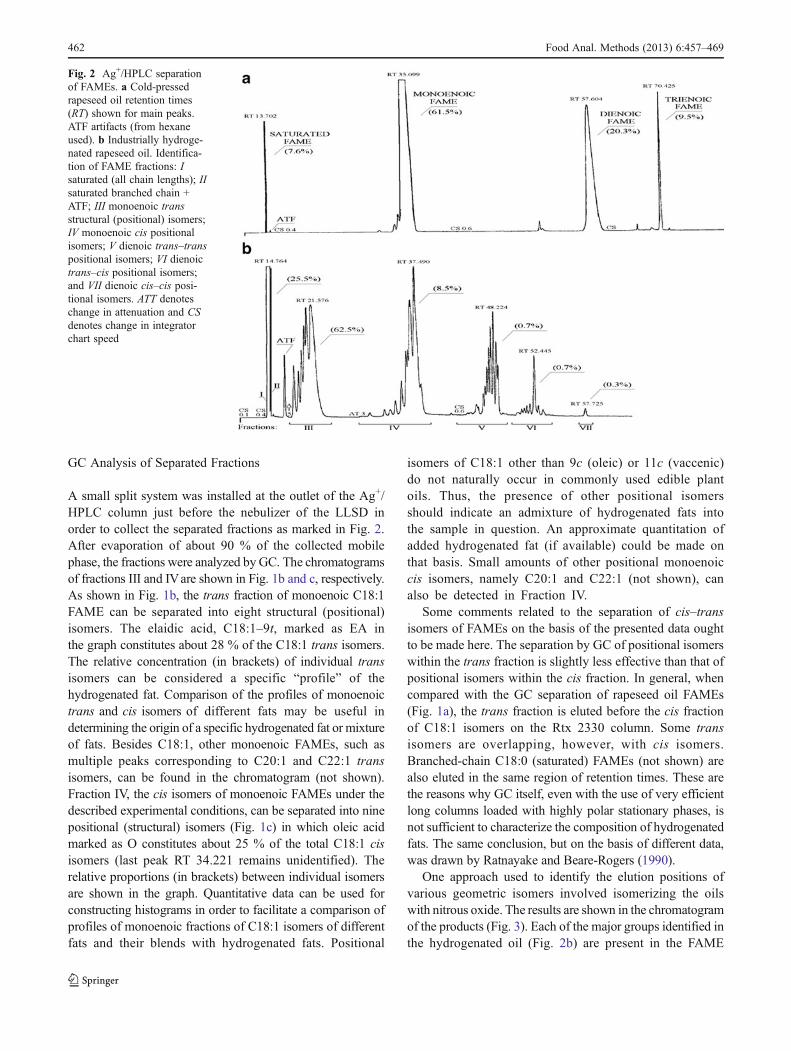
column or into classes, according to the number of doublebonds and geometrical structure in the FA molecules, withthe use of Ag+/HPLC. The HPLC separation may beconducted on a silver-loaded column using gradientelution and the LLSD. Examples of such separationsare shown in Figs. 1a and 2a. The results in Fig. 1aindicate two naturally occurring cis isomers of C18:1–9c(oleic acid; 53.1 %) and 11c, vaccenic acid (3.3 %) inrapeseed oil. Other monounsaturated FAMEs, C16:1,C20:1, and C22:1, are also accompanied by thecorresponding cis isomers with double bonds shifted in thehydrocarbon chain by two carbon atoms like in the oleic acid.Separation of the above isomers by GC was accomplishedwith the use of a very polar stationary phase.
In Ag+ HPLC, the interactions of π electrons of FAs withsilver ions are very strong (Christie et al. 1988). Thus, thesilver-loaded column is very selective with respect to thenumber of double bonds, geometric configuration, and thepositions of double bonds in the FA molecules. This isclearly shown in Fig. 2a in which rapeseed FAMEs areseparated on a silver-loaded column into saturated, mono,di-, and tri-unsaturated classes of compounds. The elution ofFAME classes with increasing numbers of double bondsrequires switching the mobile phase composition to muchstronger solvents from hexane to methylene chloride, acetoneand, finally, to acetonitrile as shown in Fig. 2a. It is essentialthat column regeneration in HPLC experiments be donecarefully with dry solvents according to the manufacturer’sspecifications. The order of regeneration must be exactlyopposite to that used in the original gradient in the volumeratios included in the graphs. The temperature must remainconstant to within ±1 °C. While some changes in RT may beobserved, the elution pattern remains constant at properregeneration of the column.
The column is not selective with respect to the chain lengthof FAs. Small peaks corresponding to C16:1, C20:1, andC22:1, just before the C18:1–9c peak, were separated fromthe main peak because of different positions of double bondsin the FA molecule with respect to the carboxyl group.Another group of small peaks eluted before the large di- andtri-unsaturated peaks are the positional and/or geometricisomers of di- and tri-unsaturated FAMEs, respectively;these were probably generated during saponification andmethylation of FAs. The peaks in Fig. 2a were identified aftercollecting fractions from HPLC into small tapered glass vialsand partial preconcentration followed by re-injection into theGC column.
Ag+/HPLC and GC Separation of FA’s of HydrogenatedRapeseed Oil
The separation of FAMEs contained in the industriallyhydrogenated rapeseed oil is shown in Fig. 2b. In order
460 Food Anal. Methods (2013) 6:457–469
to more clearly show the composition of both the principal andminor components of a sample, various classes of separatedanalytes were recorded at different attenuations and integratorchart speeds (as marked in Fig. 2b) by the letters AT and CS,respectively. The order of elution depends, as expected, on theinteraction of different FAMEs with the packing material. Atthe beginning, all the saturated FAMEs, fraction I, are elutedirrespectively of the hydrocarbon chain length. The smallpeak, fraction II, just after the saturated FAMEs, is related tothe saturated branched chain FAs which may be formed insmall quantities during the process of industrial catalytichydrogenation of rapeseed oil. Also, impurities adsorbedfrom hexane during the regeneration of the column maybe present in this peak. The peak marked ATF is suchan impurity from hexane as confirmed by a blank run
(not shown). The group of peaks marked as fraction IIIcorresponds to monoenoic FAMEs, all of trans configuration.Individual peaks in this group correspond to structural (posi-tional) monoenoic trans isomers. This was also confirmed byGC as discussed below. The next group of peaks (fraction IV)corresponds to structural (positional) monoenoic isomers, all ofcis configuration. The later elution of cis isomers with respectto trans isomers is related to a stronger interaction of silver ionswith π electrons in cis double bonds than in the trans ones. Thesubsequent groups of peaks (fractions V, VI, and VII), corre-spond to the structural (positional) isomers of dienoic C18:2(linoleic acid) having trans–trans, cis–trans, and cis–cis con-figurations, respectively. The monoenoic trans isomers areknown to quantitatively dominate in hydrogenated fats,therefore the GC analysis of those fractions was not presented.
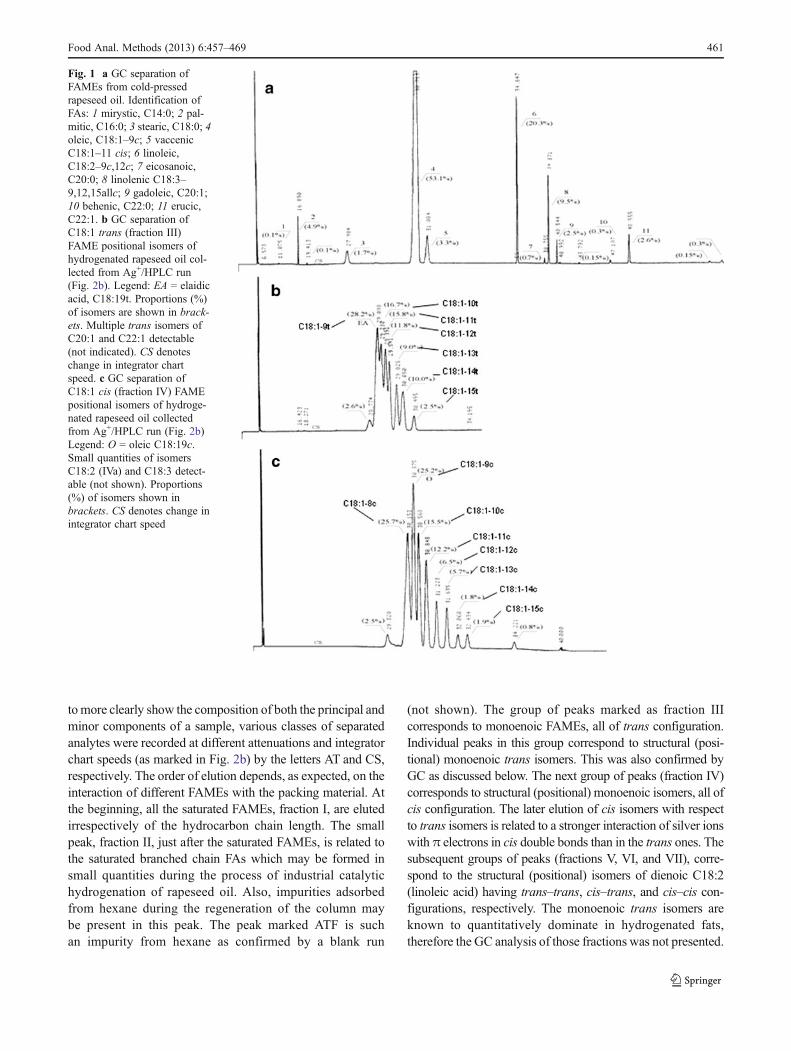
Fig. 1 a GC separation ofFAMEs from cold-pressedrapeseed oil. Identification ofFAs: 1 mirystic, C14:0; 2 pal-mitic, C16:0; 3 stearic, C18:0; 4oleic, C18:1–9c; 5 vaccenicC18:1–11 cis; 6 linoleic,C18:2–9c,12c; 7 eicosanoic,C20:0; 8 linolenic C18:3–9,12,15allc; 9 gadoleic, C20:1;10 behenic, C22:0; 11 erucic,C22:1. b GC separation ofC18:1 trans (fraction III)FAME positional isomers ofhydrogenated rapeseed oil col-lected from Ag+/HPLC run(Fig. 2b). Legend: EA 0 elaidicacid, C18:19t. Proportions (%)of isomers are shown in brack-ets. Multiple trans isomers ofC20:1 and C22:1 detectable(not indicated). CS denoteschange in integrator chartspeed. c GC separation ofC18:1 cis (fraction IV) FAMEpositional isomers of hydroge-nated rapeseed oil collectedfrom Ag+/HPLC run (Fig. 2b)Legend: O 0 oleic C18:19c.Small quantities of isomersC18:2 (IVa) and C18:3 detect-able (not shown). Proportions(%) of isomers shown inbrackets. CS denotes change inintegrator chart speed
Food Anal. Methods (2013) 6:457–469 461
GC Analysis of Separated Fractions
A small split system was installed at the outlet of the Ag+/HPLC column just before the nebulizer of the LLSD inorder to collect the separated fractions as marked in Fig. 2.After evaporation of about 90 % of the collected mobilephase, the fractions were analyzed by GC. The chromatogramsof fractions III and IVare shown in Fig. 1b and c, respectively.As shown in Fig. 1b, the trans fraction of monoenoic C18:1FAME can be separated into eight structural (positional)isomers. The elaidic acid, C18:1–9t, marked as EA inthe graph constitutes about 28 % of the C18:1 trans isomers.The relative concentration (in brackets) of individual transisomers can be considered a specific “profile” of thehydrogenated fat. Comparison of the profiles of monoenoictrans and cis isomers of different fats may be useful indetermining the origin of a specific hydrogenated fat or mixtureof fats. Besides C18:1, other monoenoic FAMEs, such asmultiple peaks corresponding to C20:1 and C22:1 transisomers, can be found in the chromatogram (not shown).Fraction IV, the cis isomers of monoenoic FAMEs under thedescribed experimental conditions, can be separated into ninepositional (structural) isomers (Fig. 1c) in which oleic acidmarked as O constitutes about 25 % of the total C18:1 cisisomers (last peak RT 34.221 remains unidentified). Therelative proportions (in brackets) between individual isomersare shown in the graph. Quantitative data can be used forconstructing histograms in order to facilitate a comparison ofprofiles of monoenoic fractions of C18:1 isomers of differentfats and their blends with hydrogenated fats. Positional
isomers of C18:1 other than 9c (oleic) or 11c (vaccenic)do not naturally occur in commonly used edible plantoils. Thus, the presence of other positional isomersshould indicate an admixture of hydrogenated fats intothe sample in question. An approximate quantitation ofadded hydrogenated fat (if available) could be made onthat basis. Small amounts of other positional monoenoiccis isomers, namely C20:1 and C22:1 (not shown), canalso be detected in Fraction IV.
Some comments related to the separation of cis–transisomers of FAMEs on the basis of the presented data oughtto be made here. The separation by GC of positional isomerswithin the trans fraction is slightly less effective than that ofpositional isomers within the cis fraction. In general, whencompared with the GC separation of rapeseed oil FAMEs(Fig. 1a), the trans fraction is eluted before the cis fractionof C18:1 isomers on the Rtx 2330 column. Some transisomers are overlapping, however, with cis isomers.Branched-chain C18:0 (saturated) FAMEs (not shown) arealso eluted in the same region of retention times. These arethe reasons why GC itself, even with the use of very efficientlong columns loaded with highly polar stationary phases, isnot sufficient to characterize the composition of hydrogenatedfats. The same conclusion, but on the basis of different data,was drawn by Ratnayake and Beare-Rogers (1990).
One approach used to identify the elution positions ofvarious geometric isomers involved isomerizing the oilswith nitrous oxide. The results are shown in the chromatogramof the products (Fig. 3). Each of the major groups identified inthe hydrogenated oil (Fig. 2b) are present in the FAME
Fig. 2 Ag+/HPLC separationof FAMEs. a Cold-pressedrapeseed oil retention times(RT) shown for main peaks.ATF artifacts (from hexaneused). b Industrially hydroge-nated rapeseed oil. Identifica-tion of FAME fractions: Isaturated (all chain lengths); IIsaturated branched chain +ATF; III monoenoic transstructural (positional) isomers;IV monoenoic cis positionalisomers; V dienoic trans–transpositional isomers; VI dienoictrans–cis positional isomers;and VII dienoic cis–cis posi-tional isomers. ATT denoteschange in attenuation and CSdenotes change in integratorchart speed
462 Food Anal. Methods (2013) 6:457–469
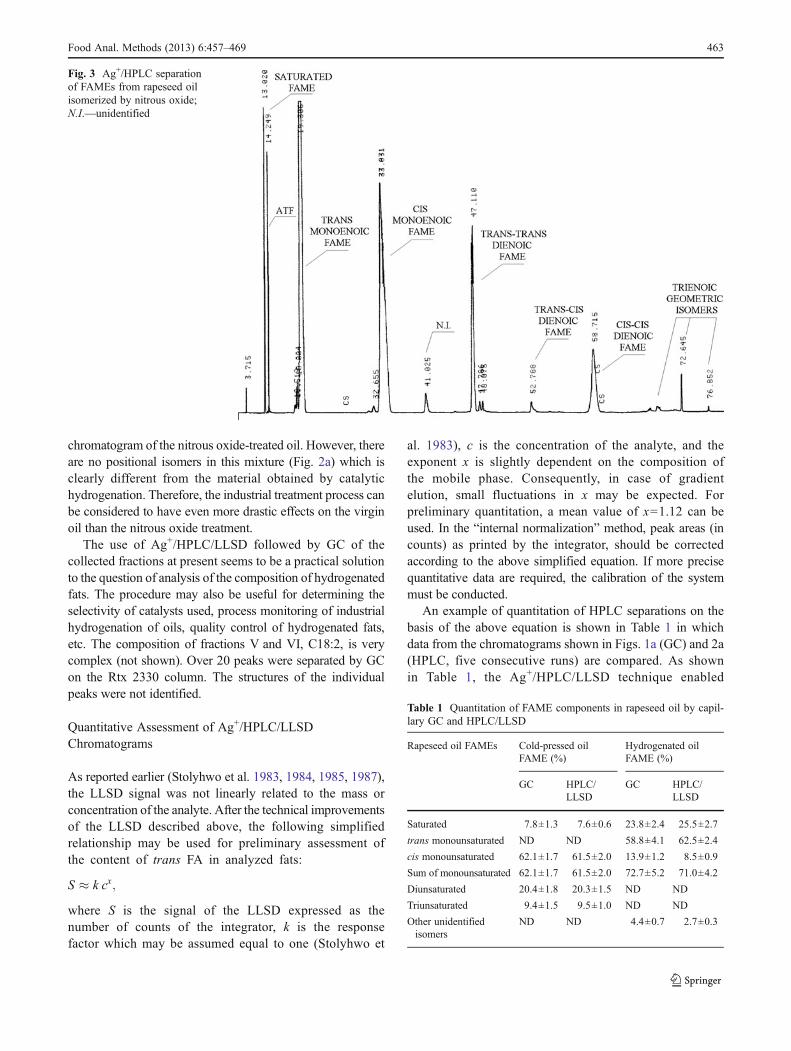
chromatogram of the nitrous oxide-treated oil. However, thereare no positional isomers in this mixture (Fig. 2a) which isclearly different from the material obtained by catalytichydrogenation. Therefore, the industrial treatment process canbe considered to have even more drastic effects on the virginoil than the nitrous oxide treatment.
The use of Ag+/HPLC/LLSD followed by GC of thecollected fractions at present seems to be a practical solutionto the question of analysis of the composition of hydrogenatedfats. The procedure may also be useful for determining theselectivity of catalysts used, process monitoring of industrialhydrogenation of oils, quality control of hydrogenated fats,etc. The composition of fractions V and VI, C18:2, is verycomplex (not shown). Over 20 peaks were separated by GCon the Rtx 2330 column. The structures of the individualpeaks were not identified.
Quantitative Assessment of Ag+/HPLC/LLSDChromatograms
As reported earlier (Stolyhwo et al. 1983, 1984, 1985, 1987),the LLSD signal was not linearly related to the mass orconcentration of the analyte. After the technical improvementsof the LLSD described above, the following simplifiedrelationship may be used for preliminary assessment ofthe content of trans FA in analyzed fats:
S � k cx;
where S is the signal of the LLSD expressed as thenumber of counts of the integrator, k is the responsefactor which may be assumed equal to one (Stolyhwo et
al. 1983), c is the concentration of the analyte, and theexponent x is slightly dependent on the composition ofthe mobile phase. Consequently, in case of gradientelution, small fluctuations in x may be expected. Forpreliminary quantitation, a mean value of x01.12 can beused. In the “internal normalization” method, peak areas (incounts) as printed by the integrator, should be correctedaccording to the above simplified equation. If more precisequantitative data are required, the calibration of the systemmust be conducted.
An example of quantitation of HPLC separations on thebasis of the above equation is shown in Table 1 in whichdata from the chromatograms shown in Figs. 1a (GC) and 2a(HPLC, five consecutive runs) are compared. As shownin Table 1, the Ag+/HPLC/LLSD technique enabled
Fig. 3 Ag+/HPLC separationof FAMEs from rapeseed oilisomerized by nitrous oxide;N.I.—unidentified
Table 1 Quantitation of FAME components in rapeseed oil by capil-lary GC and HPLC/LLSD
Rapeseed oil FAMEs Cold-pressed oilFAME (%)
Hydrogenated oilFAME (%)
GC HPLC/LLSD
GC HPLC/LLSD
Saturated 7.8±1.3 7.6±0.6 23.8±2.4 25.5±2.7
trans monounsaturated ND ND 58.8±4.1 62.5±2.4
cis monounsaturated 62.1±1.7 61.5±2.0 13.9±1.2 8.5±0.9
Sum of monounsaturated 62.1±1.7 61.5±2.0 72.7±5.2 71.0±4.2
Diunsaturated 20.4±1.8 20.3±1.5 ND ND
Triunsaturated 9.4±1.5 9.5±1.0 ND ND
Other unidentifiedisomers
ND ND 4.4±0.7 2.7±0.3
Food Anal. Methods (2013) 6:457–469 463
demonstrating that in spite of the desired selective saturationof the double bonds of linolenic (C18:3) and linoleic (C18:2)acids, the principal process of industrial hydrogenation of oilresults in the formation of isomers of FAs, structural(positional) and geometric (cis/trans), the positionalisomerization being the prevailing process. Both cisand trans isomers are positionally isomerized as shownin Fig. 2b. The second process is geometric isomerization. Inthis case, 62.6 % of the total FAs (about 88 % of C18:1 FA) isconverted into trans isomers. Assuming that the peak RT37.490 corresponds to oleic acid C18:1–9c, it is possibleto estimate from the integrated chromatogram (not shown)that only 2.3% of themonounsaturated FA left in hydrogenatedoil is neither structurally nor geometrically isomerized.Differences in the contents of trans and cis isomers,resulting from the use of GC or HPLC (Table 1), weredue to the earlier reported overlapping (Delmonte andRader 2007, AOCS Ce 1h-05).
Taking into consideration the above analytical resultsindicating considerable changes of FA structure of hydrogenatedfats, as well as the randomization of triacylglycerols which takesplaces during hydrogenation, the utilization of these fats asregular dietary components may indeed be regarded ascontroversial. Some examples of analyses by Ag+/HPLC/LLSD of products containing hydrogenated fatsare presented below.
Determination of Hydrogenated Fats in Food Products
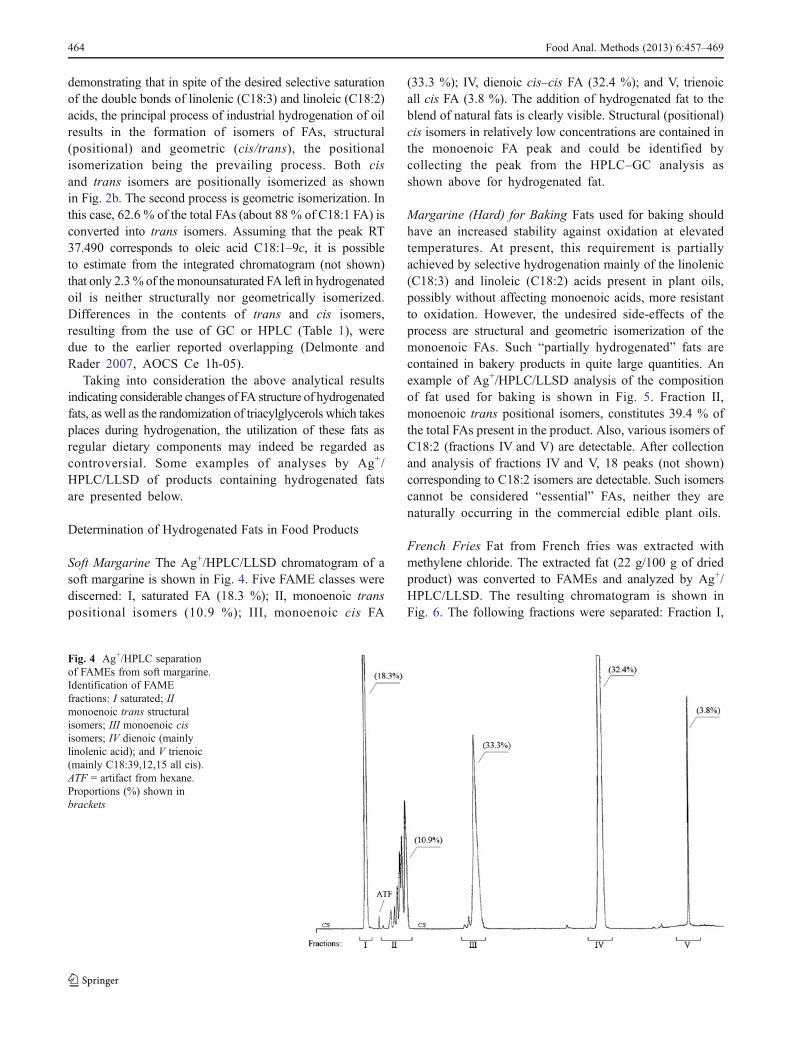
Soft Margarine The Ag+/HPLC/LLSD chromatogram of asoft margarine is shown in Fig. 4. Five FAME classes werediscerned: I, saturated FA (18.3 %); II, monoenoic transpositional isomers (10.9 %); III, monoenoic cis FA
(33.3 %); IV, dienoic cis–cis FA (32.4 %); and V, trienoicall cis FA (3.8 %). The addition of hydrogenated fat to theblend of natural fats is clearly visible. Structural (positional)cis isomers in relatively low concentrations are contained inthe monoenoic FA peak and could be identified bycollecting the peak from the HPLC–GC analysis asshown above for hydrogenated fat.
Margarine (Hard) for Baking Fats used for baking shouldhave an increased stability against oxidation at elevatedtemperatures. At present, this requirement is partiallyachieved by selective hydrogenation mainly of the linolenic(C18:3) and linoleic (C18:2) acids present in plant oils,possibly without affecting monoenoic acids, more resistantto oxidation. However, the undesired side-effects of theprocess are structural and geometric isomerization of themonoenoic FAs. Such “partially hydrogenated” fats arecontained in bakery products in quite large quantities. Anexample of Ag+/HPLC/LLSD analysis of the compositionof fat used for baking is shown in Fig. 5. Fraction II,monoenoic trans positional isomers, constitutes 39.4 % ofthe total FAs present in the product. Also, various isomers ofC18:2 (fractions IV and V) are detectable. After collectionand analysis of fractions IV and V, 18 peaks (not shown)corresponding to C18:2 isomers are detectable. Such isomerscannot be considered “essential” FAs, neither they arenaturally occurring in the commercial edible plant oils.
French Fries Fat from French fries was extracted withmethylene chloride. The extracted fat (22 g/100 g of driedproduct) was converted to FAMEs and analyzed by Ag+/HPLC/LLSD. The resulting chromatogram is shown inFig. 6. The following fractions were separated: Fraction I,
Fig. 4 Ag+/HPLC separationof FAMEs from soft margarine.Identification of FAMEfractions: I saturated; IImonoenoic trans structuralisomers; III monoenoic cisisomers; IV dienoic (mainlylinolenic acid); and V trienoic(mainly C18:39,12,15 all cis).ATF 0 artifact from hexane.Proportions (%) shown inbrackets
464 Food Anal. Methods (2013) 6:457–469
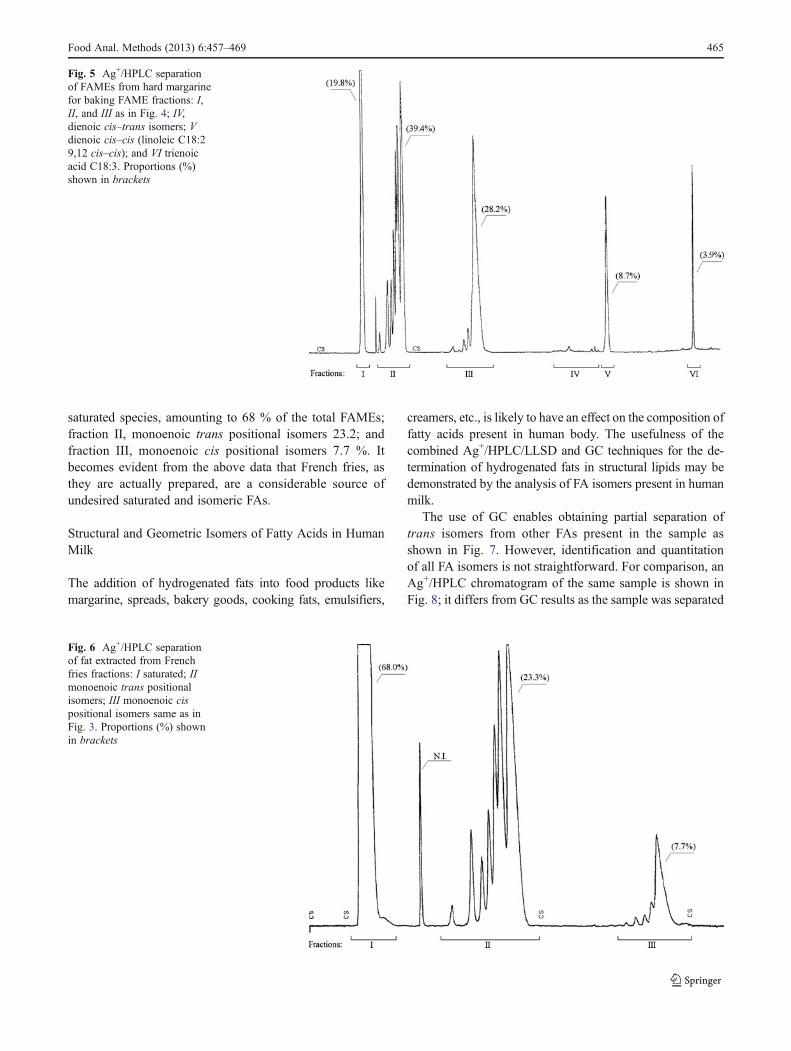
saturated species, amounting to 68 % of the total FAMEs;fraction II, monoenoic trans positional isomers 23.2; andfraction III, monoenoic cis positional isomers 7.7 %. Itbecomes evident from the above data that French fries, asthey are actually prepared, are a considerable source ofundesired saturated and isomeric FAs.
Structural and Geometric Isomers of Fatty Acids in HumanMilk
The addition of hydrogenated fats into food products likemargarine, spreads, bakery goods, cooking fats, emulsifiers,
creamers, etc., is likely to have an effect on the composition offatty acids present in human body. The usefulness of thecombined Ag+/HPLC/LLSD and GC techniques for the de-termination of hydrogenated fats in structural lipids may bedemonstrated by the analysis of FA isomers present in humanmilk.
The use of GC enables obtaining partial separation oftrans isomers from other FAs present in the sample asshown in Fig. 7. However, identification and quantitationof all FA isomers is not straightforward. For comparison, anAg+/HPLC chromatogram of the same sample is shown inFig. 8; it differs from GC results as the sample was separated
Fig. 5 Ag+/HPLC separationof FAMEs from hard margarinefor baking FAME fractions: I,II, and III as in Fig. 4; IV,dienoic cis–trans isomers; Vdienoic cis–cis (linoleic C18:29,12 cis–cis); and VI trienoicacid C18:3. Proportions (%)shown in brackets
Fig. 6 Ag+/HPLC separationof fat extracted from Frenchfries fractions: I saturated; IImonoenoic trans positionalisomers; III monoenoic cispositional isomers same as inFig. 3. Proportions (%) shownin brackets
Food Anal. Methods (2013) 6:457–469 465
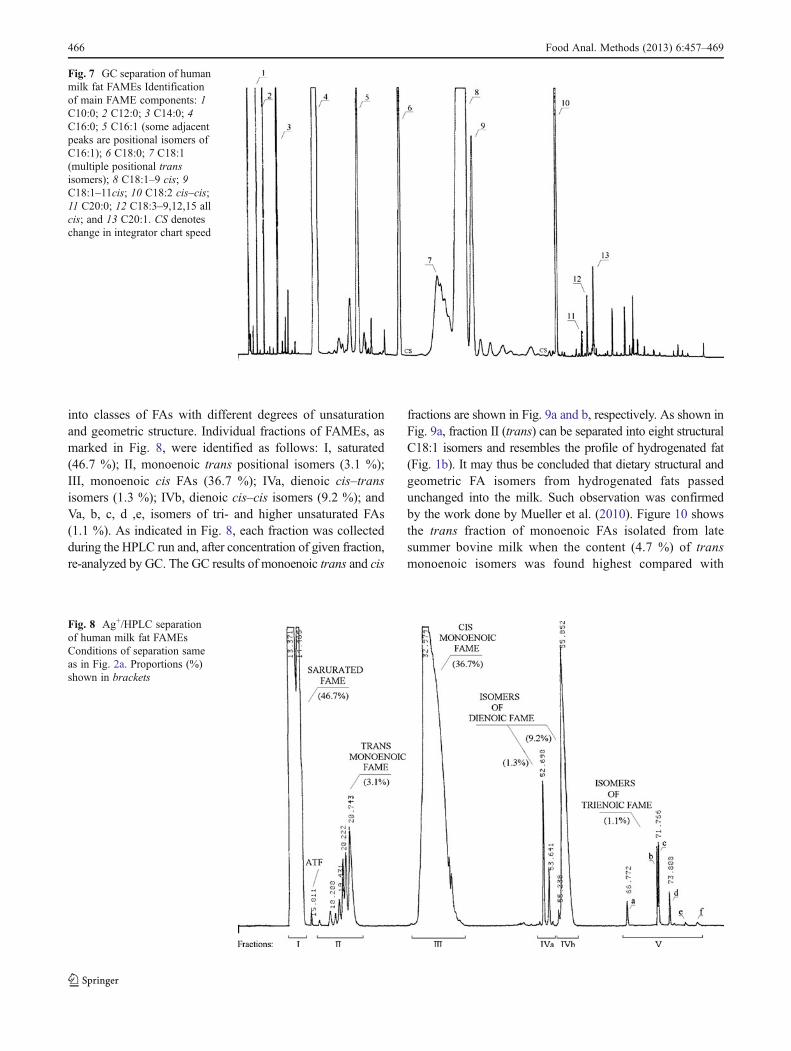
into classes of FAs with different degrees of unsaturationand geometric structure. Individual fractions of FAMEs, asmarked in Fig. 8, were identified as follows: I, saturated(46.7 %); II, monoenoic trans positional isomers (3.1 %);III, monoenoic cis FAs (36.7 %); IVa, dienoic cis–transisomers (1.3 %); IVb, dienoic cis–cis isomers (9.2 %); andVa, b, c, d ,e, isomers of tri- and higher unsaturated FAs(1.1 %). As indicated in Fig. 8, each fraction was collectedduring the HPLC run and, after concentration of given fraction,re-analyzed by GC. The GC results of monoenoic trans and cis
fractions are shown in Fig. 9a and b, respectively. As shown inFig. 9a, fraction II (trans) can be separated into eight structuralC18:1 isomers and resembles the profile of hydrogenated fat(Fig. 1b). It may thus be concluded that dietary structural andgeometric FA isomers from hydrogenated fats passedunchanged into the milk. Such observation was confirmedby the work done by Mueller et al. (2010). Figure 10 showsthe trans fraction of monoenoic FAs isolated from latesummer bovine milk when the content (4.7 %) of transmonoenoic isomers was found highest compared with
Fig. 7 GC separation of humanmilk fat FAMEs Identificationof main FAME components: 1C10:0; 2 C12:0; 3 C14:0; 4C16:0; 5 C16:1 (some adjacentpeaks are positional isomers ofC16:1); 6 C18:0; 7 C18:1(multiple positional transisomers); 8 C18:1–9 cis; 9C18:1–11cis; 10 C18:2 cis–cis;11 C20:0; 12 C18:3–9,12,15 allcis; and 13 C20:1. CS denoteschange in integrator chart speed
Fig. 8 Ag+/HPLC separationof human milk fat FAMEsConditions of separation sameas in Fig. 2a. Proportions (%)shown in brackets
466 Food Anal. Methods (2013) 6:457–469
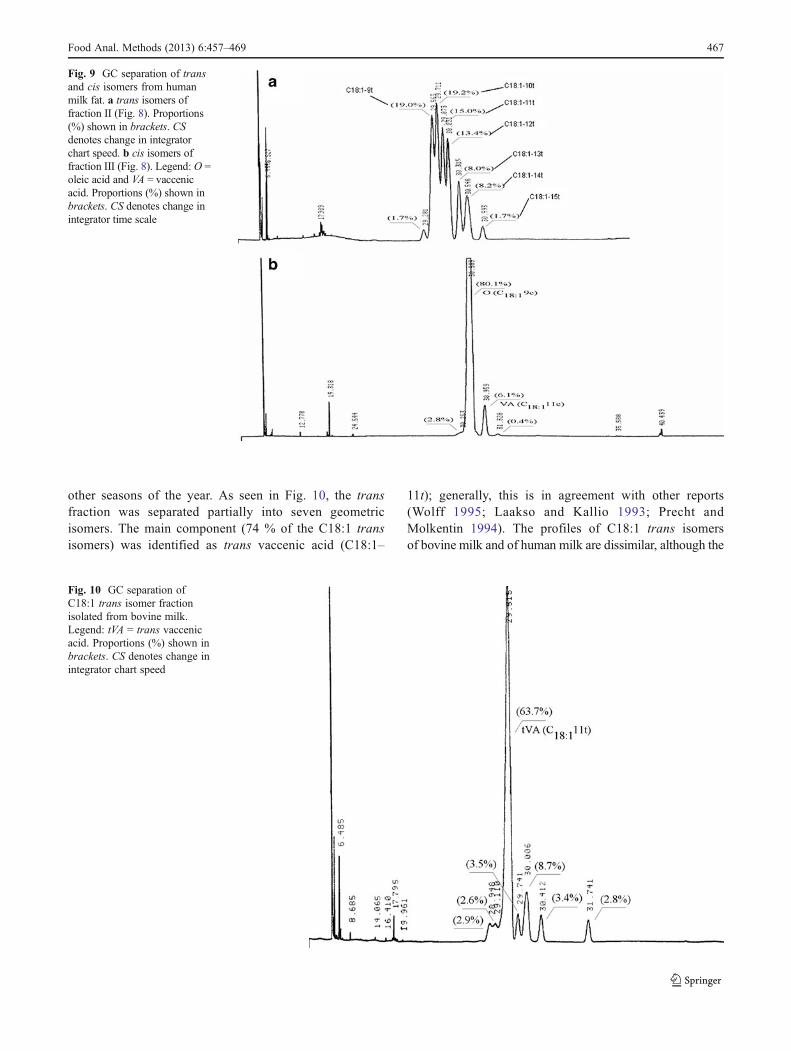
other seasons of the year. As seen in Fig. 10, the transfraction was separated partially into seven geometricisomers. The main component (74 % of the C18:1 transisomers) was identified as trans vaccenic acid (C18:1–
11t); generally, this is in agreement with other reports(Wolff 1995; Laakso and Kallio 1993; Precht andMolkentin 1994). The profiles of C18:1 trans isomersof bovine milk and of human milk are dissimilar, although the
Fig. 9 GC separation of transand cis isomers from humanmilk fat. a trans isomers offraction II (Fig. 8). Proportions(%) shown in brackets. CSdenotes change in integratorchart speed. b cis isomers offraction III (Fig. 8). Legend: O 0oleic acid and VA 0 vaccenicacid. Proportions (%) shown inbrackets. CS denotes change inintegrator time scale
Fig. 10 GC separation ofC18:1 trans isomer fractionisolated from bovine milk.Legend: tVA 0 trans vaccenicacid. Proportions (%) shown inbrackets. CS denotes change inintegrator chart speed
Food Anal. Methods (2013) 6:457–469 467
latter may be slightly affected by C18:1–11t from dairyproducts contained in woman’s diet. Beside C18:1, othermonoenoic trans FA isomers were detected in the transfraction of human milk as shown in the chromatogram.As can be seen in Fig. 9b, in contrast to the transfraction, the C18:1 cis fraction of FAs in human milkcontains virtually only two structural isomers: oleicC18:1–9c, and vaccenic C18:1–11c, which are the onlymonoenoic FAs naturally occurring in plant oils. Otherstructural cis isomers present in large quantities in hy-drogenated fats (Fig. 1c), and hence in dietary fats,occur in human milk only in negligible quantities. It isinteresting that a similar cis fraction of C18:1 in bovinemilk fat also contains exclusively oleic and vaccenicacids. It was not possible to detect other cis isomersin bovine milk even when considerable quantities of asample were injected into the GC.
It was not the scope of this paper to explain what hap-pened physiologically to the positional C18:1 cis isomersother than oleic and vaccenic acids present in hydrogenatedfat (Fig. 1c) of a typical diet. However, the analytical ap-proach presented here may prove helpful to others inexplaining this phenomenon.
Summary and Conclusions
The use of Ag+/HPLC/LLSD followed by GC of the collectedfractions at present seems to be a practical solution to thequestion of analysis of the composition of hydrogenated fats.The procedure may also be useful for determining theselectivity of catalysts used for hydrogenation, processmonitoring of industrial hydrogenation, quality controlof hydrogenated fats, etc.
The FAMEs of hydrogenated fats may be separated intoclasses according to the degree of unsaturation or geometric(cis/trans) isomerization. Partial separation of individualcomponents within each class is also possible. This can bedone by use of Ag+-loaded HPLC column, gradient elution,and an adequate detection system. So far, only the lightscattering detection-based principle, such as an LLSD, canbe used for this purpose. Individual fractions may be collectedand re-analyzed in a second dimension, namely HRGC. Aprofile of the composition of the trans or cis fractions can beused for identification of the presence of hydrogenated fats infood products. The method may also be very useful fordetermining the selectivity of catalysts used in hydrogenationas well as for quality control of hydrogenated fats.
The comparison of profiles of trans FAMEs showed thathydrogenated fats contained in human milk (3.1 %) originatemainly from dietary sources. trans FAs from bovine milk havean entirely different composition. It remains unclear why onlytwo (C18:1–9c and C18:1–11c) of the nine positional cisisomers present in hydrogenated dietary fats are found in
human milk while all eight positional trans isomers, foundin those food products, could be detected in human milk.
Open Access This article is distributed under the terms of the Crea-tive Commons Attribution License which permits any use, distribution,and reproduction in any medium, provided the original author(s) andthe source are credited.
References
American Oil Chemists Society (2005) Method Ce 1h-05, in official meth-ods and recommended practices AOCS, 5th edn. AOCS Champagin
Applewhite TH (1993) Nutr Rev 51:344–345Association of Official Analytical Chemists International (AOAC)
(1990a) Official method 985.21. In: Helrich K (ed) Official meth-ods of analysis of AOAC International, 15th edn. Association ofOfficial Analytical Chemists, Arlington
Association of Official Analytical Chemists International (AOAC)(1990b) Official method 965.34 In: Helrich K (ed) 15th Ed.1990, (Revised 1997 AOCS-AOAC Method)
Association of Official Analytical Chemists International (AOAC)(1990c) Official method 905.02. In: Helrich K (ed) Official methodsof analysis of AOAC International, 15th edn. Association of OfficialAnalytical Chemists, Arlington
Association of Official Analytical Chemists International (AOAC)(1990d) Official method 969.33. In: Helrich K (ed) Official methodsof analysis of AOAC International, 15th edn. Association of OfficialAnalytical Chemists, Arlington
Association of Official Analytical Chemists International (AOAC)(2005) Official method 996.06. In: Horowitz W (ed) Officialmethods of analysis of AOAC International, 18th edn. Associationof Official Analytical Chemists, Gaithersburg
American Oil Chemists Society (AOCS) (2009) Recommended Prac-tice Ce 1g-96
CFIA. Canadian Food Inspection Agency (2008). B.01.513 FDR section7.18. Guide to food labeling and advertising. Trans fatty acid claims
Chen ZY, Pelletier G, Hollywood P, Ratnayake WMN (1995) Lipids30:15–21
Christie WW (1987) J High Resolut Chromat 10:148–150Christie WW (1988) J Chromatogr A 454:273–284Christie WW (1991) Rev Franc Corps Grass 38:155–160Christie WW, Breckenridge GHG (1989) J Chromatogr 469:261–269Christie WW, Brechany EY, Stefanow K (1988) Chem Phys Lipids
46:127–135Craig-Schmidt MC, Weete JD, Faircloth SA, Wickwire MA, Livant EJ
(1984) Am J Clin Nutr 39:778–786Delmonte P, Rader JI (2007) Anal Bioanal Chem 389:77–85Destaillats F, Golay PA, Joffre F, De Wispelaere, Hug B, Giuffrida F,
Fauconnot L, Dionisi F (2007) J Chromatogr A 1145:222–228Golay PA, Dionisi F, Hug B, Giuffrida F, Destaillats F (2006) Food
Chem 101:1115–1120Handa Ch, Goomer S, Siddhu A (2010) Int J Food Sci Tech 45:1002–1008Haumann BF (1994) Inform 6:668–678Juanéda P (2002) J Chromatogr A 954:285–289Judd JT, Clevidence BA, Muesing RA, Wittes J, Sunkin ME, Podczasy
JJ (1994) Am J Clin Nutr 59:861–868Koletzko B, MrotzekM, Bremmer HJ (1988) Am J Clin Nutr 47:954–959Kummerow FA, Zhou Q, Mahfouz MM, Smiricky MR, Grieshop CM,
Schaeffer DJ (2004) Life Sci 74:2707–2723Laakso P, Kallio HJ (1993) Am Oil Chem Soc 70:1161–1171Larqué E, Zamora S, Gil A (2001) Early Hum Dev Suppl 65:S31–S41Lichtenstein AH (1993) Nutr Rev 51:340–343
468 Food Anal. Methods (2013) 6:457–469
Lopez-Garcia E, Schulze MB, Meigs JB, Manson JE, Rifai N, StampferMJ, Willett WC, Hu FB (2005) J Nutr 135:562–566
Mensink RP, Katan MB (1990) New Engl J Med 323:439–445Mueller A, thijs C, Rist L, Simões-Wüst AO, Huber M, Steinhart H
(2010) Lipids 45:245–251Patterson HBW (2009) Hydrogenation of fats and oils: theory and
practice. AOCS, IllinoisPhillips KM, Ruggio DM, Amanna KR (2010) Food Anal Methods
3:277–294. doi:10.1007/s12161-010-9123-yPicciano MF, Perkins EG (1977) Lipids 12:407–408PrechtD,Molkentin J (1994)KielerMilchwirtschaftliche Forschungsberichte
46:249–261Ratnayake WMN, Beare-Rogers JL (1990) J Chromatogr Sci
28:633–639
Stefanow K, Konaklieva KM, Brechany EY, Christie WW (1988)Phytochemistry 27:3495–3502
Stolyhwo A, Colin H, Guiochon G (1983) J Chromatogr 265:1–18Stolyhwo A, Colin H, Martin M, Guiochon G (1984) J Chromatogr
288:253–275Stolyhwo A, Colin H, Guiochon G (1985) Anal Chem 57:1342–1354Stolyhwo A, Martin M, Guiochon G (1987) J Liq Chromatog RT
10:1237–1253USFDA, Food and Drug Administration (2010). 21CFR101.9. Nutrition
labeling of foodWillet WC, Stampfer MJ, Manson JE, Golditz GA, Speizer FE, Rosner
BA, Hennekens CH (1993) Lancet 341:581–585. doi:10.1016/0140-6736(93)90350-P
Wolff RL (1995) J Am Oil Chem Soc 72:259–272
Food Anal. Methods (2013) 6:457–469 469