an engineering calculation method for multi-component stagnant
TRANSCRIPT
THE AMERICAN SOCIETY OF MECHANICAL ENGINEERS
··rlJ··· a45 E. 47th St;, New York, N.Y. 10017 The Society shall not be responsible for statements or opinions advanced in papers or discussion at meetings of the Society or of its Divisions or Sections, or printed in its .pablications. Discussion is pi-lnted only 1f the paper is pub· lished in an ASME Journal. Papers are available from ASME for 15 months ·after the meeting.
·94.QT·440
Printed in U.S.A.
AN ENGINEERING CALCULATION METHOD FOR MULTI-COMPONENT STAGNANT DROPLET EVAPORATION WITH FINITE DIFFUSIVITY
J. S. Chin Allison Engine Company
Indianapolis, Indiana
ABSTRACT A practical engineering calculation method has been for
mulated for commercial multicomponent fuel stagnant dropletevaporation with variablefinitemassand thermal diffusivity. Instead of solving the transient liquid phase mass and heat transfer partial differential equation set, a totally different approach is used. With zero or infinite mass diffusion resistance in liquid phase, it is possible to obtain vapor pressure and vapor molecular mass based on the distillation curve of these turbine fuels. It is determined that Peclet number (Per) is a suitable parameter to represent the mass diffusion resistance in liquid phase. The vapor pressure and vapor molecular mass at constant finite Per is expressed as a function of finite Pef, vapor pressure, and molecular mass at zero Pe rand infinite Per At any time step, with variable finite Per' the above equation is still valid, and Pp5 ,Pp5 ,Mfv ,Mfv Pef=� Pef=O Pef=� Pef=O
arecalculatedfrom Pp5 ,PFs ,Mfv ,Mfv Pef•� PefaO Pefa� PefmO
,thus P Fs and Mrv can be determined in a global way which eventually is based on the distillation curve of fuel.
The explicit solution of transient heat transfer equation is used to have droplet surface temperature and droplet average temperature as a function of surface Nusselt number and nondimensional time. The effect of varying com position of multicomponent fuel evaporation is taken into account by expressing the properties as a function of molecular mass, acentric factor, critical temperature, and critical pressure. A specific calculation method is developed for liquid fuel diffusion coefficient, also special care is taken to calculate the binary diffusion coefficient of fuel vapor-air in gaseous phase. The effect of Stefan flow and natural convection has been included. The predictions from the present evaporation model
for different turbine fuels under very wide temperature ranges have been compared with experimental data with good agreement
INTRODUCTION The aerothermal performance, ignition, and lean flame
stability characteristics, liner wall temperature levels and gradients, smoke and gaseous emissions of liquid fueled gas turbine combustors can be affected significantly by the fuel nozzle spray quality. Therefore, in order to meet combustor design requirements, one must obtain an optimum combustor internal flow field for a given fuel nozzle design, or conversely for a given cor ibustor one must select the most suitable fuel nozzle design characteristics. It is, however, more desirable to have a design procedure that allows simultaneous optimization of fuel nozzle, diffuser, combustor dome and liner. Such a design procedure will require more accurate analytical description of the various processes occurring within the combustion subsystems and their mutual interaction than the first generation empirical/analytical design method, e.g., Ref. 1.
Advanced models and analytical techniques are being developed for combustor/diffuser interaction, combustor annulus/dilution jet interaction, aerothermal performance including wall temperatures, gaseous and smoke emissions, and fuel nozzle, e.g., References 2 through 7.
In order to accurately model the important transport and evaporation processes of fuel nozzle sprays, the following should be taken into consideration:
1. Jet turbine liquid fuels are complex mixtures of paraffins, naphthenes, arometics, olefins, and others.
Presented at the International Gas Turbine and Aeroengine Congress and Exposition
The Hague, Netherlands - June 13-16, 1g94
Copyright © 1994 by ASME
Downloaded From: http://proceedings.asmedigitalcollection.asme.org/ on 04/11/2018 Terms of Use: http://www.asme.org/about-asme/terms-of-use
2. Heat and mass transfer rates within the liquid droplet can vary significantly during the heatup and evaporation period because of the varying gas environment, evaporating surface conditions and varying finite coefficients of mass diffusion and thermal conductivity.
3. Under high pressure and temperature environment of future energy efficient gas turbine engine combustors, the droplet surface temperature can be close to critical values while the pressure may be supercritical. Consequently, the liquid surface tension can approach zero with attendant increase in the secondary breakup processes. The usual assumptions of ideal gas law, negligible effects of Stefan flow and air solubility in the liquid fuel may not be acceptable.
4. Droplet to droplet interaction coupled with droplet breakup in high intensity high pressure combustors may be significant in addition to convection and turbulence effects.
Experimental and analytical research on droplet and spray transport, evaporation and combustion has been quite extensive as summarized by numerous survey articles, e.g., References 8-12. Available modeling techniques for multicomponent fuel droplet evaporation can be broadly divided into the following three categories:
1. Zero diffusion resistance, complete mixing or batch distillation models <1•1>-16l. Liquid composition inside the droplet is assumed uniform but varies with the fraction evaporated (time). The liquid thermal conductivity can be assumed infinite or finite; the former gives uniform temperature whereas the latter will result in finite temperature gradients within the liquid droplet.
2. In infinite diffusion resistance or "onion skin" models, the evaporation rate does not depend upon the volatilities of the fuel constituents.
3. Nearly all published finite diffusion models<11•21> have been applied to fuel mixtures of two chemical compounds, e.g., hexane and decane or other combinations. The governing transport equations of energy and mass diffusion of the fuel constituents inside the liquid droplet are solved numerically along with the appropriate liquid gas interface boundary conditions. These models have provided good fundamental insight in the complex finite diffusion and convection processes occurring in two-or-three component fuel mixtures. However, these fundamental finite-diffusion modeling approaches can-
not be easily extended to multicomponent gas turbine liquid fuels.
The objective of this study is to develop a practical engineering approach for calculating the heatup and evaporation rates of stagnant droplets of turbine fuels that include multicomponent finite mass diffusivity and conductivity effects. This work is limited to low pressure. Future publications will give details on the extension of this model to turbulent convective environment at supercritical pressure and temperature conditions. The developed calculation procedure is planned to be used as a subroutine to the comprehensive fuel nozzle model of Rizk and Mongia, 1991.
MODEL FORMULATION
Vapor pressure and molecular mass
The main objective of multicomponent droplet evaporation is to accurately calculate the evaporation rate, droplet surface temperature and fuel vapor compositions. Instead of solving a set of partial differential equations for ideal fuels comprised of two or three components (e.g.,. References 17-21), a global engineering approach is proposed for gas turbine fuel evaporation whereas the droplet surface temperature (1'.) is determined by explicitly solving a transient heatconductio� equation. The fuel vapor pressure and molecular weight during the droplet lifetime for different fuels are based on their distillation curves as explained in the following paragraphs.
The fuel vapor molecular weight (Mrv) under the assumption of zero or infinite diffusion resistance (DR) can be calculated, as pointed out in References 22-24, by the following equations:
Mfv,draO = Mfv,draO,EVAP=O + Mfv(EV AP) Mfv,dra� =constant
(1)
(2)
The fuel vapor pressure at the evaporating surface for zero
diffusion resistance (DR = 0) can be expressed as:
P f ( f2,dr•,.: ) fs,dr•O = 1,dr•O • exp
Ts
or dr • � or dr • � (3)
f1,draO = f1,draO,EVAP=O + f1,drso(EV AP) (4)
ft,dr•� =cons tan t
f 2,drsO = f 2,drsO,EV AP=O + f 2,drso(EV AP) (5) f 2,dr•� = cons tan t
Downloaded From: http://proceedings.asmedigitalcollection.asme.org/ on 04/11/2018 Terms of Use: http://www.asme.org/about-asme/terms-of-use
J ,1 i '
Expressions for Jet A-1, JP-4, and DF-2 are given in an internal report of Allison Engine Company with all equations used for calculations.
The finite liquid phase processes can be characterized in terms of liquid Lewis number (Ler) or Peclet number (Per) defined as:
Let=�= Kt I CptPt Df Dt
(6)
As recommended by Law et al (25, 26) the use of Per is preferred over Ler because actually Ler does not r�present the diffusion resistance and Per represents the rauo of mass consumption and mass diffusion ability. Per <<1 implies batch distillation whereas "onion-skin" evaporation model is applicable when Per>> 1. In the proposed model formulat�on, the diffusion resistance can be equated to Peclet number, 1.e., Pe =O is the same as DR=O and likewise Per::oo and DR::oo. r
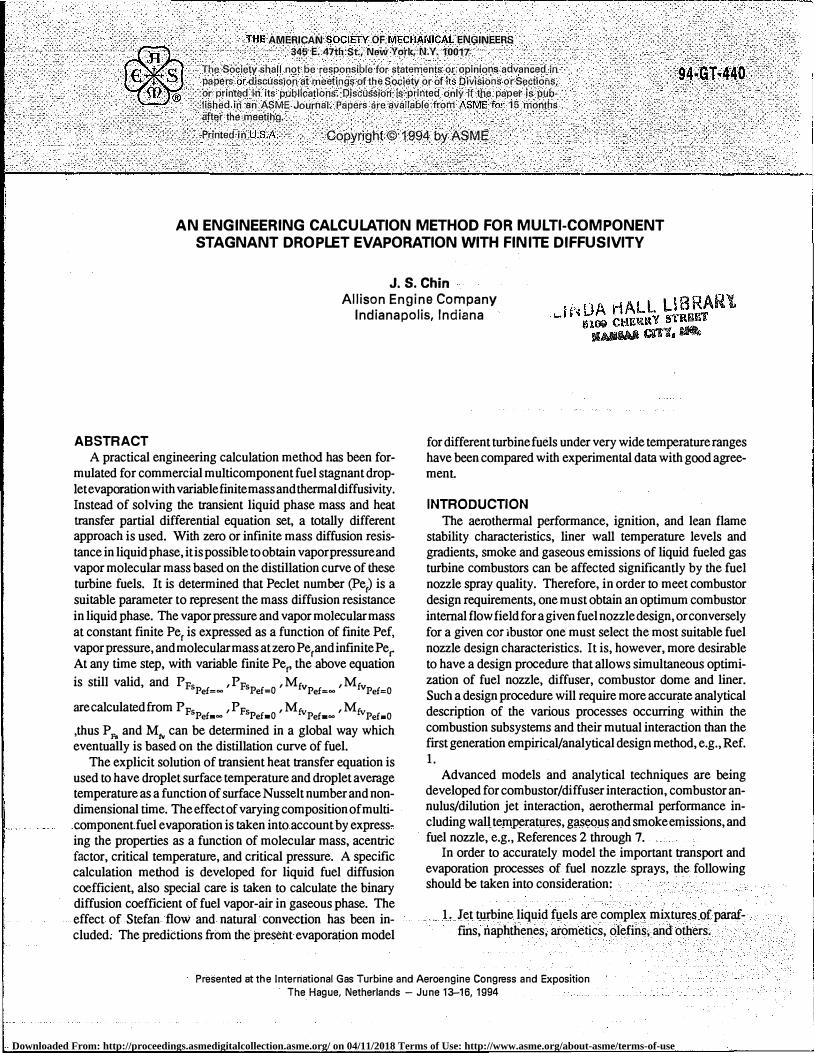
Since the vapor pressure with constant but finite Per (P Fa) must lieinbetweenthe twolimitations, PFsPef•oo and PFsPef•O•
it is reasonable to use the following expression: Pps = pFs,Pef•00
+(PFs,PefmO -Pps,Pef•oo )exp(-cPef ) (7)
Where C is a function of EV AP for a given fuel. From the results published in Ref (18, 21, and 26), the following expression for C was obtained:
C = 0.305 EV AP -0.35 EV AP2 + 0.14 EV AP3 (8)
The calculated effect of Peclet number, P0r' on fuel vapor pressure, P Fa' for constant values of Per is shown in Figure 1 for Jet A-1 at T = 500 K, along with the true vapor pressure . •
•• 0.20 0.40 0.60 EVAP
r •• sooK JetA-1
0.1 a
a.aa i.a TEi3-221S.5
FIGURE 1. EFFECT OF pefON PFs vs EVAP.
3
Similarly, the fuel vapor molecular weight for constant Per is expressed by:
Mrv. = Mfv,Pef•oo
+(Mfv,Pef•O -Mrv,Pef•oo )exp(-c · Per ) (9)
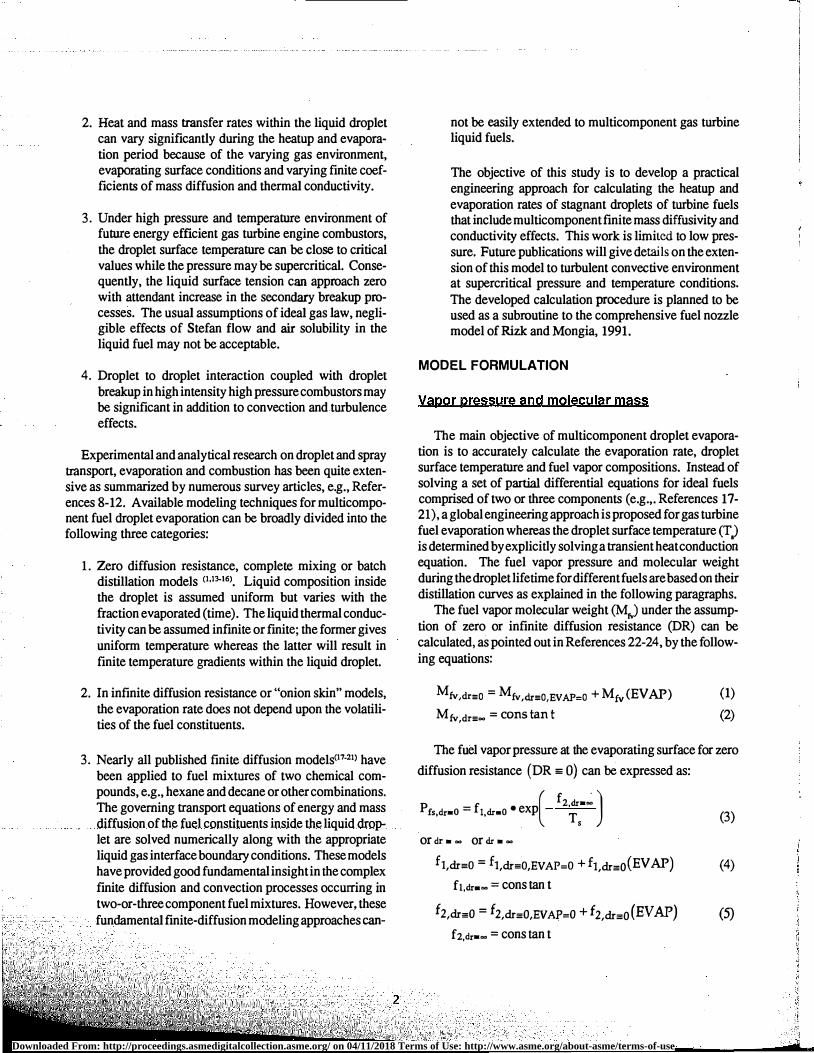
As shown in Figure 2 for an initial droplet of30 microns of Jet A-1 at 300 Kand T_ =988.7K,P:!:= lOOkPa, Pef varies during evaporation, i.e from EV AP=O to 1.0. For example, at EV AP=O, Per is approximately 0.3 and changes to 8.2 at EV AP=l.0. Assuming that the formulation for constant Per' i.e., Eq (7-9), is valid for variable Per' provided one can determine the appropriate values of the molecular weights and fuel surface partial pressures corresponding to Per=O and Per::oo· From Eq (2) where Mtv,c1r=oo has a constant value, it is implied as the integratedaveragevalueofEq (1) from EV AP=O to 1.0. In other words, Mtv r=-can be regarded as the average molecular weight (M ) of the fluid remained in the droplet r.ave The following equation fits the Mr.ave:
Mfv,Pef=oo = Mfave = Mfv,P ef•oo
+(Mfv,Pef•O,·EVAP=l -Mfv,Pef•oo )EV A.P (10)
To calculate Mfv,Pef=O for a small time step .1� defined
as ti+ 1 -ti and the corresponding fraction of fuel evaporated, dEV APi+t =EV AP;+i -EV AP; , Eq (1) is rewritten as:
(Mrv,Pef=O Li= (Mrv,Pef = 0 ); + Mrv( dEV AP�+! )x
Mfv,Pef=O,EVAP=l - (Mfv,Pef=O )i (11) Mfv,Pef=O,EVAP=l - Mfv,Pef=O,EVAP=O
10
5
0.20
T- 988.7 K Pl: 101.3 KPa Do 30x10 ·6 m Tso= T average o = 300 K stagnant JetA-1
0.40 0.60 EVAP
0.80 1.0 TE93·2216·5
FIGURE 2. P91 VS. EVAP.
Downloaded From: http://proceedings.asmedigitalcollection.asme.org/ on 04/11/2018 Terms of Use: http://www.asme.org/about-asme/terms-of-use
. LIBVAP. 1 Where LIBV AP· = 1+
1+1 1-EVAP· 1 (12)
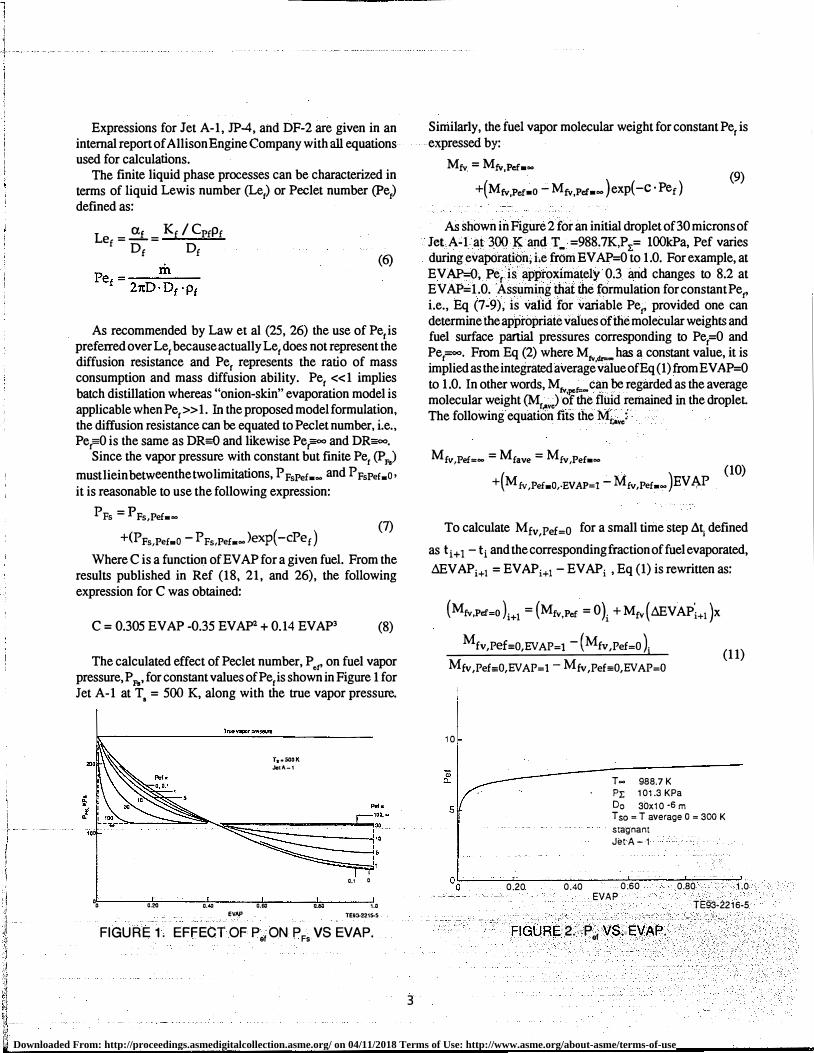
Figure 3 shows the variation of Mtv for Jet A-1 where straight line 2 - 3 represents MfvPef=co· Eq (11) means the determination ofMtvPer=0 (point A) from pointD, curve DC and points 3 and 1. Eq (10) means the determination of Mtv (point
E) from MfvPef=o(pointA)andMrvPef=co(pointF). A similar procedure is used to calculate the vapor pressure at droplet surface P Fs with variable Peclet number, Pef. Accordingly:
(p ) =P Fs,Pef=oo i+l Fs,Pefaoo
-[PFs,Pefaoo -fl,Pef•O,EVAP=l
exp (-f 2,Pef��EV AP=l ) ]EV AP
(13)
( P Fs ,Pef = 00) i + 1 is represented by point F in Figure 4. Here
f 1 and f2 are given by Eq (4) and (5). The procedure for calculating (P Fs,Pef=O )i+l is similar to
thatfor (Mfv,Pef=O)i+l except that now f 1 and f2are computed as given in Eq (14) and (15).
f1,Pef i+l =0 = f1,Pefi+l =0,Pefj=co
+( f1,Pef i+l =0,Pefi =0 - f1,Pef i+i=O,Pefi =co ) (14)
·exp(-c· Pef i)
,,, J1tA-1
.... .... 0 MivP1f1•0
• �Pl,1•• ... ..,,,,. .. "" "' �pel,·0
patl-1 ... ... �!)e�•O P1l1-1•0
--- ..,,,,. ... _..,,,,. ...
0.2 o.• 0.0 u 1.0 EVN'
TEt:l·2217-&
FIGURE 3. DETERMINATION OF MlvPel..O' Mlvpef=�· M1vpe1WITH VARIABLE Pei·
4
f 2,Pef1+1 =0 = f 2,Pef1+1 =O,Pef1 =00 + (f 2,Pef1+1 =O,Pef1=0
-f2pef : =Ope£- )·exp(-C·Pef1.) I l+l I {-00 (15)
In Figure 4 the meaning of Eq (14) and (15) is that, from point D (Pef;=O), point 1 (Pef=O,EV AP=O), point 3 (Pef =O,EVAP=l) and Curve 1-E"-C'-3
( f l,Pef•o (LIBV AP' ),f 2,Pef•O (.1EVAP ')) to determine point A.
From Eq (14) and (15):
P f ( f2,Pef1+1 =0 ) = f ·exp-Fs,Pef1+1 =0 1,Pe 1+1 =0 Ts
From Eq (13) and Eq (16), we have:
pFs,Pefi+l = (PFs,Pef=00)i+l
+[ pFs,Pefi+l =0 -(PFs,Pef=oo)i+l ] ·exp(-Ci+I ·Pefi+t)
(16)
(17)
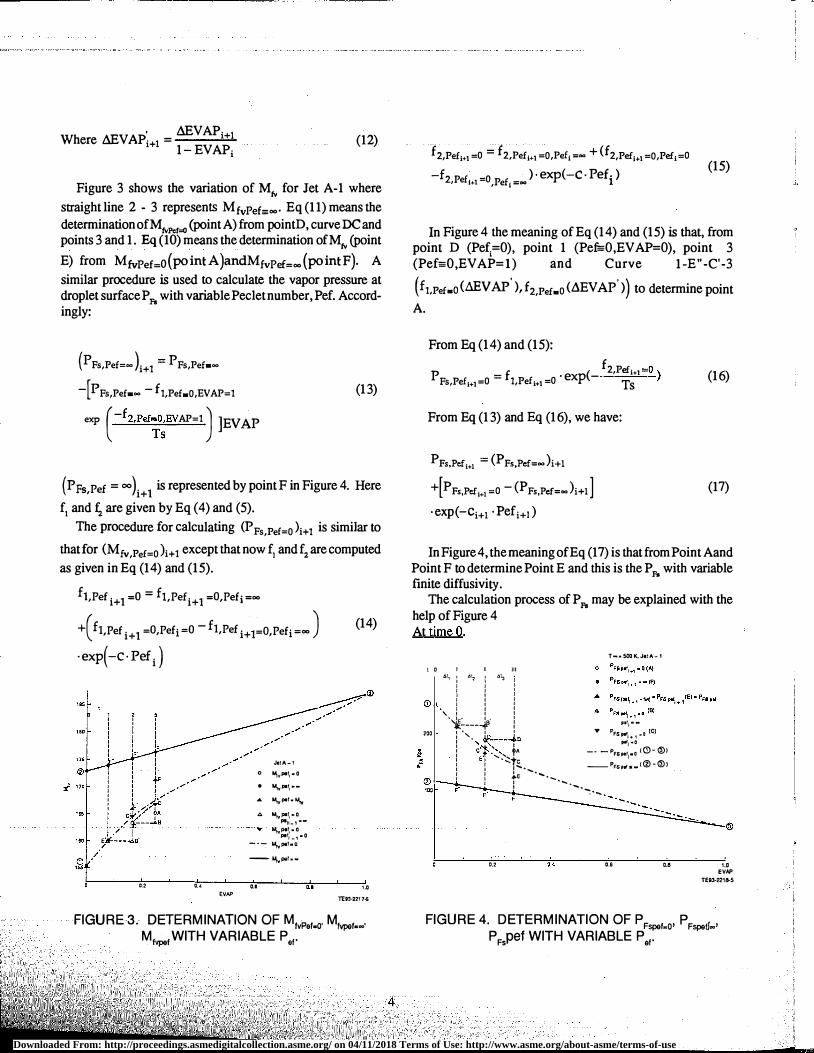
InFigure4, the meaning ofEq (17) is thatfromPointAand Point F to determine Point E and this is the P Fs with variable finite diffusivity.
The calculation process of P Fa may be explained with the help of Figure 4 At time 0.
t 0 I Ill
©
200
t.t, : A� l 4� I I I I I I I I I I I I ' I I ·�:----48' I ! ·,. �----.J.s I ':--.t._' I I c'_t"�'' tA J E'1 '·�tc : i 1'·-
T-•SOOK.JstA-1
Ptf1••
'9' PFSPl'f1+1 .. o (C) Pf11 .. o
- · - PFs111r1.o IG)- @J _.,., .... •@-@>
® : ! jE .................. .. I '·---: .. ..._
0.2 0.6 o.• 1.D EVN'
TE93·2218-5
FIGURE 4. DETERMINATION OF PFspef=o• PFsperJ�
' P Fspef WITH VARIABLE Pei·
Downloaded From: http://proceedings.asmedigitalcollection.asme.org/ on 04/11/2018 Terms of Use: http://www.asme.org/about-asme/terms-of-use
Calculate PFS,Pcf•oo,EVAP=O (point 2 )
Calculate PFS,Pcf•O,EVAP=O (point 1 ) as at time 0, Per=O is assumed. P Pa at time 0 is at Point 1 At time I (after .6.t1).
Calculate Pps,Pefr=co by Eq (13) (using straight line 2 -3 to detennine point F")
Calculate PFsPefi=O by Eq (4) and (5) (point E") as
Pef1 "'0 ,P FscalculatedbyEq(17)is verycloseto PFs,Pefr=O (pointE") At time II (after .6.t2)
Calculate PFs,Pefn=co byEq (13)(inFigure4, by straight line 2 - 3 to detennine F).
Calculate PFs,Pefu=O byEq(14),(1 5),and(l6)(inFigure
4, that means by point E" point 3, point 1 and curve E"C' to determine point D).
CalculateP Fs by Eq (17) (in Figure 4 that means from point D and point F to determine point E') At time III (after .6.t,)
Calculate Pps,Pefm=co by Eq (13) (inFigure4, by straight
line 2 - 3 to detennine point F).
Calculate PFs,Pefm=O by Eq (14), (1 5), and (16) (in
Figure 4, that means by point D, point 3, point 1 , and Curve DC to determine point A).
Calculate P Fs by Eq (17) (in Figure4, that means from point A and Point F to determine point E).
Liquid Properties
The procedure used for computing liquid fuel composition, liquid fuel temperature, evaporating surface temperature, liquid mass diffusion coefficient (Df) are as follows:
Acentric factor (ro), Eq (18), is widely used for representing the complexity of the molecule with respect to both the geometry and polarity.
5
[ Ts J Pfs at-= 0.7 co = -log �� -1.0 (18)
Here, Pc is the fuel critical pressure. For specific fuel, co can be expressed as a function of fuel molecular weight.
Liquid properties are calculated by a function of Mfv, co, Ts, Pr for surface layer properties, and Mt•••' cor> T 1,0 used for the average properties for liquid remained in the droplet.
As all properties (including density) are expressed by Mrv (or Mra.e> and co (or cor), thus the multiple component effect on liquid and gaseous properties (changing composition) is fully taken into consideration.
The exact procedure for calculating the liquid mass diffusion coefficient for multicomponent turbine fuels is intractable and is considered impractical for use in a comprehensive fuel nozzle model, e.g., Rizk and Mongia, 1991. It is therefore assumed that the problem of defining D tin gas turbine fuels is reduced· to calculating the mass diffusion coefficient of the lightest component through the uniform "rest" of the fuel (which is a good approximation for the real situation) by using the Wilke-Chang method described by Reid, 1987.
(19)
Here D rand µrare the liquid mass diffusion coefficient (112/ S) and dynamic viscosity of the fuel remained in the droplet, r:espectively.
Vb is the molar volume of the fuel element being evaporized at its normal boiling temperature.
Vb=2.25Mrv • 104.5 (20)
As fuel density changes significantly during the droplet life time (can be a factor of more than 2: 1 ), thus when the droplet diameter changing with time is calculated, both evaporation and thermal expansion need t� be considered. At the begin-
. f · d(D2) . f . . . d f nmg o evaporation, -- 1s o ten pos1uve mstea o dt negative, that is, droplet diameter is first increased and then decreased.
Gaseous Properties
The characteristic gaseous phase temperature and composition are calculated by using the one-third rule, i.e.,
.. 1
Downloaded From: http://proceedings.asmedigitalcollection.asme.org/ on 04/11/2018 Terms of Use: http://www.asme.org/about-asme/terms-of-use
(21)
1 Ypm = Yp5 +3(Ypoo -Yp5) (22)
The author tried to use different reference conditions rule, but the result show that for stagnant droplet evaporation, the onethird rule is best.
The non-ideal mixing of fuel vapor and air has been considered by including a binary mixing factor Kij in the mixture property calculation such as:
(T.T.P.) mixture
= x� -(T. T.P. )rv + (1 - X�) - (T. T.P. )air
+Xrm -(1 - Xrm) · Kij· ((T. T. P. )rv + (T. T.P. )air] (23)
Here, T.T.P. stands for thennal transportation properties, such as specific heat, thermal conductivity, etc. Based on the Kij value for hydrocarbons, the following correlation can be used for jet fuels.
Kij=l.232+0. 001 Mrv (Mfv=l00-220)
(24)
When Kij=l, it is ideal mixing, (T.T.P.) mixture = Xrm·(T.T.P.)rv +(1-Xru) (T.T.P.)air.
The mass diffusion co-efficient in gaseous phase Dg is the most important gaseous property used for droplet evaporation calculation. Here the fuel vapor is considered as one compound, specified by Mrv, co, Tc, Pc and air as another compound specified by Ma, roa, Tea, Pea. The gaseous diffusion coefficient is a binary diffusion coefficient.
For low pressure:
[3. 03 - ( 0·98 >]·oo-3)·Tm312
�MAB Dg1owp = 112 � (25) p:E ·MAB. AB . .Qd
Where Dg in cm2/sec, P � in bar. Calculation of MAB, cr AB' .Qd are listed in Reid, 1987.
If the ambient gas is not air but combustion product, then the" air" properties will all be afunctionoffuel-air ratio to take into account the effect of Hp and CO 2 on the properties. It is
6
assumed that the combustion is of 100% efficiency with chemical equilibrium.
Explicit SOiution for Ts and Tave For transient heat conduction equation of a spherical liquid
droplet initially uniformly at temperature (Tr) suddenly exposed to convective heating (or cooling), there is an explicit solution, which gives the surface temperature (Ts) and the
temperature at r = �rs location (which is, in the present model, taken as the average temperature of the droplet) as
h·_!D functions of surface Nusselt number Nu5 = 2 and
Krs
d. . l . 0 4 . afs . t ( Krs . th non 1mens10na time = 2 ar = , 1s e D · CprsPfs
thennal diffusivity at surface condition). The explicit solutions were reported in Ref 30. In the present model, these explicit solutions were converted to the following equations:
T. -Tro =
T�- Tro
1- exp{-e1 ·Nus{l. 26 - 0. 26·exp(-:U,)]
3 -2. 2 . 92. [t-exp(-Nus)] }
Tave - Tro =
T�- Tro
1- exp{-0. 695· au Nus[ 2. 3-.2 exp(-�s)]
-0.695·01·1 ·2.2· [1-exp(-Nus)]}
(26)
(27)
When Nus < 0, the droplet is cooled instead of heated, using I Nus I instead of Nus, - 1 TM - Teo I instead of TM - Teo.
These correlations were obtained under such a condition that initially the temperature of droplet is unifonn at Teo. For evaporizing droplet after the first time step the droplet temperature is no longer unifonn, now the surface temperature becomes T01, the boundary condition at the surface changes from Nu.o to Nu.1• To use the correlation to calculate Ts, Tave after the second time step, it is assumed that the surface temperature T01 were developed from an equivalent uniform temperature (Teo\ by time Llt1 with the boundary condition
. 4 ar 1 · Llt1 Nu.1 (insteadofNu.o)and 01 = �f (instead ofa00and
Downloaded From: http://proceedings.asmedigitalcollection.asme.org/ on 04/11/2018 Terms of Use: http://www.asme.org/about-asme/terms-of-use
DJ By usingEq (26) with T11,Nu.I' 0'1,a value of (Tfo)l is determined. Then calculate a value of 02•
with (Tfo )1, Nu,1, using Eq (26) and (27), values of T12, T •• .z
at the end of At:z are determined.
Heat and Mass Transfer In the Gaseous Phase
Even with stagnant droplet (Reg = 0), the numerical study in Ref 35 indicates that the Stefan flow effect cannot be neglected if the heat transfer number (BT) and mass transfer number (By) are not very small. Here the Stefan flow effect is the effect of fuel vapor diffusing outwards on the heat transfer, mass transfer towards the droplet and on drag coefficient But the correlation in Ref 35 cannot be used in the present model as when B > 6.5, the evaporation rate will decrease with increasing B value (or increasing droplet temperature). Obviously it is unreasonable, showing too strong correction of Stefan flow effect at high temperature, while for an engineering calculation it is quite possible that B > 10.
Based on droplet film model, the following correction was suggested for Stefan flow effect in Ref 36 for convective evaporation.
Sh*= 2 + (Sho-2)/FM Nu* = 2 + (Nuo - 2)/FT
(28) (29)
where FM, FT are functions of BT and By. Sho, Nuo are correlations for Sh and Nu for a nonvaporizing droplet.
But this method predicts zero Stefan flow effect for stagnant evaporating droplet Based on these two studies, Eq (28) and (29) are modified and used in the present model as follows:
Sh*= Sho/FM Nu*=Nuo/FT
where from Ref 36
FM =(l+By )o,7 ln(l+By) By
FT= (1+ BT )0.7 ln(l+ BT) BT
for stagnant droplet
(30) (31)
(32)
(33)
(34)
7
(35)
Finally, the heat transfer and evaporation rate with no natural convection are as follows:
Q . C (T .. -Ts )
:i: =m pfv · BT
m= 2IID·pg•Dg· By {1 +By )°'7
B - YFS y-
1-YFS
Y - Xf ·Mrv FS - Xf Mfv +(1-Xf)Ma PFSM - fv
- PL -PFs ·M +(1- PFs
J
M p fv p a
L L
(36)
(37)
(38)
(39)
where Eq (38) is true for Y Foo = 0. Eq (39) uses an ideal gas assumption which is valid only at low ambient pressure. At
high pressure X� *- p FS . P:i: Another factor needs to be considered is the effect of
natural convection. When we compare the model predictions with published experimental data, as these data were always obtained with large droplets (larger than 1000 J.Un), it is necessary to consider the natural convection effect
In a recent study on natural convection effect on droplet evaporation (Ref 37), it was confirmed that the effect is proportional to (Grashof number)1'4• In Ref 38, the correlations for Nu and Sh for a sphere are:
..!. 1 NuN.c = 2 + 0.4 Gr4 Pra4
.!. 1
(40)
ShN.c = 2 + 0. 5 Grc4 Sc&4 (41) which are used in the present model.
Where Gr Grashof number for heat transfer, Gr0 = Grashof number for mass transfer
With natural convection effect, Eq (37) and (38) are modified as
Qr_ =rhCprv-CT .. -T.)/
1 1 BT· (1+0.2 Gr4 Pra4 )
(42)
Downloaded From: http://proceedings.asmedigitalcollection.asme.org/ on 04/11/2018 Terms of Use: http://www.asme.org/about-asme/terms-of-use
rh=2TID·p ·Dg· By g (1+ By)o.7
Model Calibration
(43)
1.. Comparjson wjth Godsave Experimental Evaporation Constant. In the evaporation literature most experiments were done on pure compound fuels, only few are related to commercial multiple component fuels, as collected in this paper, for different fuels and temperature. In Ref 31, Godsave
d(D2) reported that the - -- values for kerosene (p = 805 k"' dt f 51
m3) and DF2 (Pr= 850 kg/m3) are 0.964 mm2/sec and 0.795 mm2/sec, respectively, under atmospheric stagnant droplet combustion conditions.
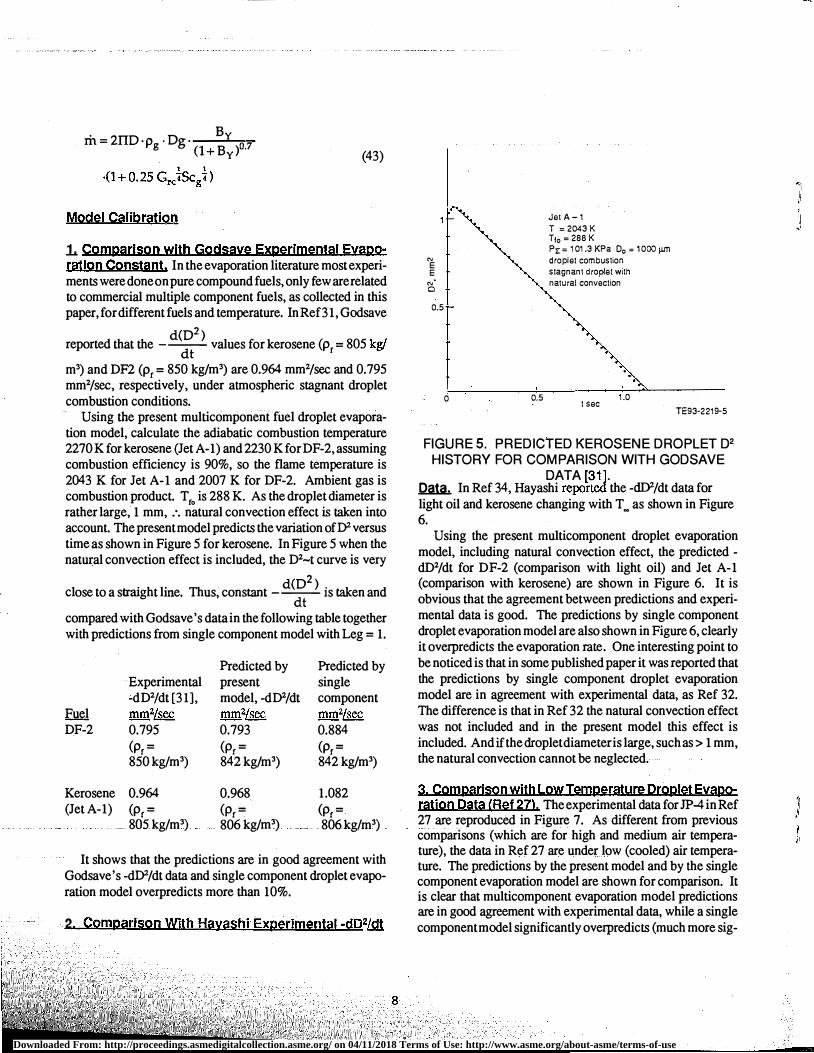
Using the present multicomponent fuel droplet evaporation model, calculate the adiabatic combustion temperature 2270 K for kerosene (Jet A-1) and 2230 K for DF-2, assuming combustion efficiency is 90%, so the flame temperature is 2043 K for Jet A-1 and 2007 K for DF-2. Ambient gas is combustion product. Tto is 288 K. As the droplet diameter is rather large, 1 mm, :. natural convection effect is taken into account. The present model predicts the variation ofD2 versus time as shown in Figure 5 for kerosene. In Figure 5 when the natural convection effect is included, the D2-t curve is very
1 t tral. h l" Th d(D2) . c ose o a s g t me. us, constant - -- 1s taken and dt compared with Godsave' s data in the following table together with predictions from single component model with Leg = 1.
Experimental -dD2/dt [31],
Fuel mm2fsec DF-2 0.795
(pf= 850kg/m3)
Kerosene 0.964 (Jet A-1) (Pr=
805 kg/m3)
Predicted by present model, -dD2/dt mm2/sec 0.793 (Pr= 842kg/m3)
0.968 (Pr= 806kg/m3)
Predicted by single component mm2/sec 0.884 (pf= 842 kg/m3)
1.082 (Pr= 806kg/m3)
It shows that the predictions are in good agreement with Godsave' s -dD2/dt data and single component droplet evaporation model overpredicts more than 10%.
2. Comparison With Hayashi Experimental ·dD2LQt
8
N E E
N•
Cl
0.5
0 0.5
Jet A-1
T = 2043 K T10 = 288 K Pi;= 101.3 KPa 00 = 1000 µm
droplet combustion stagnant droplet with natural convection
1.0 tsec
TE93·221 9-5
FIGURE 5. PREDICTED KEROSENE DROPLET D2 HISTORY FOR COMPARISON WITH GODSAVE
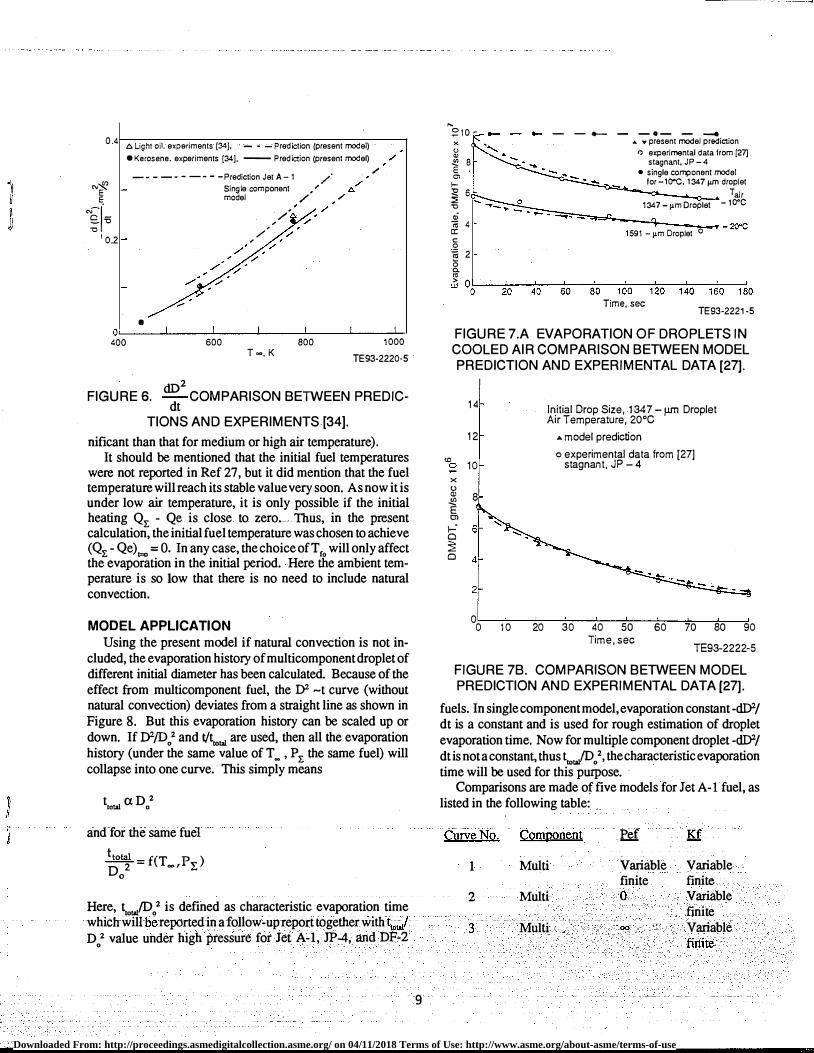
DATA [311. Qa1iL. In Ref 34, Hayashi reported the -dD2/dt data for light oil and kerosene changing with T � as shown in Figure 6.
Using the present multicomponent droplet evaporation model, including natural convection effect, the predicted -dD2/dt for DF-2 (comparison with light oil) and Jet A-1 (comparison with kerosene) are shown in Figure 6. It is obvious that the agreement between predictions and experimental data is good. The predictions by single component droplet evaporation model are also shown in Figure 6, clearly it overpredicts the evaporation rate. One interesting point to be noticed is that in some published paper it was reported that the predictions by single component droplet evaporation model are in agreement with experimental data, as Ref 32. The difference is that in Ref 32 the natural convection effect was not included and in the present model this effect is included. And if the droplet diameter is large, such as > 1 mm, the natural convection cannot be neglected.
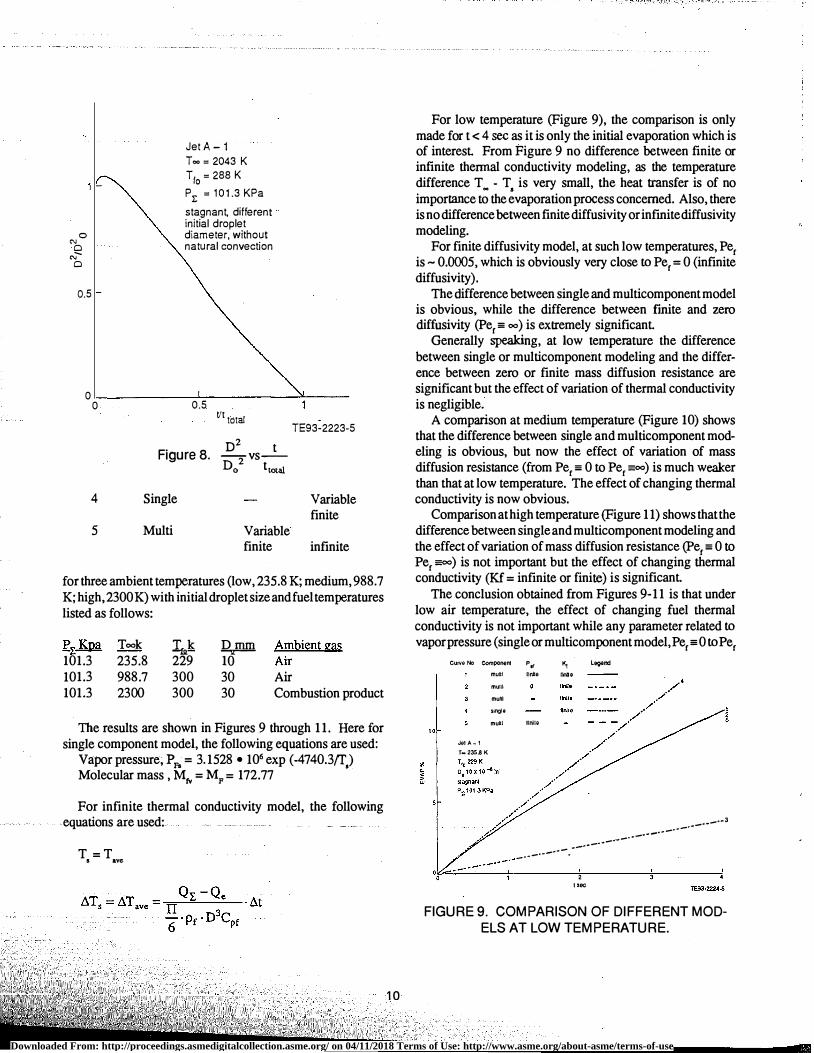
3. Comparison with Low Temperature Droplet Evaporation Data (Ref 27). The experimental data for JP-4 in Ref 27 are reproduced in Figure 7. As different from previous comparisons (which are for high and medium air temperature), the data in Ref 27 are under low (cooled) air temperature. The predictions by the present model and by the single component evaporation model are shown for comparison. It is clear that multicomponent evaporation model predictions are in good agreement with experimental data, while a single component model significantly overpredicts (much more sig-
Downloaded From: http://proceedings.asmedigitalcollection.asme.org/ on 04/11/2018 Terms of Use: http://www.asme.org/about-asme/terms-of-use
0.4 a. Light oil. experiments [34], - - - Prediction (present model)
•Kerosene, experiments [34], -- Prediction (present model)
o;'!f:
N-;;�1·-- "O "O
I 0.2
-- - -- - -- - -Prediction Jet A-1
•
Sing le component '
model /'
,
/' ,
/' ,
,/ /
,
/ /
OL-��L-��.L_��L-��.L_��.1..-��L...J 400 600
T-. K 800 1000
TE93·2220-5 ·
FIGURE 6. dD2 COMPARISON BETWEEN PREDICdt
TIONS AND EXPERIMENTS [34).
nificant than that for medium or high air temperature). It should be mentioned that the initial fuel temperatures
were not reported in Ref 27, but it did mention that the fuel temperature will reach its stable value very soon. As now it is under low air temperature, it is only possible if the initial heating Qt - Qe is close to zero. Thus, in the present calculation, the initial fuel temperature was chosen to achieve (Qt - Qe)t=o = 0. In any case, the choice of Tr. will only affect the evaporation in the initial period. Here the ambient temperature is so low that there is no need to include natural convection.
MODEL APPLICATION Using the present model if natural convection is not in
cluded, the evaporation history of multicomponent droplet of different initial diameter has been calculated. Because of the effect from multicomponent fuel, the D2 -t curve (without natural convection) deviates from a straight line as shown in Figure 8. But this evaporation history can be scaled up or down. If 02/D 02 and t/trota1 are used, then all the evaporation history (under the same value of T � , Pt the same fuel) will collapse into one curve. This simply means
t aD2 total o
and for the same fuel
ttotal = f(T p ) D 2 _, k 0
Here, t fD 2 is defined as characteristic evaporation time total: o • which will be reported in a follow-up report together with trorJ D 2 value under high pressure for Jet A-1, JP-4, and DF-2 0
9
.... �10 �
x " "' � 8 E Ol l-32 6 :::; "O o; � 4
er: c 0 � 2 0 a. "'
- - - - - · - - -.. "present model prediction
" experimental data from [27] stagnant, JP -4
• single corrponent model for-10-C, 1347 µm droplet
Tair 1347 -µm Droplet .. - 10"C
·�-:.,::.c....-...-q ______ � - 20"c 1591 -µm Droplet o
> OL-�-'-�..1.-�.1..---:��:1-::--�7:---.,.��i.,,--:-: w 0 20 40 60 80 100 120 140 160 180 Time, sec TE93·2221 ·5
FIGURE 7.A EVAPORATION OF DROPLETS IN COOLED AIR COMPARISON BETWEEN MODEL PREDICTION AND EXPERIMENTAL DATA [27].
w 0 x u Q) !:2 E Cl 1-· a � a
14
12
10
8
Initial Drop Size, 1347 - µm Droplet Air Temperature, 20°C
... model prediction
o experimental data from [27] stagnant, JP - 4
0 0 1 0 20 30 40 50 60 70 80 90
Time, sec TE93-2222-5
FIGURE 7B. COMPARISON BETWEEN MODEL PREDICTION AND EXPERIMENTAL DATA (27].
fuels. In single component model, evaporation constant -dD2/ dt is a constant and is used for rough estimation of droplet evaporation time. Now for multiple component droplet -dD2/ dt is not a constant, thus tio1a1/D 0 2, the characteristic evaporation time will be used for this purpose.
Comparisons are made of five models for Jet A-1 fuel, as listed in the following table:
Curve No. Comoonent .etl Kf
1 Multi Variable Variable finite finite
2 Multi 0 Variable finite
3 Multi co Variable finite
Downloaded From: http://proceedings.asmedigitalcollection.asme.org/ on 04/11/2018 Terms of Use: http://www.asme.org/about-asme/terms-of-use
0 C\J Cl
"'-Cl
0.5
0 0
Jet A-1 Too= 2043 K Tro = 288 K
Pl:
= 10 1.3KPa
stagnant, different initial droplet diameter, without natural convection
0.5 tft total
oz t Figure 8. --vs --Doz ttotal
TE93-2223-5
4 Single Variable finite
5 Multi Variable finite infinite
for three ambient temperatures (low, 235.8 K; medium, 988.7 K; high, 2300 K) with initial droplet size and fuel temperatures listed as follows:
£�Kpa 101.3 101.3 101.3
Took 235.8 988.7 2300
lriik 229 300 300
� 10 30 30
Ambient gas Air Air Combustion product
The results are shown in Figures 9 through 11. Here for single component model, the following equations are used:
Vapor pressure, Pl'a = 3.1528 • 106 exp (-4740.3!f1) Molecular mass , Mtv = MF= 172.77
For infinite thermal conductivity model, the following equations are used:
T =T s ave
10
For low temperature (Figure 9), the comparison is only made for t < 4 sec as it is only the initial evaporation which is of interest From Figure 9 no difference between finite or infinite thermal conductivity modeling, as the temperature difference T � - T. is very small, the heat transfer is of no importance to the evaporation process concerned. Also, there is no difference between finite diffusivity or infinitediffusivity modeling.
For finite diffusivity model, at such low temperatures, Per is - 0.0005, which is obviously very close to Per= 0 (infinite diffusivity).
The difference between single and multicomponent model is obvious, while the difference between finite and zero diffusivity (Per= oo) is extremely significant
Generally speaking, at low temperature the difference between single or multicomponent modeling and the difference between zero or finite mass diffusion resistance are significant but the effect of variation of thermal conductivity is negligible.
A comparison at medium temperature (Figure 10) shows that the difference between single and multicomponent modeling is obvious, but now the effect of variation of mass diffusion resistance (from Per= 0 to Per =oo) is much weaker than that at low temperature. The effect of changing thermal conductivity is now obvious.
Comparison at high temperature (Figure 11) shows that the difference between single and multicomponent modeling and the effect of variation of mass diffusion resistance (Per= 0 to Per =oo) is not important but the effect of changing thermal conductivity (Kf = infinite or finite) is significant
The conclusion obtained from Figures 9-11 is that under low air temperature, the effect of changing fuel thermal conductivity is not important while any parameter related to vapor pressure (single or multicomponent model, Per= 0 to Per
10
Cul\le No Componen1 P tf Kt LGQOnd
Jel A-1 T• 235.8 K
multi llnlle llnbe
mulll
muhl
single mulll 11n11e
-·--· __ .. __ ... _ ....
2 """
__ .... _ ... -... -·-3 ____ .. __ .... -
---·
FIGURE 9. COMPARISON OF DIFFERENT MODELS AT LOW TEMPERATURE.
Downloaded From: http://proceedings.asmedigitalcollection.asme.org/ on 04/11/2018 Terms of Use: http://www.asme.org/about-asme/terms-of-use
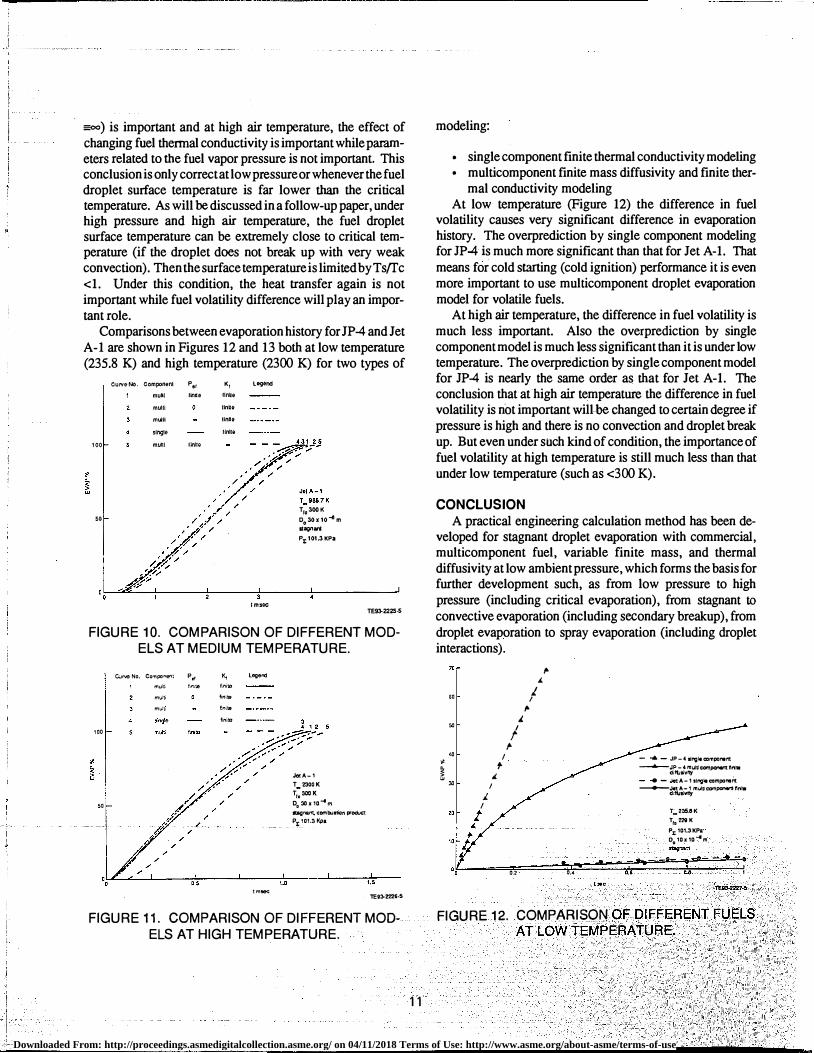
=oo) is important and at high air temperature, the effect of changing fuel thermal conductivity is important while parameters related to the fuel vapor pressure is not important. This conclusion is only correct at low pressure or whenever the fuel droplet surface temperature is far lower than the critical temperature. As will be discussed in a follow-up paper, under high pressure and high air temperature, the fuel droplet surface temperature can be extremely close to critical temperature (if the droplet does not break up with very weak convection). Then the surface temperature is limited by Ts/Tc <1. Under this condition, the heat transfer again is not important while fuel volatility difference will play an important role.
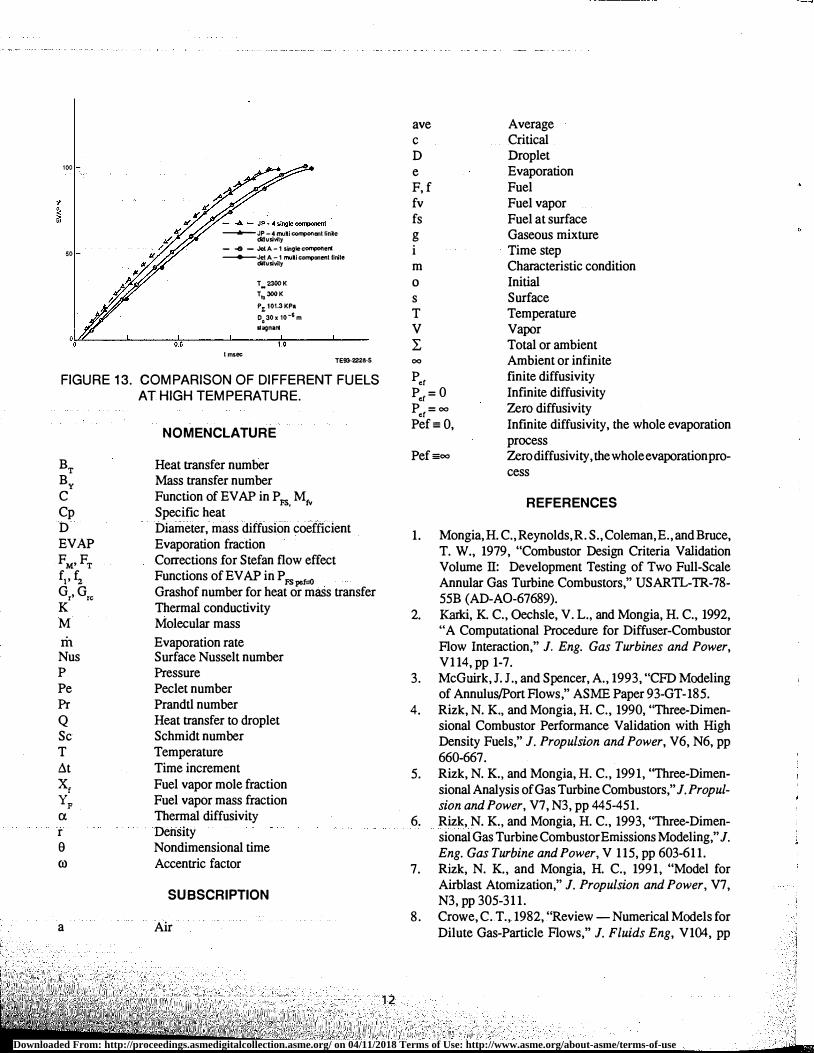
Comparisons between evaporation history for JP-4 andJet A-1 are shown in Figures 12 and 13 both at low temperature (235.8 K) and high temperature (2300 K) for two types of
CUl'\IQ No. Componenl P,, multi Unite mum
mulll
single
100 munJ llnlto
50
Kr fin�&
llnllQ
Unlle
linll•
Log>nd
Tr0300K
0030x10-em �agn ... Pt 101.3KPa
00�-"'""---'���--:-��-e-3���.L.-����--'
1msec TE93-2225.S
FIGURE 10. COMPARISON OF DIFFERENT MODELS AT MEDIUM TEMPERATURE.
c..irve No. Co'Tlpa�t p. multi f•r..ut multi m:;lti
100
50
"' finito fini10 foite fini:o
legerc:l
tm""'
JetA-1 T_ 2300K r,0 300 K 0030110-tm mgnant. combustion p-oduct Pt 101.� Kpa
1Ei3-222ii·S
FIGURE 11. COMPARISON OF DIFFERENT MODELS AT HIGH TEMPERATURE.
11
modeling:
• single component finite thermal conductivity modeling • multicomponent finite mass diffusivity and finite ther
mal conductivity modeling At low temperature (Figure 12) the difference in fuel
volatility causes very significant difference in evaporation history. The overprediction by single component modeling for JP-4 is much more significant than that for Jet A-1. That means for cold starting (cold ignition) performance it is even more important to use multicomponent droplet evaporation model for volatile fuels.
At high air temperature, the difference in fuel volatility is much less important. Also the overprediction by single component model is much less significant than it is under low temperature. The overprediction by single component model for JP-4 is nearly the same order as that for Jet A-1. The conclusion that athigh air temperature the difference in fuel volatility is not important will be changed to certain degree if pressure is high and there is no convection and droplet break up. But even under such kind of condition, the importance of fuel volatility at high temperature is still much less than that under low temperature (such as <300 K).
CONCLUSION A practical engineering calculation method has been de
veloped for stagnant droplet evaporation with commercial, multicomponent fuel, variable finite mass, and thermal diffusivity at low ambient pressure, which forms the basis for further development such, as from low pressure to high pressure (including critical evaporation), from stagnant to convective evaporation (including secondary breakup), from droplet evaporation to spray evaporation (including droplet interactions).
70
60
J. 50 I ,.
"' I ., � � If. 30 I
J. I
20 t
0.2
,. J.
1 I ,.
0,4 o.•
- ..... - JP -4 llngle c:irnpal"llnt __.__��a1�:;3yU1ti compoMm f1nl• - .. - Jet A-1 single companant --+--��;iy mula conponent flnl'9
r_235.eK Tr0mK
P.z: 101.3KPa Do. 10110 ... m -
0.0
FIGURE 12. COMPARISON OF DIFFERENT FUELS AT LOW TEMPERATURE.
Downloaded From: http://proceedings.asmedigitalcollection.asme.org/ on 04/11/2018 Terms of Use: http://www.asme.org/about-asme/terms-of-use
100
50
____.___JP - 4 roolli oomponent linle diffusi�ly - ..o - Jet A -1 single component ---+--Jet A -1 muli component tinile �lusi.,;ly
lmsec
T.2300K T�300K PE 101.3KPa 0030x10-6m �81Jnan1
TE93·2228·5
FIGURE 13. COMPARISON OF DIFFERENT FUELS AT HIGH TEMPERATURE.
BT By c Cp D EVAP FM'FT ft, fz Gr, Grc K M m Nus p Pe Pr Q Sc T �t
xr YF a r e co
a
NOMENCLATURE
Heat transfer number Mass transfer number Function of EV AP in P FS Mrv Specific heat
'
Diameter, mass diffusion coefficient Evaporation fraction Corrections for Stefan flow effect Functions of EV AP in P FS per=<>
Grashof number for heat or mass transfer Thermal conductivity Molecular mass Evaporation rate Surface Nusselt number Pressure Peclet number Prandtl number Heat transfer to droplet Schmidt number Temperature Time increment Fuel vapor mole fraction Fuel vapor mass fraction Thermal diffusivity Density Nondimensional time Accentric factor
SUBSCRIPTION
Air
12
ave c D e F, f fv fs g i m 0 s T v L 00
pcf p =0 cf p =oo cf Pef=O,
Pef=oo
Average Critical Droplet Evaporation Fuel Fuel vapor Fuel at surface Gaseous mixture Time step Characteristic condition Initial Surface Temperature Vapor Total or ambient Ambient or infinite finite diffusivity Infinite diffusivity Zero diffusivity Infinite diffusivity, the whole evaporation process Zero diffusivity, the whole evaporation process
REFERENCES
1. Mongia, H. C., Reynolds, R. S., Coleman, E., and Bruce, T. W., 1979, "Combustor Design Criteria Validation Volume Il: Development Testing of Two Full-Scale Annular Gas Turbine Combustors, " USARTL-TR-78-55B (AD-A0-67689).
2. Karki, K. C., Oechsle, V. L., and Mongia, H. C., 1992, "A Computational Procedure for Diffuser-Combustor Flow Interaction, " J. Eng. Gas Turbines and Power, Vl14, pp 1-7.
3. McGuirk, J. J ., and Spencer, A., 1993, "CFO Modeling of Annulus/Port Flows, " ASME Paper 93-GT-185.
4. Rizk, N. K., and Mongia, H. C., 1990, ''Three-Dimensional Combustor Performance Validation with High Density Fuels, " J. Propulsion and Power, V6, N6, pp 660-667.
5. Rizk, N. K., and Mongia, H. C., 1991, ''Three-Dimensional Analysis of Gas Turbine Combustors, " J. Propulsion and Power, V7, N3, pp 445-451.
6. Rizk, N. K., and Mongia, H. C., 1993, ''Three-Dimensional Gas Turbine Combustor Emissions Modeling, " J. Eng. Gas Turbine and Power, V 115, pp 603-611.
7. Rizk, N. K., and Mongia, H. C., 1991, "Model for Airblast Atomization, " J. Propulsion and Power, V7, N3, pp 305-311.
8. Crowe, C. T., 1982, "Review-Numerical Models for Dilute Gas-Particle Flows, " J. Fluids Eng, V104, pp
Downloaded From: http://proceedings.asmedigitalcollection.asme.org/ on 04/11/2018 Terms of Use: http://www.asme.org/about-asme/terms-of-use
1 297-303. ASME 91-GT-109.
9. Law, C. K., 1982, "Recent Advances in Droplet Vapor- 25. Randolph, A. L., Makino, A., and Law, C. K., 1986, ization and Combustion, " Prog. Energy Combust., Sci., "Liquid-phase Diffusional Resistance in Multicompo-V8, pp 171-201. nent Droplet Gasification, " 21st Symposium (Interna-
10. Faeth, G. M., 1983, "Evaporation and Combustion of tional) on Combustion, The Combustion Institute, pp Sprays, " Prog. Energy Combust, Sci., V9, pp 1-76. 601-608.
11. Sanders, B. R., and Bergan, N. E.; 1989, "Workshop on 26. Makino, A. and Law, C. K., 1986, "On the Controlling Mass, Momentum, and Energy Exchange in Combust- Parameter in the Gasification Behavior of Multicompo-ing Sprays: Droplet Studies, " Sandia National Lab nent Droplets, " Combustion and Flame, 73:331-336. Report 89-8442. 27. Dawbarn, R., Nutt, K. W., and Pender,C. W., 1975, "A
12. Sirignano, W. A., 1992, "Fluid Dynamics of Sprays, " Study of the Jettisoning of JP-4 Fuel in the Atmosphere, 1992 Freemen Scholar Lecture. AEDC TR75-49.
13. Lowell, H., 1960, "Free Fall and Evaporation of JP-lJ et 28. Reid,R.C.,Prausnitz, J.M., andPoling, B.E., 1987, The Fuel Droplets in a Quiet Atmosphere, " NASA TND- Properties ofGasesandLiquids,Fourth Edition, McGraw 199. Hill Book Company.
14. Law, C. W ., 1976, "Unsteady Droplet Vaporization with 29. Clift, R., Grace, J. R., and Weber, M. E., 1978, Bubbles, Droplet Heating, " Combustion and Flame, V 26, pp 17- Drops, and Particles, Academic Press. 22. 30. Heisler, M. P., 1947, ''Temperature Charts for Induction
15. Law, C. K., 1976, "Multicomponent Droplet Combus- and Constant Temperature Heating, " Trans ASME, Vol tionwithRapidinternalMixing, "CombustionandFlame, 69, April. v 26, pp 219-233. 31. Godsave, G. A. E., 1953, " Studies of the Combustion of
16. Good, R. E., and Clewell, H. J ., 1979, "Drop Formation, Drops in a Fuel Spray - The Burning of Single Drops Evaporation Modeling and Environmental Assessment of Fuel, " Fourth Symposium (International) on Com-of JP-4 Fuel Jettisoned from Aircraft, " AIAA Paper 79- bustion, Williams and Wilkins Co, Baltimore, Mary-0186. land, p 881-830.
17. Newbold, F. R. and Amundson, N. R., 1973, " A Model 32. Chin, J. S. and Lefebvre, A. H., 1983, "Steady State for Evaporation of a Multicomponent Droplet, " AIChE Evaporation Characteristics of Hydrocarbon Fuel Drops, " Journal, Vol 19, No. 1, pp 22-30. AIAA Journal, October, Vol 21, pp 1437-1443.
18. Law, C. K, 1978, " Internal Boiling and Superheating in 33. Megaridis, C. M. 1993, "Comparison Between Experi-Vaporizing Multicomponent Droplets, " AIChE Journal, mental Measurements and Numerical Predictions of Vol 24, No. 4, pp 626-632. Internal Temperature Distributions of Droplet Vaporiz-
19. Jin, J. D. and Bannan, G. L., 1985, "A Model for ing Under High Temperature Convective Conditions, " Multicomponent Droplet Vaporization at High Ambient Combustion andFlame, Vol93,No.3,May, pp287-302. Pressure, " SAE paper 850264. 34. Hayashi, S., 1979, "Fuel Droplet Evaporation in High-
20. Aggarwal, S. K., 1987, "Modeling of Multicomponent Temperature and Pressure Stagnation and Flowing En-Fuel Spray Vaporization, " Int. J. Heat & Mass Transfer, vironments, " NAL-TR-538, National Aerospace Lab, V30, pp 1949-61. Tokyo.
21. Kneer, R., Schneider, M., Noll, B., and Wittig, S., 1992, 35. Chiang, C. H, Raju, M. S., and Sirignano, W. A., 1992, "Effects of Variable Liquid Properties on Multicompo- "Numerical Analysis of Convecting, Vaporizing Fuel nent Droplet Vaporization, " ASME 92-GT-131. Droplet with Variable Properties, " Int. J. Heat Mass
22. Bardon, M. F and Rao, V. K., 1984, "Calculation of Transfer, Vol 35, No. 5, pp 1307-1324. Gasoline Volatility, " Journal of the Institute of Energy, 36. Abranzon, B. and Sirignano, W. A., 1989, "Droplet September, pp 343-348. Vaporization Model for Spray Combustion Calcula-
23. Bardon, M. F., Rao, V. K., Vaivads, R., and Evans, M. tions, " Int. J. Heat Mass Transfer, Vol 32, No. 9, pp J.B., 1986, "MeasuredandPredictedEffectoftheExtent 1605-1618. of Evaporation on Gasoline Vapor Pressure, " Journal of 37. Sato, Jun I Chi, 1990, "Effects ofNatural Convection on the Institute of Energy, December, pp 216-221. High Pressure Droplet Combustion, " Combustion and
24. Gauthier, J. E. D., Bardon, M. F., and Rao, V. K, 1991, Flame, Vol 82, p 142-150. "Com bus ti on Characteristics of Multicomponent Fuels 38. Jaluria, Y., 1980, Natural Convection, Heat and Mass under Cold Starting Conditions in a Gas Turbine, " Transfer, Pergamon Press.
13
Downloaded From: http://proceedings.asmedigitalcollection.asme.org/ on 04/11/2018 Terms of Use: http://www.asme.org/about-asme/terms-of-use