an anp-based technology network for identification of core technologies: a case of telecommunication...
TRANSCRIPT

Available online at www.sciencedirect.com
www.elsevier.com/locate/eswa
Expert Systems with Applications 36 (2009) 894–908
Expert Systemswith Applications
An ANP-based technology network for identificationof core technologies: A case of telecommunication technologies
Hakyeon Lee, Chulhyun Kim, Hyunmyung Cho, Yongtae Park *
Department of Industrial Engineering, School of Engineering, Seoul National University, San 56-1, Shillim-Dong,
Kwanak-Gu, Seoul 151-742, Republic of Korea
Abstract
There have often been attempts to examine technological structure and linkage as a network. Network analysis has been mainlyemployed with various centrality measures to identify core technologies in a technology network. None of the existing centrality mea-sures, however, can successfully capture indirect relationships in a network. To address this limitation, this study proposes a novelapproach based on the analytic network process (ANP) to identification of core technologies in a technology network. Since theANP is capable of measuring the relative importance that captures all the indirect interactions in a network, the derived ‘‘limit centrality”
indicates the importance of a technology in terms of impacts on other technologies, taking all the direct and indirect influences intoaccount. The proposed approach is expected to allow technology planners to understand current technological trends and advancesby identifying core technologies based on limit centralities. Using patent citation data as proxy for interactions between technologies,a case study on telecommunication technologies is presented to illustrate the proposed approach.� 2007 Elsevier Ltd. All rights reserved.
Keywords: Analytic network process (ANP); Technology network; Core technology; Centrality; Patent citation
1. Introduction
Due to the intractable complexity and volatility of mod-ern technologies, it becomes more important to photo-graph the overall structure and internal linkage oftechnology networks with the aim of grasping technologi-cal trends and advances. Identifying and assessing techno-logical advances critical to the company’s competitiveposition is now recognized as a crucial activity for achiev-ing and maintaining competitive positions in a rapidlyevolving environment (EIRMA, 2000). Since technologysystems are characterized by strong interdependence(Archibugi & Pianta, 1996), there have often been attemptsto examine technological structure and linkage as a form ofnetwork (Shin & Park, 2007; Wartburg, Teichert, & Rost,2005; Yoon & Park, 2004).
0957-4174/$ - see front matter � 2007 Elsevier Ltd. All rights reserved.
doi:10.1016/j.eswa.2007.10.026
* Corresponding author. Tel.: +82 2 880 8358; fax: +82 2 878 3511.E-mail address: [email protected] (Y. Park).
What is at the core of measuring technological interde-pendence or linkage is patent information (Kim, Suh, &Park, 2007). Patents have been the representative proxyfor technology (Trajtenberg, Henderson, & Jaffe, 1997).A number of studies have been conducted to identify cur-rent technology structure and make a projection of techno-logical future trends by using patent analysis (Archibugi &Pianta, 1996; Basberg, 1984; Basberg, 1987; Chen, Chang,Huang, & Fu, 2005; Gangulli, 2004; Grupp, Lacasa, &Schmoch, 2003). Several measures have been employedfor measuring technological linkage with patents, such asco-classification (Breschi, Lissoni, & Maleraba, 1998;Grupp, 1996), co-word (Courtial, Callon, & Sigogneau,1993), and keyword vector similarity (Yoon & Park,2004). Among those, citation analysis has been the mostpopular one in spite of controversial discussions about itsvalidity. The underlying assumption is that there exists atechnological linkage between the two patents if a patentcites another patent.

H. Lee et al. / Expert Systems with Applications 36 (2009) 894–908 895
Network analysis has often been used in conjunctionwith patent citation analysis with the aim of grasping theoverall relationship and structure in a network. What isat the center of interest is to identify important or coretechnologies in a technology network (Shin & Park,2007). As a quantitative measure of importance in a net-work, centrality measures can be used in network analysis.Among various measures, degree centrality has beenimplicitly deployed as an indicator of importance of tech-nologies in the previous studies (Trajtenberg et al., 1997).However, it does not mirror indirect relationships despitethe fact that indirect citations as well as direct citationsplay a crucial role in characterizing technology networks(Wartburg et al., 2005). There are other centrality measuresthat mirror indirect citations such as eigenvector centrality(Bonacich, 1972) and reachability out-degree (Wartburget al., 2005). None of the measures, however, can success-fully capture indirect relationships and produce meaningfulresults for identifying core technologies in a patent cita-tion-based technology network.
To address these limitations, this study proposes a novelapproach based on the analytic network process (ANP) toidentification of core technologies in a technology network.Since the ANP is capable of measuring the relative impor-tance of technologies that captures all the indirect interac-tions in the technology network, the derived ‘‘limitcentrality” can be used as an implicative centrality measurecharacterizing a technology network and showing coretechnologies in the network.
The remainder of this paper is organized as follows. Sec-tion 2 deals with the previous studies on patent analysisand centrality measures in network analysis. The underly-ing methodology of the proposed approach, the ANP, isbriefly introduced in Section 3. The proposed approach isexplained and illustrated with a case study in Section 4.The paper ends with conclusions in Section 5.
2. Background
2.1. Patent analysis
Patents and patent statistics have long been used as tech-nological indicators (Grilliches, 1990). Although patentshave been the representative proxy for technology as directoutput of R&D activities, there has been a ceaseless contro-versy about the use of patent analysis since patents haveadvantages and disadvantages like any other technologicalindicator (Archibugi & Pianta, 1996). The pros and cons ofpatent analysis are not explained here in detail, but can befound in the literature by Grilliches (1990), Archibugi andPianta (1996), and Ernst (2003).
The most common method for early patent analysiswas to simply count patents and to compare how manypatents had been assigned to each entity, e.g. nations,firms, and technological fields (Wartburg et al., 2005).The basic idea is the more patents belong to different enti-
ties, the more important the entity is. Due to the highlyskewed distribution of patent values, however, judgmentson importance based on simple patent counts could bebiased to a large extent in many cases (Harhoff, Scherer,& Vopel, 2003). It is also incapable of measuringimportance that mirrors influences or linkages amongentities.
Thus, what has become the center of interest in patentanalysis is citation information. Patent citation analysis isbased on the examination of citation links among differentpatents (Narin, 1994). The use of citation information inpatent analysis boosts studies from various streams. Oneof the main research topics is to measure the values of pat-ents based on the number of citations of patents in subse-quent patents. It is validated by a number of evidences thatmore frequently cited patents have higher technologicaland economic value (Breitzman & Thomas, 2002; Narin,Noma, & Perry, 1987; Trajtenberg, 1990). In this context,many studies have employed the number of citations asan indicator of patent quality (Ernst, 2003; Hirschey &Richardson, 2001; Lanjouw & Schankerman, 1999; Reit-zig, 2004). Firm’s value can also be measured based onthe values of patents belonging to the firm (Hall, Jaffe, &Trajtenberg, 2001). Another subject of studies with patentcitation information is to identify similarities between tech-nologies. The similarity information can be used for identi-fying technology overlaps with collaborative firms(Mowery, Oxley, & Silverman, 1998), and proposing anew classification system by clustering patents (Lai &Wu, 2005).
The use of patent citation information in this study is inline with the other research stream, analyzing technologicalknowledge flows or technological linkages based on patentcitation relationships. However, patent citation analysisalone cannot grasp the overall relationship and structureamong all the patents because it merely captures individuallinks between two particular patents (Yoon & Park, 2004).To address this limitation, network analysis, which will bedealt with at the next section, has often been used in con-junction with patent citation analysis to measure techno-logical knowledge flows between entities and identifyimportant or core entities. A number of studies have beenconducted at various levels, such as national level (Jaffe &Trajtenberg, 1998), industry level (Han & Park, 2006), firmlevel (Ham, Linden, & Appleyard, 1998), and technologyclass level (Shin & Park, 2007).
2.2. Network analysis and centrality measures
In general, the interactive relationships among actorscan be portrayed as a network composed of actors (nodes)and interactions (edges) (Gelsing, 1992). The structure ofrelations among actors and the location of actors in thenetwork provide rich information on diverse aspects ofan individual actor, a group of actors, and an overallnetwork (Marseden & Laumann, 1984). Thus, network

Fig. 1. Example of network in ANP and hierarchy in AHP.
896 H. Lee et al. / Expert Systems with Applications 36 (2009) 894–908
analysis has attracted considerable interests from the socialand behavioral science community in recent decades, andhas also been applied and proved fruitful in a wide rangeof disciplines (Wasserman & Faust, 1994). A patent cita-tion-based network is one of the areas where network anal-ysis is effectively employed with the aim of measuringtechnological knowledge flows among actors. An actorcan be an individual patent or patents are assigned to a cor-responding entity such as a nation or a technology class asan actor. Then, the citation relationships among patentsrepresent interactions among actors.
To characterize either holistic network characteristics orindividual actor’s positions in a network, various centralitymeasures can be calculated. Three common measures ofcentrality are degree centrality, closenees centrality, andbetweenness centrality (Freeman, 1979). Among those,degree centrality has been implicitly deployed as an indica-tor of importance of technologies in the previous studies(Trajtenberg et al., 1997). Degree centrality can be definedas the number of ties incident upon a node. However, noneof these centrality measures take into account indirect rela-tionships (Borgatti, 2005). Whereas in traditional networktheory indirect links are in general of less value than directlinks, this does not hold true in the case of patent citations(Wartburg et al., 2005).
Eigenvector centrality is the one of the centrality mea-sures that has to do with indirect influence. Eigenvectorcentrality is defined as the principal eigenvector of theadjacency matrix defining the network (Bonacich, 1972).Simply put, the centrality of an actor is a function ofthe centrality of actors who have relationships with theactor; therefore, a node that has a high eigenvector isone that is adjacent to nodes that are themselves highscores (Bonacich & Lloyd, 2001). Although eigenvectorcentrality has become one of the standard measures ofnetwork centrality, it has rarely been employed where rela-tions among actors have different strength or intensity,that is, valued networks, since it only considers the cen-trality of adjacent nodes and neglects how many nodes anode is adjacent to and how much influence a node hason adjacent nodes (Ruhnau, 2000). Also, influences onactors that have no influence on any other actors are neverconsidered. Therefore, it cannot successfully capture indi-rect relationships and produce meaningful results for tech-nological knowledge flows in a patent citation-basedtechnology network.
Wartburg et al. (2005) proposed the reachability out-degree to take into account indirect citations. The reach-ability out-degree is defined as the probability weighteddirect Freeman out-degree times the probability weighteddirect Freeman out-degrees of the cited patents. Whilethe reachability out-degree can assess indirect citationrelationships, it is a proxy for specialization, not impor-tance or impact. In addition, as what the reachabilityout-degree opts for is unvalued networks where there isno size in edges such as individual patent networks, it can-
not be implicative in the technology network where cita-tion frequency determines the intensity of relationships.In summary, it is required to develop a new centralitymeasure that can capture indirect relationships in anetwork.
3. Analytic network process
The ANP is a generalization of the AHP (Saaty, 1996).The AHP, also developed by Saaty (1980), is one of the mostwidely used multiple criteria decision making (MCDM)methods. The AHP decomposes a problem into several lev-els that make up a hierarchy in which each decision elementis supposed to be independent. The ANP extends the AHPto problems with dependence and feedback. It allows formore complex interrelationships among decision elementsby replacing a hierarchy in the AHP with a network (Meade& Sarkis, 1999). Therefore, in recent years, there has been anincrease in the use of the ANP in a variety of problems suchas strategy selection (Wu & Lee, 2007; Yuksel & Dag devi-ren, 2007), production-related decisions (Chung, Lee, &Pearn, 2005; Lin, Chiu, & Tsai, 2007; Mulebeke & Zheng,2006), project selection (Cheng & Li, 2005; Lee & Kim,2000; Meade & Presley, 2002; Meade & Sarkis, 1999), logis-tics decisions (Agarwal, Shankar, & Tiwari, 2006; Gencer &Gurpinar, 2007; Jharkharia & Shankar, 2007; Meade & Sar-kis, 1998), product design and development (Ayag�& Ozd-emir, 2007; Gungor, 2006; Kahraman, Ertay, &Buyukozkan, 2006; Karsak, Sozer, & Alptekin, 2003; Wei& Chang, 2007), product purchasing decision (Chang, Wu,Lin, & Lin, 2007; Demirtas & Ustun, 2007), quality manage-ment (Bayazit & Karpak, 2007), and financial forecasting(Niemira & Saaty, 2004).
The process of the ANP is comprised of four major steps(Chung et al., 2005; Meade & Sarkis, 1999; Saaty, 1996).
(1) Network model construction. The problem is decom-posed into a network where nodes correspond to clus-ters. The elements in a cluster may influence some orall the elements of any other cluster. These relation-ships are represented by arcs with directions. Also,

H. Lee et al. / Expert Systems with Applications 36 (2009) 894–908 897
the relationships among elements in the same clustercan exist and be represented by a looped arc. Fig. 1shows an example of the network model in theANP compared with a hierarchy in the AHP.
(2) Pairwise comparisons and priority vectors. Elementsof each cluster are compared pairwisely with respectto their impacts on an element in the cluster. Inaddition, pairwise comparisons are made for interde-pendency among elements outside clusters. Whencluster weights are required to weight the superma-trix at the next stage, clusters are also comparedpairwisely with respect to their impacts on each clus-ter. The way of conducting pairwise comparison andobtaining priority vectors is the same as in the AHP.The relative importance values are determined with ascale of 1–9, where a score of 1 indicates equalimportance between the two elements and 9 repre-sents the extreme importance of one element com-pared to the other one. A reciprocal value isassigned to the inverse comparison; that is, aji =1/aij, where aij denotes the importance of the ith ele-ment compared to the jth element. Also, aii = 1 arepreserved in the pairwise comparison matrix. Then,the eigenvector method is employed to obtain localpriority vectors for each pairwise comparisonmatrix.
(3) Supermatrix formation and transformation. The localpriority vectors are entered into the appropriate col-umns of a supermatrix, which is a partitioned matrixwhere each segment represents a relationship betweentwo clusters. The supermatrix of a system of N clus-ters is denoted as the following:
Ck is the kth cluster (k = 1, 2, . . ., N) which has nk
elements denoted as ek1, ek2, . . ., eknk. A matrix seg-
ment, Wij, represents a relationship between the ithcluster and the jth cluster. Each column of Wij is alocal priority vector obtained from the correspondingpairwise comparison, representing the importance ofthe elements in the ith cluster on an element in thejth cluster. When there is no relationship betweenclusters, the corresponding matrix segment is a zeromatrix.
Then, the supermatrix is transformed into theweighted supermatrix each of whose columns sumsto one. This ‘column stochastic’ feature of theweighted supermatrix allows convergence to occurin the limit supermatrix. A recommended approachto obtaining the weighted supermatrix is to deter-mine a cluster priority vector for each cluster, whichindicates relative importance of influences of otherclusters on each cluster. This can be done by conduct-ing pairwise comparisons among clusters with respectto the column cluster. The resulting priority vector isthen used to weight the matrix segments that fall inthe column under the given cluster. The first entryof the vector is multiplied by all the elements in thefirst matrix segment of that column, the second entryby all the elements in the second segment of the col-umn and so on. Repeating this weighting procedurefor all the column clusters produces the weightedsupermatrix.
Finally, the weighted supermatrix is transformedinto the limit supermatrix by raising itself topowers. The reason for multiplying the weightedsupermatrix is because we wish to capture the trans-mission of influence along all possible paths of thesupermatrix. The entries of the weighted superma-trix represent only the direct influence of any ele-ment on any other element, but an element caninfluence a second element indirectly through itsinfluence on a third element that has the directinfluence on the second element. Such one-stepindirect influences are captured by squaring theweighted supermatrix, and two-step indirect influ-ences are obtained from the cubic power of thematrix, and so on. Raising the weighted supermatrixto the power 2k + 1, where k is an arbitrarily largenumber, allow convergence of the matrix, whichmeans the row values converge to the same valuefor each column of the matrix. The resulting matrixis called the limit supermatrix, which yields limitpriorities capturing all the indirect influences ofeach element on every other element. For moredetails on supermatrix characteristics and theory,see the text by Saaty (1996)
(4) Final priorities. When the supermatrix covers thewhole network, the finial priorities of elements arefound in the corresponding columns in the limitsupermatrix. If a supermatrix only includes compo-nents interrelated, additional calculation should bemade.

898 H. Lee et al. / Expert Systems with Applications 36 (2009) 894–908
4. ANP-based technology network
4.1. Overview of proposed approach
The ANP underlies the novel approach to identificationof core technologies in a technology network. The ANPand network analysis has the keyword, ‘network’, in com-mon, but they are markedly different in ultimate objectivesand nodes that make up a network. The ANP is a MCDMmethodology aimed at setting priorities of alternatives orselecting the best alternative. A network model in theANP is composed of decision elements such as goal, crite-ria, and alternatives. On the other hand, the purpose ofnetwork analysis is to grasp the overall structure of a net-work consisting of a variety of types of actors by visualiza-tion and quantification. When a network is constructed toonly visualize the overall relationships among actors, theANP has nothing to do with network analysis. If measur-ing importance of actors or identifying core actors isintended in network analysis, however, the ANP can alsobe employed for the same purpose by viewing actors asalternatives. Then, the centralities or importance of actorsare equivalent to the priorities of alternatives. That is thebasic idea of the proposed approach.
The overall process of the proposed approach is shownin Fig. 2. Firstly, the scope and level of a technology net-work is determined and patent data on selected technolo-gies are collected. Then, a citation frequency matrix isobtained based on the citation relationships among tech-nologies. Finally, the ANP is applied to obtain importanceof technologies, which is named ‘‘limit centrality” that cap-tures all the direct and indirect influence among technolo-gies. In this section, the proposed approach is explainedwith a case study on telecommunication technologies.
4.2. Technology selection and patent data collection
On any measure, the information and communicationtechnology (ICT) industry has been at the forefront ofindustrial globalization (OECD, 2005). ICTs can be classi-
Fig. 2. Overall process of
fied into four categories: telecommunication, consumerelectronics, computers and office machinery, and otherICT (Schapper, 2003). Among those, telecommunicationtechnologies have been playing a critical role in economicgrowth and exhibiting dramatic technological progress.Thus, analyzing the telecommunication technology net-work is expected to provide valuable implications.
The primary source of patent data used in this study isthe United States Patent and Trademark Office (USPTO)database. The USPTO has classified granted patents intocorresponding technology classes defined by the USPC(Unites States Patent Classification). Each subject matterdivision in the USPC includes a major component calleda class and a minor component called a subclass (USPTO,2006). A class generally delineates one technology fromanother and consists of subclasses that delineate processes,structural features, and functional features of the subjectmatter encompassed within the scope of a class. There alsoexists a hierarchy among subclasses in a class. Every sub-class has an indent level as a shorthand notation for illus-trating dependency, represented as a series of zero or moredots. A subclass having an indent level of zero is called amainline subclass which is set in capital letters and boldfont in a class schedule. Subclasses having one or more dotsare the child of a mainline subclass. As an example, a partof the class 329 schedule is shown in Fig. 3. Among the 15subclasses from 329/300 to 329/314, mainline classes are329/300, 329/304, and 329/311.
In this study, a mainline subclass serves as a unit of thetechnology network. The reason for using a mainline sub-class, not a subclass is there is dependency among a main-line subclass and the child subclasses. Since the childsubclasses inherit all the properties of their parent subclass,it doest not make sense to treat all the subclasses at thesame level.
159 mainline subclasses in the USPC were selected astelecommunication technologies. The IPC (InternationalPatent Classification) codes for the four ICT categoriesare provided by OECD and shown in Appendix A. Refer-ring to the US-to-IPC concordance provided by the
proposed approach.

Table 2Form of citation frequency matrix
. . . Class M (citing) . . .
. . . 1 2 . . . m . . .
. . . . . . . . . . . . . . . . . . . . . . . .
1 . . . fN1M1 fN1M2 . . . fN1Mm . . .Class N (cited) 2 . . . fN2M1 fN2M2 . . . fN2Mm . . .
. . . . . . . . . . . . . . . . . . . . .
n . . . fNnM1 fNnM2 . . . fNnMm . . .
. . . . . . . . . . . . . . . . . . . . . . . .
Fig. 3. Part of class 329 schedule.
H. Lee et al. / Expert Systems with Applications 36 (2009) 894–908 899
USPTO website, the USPTO mainline subclasses matchedwith the IPC codes of telecommunication technologieswere only chosen. The selected 159 USPTO mainline sub-classes are shown in Appendix B and they cover 13 classesin the USPC shown in Table 1.
Documents of all the granted patents assigned to the 13classes were collected from the USPTO database andstored in our database. Since the number of patents is sohuge that we cannot collect all of them in manual, theown-developed JAVA-based web document parsing andmining program was used for automatically downloadingpatent documents.
4.3. Citation frequency matrix
The next step is to construct a citation frequency matrixwhich represents citation relationships among mainlinesubclasses. It indicates technological knowledge flows orinfluences among mainline subclasses. The basic form ofa citation frequency matrix is shown in Table 2 where fNiMj
denotes the number of patents in ith mainline subclass ofclass N that patents in jth mainline subclass of class M cite.
Table 1Telecommunication technology classes
Class Title Number of mainlinesubclasses
329 Demodulators 7331 Oscillators 37332 Modulators 7340 Communications: electrical 13341 Coded data generation or conversion 10342 Communications: directive radio wave
systems and devices11
343 Communications: radio wave antennas 1367 Communications, electrical: acoustic wave
systems and devices3
370 Multiplex communications 12375 Pulse or digital communications 20379 Telephonic communications 16380 Cryptography 15455 Telecommunications 7
As a citation has a direction from a citing patent to a citedpatent, the matrix is asymmetric.
To examine the current structure of the telecommunica-tion technology network, citations made by patents onlygranted from 2000 to 2004 were considered. The numberof citations for each cell was calculated by manipulatingthe database storing the collected patent documents. Sincethe number of mainline subclasses of the 13 classes is 159,the resulting citation frequency matrix is a 159 � 159 matrix,but not shown here due to the space limit. Only the citationfrequency matrix at the class level is shown in Table 3.
4.4. ANP
4.4.1. Network model construction
Basically, a network model in ANP is constructed basedon expert judgments to model an abstract decision prob-lem. However, the network in the proposed approach ismade on the basis of citation relationships represented inthe citation frequency matrix, as is in the case of networkanalysis. A cluster in the ANP network corresponds to aclass, and elements in a cluster are equivalent to mainlinesubclasses in a class. In the ANP context, then, the result-ing network model only includes alternative clusters, con-trary to the general network model in the ANPcomprised of a goal cluster, criteria clusters, and alternativeclusters. Thus, the importance of alternatives is only evalu-ated with respect to impacts or influences on other alterna-tives, not with respect to criteria or a goal, which is thesame as the idea of centrality measures in network analysis.

Table 3Citation frequency matrix at class level
455 380 379 375 370 367 343 342 341 340 332 331 329
455 15,487 7714 166 6804 744 20 10 344 140 1034 2837 12,884 3583380 3303 78,954 397 1160 794 3 0 32 241 1369 114 273 176379 1521 4514 400 208 212 36 0 26 17 279 77 200 37375 6469 5030 29 19,587 1380 50 4 226 356 294 4466 9605 7497370 1815 6560 58 3151 1827 35 0 54 61 310 540 1058 1229367 59 87 0 11 0 4 0 8 55 17 3 104 15343 94 46 0 46 0 0 128 43 0 17 16 386 18342 844 693 3 580 33 5 18 860 4 295 191 1347 405341 284 1132 26 770 20 12 0 12 782 227 208 1882 237340 2145 12,084 81 644 141 0 24 300 482 5211 130 1379 314332 1727 51 2 2630 53 5 0 33 74 15 2620 2869 509331 10,748 566 9 7180 104 70 57 495 207 137 2045 101,992 1121329 1495 34 0 3384 80 5 0 63 47 40 453 1373 2435
900 H. Lee et al. / Expert Systems with Applications 36 (2009) 894–908
An arrow indicates the existence of patent citation rela-tionships between classes or mainline subclasses. For exam-ple, an arrow which leaves class A and enters into class B isadded to a network if some of the patents in class A citesome of the patents in class B. What this also means is classB has some influences on class A; thus, subclasses of class Bshould be pair-wisely compared with respect to impacts oneach subclass of class A.
Fig. 4 shows the telecommunication technology networkfor ANP including the 13 classes. Every class has influenceson each other, and includes a feedback loop that representscitation relationships among mainline subclasses in theclass itself. Though the network can be elaborated moreby describing citation relationships at the mainline classlevel, it is not represented due to its complexity.
Fig. 4. Telecommunication tech
4.4.2. Pairwise comparisons and priority vectors
The next step deals with obtaining priority vectors.Firstly, cluster weights are determined through comparisonsat the cluster level. The basic form of measurement in theANP is a pairwise comparison with a scale of 1–9 since sub-ject judgments have to be made on qualitative aspects.
However, pairwise comparisons do not have to be donein the proposed approach. It is implicitly assumed that thenumber of patent citations between a pair of nodes is aproxy of intensity of influence. Then, the importance ofelements can be directly measured from the citation fre-quency matrix. For example, Table 3 shows that the num-ber of citations made by patents of class 455 is 3303 forthe patents of class 380, 1521 for the patents of class379. This can be interpreted that class 380 is about
nology network for ANP.

H. Lee et al. / Expert Systems with Applications 36 (2009) 894–908 901
2.17 (=3303/1.521) times more important than class 379 interms of impacts on class 455. Then, the number 2.17 isinserted to position (380, 379) and reciprocal value, 0.46,
Table 4Pairwise comparison matrix with respect to class 455 and resulting priority ve
h455i 455 380 379 . . .
455 1 4.69 10.18380 1 2.17379 1375370367343342341340332331329
Table 5Cluster weights
455 380 379 375 370 367
455 0.3367 0.0657 0.1418 0.1474 0.1381 0.0816380 0.0718 0.6721 0.3390 0.0251 0.1474 0.0122379 0.0331 0.0384 0.3416 0.0045 0.0393 0.1469375 0.1407 0.0428 0.0248 0.4244 0.2561 0.2041370 0.0395 0.0558 0.0495 0.0683 0.3391 0.1429367 0.0013 0.0007 0.0000 0.0002 0.0000 0.0163343 0.0020 0.0004 0.0000 0.0010 0.0000 0.0000342 0.0184 0.0059 0.0026 0.0126 0.0061 0.0204341 0.0062 0.0096 0.0222 0.0167 0.0037 0.0490340 0.0466 0.1029 0.0692 0.0140 0.0262 0.0000332 0.0376 0.0004 0.0017 0.0570 0.0098 0.0204331 0.2337 0.0048 0.0077 0.1556 0.0193 0.2857329 0.0325 0.0003 0.0000 0.0733 0.0148 0.0204
Table 6Citation frequency matrix and its transformation into priority matrix
455
3.01 403 7
Citation frequency matrix
329 300 0 0 2304 0 1 3311 0 0 0315 0 7 0345 0 1 0347 0 0 0372 0 0 0
Priority matrix
329 300 0.0000 0.0000 0.40304 0.0000 0.1111 0.60311 0.0000 0.0000 0.00315 0.0000 0.7778 0.00345 0.0000 0.1111 0.00347 0.0000 0.0000 0.00372 0.0000 0.0000 0.00
is assigned to position (375, 370). In this way, the pairwisecomparison matrix with respect to class 455 among the 13classes can be obtained as shown in Table 4. Then, the
ctor
331 329 Priority Normalization
1.44 10.36 0.3367 =15,487/45,9910.31 2.21 0.0718 =3303/45,9910.14 1.02 0.0331 =1521/45,9910.60 4.33 0.1407 =6469/45,9910.17 1.21 0.0395 =1815/45,9910.01 0.04 0.0013 =59/45,9910.01 0.06 0.0020 =94/45,9910.08 0.56 0.0184 =844/45,9910.03 0.19 0.0062 =284/45,9910.20 1.43 0.0466 =2145/45,9910.16 1.16 0.0376 =1727/45,9911 7.19 0.2337 =10,748/45,991
1 0.0325 =1495/45,991
343 342 341 340 332 331 329
0.0415 0.1378 0.0568 0.1118 0.2071 0.0952 0.20390.0000 0.0128 0.0977 0.1481 0.0083 0.0020 0.01000.0000 0.0104 0.0069 0.0302 0.0056 0.0015 0.00210.0166 0.0905 0.1444 0.0318 0.3260 0.0710 0.42650.0000 0.0216 0.0247 0.0335 0.0394 0.0078 0.06990.0000 0.0032 0.0223 0.0018 0.0002 0.0008 0.00090.5311 0.0172 0.0000 0.0018 0.0012 0.0029 0.00100.0747 0.3446 0.0016 0.0319 0.0139 0.0100 0.02300.0000 0.0048 0.3171 0.0246 0.0152 0.0139 0.01350.0996 0.1202 0.1955 0.5637 0.0095 0.0102 0.01790.0000 0.0132 0.0300 0.0016 0.1912 0.0212 0.02900.2365 0.1983 0.0839 0.0148 0.1493 0.7535 0.06380.0000 0.0252 0.0191 0.0043 0.0331 0.0101 0.1385
39 73 91 130
3 30 13 15216 38 37 3474 3 6 2717 64 27 4713 2 5 3012 24 20 1290 0 0 1
00 0.0545 0.1863 0.1204 0.131400 0.2909 0.2360 0.3426 0.299900 0.0727 0.0186 0.0556 0.023300 0.3091 0.3975 0.2500 0.407100 0.0545 0.0124 0.0463 0.025900 0.2182 0.1491 0.1852 0.111500 0.0000 0.0000 0.0000 0.0009

6734
334
234
134
033
233
132
9
..
..
..
300
304
311
315
345
347
372
..
..
..
0.00
000.
0011
0.00
000.
0000
0.00
000.
0000
0.00
00
..
..
..
0.01
260.
0504
0.05
170.
0096
0.02
080.
0083
0.09
38
..
..
..
0.01
260.
0258
0.00
000.
0032
0.00
000.
0062
0.00
00
..
..
..
0.07
550.
1153
0.13
790.
0777
0.06
250.
0922
0.06
25
..
..
..
0.09
430.
0582
0.00
000.
0714
0.04
170.
0598
0.18
75
..
..
..
0.03
770.
0582
0.10
340.
0469
0.02
080.
1774
0.06
25
..
..
..
0.76
730.
6909
0.70
690.
7913
0.85
420.
6561
0.59
38
..
..
..
..
..
..
.
..
..
..
..
..
..
.
..
..
..
..
..
..
.
..
..
..
..
..
..
.
..
..
..
..
..
..
.
..
..
..
..
..
..
.
..
..
..
..
..
..
.
..
..
..
..
..
..
.
..
..
..
..
..
..
.
..
..
..
..
..
..
.
..
..
..
..
..
..
.
..
..
..
0.50
380.
0498
0.00
000.
0854
0.07
350.
1010
0.12
50
..
..
..
0.15
150.
7658
0.25
000.
1357
0.60
290.
1838
0.25
00
..
..
..
0.01
140.
0102
0.51
670.
0244
0.04
410.
0505
0.00
00
..
..
..
0.28
790.
0905
0.10
000.
6113
0.16
180.
2929
0.37
50
..
..
..
0.03
030.
0158
0.00
000.
0442
0.05
880.
0222
0.12
50
..
..
..
0.01
140.
0645
0.13
330.
0976
0.04
410.
3394
0.12
50
..
..
..
0.00
050.
0005
0.00
000.
0002
0.00
200.
0014
0.00
00
902 H. Lee et al. / Expert Systems with Applications 36 (2009) 894–908
priority vector for class 455 is derived from the eigenvec-tor method. This priority vector is naturally the same asthe vector of the number of citations that each of 13classes received divided by total number of citations madeby the patents of class 455. This is because the pairwisecomparison matrix is a completely consistent matrix.Therefore, the priority vectors can be directly obtainedfrom the citation frequency matrix without pairwisecomparisons.
Table 5 shows the priority vectors for each cluster,that is, the cluster weights derived in this way. The clus-ter weights will be used to obtain the weighted super-matrix.
Secondly, local priority vectors for mainline subclassesare obtained. In ANP, basically, pairwise comparisonsare made among elements of a cluster an arrow enters withrespect to each element of a cluster from which an arrowleaves. For a feedback loop, elements in a cluster arepair-wisely compared with respect to each element in thecluster itself. For each pairwise comparison supposed tobe made, local priority vectors can be directly derivedwithout pairwise comparisons as mentioned above. Forexample, the importance of mainline subclasses of class370 on each mainline subclass of class 450 is obtained bytransformation of the citation frequency matrix, as shownin Table 6. What is important here is normalization of col-umns has to be done for each cluster. The resulting set ofpriority vectors, a priority matrix, will be imported to thesupermatrix.
Tab
le7
Su
per
mat
rix
455
380
379
375
370
3
3.01
403
739
7391
130
..
..
.
455
3.01
0.00
000.
0005
0.00
000.
0051
0.00
050.
0023
0.00
11.
..
..
403
0.13
790.
6938
0.33
710.
0925
0.16
250.
0320
0.00
89.
..
..
70.
0000
0.03
710.
1873
0.02
310.
0286
0.01
070.
0086
..
..
.
390.
2069
0.07
390.
1161
0.28
280.
0561
0.08
460.
0479
..
..
.
730.
3793
0.15
540.
2472
0.08
740.
2166
0.15
240.
1020
..
..
.
910.
1379
0.00
750.
0749
0.09
510.
1162
0.52
900.
1006
..
..
.
130
0.13
790.
0318
0.03
750.
4139
0.41
950.
1890
0.73
10.
..
..
380
..
..
..
..
..
..
.
379
..
..
..
..
..
..
.
375
..
..
..
..
..
..
.
370
..
..
..
..
..
..
.
367
..
..
..
..
..
..
.
343
..
..
..
..
..
..
.
342
..
..
..
..
..
..
.
341
..
..
..
..
..
..
.
340
..
..
..
..
..
..
.
332
..
..
..
..
..
..
.
331
..
..
..
..
..
..
.
329
300
0.00
000.
0000
0.40
000.
0545
0.18
630.
1204
0.13
14.
..
..
304
0.00
000.
1111
0.60
000.
2909
0.23
600.
3426
0.29
99.
..
..
311
0.00
000.
0000
0.00
000.
0727
0.01
860.
0556
0.02
33.
..
..
315
0.00
000.
7778
0.00
000.
3091
0.39
750.
2500
0.40
71.
..
..
345
0.00
000.
1111
0.00
000.
0545
0.01
240.
0463
0.02
59.
..
..
347
0.00
000.
0000
0.00
000.
2182
0.14
910.
1852
0.11
15.
..
..
372
0.00
000.
0000
0.00
000.
0000
0.00
000.
0000
0.00
09.
..
..
4.4.3. Supermatrix formation and transformation
The supermatrix is constructed with local priority vec-tors obtained from the previous step. The supermatrix forthe telecommunication technology network, which is a159 � 159 matrix composed of 169 (=13 � 13) blocks. Ablock corresponds to a set of priority vectors, a prioritymatrix. The priority matrix in Table 6 is equivalent toW13,1 in the supermatrix. Table 7 shows a part of the limitsupermatrix.
The supermatrix then needs to be transformed into theweighted supermatrix. Each matrix segment of thesupermatrix is multiplied by the corresponding clusterweights shown in Table 5. For example, all the elementsof W11 are multiplied by the weight of class 455 for class455 itself, 0.3367, W13,1 is multiplied by 0.0325, and so on.However, the resulting matrix is not column stochasticbecause there are several matrix segments that have col-umns all of whose entries are zero. When this is the case,the weighted column of the supermatrix must be renor-malized (Saaty, 1996). The renormalized matrix, which isnow column stochastic, is what is called the weightedsupermatrix. A part of the weighted supermatrix is shownin Table 8. Finally, the limit supermatrix was derived byraising the weighted supermatrix to powers. In this case,convergence is reached at W41. Table 9 shows a part ofthe limit supermatrix.

Table 8
Weighted supermatrix
455 380 379 375 370 367 343 342 341 340 332 331 329
3.01 403 7 39 73 91 130 . . . . . . . . . . . 300 304 311 315 345 347 372
455 3.01 0.0000 0.0002 0.0000 0.0017 0.0002 0.0008 0.0004 . . . . . . . . . . . 0.0000 0.0002 0.0000 0.0000 0.0000 0.0000 0.0000
403 0.0695 0.2339 0.1144 0.0312 0.0547 0.0108 0.0030 . . . . . . . . . . . 0.0026 0.0103 0.0105 0.0020 0.0043 0.0017 0.0221
7 0.0000 0.0125 0.0635 0.0078 0.0096 0.0036 0.0029 . . . . . . . . . . . 0.0026 0.0053 0.0000 0.0007 0.0000 0.0013 0.0000
39 0.1042 0.0249 0.0394 0.0953 0.0189 0.0285 0.0161 . . . . . . . . . . . 0.0154 0.0235 0.0281 0.0159 0.0128 0.0188 0.0147
73 0.1911 0.0524 0.0839 0.0295 0.0730 0.0513 0.0343 . . . . . . . . . . . 0.0193 0.0119 0.0000 0.0146 0.0085 0.0122 0.0442
91 0.0695 0.0025 0.0254 0.0321 0.0391 0.1781 0.0339 . . . . . . . . . . . 0.0077 0.0119 0.0211 0.0096 0.0043 0.0362 0.0147
130 0.0695 0.0107 0.0127 0.1395 0.1413 0.0637 0.2461 . . . . . . . . . . . 0.1570 0.1409 0.1441 0.1615 0.1748 0.1338 0.1400
380 . . . . . . . . . . . . . . . . . . . . . . . . . .
379 . . . . . . . . . . . . . . . . . . . . . . . . . .
375 . . . . . . . . . . . . . . . . . . . . . . . . . .
370 . . . . . . . . . . . . . . . . . . . . . . . . . .
367 . . . . . . . . . . . . . . . . . . . . . . . . . .
343 . . . . . . . . . . . . . . . . . . . . . . . . . .
342 . . . . . . . . . . . . . . . . . . . . . . . . . .
341 . . . . . . . . . . . . . . . . . . . . . . . . . .
340 . . . . . . . . . . . . . . . . . . . . . . . . . .
332 . . . . . . . . . . . . . . . . . . . . . . . . . .
331 . . . . . . . . . . . . . . . . . . . . . . . . . .
329 300 0.0000 0.0000 0.0131 0.0018 0.0061 0.0039 0.0043 . . . . . . . . . . . 0.0701 0.0069 0.0000 0.0118 0.0102 0.0140 0.0200
304 0.0000 0.0036 0.0197 0.0095 0.0077 0.0111 0.0097 . . . . . . . . . . . 0.0211 0.1061 0.0346 0.0188 0.0839 0.0255 0.0401
311 0.0000 0.0000 0.0000 0.0024 0.0006 0.0018 0.0008 . . . . . . . . . . . 0.0016 0.0014 0.0716 0.0034 0.0061 0.0070 0.0000
315 0.0000 0.0253 0.0000 0.0101 0.0129 0.0081 0.0132 . . . . . . . . . . . 0.0400 0.0125 0.0139 0.0848 0.0225 0.0406 0.0601
345 0.0000 0.0036 0.0000 0.0018 0.0004 0.0015 0.0008 . . . . . . . . . . . 0.0042 0.0022 0.0000 0.0061 0.0082 0.0031 0.0200
347 0.0000 0.0000 0.0000 0.0071 0.0048 0.0060 0.0036 . . . . . . . . . . . 0.0016 0.0089 0.0185 0.0135 0.0061 0.0470 0.0200
372 0.0000 0.0000 0.0000 0.0000 0.0000 0.0000 0.0000 . . . . . . . . . . . 0.0005 0.0005 0.0000 0.0002 0.0020 0.0014 0.0000
Table 9
Limit supermatrix
455 380 379 375 370 367 343 342 341 340 332 331 329
3.01 403 7 39 73 91 130 . . . . . . . . . . . 300 304 311 315 345 347 372
455 3.01 0.0003 0.0003 0.0003 0.0003 0.0003 0.0003 0.0003 . . . . . . . . . . . 0.0003 0.0003 0.0003 0.0003 0.0003 0.0003 0.0003
403 0.0194 0.0193 0.0194 0.0194 0.0194 0.0194 0.0194 . . . . . . . . . . . 0.0193 0.0193 0.0193 0.0193 0.0193 0.0193 0.0193
7 0.0032 0.0032 0.0032 0.0032 0.0032 0.0032 0.0032 . . . . . . . . . . . 0.0032 0.0032 0.0032 0.0032 0.0032 0.0032 0.0032
39 0.0164 0.0164 0.0164 0.0164 0.0164 0.0164 0.0164 . . . . . . . . . . . 0.0164 0.0164 0.0164 0.0164 0.0164 0.0164 0.0164
73 0.0174 0.0173 0.0174 0.0174 0.0174 0.0174 0.0174 . . . . . . . . . . . 0.0174 0.0173 0.0174 0.0174 0.0174 0.0174 0.0174
91 0.0180 0.0180 0.0180 0.0180 0.0180 0.0180 0.0180 . . . . . . . . . . . 0.0180 0.0180 0.0180 0.0180 0.0180 0.0180 0.0180
130 0.0699 0.0699 0.0699 0.0699 0.0699 0.0699 0.0699 . . . . . . . . . . . 0.0699 0.0699 0.0699 0.0699 0.0699 0.0699 0.0699
380 . . . . . . . . . . . . . . . . . . . . . . . . . .
379 . . . . . . . . . . . . . . . . . . . . . . . . . .
375 . . . . . . . . . . . . . . . . . . . . . . . . . .
370 . . . . . . . . . . . . . . . . . . . . . . . . . .
367 . . . . . . . . . . . . . . . . . . . . . . . . . .
343 . . . . . . . . . . . . . . . . . . . . . . . . . .
342 . . . . . . . . . . . . . . . . . . . . . . . . . .
341 . . . . . . . . . . . . . . . . . . . . . . . . . .
340 . . . . . . . . . . . . . . . . . . . . . . . . . .
332 . . . . . . . . . . . . . . . . . . . . . . . . . .
331 . . . . . . . . . . . . . . . . . . . . . . . . . .
329 300 0.0025 0.0025 0.0025 0.0025 0.0025 0.0025 0.0025 . . . . . . . . . . . 0.0025 0.0025 0.0025 0.0025 0.0025 0.0025 0.0025
304 0.0102 0.0102 0.0102 0.0102 0.0102 0.0102 0.0102 . . . . . . . . . . . 0.0102 0.0102 0.0102 0.0102 0.0102 0.0102 0.0102
311 0.0015 0.0015 0.0015 0.0015 0.0015 0.0015 0.0015 . . . . . . . . . . . 0.0015 0.0015 0.0015 0.0015 0.0015 0.0015 0.0015
315 0.0075 0.0075 0.0075 0.0075 0.0075 0.0075 0.0075 . . . . . . . . . . . 0.0075 0.0075 0.0075 0.0075 0.0075 0.0075 0.0075
345 0.0008 0.0008 0.0008 0.0008 0.0008 0.0008 0.0008 . . . . . . . . . . . 0.0008 0.0008 0.0008 0.0008 0.0008 0.0008 0.0008
347 0.0026 0.0026 0.0026 0.0026 0.0026 0.0026 0.0026 . . . . . . . . . . . 0.0026 0.0026 0.0026 0.0026 0.0026 0.0026 0.0026
372 0.0000 0.0000 0.0000 0.0000 0.0000 0.0000 0.0000 . . . . . . . . . . . 0.0000 0.0000 0.0000 0.0000 0.0000 0.0000 0.0000
H.
Lee
eta
l./Ex
pert
Sy
stems
with
Ap
plica
tions
36
(2
00
9)
89
4–
90
8903

Appendix A. ICT classification and corresponding IPC codes
Classifications IPC codes
Telecommunication G01S, G08C, G09C, H01P, H01Q,H01S3/(025, 243, 063, 067, 085,0933, 0941, 103, 133, 18, 19, 25),H1S5, H03B, H03C, H03D, H03H,H03M, H04B, H04J, H04K, H04L,H04M, H04Q
Consumerelectronics
G11B, H03F, H03G, H03J, H04H,H04N, H04R, H04S
Table 10Limit centralities of 13 classes
No. Title Limitcentrality
455 Telecommunications 0.0251380 Cryptography 0.2885379 Telephonic communications 0.0272375 Pulse or digital communications 0.0883370 Multiplex communications 0.0191367 Communications, electrical: acoustic wave systems
and devices0.0219
343 Communications: radio wave antennas 0.0034342 Communications: directive radio wave systems and
devices0.0023
341 Coded data generation or conversion 0.0515340 Communications: electrical 0.1547332 Modulators 0.0263331 Oscillators 0.1464329 Demodulators 0.1446
904 H. Lee et al. / Expert Systems with Applications 36 (2009) 894–908
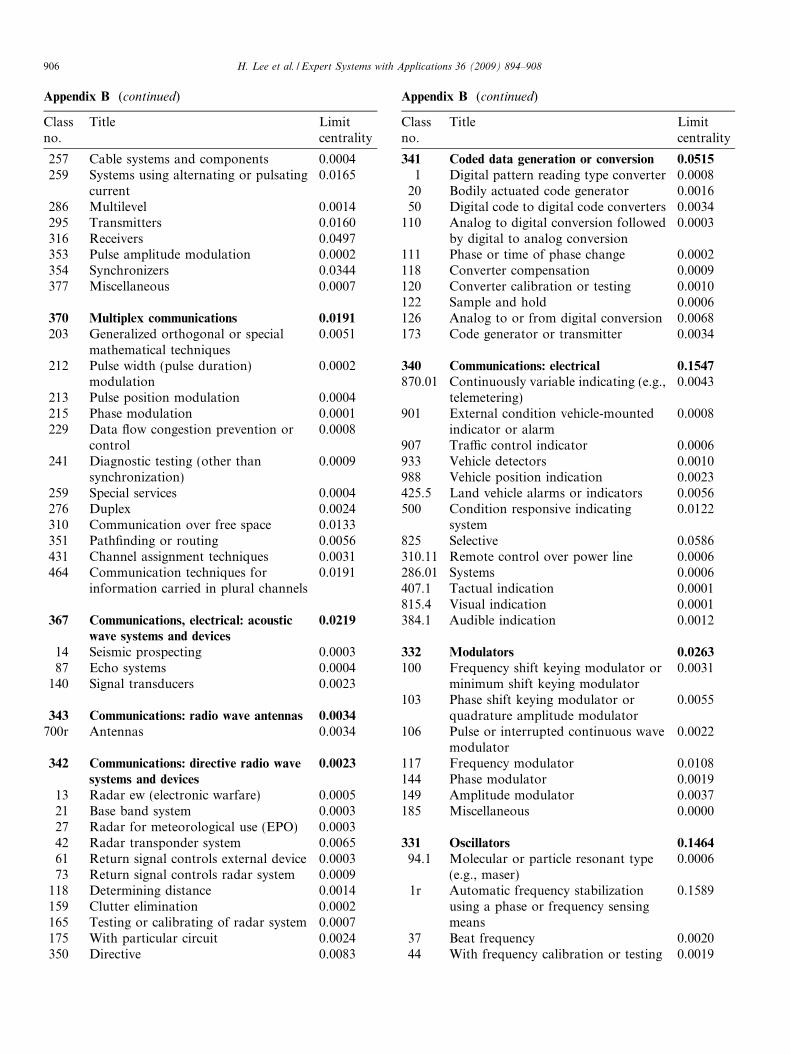
4.5. Limit centrality
As the supermatrix covers the whole network, the col-umns in the limit supermatrix (Table 9) represent final pri-orities, namely, limit centralities. That is why it is calledlimit centrality. Due to the nature of limit priorities inANP, the limit centralities of all the elements sum to one.The limit centrality indicates importance of technologiesin terms of impacts on other technologies, taking all thedirect and indirect influences into consideration. The limitcentralities of the 159 mainline subclasses are shown inAppendix B. The limit centrality of a class is the sum ofmainline subclasses belonging to the class. Table 10 showsthe limit centralities of 13 classes.
At the mainline subclass level, the one with the highestlimit centrality is 455/130 (Receiver or analog modulatedsignal frequency converter), and the next is 375/316(Receivers). It is obvious that these technologies have sig-nificant impacts on other technologies, and therefore theyare considered as the core technologies of the telecommuni-cation technology network. When it comes to the classlevel, 380 (Cryptography) has the highest limit centrality,followed by 340 (Communications: electrical), 331 (Oscilla-tors), and 329 (Demodulators).
On the other hand, the limit centrality of 379/414 (trans-mission line conditioning) is zero since its patents havenever been cited by all the patents of the other classes.The class whose limit centrality is the lowest is 342 (Com-munications: directive radio wave systems and devices).
5. Conclusions
The proposed approach measures the limit centralitiesof technologies with the aim of identification of core tech-nologies in the technology network. A case study on thetelecommunication technology network was presented toillustrate the proposed approach. After constructing thecitation frequency matrix based on patent data collected
from the USPTO, the ANP network model was con-structed and local priority vectors were obtained. Formingand transforming the supermatrix led to converged priori-ties, limit centralities.
The main contribution of this study is to apply theMCDM methodology, ANP, to a technology network.Since ANP captures the relative importance that mirrorsall the direct and indirect interactions, the limit centralitymeasures importance of technologies in terms of impactson other technologies in the technology network, takingindirect impacts or relationships into account, which is verydifficult or tedious with the conventional centrality mea-sures. The applicability of limit centrality is not limitedto a technology network. For any type of social networks,the limit centrality can be used as an implicative centralitymeasure characterizing a network and showing core actorsin the network.
Nevertheless, this research is still subject to some limi-tations. Firstly, it cannot be used for undirectional net-works where an edge has no direction and onlyrepresents the existence of a relationship between twonodes since relationships in a network of ANP must havedirections depending on the influence between elements orclusters. Secondly, the influences among patent classes aremeasured by the absolute size of patent citations; thus, wecannot control the effect of the size of a class, that is, totalnumber of patents in a class, on measuring the degree ofimpacts. The relative impact may be a more implicativemeasure depending on the context. It can be derived bydividing each column of the citation frequency matrixby the total number of patents in the corresponding class.Thirdly, the selected 13 patent classes as telecommunica-tion technologies are by no means exhaustive. A moresystematic procedure is required to select the targetclasses.
These limitations could serve as fruitful avenues forfuture research. Applications of the proposed approachto a variety of networks can be a worthwhile area for futureresearch. A dynamic analysis on the telecommunicationnetwork is also expected to provide useful information onthe change of the network structure and technologicaltrends.

Appendix A (continued)
Classifications IPC codes
Computers,office
machinery
B07C, B41J, B41K, G02F, G03G, G05F,G06, G07, G09G, G10L, G11C, H03K,H03L
Other ICT G01B, G01C, G01D, G01F, G01G,G01H, G01J, G01K, G01L, G01M,G01N, G01P, G01R, G01V, G01W,G02B6, G05B, G08G, G09B, H01B11,H01J(11/, 13/, 15/, 17/, 19/, 21/, 23/, 25/,27/, 29/, 31/, 33/, 40/, 41/, 43/, 45/), H01L
Appendix B. One hundred and fifty nine mainline subclasses’
titles and derived limit centralities
Classno.
Title Limitcentrality
455 Telecommunications 0.0251
3.01 Wireless distribution system 0.0003403 Radiotelephone system 0.0194
7 Carrier wave repeater or relay system(i.e., retransmission of sameinformation)
0.0032
39 Transmitter and receiver at separatestations
0.0164
73 Transmitter and receiver at samestation (e.g., transceiver)
0.0174
91 Transmitter 0.0180130 Receiver or analog modulated signal
frequency converter0.0699
380 Cryptography 0.2885
1 Cryptanalysis 0.00022 Equipment test or malfunction
indication 10.0009
200 Video cryptography 0.0216243 Facsimile cryptography 0.0018247 Cellular telephone cryptographic
authentication0.0050
251 Electronic game using cryptography 0.0001252 Electric signal masking 0.0006255 Communication system using
cryptography0.0422
277 Key management 0.034628 Particular algorithmic function
encoding0.0292
287 Electric signal modification 0.005954 By modifying optical image (e.g.,
transmissive overlay)0.0023
55 Having production of printed copy(e.g., cryptographic printer ortyperwriter)
0.0012
Appendix B (continued)
Classno.
Title Limitcentrality
56 Selectively movable element havingcode characters
0.0002
59 Miscellaneous 0.0008
379 Telephonic communications 0.0272
1.01 Diagnostic testing, malfunctionindication, or electrical conditionmeasurement
0.0005
67.1 Audio message storage, retrieval, orsynthesis
0.0031
90.01 Telephone line or system combinedwith diverse electrical system orsignalling (e.g., composite)
0.0106
110.01 Composite substation or therminal(e.g., having calculator, radio)
0.0001
111 With usage measurement (e.g., call ortraffic register)
0.0022
142.01 Reception of calling information atsubstation in wirelinecommunications system
0.0004
156 Multi-line or key substation systemwith selective switching and centralswitching office connection
0.0003
188 Call or terminal access alarm orcontrol
0.0009
201.01 Special services 0.0017219 Plural exchange network or
interconnection0.0005
242 Centralized switching system 0.0011350 Supervisory or control line signaling 0.0018399.01 Subscriber line or transmission line
interface0.0010
414 Transmission line conditioning 0.0000419 Terminal 0.0016441 Terminal accessory or auxiliary
equipment0.0004
375 Pulse or digital communications 0.0883130 Spread spectrum 0.0162211 Repeaters 0.0002216 Apparatus convertible to analog 0.0013219 Transceivers 0.0042224 Testing 0.0013229 Equalizers 0.0042237 Pulse number modulation 0.0001238 Pulse with modulation 0.0011239 Pulse position, frequency, or spacing
modulation0.0011
240 Bandwidth reduction or expansion 0.0039242 Pulse code modulation 0.0016256 Pulse transmission via radiated
baseband0.0003
(continued on next page)
H. Lee et al. / Expert Systems with Applications 36 (2009) 894–908 905
Appendix B (continued)
Classno.
Title Limitcentrality
257 Cable systems and components 0.0004259 Systems using alternating or pulsating
current0.0165
286 Multilevel 0.0014295 Transmitters 0.0160316 Receivers 0.0497353 Pulse amplitude modulation 0.0002354 Synchronizers 0.0344377 Miscellaneous 0.0007
370 Multiplex communications 0.0191
203 Generalized orthogonal or specialmathematical techniques
0.0051
212 Pulse width (pulse duration)modulation
0.0002
213 Pulse position modulation 0.0004215 Phase modulation 0.0001229 Data flow congestion prevention or
control0.0008
241 Diagnostic testing (other thansynchronization)
0.0009
259 Special services 0.0004276 Duplex 0.0024310 Communication over free space 0.0133351 Pathfinding or routing 0.0056431 Channel assignment techniques 0.0031464 Communication techniques for
information carried in plural channels0.0191
367 Communications, electrical: acousticwave systems and devices
0.0219
14 Seismic prospecting 0.000387 Echo systems 0.0004
140 Signal transducers 0.0023
343 Communications: radio wave antennas 0.0034
700r Antennas 0.0034
342 Communications: directive radio wave
systems and devices
0.0023
13 Radar ew (electronic warfare) 0.000521 Base band system 0.000327 Radar for meteorological use (EPO) 0.000342 Radar transponder system 0.006561 Return signal controls external device 0.000373 Return signal controls radar system 0.0009
118 Determining distance 0.0014159 Clutter elimination 0.0002165 Testing or calibrating of radar system 0.0007175 With particular circuit 0.0024350 Directive 0.0083
Appendix B (continued)
Classno.
Title Limitcentrality
341 Coded data generation or conversion 0.0515
1 Digital pattern reading type converter 0.000820 Bodily actuated code generator 0.001650 Digital code to digital code converters 0.0034
110 Analog to digital conversion followedby digital to analog conversion
0.0003
111 Phase or time of phase change 0.0002118 Converter compensation 0.0009120 Converter calibration or testing 0.0010122 Sample and hold 0.0006126 Analog to or from digital conversion 0.0068173 Code generator or transmitter 0.0034
340 Communications: electrical 0.1547870.01 Continuously variable indicating (e.g.,
telemetering)0.0043
901 External condition vehicle-mountedindicator or alarm
0.0008
907 Traffic control indicator 0.0006933 Vehicle detectors 0.0010988 Vehicle position indication 0.0023425.5 Land vehicle alarms or indicators 0.0056500 Condition responsive indicating
system0.0122
825 Selective 0.0586310.11 Remote control over power line 0.0006286.01 Systems 0.0006407.1 Tactual indication 0.0001815.4 Visual indication 0.0001384.1 Audible indication 0.0012
332 Modulators 0.0263
100 Frequency shift keying modulator orminimum shift keying modulator
0.0031
103 Phase shift keying modulator orquadrature amplitude modulator
0.0055
106 Pulse or interrupted continuous wavemodulator
0.0022
117 Frequency modulator 0.0108144 Phase modulator 0.0019149 Amplitude modulator 0.0037185 Miscellaneous 0.0000
331 Oscillators 0.1464
94.1 Molecular or particle resonant type(e.g., maser)
0.0006
1r Automatic frequency stabilizationusing a phase or frequency sensingmeans
0.1589
37 Beat frequency 0.002044 With frequency calibration or testing 0.0019
906 H. Lee et al. / Expert Systems with Applications 36 (2009) 894–908

Appendix B (continued)
Classno.
Title Limitcentrality
45 Polyphase output 0.001846 Plural oscillators 0.007957 Ring oscillators 0.010759 Convertible (e.g., oscillator to
amplifier, etc.)0.0001
60 Single oscillator with plural outputcircuits
0.0010
62 With oscillator circuit protectivemeans
0.0001
64 With indicator, signal, or alarm 0.000365 With device responsive to external
physical condition0.0025
67 With electromagnetic or electrostaticshield
0.0001
68 With outer casing or housing 0.001270 With temperature modifier 0.000272 Electron-coupled type 0.000074 Combined with particular output
coupling network0.0059
78 Electrical noise or random wavegenerator
0.0034
79 Beam tube 0.000086 With magnetically controlled space
discharge device (e.g., magnetron)0.0001
96 With distributed parameter resonator 0.0050105 With parasitic oscillation control or
prevention means0.0003
107r Solid state active element oscillator 0.0319126 Gaseous space discharge device 0.0000132 Negative resistance or negative
transconductance oscillator0.0004
135 Phase shift type 0.0011138 Bridge type 0.0002143 Relaxation oscillators 0.0027154 Electromechanical resonator 0.0060165 Shock excited resonant circuit 0.0002167 L-C type oscillators 0.0015172 With synchronizing, triggering or
pulsing circuits0.0019
175 Frequency stabilization 0.0078177r With frequency adjusting means 0.0263182 Amplitude control or stabilization 0.0018185 With particular source of power or
bias voltage0.0026
187 Miscellaneous oscillator structures 0.0001
329 Demodulators 0.1446
300 Frequency shift keying or minimumshift keying demodulator
0.0025
304 Phase shift keying or quadratureamplitude demodulator
0.0102
311 Pulse or interrupted continuous wavedemodulator
0.0015
Appendix B (continued)
Classno.
Title Limitcentrality
315 Frequency modulationdemodulator
0.0075
345 Phase modulation demodulator 0.0008347 Amplitude modulation
demodulator0.0026
372 Miscellaneous 0.0000
H. Lee et al. / Expert Systems with Applications 36 (2009) 894–908 907
References
Agarwal, A., Shankar, R., & Tiwari, M. K. (2006). Modeling the metricsof lean, agile and leagile supply chain: An ANP-based approach.European Journal of Operational Research, 173(1), 211–225.
Archibugi, D., & Pianta, M. (1996). Measuring technological changethrough patents and innovation surveys. Technovation, 16, 451–458.
Ayag�, Z., & Ozdemir, R. G. (2007). An analytic network process-basedapproach to concept evaluation in a new product developmentenvironment. Journal of Engineering Design, 18(3), 209–226.
Basberg, B. L. (1984). Patent statistics and the measurement of techno-logical change: An assessment of the Norwegian patent data, 1840–1980. World Patent Information, 6, 158–164.
Basberg, B. L. (1987). Patents and the measurement of technologicalchange: A survey of literature. Research Policy, 16, 131–141.
Bayazit, O., & Karpak, B. (2007). An analytical network process-basedframework for successful total quality management (TQM): Anassessment of Turkish manufacturing industry readiness. International
Journal of Production Economics, 105(1), 79–96.Bonacich, P., & Lloyd, P. (2001). Eigenvector-like measures of centrality
for asymmetric relations. Social Networks, 23(3), 191–201.Bonacich, P. (1972). Factoring and weighting approaches to status scores
and clique identification. Journal of Mathematical Sociology, 2,113–120.
Borgatti, S. P. (2005). Centrality and network flow. Social Networks,
27(1), 55–71.Breitzman, A., & Thomas, P. (2002). Using patent citation analysis to
target/value M&A candidates. Research Technology Management, 45,28–46.
Breschi, S., Lissoni, F., & Maleraba, F. (1998). Knowledge proximity andtechnological diversification, CESPRI, ISE Research Project.
Chang, C. W., Wu, C. R., Lin, C. T., & Lin, H. L. (2007). Evaluatingdigital video recorder systems using analytic hierarchy and analyticnetwork processes. Information Sciences, 177(16), 3383–3396.
Chen, D.-Z., Chang, H.-W., Huang, M.-H., & Fu, F.-C. (2005). Coretechnologies and key industries in Taiwan from 1978 to 2002: Aperspective from patent analysis. Scientometrics, 64, 31–53.
Cheng, E. W. L., & Li, H. (2005). Analytic network process applied toproject selection. Journal of construction engineering and management,
131(4), 459–466.Chung, S., Lee, A., & Pearn, W. (2005). Analytic network process (ANP)
approach for product mix planning in semiconductor fabricator.International Journal of Production Economics, 96(1), 15–36.
Courtial, J. P., Callon, M., & Sigogneau, A. (1993). The use of patent titlesfor identifying the topics of invention and forecasting trends. Sciento-
metrics, 26(2), 231–242.Demirtas, E. A., & Ustun, O. (2007). Analytic network process and multi-
period goal programming integration in purchasing decisions. Com-
puters & Industrial Engineering, doi:10.1016/j.cie.2006.12.006.EIRMA (2000). Technology monitoring for business success. European
Industrial Research Management Association, Working Group 55Report.

908 H. Lee et al. / Expert Systems with Applications 36 (2009) 894–908
Ernst, H. (2003). Patent information for strategic technology manage-ment. World Patent Information, 25(3), 233–242.
Freeman, L. C. (1979). Centrality in social networks: Conceptualclarification. Social Networks, 1, 215–239.
Gangulli, P. (2004). Patents and patent information in 1979 and 2004: Aperspective from India. World Patent Information, 26, 61–62.
Gelsing, L. (1992). Innovation and the development of industrialnetworks. In B.-A. Lundvall (Ed.), National systems of innovation –
Towards a theory of innovation and interactive learning (pp. 116–128).London: Pinter.
Gencer, C., & Gurpinar, D. (2007). Analytic network process in supplierselection: A case study in an electronic firm. Applied Mathematical
Modelling, 31(11), 2475–2486.Grilliches, Z. (1990). Patent statistics as economic indicators: A survey.
Journal of Economic Literature, 28, 1661–1707.Grupp, H. (1996). Spillover effects and the science base of innovations
reconsidered: An empirical approach. Journal of Evolutionary Eco-
nomics, 6(2), 175–197.Grupp, H., Lacasa, D., & Schmoch, U. (2003). Tracing technological
change over long periods in Germany in chemicals using patentstatistics. Scientometrics, 57, 175–195.
Gungor, A. (2006). Evaluation of connection types in design fordisassembly (DFD) using analytic network process. Computers &
Industrial Engineering, 50(1/2), 35–54.Hall, B. H., Jaffe, A. B., & Trajtenberg, M. (2001). The NBER patent
citations data file: Lessons, insights and methodological tools.National Bureau of Economic Research, Working Paper No. 8498.
Ham, R. M., Linden, G., & Appleyard, M. M. (1998). The evolving role ofsemiconductor consortia in the United States and Japan. California
Management Review, 41, 137–163.Han, Y., & Park, Y. (2006). Patent network analysis of inter-industrial
knowledge flows: The case of Korea between traditional and emergingindustries. World Patent Information, 28(3), 235–247.
Harhoff, D., Scherer, F. M., & Vopel, K. (2003). Citations, family size,opposition and the value of patent rights. Research Policy, 32(8),1343–1363.
Hirschey, M., & Richardson, V. J. (2001). Valuation effects of patentquality: A comparison for Japanese and US firms. Pacific-Basin
Finance Journal, 9(1), 65–82.Jaffe, A., & Trajtenberg, M. (1998). International knowledge flows:
Evidence from patent citations. National Bureau of EconomicResearch, Working Paper No. 6509.
Jharkharia, S., & Shankar, R. (2007). Selection of logistics serviceprovider: An analytic network process (ANP) approach. Omega, 35(3),274–289.
Kahraman, C., Ertay, T., & Buyukozkan, G. (2006). A fuzzy optimizationmodel for QFD planning process using analytic network approach.European Journal of Operational Research, 171(2), 390–411.
Karsak, E. E., Sozer, S., & Alptekin, S. E. (2003). Product planning inquality function deployment using a combined analytic networkprocess and goal programming approach. Computers & Industrial
Engineering, 44(1), 171–190.Kim, Y. G., Suh, J. H., & Park, S. C. (2007). Visualization of patent
analysis for emerging technology. Expert Systems with Applications,doi:10.1016/j.eswa.2007.01.033.
Lai, K. K., & Wu, S. J. (2005). Using the patent co-citation approach toestablish a new patent classification system. Information Processing &
Management, 41(2), 313–330.Lanjouw, J. O., & Schankerman, M. (1999). The quality of ideas:
Measuring innovation with multiple indicators. National Bureau ofEconomic Research, Working Paper No. 7345.
Lee, J. W., & Kim, S. H. (2000). Using analytic network process and goalprogramming for interdependent information system project selection.Computers & Operations Research, 27(4), 367–382.
Lin, Y. H., Chiu, C. C., & Tsai, C. H. (2007). The study of applying ANPmodel to assess dispatching rules for wafer fabrication. Expert Systems
with Applications, doi:10.1016/j.eswa.2007.02.033.Marseden, P., & Laumann, E. (1984). Mathematical ideas in social
structural analysis. Journal of Mathematical Sociology, 10, 271–294.Meade, L., & Presley, A. (2002). R&D project selection using ANP. IEEE
Transactions on Engineering Management, 49(1), 22–28.Meade, L., & Sarkis, J. (1998). Strategic analysis of logistics and supply
chain management systems using the analytical network process.Transportation Research Part E: Logistics and Transportation Review,
34(3), 201–215.Meade, L., & Sarkis, J. (1999). Analyzing organizational project alterna-
tives for agile manufacturing processes: An analytic network approach.International Journal of Production Research, 37(2), 241–261.
Mowery, D. C., Oxley, J. E., & Silverman, B. S. (1998). Technologicaloverlap and interfirm cooperation: Implications for the resource-basedview of the firm. Research Policy, 27, 507–523.
Mulebeke, J. A. W., & Zheng, L. (2006). Analytical network process forsoftware selection in product development: A case study. Journal of
Engineering and Technology Management, 23(4), 337–352.Narin, F. (1994). Patent bibliometrics. Scientometrics, 30, 147–155.Narin, F., Noma, E., & Perry, R. (1987). Patents as indicators of
corporate technological strength. Research Policy, 16, 143–155.Niemira, M. P., & Saaty, T. L. (2004). An Analytic Network Process
model for financial-crisis forecasting. International Journal of Fore-
casting, 20(4), 573–587.OECD (2005). Measuring globalization: OECD handbook on economic
globalization indicators. OECD, Paris.Reitzig, M. (2004). Improving patent valuations for management pur-
poses—validating new indicators by analyzing application rationales.Research Policy, 33(6/7), 939–957.
Ruhnau, B. (2000). Eigenvector-centrality — a node-centrality? Social
Networks, 22(4), 357–365.Saaty, T. (1980). The analytic hierarchy process. New York: McGraw-Hill.Saaty, T. (1996). Decision making with dependence and feedback: The
analytic network process. Pittsburgh: RWS Publications.Schapper, M. (2003). A proposal for a core list of indicators for ICT
measurement. Electronic document at http://www.oecd.org, OECD.Shin, J., & Park, Y. (2007). Building the national ICT frontier: The case of
Korea. Information Economics and Policy, 19(2), 249–277.Trajtenberg, M. (1990). A penny for your quotes: Patent citations and the
value of inventions. Rand Journal of Economics, 21, 172–187.Trajtenberg, M., Henderson, R., & Jaffe, A. B. (1997). University versus
corporate patents: A window on the basicness of invention. Economics
of Innovation and new technology, 5(1), 19–50.USPTO (2006). Overview of the US patent classification system (USPC).
Electronic document at http://www.uspto.gov, USPTO.Wartburg, I., Teichert, T., & Rost, K. (2005). Inventive progress measured
by multi-stage patent citation analysis. Research Policy, 34, 1591–1607.Wasserman, S., & Faust, K. (1994). Social network analysis. Cambridge
University Press.Wei, W. L., & Chang, W. C. (2007). Analytic network process-based
model for selecting an optimal product design solution with zero-onegoal programming. Journal of Engineering Design, doi:10.1080/09544820601186054.
Wu, W. W., & Lee, Y. T. (2007). Selecting knowledge managementstrategies by using the analytic network process. Expert Systems with
Applications, 32(3), 841–847.Yoon, B., & Park, Y. (2004). A text-mining based patent network:
Analytical tool for high-technology trend. Journal of High Technology,
15(1), 37–50.Yuksel, _I., & Dag66deviren, M. (2007). Using the analytic network process
(ANP) in a SWOT analysis – A case study for a textile firm.Information Sciences, 177(16), 3364–3382.