an analysis of water contaminants from thirty-one … water across america: an analysis of water...
TRANSCRIPT

Tap Water Across America:An Analysis of Water Contaminants from Thirty-one
States
Patrick ReisVincent PoturicaKelley Johnson
Darius De La Cruz
Environmental Geology 120 Professor Bereket Haileab

61
Introduction
The purpose of our study is to analyze the uniformity and quality of the American
drinking water systems, using a large number and wide variety of tap water samples.
More specifically, we wanted to test the levels of seven contaminants, (fluoride, nitrate,
chloride, phosphate, bromide, sodium and sulfate) and compare their concentration,
where applicable, to the acceptable levels mandated by the Safe Drinking Water Act
(SDWA). The SDWA, ratified in 1974, requires the EPA to set the acceptable levels of
chemical contaminants in drinking water systems (see figure 1). In an effort to gain an
accurate picture of water samples, we sent sample kits to volunteers across the country
and asked them to send us a small sample of their drinking water. With this method we
gathered sixty-two samples of drinking water from across the country. We then analyzed
our water systems for the above listed elements, gathering data for our study.
Our study relates to similar studies that have analyzed the contaminant levels of
drinking water systems. Scientists in Australia analyzed the nitrate levels of well water
in heavily agricultural regions and found that 11% of well water systems had elevated
nitrate levels and 3% had levels above those permissible by government standards
(Thorburn, 2003). Other studies have pointed to residual contaminant levels that remain
in water not from source pollution, but rather from the continued presence of chemicals
used to treat and clean contaminated water (Burke, 1982). Most similar to our study, a
group of environmental scientists in Bahrain tested drinking water for nitrate, nitrite,
calcium, chloride, sulfate, sodium, potassium, magnesium, ammonia, and phosphate, and
then compared the levels of concentration with those set by government standards

62
(Raveendran and Madany, 1991). Their findings unearthed many non-compliant water
systems and particularly egregious violations in chloride and sodium levels.
What differentiates our study from those conducted previously is the diversity of
our samples. We have conducted a nation-wide study of drinking water quality, drawing
samples from every EPA region of the country and nearly every state. This diverse
sample size allows us to draw preliminary conclusions about both the contaminant levels
of the country’s drinking water supply and the relative uniformity of contaminant levels
from one region to another.
After collecting our study and analyzing their contaminant levels, there were a
few observable trends. Overall the drinking water is safe under EPA standards, though
there seem to be a greater variation of contaminant levels further west. Eastern samples
appear to reflect more uniform treatment. Additionally we believe well water samples
will reflect a broader range of contaminants since they are untreated sources of water.

63
Figure 1 Map of the United States of America with all ten EPA tap water regionsnumbered and outlined in blue, and every location that our group received tap water fromrepresented by red dots.

64
Figure 2. Maximum Contaminant Levels as given by the EPA
Methods of Data Collection and Analysis
Because we attend college in Northfield, Minnesota and our project needed a
sampling of tap water from all over the United States to address its claim, the first step to
our data collection involved postage. We cooperated with another group that needed a
scattered sampling of U.S. rainwater, assembling boxes that both groups used to collect

65
their respective water samples. These boxes contained a cover letter that included a
description of the project along with a section that the package recipient was asked to fill
out (see appendix I). This part of the cover letter requested the person who received the
box to record certain facts regarding the location and type of tap water and rainwater they
were sending back to Carleton College. Along with the letter, two 120 mL glass bottles
were included in the packages in order to store and transport the tap water and rainwater
to and from Carleton. The bottles assigned for tap water had yellow labels on which the
box recipients were also asked to record their name and the location of the tap water. The
rain water bottles had red labels with the same purpose. These labels made it so we could
distinguish between the two types of water that our separate groups were studying.
Once we began to receive the tap water samples back in the mail, we recorded the
location of the individual sample along with the E.P.A. region from which it came. We
continued to send out boxes in an attempt to cover as much U.S. terrain as possible and
make our sample size as large and varied as it could be. We were lucky enough to get
almos all of our boxes back, but a few did not return to Carleton, and more than a few did
not come back with their cover letter. With the help of Professor Bereket Haileab and the
funding of Carleton College, we received a total of sixty-two tap water samples from
thirty-one different states, covering all ten of the EPA’s tap water regulated regions.
After the samples were mailed back, we tested the tap water for chloride,
bromide, fluoride, nitrite, nitrate, sulphate, and phosphate anions using the Ion
Chromatograph Dionex 600. Before testing the tap water samples for these anions the
samples had to be “filtered through a 0.25 µm filter” which “was pre-rinsed with at least
30 ml of deionized water” to “remove soluble salts” (Haileab Personal Communication).

66
This machine separates anions “based on their relative affinity for a low capacity,
strongly basic anion exchanger,” by “injecting” a given water sample into a “stream of
carbonate-bicarbonate eluant” and “pass[ing] [it] through a series of ion exchangers”
(Haileab Personal Communication). Anions with “a low affinity for the exchange
column pass quickly through the column, while those with a high affinity move much
more slowly” (Haileab Personal Communication). Then, to find the concentration of
each of these anions, the “separated anions” go “through a strongly acidic cation
exchanger” which “in the form of a micro membrane suppressor” converts the separated
anions into to “their highly conductive acid forms,” which in this form can be “measured
by a specific conductance detector” (Haileab Personal Communication). So, ultimately,
the “species” of anions we were searching for was “determined by [their] retention time”
in the exchange column, while the concentration of the anion was found by measuring the
“peak area” of the anion in it’s acidic form “compared to known standards” (Haileab
Personal Communication). This aspect of our water analysis was preformed byProfessor
Haileab.
We also measured the sodium content of our tap water samples using an Atomic
Absorption Spectrometer. To prepare the samples, we first had to dilute a standard of a
known concentration (1000 parts per million [ppm] sodium) to levels comparable to our
sample range (which we guessed would be 0 to 200 ppm sodium). This spectrometer
determined the Na content of a given tap water sample by “aspirate[ing]” a flame through
the sample and “into a monochrometer and onto a detector” that measures “the amount of
light absorbed by the atomized element in the flame” (Haileab Personal Communication).
Using a “source lamp composed of” Sodium, we were able to figure out the sodium

67
concentration in each sample size because “the energy absorbed in the flame is
proportional” to Na concentration (Haileab Personal Communication).
Results
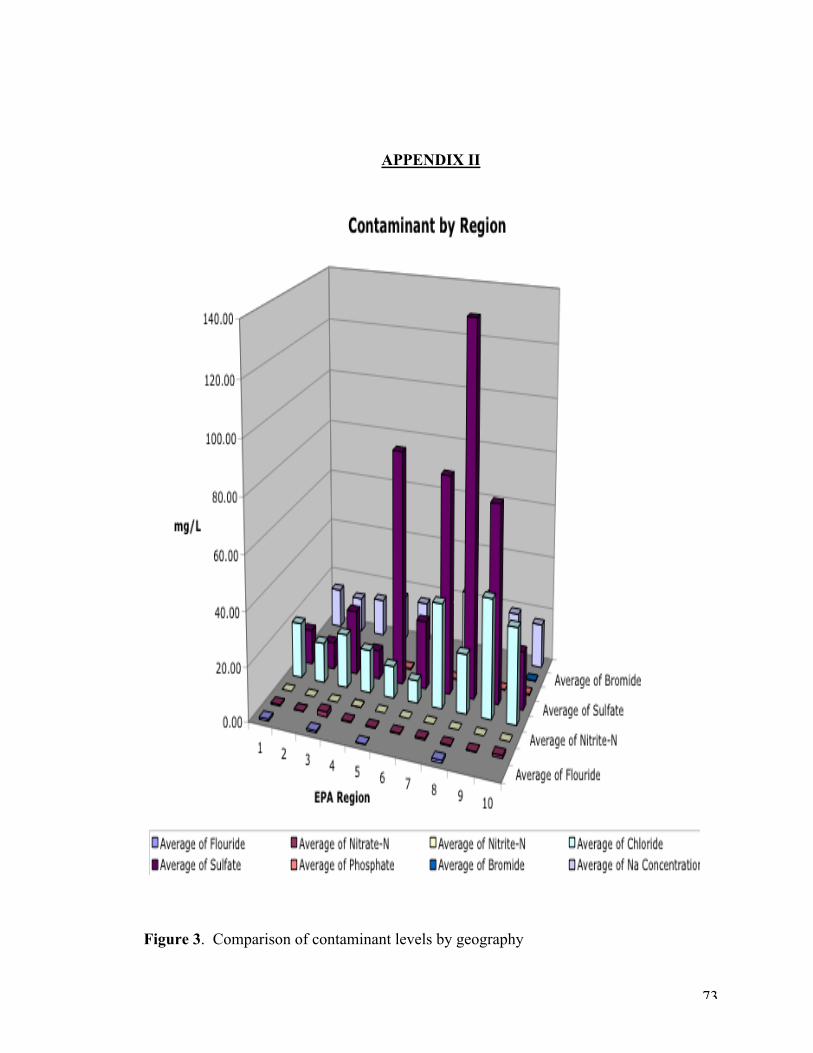
Our water samples came from all ten of the EPA’s designated water regions.
Levels of nitrite, fluoride, nitrate, phosphate, and bromide were fairly low and consistent
throughout all ten regions. The levels of chloride, sulfate, and concentration of sodium,
were all higher and more likely to vary. Especially in the case of sulfate, we found that
regions 7, 8, and 9 show a definite trend in that they have higher amounts of these anions
in their tap water (see Appendix II) than the other seven regions.
Our results show that much higher amounts of chloride are found in city water
systems as opposed to well water systems. There is about a 60-mg/L difference between
the maximum amounts of chloride we found in city water than we found in well water
(see Appendix III).
Our Fluoride results show that city water systems have a higher maximum level
of fluoride. However, our we found more more traces in of flouride in our well water
samples than we did in our city water samples (see Appendix IV). Based on our results,
region 8 has the highest fluoride levels. Most importantly though, all these levels still
remain well under the EPA’s Fluoride standards (see Appendix V).
Nitrite was not very common throughout our samples. The highest levels of
nitrite were found in city water. There was about a 0.15 mg/L difference between the
highest amounts of nitrite we found in city water than in there was in the samples from
the well water systems (see Appendix VI).

68
We found sulfate to be more prevalent in well water systems than in city water
systems (see Appendix VII). The well water also had larger variations. When we
examine our graph which shows the regions from which the sulfate comes, we find larger
amounts of sulfate in the western and northern part of the country. Regions 7, 8, and 9
are characterized by a steady, rising curve that eventually drops off in the amount of its
sulfate levels. Region 5 has the largest amount of sulfate in the well water. In all of our
samples, we found only three that exceeded the EPA’s secondary regulation of sulfates
(see Appendix VIII).
The minimal levels of phosphate that we found were nearly the same throughout
all types of water systems (see Appendix IX). We found the maximum amounts of this
contaminant to be most prevalent in the city water systems we tested.
In our results, we can see that the sodium content in our water samples proves to
be highest in the well water samples, rather than city water samples. Along with sulfate,
and nitrate, sodium was only one of four contaminants that we found in greater quantities
in well water systems (see Appendix X). Sodium levels are highest in regions 1 and 5.
The same trend that we see in sulfate can be seen in our sodium samples. From region 7
to region 10 the amount of sodium steadily increases (and eventually decreases towards
region 10), but the amounts found in region 10 were still higher than in most other
regions (see Appendix XI).
Like sodium and sulfate, we also found the nitrate levels to be higher in well
water systems. In well water systems, the maximum amount of nitrate we found was 2
mg/L larger than that found in city systems (see Appendix XII).
69
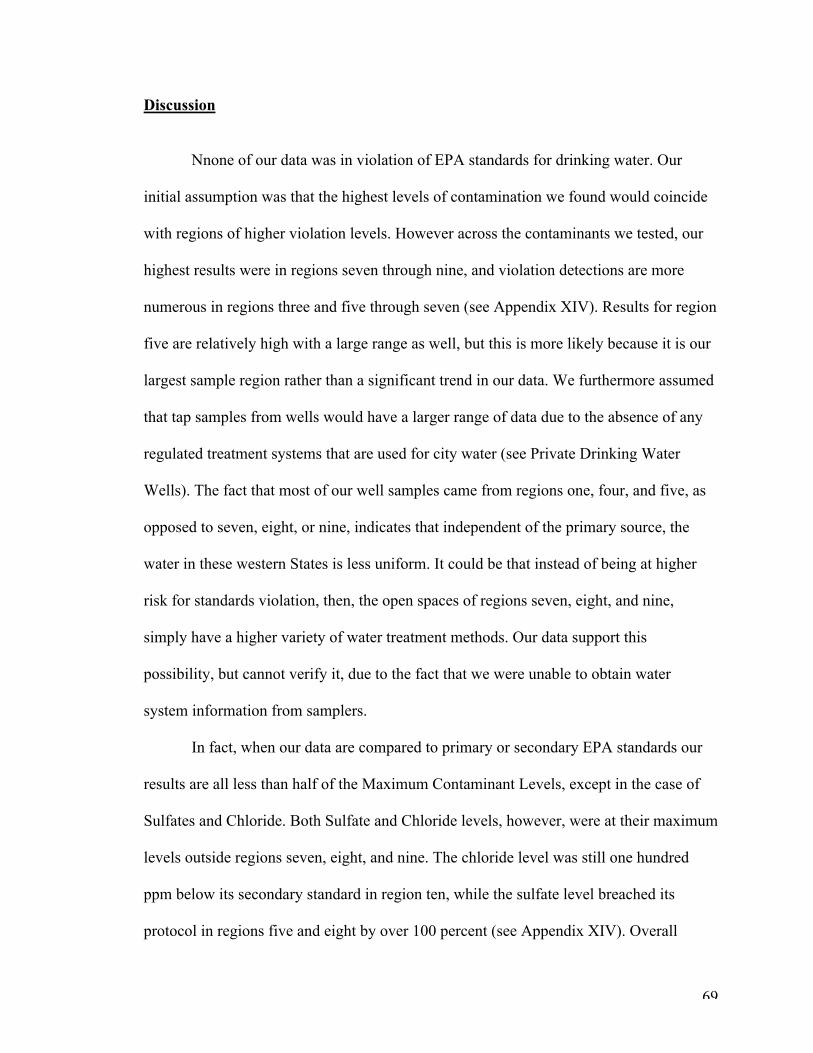
Discussion
Nnone of our data was in violation of EPA standards for drinking water. Our
initial assumption was that the highest levels of contamination we found would coincide
with regions of higher violation levels. However across the contaminants we tested, our
highest results were in regions seven through nine, and violation detections are more
numerous in regions three and five through seven (see Appendix XIV). Results for region
five are relatively high with a large range as well, but this is more likely because it is our
largest sample region rather than a significant trend in our data. We furthermore assumed
that tap samples from wells would have a larger range of data due to the absence of any
regulated treatment systems that are used for city water (see Private Drinking Water
Wells). The fact that most of our well samples came from regions one, four, and five, as
opposed to seven, eight, or nine, indicates that independent of the primary source, the
water in these western States is less uniform. It could be that instead of being at higher
risk for standards violation, then, the open spaces of regions seven, eight, and nine,
simply have a higher variety of water treatment methods. Our data support this
possibility, but cannot verify it, due to the fact that we were unable to obtain water
system information from samplers.
In fact, when our data are compared to primary or secondary EPA standards our
results are all less than half of the Maximum Contaminant Levels, except in the case of
Sulfates and Chloride. Both Sulfate and Chloride levels, however, were at their maximum
levels outside regions seven, eight, and nine. The chloride level was still one hundred
ppm below its secondary standard in region ten, while the sulfate level breached its
protocol in regions five and eight by over 100 percent (see Appendix XIV). Overall
70
where results approach the MCLs or exceed them (as they rarely do), it is more often
outside of regions seven, eight, and nine.
Sulfate was the only contaminant to exceed its EPA standard (250 mg/L). Even
though this anion is only a secondary EPA standard, some scientists speculate that sulfate
may cause minor indigestion problems (see Sulfate in Drinking Water). Most importantly
the sample reflecting the most egregious violation of over 1000 ppm was from a private
well, while the other two violations occurred in city water samples. In these two cases it
appears that treatment in regions eight and nine was not ideal, but neither was it
accompanied by high levels of other contaminants. It is possible that the sulfate level is
simply not addressed as seriously as a secondary contaminant rather than an accident in
treatment, which would also support the theory that water treatment is less uniform in
regions seven, eight, and nine.
Conclusion
We realize that in order to do a complete survey and study of the United States’
tap water, we need a much, much larger and broader range of tap water sampling to come
up with substantial claims regarding characteristic composition and treatment. However,
we feel that the data we have collected and studied reveals that tap water in the United
States complies with E.P.A. standards and that water in the west is probably treated by a
wider variety of methods than in the more densely populated areas along the coasts.
Some possible sources of error include the fact that most of the people collecting
the water from us are not scientists, so that some of our tap water samples can be
contaminated in ways that we cannot anticipate. Also, we were unable to mix standards

71
as accurately as we wanted in calibrating the Atomic Absorption Spectrometer. Our
samples also sat in a refrigerator for several weeks before they were tested and since we
did not test for any other contaminants, specifically microbiotic content, we were unable
to anticipate how are anions would have been affected (e.g. absorbed or produced by
microorganisms over time).
Acknowledgements
Our group would like to acknowledge all the friends, family members, and
geological colleagues acriss the country who were kind enough to send us their tap water.
We would also like to thank our lab assistants Rebecca and Jake, for their positive
encourgement, help, and time. And last but not least, we owe a tremendous amount of
gratitude to Bereket Haileab for his analysis of our water samples, his help and support
throughout our project, and his constant motivation
Bibliography
Burke, T. “Chemicals in Water Treatment—Effects on Water Quality.” Aqua. No. 11982
EPA Water Quality Standards, http://www.epa.gov/safewater/dwinfo/mn.htm
Private Drinking Water Wells. EPA Safewater,http://www.epa.gov/safewater/privatewells/index2.html
Sulfate in Drinking Water. EPA Ground Water and Drinking Water,http://www.epa.gov/safewater/sulfate.html
Haileab, Bereket. “IC and AAS Methods.” Personal Communication.
Raveendran, E. and Madany, Ismail M. “The Quality of Groundwater in Bahrain.” TheScience of The Total Environment. Vol. 103. April 15, 1991.

72
Richard, Y. “Nitrates and Drinking Water.” Watershed 89: The Future for WaterQuality in Europe. Vol. I. 1989
Thorburn, Peter J. “Nitrate in Groundwaters of Intensive Agricultural Areas in CoastalNortheastern Australia.” Agriculture Ecosystems & Environment. Vol. 94, No. 1.Jan 2003.
Patricia Toccalino, L. N., William Wilber, John Zogorski, Joyce Donohue, CatherineEiden, Sandra Krietzman, and Gloria Post (2003). "Development of Health-BasedScreening Levels for Use in State- or Local-Scale Water-Quality Assessments."National Water-Quality Assessment Program(03-4054).
APPENDIX I
Dear Friends:
Two groups from my environmental geology class are doing their term project onrainwater and drinking water from across the country. We will analyze the collectedwater for anions, cations and then possible for stable isotope compositions. The groupswill write 10 to 15 pages report at the end of the term and I will send you copies whenthey are done.
Please tell us anything that you know about your drinking water and rainwater.
Thank you very much,
Bereket Haileab
Rain Water1. Your name____________2. Location _____________3. Date and time collected _______4. Amount of precipitation (if possible)Drinking ware
1. Private wella. Filteredb. Unfiltered
2. City water3. Additional comments
73
APPENDIX II
Figure 3. Comparison of contaminant levels by geography

74
APPENDIX III
City
Well
Figure 4. Amount of Chloride contaminant based on type of water system

75
APPENDIX IV
CityWell
Figure 5. Amount of Fluoride contaminant based on type of water system

76
APPENDIX V
Well
City
Figure 6. Fluoride amounts based on EPA water region

77
APPENDIX VI
CityWell
Figure 7. Amount of Nitrite based on type of water system

78
APPENDIX VII
CityWell
Figure 8. Amount of sulfate based on type of water system

79
APPENDIX VIII
WellCity
Figure 9. Sulfate contaminants by EPA water region

80
APPENDIX IX
Figure 10. Amount of Phosphate based on type of water system

81
APPENDIX X
Figure 11. Sodium content based on type of water system

82
APPENDIX XI
Figure 12. Sodium content based on EPA water region

83
APPENDIX XII
Figure 13. Nitrate levels based on type of water system
City

84
APPENDIX XIII
Figure 14. In the past eight years the EPA has recorded these violation detections for thecontaminants we tested.

85
APPENDIX XIV 1
1 High-end outliers are in orange, bold, boxes. Question marks indicate a lack of data, and there was onesample that was tested for anions, but not sodium due to an incomplete gathering of samples beforedifferent testing stages.

86