an analysis of the land use sustainability index (lusi) at territorial scale based on corine land...
TRANSCRIPT
An analysis of the Land UseSustainability Index (LUSI) at
territorial scale based on CorineLand Cover
Ciro Gardi, Claudio Bosco, Ezio Rusco and Luca MontanerellaLand Management & Natural Hazards Unit,
Institute for Environment & Sustainability (IES), European Commission,Ispra, Italy
Abstract
Purpose – The aim of this paper is to propose a methodology based on the use of a simple andaccessible database, such as Corine Land Cover (CLC), for providing an in depth evaluation ofenvironmental sustainability. This evaluation has been carried out through the analysis of factorssuch as landscape and habitat composition, the level of biodiversity, the degree of anthropisation andsoil sealing and the arable land availability.
Design/methodology/approach – Starting from the analysis of some of the existing approachesfor the evaluation of environmental sustainability, this paper presents a GIS approach, based on theuse of the Corine Land Cover (CLC), and other sources of geographical data, aimed at producingseveral thematic Environmental Sustainability Indicators, and one synthetic index.
Findings – The proposed methodology was found to enable a satisfactory assessment of theenvironmental state, at territorial scale, starting from an easy accessible land use data set. The adoptedapproach is tailored by the CLC, but can easily be adapted to other land cover/land use classificationsystems. The applications presented in this paper have been applied to a relatively small area, andother tests should be performed across Europe for a better evaluation of the methodology. However,the results obtained from the Emilia-Romagna case study, showed a realistic and coherent picture ofthe environmental status in the area. Similarly to other successful sustainability indexes and/orindicators, the main advantage of the LUSI is the possibility of synthesizing, as a single value, theenvironmental sustainability of a given territory.
Originality/value – The application of the proposed methodology relies essentially on land use dataand can be easily executed in batch mode, using simple models or script in a GIS environment.Contrary to other environmental sustainability indicators, where the land use data are only a sub-set ofthe data required, LUSI core data set is represented by the Corine Land Cover, or other equivalentgeographical database.
Keywords Europe, Analysis, Tests and testing
Paper type Research paper
IntroductionThere is ample evidence to suggest that the sheer scale of human activities on Earth isunprecedented. While it took human world population 100 years from 1850 to 1950 todouble from 1.2 to 2.4 billion, the world population increased by a factor of 2.4 to about
The current issue and full text archive of this journal is available at
www.emeraldinsight.com/1477-7835.htm
The authors would like to express their gratitude for the helpful comments to the reviewers, andto Simon Jeffery for language improvements.
MEQ21,5
680
Received 15 June 2009Revised 17 February 2010Accepted 24 March 2010
Management of EnvironmentalQuality: An International JournalVol. 21 No. 5, 2010pp. 680-694q Emerald Group Publishing Limited1477-7835DOI 10.1108/14777831011067953
6 billion in just 50 years from 1950 (Cohen, 1995). Almost the 83 per cent of the Earth’ssurface is directly under human influence (Sanderson et al., 2002), with the energyneeds of the humanity consuming almost the 30 per cent of the primary production ofterrestrial ecosystems which can be expected to increase further in the future (Haberl,2000).
The Brundtland Commission (1987) and the Earth Summit in Rio de Janeiro (1992)contributed to the definition and the affirmation of sustainable development principles.From a scientific point of view, the concept of sustainability is still under debate; thereis a plurality of purposes in characterizing and measuring sustainable development.The conceptual framework, in which the sustainable development concept was created,was based on the interaction between ecological and social factors, with littleconsideration of either temporal or spatial scales. Nowadays, however, the extent ofglobal scale process, from climate change to the globalization of the economy, requiresthe adoption of multiscalar approaches, enabling the assessment of sustainability atdifferent geographic resolutions.
Within Chapter 40 of Agenda 21, it is stated that “indicators of sustainabledevelopment need to be developed to provide solid bases for decision-making at alllevels and to contribute to a self-regulating sustainability of integrated environmentand development systems”. The role and the importance of simple and robustindicators is generally recognized although no indicators are as yet universallyaccepted. Numerous indicators and indicator sets for sustainable agriculture andsustainable land management have been proposed in recent years (Hansen, 1996;Christen, 1999; Walter, 2005). Several of the proposed indicators and indicator sets, canbe classified as Pressure/Driving Forces indicators in the OECD indicator classificationscheme (OECD, 1998, 2000), and generally their applications require the availability ofcomplex database. The catalysing activity of the OECD and the JRC for the productionof simple and robust composite indicators is demonstrated by the recent publication ofthe Handbook on Constructing Composite Indicators: Methodology and User Guide(OECD-JRC, 2008).
Modern tools, such as Geographic Information Systems (GIS) and remote sensing,play an essential role in the development of environmetal sustainability indicators andare increasing our capacity to spot regions that are under “threat”; numerous indicatorsfor environmental sustainability assessment, based on these technologies, have beenproposed (Langaas, 1997; Graymore et al., 2007; Trinder and Milne, 2002; Rao, 1998).Regarding environmental indicators, which relate the pressure on the environment(flow of energy and materials) with land use, two well-known and consolidatedapproaches exist:
(1) Ecological Footprint (Wackernagel and Rees, 1995).
(2) Sustainable Process Index (Krotschek and Narodoslawksy, 1996).
The disadvantage when applying both of these approaches, however, is the need oflarge and complex data sets.
There are several examples of indicators which have been developed on the base ofCorine data set: some are aimed at the evaluation of landscape diversity (Gallego andEscribano, 2000; Frost et al., 2007), others are aimed at evaluating the richness ofbiodiversity (Gimona et al., 2009), and the final group are devoted to estimations of the
Analysis of theLUSI at
territorial scale
681
environmental impact of land use or land use change (Petit et al., 2008) such as withinthe life cycle analaysis (LCA) procedure (Anton et al., 2007).
In this article, a set of environmental sustainability indicators and a synthetic index,based on GIS techniques and a well-known database like the Corine Land Cover (CLC),is proposed. The aim of this methodology is to provide simple, but scientifically sound,tools useful for researchers and decision makers. The main advantages of thismethodology, even though they are not very innovative, are to be based on an accurate,updated and easy accessible land cover database and to have the possibility to beundertaken using several types of GIS software.
Materials and methodsThe proposed methodology, in the current version, led to the calculation of a Land UseSustainability Index (LUSI), starting from the data of Corine Land Cover and a fewauxiliary data. The LUSI is merely the expression of the pressures, estimated on thebasis of land use, on a given territory. The close link between land use andsocio-economic metabolism, in terms of flow of material and energy, legitimises the useof this relationship. In its current version, this index does not contain any measure ofthe efficiency of land uses.
LUSI can be calculated at different level of spatial resolution, for example byadopting the different levels of NUTS administrative classes.
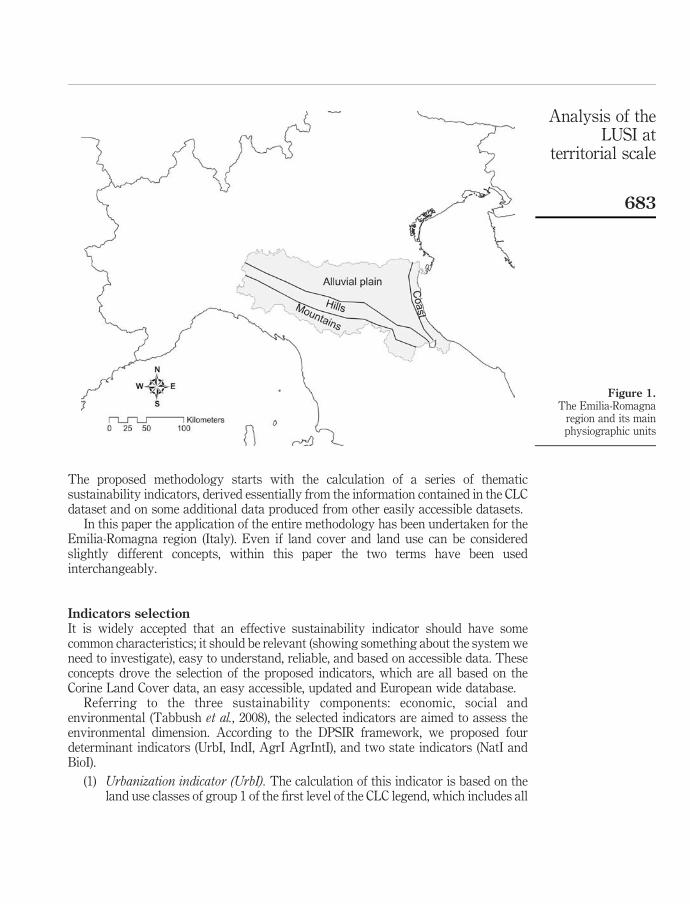
Study areaThe proposed methodology has been applied in Emilia-Romagna, one of the largestand most populated regions of Italy. This region is located in the Northeastern part ofthe country. Four main physiographic units are present in the region: mountains, hills,alluvial plains and the coastal belt (see Figure 1). In this territory, which has beeninhabited since prehistoric times, human settlements have been concentrated along the“Via Emilia”, and only along the coastline in more recent times. The “Via Emilia”,which runs in direction WNW-ESE, divides the high plain from the middle and lowalluvial plains. The administrative level, according to the NUTS classification,corresponds to the second level (NUTS2), while the analysis, and the calculation of theindicators and final index have been carried out at level of municipalities (NUTS 4).
Data sourcesCorine Land Cover is a European information database at the service of sustainabledevelopment policies in the European Union (Cornaert, 2004), and provides ahigh-resolution map of land use over Europe at a resolution of 1 ha (ETC, 2005). Theminimum mapping unit is 25 ha and the map scale is 1:100,000. Land cover categoriesare organized in a hierarchical order, where, at the first level, we have only five maingroups of land cover and in the second and third level, 15 and 44 categoriesrespectively. For its particular structure this land cover classification system issuitable to be used at a different level of thematic resolution and could be used withinthe aim of the proposed methodology. This should provide an easy and inexpensivetool in the hands of a wide variety of stakeholders, from policy and decision makers, toresearchers of several disciplines.
MEQ21,5
682
The proposed methodology starts with the calculation of a series of thematicsustainability indicators, derived essentially from the information contained in the CLCdataset and on some additional data produced from other easily accessible datasets.
In this paper the application of the entire methodology has been undertaken for theEmilia-Romagna region (Italy). Even if land cover and land use can be consideredslightly different concepts, within this paper the two terms have been usedinterchangeably.
Indicators selectionIt is widely accepted that an effective sustainability indicator should have somecommon characteristics; it should be relevant (showing something about the system weneed to investigate), easy to understand, reliable, and based on accessible data. Theseconcepts drove the selection of the proposed indicators, which are all based on theCorine Land Cover data, an easy accessible, updated and European wide database.
Referring to the three sustainability components: economic, social andenvironmental (Tabbush et al., 2008), the selected indicators are aimed to assess theenvironmental dimension. According to the DPSIR framework, we proposed fourdeterminant indicators (UrbI, IndI, AgrI AgrIntI), and two state indicators (NatI andBioI).
(1) Urbanization indicator (UrbI). The calculation of this indicator is based on theland use classes of group 1 of the first level of the CLC legend, which includes all
Figure 1.The Emilia-Romagna
region and its mainphysiographic units
Analysis of theLUSI at
territorial scale
683
of the artificial land uses. This indicator is calculated as a ratio between the totalarea of class 1 and the total area of a given administrative unit.
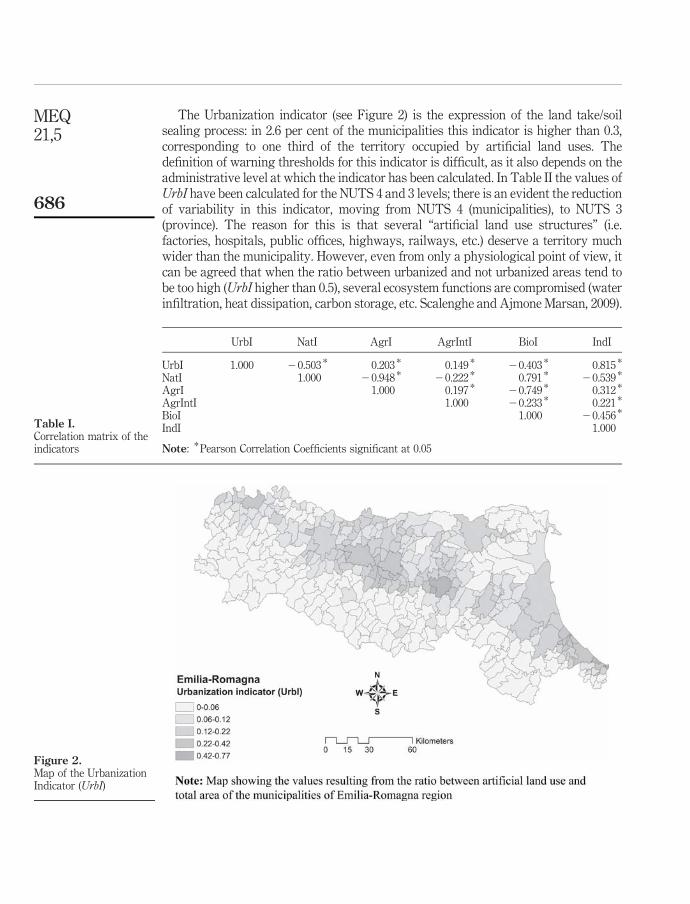
(2) Industrialization indicator (IndI). The calculation of industrialization indicatoris based on one land use class within the group 100 (artificial surfaces). Theindicator was calculated as the ratio between the area of industrial andcommercial units (1.2.1) and the total area of a given administrative unit.
(3) Agricultural indicator (AgrI). The calculation of the agricultural indicator isbased on the land use classes of group 2 of the first level of the CLC legend,which includes all of the agricultural land uses, including agro-forestry andpasture areas. This indicator is calculated as a ratio between the total area ofclass 2 and the total area of a given administrative unit.
(4) Agricultural intensity indicator (AgrIntI). For the calculation of this indicator,the area of high intensity agricultural land uses is taken into account as well asthe animal husbandry load. The selected intensive land use classes, from thethird level, were: rice fields (2.1.3), vineyards (2.2.1), fruit trees and berryplantations (2.2.2) ad olive groves (2.2.3). For animal husbandry the total load,expressed as Adult Cattle Unit (ACU), should be converted into intensiveagricultural land use area according to the following equation:
Ha ¼ACU
10
where ha is the hectares of agricultural land use derived from the animal husbandryload.
This indicator is calculated as the ratio between intensive agricultural land uses(agriculture þ animal husbandry) and the total agricultural land use area.
(1) Naturality indicator (NatI). The calculation of the naturality indicator is basedon the land use classes of groups 3, 4 and 5 of the first level of the CLC legend,which includes respectively forested and semi-natural land uses, wetlands andwater bodies. This indicator is calculated as a ratio between the total area ofclasses 3, 4 and 5 and the total area of a given administrative unit.
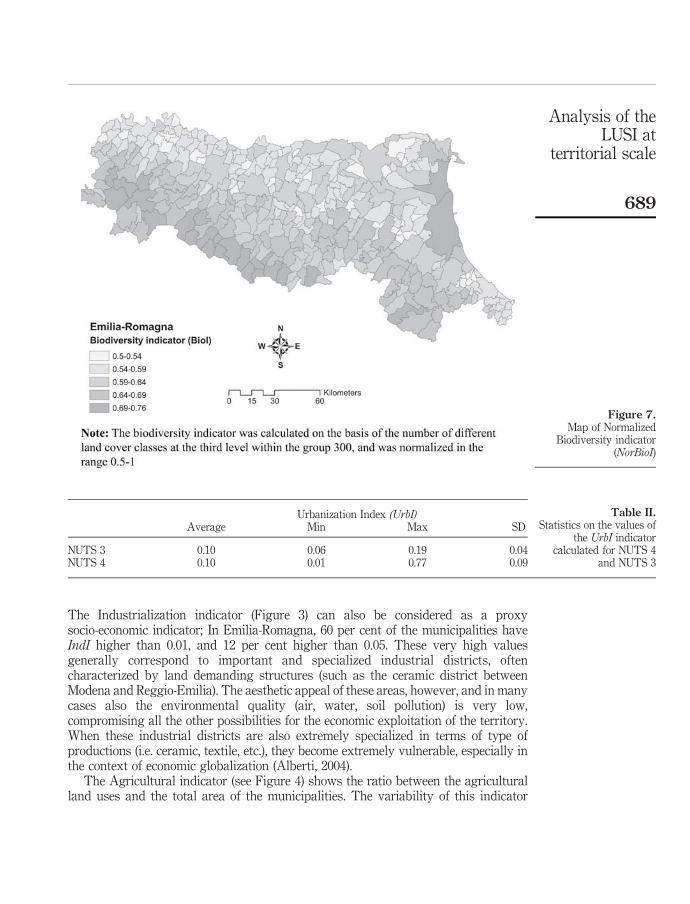
(2) Biodiversity indicator (BioI). The biodiversity indicator has been calculated, noton the base of areas, but only on the basis of different land use classes, at thethird level, within group 300 (forests and semi-natural lands), 400 (wetlands),and 500 (water bodies). Ecosystem diversity is one type of biodiversity andconsequently different type of land uses, in classes 300, 400 and 500, areconsidered as an expression of ecosystem diversity. Furthermore, this approachis based on the hypothesis that each one of these land use classes, can hold adistinct contingent of species; this necessary simplification, has been adoptedwith the aim of proposing a simple and practical indicator. In other words, if in agiven territory (A) only broad-leaved forests (3.1.1) are present, while in an otherterritory (B) also coniferous forests (3.1.2), mixed forests (3.1.3), naturalgrasslands (3.2.1), and peat bogs (4.1.2), it can be expected that also the speciesbiodiversity of territory B would be higher than biodiversity of territory A.
The biodiversity indicator was normalized (NorBoiI) in the range 0.5 (min value) to 1.0(maximum value) and was used for the calculation of the final index.
MEQ21,5
684
Indicators aggregation and final index (LUSI)When it is planned to process multiple indicators within an aggregation framework itis necessary that all values are reduced to the same scale, normalized with commonunits (Nardo et al., 2005). All proposed indicators, except BioI, vary within the samerange, while the BioI have been normalized as described previously.
The Land Use Sustainability Index was calculated according to the followingequation:
LUSI ¼IndI*20ð Þ þ UrbI*10ð Þ þ AgrI*2 þ AgrIntIð Þ þ 1 2 NatIð Þ
NorBioI
� �
The concept behind this is the attempt to assign a relative weight to each of thepreviously described Land Use Indicators, on the basis of the potential impacts on theenvironment associated to these land use types. Forests, natural and semi-natural landuses (NatI) were used in the equation as values complementary to one, in order toassign value 0 to an hypothetical land use that would be present in absence of humanintervention. The other indicators (and related land uses) were weighted according tothe pressure on the environment; the weight increases progressively from agriculture(2), to urbanized area (10), to industrial area (30). The final weighting assigned to theindustrial area (IndI) was in fact 20, but these areas are also accounted for in theurbanization indicator (UrbI – weight 10). The intensive agriculture indicator (AgrIntI)was applied as an additive correction factor.
The weighting process in the formulation of a synthetic index always represents anintrinsic theoretical weakness; it is difficult to find a rational justification of theadopted weightings (Perret, 2002). In this approach, however, the taking into account ofthe relative impact of different land uses on the environment was attempted. Theweighting process were realized on the base of experts judgement; a panel of scientistsbelonging to different domains were consulted for the attribution of weights to theselected indicators, in order to express a degree of pressure on the environment, andconsidering a value of 1 as the absence of human induced pressures. The weightingsadopted represent the modal value among the scores expressed by the experts. For thecalculation of the final index, the sum of the indicators, multiplied by their relativeweight, was divided by the Normalized Biodiversity indicator (NorBioI). In this casethe NorBioI was applied as a further correction factor, in order to take into account thelevel of biodiversity of the territory.
Results and discussionsThe objective of the proposed methodology was to evaluate the environmentalsustainability of territories, based on land use analysis, while ignoring, at this stage,any possible assessment of the efficiency in the use of resources.
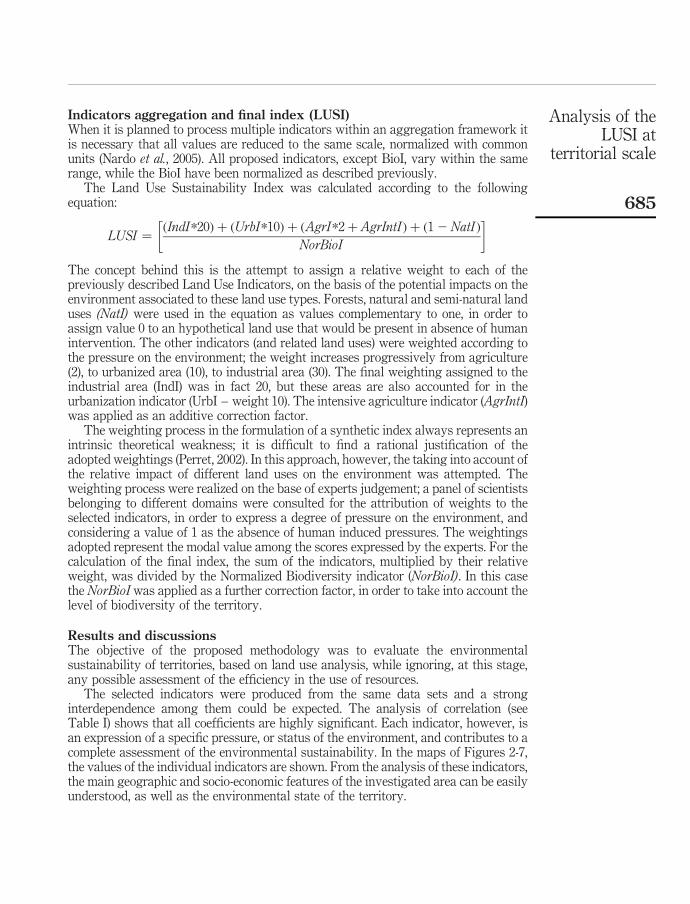
The selected indicators were produced from the same data sets and a stronginterdependence among them could be expected. The analysis of correlation (seeTable I) shows that all coefficients are highly significant. Each indicator, however, isan expression of a specific pressure, or status of the environment, and contributes to acomplete assessment of the environmental sustainability. In the maps of Figures 2-7,the values of the individual indicators are shown. From the analysis of these indicators,the main geographic and socio-economic features of the investigated area can be easilyunderstood, as well as the environmental state of the territory.
Analysis of theLUSI at
territorial scale
685
The Urbanization indicator (see Figure 2) is the expression of the land take/soilsealing process: in 2.6 per cent of the municipalities this indicator is higher than 0.3,corresponding to one third of the territory occupied by artificial land uses. Thedefinition of warning thresholds for this indicator is difficult, as it also depends on theadministrative level at which the indicator has been calculated. In Table II the values ofUrbI have been calculated for the NUTS 4 and 3 levels; there is an evident the reductionof variability in this indicator, moving from NUTS 4 (municipalities), to NUTS 3(province). The reason for this is that several “artificial land use structures” (i.e.factories, hospitals, public offices, highways, railways, etc.) deserve a territory muchwider than the municipality. However, even from only a physiological point of view, itcan be agreed that when the ratio between urbanized and not urbanized areas tend tobe too high (UrbI higher than 0.5), several ecosystem functions are compromised (waterinfiltration, heat dissipation, carbon storage, etc. Scalenghe and Ajmone Marsan, 2009).
UrbI NatI AgrI AgrIntI BioI IndI
UrbI 1.000 20.503 * 0.203 * 0.149 * 20.403 * 0.815 *
NatI 1.000 20.948 * 20.222 * 0.791 * 20.539 *
AgrI 1.000 0.197 * 20.749 * 0.312 *
AgrIntI 1.000 20.233 * 0.221 *
BioI 1.000 20.456 *
IndI 1.000
Note: * Pearson Correlation Coefficients significant at 0.05
Table I.Correlation matrix of theindicators
Figure 2.Map of the UrbanizationIndicator (UrbI)
MEQ21,5
686
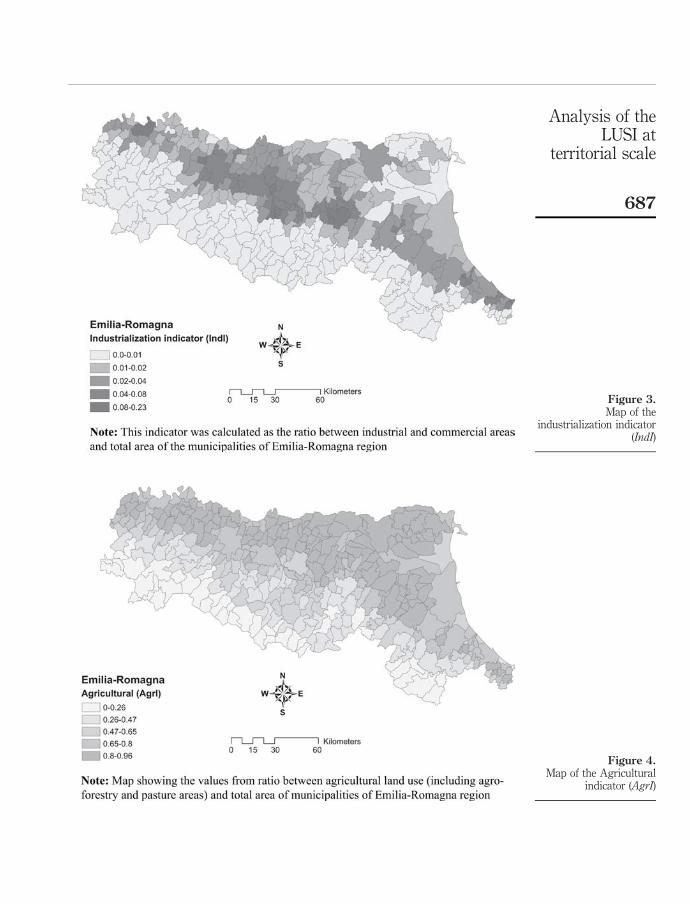
Figure 3.Map of the
industrialization indicator(IndI)
Figure 4.Map of the Agricultural
indicator (AgrI)
Analysis of theLUSI at
territorial scale
687
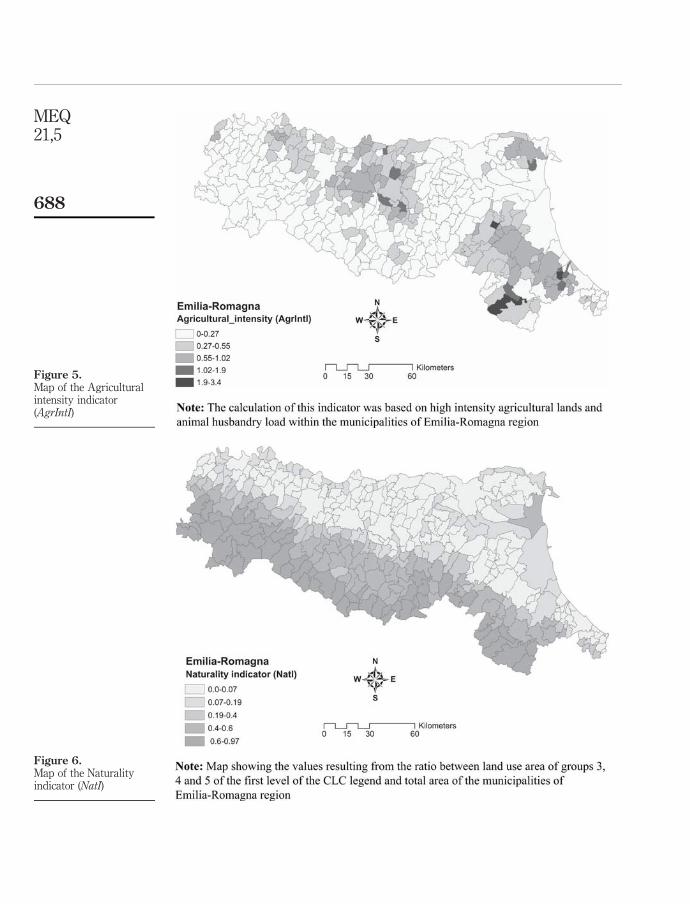
Figure 6.Map of the Naturalityindicator (NatI)
Figure 5.Map of the Agriculturalintensity indicator(AgrIntI)
MEQ21,5
688
The Industrialization indicator (Figure 3) can also be considered as a proxysocio-economic indicator; In Emilia-Romagna, 60 per cent of the municipalities haveIndI higher than 0.01, and 12 per cent higher than 0.05. These very high valuesgenerally correspond to important and specialized industrial districts, oftencharacterized by land demanding structures (such as the ceramic district betweenModena and Reggio-Emilia). The aesthetic appeal of these areas, however, and in manycases also the environmental quality (air, water, soil pollution) is very low,compromising all the other possibilities for the economic exploitation of the territory.When these industrial districts are also extremely specialized in terms of type ofproductions (i.e. ceramic, textile, etc.), they become extremely vulnerable, especially inthe context of economic globalization (Alberti, 2004).
The Agricultural indicator (see Figure 4) shows the ratio between the agriculturalland uses and the total area of the municipalities. The variability of this indicator
Urbanization Index (UrbI)Average Min Max SD
NUTS 3 0.10 0.06 0.19 0.04NUTS 4 0.10 0.01 0.77 0.09
Table II.Statistics on the values of
the UrbI indicatorcalculated for NUTS 4
and NUTS 3
Figure 7.Map of Normalized
Biodiversity indicator(NorBioI)
Analysis of theLUSI at
territorial scale
689
across the region is mainly affected by the physiography, and reaches the highestvalues in the alluvial plains and in the first reliefs of the Apennines. Along the ViaEmilia and the Adriatic coastline, the intensity of urbanization (residential, industrialand infrastructure systems) has led to an evident reduction of the areas available foragricultural land uses. The agricultural indicator alone expresses only the relativeimportance of agricultural land uses; in order to provide further details on theagricultural sector, the Agricultural Intensity Indicator (see Figure 5) has beenproposed. This indicator was calculated on the base of the relative importance of theintensive agricultural land uses (detectable from CLC), and of the animal husbandry.From the map showing this indicator, the most important districts of cattle, pig andpoultry husbandry, as well as the fruit orchards and vineyards areas can be easilyidentified. There are, however, intensive types of agriculture (open fields tomato,potato, onions, cucumbers, watermelon, etc.) that cannot be detected on the basis of aland cover map. For this reason, a possible underestimation of agricultural intensity insome area of Piacenza, Parma (tomato and onion), Ferrara (watermelon, cucumbers)and Bologna (potato and onion) provinces may be present in the calculated indicator.
The Naturality indicator (see Figure 6), showing the ratio between natural andsemi-natural land uses and the total area, is affected by the physiography of theterritory. In fact this indicator reaches the highest values in the most impervious areasof the Apennines, where the woodlands and the above timberline vegetation typesprevail.
Regarding the attempt to provide an assessment of biodiversity from the CLC, theresults appear to be sound. The highest values of the Normalized Biodiversity indicator(see Figure 7) are shown in the mountain areas, but also in the municipalities wherewetland and water bodies are present. More complex approaches, considering therelationships between shape-of-land cover patches, and species richness (Moser et al.,2002) has been proposed, but their implementation in the proposed methodology wascontrasting with the aim of providing an easy to use tool.
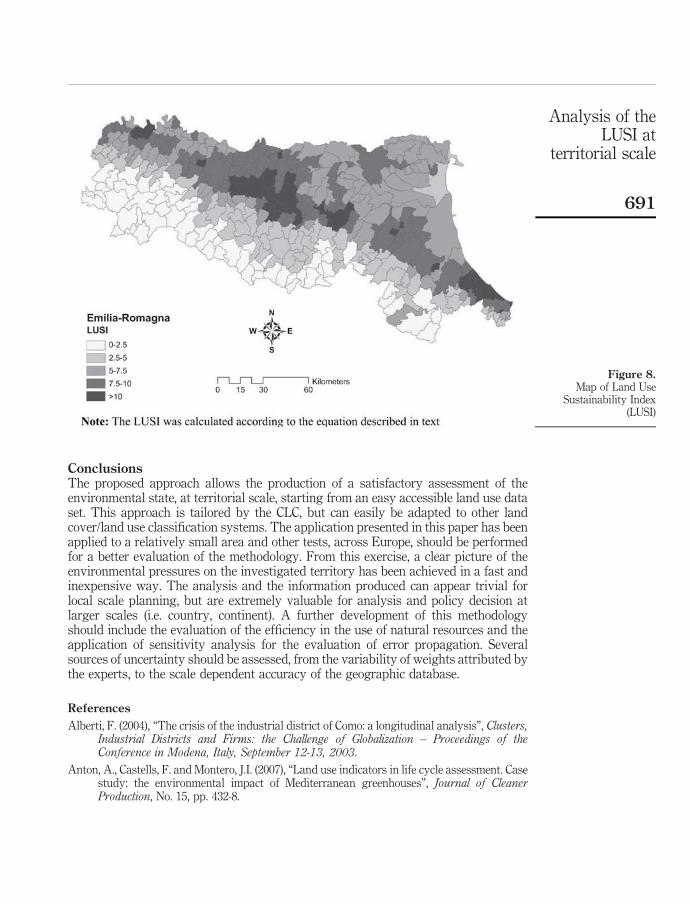
In the map of Figure 8, the LUSI in the municipalities of Emilia-Romagna region isshown. The values are divided into five classes, corresponding to a very low, low,moderate, high and very high degree of sustainability. The highest values of LUSI arepresent in the most populated municipalities, developed along the Via Emilia and thesouthern part of the coastal belt. However, high values of LUSI, corresponding to verylow and low sustainability, are also present in the most intensive agricultural districtsof the region.
The application of the proposed methodology relies essentially on land use data andcan be easily executed in batch mode, using simple models or script in a GISenvironment. Contrary to other environmental sustainability indicators where the landuse data are only a sub-set of the data required, LUSI core data set is represented by theCorine Land Cover, or other equivalent geographical database.
The use of indicators such as the ecological footprint, allows a more accurateestimate of the pressures on the environment to be drawn. The complexity of the datarequired, however, prevents the use of the extended version of this indicator bynon-specialist; the great appreciation of the ecological footprint is related to thepossibility to use simplified versions and to express the results using simple, and easilyunderstandable, units of measures.
MEQ21,5
690
ConclusionsThe proposed approach allows the production of a satisfactory assessment of theenvironmental state, at territorial scale, starting from an easy accessible land use dataset. This approach is tailored by the CLC, but can easily be adapted to other landcover/land use classification systems. The application presented in this paper has beenapplied to a relatively small area and other tests, across Europe, should be performedfor a better evaluation of the methodology. From this exercise, a clear picture of theenvironmental pressures on the investigated territory has been achieved in a fast andinexpensive way. The analysis and the information produced can appear trivial forlocal scale planning, but are extremely valuable for analysis and policy decision atlarger scales (i.e. country, continent). A further development of this methodologyshould include the evaluation of the efficiency in the use of natural resources and theapplication of sensitivity analysis for the evaluation of error propagation. Severalsources of uncertainty should be assessed, from the variability of weights attributed bythe experts, to the scale dependent accuracy of the geographic database.
References
Alberti, F. (2004), “The crisis of the industrial district of Como: a longitudinal analysis”, Clusters,Industrial Districts and Firms: the Challenge of Globalization – Proceedings of theConference in Modena, Italy, September 12-13, 2003.
Anton, A., Castells, F. and Montero, J.I. (2007), “Land use indicators in life cycle assessment. Casestudy: the environmental impact of Mediterranean greenhouses”, Journal of CleanerProduction, No. 15, pp. 432-8.
Figure 8.Map of Land Use
Sustainability Index(LUSI)
Analysis of theLUSI at
territorial scale
691
Christen, O. (1999), Sustainable Agriculture – from the History of Ideas to Practical Application,Institut fur Landwirtschaft und Umwelt (ilu), Bonn.
Cohen, J.E. (1995), How Many People Can the Earth Support?, W.W. Norton, New York, NY andLondon.
Cornaert, M. (2004), “Mapping Europe’s environment from CORINE Land Cover to Europeanspatial analysis”, EEA 10th Anniversary, 25 November, available at: www.eea.eu.int
ETC (2005), ETC, European Topic Centre on Terrestrial Environment, Copenhagen, Corine LandCover database (Version 05/2005), European Topic Centre on Terrestrial Environment.
Frost, L.C., Willems, E., Lathuy, C. and Calvo Iglesias, M.S. (2007), “An assessment of landscapeheterogeneity in the European Union using Corine Land Cover 2000 and LUCAS surveydata”, paper presented at the XI congreso internacional de ingenieria de proyectos, Lugo,26-28 September.
Gallego, J. and Escribano, P. (2000), “Landscape diversity indices from CORINE Land Cover andpoint observations”, Accuracy 2000, July 12-14, Amsterdam.
Gimona, A., Messager, P. and Occhi, M. (2009), “CORINE-based landscape indices weaklycorrelate with plant species richness in a northern European landscape transect”,Landscape Ecology, Vol. 24, pp. 53-64.
Graymore, M., Richards, A. and Wallis, A. (2007), “Producing a GIS based multiple criteriaanalysis tool for regional sustainability assessment: the problem of weighting”,Proceedings of the ANZEE Conference: Re-inventing Sustainability: a Climate ForChange, Australian New Zealand Society for Ecological Economics, Canberra, pp. 1-21.
Haberl, H. (2000), “Energetischer Stoffwechsel und nachhaltige Entwicklung”, Natur und Kultur,Vol. 1 No. 1, pp. 32-47.
Hansen, J.W. (1996), “Is agricultural sustainability a useful concept?”, Agricultural Systems, No. 5,pp. 117-43.
Krotschek, C. and Narodoslawksy, M. (1996), “The sustainable process index. A new dimensionin ecological evaluation”, Ecological Engineering, No. 6, pp. 241-58.
Langaas, S. (1997), “The spatial dimension of indicators of sustainable development: the role ofGeographic Information Systems (GIS) and cartography”, in Moldan, B. and Billharz, S.(Eds), Sustainability Indicators: A Report on the Project on Indicators of SustainableDevelopment, John Wiley & Sons, Chichester, pp. 33-9, SCOPE 58.
Moser, D., Zechmeister, H.G., Plutzar, C., Sauberer, N., Wrbka, T. and Grabherr, G. (2002),“Landscape shape complexity as an effective measure for plant species richness in rurallandscapes”, Landscape Ecology, Vol. 17, pp. 657-69.
Nardo, M., Saisana, M., Saltelli, A., Tarantola, S., Hoffman, A. and Giovannini, E. (2005),“Handbook on constructing composite indicators: methodology and user guide”, OECDstatistics working paper, OECD, Paris.
OECD (1998), Environmental Indicators. Towards Sustainable Development, Organisation forEconomic Co-operation and Development (OECD), Paris.
OECD (2000), Environmental Indicators for Agriculture. Methods and Results, Organisation forEconomic Co-operation and Development (OECD), Paris.
Perret, B. (2002), Indicateurs sociaux, Etat des lieux et perspectives, Conseil de l’emploi, desrevenus et de la cohesion sociale, Les Papiers du CERC 2002-01, Paris.
Petit, S.L., Vinther, F.P., Verkerk, P.J., Firbank, L.G., Halberg, N., Dalgaard, T., Kjeldsen, C.,Lindner, M. and Zudin, S. (2008), Indicators for Assessing the Environmental Impacts ofLand Use Change Across Europe, Springer, Berlin/Heidelberg.
MEQ21,5
692
Rao, D.P. (1998), “Remote sensing and GIS for sustainable development: an overview”,International Archives of Photogrammetry and Remote Sensing, Vol. XXXII No. 7,pp. 156-63.
Sanderson, E., Jaiteh, M., Levy, M., Redford, K., Wannebo, A. and Woolmer, G. (2002), “Thehuman footprint and the last of the wild”, BioScience, Vol. 52 No. 10, pp. 891-904.
Scalenghe, R. and Ajmone Marsan, F. (2009), “The anthropogenic sealing of soils in urban areas”,Landscape and Urban Planning, Vol. 90, pp. 1-10.
Tabbush, P., Frederiksen, P. and Edwards, D. (2008), “Impact assessment in the EuropeanCommission in relation to multifunctional land use”, in Helming, K., Perez-Soba, M. andTabbush, P. (Eds), Sustainability Impact Assessment of Land Use Changes,Springer-Verlag, Berlin, pp. 35-54.
Trinder, J.C. and Milne, A.K. (2002), “Determining sustainability indicators by remote sensing,international archives of photogrammetry”, Remote Sensing and Spatial InformationSciences, Vol. 34 No. 7, pp. 1451-6.
Wackernagel, M. and Rees, W. (1995), Our Ecological Footprint. Reducing Human Impact on theEarth, New Society Publishers, Philadelphia, PA.
Walter, C. (2005), “Sustainability assessment of land use systems”, PhD dissertation, Institute ofVegetable and Fruit Science, Natural Sciences, University of Hanover, Hanover, availableat: www.gartenbau.uni-hannover.de/gem/Literatur/index_veroeff.htm
About the authorsCiro Gardi has, since May 2008, worked as a National Expert at the Institute for Environmentand Sustainability, Land Management and the Natural Hazard Unit, managing the activities ofthe Soil Biodiversity Project. Between 1998 and 2007, he was Contract Professor of Soil Science atParma University, where he undertook research activities on the relationships between land use,agronomic management and soil quality, with particular emphasis on soil degradation process,soil organic matter and soil biodiversity. He also carried out research activities in the fields ofsustainable agriculture and organic farming. He teaches in international masters and courses.Since 1988 he has acquired significant experience on soil survey, carried out in Italy and abroad,and on GIS and RS. He has got experience in international cooperation and he did consultancy, asan independent expert, for the European Commission, World Bank, OECD and NGO’s.
Claudio Bosco graduated in 2002, at the University of Milan, in natural sciences. SinceOctober 2008 he has worked as a grant holder at the Institute for Environment andSustainability, Land Management and the Natural Hazard Unit, managing the activities linkedwith the European Digital archive of soil maps and with soil erosion. Between 2006 and 2008, hewas a researcher at the Catholic University of Brescia, where he carried out research activities onsoil erosion, with particular emphasis on soil erosion in the alpine area. Since 2003 he hasacquired significant experience on soil degradation problems, natural hazards, geomorphology,GIS techniques and environmental pollution analysis. He has experience in international projectsand cooperation.
Ezio Rusco graduated in 1989 in Forest Engineering from the Faculty of Agriculture of TurinUniversity (Italy). Since 1990 he has been working free lance and as a Consultant for manydifferent private companies and public institutions in the sector of pedology and forestry. In 1999he joined the European Commission for the first time, at the JRC, initially at the SpaceApplication Institute and afterwards at the Environmental Institute (Soil and Waste Unit). Hiswork mainly addressed the soil geographical database and soil mapping (Italy and Albania).From 2003 to 2007 he worked as a Consultant for the Italian Environmental Agency and otherpublic institutions on soil degradation processes, climate change and land use dynamics. From 1March 2007 he returned to the JRC, Institute for Environment and Sustainability, LandManagement and Natural Hazards Unit. His work focuses on the development of a new model for
Analysis of theLUSI at
territorial scale
693
soil erosion risk assessment in Europe and supports the definition and analysis of other soildegradation processes such as the decline of soil organic matter. He is also in charge of themanagement of the SoCo project (Sustainable Agriculture and Soil Conservation).
Luca Montanarella, between 1978-1984, studied Agriculture Sciences and graduated inAgricultural Engineering at the Faculty of Agriculture, University of Perugia, Italy. From1984-1985, he undertook post-doctoral study at the Centre for Biopharmaceutical Sciences,University of Leiden, The Netherlands. From 1986, he was Visiting Scientist at the Faculty ofPharmacy, University of Groningen, The Netherlands. Between 1986-1991, he was MassSpectrometry and Chromatography Specialist at Varian Associates, Palo Alto, USA. Between1991-1992, he was Principal Administrator at the Italian Ministry of Agriculture. Since 1992, hehas been Scientific Officer at the Commission of the European Communities, Joint ResearchCentre ( JRC), Ispra, Italy. Since 2003 he has been the head of the new JRC action Soil Data andInformation Systems (SOIL). His main interests are: soil databases, GIS, soil protection, and landdegradation.
MEQ21,5
694
To purchase reprints of this article please e-mail: [email protected] visit our web site for further details: www.emeraldinsight.com/reprints