amp retirement adequacy index€¦ · 1 amp retirement adequacy index the amp retirement index (the...
TRANSCRIPT
AMP Retirement Adequacy IndexSummary of trends July - December 2009
C o n t e n t S
executive Summary
1 overall Retirement Adequacy 2
2 Contribution Rates - comparative periods 3
3 Contribution Rates - 6 months to December 2009 4
4 Average Superannuation Balances - by age group 5
5 Retirement Balance estimate - by age group 6
6 estimated Retirement Income - by age group 7
7 Females - account balances by age group 8
8 Adequacy - workers above and below target 9

1
AMP Retirement Adequacy Index
The AMP Retirement Index (the Index) compares the savings of Australians against a target for an adequate income in retirement - set at 65% of an individual’s pre-retirement living standards. The Index uses data from more than 328,000 AMP members, along with estimates of the age pension (for those who qualify) and “other investments” (excluding the family home), to estimate whether Australians are on track for an adequate retirement.This issue of the Index draws on data for the 6 months from July to December of 2009.Following the recent announcements by the Government in response to the Henry Review’s final report, AMP has commissioned a second Index that models the effect the proposed changes would have. The proposed changes modelled are:
Increase in Superannuation Guarantee (SG) rate to 12% by 2019. Low income earner concessional contribution tax offset - this would equate to a maximum rebate of $500 for workers
earning up to $37,000 per annum, and A permanent increase in the concessional contribution cap for over-50s with superannuation balances less than $500,000.
This Index summary provides an overview of both the “before and after” picture of retirement adequacy as at 31 December 2009.
A tale of 2 adequacy outcomes...
The proposed increase in the Superannuation Guarantee (SG) to 12% announced recently by the Government in response to the Henry Review’s recommendations will have a significant impact on retirement adequacy.
However, prior to this announcement, average retirement adequacy had plummeted since our last report, falling to one of its lowest levels since the commencement of the Index.
While investment values continue to improve...
Strong gains in investment markets have seen average member balances increase by approximately 6% over the period. However, a fall in contribution levels has outweighed the improvements in investment balances, leading to an overall substantial fall in adequacy.
Changes in contribution rules prove most significant...
The 2009 Budget announcing cuts to the concessional contribution caps available for members appears to have had a real and immediate impact on voluntary contribution levels. Coupled with the cuts to the co-contribution scheme announced at the same time, members at either end of the income spectrum have curtailed their level of voluntary contributions, directly impacting on their ability to achieve adequate retirement savings through superannuation.
The future of superannuation...
The 2010 Budget announcements lifting the Superannuation Guarantee (SG) to 12% by 2019 and the low-income concessional tax rebate will stimulate a significant rise in adequacy for members. Based on current contribution levels, there is an immediate uplift of nearly 3% to 71.3%. However, the greatest beneficiaries will be those yet to enter the workforce, who - in the fullness of time - will be more likely to achieve overall adequacy rates closer to 75%.
Executive Summary
2
1. Overall Retirement Adequacy
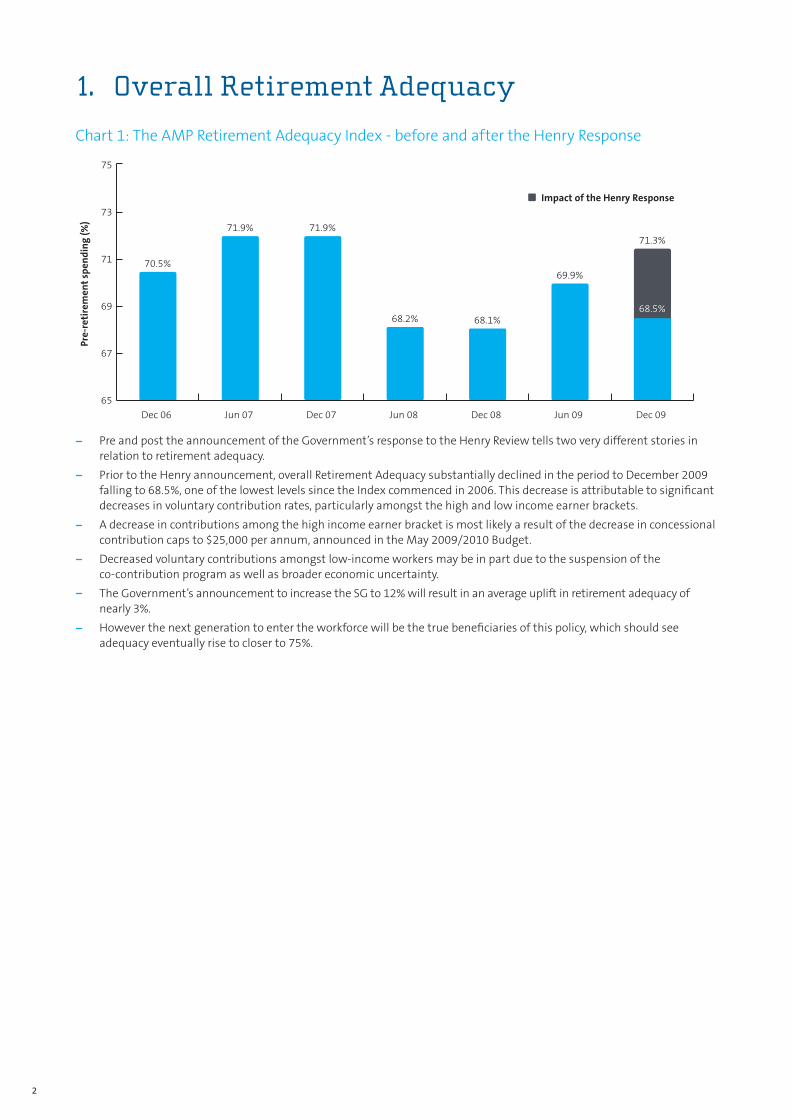
Chart 1: The AMP Retirement Adequacy Index - before and after the Henry Response
Impact of the Henry Response
Pre-
reti
rem
ent
spen
din
g (%
)
65
67
69
71
73
75
70.5%
Dec 06 Jun 07 Dec 07 Jun 08 Dec 08 Jun 09 Dec 09
71.9% 71.9%
68.2% 68.1%
69.9%
71.3%
68.5%
Pre and post the announcement of the Government’s response to the Henry Review tells two very different stories in relation to retirement adequacy.
Prior to the Henry announcement, overall Retirement Adequacy substantially declined in the period to December 2009 falling to 68.5%, one of the lowest levels since the Index commenced in 2006. This decrease is attributable to significant decreases in voluntary contribution rates, particularly amongst the high and low income earner brackets.
A decrease in contributions among the high income earner bracket is most likely a result of the decrease in concessional contribution caps to $25,000 per annum, announced in the May 2009/2010 Budget.
Decreased voluntary contributions amongst low-income workers may be in part due to the suspension of the co-contribution program as well as broader economic uncertainty.
The Government’s announcement to increase the SG to 12% will result in an average uplift in retirement adequacy of nearly 3%.
However the next generation to enter the workforce will be the true beneficiaries of this policy, which should see adequacy eventually rise to closer to 75%.

3
2. Contribution Rates - comparative periods
TABLE 1: CONTRIBUTION RATES BY AGE, DECEMBER 2006 TO DECEMBER 2009
AGE DEC 06 (%) JUN 07 (%) DEC 07 (%) JUN 08 (%) DEC 08 (%) JUN 09 (%) DEC 09 (%)
20-24 10.1 11.0 10.1 10.3 10.1 10.0 10.0
25-29 10.2 11.0 10.2 10.4 10.3 10.1 10.4
30-34 10.7 11.4 10.6 10.7 10.4 10.2 10.5
35-39 10.8 12.4 10.9 10.8 10.8 10.5 10.6
40-44 11.3 16.7 11.6 11.4 11.5 11.4 11.3
45-49 13.7 17.7 12.8 12.2 12.1 12.1 11.9
50-54 14.4 21.5 16.0 14.3 13.7 13.9 13.4
55-59 18.1 28.4 19.4 18.2 17.6 18.4 17.7
60-64 21.6 40.0 25.0 22.2 22.8 23.5 21.3
65-69 25.5 56.5 24.4 25.7 25.6 28.6 25.1
All workers 12.6 17.2 13.0 12.6 12.5 12.5 12.4
Contribution rates fell overall due to decreases in contributions in all 40+ age groups. Slight increases in contribution levels in each age group under 40 have not been significant enough to offset impact of the decline among older workers.
The most significant falls in contributions have been recorded in the 60+ age categories with falls of 9.4% and 12.2% when compared to June 2009 contribution levels.
The halving of the transitional concessional contribution caps has impacted members aged 60+. This is likely to have been further compounded by the broader economic environment that has seen a reduction in the availability of part-time or casual work.
3. Contribution Rates - 6 months to June 2009
TABLE 2: CONTRIBUTION RATES BY AGE, DECEMBER 2009
AGE SUPER GUARANTEE (SG)/ AWARD (%)
SALARY SACRIFICE (%) AFTER TAX (%) TOTAL (%)
20-24 9.5 0.4 0.4 10.3
25-29 9.6 0.6 0.5 10.6
30-34 9.5 0.7 0.5 10.7
35-39 9.5 0.8 0.5 10.8
40-44 9.4 1.2 0.6 11.2
45-49 9.4 1.7 0.7 11.8
50-54 9.4 3.1 0.9 13.3
55-59 9.4 6.9 1.3 17.5
60-64 9.3 10.2 1.5 21.0
65-69 9.3 12.3 3.0 24.6
All workers 9.4 2.2 0.7 12.4
The overall contribution rate of 12.4% is marginally down on the same rate for the 6 months ending June 2009 (12.5%).
SG and salary sacrifice contribution rates have decreased by 0.1 and 0.2 percentage points respectively compared with the June 2009 period. These decreases were offset by a minor increase (0.1 percentage points) in after-tax contributions.
Substantial increases in contribution rates for workers under the age of 40 may be a reaction to the decreases in concessional contribution caps, however future editions of the Index will show whether this is a long-term trend.

4
4. Average Superannuation Balances - by age group
TABLE 3: AVERAGE SUPER BALANCES (9% SG) - ACTIVE MEMBERS, DECEMBER 2006 TO DECEMBER 2009
AGE BALANCE ($)
DEC 06 JUN 07 DEC 07 JUN 08 DEC 08 JUN 09 DEC 09
20-24 5,246 5,110 5,277 5,184 4,838 5,341 6,159
25-29 13,131 13,052 13,573 13,278 11,725 12,420 13,678
30-34 24,076 24,799 26,352 25,948 22,777 23,140 24,617
35-39 34,486 35,829 38,850 38,747 34,257 34,206 36,069
40-44 44,233 46,621 51,319 50,622 45,151 44,408 46,599
45-49 54,991 57,507 63,314 62,706 56,682 55,227 57,874
50-54 69,025 75,247 79,534 77,905 71,267 69,076 71,762
55-59 81,257 90,244 91,638 85,561 76,925 75,692 79,245
60-64 93,331 96,494 88,684 79,446 71,014 70,470 73,754
65-69 86,927 98,160 83,767 71,097 66,766 66,741 73,285
Average 39,663 42,226 44,013 42,651 38,447 37,939 40,132
In the 6 months to December 2009, super balances rose by an average of $2,192 per member, or 5.8%.
The increase in average super balances was mainly due to continued gains in the underlying value of investments.
Younger members saw the biggest gains in relative terms, while those aged 55 and over achieved the greatest dollar increases in super balances.

5
5. Retirement Balance Estimate - by age group
TABLE 4: AVERAGE ASSETS AT RETIREMENT (12% SG) - TODAY’S DOLLARS
AGE SUPER ($) OTHER ASSETS ($) TOTAL ($)
20-24 829,894 152,981 982,876
25-29 712,821 133,405 846,226
30-34 600,633 148,291 748,924
35-39 496,672 146,820 643,492
40-44 401,993 169,479 571,473
45-49 303,350 166,594 469,944
50-54 221,830 184,706 406,536
55-59 172,635 192,874 365,508
60-64 139,028 201,682 340,710
65-69 112,744 185,689 298,433
All workers 489,089 161,648 650,737
TABLE 5: AVERAGE ASSETS AT RETIREMENT (9% SG) - TODAY’S DOLLARS
AGE SUPER ($) OTHER ASSETS ($) TOTAL ($)
20-24 722,360 152,981 875,341
25-29 630,293 133,405 763,698
30-34 540,896 148,291 689,187
35-39 456,489 146,820 603,308
40-44 377,942 169,479 547,421
45-49 292,560 166,594 459,155
50-54 219,676 184,706 404,381
55-59 172,763 192,874 365,636
60-64 139,137 201,682 340,819
65-69 113,005 185,689 298,694
All workers 442,801 161,648 604,449
Increasing the SG to 12% would deliver an immediate uplift of an additional $46,000 in projected retirement assets.
However, without the increase in SG, projected average retirement assets fell nearly 1% since June 2009.
This projected decrease is a result of a significant fall (3.4%) in average superannuation savings, stemming from the diminished contributions levels seen during this period.
Average other assets increased 6.9% off the back of stronger investment performance during the 6 months to December 2009.

6
6. Estimated Retirement Income - by age group
TABLE 6: AVERAGE RETIREMENT INCOME (12% SG) - TODAY’S DOLLARS
AGE SUPER INCOME ($) OTHER INVESTMENTS ($)
AGED PENSION ($) INCOME TAX ($) NET RETIREMENT INCOME ($)
20-24 41,344 7,607 13,613 1,776 60,788
25-29 36,514 6,815 14,256 1,566 56,019
30-34 30,778 7,575 14,079 1,516 50,915
35-39 25,462 7,500 14,214 1,405 45,770
40-44 20,616 8,655 13,924 1,418 41,777
45-49 15,328 8,379 13,715 1,311 36,112
50-54 11,012 9,113 12,751 1,277 31,599
55-59 8,886 9,832 13,276 1,313 30,681
60-64 7,861 11,215 14,864 1,602 32,338
65-69 7,433 11,730 15,634 1,812 32,984
Average 25,008 8,299 13,909 1,505 45,710
TABLE 7: AVERAGE RETIREMENT INCOME (9% SG) - TODAY’S DOLLARS
AGE SUPER INCOME ($) OTHER INVESTMENTS ($)
AGED PENSION ($) INCOME TAX ($) NET RETIREMENT INCOME ($)
20-24 35,992 7,607 15,269 2,234 56,634
25-29 32,291 6,815 15,650 1,916 52,840
30-34 27,719 7,575 15,115 1,780 48,629
35-39 23,403 7,500 14,925 1,585 44,242
40-44 19,382 8,655 14,357 1,536 40,858
45-49 14,780 8,379 13,898 1,363 35,695
50-54 10,901 9,113 12,790 1,291 31,513
55-59 8,888 9,832 13,273 1,314 30,678
60-64 7,860 11,215 14,859 1,601 32,334
65-69 7,427 11,730 15,630 1,811 32,976
Average 22,646 8,299 14,682 1,711 43,915
7
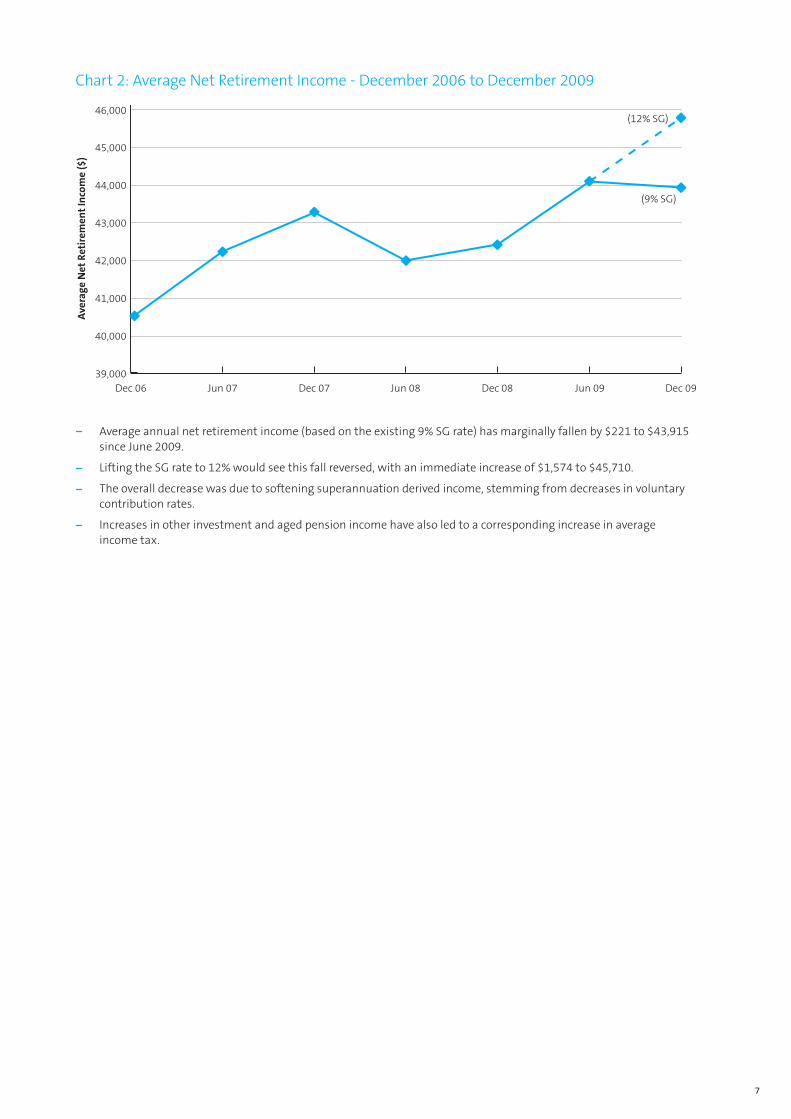
Chart 2: Average Net Retirement Income - December 2006 to December 2009A
vera
ge N
et R
etir
emen
t In
com
e ($
)
39,000
40,000
41,000
42,000
43,000
44,000
45,000
Dec 06 Jun 07 Dec 07 Jun 08 Dec 08 Jun 09 Dec 09
46,000(12% SG)
(9% SG)
Average annual net retirement income (based on the existing 9% SG rate) has marginally fallen by $221 to $43,915 since June 2009.
Lifting the SG rate to 12% would see this fall reversed, with an immediate increase of $1,574 to $45,710.
The overall decrease was due to softening superannuation derived income, stemming from decreases in voluntary contribution rates.
Increases in other investment and aged pension income have also led to a corresponding increase in average income tax.

8
7. Females - account balances by age group
TABLE 8: AVERAGE SUPER BALANCE - ACTIVE MEMBERS, DECEMBER QUARTER 2009
AGE BALANCE ($) SHORTFALL (%)
MALES FEMALES
20-24 6,270 5,854 7
25-29 13,839 13,222 4
30-34 24,999 23,450 6
35-39 37,280 32,043 14
40-44 49,803 35,582 29
45-49 63,236 40,121 37
50-54 79,448 47,374 40
55-59 87,338 53,985 38
60-64 78,533 57,351 27
65-69 77,405 54,637 29
Average 43,840 28,534 35
Chart 3: Average Super Balance - Female Members, December Quarter 2009
Ave
rage
Su
per
Bal
ance
- Fe
mal
e M
embe
rs ($
)
0Dec 06 Jun 07 Dec 07 Jun 08 Dec 08 Jun 09 Dec 09
10,000
20,000
30,000
40,000
50,000
60,000
70,000
80,000
20-24
25-29
30-34
35-39
40-44
45-49
50-54
55-59
60-64
65-69
This table shows the average account balance as at 31 December 2009. The chart shows how the average balance has moved over each period since the inception of the Index.
Female superannuation account balances overall have decreased slightly from June 2009.
However, strong increases in average balances were recorded in the “under 30” and “over 60” age categories largely due to increases in the underlying asset values.

9
8. Adequacy - workers above and below target
TABLE 9: WORKERS ABOVE AND BELOW THE ADEQUACY “TARGET”, DECEMBER 2009
AGE
ON OR ABOVE TARGET BELOW TARGET
% OF WORKERS NUMBER (000s) % OF WORKERS NUMBER (000s) SHORTFALL AGAINST TARGET (%)
20-24 46.3 554.2 53.4 635.6 15.2
25-29 52.9 642.7 46.3 561.2 17.5
30-34 55.4 677.8 43.9 535.8 17.0
35-39 55.8 715.2 43.8 560.3 17.2
40-44 56.7 740.3 43.2 558.7 16.3
45-49 48.0 642.1 51.9 688.3 16.2
50-54 45.5 519.2 54.6 616.8 17.7
55-59 53.6 489.4 46.6 421.0 17.8
60-64 63.1 361.3 32.9 166.4 15.3
65-69 77.4 153.4 20.2 35.2 11.4
All workers1 54.3 6,114.6 45.6 5,073.0 13.0
Chart 4: Workers below the adequacy “target”, December 2009
Wor
kers
bel
ow a
dequ
acy
targ
et (%
)
5Dec 06 Jun 07 Dec 07 Jun 08 Dec 08 Jun 09 Dec 09
15
25
35
45
55
20-24
25-29
30-34
35-39
40-44
45-49
50-54
55-59
60-64
65-69
1. Note that, as with all tables in this report, the “all workers” total includes some workers under the age of 20 and some aged 70 and over. It is therefore not the sum of the identified age groups. For example, there are more than 200,00 workers aged under 20 who are below the adequacy target (and therefore included in relevant totals - such as 4 million Australians falling below the adequacy target).
The number of Australians falling short of achieving an adequate retirement has increased significantly in the 6 months to December 2009.
This represents the most significant deterioration in adequacy since the commencement of the Index.
While the June 2009 Index estimated approximately 4.5 million Australians would not achieve an adequate level of retirement income, this has now blown out to approximately 5 million.
This is directly due to the fall in voluntary contributions experienced over the current period.
The proposed increase in SG should counter this fall - future editions of the Index will substantiate the extent of this counter.

NS5501 06/10