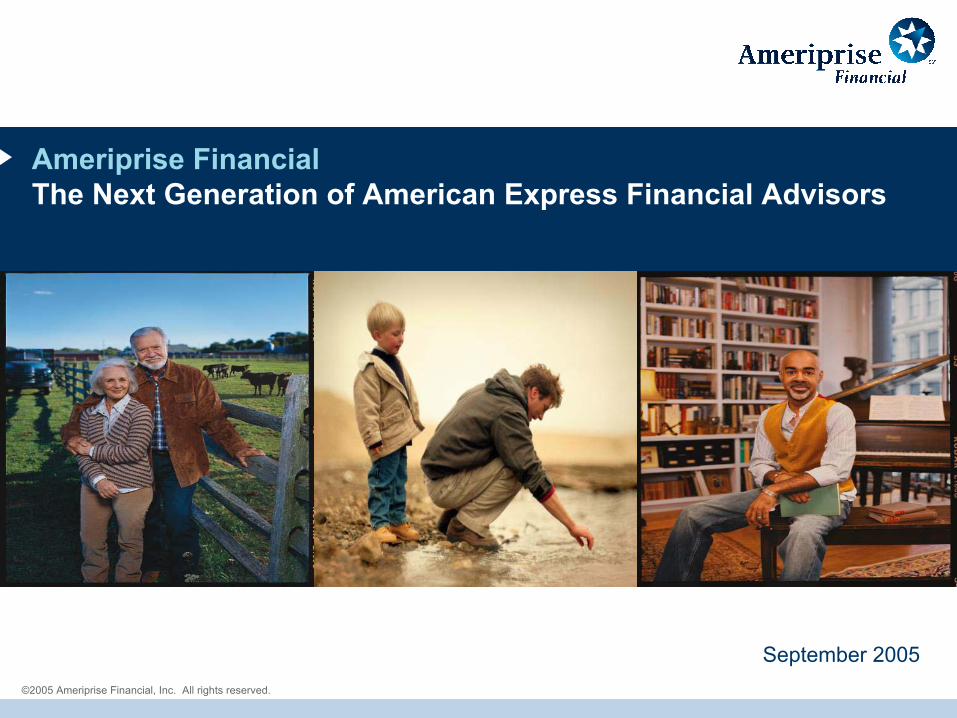
ameriprise financial the next generation of american express financial...
TRANSCRIPT
©2005 Ameriprise Financial, Inc. All rights reserved.
Ameriprise FinancialThe Next Generation of American Express Financial Advisors
September 2005
2
Forward-Looking Statements
Some of the statements that we make in this presentation may constitute "forward-looking statements." These statements reflect management's expectations about future events and operating plans and performance and speak only as of the date hereof. These forward-looking statements involve a number of risks and uncertainties. A list of the factors that could causeactual results to be materially different from those expressed or implied by any of these forward-looking statements is detailed under "Risk Factors" and elsewhere in our Registration Statement on Form 10, as amended, filed with the SEC. We undertake no obligation to update publicly or revise these forward-looking statements for any reason.
All 2004 financial data in this presentation is pro forma as per Form 10 filing unless otherwise noted.
3
Today’s Agenda
> Transaction Overview
> Company History
> Integrated Business Model
> Growth Strategies
> Financial Overview
> Summary and Q&A
James M. CracchioloChairman & Chief Executive Officer
Walter S. BermanExecutive Vice President and Chief Financial Officer
4
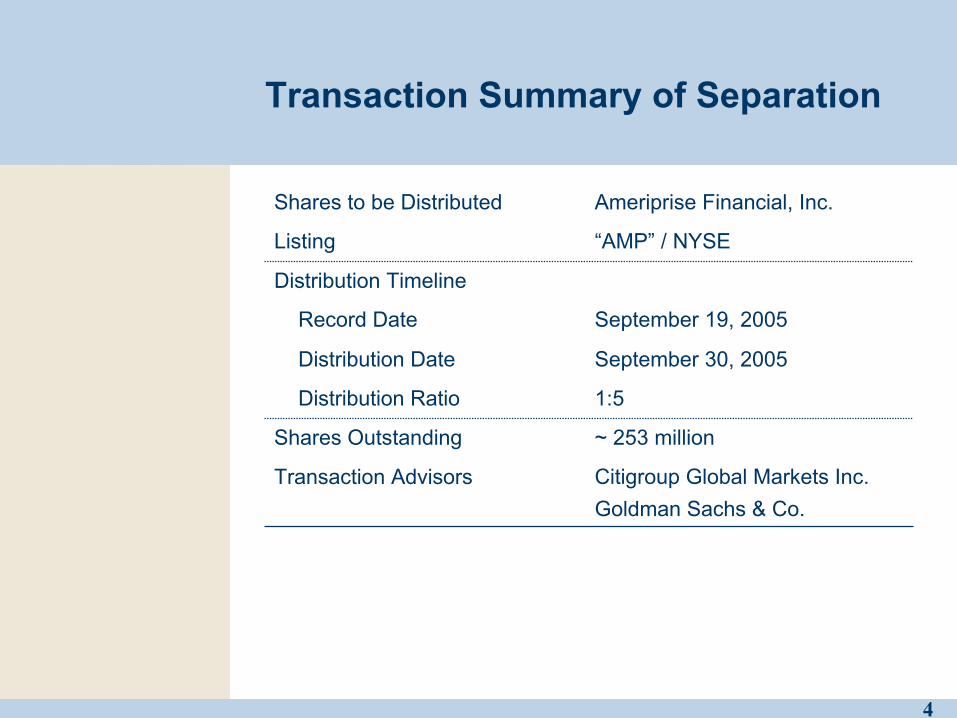
Transaction Summary of Separation
~ 253 millionShares Outstanding
Distribution Timeline
Citigroup Global Markets Inc.Goldman Sachs & Co.
Transaction Advisors
1:5 Distribution Ratio
September 30, 2005Distribution Date
September 19, 2005Record Date
“AMP” / NYSEListing
Ameriprise Financial, Inc.Shares to be Distributed
5
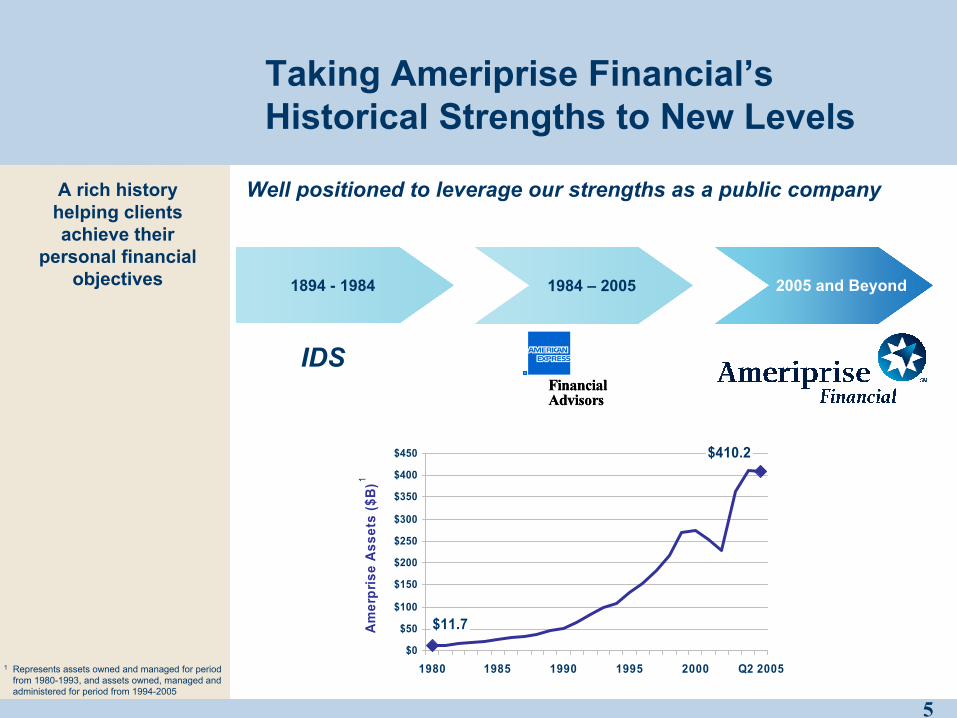
Taking Ameriprise Financial’s Historical Strengths to New Levels
$11.7
$410.2
$0
$50
$100
$150
$200
$250
$300
$350
$400
$450
1980 1985 1990 1995 2000 Q2 2005
Am
erpr
ise
Ass
ets
($B
)
A rich history helping clients achieve their
personal financial objectives 1894 - 1984 1984 – 2005 2005 and Beyond
IDS
Well positioned to leverage our strengths as a public company
1 Represents assets owned and managed for period from 1980-1993, and assets owned, managed and administered for period from 1994-2005
1
6
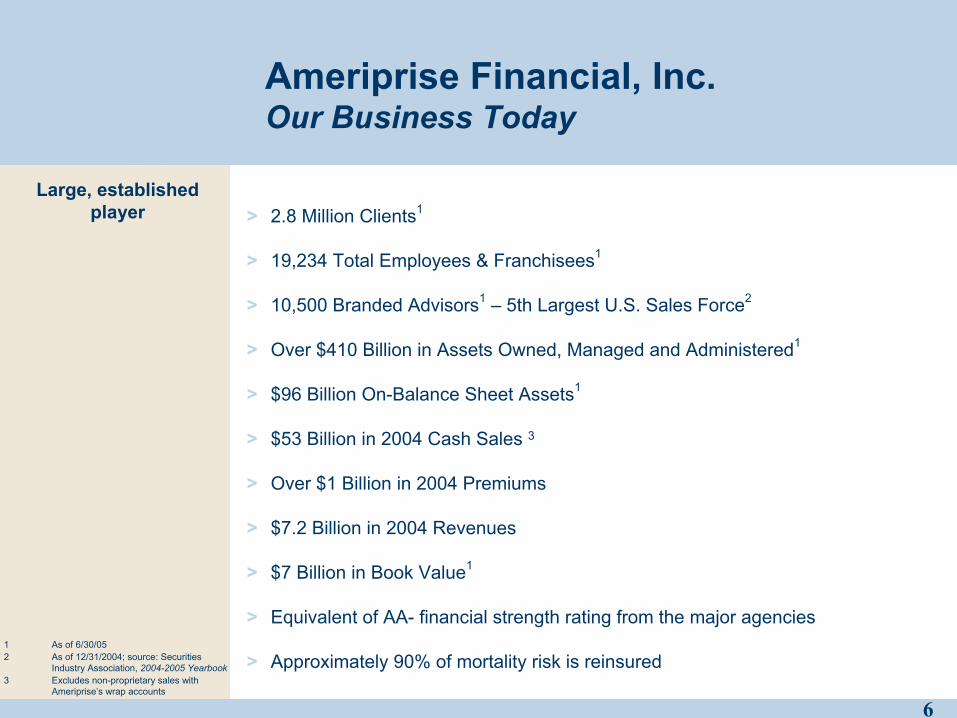
Ameriprise Financial, Inc.Our Business Today
Large, established player
1 As of 6/30/052 As of 12/31/2004; source: Securities
Industry Association, 2004-2005 Yearbook3 Excludes non-proprietary sales with
Ameriprise’s wrap accounts
> 2.8 Million Clients1
> 19,234 Total Employees & Franchisees1
> 10,500 Branded Advisors1 – 5th Largest U.S. Sales Force2
> Over $410 Billion in Assets Owned, Managed and Administered1
> $96 Billion On-Balance Sheet Assets1
> $53 Billion in 2004 Cash Sales 3
> Over $1 Billion in 2004 Premiums
> $7.2 Billion in 2004 Revenues
> $7 Billion in Book Value1
> Equivalent of AA- financial strength rating from the major agencies
> Approximately 90% of mortality risk is reinsured
7
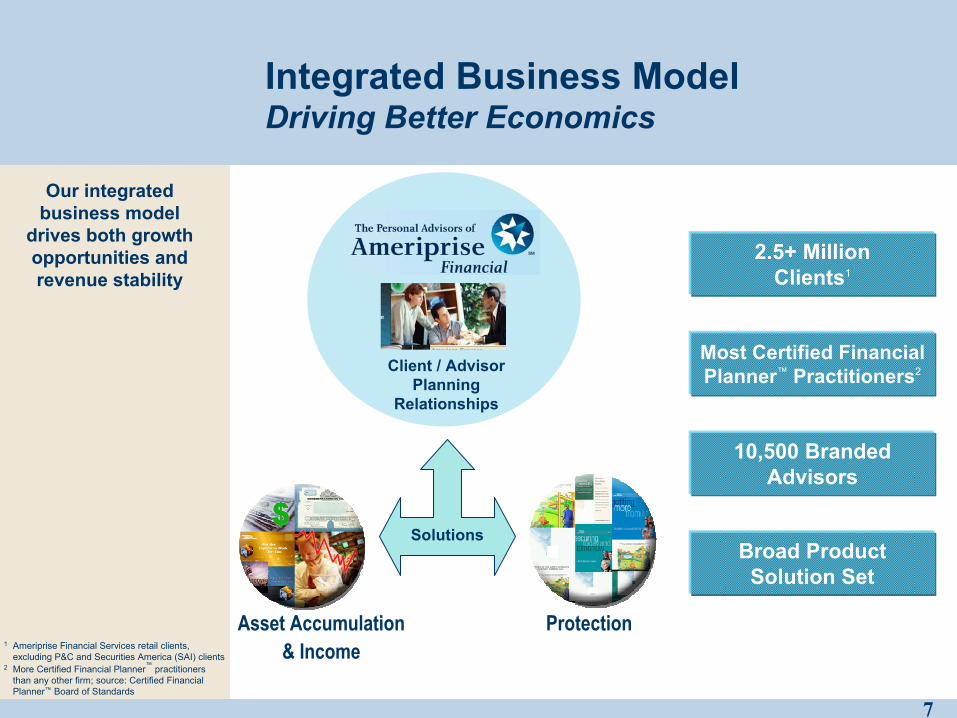
Client / Advisor Planning
Relationships
ProtectionAsset Accumulation & Income
Solutions
Integrated Business ModelDriving Better Economics
Our integrated business model
drives both growth opportunities and revenue stability
10,500 Branded Advisors
Broad ProductSolution Set
Most Certified Financial Planner™ Practitioners2
2.5+ MillionClients1
1 Ameriprise Financial Services retail clients, excluding P&C and Securities America (SAI) clients
2 More Certified Financial Planner™ practitioners than any other firm; source: Certified Financial Planner™ Board of Standards
8
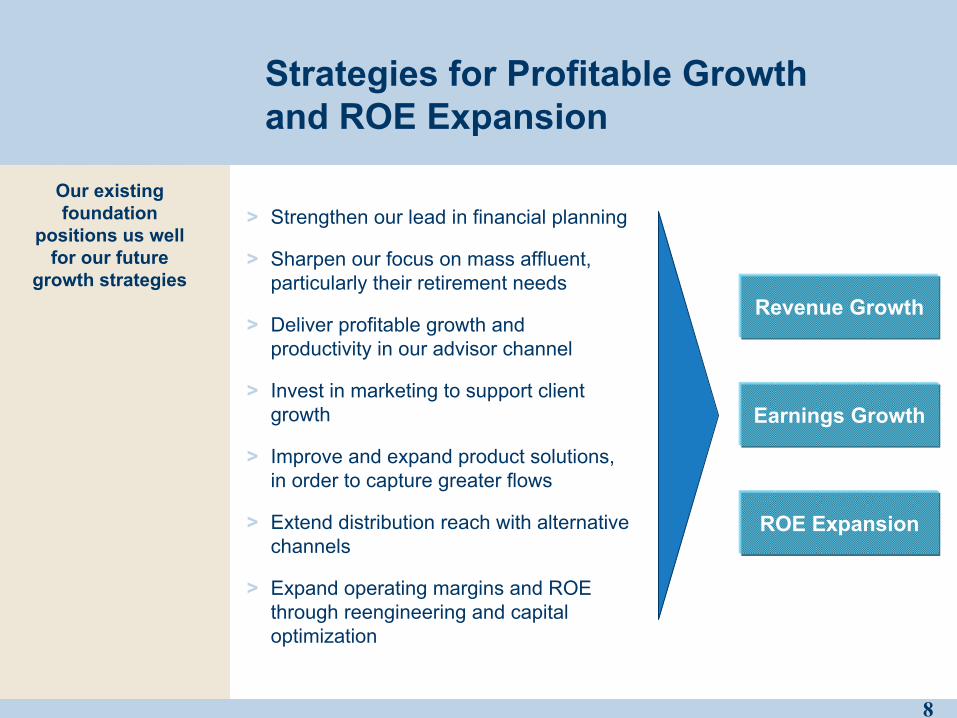
Strategies for Profitable Growthand ROE Expansion
> Strengthen our lead in financial planning
> Sharpen our focus on mass affluent, particularly their retirement needs
> Deliver profitable growth and productivity in our advisor channel
> Invest in marketing to support client growth
> Improve and expand product solutions, in order to capture greater flows
> Extend distribution reach with alternative channels
> Expand operating margins and ROE through reengineering and capital optimization
Our existing foundation
positions us well for our future
growth strategies
Earnings Growth
ROE Expansion
Revenue Growth
9
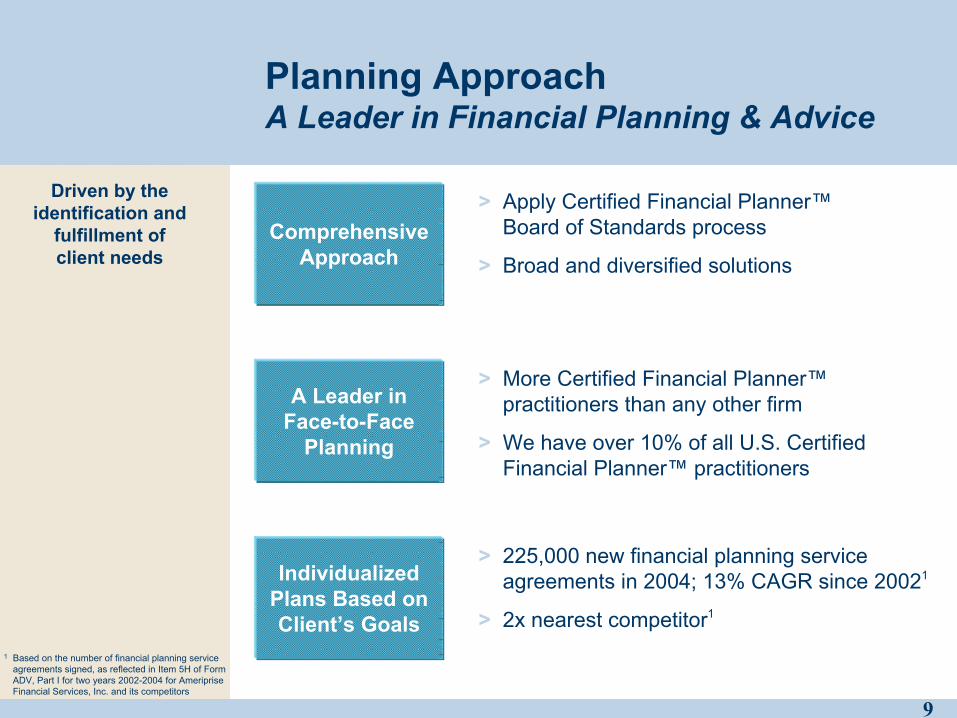
Planning ApproachA Leader in Financial Planning & Advice
Comprehensive Approach
A Leader inFace-to-Face
Planning
Individualized Plans Based on Client’s Goals
> 225,000 new financial planning service agreements in 2004; 13% CAGR since 20021
> 2x nearest competitor1
> Apply Certified Financial Planner™Board of Standards process
> Broad and diversified solutions
> More Certified Financial Planner™practitioners than any other firm
> We have over 10% of all U.S. Certified Financial Planner™ practitioners
Driven by the identification and
fulfillment ofclient needs
1 Based on the number of financial planning service agreements signed, as reflected in Item 5H of Form ADV, Part I for two years 2002-2004 for Ameriprise Financial Services, Inc. and its competitors
10
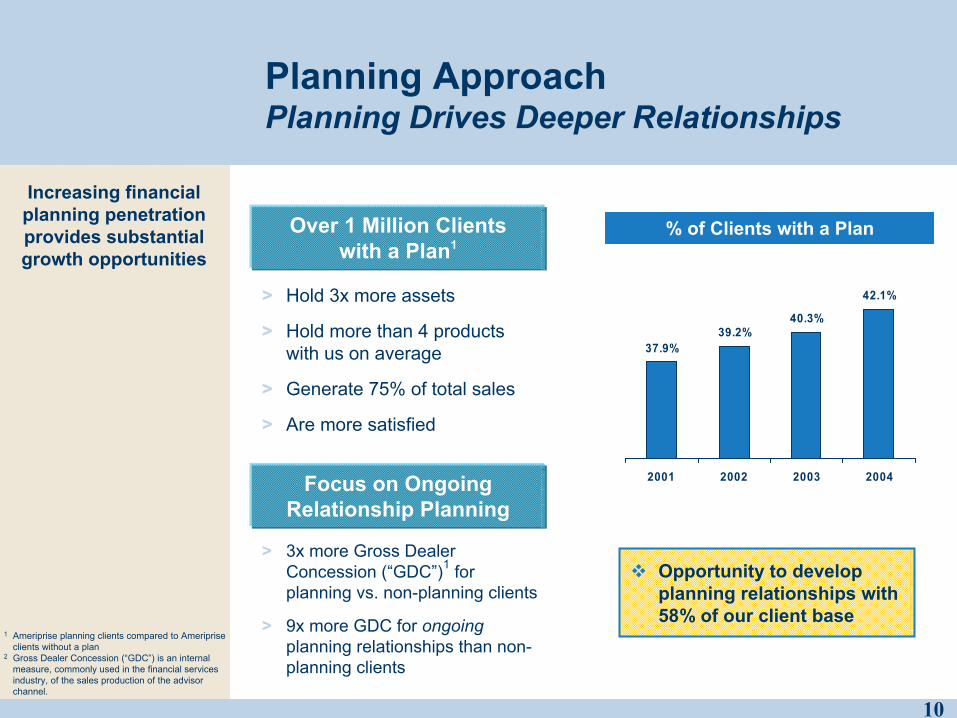
Planning ApproachPlanning Drives Deeper Relationships
> 3x more Gross Dealer Concession (“GDC”)1 for planning vs. non-planning clients
> 9x more GDC for ongoingplanning relationships than non-planning clients
Increasing financial planning penetration provides substantial growth opportunities
Focus on Ongoing Relationship Planning
37.9%39.2%
40.3%
42.1%
2001 2002 2003 2004
% of Clients with a Plan
Opportunity to develop planning relationships with 58% of our client base
Over 1 Million Clientswith a Plan1
> Hold 3x more assets
> Hold more than 4 products with us on average
> Generate 75% of total sales
> Are more satisfied
1 Ameriprise planning clients compared to Ameriprise clients without a plan
2 Gross Dealer Concession (“GDC”) is an internal measure, commonly used in the financial services industry, of the sales production of the advisor channel.
11
Profitably serving mass and
mass-affluent segment
Proven successattracting and
retaining clients in this high-growth
segment
Client FocusFocusing on the Mass Affluent
Largest, Fastest Growing Segment
Indexed5 Growth in AMPMass-Affluent Clients
Acute Need forRetirement
134
119
100
2002 2003 2004
1 Source: MacroMonitor 2004-2005 consumer survey prepared by SRI Consulting Business Intelligence
2 Source: BCG Wealth Market Sizing Database3 Source: Federal Reserve Board Survey of
Consumer Finances; EBRI; Financial Insights; U.S. Federal Reserve, 2001
4 Source: Spectrem Group, Planning for Retirement: Baby Boomer Expectations vs. Reality, April 2005
5 Indexed to 2002 levels of clients holding over $100,000 of assets with Ameriprise
6 Retail assets includes assets in the U.S., managed and administered for retail clients
> 50% of U.S. investable assets1
> Growth 2x faster than market2
> Biggest identified need3
> 54% prefer having a financial planner4 Mass-Affluent Clients represent
over 70% of our retail assets6
12
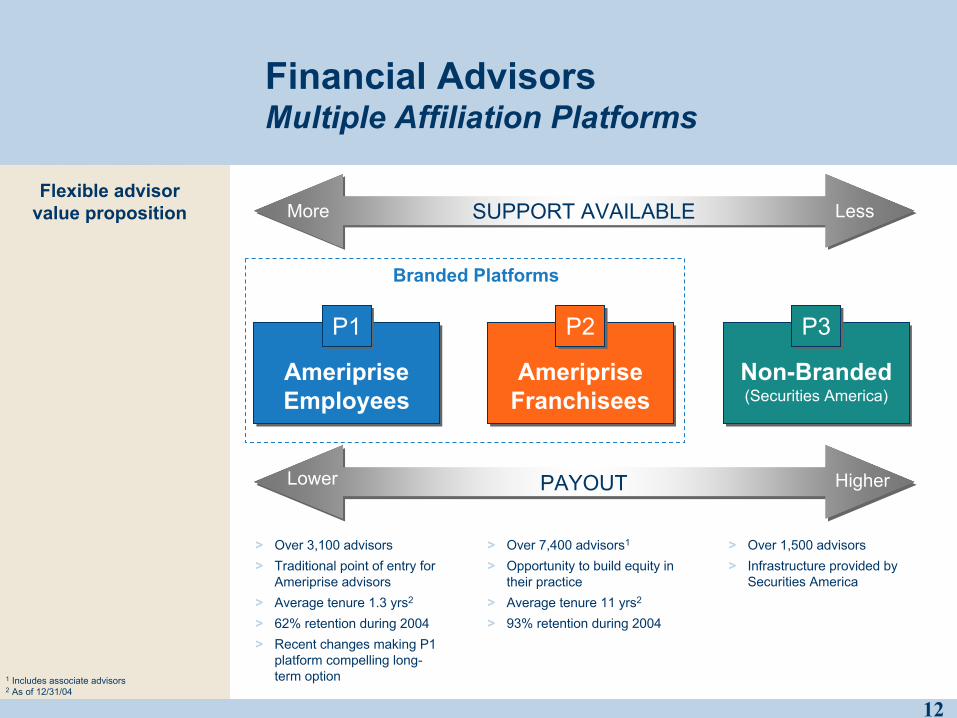
Financial AdvisorsMultiple Affiliation Platforms
AmeripriseEmployeesAmeripriseEmployees
AmeripriseFranchiseesAmeriprise
FranchiseesNon-Branded(Securities America)
Non-Branded(Securities America)
P1P1 P2P2 P3P3
> Over 3,100 advisors> Traditional point of entry for
Ameriprise advisors> Average tenure 1.3 yrs2
> 62% retention during 2004> Recent changes making P1
platform compelling long-term option
> Over 7,400 advisors1
> Opportunity to build equity in their practice
> Average tenure 11 yrs2
> 93% retention during 2004
> Over 1,500 advisors> Infrastructure provided by
Securities America
1 Includes associate advisors2 As of 12/31/04
Flexible advisor value proposition
Branded Platforms
SUPPORT AVAILABLESUPPORT AVAILABLEMore Less
PAYOUTPAYOUTLower Higher
13
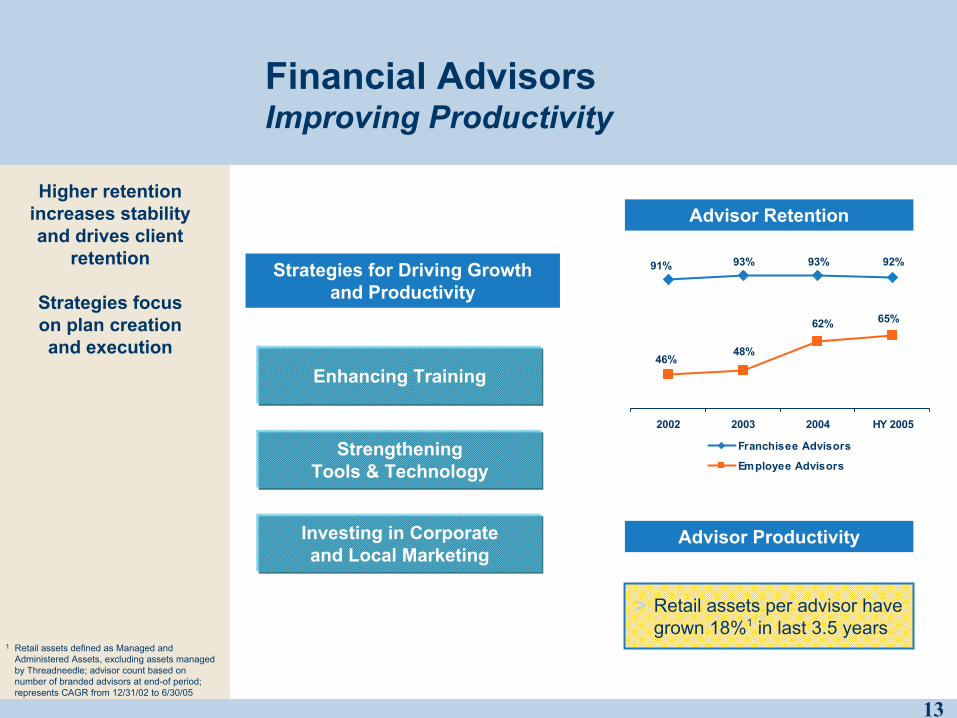
Financial AdvisorsImproving Productivity
Advisor Productivity
Higher retention increases stability and drives client
retention
Strategies focus on plan creationand execution
Enhancing Training
Strategies for Driving Growth and Productivity
Investing in Corporateand Local Marketing
Advisor Retention
93% 93% 92%
48%
91%
62%
46%
65%
2002 2003 2004 HY 2005
Franchisee Advisors
Employee Advisors
1 Retail assets defined as Managed and Administered Assets, excluding assets managed by Threadneedle; advisor count based on number of branded advisors at end-of period; represents CAGR from 12/31/02 to 6/30/05
StrengtheningTools & Technology
> Retail assets per advisor have grown 18%1 in last 3.5 years
14
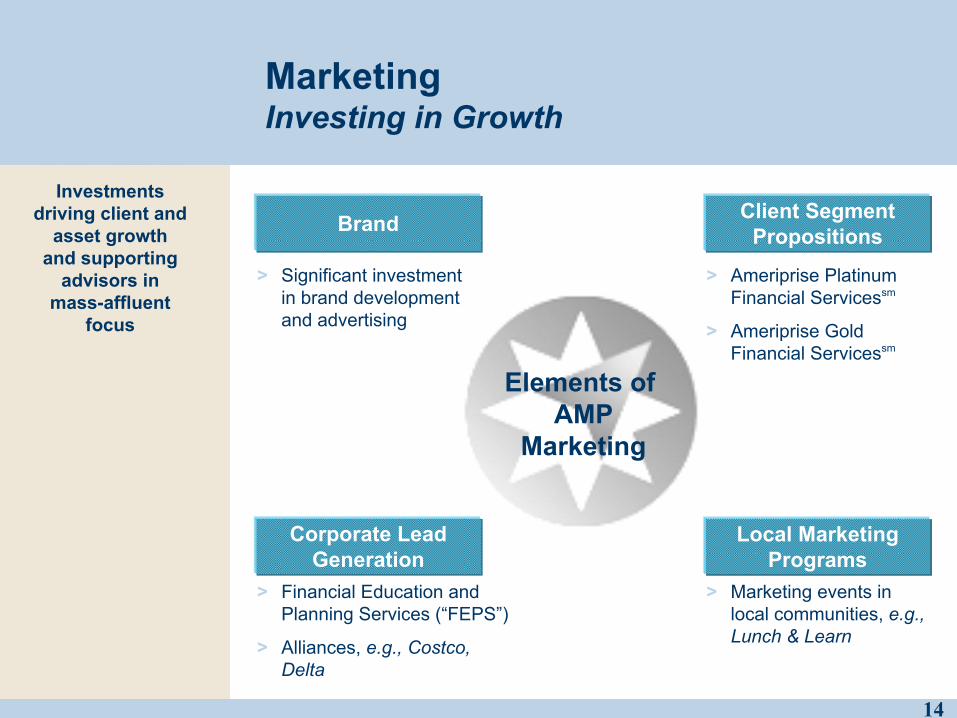
MarketingInvesting in Growth
Investments driving client and
asset growthand supporting
advisors inmass-affluent
focus
Brand
> Significant investment in brand development and advertising
Client Segment Propositions
> Ameriprise Platinum Financial Servicessm
> Ameriprise Gold Financial Servicessm
Corporate Lead Generation
> Financial Education and Planning Services (“FEPS”)
> Alliances, e.g., Costco, Delta
Local Marketing Programs
> Marketing events in local communities, e.g., Lunch & Learn
Elements of AMP
Marketing
15
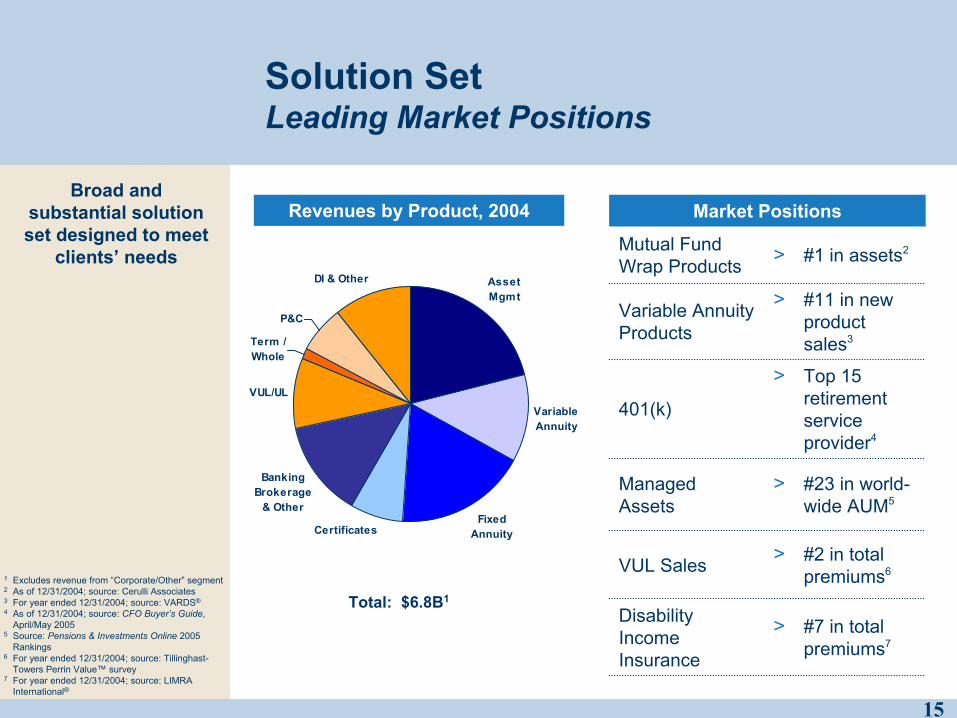
Asset Mgmt
Variable Annuity
Fixed AnnuityCertificates
Banking Brokerage
& Other
VUL/UL
Term / Whole
P&C
DI & Other
Solution SetLeading Market Positions
> #23 in world-wide AUM5
Managed Assets
> Top 15 retirement service provider4
401(k)
> #11 in new product sales3
Variable Annuity Products
> #7 in total premiums7
Disability Income Insurance
> #2 in total premiums6VUL Sales
> #1 in assets2Mutual Fund Wrap Products
Market PositionsRevenues by Product, 2004Broad and
substantial solution set designed to meet
clients’ needs
Total: $6.8B1
1 Excludes revenue from “Corporate/Other” segment2 As of 12/31/2004; source: Cerulli Associates3 For year ended 12/31/2004; source: VARDS®
4 As of 12/31/2004; source: CFO Buyer’s Guide, April/May 2005
5 Source: Pensions & Investments Online 2005 Rankings
6 For year ended 12/31/2004; source: Tillinghast-Towers Perrin Value™ survey
7 For year ended 12/31/2004; source: LIMRA International®
16
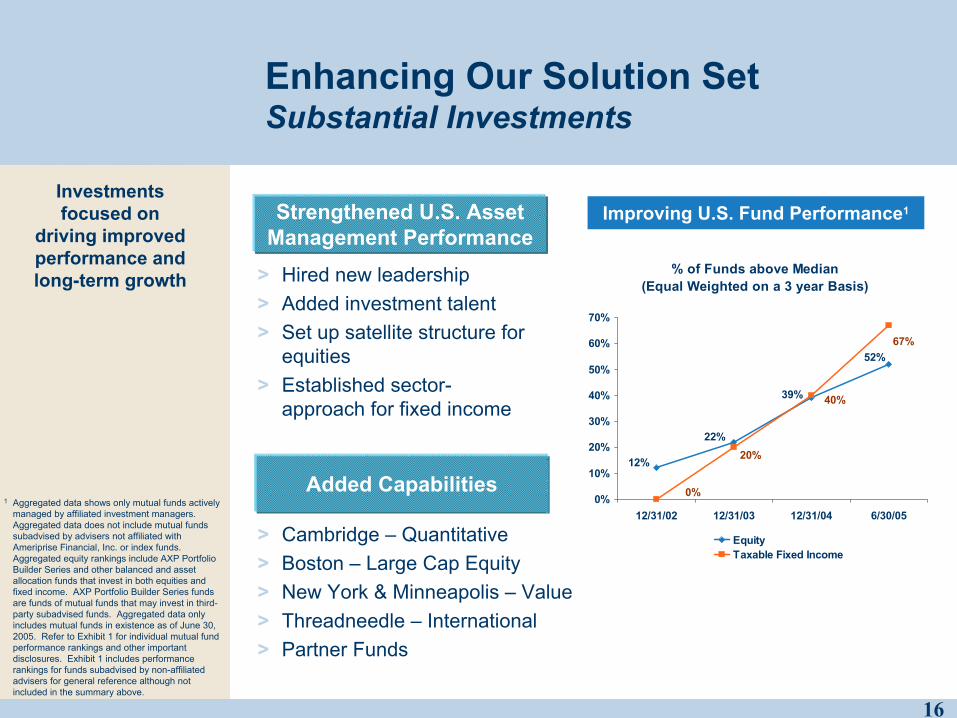
Enhancing Our Solution SetSubstantial Investments
Investments focused on
driving improved performance and long-term growth
Added Capabilities
Strengthened U.S. Asset Management Performance
Improving U.S. Fund Performance1
> Hired new leadership> Added investment talent> Set up satellite structure for
equities> Established sector-
approach for fixed income
> Cambridge – Quantitative> Boston – Large Cap Equity> New York & Minneapolis – Value> Threadneedle – International> Partner Funds
1 Aggregated data shows only mutual funds actively managed by affiliated investment managers. Aggregated data does not include mutual funds subadvised by advisers not affiliated with Ameriprise Financial, Inc. or index funds. Aggregated equity rankings include AXP Portfolio Builder Series and other balanced and asset allocation funds that invest in both equities and fixed income. AXP Portfolio Builder Series funds are funds of mutual funds that may invest in third-party subadvised funds. Aggregated data only includes mutual funds in existence as of June 30, 2005. Refer to Exhibit 1 for individual mutual fund performance rankings and other important disclosures. Exhibit 1 includes performance rankings for funds subadvised by non-affiliated advisers for general reference although not included in the summary above.
% of Funds above Median (Equal Weighted on a 3 year Basis)
52%
39%
22%
12% 20%
40%
0%
67%
0%
10%
20%
30%
40%
50%
60%
70%
12/31/02 12/31/03 12/31/04 6/30/05
EquityTaxable Fixed Income
17
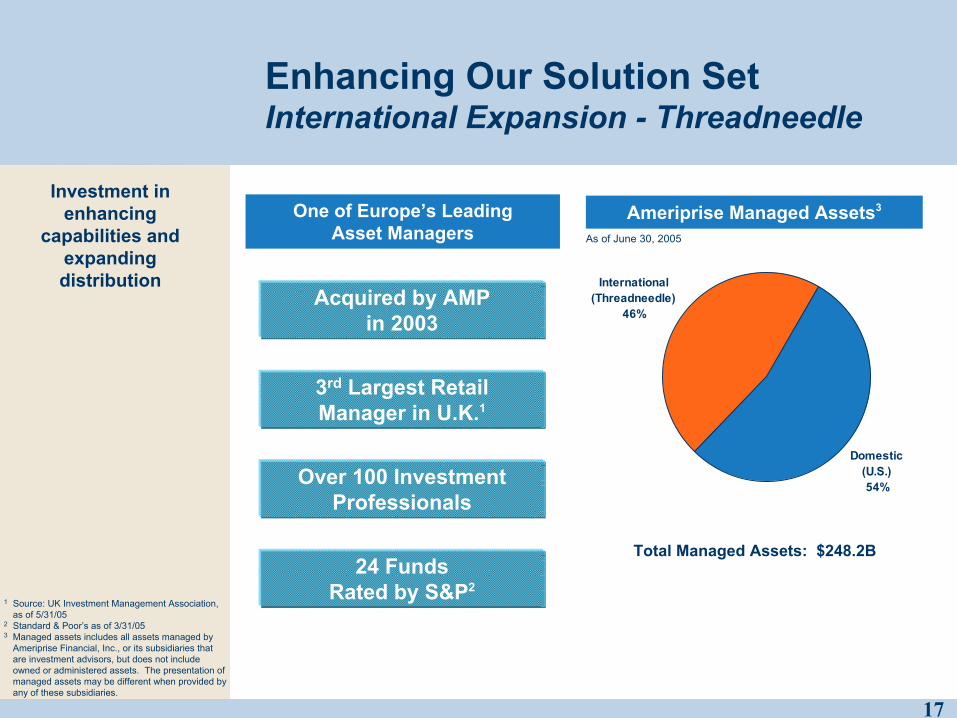
Enhancing Our Solution SetInternational Expansion - Threadneedle
Investment in enhancing
capabilities and expanding distribution
Acquired by AMPin 2003
3rd Largest RetailManager in U.K.1
Over 100 Investment Professionals
One of Europe’s LeadingAsset Managers
24 FundsRated by S&P2
Total Managed Assets: $248.2B
Ameriprise Managed Assets3
International(Threadneedle)
46%
Domestic(U.S.)54%
1 Source: UK Investment Management Association, as of 5/31/05
2 Standard & Poor’s as of 3/31/053 Managed assets includes all assets managed by
Ameriprise Financial, Inc., or its subsidiaries that are investment advisors, but does not include owned or administered assets. The presentation of managed assets may be different when provided by any of these subsidiaries.
As of June 30, 2005
18
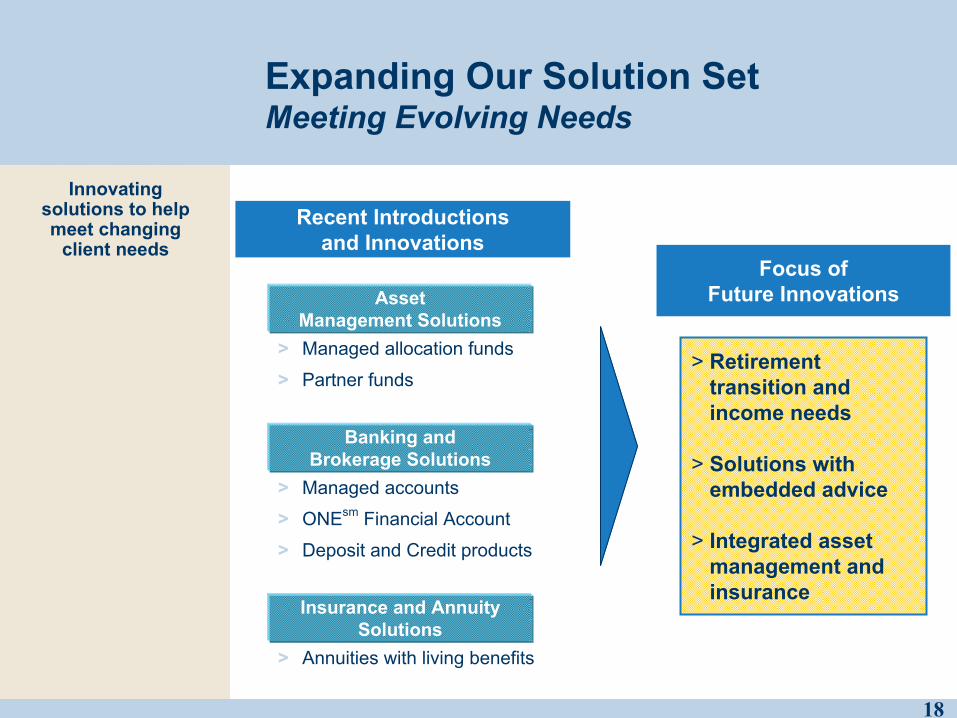
Expanding Our Solution SetMeeting Evolving Needs
Innovating solutions to help meet changing
client needsFocus of
Future Innovations
Recent Introductionsand Innovations
> Managed accounts
> ONEsm Financial Account
> Deposit and Credit products
> Annuities with living benefits
AssetManagement Solutions
Banking andBrokerage Solutions
Insurance and AnnuitySolutions
> Managed allocation funds
> Partner funds> Retirement
transition and income needs
> Solutions withembedded advice
> Integrated asset management and insurance
19
Product DistributionExpanding Our Reach
3rd Party Retail Distribution
Sub-Advisory
> Manage over $1.0 billion in sub-advisory mandates
> Annuity product sales through over 26 banks and broker-dealers in 2005
> Increased share in 15 of 17 accounts active in 2004
Institutional
> $22.9 billion in assets managed for Institutional clients in the U.S.2,3
> Alternative investment capabilities, e.g., CDOs, Hedge Funds
1 Source: CFO Magazine, April/May 20052 Excluding Institutional assets managed by
Threadneedle3 Managed assets includes all assets managed by
Ameriprise Financial, Inc., or its subsidiaries that are investment advisors, but does not include owned or administered assets. The presentation of managed assets may be different when provided by any of these subsidiaries.
Opportunity to grow scale and
leverage manufacturing
capabilities
Retirement Services
> Top 15 retirement services provider1
> FEPS – retail client acquisition
> IRA rollover opportunity
20
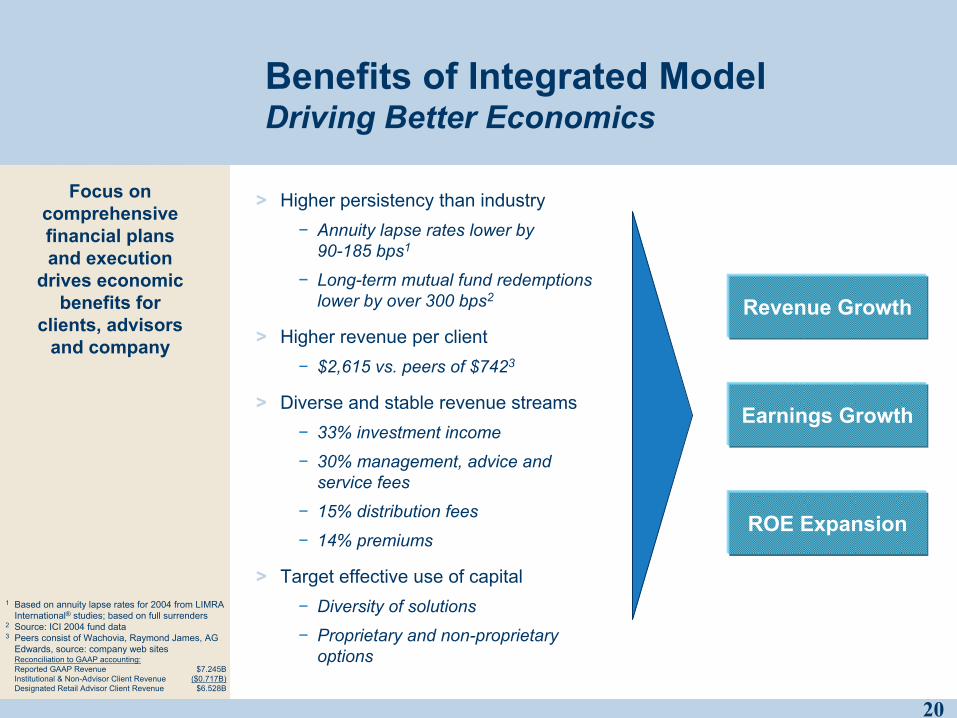
Benefits of Integrated ModelDriving Better Economics
Focus on comprehensive financial plans and execution
drives economic benefits for
clients, advisors and company
Earnings Growth
ROE Expansion
Revenue Growth
1 Based on annuity lapse rates for 2004 from LIMRA International® studies; based on full surrenders
2 Source: ICI 2004 fund data3 Peers consist of Wachovia, Raymond James, AG
Edwards, source: company web sitesReconciliation to GAAP accounting:Reported GAAP Revenue $7.245BInstitutional & Non-Advisor Client Revenue ($0.717B)Designated Retail Advisor Client Revenue $6.528B
> Higher persistency than industry− Annuity lapse rates lower by
90-185 bps1
− Long-term mutual fund redemptionslower by over 300 bps2
> Higher revenue per client − $2,615 vs. peers of $7423
> Diverse and stable revenue streams− 33% investment income
− 30% management, advice and service fees
− 15% distribution fees
− 14% premiums
> Target effective use of capital− Diversity of solutions
− Proprietary and non-proprietary options
21
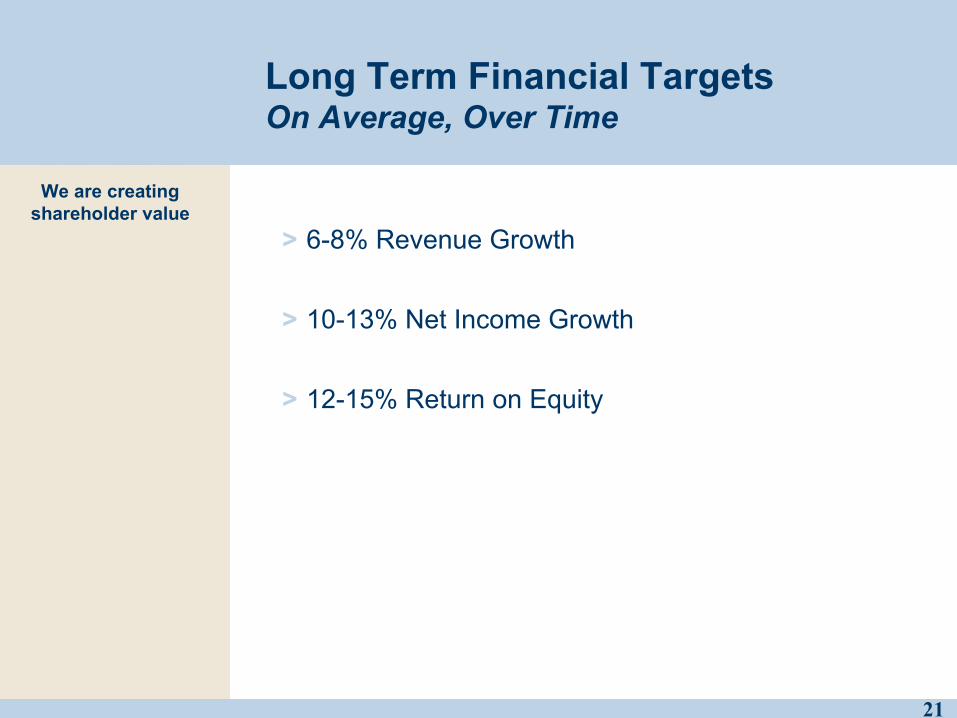
Long Term Financial TargetsOn Average, Over Time
We are creating shareholder value
> 6-8% Revenue Growth
> 10-13% Net Income Growth
> 12-15% Return on Equity
22
Financial Overview
> Walter S. BermanExecutive Vice President & Chief Financial Officer
23
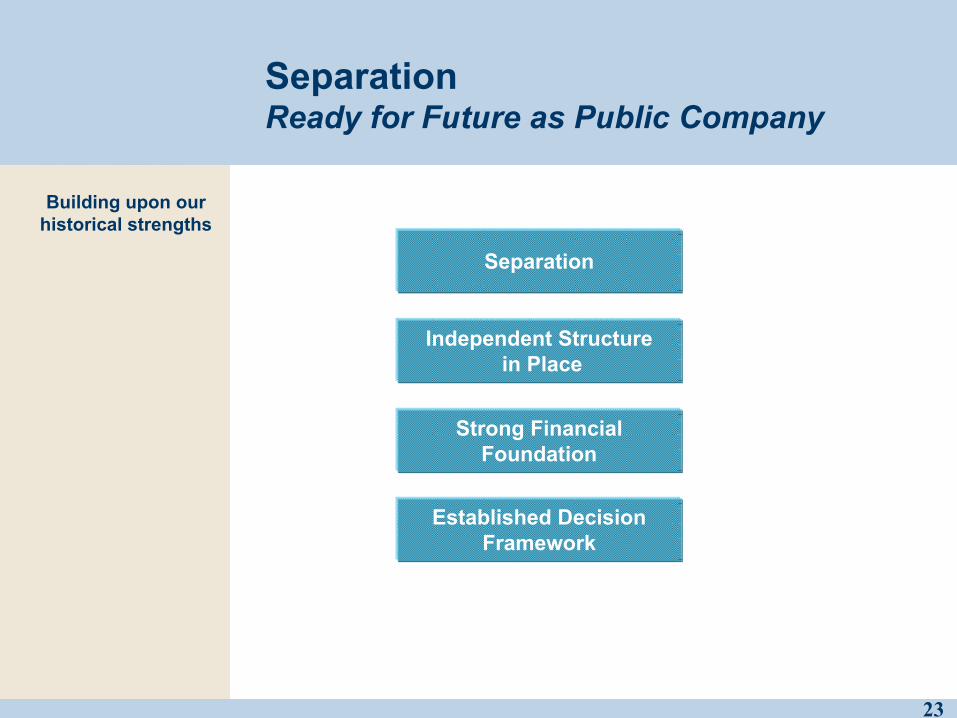
SeparationReady for Future as Public Company
Separation
Strong Financial Foundation
Independent Structurein Place
Established Decision Framework
Building upon our historical strengths
24
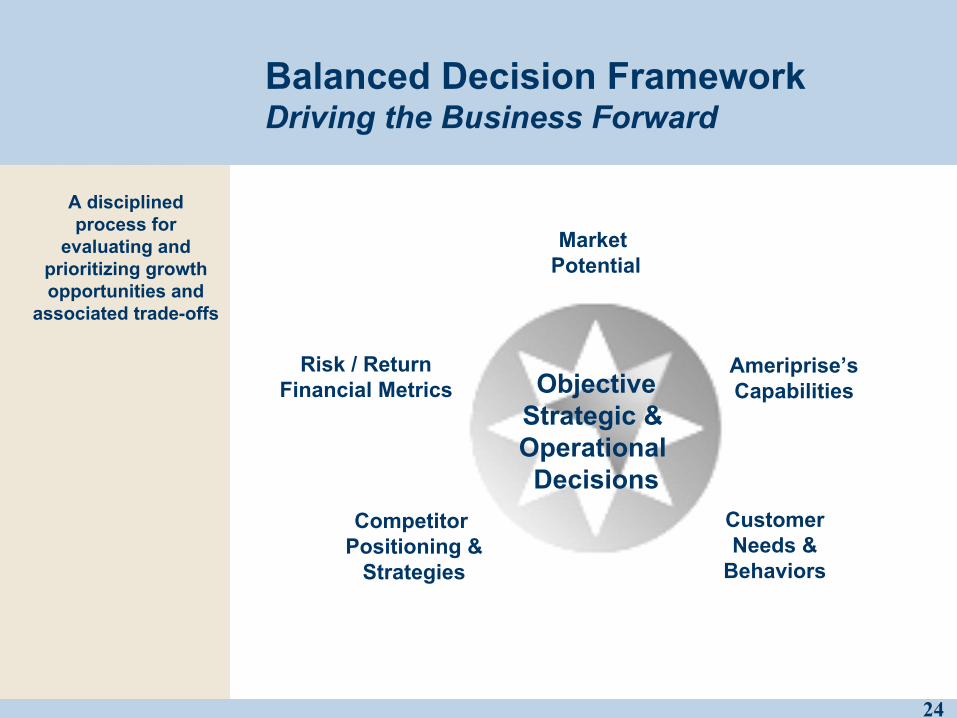
Market Potential
Balanced Decision FrameworkDriving the Business Forward
A disciplined process for
evaluating and prioritizing growth opportunities and
associated trade-offs
Risk / ReturnFinancial Metrics
Competitor Positioning &
Strategies
Ameriprise’sCapabilities
CustomerNeeds &
Behaviors
ObjectiveStrategic & Operational Decisions
25
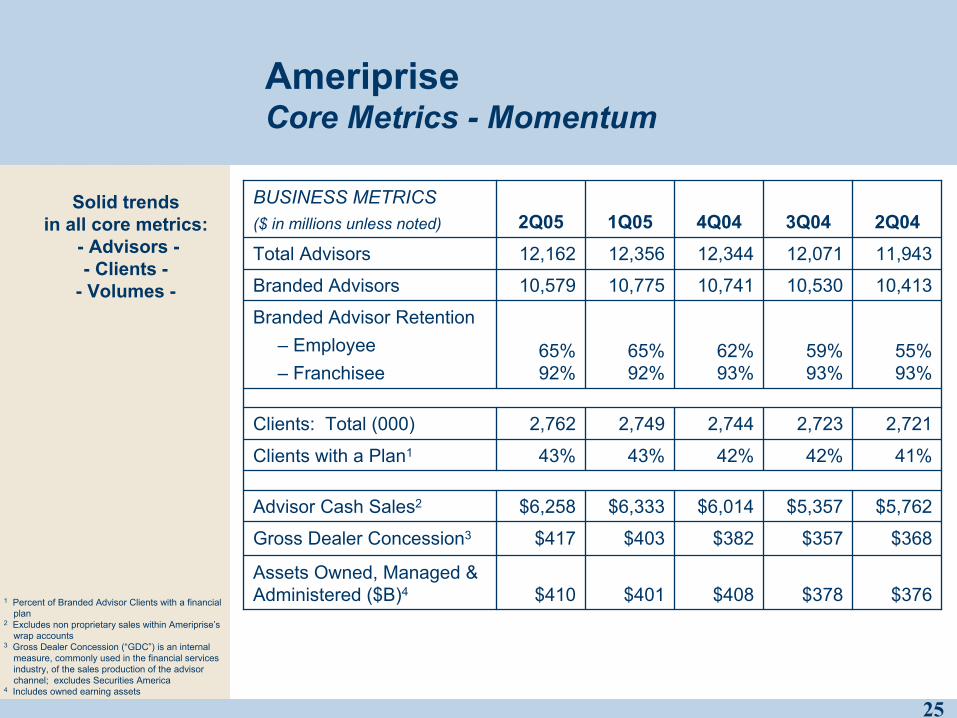
AmeripriseCore Metrics - Momentum
Solid trendsin all core metrics:
- Advisors -- Clients -
- Volumes -
$401
$403
$6,333
43%
2,749
65%92%
10,775
12,356
1Q05
$408
$382
$6,014
42%
2,744
62%93%
10,741
12,344
4Q04
$378
$357
$5,357
42%
2,723
59%93%
10,530
12,071
3Q04
$410
$417
$6,258
43%
2,762
65%92%
10,579
12,162
2Q05
55%93%
Branded Advisor Retention– Employee– Franchisee
$368Gross Dealer Concession3
11,943Total Advisors
$5,762Advisor Cash Sales2
2,721Clients: Total (000)
10,413Branded Advisors
41%Clients with a Plan1
$376Assets Owned, Managed & Administered ($B)4
2Q04BUSINESS METRICS($ in millions unless noted)
1 Percent of Branded Advisor Clients with a financial plan
2 Excludes non proprietary sales within Ameriprise’s wrap accounts
3 Gross Dealer Concession (“GDC”) is an internal measure, commonly used in the financial services industry, of the sales production of the advisor channel; excludes Securities America
4 Includes owned earning assets
26
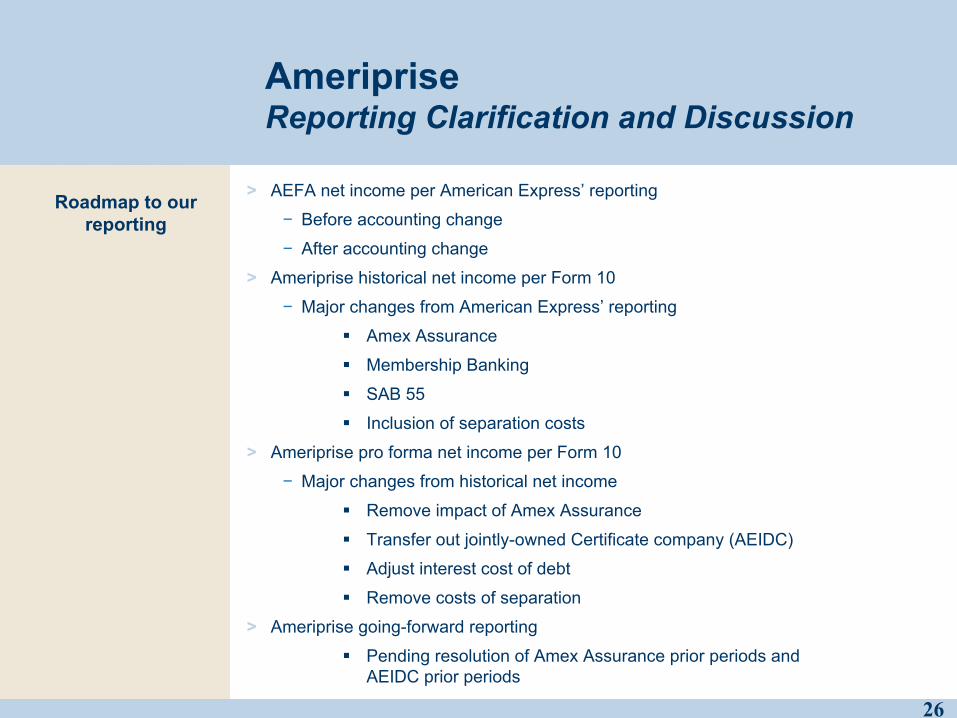
Ameriprise Reporting Clarification and Discussion
> AEFA net income per American Express’ reporting
− Before accounting change
− After accounting change
> Ameriprise historical net income per Form 10
− Major changes from American Express’ reporting
Amex Assurance
Membership Banking
SAB 55
Inclusion of separation costs
> Ameriprise pro forma net income per Form 10
− Major changes from historical net income
Remove impact of Amex Assurance
Transfer out jointly-owned Certificate company (AEIDC)
Adjust interest cost of debt
Remove costs of separation
> Ameriprise going-forward reporting
Pending resolution of Amex Assurance prior periods and AEIDC prior periods
Roadmap to our reporting
27
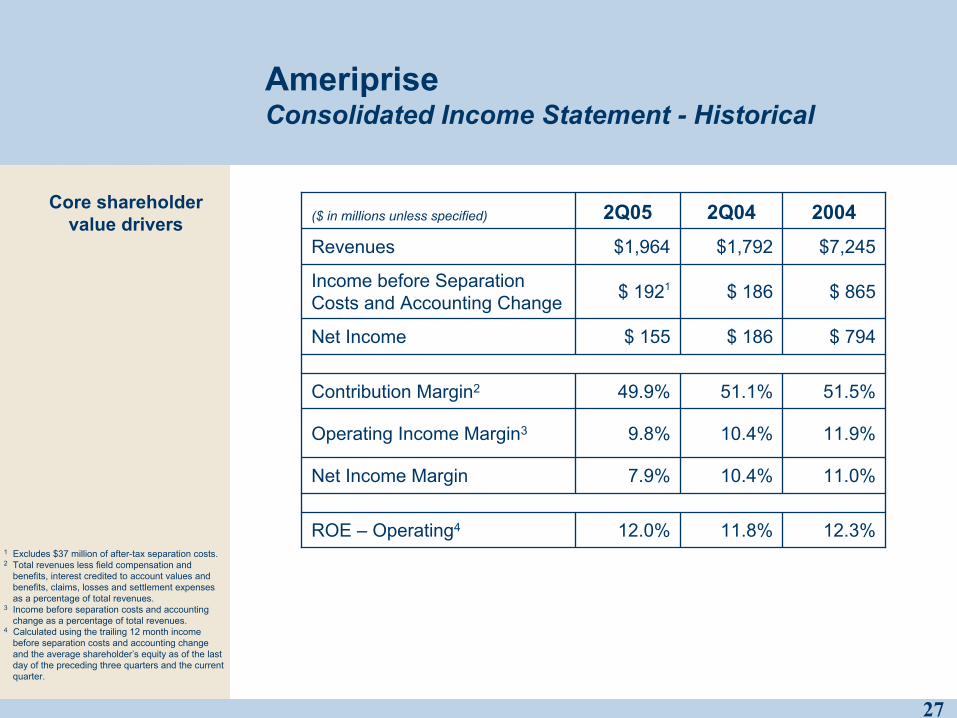
AmeripriseConsolidated Income Statement - Historical
51.5%51.1%49.9%Contribution Margin2
$ 794$ 186$ 155Net Income
$7,245$1,792$1,964Revenues
$ 865$ 186$ 1921Income before Separation Costs and Accounting Change
11.9%10.4%9.8%Operating Income Margin3
11.0%10.4%7.9%Net Income Margin
12.3%11.8%12.0%ROE – Operating4
20042Q042Q05($ in millions unless specified)
1 Excludes $37 million of after-tax separation costs.2 Total revenues less field compensation and
benefits, interest credited to account values and benefits, claims, losses and settlement expenses as a percentage of total revenues.
3 Income before separation costs and accounting change as a percentage of total revenues.
4 Calculated using the trailing 12 month income before separation costs and accounting change and the average shareholder’s equity as of the last day of the preceding three quarters and the current quarter.
Core shareholder value drivers
28
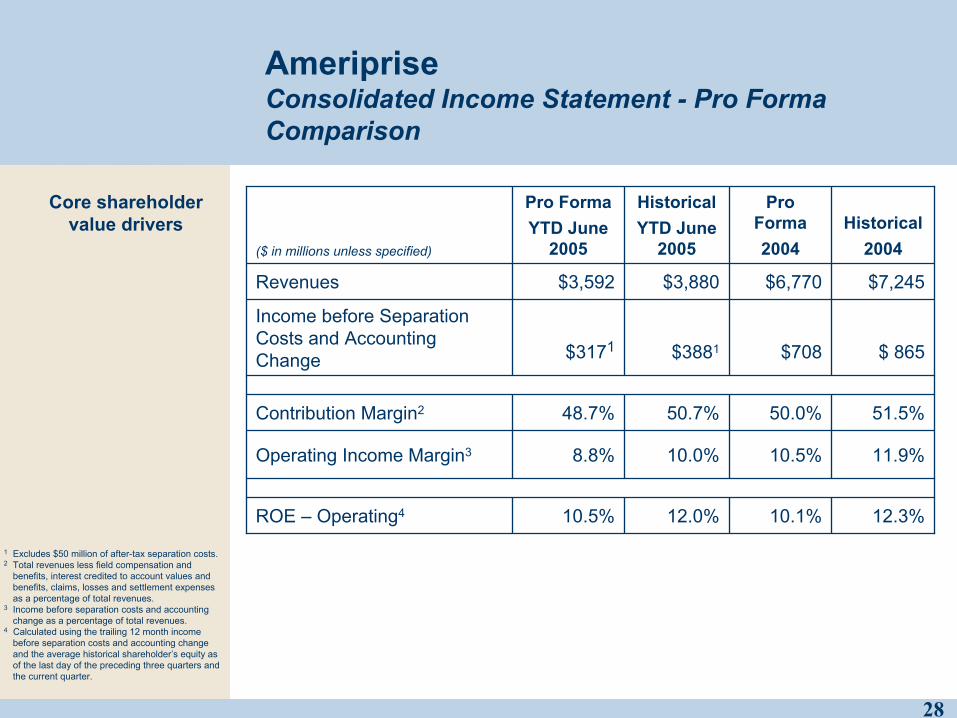
AmeripriseConsolidated Income Statement - Pro Forma Comparison
10.5%
8.8%
48.7%
$3171
$3,592
Pro FormaYTD June
2005
51.5%50.0%50.7%Contribution Margin2
$7,245$6,770$3,880Revenues
$ 865$708$3881
Income before Separation Costs and Accounting Change
11.9%10.5%10.0%Operating Income Margin3
12.3%10.1%12.0%ROE – Operating4
Historical2004
Pro Forma2004
HistoricalYTD June
2005($ in millions unless specified)
1 Excludes $50 million of after-tax separation costs.2 Total revenues less field compensation and
benefits, interest credited to account values and benefits, claims, losses and settlement expenses as a percentage of total revenues.
3 Income before separation costs and accounting change as a percentage of total revenues.
4 Calculated using the trailing 12 month income before separation costs and accounting change and the average historical shareholder’s equity as of the last day of the preceding three quarters and the current quarter.
Core shareholder value drivers
29
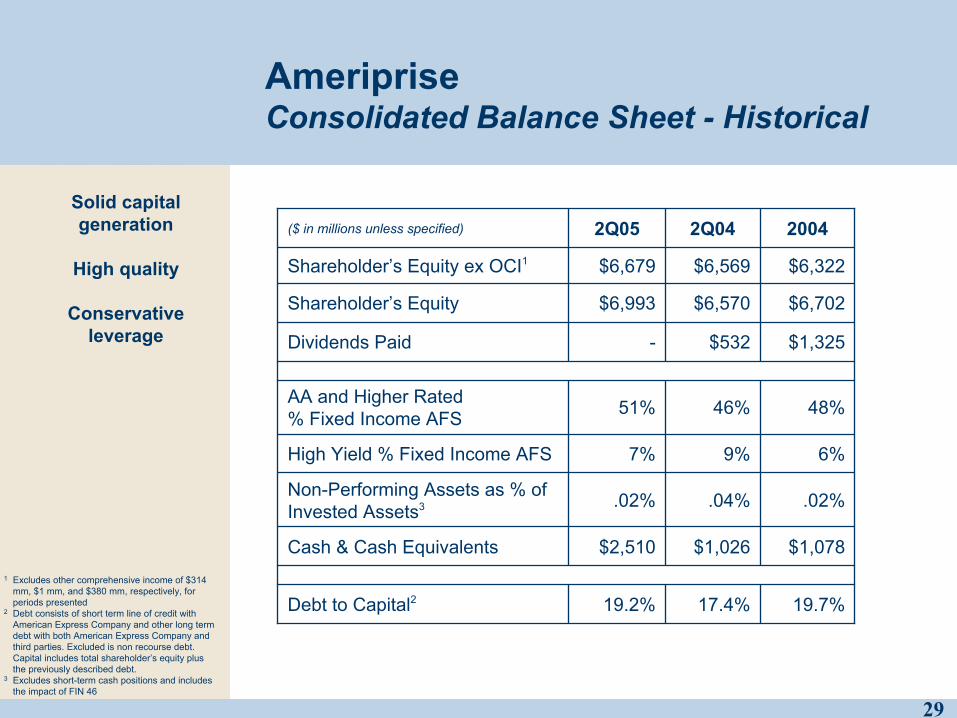
AmeripriseConsolidated Balance Sheet - Historical
6%9%7%High Yield % Fixed Income AFS
.02%.04%.02%Non-Performing Assets as % of Invested Assets3
$1,325$532-Dividends Paid
$6,702$6,570$6,993Shareholder’s Equity
$6,322$6,569$6,679Shareholder’s Equity ex OCI1
48%46%51%AA and Higher Rated% Fixed Income AFS
$1,078$1,026$2,510Cash & Cash Equivalents
19.7%17.4%19.2%Debt to Capital2
20042Q042Q05($ in millions unless specified)
Solid capital generation
High quality
Conservative leverage
1 Excludes other comprehensive income of $314 mm, $1 mm, and $380 mm, respectively, for periods presented
2 Debt consists of short term line of credit with American Express Company and other long term debt with both American Express Company and third parties. Excluded is non recourse debt. Capital includes total shareholder’s equity plus the previously described debt.
3 Excludes short-term cash positions and includes the impact of FIN 46
30
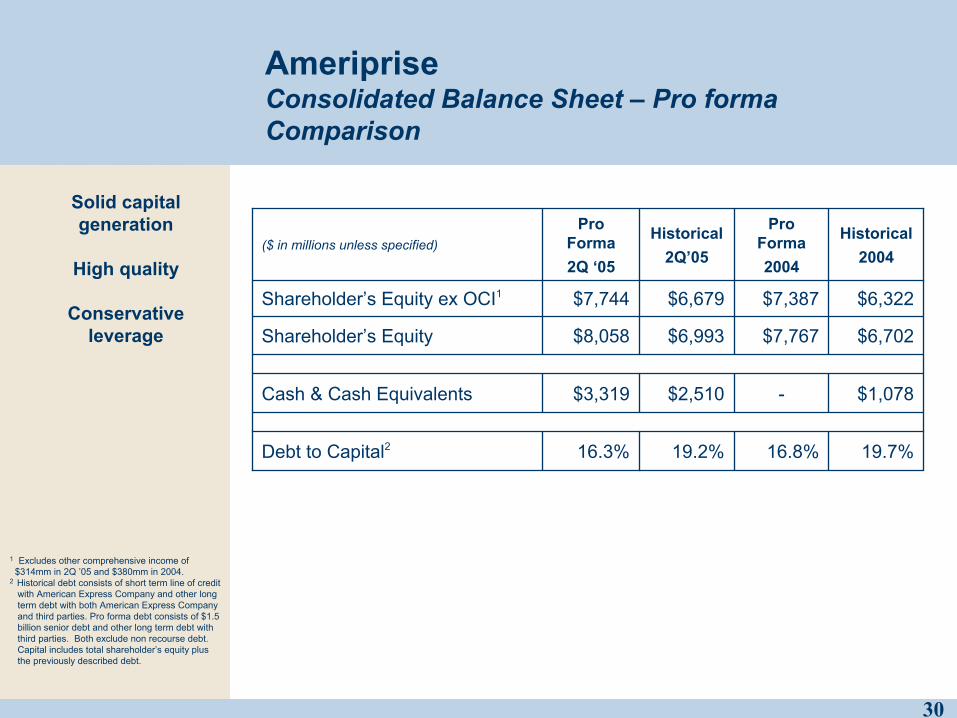
AmeripriseConsolidated Balance Sheet – Pro forma Comparison
19.2%
$2,510
$6,993
$6,679
Historical2Q’05
16.8%
-
$7,767
$7,387
Pro Forma2004
$6,702$8,058Shareholder’s Equity
$6,322$7,744Shareholder’s Equity ex OCI1
$1,078$3,319Cash & Cash Equivalents
19.7%16.3%Debt to Capital2
Historical2004
Pro Forma2Q ‘05
($ in millions unless specified)
Solid capital generation
High quality
Conservative leverage
1 Excludes other comprehensive income of$314mm in 2Q ’05 and $380mm in 2004.
2 Historical debt consists of short term line of creditwith American Express Company and other longterm debt with both American Express Companyand third parties. Pro forma debt consists of $1.5billion senior debt and other long term debt withthird parties. Both exclude non recourse debt.Capital includes total shareholder’s equity plusthe previously described debt.
31
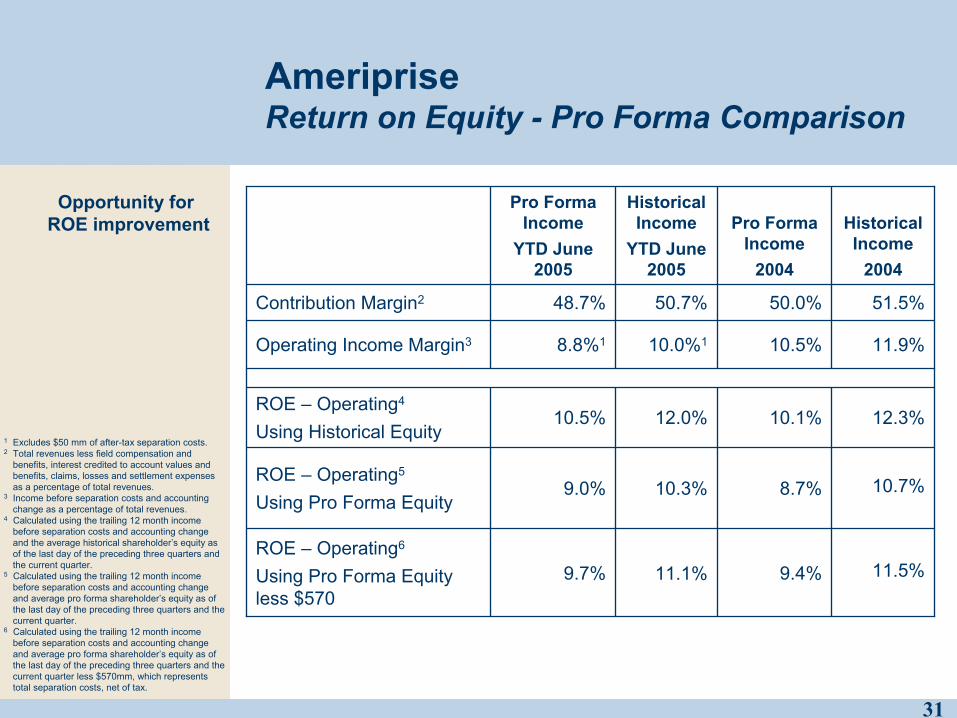
AmeripriseReturn on Equity - Pro Forma Comparison
11.5%9.4%11.1%9.7%ROE – Operating6
Using Pro Forma Equity less $570
10.7%8.7%10.3%9.0%ROE – Operating5
Using Pro Forma Equity
10.5%
8.8%1
48.7%
Pro FormaIncome
YTD June 2005
51.5%50.0%50.7%Contribution Margin2
11.9%10.5%10.0%1Operating Income Margin3
12.3%10.1%12.0%ROE – Operating4
Using Historical Equity
HistoricalIncome
2004
Pro FormaIncome
2004
HistoricalIncome
YTD June 2005
1 Excludes $50 mm of after-tax separation costs.2 Total revenues less field compensation and
benefits, interest credited to account values and benefits, claims, losses and settlement expenses as a percentage of total revenues.
3 Income before separation costs and accounting change as a percentage of total revenues.
4 Calculated using the trailing 12 month income before separation costs and accounting change and the average historical shareholder’s equity as of the last day of the preceding three quarters and the current quarter.
5 Calculated using the trailing 12 month income before separation costs and accounting change and average pro forma shareholder’s equity as of the last day of the preceding three quarters and the current quarter.
6 Calculated using the trailing 12 month income before separation costs and accounting change and average pro forma shareholder’s equity as of the last day of the preceding three quarters and the current quarter less $570mm, which represents total separation costs, net of tax.
Opportunity forROE improvement
32
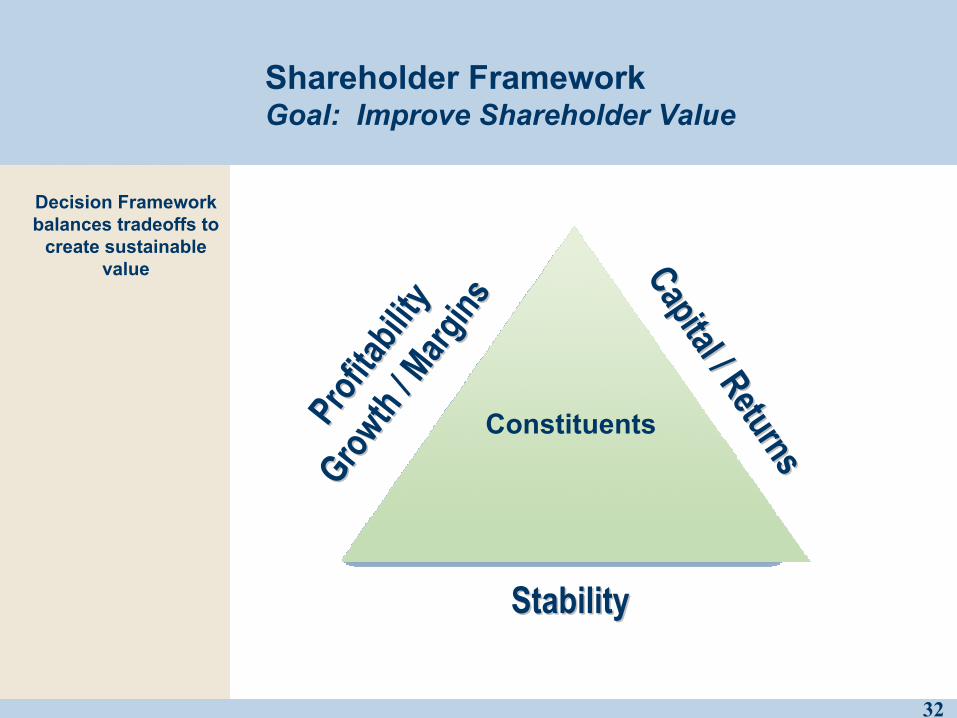
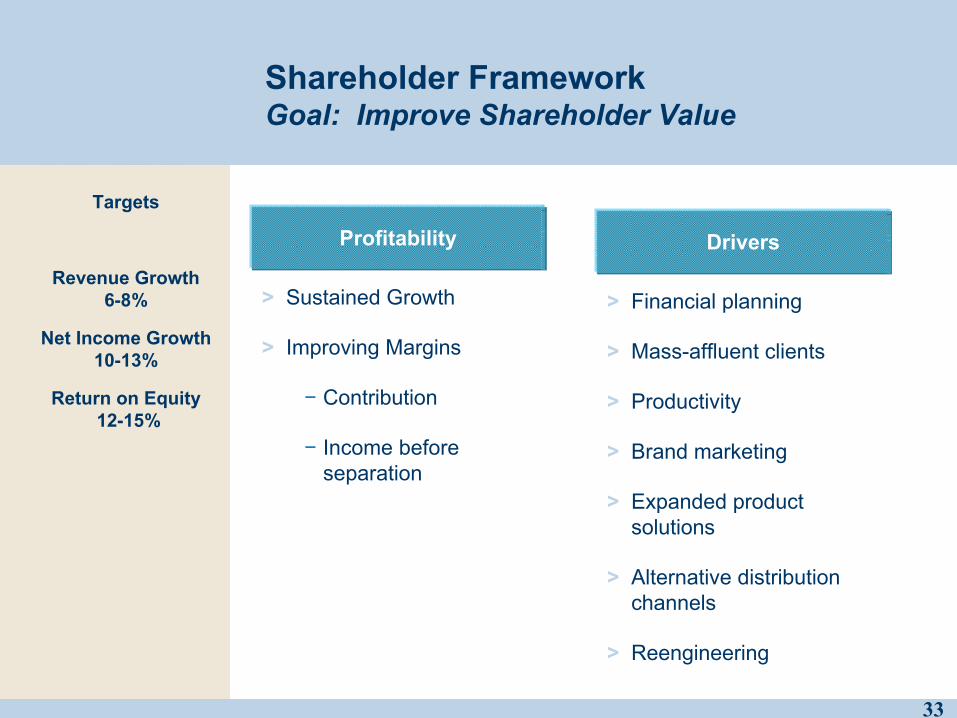
Shareholder FrameworkGoal: Improve Shareholder Value
Profita
bility
Profita
bility
Growth
/ Marg
ins
Growth
/ Marg
ins
Capital / Returns
Capital / Returns
StabilityStability
Constituents
Decision Framework balances tradeoffs to
create sustainable value
33
Shareholder FrameworkGoal: Improve Shareholder Value
Targets
Revenue Growth 6-8%
Net Income Growth 10-13%
Return on Equity12-15%
Profitability
> Sustained Growth
> Improving Margins
− Contribution
− Income before separation
Drivers
> Financial planning
> Mass-affluent clients
> Productivity
> Brand marketing
> Expanded product solutions
> Alternative distribution channels
> Reengineering
34
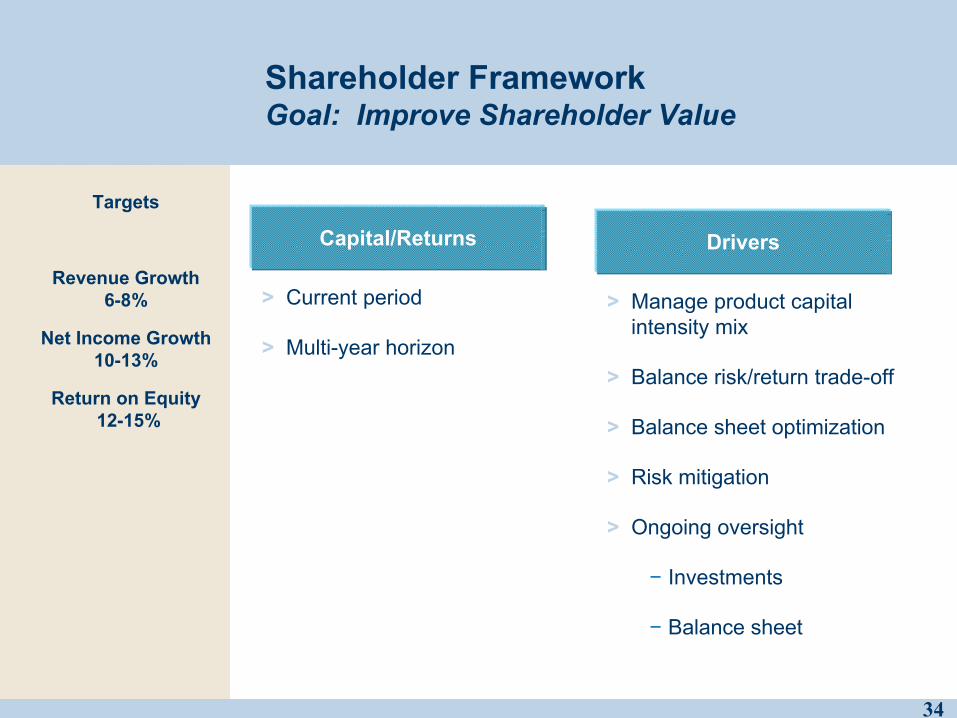
Shareholder FrameworkGoal: Improve Shareholder Value
Targets
Revenue Growth 6-8%
Net Income Growth 10-13%
Return on Equity12-15%
Capital/Returns
> Current period
> Multi-year horizon
Drivers
> Manage product capital intensity mix
> Balance risk/return trade-off
> Balance sheet optimization
> Risk mitigation
> Ongoing oversight
− Investments
− Balance sheet
35
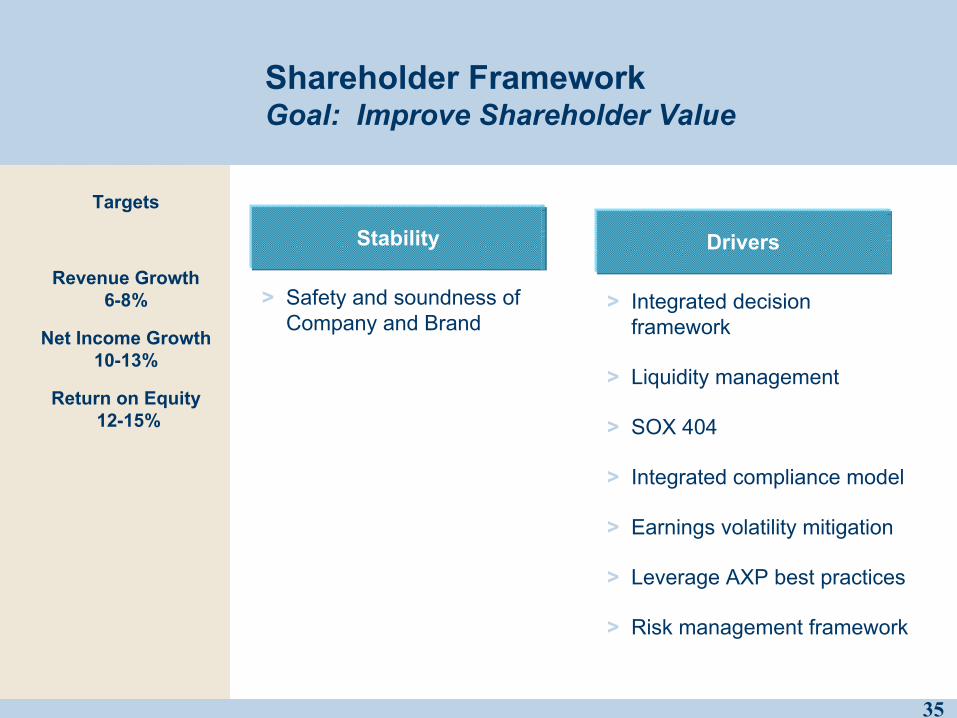
Shareholder FrameworkGoal: Improve Shareholder Value
Targets
Revenue Growth 6-8%
Net Income Growth 10-13%
Return on Equity12-15%
Stability
> Safety and soundness of Company and Brand
Drivers
> Integrated decision framework
> Liquidity management
> SOX 404
> Integrated compliance model
> Earnings volatility mitigation
> Leverage AXP best practices
> Risk management framework

36
Summary
> James M. CracchioloChairman & Chief Executive Officer
37
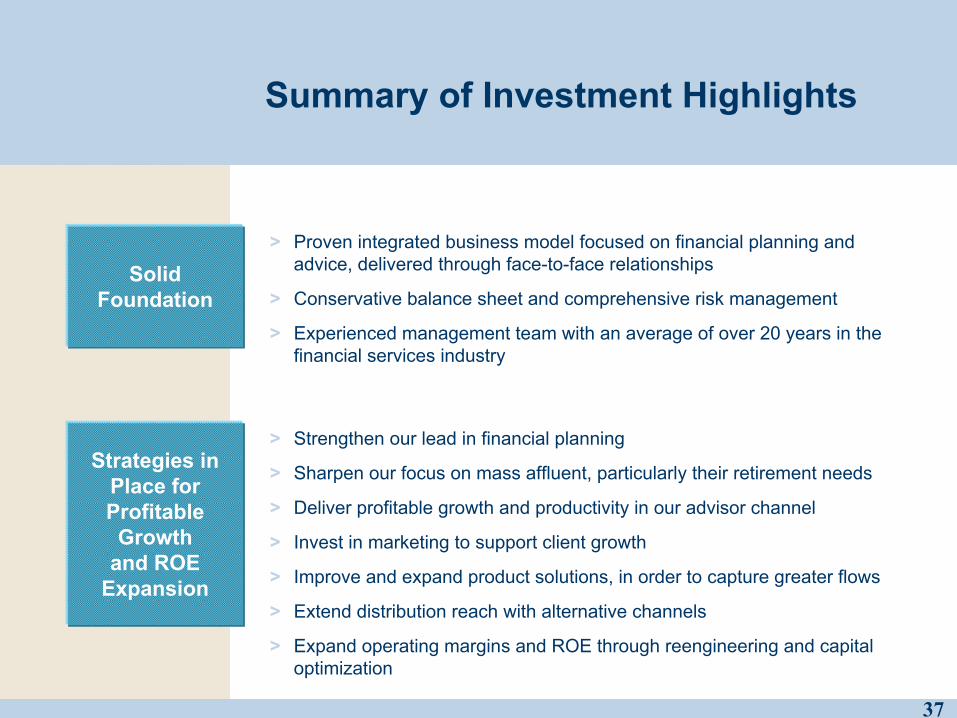
Summary of Investment Highlights
> Strengthen our lead in financial planning
> Sharpen our focus on mass affluent, particularly their retirement needs
> Deliver profitable growth and productivity in our advisor channel
> Invest in marketing to support client growth
> Improve and expand product solutions, in order to capture greater flows
> Extend distribution reach with alternative channels
> Expand operating margins and ROE through reengineering and capital optimization
Strategies in Place for Profitable Growth
and ROE Expansion
> Proven integrated business model focused on financial planning and advice, delivered through face-to-face relationships
> Conservative balance sheet and comprehensive risk management
> Experienced management team with an average of over 20 years in the financial services industry
Solid Foundation
38©2005 Ameriprise Financial, Inc. All rights reserved.
39
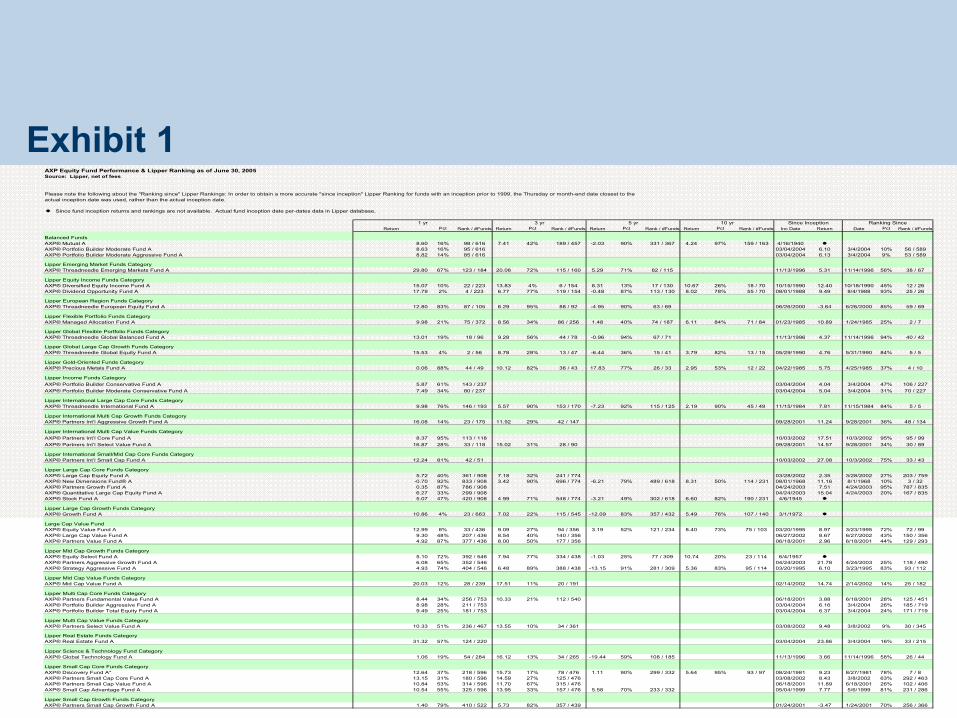
Exhibit 1AXP Equity Fund Performance & Lipper Ranking as of June 30, 2005Source: Lipper, net of fees
Please note the following about the "Ranking since" Lipper Rankings: In order to obtain a more accurate "since inception" Lipper Ranking for funds with an inception prior to 1999, the Thursday or month-end date closest to theactual inception date was used, rather than the actual inception date.
Since fund inception returns and rankings are not available. Actual fund inception date per-dates data in Lipper database.
Return Pct Rank / #Funds Return Pct Rank / #Funds Return Pct Rank / #Funds Return Pct Rank / #Funds Inc Date Return Date Pct Rank / #Funds
Balanced FundsAXP® Mutual A 8.60 16% 98 / 616 7.41 42% 189 / 457 -2.03 90% 331 / 367 4.24 97% 159 / 163 4/16/1940AXP® Portfolio Builder Moderate Fund A 8.63 16% 95 / 616 03/04/2004 6.10 3/4/2004 10% 56 / 589AXP® Portfolio Builder Moderate Aggressive Fund A 8.82 14% 85 / 616 03/04/2004 6.13 3/4/2004 9% 53 / 589
Lipper Emerging Market Funds CategoryAXP® Threadneedle Emerging Markets Fund A 29.80 67% 123 / 184 20.08 72% 115 / 160 5.29 71% 82 / 115 11/13/1996 5.31 11/14/1996 56% 38 / 67
Lipper Equity Income Funds CategoryAXP® Diversified Equity Income Fund A 15.07 10% 22 / 223 13.83 4% 6 / 154 8.31 13% 17 / 130 10.67 26% 18 / 70 10/15/1990 12.40 10/18/1990 45% 12 / 26AXP® Dividend Opportunity Fund A 17.79 2% 4 / 223 6.77 77% 119 / 154 -0.48 87% 113 / 130 8.02 78% 55 / 70 08/01/1988 9.49 8/4/1988 93% 25 / 26
Lipper European Region Funds CategoryAXP® Threadneedle European Equity Fund A 12.80 83% 87 / 105 6.29 95% 88 / 92 -4.95 90% 63 / 69 06/26/2000 -3.64 6/26/2000 85% 59 / 69
Lipper Flexible Portfolio Funds CategoryAXP® Managed Allocation Fund A 9.98 21% 75 / 372 8.56 34% 86 / 256 1.48 40% 74 / 187 6.11 84% 71 / 84 01/23/1985 10.89 1/24/1985 25% 2 / 7
Lipper Global Flexible Portfolio Funds CategoryAXP® Threadneedle Global Balanced Fund A 13.01 19% 18 / 96 9.28 56% 44 / 78 -0.96 94% 67 / 71 11/13/1996 4.37 11/14/1996 94% 40 / 42
Lipper Global Large Cap Growth Funds CategoryAXP® Threadneedle Global Equity Fund A 15.53 4% 2 / 56 8.78 28% 13 / 47 -6.44 36% 15 / 41 3.79 82% 13 / 15 05/29/1990 4.76 5/31/1990 84% 5 / 5
Lipper Gold-Oriented Funds CategoryAXP® Precious Metals Fund A 0.06 88% 44 / 49 10.12 82% 36 / 43 17.83 77% 26 / 33 2.95 53% 12 / 22 04/22/1985 5.75 4/25/1985 37% 4 / 10
Lipper Income Funds CategoryAXP® Portfolio Builder Conservative Fund A 5.87 61% 143 / 237 03/04/2004 4.04 3/4/2004 47% 106 / 227AXP® Portfolio Builder Moderate Conservative Fund A 7.49 34% 80 / 237 03/04/2004 5.04 3/4/2004 31% 70 / 227
Lipper International Large Cap Core Funds CategoryAXP® Threadneedle International Fund A 9.98 76% 146 / 193 5.57 90% 153 / 170 -7.23 92% 115 / 125 2.19 90% 45 / 49 11/15/1984 7.81 11/15/1984 84% 5 / 5
Lipper International Multi Cap Growth Funds CategoryAXP® Partners Int’l Aggressive Growth Fund A 16.08 14% 23 / 175 11.92 29% 42 / 147 09/28/2001 11.24 9/28/2001 36% 48 / 134
Lipper International Multi Cap Value Funds CategoryAXP® Partners Int’l Core Fund A 8.37 95% 113 / 118 10/03/2002 17.51 10/3/2002 95% 95 / 99AXP® Partners Int’l Select Value Fund A 16.87 28% 33 / 118 15.02 31% 28 / 90 09/28/2001 14.57 9/28/2001 34% 30 / 89
Lipper International Small/Mid Cap Core Funds CategoryAXP® Partners Int’l Small Cap Fund A 12.24 81% 42 / 51 10/03/2002 27.08 10/3/2002 75% 33 / 43
Lipper Large Cap Core Funds CategoryAXP® Large Cap Equity Fund A 5.72 40% 361 / 908 7.18 32% 241 / 774 03/28/2002 2.35 3/28/2002 27% 203 / 759AXP® New Dimensions Fund® A -0.70 92% 833 / 908 3.42 90% 696 / 774 -6.21 79% 489 / 618 8.31 50% 114 / 231 08/01/1968 11.16 8/1/1968 10% 3 / 32AXP® Partners Growth Fund A 0.35 87% 786 / 908 04/24/2003 7.51 4/24/2003 95% 787 / 835AXP® Quantitative Large Cap Equity Fund A 6.27 33% 299 / 908 04/24/2003 15.04 4/24/2003 20% 167 / 835AXP® Stock Fund A 5.07 47% 420 / 908 4.99 71% 548 / 774 -3.21 49% 302 / 618 6.60 82% 190 / 231 4/6/1945
Lipper Large Cap Growth Funds CategoryAXP® Growth Fund A 10.86 4% 23 / 663 7.02 22% 115 / 545 -12.09 83% 357 / 432 5.49 76% 107 / 140 3/1/1972
Large Cap Value FundAXP® Equity Value Fund A 12.99 8% 33 / 436 9.09 27% 94 / 356 3.19 52% 121 / 234 8.40 73% 75 / 103 03/20/1995 8.97 3/23/1995 72% 72 / 99AXP® Large Cap Value Fund A 9.30 48% 207 / 436 8.54 40% 140 / 356 06/27/2002 8.67 6/27/2002 43% 150 / 356AXP® Partners Value Fund A 4.92 87% 377 / 436 8.00 50% 177 / 356 06/18/2001 2.96 6/18/2001 44% 129 / 293
Lipper Mid Cap Growth Funds CategoryAXP® Equity Select Fund A 5.10 72% 392 / 546 7.94 77% 334 / 438 -1.03 25% 77 / 309 10.74 20% 23 / 114 6/4/1957AXP® Partners Aggressive Growth Fund A 6.08 65% 352 / 546 04/24/2003 21.78 4/24/2003 25% 118 / 490AXP® Strategy Aggressive Fund A 4.93 74% 404 / 546 6.48 89% 388 / 438 -13.15 91% 281 / 309 5.36 83% 95 / 114 03/20/1995 6.10 3/23/1995 83% 93 / 112
Lipper Mid Cap Value Funds CategoryAXP® Mid Cap Value Fund A 20.03 12% 28 / 239 17.51 11% 20 / 191 02/14/2002 14.74 2/14/2002 14% 25 / 182
Lipper Multi Cap Core Funds CategoryAXP® Partners Fundamental Value Fund A 8.44 34% 256 / 753 10.33 21% 112 / 540 06/18/2001 3.88 6/18/2001 28% 125 / 451AXP® Portfolio Builder Aggressive Fund A 8.98 28% 211 / 753 03/04/2004 6.16 3/4/2004 26% 185 / 719AXP® Portfolio Builder Total Equity Fund A 9.49 25% 181 / 753 03/04/2004 6.37 3/4/2004 24% 171 / 719
Lipper Multi Cap Value Funds CategoryAXP® Partners Select Value Fund A 10.33 51% 236 / 467 13.55 10% 34 / 361 03/08/2002 9.48 3/8/2002 9% 30 / 345
Lipper Real Estate Funds CategoryAXP® Real Estate Fund A 31.32 57% 124 / 220 03/04/2004 23.86 3/4/2004 16% 33 / 215
Lipper Science & Technology Fund CategoryAXP® Global Technology Fund A 1.06 19% 54 / 284 16.12 13% 34 / 265 -19.44 59% 108 / 185 11/13/1996 3.66 11/14/1996 58% 26 / 44
Lipper Small Cap Core Funds CategoryAXP® Discovery Fund A* 12.64 37% 218 / 596 15.73 17% 78 / 476 1.11 90% 299 / 332 5.64 95% 93 / 97 08/24/1981 9.23 8/27/1981 78% 7 / 8AXP® Partners Small Cap Core Fund A 13.15 31% 180 / 596 14.59 27% 125 / 476 03/08/2002 8.43 3/8/2002 63% 292 / 463AXP® Partners Small Cap Value Fund A 10.84 53% 314 / 596 11.70 67% 315 / 476 06/18/2001 11.89 6/18/2001 26% 102 / 406AXP® Small Cap Advantage Fund A 10.54 55% 325 / 596 13.95 33% 157 / 476 5.58 70% 233 / 332 05/04/1999 7.77 5/6/1999 81% 231 / 286
Lipper Small Cap Growth Funds CategoryAXP® Partners Small Cap Growth Fund A 1.40 79% 410 / 522 5.73 82% 357 / 439 01/24/2001 -3.47 1/24/2001 70% 256 / 366
Since Inception Ranking Since1 yr 3 yr 5 yr 10 yr
40
Exhibit 1
to the most recent month-end by visiting americanexpress.com.
Current performance may be lower or higher than the performance information shown. You may obtain performance information current
when redeemed, may be worth more or less than their original cost.
have been lower if the applicable sales charges were included. The value of your investment and returns will fluctuate so that your shares,
The performance information shown represents past performance and is not a guarantee of future results. Fund returns for all periods would
not been in place.
Fee waivers were in place for each American Express Partners Fund shown. Return would have been lower for each Fund had fee waivers
With minimum sales charge of 4.75%.
*Closed to new investors.
Source: Lipper as of 6/30/2005. Lipper rankings are based upon annualized total returns, excluding sales charges.
41
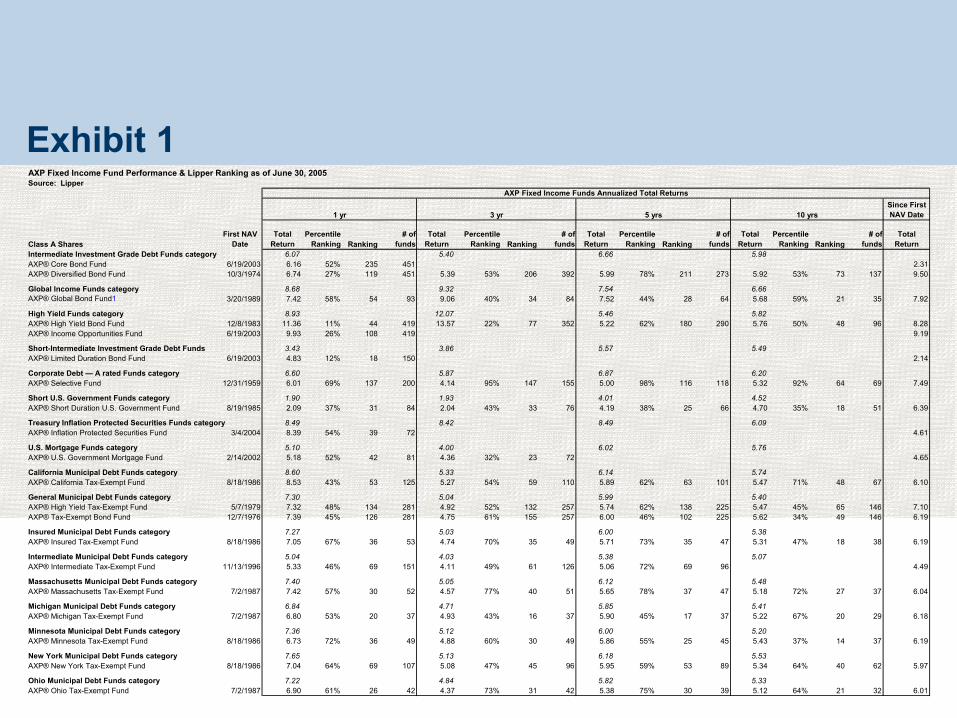
Exhibit 1AXP Fixed Income Fund Performance & Lipper Ranking as of June 30, 2005Source: Lipper
Since First NAV Date
Class A SharesFirst NAV
DateTotal
ReturnPercentile
Ranking Ranking# of
fundsTotal
ReturnPercentile
Ranking Ranking# of
fundsTotal
ReturnPercentile
Ranking Ranking# of
fundsTotal
ReturnPercentile
Ranking Ranking# of
fundsTotal
ReturnIntermediate Investment Grade Debt Funds category 6.07 5.40 6.66 5.98AXP® Core Bond Fund 6/19/2003 6.16 52% 235 451 2.31AXP® Diversified Bond Fund 10/3/1974 6.74 27% 119 451 5.39 53% 206 392 5.99 78% 211 273 5.92 53% 73 137 9.50
Global Income Funds category 8.68 9.32 7.54 6.66AXP® Global Bond Fund1 3/20/1989 7.42 58% 54 93 9.06 40% 34 84 7.52 44% 28 64 5.68 59% 21 35 7.92
High Yield Funds category 8.93 12.07 5.46 5.82AXP® High Yield Bond Fund 12/8/1983 11.36 11% 44 419 13.57 22% 77 352 5.22 62% 180 290 5.76 50% 48 96 8.28AXP® Income Opportunities Fund 6/19/2003 9.93 26% 108 419 9.19
Short-Intermediate Investment Grade Debt Funds 3.43 3.86 5.57 5.49AXP® Limited Duration Bond Fund 6/19/2003 4.83 12% 18 150 2.14
Corporate Debt — A rated Funds category 6.60 5.87 6.87 6.20AXP® Selective Fund 12/31/1959 6.01 69% 137 200 4.14 95% 147 155 5.00 98% 116 118 5.32 92% 64 69 7.49
Short U.S. Government Funds category 1.90 1.93 4.01 4.52AXP® Short Duration U.S. Government Fund 8/19/1985 2.09 37% 31 84 2.04 43% 33 76 4.19 38% 25 66 4.70 35% 18 51 6.39
Treasury Inflation Protected Securities Funds category 8.49 8.42 8.49 6.09AXP® Inflation Protected Securities Fund 3/4/2004 8.39 54% 39 72 4.61
U.S. Mortgage Funds category 5.10 4.00 6.02 5.76AXP® U.S. Government Mortgage Fund 2/14/2002 5.18 52% 42 81 4.36 32% 23 72 4.65
California Municipal Debt Funds category 8.60 5.33 6.14 5.74AXP® California Tax-Exempt Fund 8/18/1986 8.53 43% 53 125 5.27 54% 59 110 5.89 62% 63 101 5.47 71% 48 67 6.10
General Municipal Debt Funds category 7.30 5.04 5.99 5.40AXP® High Yield Tax-Exempt Fund 5/7/1979 7.32 48% 134 281 4.92 52% 132 257 5.74 62% 138 225 5.47 45% 65 146 7.10AXP® Tax-Exempt Bond Fund 12/7/1976 7.39 45% 126 281 4.75 61% 155 257 6.00 46% 102 225 5.62 34% 49 146 6.19
Insured Municipal Debt Funds category 7.27 5.03 6.00 5.38AXP® Insured Tax-Exempt Fund 8/18/1986 7.05 67% 36 53 4.74 70% 35 49 5.71 73% 35 47 5.31 47% 18 38 6.19
Intermediate Municipal Debt Funds category 5.04 4.03 5.38 5.07AXP® Intermediate Tax-Exempt Fund 11/13/1996 5.33 46% 69 151 4.11 49% 61 126 5.06 72% 69 96 4.49
Massachusetts Municipal Debt Funds category 7.40 5.05 6.12 5.48AXP® Massachusetts Tax-Exempt Fund 7/2/1987 7.42 57% 30 52 4.57 77% 40 51 5.65 78% 37 47 5.18 72% 27 37 6.04
Michigan Municipal Debt Funds category 6.84 4.71 5.85 5.41AXP® Michigan Tax-Exempt Fund 7/2/1987 6.80 53% 20 37 4.93 43% 16 37 5.90 45% 17 37 5.22 67% 20 29 6.18
Minnesota Municipal Debt Funds category 7.36 5.12 6.00 5.20AXP® Minnesota Tax-Exempt Fund 8/18/1986 6.73 72% 36 49 4.88 60% 30 49 5.86 55% 25 45 5.43 37% 14 37 6.19
New York Municipal Debt Funds category 7.65 5.13 6.18 5.53AXP® New York Tax-Exempt Fund 8/18/1986 7.04 64% 69 107 5.08 47% 45 96 5.95 59% 53 89 5.34 64% 40 62 5.97
Ohio Municipal Debt Funds category 7.22 4.84 5.82 5.33AXP® Ohio Tax-Exempt Fund 7/2/1987 6.90 61% 26 42 4.37 73% 31 42 5.38 75% 30 39 5.12 64% 21 32 6.01
AXP Fixed Income Funds Annualized Total Returns
1 yr 3 yr 5 yrs 10 yrs
42
Exhibit 1 Source: Lipper as of 6/30/2005. Lipper rankings are based upon annualized total returns, excluding sales charges.
With minimum sales charge of 4.75%.The performance information shown represents past performance and is not a guarantee of future results. Fundreturns for all periods would have been lower if the applicable sales charges were included. The value of yourinvestment and returns will fluctuate so that your shares, when redeemed, may be worth more or less than theiroriginal cost.
Current performance may be lower or higher than the performance information shown. You may obtain performanceinformation current to the most recent month-end by visiting americanexpress.com
43
Exhibit 1Important Disclosures
> You should consider the investment objectives, risks, charges and expenses of mutual funds carefully before investing. For a free prospectus, which contains this and other important information about our funds, call (800) AXP-FUND, TTY: (800) 846-4852. Read the prospectus carefully before you invest.
> An investment in money market funds is not insured or guaranteed by the Federal Deposit Insurance Corporation or any other government agency. Although these funds seek to preserve the value of your investment at $1.00 per share, it is possible to lose money by investing in these funds.
> Stocks of small- and mid-capitalization companies involve substantial risk. Historically, these stocks have experienced greater price volatility than stocks of larger companies, and they can be expected to do so in the future. Stocks of mid-capitalization may be slightly less volatile than those of small-capitalization companies but still involve substantial risk.
> The investment process used to manage the AXP Quantitative Large Cap Equity Fund employs new technologies and statistical methods that have not previously been used to manage open-end mutual funds. Shareholders should be prepared for the possibility that the Fund may underperform its benchmark. While Ameriprise Financial, Inc. seeks to control trading activity, the Fund may trade more often that other funds in its peer group. Trading activity may result in increased fees, expenses and taxes.
> International investing involves increased risk and volatility, not typically associated with domestic investing, due to changes in currency exchange rates, foreign government regulations, differences in auditing and accounting standards, potential political and economic instability, limited liquidity and volatile prices. The risks of international investing are particularly significant in emerging markets.
> The AXP Global Technology Fund is a narrowly focused sector fund and it may exhibit higher volatility than funds with broader investment objectives.
> The AXP Real Estate Fund is a narrowly focused sector fund and it may exhibit higher volatility than funds with broader investment objectives. An investment in a real estate fund is subject to the same risks as a direct investment in real estate. Such risks include market risk, economic risk and mortgage rate risk.
> The AXP Precious Metals Fund is a narrowly focused sector fund and it may exhibit higher volatility than funds with broader investment objectives.
> There are risks associated with an investment in a bond fund, including the impact of interest rates, credit and inflation. These and other risk considerations are discussed in the fund’s prospectus. In general, bond prices rise when interest rates fall and vice versa. This effect is usually more pronounced for longer-term securities.
> High-yield funds invest in lower-rated bonds, which generally have more volatile prices and carry more risk to principal and income than investment grade securities.
> Income from tax-exempt funds may be subject to state and local taxes, and a portion of income may be subject to the federal and/or state alternative minimum tax for certain investors. Federal income tax rules will apply to any capital gains distribution.
> Shares of the AXP Short Duration U.S. Government Fund and the AXP U.S. Government Mortgage Fund are not insured or guaranteed by the U.S. government.
> Principal risks associated with the AXP Inflation Protected Securities Fund include style risk, interest rate risk, market risk, credit risk, liquidity risk and sector/concentration risk. Treasury Inflation Protected Securities (TIPS) are backed by the full faith and credit of the U.S. government. The U.S. government guarantee applies only to the underlying TIPS securities, and not the Fund itself.
> “Standard & Poor's®,” “S&P,” “S&P 500®,” and “Standard & Poor’s 500®” are trademarks of the McGraw-Hill Companies, Inc. These trademarks and service marks have been licensed for use by Ameriprise Financial Services, Inc. The Funds are not sponsored, endorsed, sold or promoted by Standard & Poor’s or any of their subsidiaries or affiliates (the “Licensors”), and the Licensors make no representation regarding the advisability of investing in the Funds.
> Ameriprise Financial Services, Inc., Member NASD