america’s aging workforce: opportunities and challenges workforce report... · america’s aging...
TRANSCRIPT
America’s Aging Workforce:
Opportunities and Challenges
Special Committee on Aging
United States Senate
Senator Susan M. Collins (R-ME), Chairman
Senator Robert P. Casey, Jr. (D-PA), Ranking Member
December 2017
2
Senate Special Committee on Aging
SUSAN M. COLLINS, Maine ROBERT P. CASEY, Jr., Pennsylvania
ORRIN HATCH, Utah BILL NELSON, Florida
JEFF FLAKE, Arizona SHELDON WHITEHOUSE, Rhode Island
TIM SCOTT, South Carolina KIRSTEN GILLIBRAND, New York
THOM TILLIS, North Carolina RICHARD BLUMENTHAL, Connecticut
BOB CORKER, Tennessee JOE DONNELLY, Indiana
RICHARD BURR, North Carolina ELIZABETH WARREN, Massachusetts
MARCO RUBIO, Florida CATHERINE CORTEZ MASTO, Nevada
DEB FISCHER, Nebraska
Kevin Kelley, Majority Staff Director
Kate Mevis, Minority Staff Director
3
EXECUTIVE SUMMARY
From small towns in rural America to the country’s bustling metropolitan centers, older
Americans are playing an ever-growing role in shaping the nation’s economy through work.
Whether they work on farms growing produce, in office buildings developing new technologies,
or in hardware stores ringing up customers, aging Americans are a critical and expanding share
of the nation’s workforce every day. With advances in public health and medicine, Americans are
living longer and working longer, resulting in an unprecedented transformation of the workplace.
The number of Americans over age 55 in the labor force is projected to increase from 35.7
million in 2016 to 42.1 million in 2026, and, by 2026, aging workers will make up nearly one
quarter of the labor force. These significant changes will present tremendous opportunities and
challenges.
For the 55-year-old paper mill worker in Maine who worked from dusk until dawn every
day for the past thirty years at a plant that just closed, training for a new career is a daunting task.
For the 62-year-old office manager in North Carolina who has become the primary caregiver to a
husband living with Alzheimer’s disease, staying at work while caring for an ailing loved one
may be unmanageable. For the 57-year-old nurse in Pennsylvania with chronic back pain after a
lifetime of physically demanding work, just staying on the job to pay the bills and cover the
mortgage can be overwhelming. As the number of older workers steadily grows, so too will the
number of aging Americans confronting challenges like these day in and day out.
At work, older Americans are productive. They can offer employers exemplary skills and
experience as well as an exceptional work ethic. The business case for hiring, retaining, and
supporting older workers is strong. Leading employers have taken it upon themselves to institute
policies and practices to harness the strengths of aging workers. From providing employees with
ergonomic office equipment and assistive technologies to establishing inter-generational training
programs, family caregiver support initiatives, and flexible paths towards retirement, large and
small employers who recognize and value the talent of aging workers are taking steps to respond
to one of the fastest growing demographic groups at work, older adults.
The United States Senate Special Committee on Aging is committed to understanding,
embracing, and addressing the opportunities and challenges facing older workers. The
Committee seeks to ensure that older workers are able to thrive at work and adequately prepare
for retirement. This report provides a summary of the landscape of the aging workforce and key
findings related to aging workers as well as employers. The report concludes with a vision of
how aging employees and their employers can work together to ensure that they both prosper.
KEY FINDINGS
The number of older workers is growing at a rate that outpaces the overall growth of
the labor force. In 2000, 12.5 percent of those over 65 were working; by 2016, that share
had increased to 18.6 percent. Moreover, while the labor force as a whole is projected to
grow by an average of just 0.6 percent per year between 2016 and 2026, the number of
4
workers ages 65 to 74 is projected to grow by 4.2 percent annually and the number of
workers ages 75 and above by 6.7 percent annually.
Older workers take increasingly diverse paths to retirement. Fewer older workers
are transitioning directly from full-time work to full-time retirement. Many workers
transition to part-time positions with their current employer or a new one, while
others become self-employed.
Current challenges make it more difficult for older workers to thrive in the workplace. Age discrimination, inadequate training opportunities, working while managing health
conditions and disabilities, balancing caregiving responsibilities with work, and preparing
financially for retirement are among the main challenges facing an aging workforce.
The business case for age-friendly workplaces is strong. Hiring and retaining older
workers can help employers retain valuable skills, address workforce shortages, and increase
workplace diversity, which can contribute to improved outcomes.
Most employers acknowledge the trend of the aging workforce; few are taking action. While 80 percent of employers say they are supportive of employees who plan to work past
the age of 65, only 39 percent offer flexible scheduling options and only 31 percent facilitate
processes for moving from full-time to part-time roles.
A growing group of aging workers are caregivers and some employers are
implementing strategies to support them. One out of every four employees over the age of
50 serves as a family caregiver. Employers find that helping these employees balance their
work and caregiving roles without sacrificing their personal financial security can reduce
some employer costs as well and may attract talent.
Many older workers are struggling to prepare financially for retirement. Roughly one-
third of workers do not have access to a retirement plan at work, and many aging workers
have not saved enough for retirement and may continue to work beyond when they intended
to retire out of financial need.
Work is linked with improved health and well-being. For many aging Americans, work
provides a sense of purpose. Research consistently links work with improved physical,
emotional, and cognitive health, financial stability and security, and quality of life.
The Senate Aging Committee aims to support the needs of aging Americans, and with this
report, seeks to help aging workers and their families achieve the personal and professional goals
they set for themselves.
5
Chapter 1: The Aging American Labor Force
America’s labor force is aging. The number of persons working past the age of 55 is at a historic
high, and with 10,000 baby boomers turning 65 every day, understanding the implications of the
growth and diversification of the aging labor force is becoming increasingly important.1 In 2000,
12.5 percent of those over 65 were working; by 2016, that share had increased to 18.6 percent.2
According to the Bureau of Labor Statistics, the number of individuals ages 55 and above in the
labor force will grow from 35.7 million in 2016 to 42.1 million in 2026.3 While in 2006 workers
ages 55 and over represented just 16.8 percent of the American labor force, in 2016 they made
up 22.4 percent and by 2026 that number will rise to 24.8 percent, accounting for nearly one out
of four American workers.
Older workers are shaping the American labor force. While the number of individuals under age
35 in the labor force remained almost unchanged between 1996 and 2016, the number of persons
in the labor force ages 55 and above grew by 124 percent.4 These trends are expected to
continue, with the fastest growth expected among the older groups of American workers. While
the labor force as a whole is projected to grow by an average of just 0.6 percent per year between
2016 and 2026, the number of workers ages 65 to 74 is projected to grow by 4.2 percent
annually, and the number of workers ages 75 and above by 6.7 percent annually.5
This transformation of the American labor force is unprecedented and presents unique
opportunities and challenges. The changing face of the average American worker will shape
preferences about work and retirement, practices implemented by employers, the composition of
the economy, and the direction of public policy. Decisions made by employers and policy makers
in response to the aging of the labor force will have significant implications for all American
workers.
In this chapter, we provide detailed information about the current and future status of America’s
older workers. Among the key takeaways:
Older workers’ labor force participation has increased in recent decades, and this trend
of increasing participation is expected to continue in the near term.
The largest changes in the labor force participation of older workers occur between the
ages of 60 and 70, as many workers retire or move to part-time work.
The transition from work into retirement has become increasingly varied as older
workers choose to move from full-time work into bridge jobs, second careers, and
encore careers, or decide to become self-employed.
1 See, for instance, Pew Research Center, Baby Boomers Retire, Fact Tank: News in the Numbers, Washington, DC, December 29, 2009,
http://www.pewresearch.org/fact-tank/2010/12/29/baby-boomers-retire/.
2 Bureau of Labor Statistics, Current Population Survey data from 2000 and 2016, at https://www.bls.gov/cps/. 3 Bureau of Labor Statistics (BLS) publishes 10-year labor force and employment projections every other year; the most current projections were
published in October 2017. Estimates are available at BLS, Employment Projections: Civilian labor force by age, sex, race, and ethnicity,
https://www.bls.gov/emp/tables.htm, and details on the BLS projections methodology are available at BLS, Employment Projections: Projections
Methodology, https://www.bls.gov/emp/ep_projections_methods.htm. 4 Authors’ calculations using BLS 10-year labor force projections, available at BLS, Employment Projections: Civilian labor force by age, sex,
race, and ethnicity, https://www.bls.gov/emp/ep_table_303.htm. 5 The number of workers ages 55 to 64 is projected to grow by an average of 0.4 percent per year between 2016 and 2026. Available at BLS,
Employment Projections: Civilian labor force by age, sex, race, and ethnicity, https://www.bls.gov/emp/ep_table_304.htm.
6
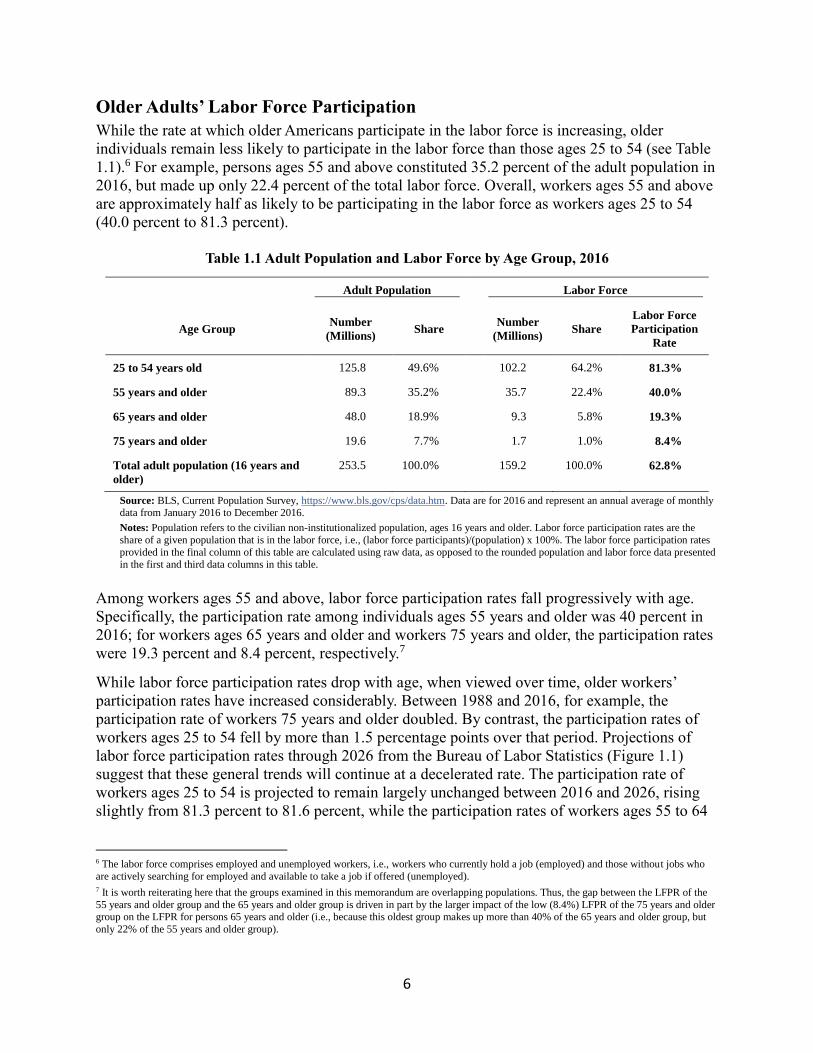
Older Adults’ Labor Force Participation
While the rate at which older Americans participate in the labor force is increasing, older
individuals remain less likely to participate in the labor force than those ages 25 to 54 (see Table
1.1).6 For example, persons ages 55 and above constituted 35.2 percent of the adult population in
2016, but made up only 22.4 percent of the total labor force. Overall, workers ages 55 and above
are approximately half as likely to be participating in the labor force as workers ages 25 to 54
(40.0 percent to 81.3 percent).
Table 1.1 Adult Population and Labor Force by Age Group, 2016
Adult Population Labor Force
Age Group Number
(Millions) Share
Number
(Millions) Share
Labor Force
Participation
Rate
25 to 54 years old 125.8 49.6% 102.2 64.2% 81.3%
55 years and older 89.3 35.2% 35.7 22.4% 40.0%
65 years and older 48.0 18.9% 9.3 5.8% 19.3%
75 years and older 19.6 7.7% 1.7 1.0% 8.4%
Total adult population (16 years and
older)
253.5 100.0% 159.2 100.0% 62.8%
Source: BLS, Current Population Survey, https://www.bls.gov/cps/data.htm. Data are for 2016 and represent an annual average of monthly data from January 2016 to December 2016.
Notes: Population refers to the civilian non-institutionalized population, ages 16 years and older. Labor force participation rates are the
share of a given population that is in the labor force, i.e., (labor force participants)/(population) x 100%. The labor force participation rates
provided in the final column of this table are calculated using raw data, as opposed to the rounded population and labor force data presented in the first and third data columns in this table.
Among workers ages 55 and above, labor force participation rates fall progressively with age.
Specifically, the participation rate among individuals ages 55 years and older was 40 percent in
2016; for workers ages 65 years and older and workers 75 years and older, the participation rates
were 19.3 percent and 8.4 percent, respectively.7
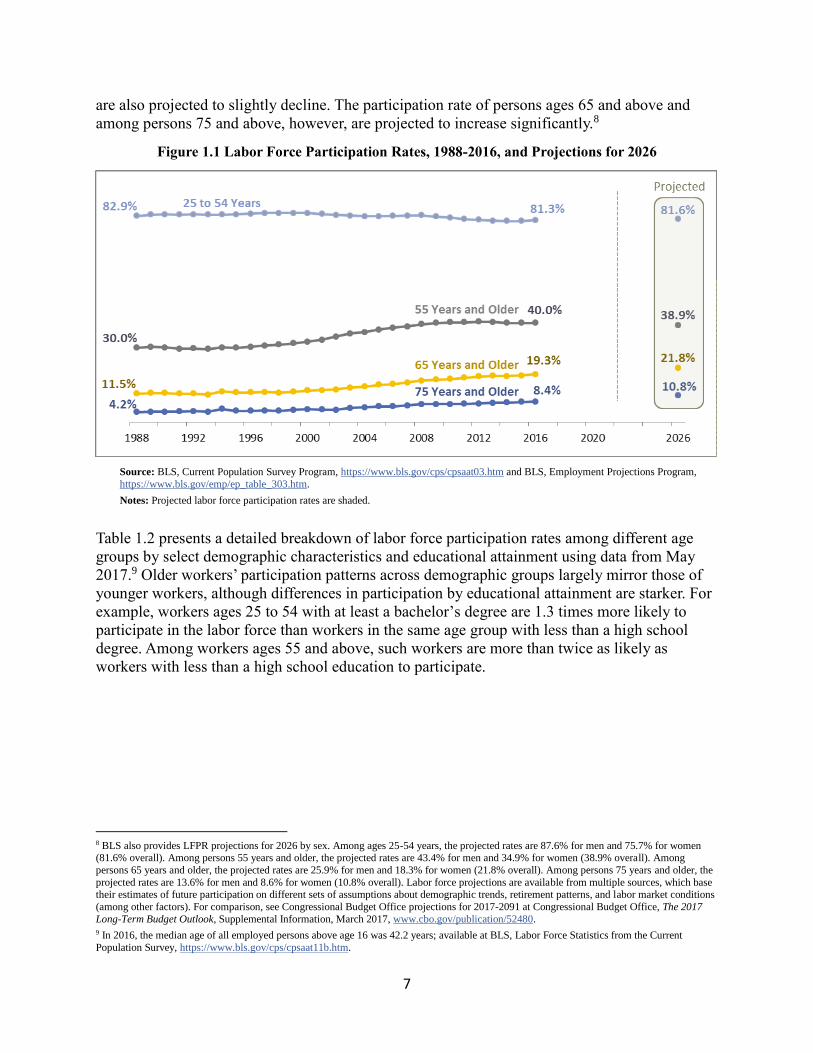
While labor force participation rates drop with age, when viewed over time, older workers’
participation rates have increased considerably. Between 1988 and 2016, for example, the
participation rate of workers 75 years and older doubled. By contrast, the participation rates of
workers ages 25 to 54 fell by more than 1.5 percentage points over that period. Projections of
labor force participation rates through 2026 from the Bureau of Labor Statistics (Figure 1.1)
suggest that these general trends will continue at a decelerated rate. The participation rate of
workers ages 25 to 54 is projected to remain largely unchanged between 2016 and 2026, rising
slightly from 81.3 percent to 81.6 percent, while the participation rates of workers ages 55 to 64
6 The labor force comprises employed and unemployed workers, i.e., workers who currently hold a job (employed) and those without jobs who
are actively searching for employed and available to take a job if offered (unemployed). 7 It is worth reiterating here that the groups examined in this memorandum are overlapping populations. Thus, the gap between the LFPR of the
55 years and older group and the 65 years and older group is driven in part by the larger impact of the low (8.4%) LFPR of the 75 years and older group on the LFPR for persons 65 years and older (i.e., because this oldest group makes up more than 40% of the 65 years and older group, but
only 22% of the 55 years and older group).
7
are also projected to slightly decline. The participation rate of persons ages 65 and above and
among persons 75 and above, however, are projected to increase significantly.8
Figure 1.1 Labor Force Participation Rates, 1988-2016, and Projections for 2026
Source: BLS, Current Population Survey Program, https://www.bls.gov/cps/cpsaat03.htm and BLS, Employment Projections Program,
https://www.bls.gov/emp/ep_table_303.htm.
Notes: Projected labor force participation rates are shaded.
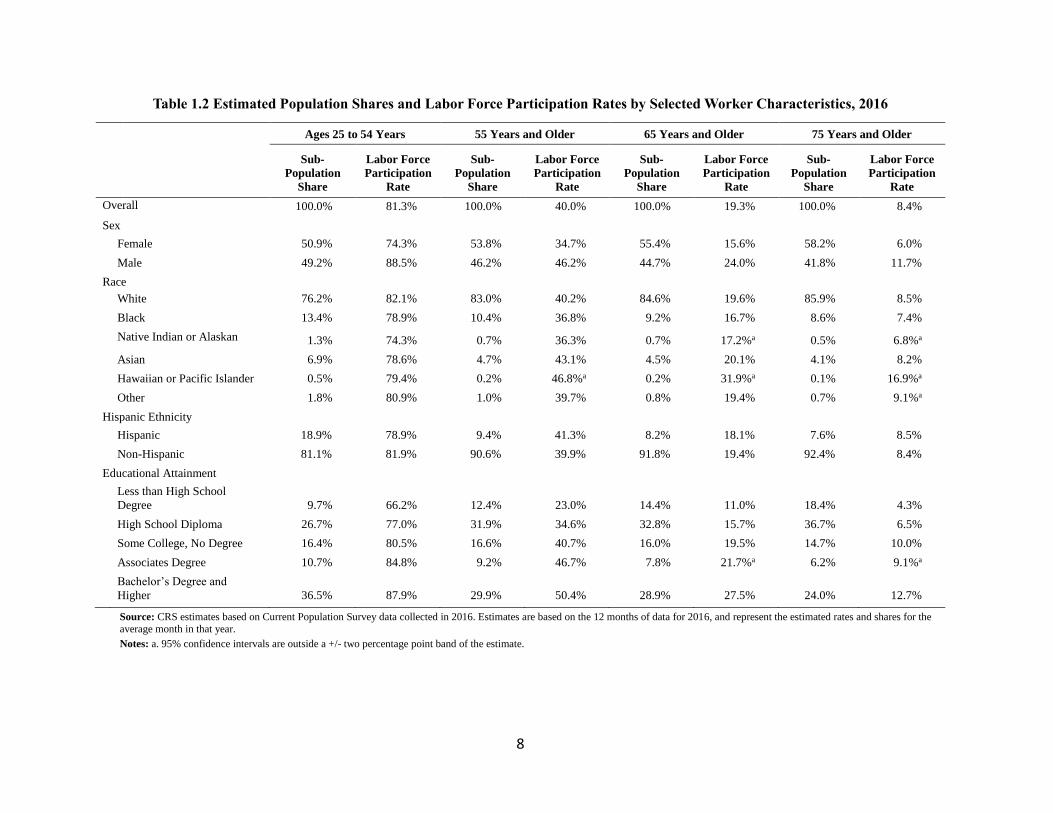
Table 1.2 presents a detailed breakdown of labor force participation rates among different age
groups by select demographic characteristics and educational attainment using data from May
2017.9 Older workers’ participation patterns across demographic groups largely mirror those of
younger workers, although differences in participation by educational attainment are starker. For
example, workers ages 25 to 54 with at least a bachelor’s degree are 1.3 times more likely to
participate in the labor force than workers in the same age group with less than a high school
degree. Among workers ages 55 and above, such workers are more than twice as likely as
workers with less than a high school education to participate.
8 BLS also provides LFPR projections for 2026 by sex. Among ages 25-54 years, the projected rates are 87.6% for men and 75.7% for women (81.6% overall). Among persons 55 years and older, the projected rates are 43.4% for men and 34.9% for women (38.9% overall). Among
persons 65 years and older, the projected rates are 25.9% for men and 18.3% for women (21.8% overall). Among persons 75 years and older, the
projected rates are 13.6% for men and 8.6% for women (10.8% overall). Labor force projections are available from multiple sources, which base their estimates of future participation on different sets of assumptions about demographic trends, retirement patterns, and labor market conditions
(among other factors). For comparison, see Congressional Budget Office projections for 2017-2091 at Congressional Budget Office, The 2017
Long-Term Budget Outlook, Supplemental Information, March 2017, www.cbo.gov/publication/52480. 9 In 2016, the median age of all employed persons above age 16 was 42.2 years; available at BLS, Labor Force Statistics from the Current
Population Survey, https://www.bls.gov/cps/cpsaat11b.htm.
8
Table 1.2 Estimated Population Shares and Labor Force Participation Rates by Selected Worker Characteristics, 2016
Ages 25 to 54 Years 55 Years and Older 65 Years and Older 75 Years and Older
Sub-
Population
Share
Labor Force
Participation
Rate
Sub-
Population
Share
Labor Force
Participation
Rate
Sub-
Population
Share
Labor Force
Participation
Rate
Sub-
Population
Share
Labor Force
Participation
Rate
Overall 100.0% 81.3% 100.0% 40.0% 100.0% 19.3% 100.0% 8.4%
Sex
Female 50.9% 74.3% 53.8% 34.7% 55.4% 15.6% 58.2% 6.0%
Male 49.2% 88.5% 46.2% 46.2% 44.7% 24.0% 41.8% 11.7%
Race
White 76.2% 82.1% 83.0% 40.2% 84.6% 19.6% 85.9% 8.5%
Black 13.4% 78.9% 10.4% 36.8% 9.2% 16.7% 8.6% 7.4%
Native Indian or Alaskan 1.3% 74.3% 0.7% 36.3% 0.7% 17.2%a 0.5% 6.8%a
Asian 6.9% 78.6% 4.7% 43.1% 4.5% 20.1% 4.1% 8.2%
Hawaiian or Pacific Islander 0.5% 79.4% 0.2% 46.8%a 0.2% 31.9%a 0.1% 16.9%a
Other 1.8% 80.9% 1.0% 39.7% 0.8% 19.4% 0.7% 9.1%a
Hispanic Ethnicity
Hispanic 18.9% 78.9% 9.4% 41.3% 8.2% 18.1% 7.6% 8.5%
Non-Hispanic 81.1% 81.9% 90.6% 39.9% 91.8% 19.4% 92.4% 8.4%
Educational Attainment
Less than High School
Degree 9.7% 66.2% 12.4% 23.0% 14.4% 11.0% 18.4% 4.3%
High School Diploma 26.7% 77.0% 31.9% 34.6% 32.8% 15.7% 36.7% 6.5%
Some College, No Degree 16.4% 80.5% 16.6% 40.7% 16.0% 19.5% 14.7% 10.0%
Associates Degree 10.7% 84.8% 9.2% 46.7% 7.8% 21.7%a 6.2% 9.1%a
Bachelor’s Degree and
Higher 36.5% 87.9% 29.9% 50.4% 28.9% 27.5% 24.0% 12.7%
Source: CRS estimates based on Current Population Survey data collected in 2016. Estimates are based on the 12 months of data for 2016, and represent the estimated rates and shares for the average month in that year.
Notes: a. 95% confidence intervals are outside a +/- two percentage point band of the estimate.
9
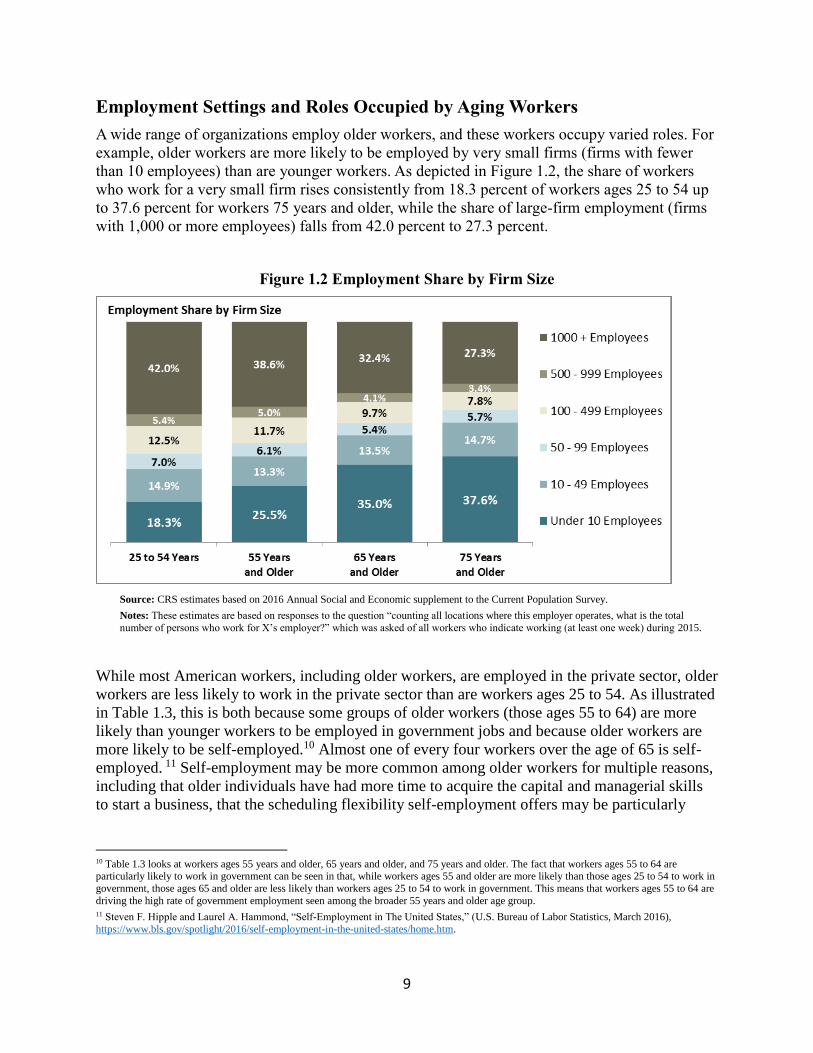
Employment Settings and Roles Occupied by Aging Workers
A wide range of organizations employ older workers, and these workers occupy varied roles. For
example, older workers are more likely to be employed by very small firms (firms with fewer
than 10 employees) than are younger workers. As depicted in Figure 1.2, the share of workers
who work for a very small firm rises consistently from 18.3 percent of workers ages 25 to 54 up
to 37.6 percent for workers 75 years and older, while the share of large-firm employment (firms
with 1,000 or more employees) falls from 42.0 percent to 27.3 percent.
Figure 1.2 Employment Share by Firm Size
Source: CRS estimates based on 2016 Annual Social and Economic supplement to the Current Population Survey.
Notes: These estimates are based on responses to the question “counting all locations where this employer operates, what is the total
number of persons who work for X’s employer?” which was asked of all workers who indicate working (at least one week) during 2015.
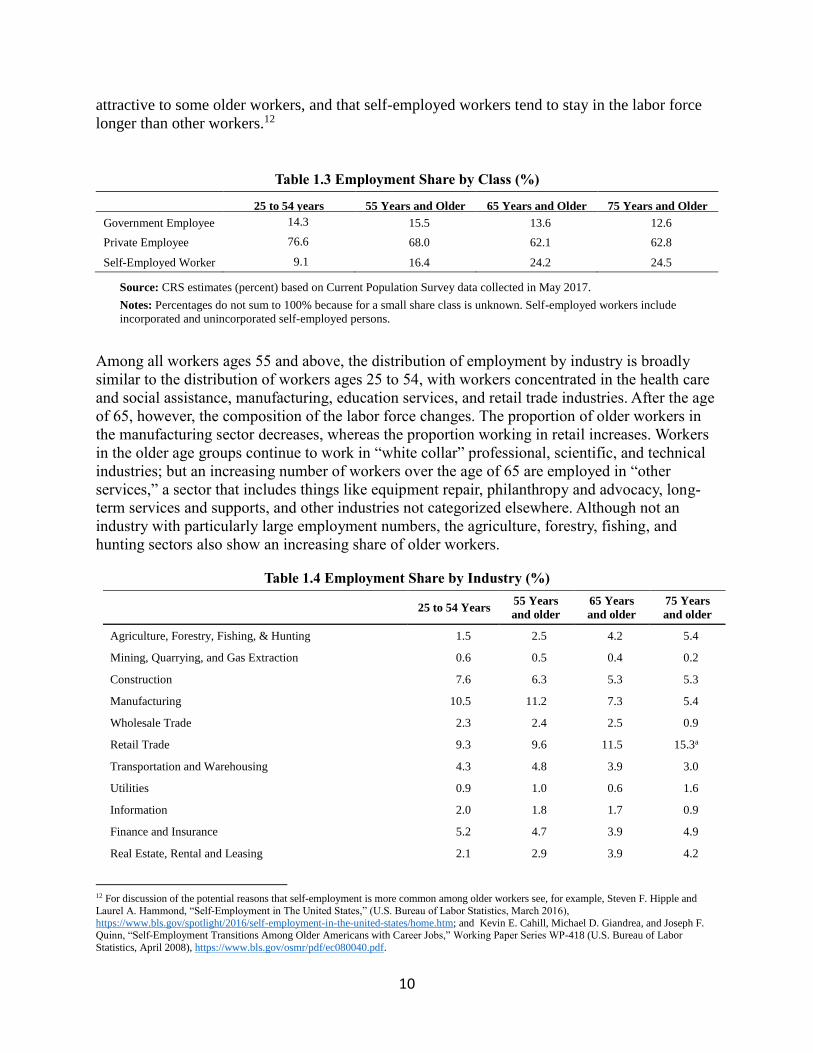
While most American workers, including older workers, are employed in the private sector, older
workers are less likely to work in the private sector than are workers ages 25 to 54. As illustrated
in Table 1.3, this is both because some groups of older workers (those ages 55 to 64) are more
likely than younger workers to be employed in government jobs and because older workers are
more likely to be self-employed.10 Almost one of every four workers over the age of 65 is self-
employed. 11 Self-employment may be more common among older workers for multiple reasons,
including that older individuals have had more time to acquire the capital and managerial skills
to start a business, that the scheduling flexibility self-employment offers may be particularly
10 Table 1.3 looks at workers ages 55 years and older, 65 years and older, and 75 years and older. The fact that workers ages 55 to 64 are particularly likely to work in government can be seen in that, while workers ages 55 and older are more likely than those ages 25 to 54 to work in
government, those ages 65 and older are less likely than workers ages 25 to 54 to work in government. This means that workers ages 55 to 64 are
driving the high rate of government employment seen among the broader 55 years and older age group. 11 Steven F. Hipple and Laurel A. Hammond, “Self-Employment in The United States,” (U.S. Bureau of Labor Statistics, March 2016),
https://www.bls.gov/spotlight/2016/self-employment-in-the-united-states/home.htm.
10
attractive to some older workers, and that self-employed workers tend to stay in the labor force
longer than other workers.12
Table 1.3 Employment Share by Class (%)
25 to 54 years 55 Years and Older 65 Years and Older 75 Years and Older
Government Employee 14.3 15.5 13.6 12.6
Private Employee 76.6 68.0 62.1 62.8
Self-Employed Worker 9.1 16.4 24.2 24.5
Source: CRS estimates (percent) based on Current Population Survey data collected in May 2017.
Notes: Percentages do not sum to 100% because for a small share class is unknown. Self-employed workers include
incorporated and unincorporated self-employed persons.
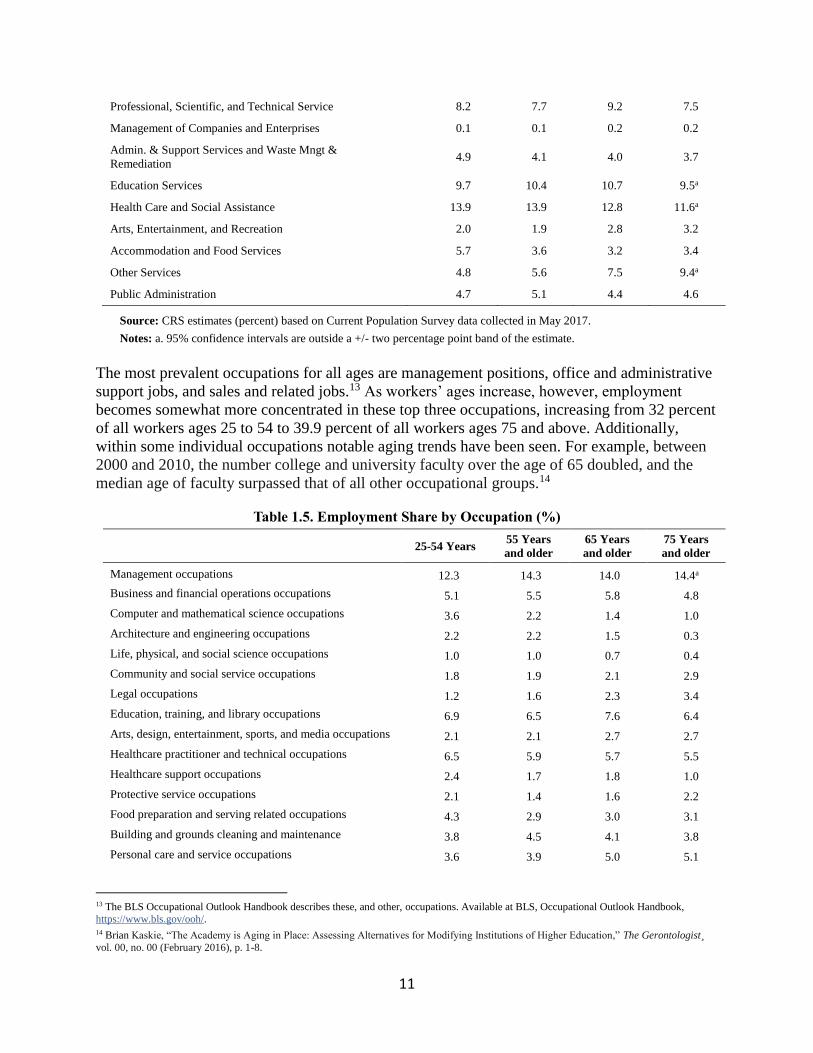
Among all workers ages 55 and above, the distribution of employment by industry is broadly
similar to the distribution of workers ages 25 to 54, with workers concentrated in the health care
and social assistance, manufacturing, education services, and retail trade industries. After the age
of 65, however, the composition of the labor force changes. The proportion of older workers in
the manufacturing sector decreases, whereas the proportion working in retail increases. Workers
in the older age groups continue to work in “white collar” professional, scientific, and technical
industries; but an increasing number of workers over the age of 65 are employed in “other
services,” a sector that includes things like equipment repair, philanthropy and advocacy, long-
term services and supports, and other industries not categorized elsewhere. Although not an
industry with particularly large employment numbers, the agriculture, forestry, fishing, and
hunting sectors also show an increasing share of older workers.
Table 1.4 Employment Share by Industry (%)
25 to 54 Years
55 Years
and older
65 Years
and older
75 Years
and older
Agriculture, Forestry, Fishing, & Hunting 1.5 2.5 4.2 5.4
Mining, Quarrying, and Gas Extraction 0.6 0.5 0.4 0.2
Construction 7.6 6.3 5.3 5.3
Manufacturing 10.5 11.2 7.3 5.4
Wholesale Trade 2.3 2.4 2.5 0.9
Retail Trade 9.3 9.6 11.5 15.3a
Transportation and Warehousing 4.3 4.8 3.9 3.0
Utilities 0.9 1.0 0.6 1.6
Information 2.0 1.8 1.7 0.9
Finance and Insurance 5.2 4.7 3.9 4.9
Real Estate, Rental and Leasing 2.1 2.9 3.9 4.2
12 For discussion of the potential reasons that self-employment is more common among older workers see, for example, Steven F. Hipple and
Laurel A. Hammond, “Self-Employment in The United States,” (U.S. Bureau of Labor Statistics, March 2016),
https://www.bls.gov/spotlight/2016/self-employment-in-the-united-states/home.htm; and Kevin E. Cahill, Michael D. Giandrea, and Joseph F. Quinn, “Self-Employment Transitions Among Older Americans with Career Jobs,” Working Paper Series WP-418 (U.S. Bureau of Labor
Statistics, April 2008), https://www.bls.gov/osmr/pdf/ec080040.pdf.
11
Professional, Scientific, and Technical Service 8.2 7.7 9.2 7.5
Management of Companies and Enterprises 0.1 0.1 0.2 0.2
Admin. & Support Services and Waste Mngt &
Remediation 4.9 4.1 4.0 3.7
Education Services 9.7 10.4 10.7 9.5a
Health Care and Social Assistance 13.9 13.9 12.8 11.6a
Arts, Entertainment, and Recreation 2.0 1.9 2.8 3.2
Accommodation and Food Services 5.7 3.6 3.2 3.4
Other Services 4.8 5.6 7.5 9.4a
Public Administration 4.7 5.1 4.4 4.6
Source: CRS estimates (percent) based on Current Population Survey data collected in May 2017.
Notes: a. 95% confidence intervals are outside a +/- two percentage point band of the estimate.
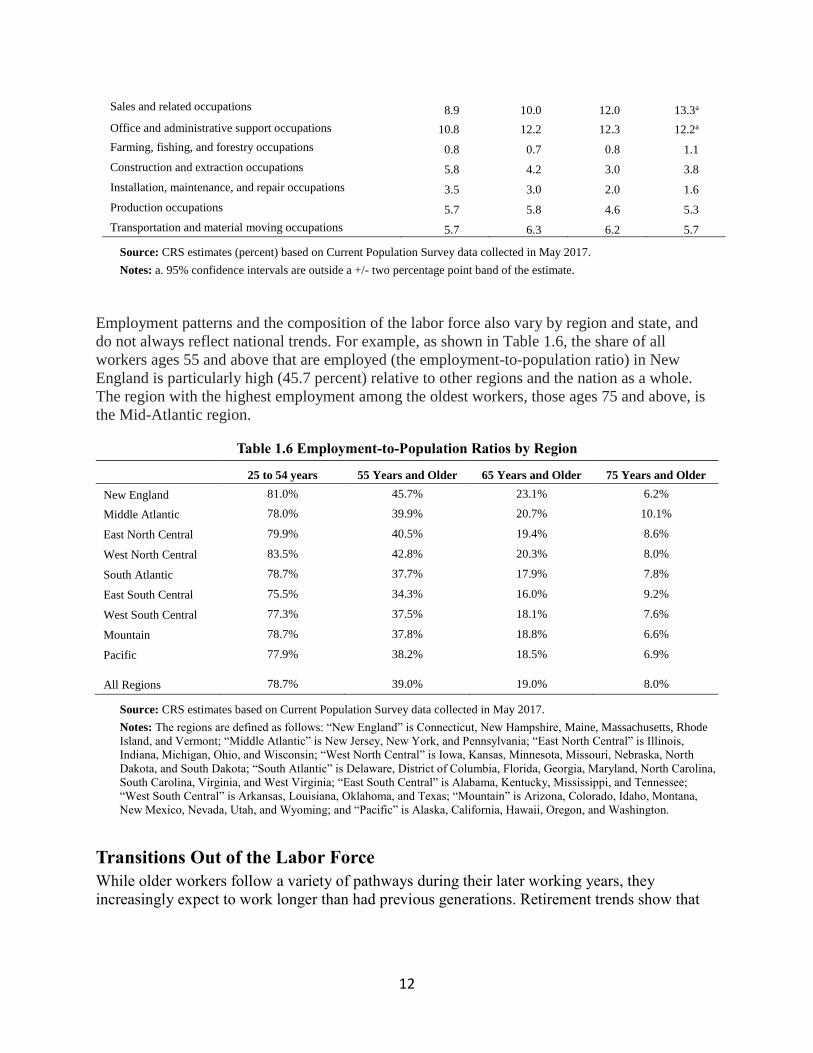
The most prevalent occupations for all ages are management positions, office and administrative
support jobs, and sales and related jobs.13 As workers’ ages increase, however, employment
becomes somewhat more concentrated in these top three occupations, increasing from 32 percent
of all workers ages 25 to 54 to 39.9 percent of all workers ages 75 and above. Additionally,
within some individual occupations notable aging trends have been seen. For example, between
2000 and 2010, the number college and university faculty over the age of 65 doubled, and the
median age of faculty surpassed that of all other occupational groups.14
Table 1.5. Employment Share by Occupation (%)
25-54 Years 55 Years
and older
65 Years
and older
75 Years
and older
Management occupations 12.3 14.3 14.0 14.4a
Business and financial operations occupations 5.1 5.5 5.8 4.8
Computer and mathematical science occupations 3.6 2.2 1.4 1.0
Architecture and engineering occupations 2.2 2.2 1.5 0.3
Life, physical, and social science occupations 1.0 1.0 0.7 0.4
Community and social service occupations 1.8 1.9 2.1 2.9
Legal occupations 1.2 1.6 2.3 3.4
Education, training, and library occupations 6.9 6.5 7.6 6.4
Arts, design, entertainment, sports, and media occupations 2.1 2.1 2.7 2.7
Healthcare practitioner and technical occupations 6.5 5.9 5.7 5.5
Healthcare support occupations 2.4 1.7 1.8 1.0
Protective service occupations 2.1 1.4 1.6 2.2
Food preparation and serving related occupations 4.3 2.9 3.0 3.1
Building and grounds cleaning and maintenance
occupations 3.8 4.5 4.1 3.8
Personal care and service occupations 3.6 3.9 5.0 5.1
13 The BLS Occupational Outlook Handbook describes these, and other, occupations. Available at BLS, Occupational Outlook Handbook,
https://www.bls.gov/ooh/. 14 Brian Kaskie, “The Academy is Aging in Place: Assessing Alternatives for Modifying Institutions of Higher Education,” The Gerontologist¸
vol. 00, no. 00 (February 2016), p. 1-8.
12
Sales and related occupations 8.9 10.0 12.0 13.3a
Office and administrative support occupations 10.8 12.2 12.3 12.2a
Farming, fishing, and forestry occupations 0.8 0.7 0.8 1.1
Construction and extraction occupations 5.8 4.2 3.0 3.8
Installation, maintenance, and repair occupations 3.5 3.0 2.0 1.6
Production occupations 5.7 5.8 4.6 5.3
Transportation and material moving occupations 5.7 6.3 6.2 5.7
Source: CRS estimates (percent) based on Current Population Survey data collected in May 2017.
Notes: a. 95% confidence intervals are outside a +/- two percentage point band of the estimate.
Employment patterns and the composition of the labor force also vary by region and state, and
do not always reflect national trends. For example, as shown in Table 1.6, the share of all
workers ages 55 and above that are employed (the employment-to-population ratio) in New
England is particularly high (45.7 percent) relative to other regions and the nation as a whole.
The region with the highest employment among the oldest workers, those ages 75 and above, is
the Mid-Atlantic region.
Table 1.6 Employment-to-Population Ratios by Region
25 to 54 years 55 Years and Older 65 Years and Older 75 Years and Older
New England 81.0% 45.7% 23.1% 6.2%
Middle Atlantic 78.0% 39.9% 20.7% 10.1%
East North Central 79.9% 40.5% 19.4% 8.6%
West North Central 83.5% 42.8% 20.3% 8.0%
South Atlantic 78.7% 37.7% 17.9% 7.8%
East South Central 75.5% 34.3% 16.0% 9.2%
West South Central 77.3% 37.5% 18.1% 7.6%
Mountain 78.7% 37.8% 18.8% 6.6%
Pacific 77.9% 38.2% 18.5% 6.9%
All Regions 78.7% 39.0% 19.0% 8.0%
Source: CRS estimates based on Current Population Survey data collected in May 2017.
Notes: The regions are defined as follows: “New England” is Connecticut, New Hampshire, Maine, Massachusetts, Rhode
Island, and Vermont; “Middle Atlantic” is New Jersey, New York, and Pennsylvania; “East North Central” is Illinois,
Indiana, Michigan, Ohio, and Wisconsin; “West North Central” is Iowa, Kansas, Minnesota, Missouri, Nebraska, North
Dakota, and South Dakota; “South Atlantic” is Delaware, District of Columbia, Florida, Georgia, Maryland, North Carolina,
South Carolina, Virginia, and West Virginia; “East South Central” is Alabama, Kentucky, Mississippi, and Tennessee;
“West South Central” is Arkansas, Louisiana, Oklahoma, and Texas; “Mountain” is Arizona, Colorado, Idaho, Montana,
New Mexico, Nevada, Utah, and Wyoming; and “Pacific” is Alaska, California, Hawaii, Oregon, and Washington.
Transitions Out of the Labor Force
While older workers follow a variety of pathways during their later working years, they
increasingly expect to work longer than had previous generations. Retirement trends show that
13
expected probabilities of working full-time at older ages have been increasing over time.15 In
1992, Americans in their 50’s estimated that there was just over a one-in-four chance they would
work full-time past the page of 65; in 2004, Americans in the same age group estimated that
there was a one-in-three chance. Today, Americans increasingly envision themselves working
longer than workers their age envisioned 25 years ago.
At some point, however, most workers do exit the labor force and cease working. Analysis of
older workers’ labor force participation and hours of work suggest that many workers begin to
leave the workforce between ages 60 and 70.16 Between ages 60 and 70, labor force participation
rates decline markedly, and individuals in this age group increasingly report retirement as their
primary reason for non-participation. Figure 1.3 plots the labor force participation rates of
workers ages 55 and above in 2016 by age and illustrates this trend. The difference in the labor
force participation rates of persons 60 years old and 70 years old is 42.3 percentage points.
Figure 1.3 Labor Force Participation Rate by Age, 2016
Source: Unpublished 2016 CPS data provided to CRS by BLS.
Among individuals not participating in the labor force in May 2017, 80 percent of those who
were ages 55 and above reported that they were retired, 13 percent reported that a disability was
keeping them from participating, and seven percent reported other reasons (Figure 1.4). When
these responses are examined across individual years of age, they suggest:
The most commonly cited reason for not participating in the labor force among
workers ages 55 to 58 is disability. Among individuals age 55 that are not in the
labor force, 48 percent report that it was due to a disability.
The share of Americans who cite retirement as the reason for non-participation
goes up as individuals get older (24 percent at age 55 to 97 percent at age 79).
Retirement becomes the primary reason for non-participation at age 61.
15 Gordon B. T. Mermin, Richard W. Johnson, and Dan P. Murphy, "Why Do Boomers Plan to Work Longer?" Journal of Gerontology: Social
Sciences, vol. 62B, no. 5 (2007), pp. S286-S294. 16 The Organization for Economic Cooperation and Development estimates an “average effective age of retirement” across its member countries
and describes this measure as “the average age of all persons withdrawing from the labor force in a given period.” The OECD estimation methodology is available at OECD, A method for calculating the average effective age of retirement, http://www.oecd.org/els/emp/39371923.pdf,
and estimates are available at OECD, http://www.oecd.org/els/emp/Summary_1970%20values.xls.
14
Figure 1.4. Reason for Non-Participation, Persons 55 Years and Older
Source: CRS estimates based on Current Population Survey data collected in May 2017.
Research on how individuals transition out of the labor force shows that transitioning
permanently into full-time retirement from full-time career employment has become less
common.17 For example, some older workers, instead of retiring when leaving a long-held job,
are transitioning to another occupation. One study of workers ages 55 and over found that by age
62, about one-quarter were still in their career occupations, while 17 percent had made a
transition to another occupation, and 57 percent had exited the labor force. At later ages (i.e.,
beginning at age 66), individuals are just as likely to be in a new occupation as they are to be still
working in their career occupation (13 percent of all persons falling into each category).18
Among the varied paths that older workers now take from full-time work into and out of
retirement are bridge jobs, phased retirement arrangements, self-employment, unretirement, and
volunteering.
Part-Time Work, Bridge Jobs, and Phased-Retirement
Between the ages of 60 and 70, the share of older workers employed part-time increases
significantly (Figure 1.5). These workers are employed part-time for various reasons. Some may
transition to part-time work following full-time work, while others move from not working to
part-time work (e.g., returning to work after raising children or a period of unemployment). A
smaller number prefer full-time hours but may only find part-time work. Data from May 2017
reveal that 13.4 percent of part-time workers ages 55 and above would prefer full-time hours
(Figure 1.6).
17 Kevin E. Cahill, Michael D. Giandrea, and Joseph F. Quinn, "Reentering the Labor Force After Retirement," Monthly Labor Review, June
2011, pp. 34-42. Note that other studies have shown that both workers who do not have full-time career jobs as part of their work histories and those that do experience similarly diverse trajectories through job transitions and retirement. See Kevin E. Cahill, Michael D. Giandrea, and
Joseph F. Quinn, "Older Workers and Short-Term Jobs: Patterns and Determinants," Monthly Labor Review, May 2012, pp. 19-32.
18 Amanda Sonnega, Brooke Helppie McFall, and Robert J. Willis, Occupational Transitions at Older Ages: What Moves are People Making?, University of Michigan Retirement Research Center (MRCC), Working Paper, WP 2016-352, Ann Arbor, MI, 2016,
http://www.mrrc.isr.umich.edu/publications/papers/pdf/wp352.pdf.
15
Figure 1.5 Shares of Employed Workers Reporting Part-time and Full-time Hours, 2016
Source: CRS calculations using unpublished BLS data.
Notes: A worker is considered to be employed part-time if he or she reports usually working 34 hours or fewer per week.
Figure 1.6 Share of Employed Workers in Part-time Positions and Share of Part-time Workers Who
Would Like Full-time Hours, May 2017
Source: CRS estimates based on Current Population Survey data collected in May 2017.
Notes: A worker is considered to be employed part-time if he or she reports usually working 34 hours or fewer per week. Some workers
who are identified as being employed part-time based on reported usual hours of work (i.e., usually fewer than 35) did not respond to the survey question about a preference for full-time work because, despite their reported hours, they view themselves as full-time workers.
These workers are not included in the estimated shares of part-time workers who prefer full-time work.
Among those transitioning from full-time work to part-time work are workers taking up bridge
jobs, which are generally part-time or less-than-full-year positions with a new employer.
Researchers have found that older workers often move into bridge jobs from career full-time
positions rather than directly exiting the labor force. One study documented that among workers
ages 57 to 74 in 2010, the percentage of individuals who left a full-time career job and moved to
a bridge job ranged from 57 to 65 percent among men and 54 to 74 percent among women,
depending on the exact group examined.19 For the majority of older workers, these bridge jobs
19 This study looked at three age groups: HRS Core (aged 69 to 74 in 2010); War Babies (aged 63 to 68 in 2010); and Early Baby Boomers (aged 57 to 62 in 2010). See study for more details of the differences in bridge job take-up between age groups and genders. Kevin E. Cahill, Michael
D. Giandrea, and Joseph F. Quinn, "Retirement Patterns and the Macroeconomy, 1992-2010: The Prevalence and Determinants of Bridge Jobs,
Phased Retirement, and Reentry Among Three Recent Cohorts of Older Americans," The Gerontologist, vol. 55, no. 3 (2015), pp. 384-403. For additional information on the use of bridge jobs, see also Kevin E. Cahill, Michael D. Giandrea, and Joseph F. Quinn, "Retirement Patterns from
Career Employment," The Gerontologist, vol. 46, no. 4 (2006), pp. 514-523.
16
involved part-time employment. Research also shows that transitioning from full-time career
jobs to bridge jobs has become more common among more recent birth cohorts.20
Also included among those older workers taking up part-time employment are workers taking
advantage of phased-retirement arrangements. These arrangements generally allow workers to
gradually transition out of their full-time career by accepting a part-time position with the same
employer, usually in the same general role.
Self-Employment
Self-employment is more common for older workers compared to younger workers. While only
6.4 percent of all employed workers ages 16 and older were self-employed in 2015, 8.8 percent
of workers ages 55 to 64 and 15.5 percent of workers aged 65 and older were self-employed.21
Transitions into and out of self-employment for older workers who previously had full-time
careers are common.22 Changes in self-employment rates among older workers are somewhat
uncertain. Some analyses have found that self-employment rates have risen for certain cohorts of
older workers, while other analyses have documented a decline in self-employment rates, more
in line with the general decline in self-employment that has occurred among all workers over the
last several years.23
Labor Force Reentry, or “Unretirement”
Another phenomenon seen among older workers is “unretirement,” which is when workers who
had previously retired return to employment.24 In one study that followed retirees for six years,
26 percent returned to work, most commonly returning about two years after retirement. The
same study found that the unretirement rate was particularly high (35 percent) among younger
retirees (i.e., aged 53-54), and that the majority (82 percent) of unretirement transitions were
made by individuals who had stated prior to retirement that they expected to work in
retirement.25
20 Giandrea, Michael D., Kevin E. Cahill, Joseph F. Quinn, 2009. “Bridge Jobs A Comparison Across Cohorts,” Research on Aging 31(5), 549-
576. 21 These figures refer to the percent of workers that are unincorporated self-employed. The shares of workers that are incorporated self-employed
are 3.7 percent for all workers ages 16 and over, 5.9 percent for workers ages 55 to 64, and 8.6 percent for workers ages 65 and over. See Steven F. Hipple and Laurel A. Hammond, “Self-Employment in The United States,” (U.S. Bureau of Labor Statistics, March 2016),
https://www.bls.gov/spotlight/2016/self-employment-in-the-united-states/home.htm.
22 Michael D. Giandrea, Kevin E. Cahill, and Joseph F. Quinn, “Self Employment Transitions Among Older American Workers with Career
Jobs,” Working Paper Series WP-418 (U.S. Bureau of Labor Statistics, April 2008), http://www.bls.gov/osmr/abstract/ec/ec080040.htm. 23 For example, one report looked specifically at workers who were between ages 65 and 75 in 2006 and found that, from 2006-2010, the
prevalence of self-employment among older workers increased by five percentage points for men (36 percent to 41 percent) and by four percentage points for women (18 percent to 22 percent). See Kevin E. Cahill, Michael D. Giandrea, and Joseph F. Quinn, “New Evidence on
Self-Employment Transitions Among Older Americans with Career Jobs,” Working Paper Series WP-463 (U.S. Bureau of Labor Statistics,
March 2013), https://www.bls.gov/osmr/abstract/ec/ec130030.htm. However, another report documented a decline in self-employment between 1994 and 2012 among a younger group of older workers – those ages 55 to 64. See Bradley T. Heim, Understanding Self-Employment Dynamics
Among Individuals Nearing Retirement, Small Business Administration Office of Advocacy, No. 422, April 2014,
https://www.sba.gov/sites/default/files/files/rs422.pdf. Discussion of the overall decline in self-employment rates among all workers can be found in Steven F. Hipple and Laurel A. Hammond, “Self-Employment in The United States,” (U.S. Bureau of Labor Statistics, March 2016),
https://www.bls.gov/spotlight/2016/self-employment-in-the-united-states/pdf/self-employment-in-the-united-states.pdf.
24 Nicole Maestas, "Back to Work: Expectations and Realizations of Work after Retirement," Journal of Human Resources, Summer 2010, pp.
719-748. 25 ibid.
17
Another study examining retirements of workers ages 50 and above found that between 1992 and
2004, approximately a third of retirements were later reversed.26 This trend was again found to
be more common for younger members of the older worker population, and women were found
to be slightly more likely to reenter the workforce than men.27
Encore Adulthood, Civic Engagement, and Volunteering
Older adults are also increasingly choosing to engage in meaningful activities other than full-
time employment.28 Sometimes referred to as “encore adulthood,” this path may involve less
leisure time and offers the opportunity for “continued learning, engagement, and work.”29 For
older workers, leaving one’s career may involve not only moving to part-time jobs through
bridge jobs or phased retirement arrangements, but also civic engagement, such as volunteering
or informally helping out family, friends, or others in the community – positions that may
include some form of compensation.30 In fact, older workers going through a retirement
transition are more likely to be involved in volunteering than individuals who are not retired.31
Research on Factors Influencing Older Workers’ Labor Force Decisions
Scholars have identified a number of factors that influence the work and retirement decisions of
older workers in the United States. These include both individual-level factors such as
characteristics of older workers themselves, as well as other factors such as employer
characteristics. The discussion of this research below is not intended to be exhaustive; rather, it
summarizes selected recent research to provide an overview of key topics.
Worker Characteristics
Individual-level factors, such as demographic and socio-economic characteristics, are among the
most studied topics in the literature focusing on the labor force decisions of older workers, and
research focusing on the impact of individual-level health and education is among the most
widely discussed.
Research has identified a number of links between older workers’ health and their retirement and
late career pathways. Older workers who are healthier are more likely to stay in the labor force
and be employed.32 Researchers have also found that healthier older workers are more likely to
26 David F. Warner, Mark D. Hayward, and Melissa A. Hardy, "The Retirement Life Course in America at the Dawn of the Twenty-First
Century," Population Research and Policy Review, vol. 29, no. 6 (December 2010), pp. 893-919,
https://www.ncbi.nlm.nih.gov/pmc/articles/PMC3002227/pdf/nihms-197861.pdf. 27 David F. Warner, Mark D. Hayward, and Melissa A. Hardy, "The Retirement Life Course in America at the Dawn of the Twenty-First
Century," Population Research and Policy Review, vol. 29, no. 6 (December 2010), pp. 893-919, https://www.ncbi.nlm.nih.gov/pmc/articles/PMC3002227/pdf/nihms-197861.pdf. Note that Cahill et al. (2011) also investigated the labor force
status of older individuals with full-time career jobs in 1992 using data for the 1992-2008 period. They found that, among older workers who had
left the labor force by 2008, about 15 percent of men and 13 percent of women later returned. 28 Erik Kojola and Phyllis Moen, "No More Lock-Step Retirement: Boomers' Shifting Meanings of Work and Retirement," Journal of Aging
Studies, vol. 36 (2016), pp. 59-70.
29 ibid. 30 Brian Kaskie, Sara Imhof, and Joseph Cavanaugh, et al., "Civic Engagement as a Retirement Role for Aging Americans," The Gerontologist,
vol. 48, no. 3 (2008), pp. 368-377.
31 Fengyan Tang, "Retirement Patterns and Their Relationship to Volunteering," Nonprofit and Voluntary Sector Quarterly, vol. 45, no. 5 (August
2015), pp. 910-930. 32 Kevin E. Cahill, Michael D. Giandrea, and Joseph F. Quinn, "Older Workers and Short-Term Jobs: Patterns and Determinants," Monthly Labor
18
reenter the labor force after an exit as well as remain in the labor force by transitioning to a
bridge job.33 Other studies have shown that poor health and worsening health are linked to
earlier-than-expected retirement for older workers, and have found that disability status is also
linked to the labor force participation of older adults.34
Education has also been found to be related to the retirement decisions and late career pathways
of older workers. For example, some research has found that older individuals with higher levels
of education are more likely to participate in the labor force than are those with lower levels of
education, and that older workers are more likely to remain in a full-time career job if they have
a college education.35
Other factors that have been found to have some impact on older workers’ career pathways and
retirement decisions include workers’ gender and family relationships. For example, some
research has found that there is more variability in the retirement behaviors of women relative to
men, while other research has found that the work and retirement decisions of a worker’s spouse
can significantly impact the workers’ own decisions.36
Employer Characteristics
Research has shown that a number of employer characteristics can also impact workers’ work
and retirement decisions. For example, one study found that older workers who retire early were
more likely to be employed by larger organizations.37 Other studies have shown that certain
employer-provided benefits can impact the labor market behavior of older workers. For example,
the declining availability of defined benefit (DB)38 pension coverage has been found to partially
explain increased work expectations among older workers.39 Older workers with no health
insurance through full-time career jobs have also been found to be more likely to take bridge
Review, May 2012, pp. 19-32.
33 Kevin E. Cahill, Michael D. Giandrea, and Joseph F. Quinn, "Reentering the Labor Force After Retirement," Monthly Labor Review, June
2011, pp. 34-42. 34 For findings on how poor and worsening health impacts retirement decisions, see Alicia H. Munnell, Geoffrey T. Sanzenbacher, and Matthew
S. Rutledge, What Causes Workers to Retire Before They Plan?, Center for Retirement Research at Boston College, CRR WP 2015-22, Chestnut Hill, MA, September 2015. For information on the relationship between disability status and labor force participation, see, for example, Warner et
al. (2010) and John C. Henretta, "Uniformity and Diversity: Life Course Institutionalization and Late-Life Work Exit," The Sociological
Quarterly, vol. 33, no. 2 (1992), pp. 265-279. 35 Gary Burtless. The Impact of Population Aging and Delayed Retirement on Workforce Productivity, Center for Retirement Research at Boston
College, CRR WP 2013-11, Chestnut Hill, MA, May 2013; Cahill et al. (2012)
36 For research relating to the relationship between workers’ decisions and gender, see, for example, David F. Warner, Mark D. Hayward, and Melissa A. Hardy, "The Retirement Life Course in America at the Dawn of the Twenty-First Century," Population Research and Policy Review,
vol. 29, no. 6 (December 2010), pp. 893-919. For research examining how familial relationships are related to workers’ decisions, see, for
example, Alicia H. Munnell and Mauricio Soto, Why Do Women Claim Social Security Benefits So Early?, Center for Retirement Research at Boston College, Issue Brief No. 35, Chestnut Hill, MA, 2005; Donald C. Reitzes, Elizabeth J. Muran, and Maria E. Fernandez, "The Decision to
Retire: A Career Perspective," Social Science Quarterly, vol. 79 (1998), pp. 607-619; and Deborah B. Smith and Phyllis Moen, "Spousal
Influence on Retirement: His, Her, and Their Perceptions," Journal of Marriage and Family, vol. 60 (1998), pp. 734-744.
37 Chinhui Juhn and Kristin McCue, Workplace Characteristics and Employment of Older Workers, Center for Economic Studies, U.S. Census
Bureau, CES 12-31, Washington, DC, September 2012.
38 In defined benefit (DB) pension plans, participants receive monthly payments in retirement that are based on a formula that typically uses a combination of length of service, accrual rate, and average of final years' salary. For example, a plan might specify that retirees receive an amount
equal to 1.5% of their pay for each year of service, where the pay is the average of a worker's salary during his or her highest-paid five years. The
benefit formulas of DB pensions are designed in conjunction with a specific normal retirement age, at which point participants are eligible to receive their pension benefits. This normal retirement age, therefore, creates incentives to fully retire at that age in order to collect the DB
pension. For more information on DB pensions, including current data on worker participation, see CRS Report R43439, Worker Participation in
Employer-Sponsored Pensions: A Fact Sheet (hereinafter, “CRS Report R43439”). 39Gordon B. T. Mermin, Richard W. Johnson, and Dan P. Murphy, "Why Do Boomers Plan to Work Longer?" Journal of Gerontology: Social
Sciences, vol. 62B, no. 5 (2007), pp. S286-S294.

19
jobs, and older workers who do not have access to employer-sponsored retiree health benefits at
their full-time career job appear more likely to anticipate working to later ages.40
Other Factors
Other factors such as the national economy and government policy have also been found to be
related to older workers’ labor force behavior.
Research on the relationship between the national economy and older workers’ behavior has
found that both the current economy conditions and the economic conditions workers
experiences over their careers can impact their behavior. For example, research has found that
poor labor market conditions and increases in national unemployment can negatively affect
employment among older workers.41 Research has also found that different retirement and late
career patterns for different U.S. birth cohorts appear to be partially explained by the different
economic conditions each birth cohort experienced throughout the entirety of their working
lives.42
Government policies can also have impacts on older workers’ decisions and behavior. To look at
a single example, the Social Security program has been found to impact workers’ retirement
choices.43 Research has shown that particular aspects of the program, such as the age set as the
full-retirement age (FRA), can have a significant effect on when workers choose to retire.44
40 ibid.
41 Till von Wachter. The Effect of Economic Conditions on the Employment of Workers Nearing Retirement Age, Center for Retirement Research at Boston College, CRR WP 2007-25, Chestnut Hill, MA, December 2007; Paul Marmora and Moritz Ritter, "Unemployment and the
Retirement Decisions of Older Workers," Journal of Labor Research, vol. 36 (2015), pp. 274-290. Data analyzed in this study came from Survey
of Income and Program Participation (SIPP). 42 Kevin E. Cahill, Michael D. Giandrea, and Joseph F. Quinn, "Retirement Patterns and the Macroeconomy, 1992-2010: The Prevalence and
Determinants of Bridge Jobs, Phased Retirement, and Reentry Among Three Recent Cohorts of Older Americans," The Gerontologist, vol. 55,
no. 3 (2015), pp. 384-403. 43 Other examples of significant federal policies with implications for the retirement and later career pathways of older workers include health
care policies, such as Medicare and the Affordable Care Act, as well as the tax treatment of employer-sponsored benefits, including defined
benefit and defined contributions pension plans and health insurance plans. 44 Luc Behaghel and David M. Blau, Framing Social Security Reform: Behavioral Responses to Changes in the Full Retirement Age, Institute for
the Study of Labor (IZA), Discussion Paper No. 5310, Bonn, Germany, November 2010, http://ftp.iza.org/dp5310.pdf.
20
Chapter 2. The Aging Worker: Opportunities and
Challenges
Studies show that work and other meaningful activities correspond with increased personal
satisfaction as one grows older.45 Many older Americans define themselves by their work and
envision themselves working well past the traditional age of retirement. Others continue to work
out of financial necessity that involves meeting day-to-day expenses, a lack of retirement
savings, and the expected need for health care in older age.46
This chapter describes how remaining in the workforce into older age presents unique
opportunities as well as challenges. Key takeaways from this analysis are:
Older workers can experience benefits from continuing to work, including improved
well-being, health, and financial security.
Some older workers experience barriers to finding employment and advancing in their
jobs, including workplace discrimination and a lack of training opportunities.
Older workers can also face challenges that make it harder to stay in their jobs,
including balancing personal and professional responsibilities and managing health
conditions and disabilities.
Preparing financially for retirement is a priority for many older workers although it
remains difficult for many to achieve financial security.
Benefits of Continued Employment for Older Workers
Employment can provide older workers with substantial benefits. Continuing to work into older
age may have positive impacts on workers’ overall well-being, health, and financial security.
Research indicates that for older workers, there is a strong link between health and employment.
Continuing to work into older age has been shown to have positive impacts on individuals’
physical, cognitive, and emotional health.47 For example, studies have found that persons who
continue to work past age 65 are able to sustain their levels of cognitive functioning over longer
periods.48 Continued employment can also help workers’ and their families afford medical
45John Hendricks and Stephen J. Cutler, “Volunteerism and Socioemotional Selectivity in Later Life,” Journal of Gerontology, vol.59B, no. 5
(2004), p. s215-s257. 46Marcie Pitt-Catsouphes and Michael Smyer, “Older workers What keeps them working?” The Center on Aging and Work Issue Brief 1, July
2005.
47For examples of such research and discussion of these relationships, see: Esteban Calvo, “Does Working Longer Make People Healthier and
Happier?” Center for Retirement Research at Boston College, (2006), available at http://crr.bc.edu/wp-content/uploads/2006/02/wob_2.pdf;
Linda Hoffman and Erin Andrew, “Maximizing the Potential of Older Adults: Benefits to State Economies and Individual Well-Being,” National
Governors Association for Best Practices, (2010), available at https://www.nga.org/files/live/sites/NGA/files/pdf/1004OLDERADULTS.PDF; Jessica Johnson et al., “Quality of Employment and Life-Satisfaction: A Relationship that Matters for Older Workers,” Sloan Center on Aging &
Work, (2008), available at https://dlib.bc.edu/islandora/object/bc-ir:100070/datastream/PDF/view. Will Maimaris, Helen Hogan, and Karen Lock,
“The Impact of Working Beyond Traditional Retirement Ages on Mental Health: Implications for Public Health and Welfare Policy,” Public Health Reviews, vol. 32, no. 2, (2010); Christopher Farrell, “Working Longer May Benefit Your Health,” New York Times, March 3, 2017, at
https://www.nytimes.com/2017/03/03/business/retirement/working-longer-may-benefit-your-health.html.
48Centers for Disease Control and Prevention (2016) Continuing to work can provide workers with additional social interaction which logically may help stave off social isolation. Some research has pointed to such a potential positive effect among specific groups of workers. For example,
see Eleonora Patacchini and Gary Engelhardt, “Work, Retirement, and Social Networks at Older Ages,” Center for Retirement Research at
21
treatment by providing access to employer-sponsored health insurance. A significant share of
older workers report that access to health insurance influences their decision to continue to
work.49 Some employers also offer wellness programs, which may provide additional health
benefits.
This relationship between health and work goes both ways, as individuals’ health also affects
their likelihood of working to begin with. Research has shown that workers who are healthy are
more likely to stay in the workforce and that healthier workers are more likely to reenter the
workforce after an exit.50 Health conditions may make it particularly difficult for older workers
in physically demanding jobs to continue working.51
In addition to being associated with better health outcomes, regular employment also has the
potential to stave off social isolation among older individuals and to improve older workers’
overall well-being and quality of life.52 Older workers are more likely than younger workers to
report that their job provides personal fulfillment and a sense of being needed and valued, as well
as opportunities to learn new skills and remain physically, cognitively, and socially active.53
Older adults may also appreciate the chance to share wisdom and experiences with younger
employees, and may value intergenerational exchanges. One national survey of adults ages 45 to
74 found that roughly eight in ten older workers said that feeling useful was a reason they were
working or looking for work, and aging workers were more likely to be engaged in their work
than younger employees.54
Boston College, (2016), at http://crr.bc.edu/wp-content/uploads/2016/11/wp_2016-15.pdf which finds that continued labor force participation
raises the size and density of social networks for women and persons with higher levels of education. For an example of research linking continued working to improved mental health outcomes, see Will Maimaris, Helen Hogan, and Karen Lock, “The Impact of Working Beyond
Traditional Retirement Ages on Mental Health: Implications for Public Health and Welfare Policy,” Public Health Reviews, vol. 32, no. 2,
(2010). Note that workers’ expectations of whether or not they will continue working at older ages may also affect the impact continued working
has on their mental health. See, for example, Tracy Falba, William Gallo, and Jody Sindelar, “Work Expectations, Realizations, and Depression
in Older Workers,” Journal of Mental Health Policy and Economics, vol. 12, no. 4, (2009), available at
https://www.ncbi.nlm.nih.gov/pmc/articles/PMC3434685/. 49Fronstin, P., Sources of health insurance coverage: A look at changes between 2013 and 2014 from the March 2014 and 2015 Current
Population Survey, Employee Benefit Research Institute (EBRI Issue Brief No. 419), 2015; AARP, “Staying Ahead of the Curve 2013: The AARP Work and Career Study,” (2014), at https://www.aarp.org/content/dam/aarp/research/surveys_statistics/general/2014/Staying-Ahead-of-
the-Curve-2013-The-Work-and-Career-Study-AARP-res-gen.pdf.
50Kevin E. Cahill, Michael D. Giandrea and Joseph F. Quinn, “Reentering the Labor Force After Retirement,” Monthly Labor Review (June
2011), p. 34-42. 51For document on the prevalence of physically demanding work among older workers and how health may impact the career of decisions of
individuals engaged in such work differently than they may other workers, see Hye Jin Rho, Hard Work? Patterns in Physically Demanding Labor Among Older Workers, Center for Economic and Policy Research, August 2010, at http://cepr.net/documents/publications/older-workers-
2010-08.pdf and Richard Johnson, Jannette Kawachi, Eric K Lewis, Older Workers on the Move: Recareering in Later Life, AARP Public Policy
Institute, 2009, at https://assets.aarp.org/rgcenter/econ/2009_08_recareering.pdf. 52Continuing to work can provide workers with additional social interaction which logically may help stave off social isolation. Some research
has pointed to such a potential positive effect among specific groups of workers. For example, see Eleonora Patacchini and Gary Engelhardt,
“Work, Retirement, and Social Networks at Older Ages,” Center for Retirement Research at Boston College, (2016), at http://crr.bc.edu/wp-
content/uploads/2016/11/wp_2016-15.pdf which finds that continued labor force participation raises the size and density of social networks for
women and persons with higher levels of education. For an example of research linking continued to working to improved mental health
outcomes, see Will Maimaris, Helen Hogan, and Karen Lock, “The Impact of Working Beyond Traditional Retirement Ages on Mental Health: Implications for Public Health and Welfare Policy,” Public Health Reviews, vol. 32, no. 2, (2010). Note that workers’ expectations of whether or
not they will continue working at older ages may also impact continued working has on their mental health. See, for example, Tracy Falba,
William Gallo, and Jody Sindelar, “Work Expectations, Realizations, and Depression in Older Workers,” Journal of Mental Health Policy and
Economics, vol. 12, no. 4, (2009), at https://www.ncbi.nlm.nih.gov/pmc/articles/PMC3434685/. 53Aon Hewitt, “A-Business-Case-Report-for-Workers Age 50Plus”, AARP, 2015, at
https://www.aarp.org/content/dam/aarp/research/surveys_statistics/general/2015/A-Business-Case-Report-for-Workers%20Age%2050Plus-
ES.pdf 54AARP, “Staying Ahead of the Curve 2013: The AARP Work and Career Study,” 2014, at
22
Working into older ages can also improve the financial security of individuals and families.
Continuing to work not only provides a source of reliable income to pay rent, buy groceries, and
afford medications, but it can also provide more time to save for retirement. By continuing to
work, seniors may also have access to continued employer benefits that can improve their
financial security, such as employer-sponsored retirement plan contributions and health
insurance.
Continuing to work and delaying retirement can also increase the monthly payments seniors
receive from Social Security upon retirement. Monthly Social Security payments are calculated
based on a formula that accounts for an individual’s earnings history and the age when an
individual starts to claim benefits (the earliest a worker with no disability can begin claiming
benefits is age 62). In many cases, adding more covered earnings to an individual’s earnings
history could increase expected monthly benefits. Regardless of the specifics of their earnings
history, however, workers who delay claiming their benefits after they reach age 62 will receive
a larger monthly check when they do begin claiming them. This is true for every month a worker
delays claiming benefits between ages 62 and 70.55
How workers respond to these potential benefits of continued employment will depend on their
personal circumstances, preferences, and goals. For some, exiting the labor force sooner rather
than later may prove possible and preferable, while others may not be able to participate in the
labor force due to circumstances beyond their control. For growing numbers of aging Americans,
however, continued employment can offer a great number of benefits and opportunities.
Challenges Faced by Aging Workers
Taking advantage of the benefits and opportunities accompanying continued employment can be
complicated by challenges that disproportionately affect older workers. These challenges include
factors that make it more difficult for older workers to find employment, advance in their careers,
remain in the workforce, and transition into retirement. As the workforce ages, these obstacles
will likely impact a growing share of American workers. Significant challenges are discussed
below.
Age Discrimination
Some individuals experience workplace discrimination based on their age. This discrimination
can take many forms, from older workers being treated differently in hiring, firing, promotion,
and layoff decisions, to being systematically offered inferior benefits, job assignments, and
training opportunities. Researchers have shown that age discrimination in the hiring process is a
particularly significant challenge for older workers and may be undermining their ability to
transition between jobs or reenter the workforce.56
https://www.aarp.org/content/dam/aarp/research/surveys_statistics/general/2014/Staying-Ahead-of-the-Curve-2013-The-Work-and-Career-Study-
AARP-res-gen.pdf 55For description of impacts on Social Security benefits of delaying retirement, see Melissa Knoll and Anya Olsen, “Incentivizing Delayed
Claiming of Social Security Retirement Benefits Before Reaching the Full Retirement Age,” Social Security Bulletin, vol. 74, no. 4, (2014), at
https://www.ssa.gov/policy/docs/ssb/v74n4/v74n4p21.html. 56 For an example of such research, see David Neumark, Ian Burn, and Patrick Button, “Age Discrimination and Hiring of Older Workers”,
Federal Reserve Bank of San Francisco (2017), at http://www.frbsf.org/economic-research/publications/economic-letter/2017/february/age-
23
In 1967, 50 years ago, the Age Discrimination in Employment Act (ADEA) made employment
discrimination against individuals 40 years of age and older illegal. The ADEA outlawed
blatantly discriminatory hiring practices such as posting job openings that explicitly bar older
workers from applying or forcing older workers to retire at specific ages.57
While ADEA made discrimination based on age illegal, such discrimination still exists.58 For
example, modern age discrimination in the workplace can take the form of an older worker being
denied training opportunities made available to younger workers because an employer assumes
that the older worker is not tech-savvy enough for the training. It can also take the form of an
older worker being denied a promotion in favor of a younger worker because an employer
assumes that the older worker will not be with the company for much longer.
Some employers have found ways to circumvent requirements of the ADEA in order to hire
younger workers over older ones. For example, while the ADEA makes it illegal to “fail or
refuse to hire” individuals on the basis of their age, some prospective employers do specify a
maximum number of years of experience that eligible job applicants can have or require all
eligible applicants to be “digital natives,” meaning that they grew up using technology from an
early age.59 Other practices include online job applications that make it impossible to apply for a
job without filling in one’s year of birth or graduation year, as well as application sites that use
drop-down menus for these fields that only include years dating back to, for example, the
1970s.60 Despite not explicitly eliminating older workers from consideration, these practices can
systematically screen out older workers in a discriminatory manner.61
Recent studies and surveys have repeatedly illustrated how certain practices significantly
disadvantage older workers in today’s labor market. According to one 2013 AARP survey,
nearly two thirds of workers ages 45 to 74 reported that based on what they had seen or
experienced, they believed workers still face age discrimination in the workplace today.62 This
included a significant majority of male employees (57 percent) and nearly three quarters of
female employees (72 percent) in this age group.63 Further, multiple experimental studies have
documented significant discrimination against older workers in the hiring process, including one
recent study that sent out similar resumes to over 13,000 lower-skill positions in 12 cities across
discrimination-and-hiring-older-workers/. 57Note that a limited number of professions are exempt from the ADEA’s prohibition of mandatory retirement ages, such as pilots and public
safety workers. For additional discussion of the prevalence of blatant form of age discrimination previous to the passage of the ADEA, see Laurie
McCann, “The ADEA @ 50 – More Relevant Than Ever,” Testimony to US Equal Employment Opportunity Commission, June 14, 2017, at http://www.aarp.org/content/dam/aarp/aarp_foundation/litigation/pdf-beg-02-01-2016/AARP-Testimony-ADEA50-EEOC.pdf 58 For an example of research identifying the continued pervasiveness of age discrimination in a particular employment sector, see David
Neumark, Ian Burn, and Patrick Button, “Age Discrimination and Hiring of Older Workers”, Federal Reserve Bank of San Francisco (2017), at
http://www.frbsf.org/economic-research/publications/economic-letter/2017/february/age-discrimination-and-hiring-older-workers/. 59Laurie McCann, “The ADEA @ 50 – More Relevant Than Ever,” Testimony to US Equal Employment Opportunity Commission, June 14,
2017, at http://www.aarp.org/content/dam/aarp/aarp_foundation/litigation/pdf-beg-02-01-2016/AARP-Testimony-ADEA50-EEOC.pdf.
60ibid. 61Note that the EEOC has not yet clarified whether the use of the term ‘digital native’ in job postings constitutes a violation of the ADEA,
although the EEOC has generally held that the inclusion of language in job postings that discourages protected classes of workers from applying
is illegal. 62AARP, “Staying Ahead of the Curve 2013: The AARP Work and Career Study,” (2014), at
https://www.aarp.org/content/dam/aarp/research/surveys_statistics/general/2014/Staying-Ahead-of-the-Curve-2013-The-Work-and-Career-Study-
AARP-res-gen.pdf. 63ibid.
24
11 states, totaling 40,000 applicants, to see if employers were less likely to respond to the
resumes of older workers than to the resumes of younger workers.64 The study found that
employers were significantly less likely to call back older applicants and that older women
appeared to be discriminated against more frequently than older men.
Discriminatory practices can affect all types of older workers. This includes unemployed older
workers looking for needed work, workers happy in their jobs attempting to stay in their
positions as long as possible, older workers looking to advance in their organization, and workers
looking to switch from their current jobs to a part-time or bridge job before retiring completely.
In FY 2016, the Equal Employment Opportunity Commission (EEOC) received more than
20,000 claims of age discrimination, and over the last 20 years, more than 20 percent of all
charges filed with EEOC have included an age discrimination claim.65 Most of these claims
concern age discrimination in the workplace against employed individuals as opposed to hiring
discrimination, which reflects the fact that it is harder for job applicants to determine why they
were not hired than it is for current employees to determine an injustice in an employment
action. Over the last ten fiscal years, approximately one in every six of these claims has resulted
in an outcome favorable to the charging party.66
Combating age discrimination in the workplace has become more difficult in recent years. A
2009 Supreme Court ruling held that age discrimination claimants must now prove that
discrimination on the basis of age was not just one motivating factor in an adverse employment
decision, but that it was the sole or overriding factor behind the decision.67 This additional
requirement means that workers alleging age discrimination now face a higher burden of proof in
court than do workers alleging discrimination on the basis of race, sex, national origin, or
religion. While discrimination on the basis of age may not always be as easy to see as it was in
the decades before the ADEA, it remains a barrier to older workers and hinders their ability to
find employment and advance within the workplace.
Skills Development and Training
Many older workers find themselves in the position of needing to improve their professional
skills or learn new ones in order to keep up-to-date with the requirements of their current job,
receive a promotion, or find a new job. These workers may face challenges in acquiring new
skills and training, which may significantly hinder their ability to succeed in the workplace or
search for employment. Older workers encountering these challenges can face prolonged periods
of unemployment, and some may leave the labor force altogether.
64David Neumark, Ian Burn, and Patrick Button, “Age Discrimination and Hiring of Older Workers”, Federal Reserve Bank of San Francisco
(2017), at http://www.frbsf.org/economic-research/publications/economic-letter/2017/february/age-discrimination-and-hiring-older-workers/.
65Christina Smith FitzPatrick, “Fact Sheet: Age Discrimination,” AARP, 2014, at http://www.aarp.org/content/dam/aarp/ppi/2014-10/age-
discrimination-fact-sheet-aarp.pdf. US Equal Employment Opportunity Commission, Age Discrimination in Employment Act (Charges filed with
EEOC), FY 1997- FY 2016, at https://www.eeoc.gov/eeoc/statistics/enforcement/adea.cfm. 66This figure refers to the share of all resolutions arrived at between fiscal years 2007 and 2016 that were considered ‘merit resolutions.’ Merit
resolutions are defined by the EEOC as “Charges with outcomes favorable to charging parties and/or charges with meritorious allegations” including “negotiated settlements, withdrawals with benefits, successful conciliations, and unsuccessful conciliations.” US Equal Employment
Opportunity Commission, Age Discrimination in Employment Act (Charges filed with EEOC), FY 1997- FY 2016, at
https://www.eeoc.gov/eeoc/statistics/enforcement/adea.cfm. 67Gross v. FBL Financial Services, Inc., 557 U.S. 167 (2009). Legal Information Inst., Cornell University Law School, at
https://www.law.cornell.edu/supct/html/08-441.ZS.html.
25
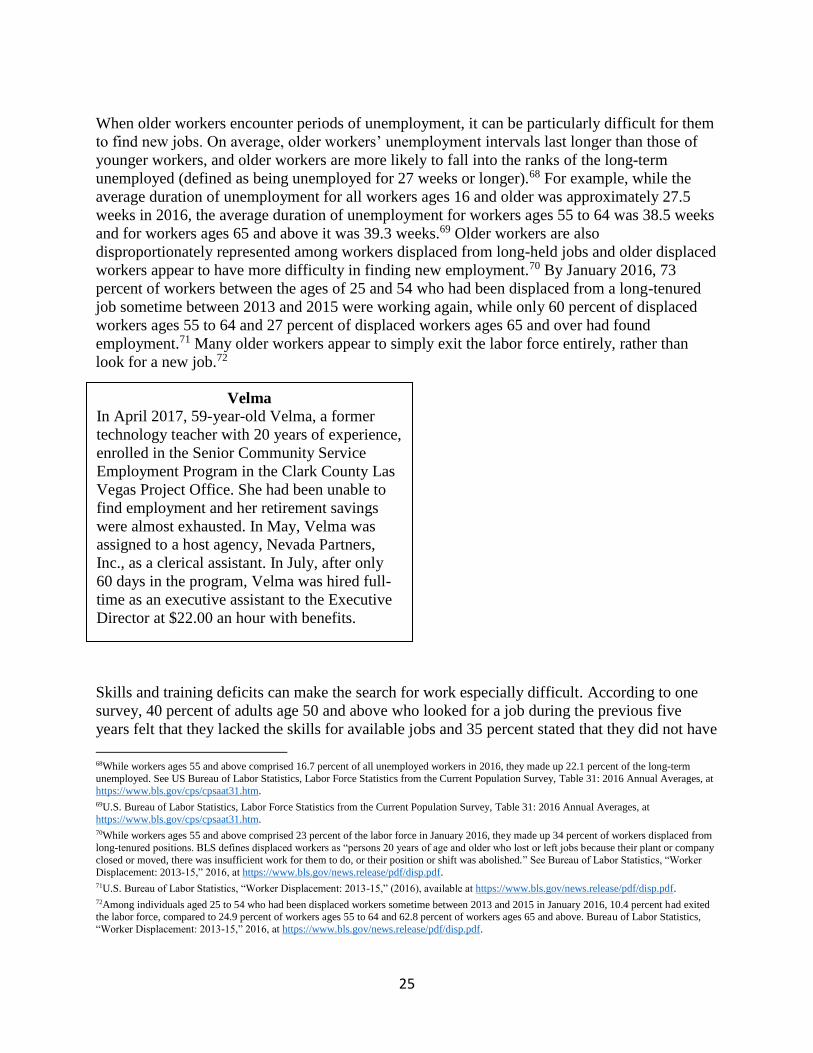
When older workers encounter periods of unemployment, it can be particularly difficult for them
to find new jobs. On average, older workers’ unemployment intervals last longer than those of
younger workers, and older workers are more likely to fall into the ranks of the long-term
unemployed (defined as being unemployed for 27 weeks or longer).68 For example, while the
average duration of unemployment for all workers ages 16 and older was approximately 27.5
weeks in 2016, the average duration of unemployment for workers ages 55 to 64 was 38.5 weeks
and for workers ages 65 and above it was 39.3 weeks.69 Older workers are also
disproportionately represented among workers displaced from long-held jobs and older displaced
workers appear to have more difficulty in finding new employment.70 By January 2016, 73
percent of workers between the ages of 25 and 54 who had been displaced from a long-tenured
job sometime between 2013 and 2015 were working again, while only 60 percent of displaced
workers ages 55 to 64 and 27 percent of displaced workers ages 65 and over had found
employment.71 Many older workers appear to simply exit the labor force entirely, rather than
look for a new job.72
Skills and training deficits can make the search for work especially difficult. According to one
survey, 40 percent of adults age 50 and above who looked for a job during the previous five
years felt that they lacked the skills for available jobs and 35 percent stated that they did not have
68While workers ages 55 and above comprised 16.7 percent of all unemployed workers in 2016, they made up 22.1 percent of the long-term
unemployed. See US Bureau of Labor Statistics, Labor Force Statistics from the Current Population Survey, Table 31: 2016 Annual Averages, at
https://www.bls.gov/cps/cpsaat31.htm.
69U.S. Bureau of Labor Statistics, Labor Force Statistics from the Current Population Survey, Table 31: 2016 Annual Averages, at
https://www.bls.gov/cps/cpsaat31.htm. 70While workers ages 55 and above comprised 23 percent of the labor force in January 2016, they made up 34 percent of workers displaced from
long-tenured positions. BLS defines displaced workers as “persons 20 years of age and older who lost or left jobs because their plant or company
closed or moved, there was insufficient work for them to do, or their position or shift was abolished.” See Bureau of Labor Statistics, “Worker
Displacement: 2013-15,” 2016, at https://www.bls.gov/news.release/pdf/disp.pdf. 71U.S. Bureau of Labor Statistics, “Worker Displacement: 2013-15,” (2016), available at https://www.bls.gov/news.release/pdf/disp.pdf.
72Among individuals aged 25 to 54 who had been displaced workers sometime between 2013 and 2015 in January 2016, 10.4 percent had exited the labor force, compared to 24.9 percent of workers ages 55 to 64 and 62.8 percent of workers ages 65 and above. Bureau of Labor Statistics,
“Worker Displacement: 2013-15,” 2016, at https://www.bls.gov/news.release/pdf/disp.pdf.
Velma
In April 2017, 59-year-old Velma, a former
technology teacher with 20 years of experience,
enrolled in the Senior Community Service
Employment Program in the Clark County Las
Vegas Project Office. She had been unable to
find employment and her retirement savings
were almost exhausted. In May, Velma was
assigned to a host agency, Nevada Partners,
Inc., as a clerical assistant. In July, after only
60 days in the program, Velma was hired full-
time as an executive assistant to the Executive
Director at $22.00 an hour with benefits.
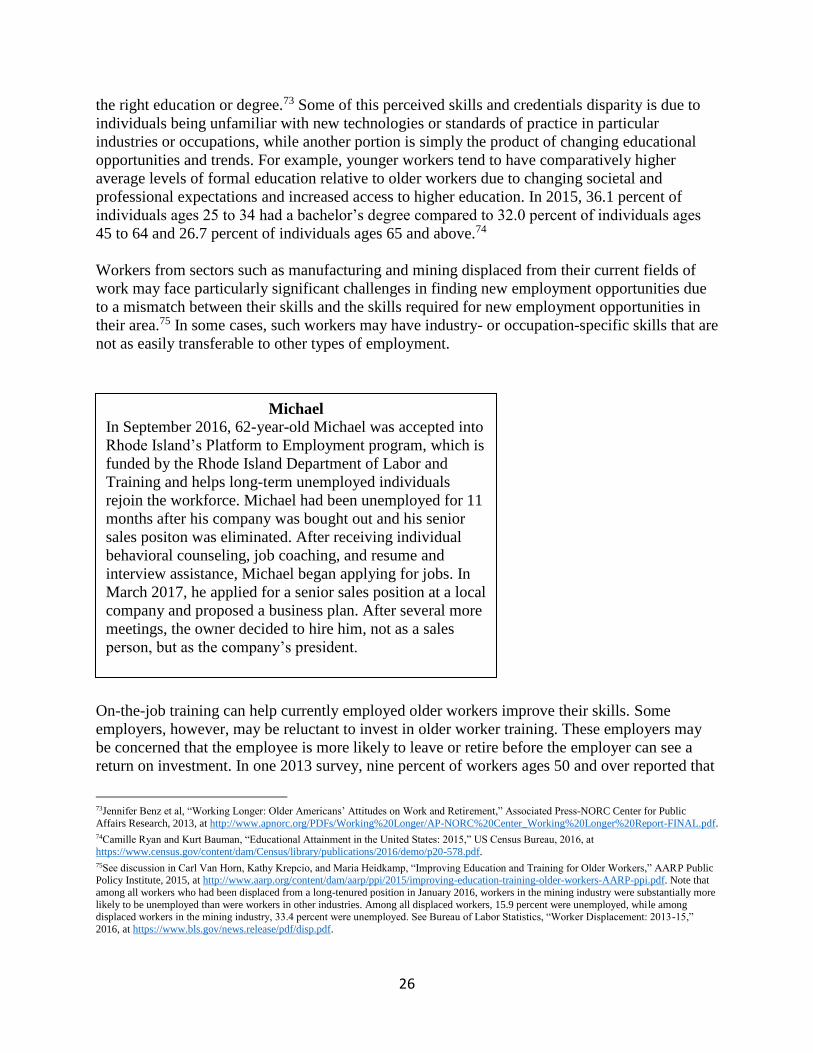
26
the right education or degree.73 Some of this perceived skills and credentials disparity is due to
individuals being unfamiliar with new technologies or standards of practice in particular
industries or occupations, while another portion is simply the product of changing educational
opportunities and trends. For example, younger workers tend to have comparatively higher
average levels of formal education relative to older workers due to changing societal and
professional expectations and increased access to higher education. In 2015, 36.1 percent of
individuals ages 25 to 34 had a bachelor’s degree compared to 32.0 percent of individuals ages
45 to 64 and 26.7 percent of individuals ages 65 and above.74
Workers from sectors such as manufacturing and mining displaced from their current fields of
work may face particularly significant challenges in finding new employment opportunities due
to a mismatch between their skills and the skills required for new employment opportunities in
their area.75 In some cases, such workers may have industry- or occupation-specific skills that are
not as easily transferable to other types of employment.
On-the-job training can help currently employed older workers improve their skills. Some
employers, however, may be reluctant to invest in older worker training. These employers may
be concerned that the employee is more likely to leave or retire before the employer can see a
return on investment. In one 2013 survey, nine percent of workers ages 50 and over reported that
73Jennifer Benz et al, “Working Longer: Older Americans’ Attitudes on Work and Retirement,” Associated Press-NORC Center for Public
Affairs Research, 2013, at http://www.apnorc.org/PDFs/Working%20Longer/AP-NORC%20Center_Working%20Longer%20Report-FINAL.pdf. 74Camille Ryan and Kurt Bauman, “Educational Attainment in the United States: 2015,” US Census Bureau, 2016, at
https://www.census.gov/content/dam/Census/library/publications/2016/demo/p20-578.pdf.
75See discussion in Carl Van Horn, Kathy Krepcio, and Maria Heidkamp, “Improving Education and Training for Older Workers,” AARP Public Policy Institute, 2015, at http://www.aarp.org/content/dam/aarp/ppi/2015/improving-education-training-older-workers-AARP-ppi.pdf. Note that
among all workers who had been displaced from a long-tenured position in January 2016, workers in the mining industry were substantially more
likely to be unemployed than were workers in other industries. Among all displaced workers, 15.9 percent were unemployed, while among displaced workers in the mining industry, 33.4 percent were unemployed. See Bureau of Labor Statistics, “Worker Displacement: 2013-15,”
2016, at https://www.bls.gov/news.release/pdf/disp.pdf.
Michael
In September 2016, 62-year-old Michael was accepted into
Rhode Island’s Platform to Employment program, which is
funded by the Rhode Island Department of Labor and
Training and helps long-term unemployed individuals
rejoin the workforce. Michael had been unemployed for 11
months after his company was bought out and his senior
sales positon was eliminated. After receiving individual
behavioral counseling, job coaching, and resume and
interview assistance, Michael began applying for jobs. In
March 2017, he applied for a senior sales position at a local
company and proposed a business plan. After several more
meetings, the owner decided to hire him, not as a sales
person, but as the company’s president.
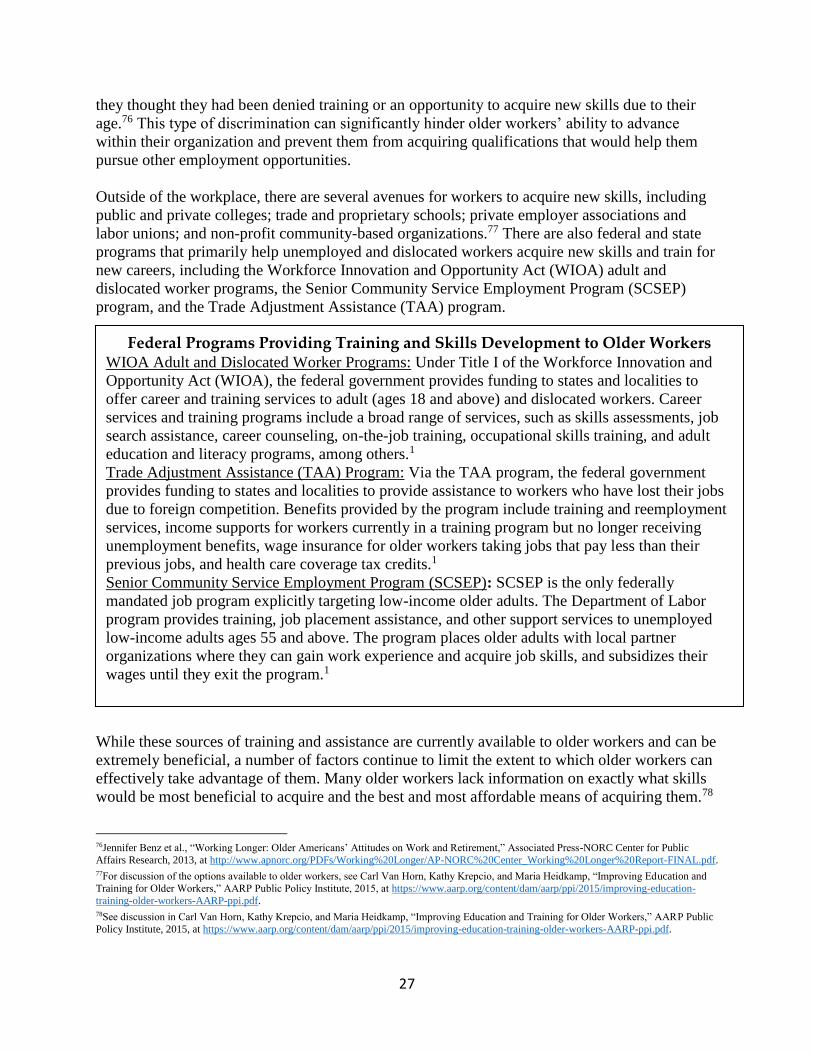
27
they thought they had been denied training or an opportunity to acquire new skills due to their
age.76 This type of discrimination can significantly hinder older workers’ ability to advance
within their organization and prevent them from acquiring qualifications that would help them
pursue other employment opportunities.
Outside of the workplace, there are several avenues for workers to acquire new skills, including
public and private colleges; trade and proprietary schools; private employer associations and
labor unions; and non-profit community-based organizations.77 There are also federal and state
programs that primarily help unemployed and dislocated workers acquire new skills and train for
new careers, including the Workforce Innovation and Opportunity Act (WIOA) adult and
dislocated worker programs, the Senior Community Service Employment Program (SCSEP)
program, and the Trade Adjustment Assistance (TAA) program.
While these sources of training and assistance are currently available to older workers and can be
extremely beneficial, a number of factors continue to limit the extent to which older workers can
effectively take advantage of them. Many older workers lack information on exactly what skills
would be most beneficial to acquire and the best and most affordable means of acquiring them.78
76Jennifer Benz et al., “Working Longer: Older Americans’ Attitudes on Work and Retirement,” Associated Press-NORC Center for Public
Affairs Research, 2013, at http://www.apnorc.org/PDFs/Working%20Longer/AP-NORC%20Center_Working%20Longer%20Report-FINAL.pdf. 77For discussion of the options available to older workers, see Carl Van Horn, Kathy Krepcio, and Maria Heidkamp, “Improving Education and
Training for Older Workers,” AARP Public Policy Institute, 2015, at https://www.aarp.org/content/dam/aarp/ppi/2015/improving-education-
training-older-workers-AARP-ppi.pdf. 78See discussion in Carl Van Horn, Kathy Krepcio, and Maria Heidkamp, “Improving Education and Training for Older Workers,” AARP Public
Policy Institute, 2015, at https://www.aarp.org/content/dam/aarp/ppi/2015/improving-education-training-older-workers-AARP-ppi.pdf.
Federal Programs Providing Training and Skills Development to Older Workers WIOA Adult and Dislocated Worker Programs: Under Title I of the Workforce Innovation and
Opportunity Act (WIOA), the federal government provides funding to states and localities to
offer career and training services to adult (ages 18 and above) and dislocated workers. Career
services and training programs include a broad range of services, such as skills assessments, job
search assistance, career counseling, on-the-job training, occupational skills training, and adult
education and literacy programs, among others.1
Trade Adjustment Assistance (TAA) Program: Via the TAA program, the federal government
provides funding to states and localities to provide assistance to workers who have lost their jobs
due to foreign competition. Benefits provided by the program include training and reemployment
services, income supports for workers currently in a training program but no longer receiving
unemployment benefits, wage insurance for older workers taking jobs that pay less than their
previous jobs, and health care coverage tax credits.1
Senior Community Service Employment Program (SCSEP): SCSEP is the only federally
mandated job program explicitly targeting low-income older adults. The Department of Labor
program provides training, job placement assistance, and other support services to unemployed
low-income adults ages 55 and above. The program places older adults with local partner
organizations where they can gain work experience and acquire job skills, and subsidizes their
wages until they exit the program.1
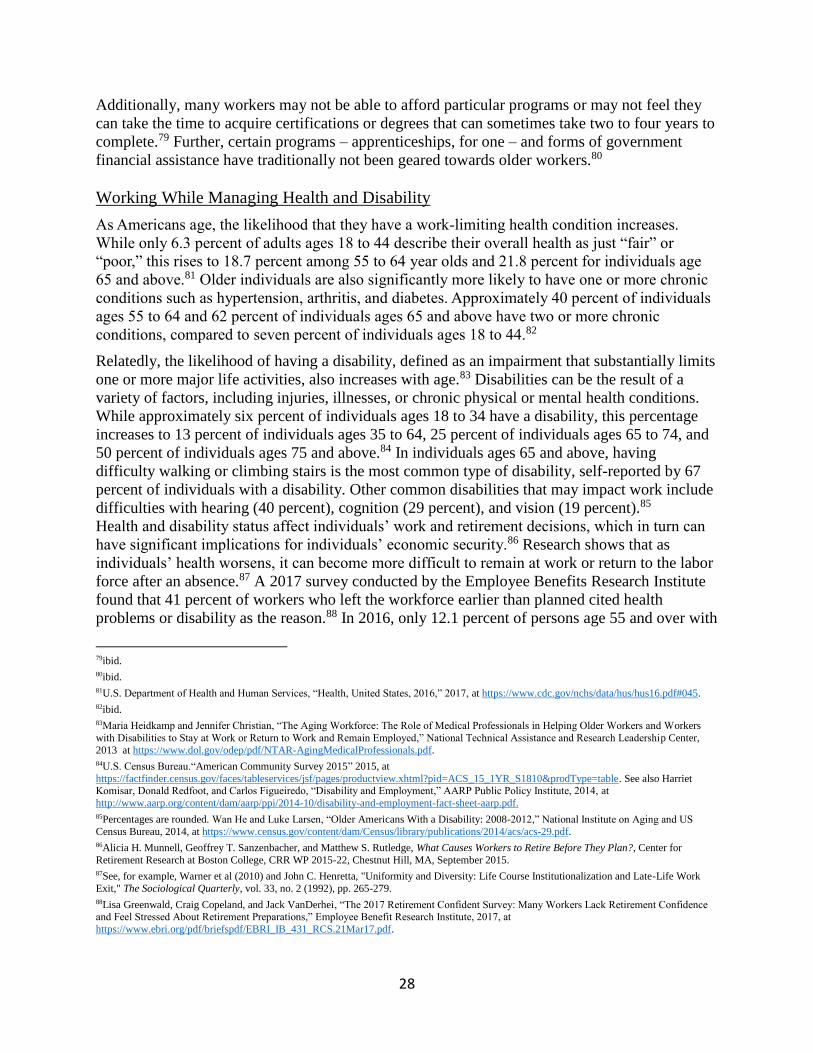
28
Additionally, many workers may not be able to afford particular programs or may not feel they
can take the time to acquire certifications or degrees that can sometimes take two to four years to
complete.79 Further, certain programs – apprenticeships, for one – and forms of government
financial assistance have traditionally not been geared towards older workers.80
Working While Managing Health and Disability
As Americans age, the likelihood that they have a work-limiting health condition increases.
While only 6.3 percent of adults ages 18 to 44 describe their overall health as just “fair” or
“poor,” this rises to 18.7 percent among 55 to 64 year olds and 21.8 percent for individuals age
65 and above.81 Older individuals are also significantly more likely to have one or more chronic
conditions such as hypertension, arthritis, and diabetes. Approximately 40 percent of individuals
ages 55 to 64 and 62 percent of individuals ages 65 and above have two or more chronic
conditions, compared to seven percent of individuals ages 18 to 44.82
Relatedly, the likelihood of having a disability, defined as an impairment that substantially limits
one or more major life activities, also increases with age.83 Disabilities can be the result of a
variety of factors, including injuries, illnesses, or chronic physical or mental health conditions.
While approximately six percent of individuals ages 18 to 34 have a disability, this percentage
increases to 13 percent of individuals ages 35 to 64, 25 percent of individuals ages 65 to 74, and
50 percent of individuals ages 75 and above.84 In individuals ages 65 and above, having
difficulty walking or climbing stairs is the most common type of disability, self-reported by 67
percent of individuals with a disability. Other common disabilities that may impact work include
difficulties with hearing (40 percent), cognition (29 percent), and vision (19 percent).85
Health and disability status affect individuals’ work and retirement decisions, which in turn can
have significant implications for individuals’ economic security.86 Research shows that as
individuals’ health worsens, it can become more difficult to remain at work or return to the labor
force after an absence.87 A 2017 survey conducted by the Employee Benefits Research Institute
found that 41 percent of workers who left the workforce earlier than planned cited health
problems or disability as the reason.88 In 2016, only 12.1 percent of persons age 55 and over with
79ibid. 80ibid. 81U.S. Department of Health and Human Services, “Health, United States, 2016,” 2017, at https://www.cdc.gov/nchs/data/hus/hus16.pdf#045. 82ibid. 83Maria Heidkamp and Jennifer Christian, “The Aging Workforce: The Role of Medical Professionals in Helping Older Workers and Workers
with Disabilities to Stay at Work or Return to Work and Remain Employed,” National Technical Assistance and Research Leadership Center,
2013 at https://www.dol.gov/odep/pdf/NTAR-AgingMedicalProfessionals.pdf. 84U.S. Census Bureau.“American Community Survey 2015” 2015, at
https://factfinder.census.gov/faces/tableservices/jsf/pages/productview.xhtml?pid=ACS_15_1YR_S1810&prodType=table. See also Harriet Komisar, Donald Redfoot, and Carlos Figueiredo, “Disability and Employment,” AARP Public Policy Institute, 2014, at
http://www.aarp.org/content/dam/aarp/ppi/2014-10/disability-and-employment-fact-sheet-aarp.pdf.
85Percentages are rounded. Wan He and Luke Larsen, “Older Americans With a Disability: 2008-2012,” National Institute on Aging and US
Census Bureau, 2014, at https://www.census.gov/content/dam/Census/library/publications/2014/acs/acs-29.pdf. 86Alicia H. Munnell, Geoffrey T. Sanzenbacher, and Matthew S. Rutledge, What Causes Workers to Retire Before They Plan?, Center for
Retirement Research at Boston College, CRR WP 2015-22, Chestnut Hill, MA, September 2015. 87See, for example, Warner et al (2010) and John C. Henretta, "Uniformity and Diversity: Life Course Institutionalization and Late-Life Work
Exit," The Sociological Quarterly, vol. 33, no. 2 (1992), pp. 265-279. 88Lisa Greenwald, Craig Copeland, and Jack VanDerhei, “The 2017 Retirement Confident Survey: Many Workers Lack Retirement Confidence and Feel Stressed About Retirement Preparations,” Employee Benefit Research Institute, 2017, at
https://www.ebri.org/pdf/briefspdf/EBRI_IB_431_RCS.21Mar17.pdf.
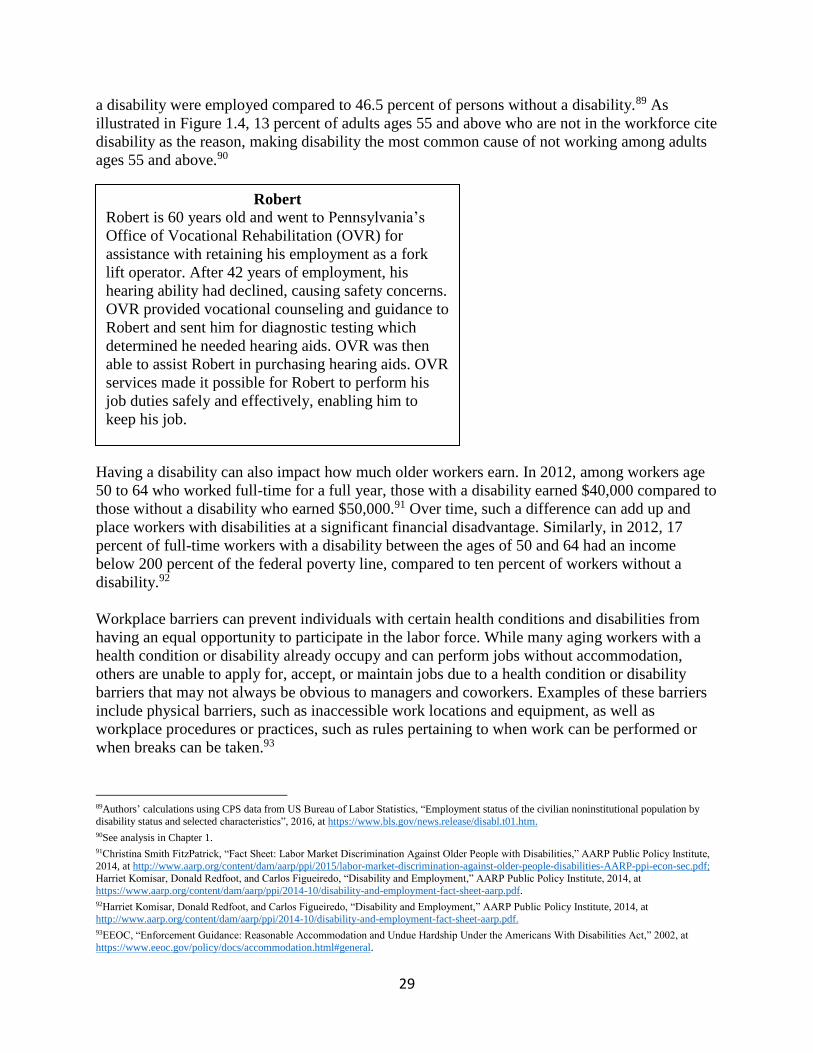
29
a disability were employed compared to 46.5 percent of persons without a disability.89 As
illustrated in Figure 1.4, 13 percent of adults ages 55 and above who are not in the workforce cite
disability as the reason, making disability the most common cause of not working among adults
ages 55 and above.90
Having a disability can also impact how much older workers earn. In 2012, among workers age
50 to 64 who worked full-time for a full year, those with a disability earned $40,000 compared to
those without a disability who earned $50,000.91 Over time, such a difference can add up and
place workers with disabilities at a significant financial disadvantage. Similarly, in 2012, 17
percent of full-time workers with a disability between the ages of 50 and 64 had an income
below 200 percent of the federal poverty line, compared to ten percent of workers without a
disability.92
Workplace barriers can prevent individuals with certain health conditions and disabilities from
having an equal opportunity to participate in the labor force. While many aging workers with a
health condition or disability already occupy and can perform jobs without accommodation,
others are unable to apply for, accept, or maintain jobs due to a health condition or disability
barriers that may not always be obvious to managers and coworkers. Examples of these barriers
include physical barriers, such as inaccessible work locations and equipment, as well as
workplace procedures or practices, such as rules pertaining to when work can be performed or
when breaks can be taken.93
89Authors’ calculations using CPS data from US Bureau of Labor Statistics, “Employment status of the civilian noninstitutional population by
disability status and selected characteristics”, 2016, at https://www.bls.gov/news.release/disabl.t01.htm.
90See analysis in Chapter 1. 91Christina Smith FitzPatrick, “Fact Sheet: Labor Market Discrimination Against Older People with Disabilities,” AARP Public Policy Institute,
2014, at http://www.aarp.org/content/dam/aarp/ppi/2015/labor-market-discrimination-against-older-people-disabilities-AARP-ppi-econ-sec.pdf;
Harriet Komisar, Donald Redfoot, and Carlos Figueiredo, “Disability and Employment,” AARP Public Policy Institute, 2014, at
https://www.aarp.org/content/dam/aarp/ppi/2014-10/disability-and-employment-fact-sheet-aarp.pdf. 92Harriet Komisar, Donald Redfoot, and Carlos Figueiredo, “Disability and Employment,” AARP Public Policy Institute, 2014, at
http://www.aarp.org/content/dam/aarp/ppi/2014-10/disability-and-employment-fact-sheet-aarp.pdf. 93EEOC, “Enforcement Guidance: Reasonable Accommodation and Undue Hardship Under the Americans With Disabilities Act,” 2002, at
https://www.eeoc.gov/policy/docs/accommodation.html#general.
Robert
Robert is 60 years old and went to Pennsylvania’s
Office of Vocational Rehabilitation (OVR) for
assistance with retaining his employment as a fork
lift operator. After 42 years of employment, his
hearing ability had declined, causing safety concerns.
OVR provided vocational counseling and guidance to
Robert and sent him for diagnostic testing which
determined he needed hearing aids. OVR was then
able to assist Robert in purchasing hearing aids. OVR
services made it possible for Robert to perform his
job duties safely and effectively, enabling him to
keep his job.
30
To prevent such barriers from limiting the employment prospects of individuals with disabilities
and to ensure that all persons with disabilities are able to fully participate in society and the labor
market, Congress passed the Americans with Disabilities Act (ADA) in 1990 and significantly
strengthened the law in 2008. The ADA requires that employers provide reasonable
accommodations to employees and job applicants with disabilities, unless doing so would cause
undue hardship. The three major categories of reasonable accommodations outlined in the law
are:
(i) “modifications or adjustments to a job application that enable a qualified applicant
with a disability to be considered for the position such qualified applicant desires; or
(ii) modifications or adjustments to the work environment, or to the manner or
circumstances under which the position held or desired is customarily performed, that
enable a qualified individual with a disability to perform the essential functions of
that position; or
(iii) modifications or adjustments that enable a covered entity’s employee with a disability
to enjoy equal benefits and privileges of employment as are enjoyed by its other
similarly situated employees without disabilities.”94
While the ADA has had a positive impact on the ability of individuals with disabilities to
participate in the workplace, a number of these barriers still exist. Workers and job seekers with
disabilities whose employers refuse to make legally required accommodations or who are
discriminated against in other ways on the basis of their disability can file claims with the EEOC
just as workers facing discrimination on the basis of age can. Approximately 28,000 such ADA
claims were filed in 2016,95 and they were disproportionally from individuals age 50 and
above.96 The most common claim type involves discrimination as a result of orthopedic
disabilities, followed by heart and cardiovascular issues, diabetes, depression, and cancer.97
Caring For Loved Ones While Working
Workers of all ages find it challenging to balance work with caring for loved ones, and this
balance is a particularly salient challenge for older workers. As the country ages and caregiving
needs increase, growing numbers of older workers will be challenged to care for their aging
parents, spouses, and other loved ones while also continuing to work and earn enough money to
cover their personal costs and remain financially secure.
An estimated 43.5 million Americans, or nearly one in every five American adults, serve as
unpaid family caregivers.98 As of 2013, family caregivers provided an estimated $470 billion in
uncompensated long-term care.99 These caregivers are most likely to be caring for a parent or
94EEOC, “Enforcement Guidance: Reasonable Accommodation and Undue Hardship Under the Americans With Disabilities Act,” 2002, at
https://www.eeoc.gov/policy/docs/accommodation.html#general.
95U.S. Equal Employment Opportunity Commission, Age Discrimination in Employment Act (Charges filed with EEOC), FY 1997- FY 2016, at
https://www.eeoc.gov/eeoc/statistics/enforcement/adea.cfm. 96Christina Smith FitzPatrick, “Fact Sheet: Labor Market Discrimination Against Older People with Disabilities,” AARP Public Policy Institute,
2014, at http://www.aarp.org/content/dam/aarp/ppi/2015/labor-market-discrimination-against-older-people-disabilities-AARP-ppi-econ-sec.pdf. 97Christina Smith FitzPatrick, “Fact Sheet: Labor Market Discrimination Against Older People with Disabilities,” AARP Public Policy Institute,
2014, at http://www.aarp.org/content/dam/aarp/ppi/2015/labor-market-discrimination-against-older-people-disabilities-AARP-ppi-econ-sec.pdf.
98AARP Public Policy Institute, “2015 Report: Caregiving in the U.S.,”2015, at http://www.aarp.org/content/dam/aarp/ppi/2015/valuing-the-
invaluable-2015-update-new.pdf. 99ibid.

31
parent-in-law, but among the oldest caregivers, those age 75 and above, caring for a spouse is
more common than caring for a parent or parent-in-law.100 The majority (53 percent) of these
caregivers are age 50 and above, with 34 percent of all caregivers falling between the ages of 50
and 64.101 Many of these caregivers continue to work while providing care to a loved one, with
21 percent of caregivers age 65 and above reporting that they are employed.102 Working full-time
is more common among the younger of these two groups, with 60 percent of working caregivers
ages 50 to 64 working full time compared to 33 percent of working caregivers age 65 and
above.103
As the population continues to age, the demand for informal caregiving will increase and aging
workers increasingly will be faced with balancing work and caregiving roles. According to one
estimate, roughly 40 percent of adults over the age of 50 have parents or parents-in-law that may
require care, and approximately 20 percent have parents already in poor health.104 A 2012 survey
also found that 59 percent of adults in their 50s and 38 percent of adults ages 60 and above said it
seemed very or somewhat likely that they will have to care for an older family member in the
future.105
While the aging of America’s population will result in more workers caring for elderly family
members, the Senate Special Committee on Aging held a hearing in March highlighting that a
new trend is also emerging: the need to care for children left behind by the opioid epidemic.106
Approximately 2.6 million children nationwide are being raised by grandparents or other
extended family or friends because their parents are unable to care for them, and the number of
children in this situation is increasing.107 The opioid epidemic has caused upheaval in families
across the nation and has resulted in a number of older Americans taking responsibility for their
grandchildren.108 Grandparents have reported returning to work after retirement, or staying in the
workforce longer to pay for the unanticipated costs of raising grandchildren. Some of these
grandparents also serve double caregiver roles, caring for both their grandchildren and, in many
cases, for another older individual, such as an aging spouse.
Caregiving is rewarding; however, it can also place significant emotional, physical, and financial
stress on caregivers. Researchers show that caregiving is associated with increased depression,
100ibid.
101ibid.
102ibid. 103ibid.
104Note that the 2012 survey also found that 59 percent of adults in their 50s and 38 percent of adults ages 60 and above said it seemed very or somewhat likely that they will have to care for an older family member in the future. See Kim Parker and Eileen Patten, “The Sandwich
Generation: Rising Financial Burdens for Middle-Aged Americans,” Pew Research Center, 2013, at
http://www.pewsocialtrends.org/2013/01/30/the-sandwich-generation/. 105Kim Parker and Eileen Patten, “The Sandwich Generation: Rising Financial Burdens for Middle-Aged Americans,” Pew Research Center,
2013, at http://www.pewsocialtrends.org/2013/01/30/the-sandwich-generation/.
106 U.S. Congress, Senate Special Committee on Aging, Grandparents to the Rescue: Raising Grandchildren in the Opioid Crisis and Beyond,
115th Cong., 1st sess., March 21, 2017 (Washington, DC: GPO, 2017). 107Estimate is derived from CPS data from years 2014-2016 and can be found at Kids Count Data Center, “Children in kinship care,” 2016, at
http://datacenter.kidscount.org/data/tables/7172-children-in-kinship- care?loc=1&loct=1#detailed/1/any/false/1564/any/14207,14208. 108 Generations United, “State of Grandfamilies in America: 2016. Raising the Children of the Opioid Epidemic: Solutions and Support for
Grandfamilies” 2016, at https://dl2.pushbulletusercontent.com/qdCNUO2JMMZKzKRjyIlwbgjMtf39xkKa/16-Report-SOGF-Final.pdf.
32
anxiety, sleep problems, pain, weakness, low energy, and exhaustion.109 Caregivers also often
face substantial out-of-pocket costs related to caregiving, with one recent study estimating that
family caregivers spend an average of nearly $7,000 on such costs per year.110 Working while
providing care to a loved one can exacerbate these challenges. According to one 2015 survey,
approximately half of working caregivers who are caring for an adult report having to go in late,
leave early, or take time off as a result of caregiving. In addition to disruptions in the work
schedule, 15 percent of family caregivers report taking a leave of absence and 14 percent report
reducing work hours or taking a less demanding job.111 Cutting back on work or giving it up
because of caregiving can lead to reduced income and reduced access to employer benefits such
as health care coverage, as well as long-term reductions in Social Security and pension
benefits.112
Preparing for the Transition into Retirement
A primary challenge faced by workers preparing to leave the workforce is ensuring that they
have adequately prepared themselves financially for retirement. Many workers spend their entire
careers saving for retirement, which can be complicated due to factors including low wages,
household expenses, health emergencies, and economic factors. How prepared an older worker is
for retirement and what financial challenges they may face in retirement can significantly impact
their decisions about whether and for how long to stay in the labor force.
In a 2016 Transamerica survey, when respondents were asked what their greatest financial
priority was right now, the most commonly cited answer for both Baby Boomer responders (39
percent) and Gen X responders (31 percent) was “saving for retirement.”113 When looking at
older workers’ confidence in their financial situation heading toward retirement, while majorities
consistently say they do feel prepared, the share of workers who express a lack of confidence is
substantial. For example, a January 2017 USA Today poll found that among workers ages 45 to
65, 59 percent say they were very or somewhat prepared for retirement. However, 41 percent
indicated that they were not confident they were prepared.114 Similarly, a 2016 poll from the
Employee Benefits Research Institute found that while 65 percent of workers ages 50 and above
felt they were either “somewhat” or “very confident” that they would have enough money to live
109See Brenda Spillman et al., “Informal Caregiving for Older Americans: An Analysis of the 2011 National Study of Caregiving,” 2014, at
https://aspe.hhs.gov/report/informal-caregiving-older-americans-analysis-2011-national-study-caregiving; discussion in Department of Labor, “Navigating the Demands of Work and Eldercare,” 2017, at
https://www.dol.gov/sites/default/files/NavigatingTheDemandsOfWorkAndEldercare.pdf.
110Chuck Rainville, Laura Skufca, and Laura Mehegan, “Family Caregiving and Out-of-Pocket Costs: 2016 Report,” AARP, 2016, at
http://www.aarp.org/content/dam/aarp/research/surveys_statistics/ltc/2016/family-caregiving-cost-survey-res-ltc.pdf. 111AARP Public Policy Institute, “2015 Report: Caregiving in the U.S.,” 2015, at http://www.aarp.org/content/dam/aarp/ppi/2015/caregiving-in-
the-united-states-2015-report-revised.pdf. 112See discussion in Department of Labor, “Navigating the Demands of Work and Eldercare,” 2017, at
https://www.dol.gov/sites/default/files/NavigatingTheDemandsOfWorkAndEldercare.pdf. For one example of potential financial impact of
caregiving for older workers, see MetLife Mature Market Institute, “The MetLife Study of Caregiving Costs to Working Caregivers: Double Jeopardy for Baby Boomers Caring for Their Parents,” 2011, at http://www.caregiving.org/wp-content/uploads/2011/06/mmi-caregiving-costs-
working-caregivers.pdf.
113In this survey, ‘Baby Boomers’ refers to individuals born between 1946 and 1964, ‘Gen X’ refers to individuals born between 1965 and 1978, and ‘Millennials’ refers to individuals born between 1979 and 2000. See Catherine Collinson, “Perspectives on Retirement: Baby Boomers,
Generation X, and Millennials,” Transamerica Center for Retirement Studies 2016, at https://www.transamericacenter.org/docs/default-
source/retirement-survey-of-workers/tcrs2016_sr_perspectives_on_retirement_baby_boomers_genx_millennials.pdf. 114Paul Davidson, “Older Workers Feel on Track for Retirement. Are They?” USA Today, January 31, 2017, at
https://www.usatoday.com/story/money/2017/01/31/older-workers-feel-track-retirement-they/97162652/.
33
comfortably throughout retirement, 35 percent said they were “not too” or “not at all
confident.”115
Many older workers are particularly concerned about whether they will have enough money to
last through retirement and be able to afford health care expenses. While all Americans age 65
and over qualify for Medicare coverage, workers also are aware of the substantial out-of-pocket
medical costs that they can incur, as their period of retirement can last up to 30 years or more.
According to one recent survey, 63 percent of people age 50 and above listed their greatest
retirement worry as not being able to afford health care and long-term care costs, making it the
top retirement-specific concern identified.116
The realities of workers’ financial situations chiefly shape concerns about being financially
prepared for retirement. While some older workers have been able to accumulate enough in
earning to save sufficiently for retirement, many have not been able to do so. According to a
2015 Government Accountability Office (GAO) report analyzing 2013 data, 29 percent of
households age 55 and over have neither retirement savings in an account like a 401(k) or
individual retirement account (IRA) nor a defined-benefit pension.117 Among those with savings,
the median value saved was $104,000 for households ages 55 to 64 and $148,000 for households
ages 65 to 74.118 Having savings or pensions is positively associated with income, education,
health, and employment status.119 Studies generally estimate that between one-third to two-thirds
of workers of all ages are at risk of not having enough money to maintain their standard of living
in retirement.120
Many individuals also report a lack of confidence in their own ability to manage their assets and
successfully navigate their transition into retirement. According to one 2016 survey, only 57
percent of workers age 50 and above report that they have tried to calculate how much they
would need to save for a comfortable retirement, and only 35 percent have attempted to estimate
how much money they would need to cover health expenses in retirement.121 According to 2017
data, among all workers age 25 and above, 52 percent say they are very or somewhat confident
115Note that data from the Employee Benefits Research Institute survey was analyzed by AARP. See Alicia Williams and Eowna Young Harrison,
“2016 Retirement Confidence Survey,” AARP, 2016, at http://www.aarp.org/content/dam/aarp/research/surveys_statistics/econ/2017/2016-rc-
report-res-econ.pdf. 116Nanci Hellmich, “Top Retirement Financial Concern: Health Care Bills,” USA Today, September 12, 2014, at
https://www.usatoday.com/story/money/personalfinance/2014/09/12/health-care-costs-retirement/15348233/.
117Government Accountability Office, “Retirement Security: Most Households Approaching Retirement Have Low Savings,” 2015, at
http://www.gao.gov/assets/680/670153.pdf.
118ibid. See also Board of Governors of the Federal Reserve System, “Report on the Economic Well-Being of U.S. Households in 2016,” 2017, at
https://www.federalreserve.gov/publications/files/2016-report-economic-well-being-us-households-201705.pdf. 119Government Accountability Office, “Retirement Security: Most Households Approaching Retirement Have Low Savings,” 2015,at
http://www.gao.gov/assets/680/670153.pdf; Board of Governors of the Federal Reserve System, “Report on the Economic Well-Being of U.S.
Households in 2016,” 2017, at https://www.federalreserve.gov/publications/files/2016-report-economic-well-being-us-households-201705.pdf. 120Note that the methodologies and assumptions utilized by these studies can vary significantly, which in turn can produce significantly different
estimates. For more details of these estimates, see Government Accountability Office, “Retirement Security: Most Households Approaching
Retirement Have Low Savings,” 2015, at http://www.gao.gov/assets/680/670153.pdf. 121Alicia Williams and Eowna Young Harrison, “2016 Retirement Confidence Survey,” AARP, 2016, at
http://www.aarp.org/content/dam/aarp/research/surveys_statistics/econ/2017/2016-rc-report-res-econ.pdf.
34
they know how to protect accumulated retirement savings.122 Among workers with at least some
assets in a self-directed retirement plan (like a 401(k) plan or IRA), 53 percent report they are
either not comfortable or only slightly comfortable making investment decisions in these
accounts.123 Despite Social Security being one of the most critical sources of retirement income
for many retirees, more than a third of workers age 50 and above report that they have not
attempted to estimate the amount they will receive in Social Security at their planned retirement
age.124
Contributing to this uncertainty is the fact that many Americans have a difficult time navigating
the financial system and have low levels of financial literacy. Studies conducted by the Social
Security Administration have found that households or individuals who are less financially
literate are less likely to have a checking account, maintain an emergency fund, invest in stocks,
or have a retirement plan.125 However, just as low levels of financial literacy appear to lead to
poorer financial outcomes, there is also evidence that assistance with financial planning can lead
households to better financial outcomes and more wealth accumulation.126 For example,
retirement counseling programs have been shown to increase household savings, although many
Americans lack access to such programs.127
The concerns and uncertainty many workers face can influence their decision-making and how
and when they choose to move out of the workforce. Americans who feel unprepared for
retirement or who are concerned about their ability to cover expenses, such as out-of-pocket
health expenditures, may continue working later in life than they would have otherwise, or
remain employed by an employer offering particular benefits instead of changing jobs. A 2014
survey found that of workers who intended to delay retirement beyond their target retirement
age, the second most oft-reported reason for doing so was “inadequate finances or can’t afford to
retire” (18 percent of respondents), which trailed only “the poor economy” (25 percent of
respondents).128 Another 12 percent cited “needing to pay for health care costs” and 8 percent
cited “wanting to make sure they have enough money to retire comfortably.” Multiple studies,
122Note that this information is from is the 2017 iteration of the Retirement Confidence Survey. The 2016 iteration was previously cited, but not
all questions were identical in the two versions of the survey, which is why both are being used and not only the most recent iteration. Lisa
Greenwald, Craig Copeland, and Jack VanDerhei, “The 2017 Retirement Confidence Survey: Many Workers Lack Retirement Confidence and Feel Stressed About Retirement Preparations,” Employee Benefit Research Institute, 2017, at
https://www.ebri.org/pdf/surveys/rcs/2017/IB.431.Mar17.RCS17..21Mar17.pdf.
123Lisa Greenwald, Craig Copeland, and Jack VanDerhei, “The 2017 Retirement Confident Survey: Many Workers Lack Retirement Confidence and Feel Stressed About Retirement Preparations,” Employee Benefit Research Institute, 2017, at
https://www.ebri.org/pdf/briefspdf/EBRI_IB_431_RCS.21Mar17.pdf; Board of Governors of the Federal Reserve System, “Report on the
Economic Well-Being of U.S. Households in 2016,” 2017, at https://www.federalreserve.gov/publications/files/2016-report-economic-well-
being-us-households-201705.pdf. 124Alicia Williams and Eowna Young Harrison, “2016 Retirement Confidence Survey,” AARP, 2016, at
http://www.aarp.org/content/dam/aarp/research/surveys_statistics/econ/2017/2016-rc-report-res-econ.pdf. 125William Gale, Benjamin Harris, and Ruth Levine, “Raising Household Saving: Does Financial Education Work” Social Security
Administration, 2012, at https://www.ssa.gov/policy/docs/ssb/v72n2/v72n2p39.html.
126Justine Hastings, Brigitte Madrian and William Skimmyhorn, “Financial Literacy, Financial Education and Economic Outcomes”, National
Institutes of Health, April 2013, available at http://www.ncbi.nlm.nih.gov/pmc/articles/PMC3753821/. 127William Gale, Benjamin Harris, and Ruth Levine, “Raising Household Saving: Does Financial Education Work” Social Security
Administration, 2012, at https://www.ssa.gov/policy/docs/ssb/v72n2/v72n2p39.html. 128Employee Benefit Research Institute, “2016 RCS Fact Sheet #2: Expectations About Retirement,” 2016, available at
https://www.ebri.org/files/RCS_16.FS-2_Expects1.pdf.
35
however, have found that while many workers may intend to continue working well into old age
or while retired for a variety of reasons, much smaller shares end up actually doing so.129
The aging of America’s workforce presents great opportunities for workers, and also brings to
the forefront a number of issues faced by older workers that ought to be appropriately addressed
if all older workers are to be able to meet their personal goals and achieve financial security. As
employers, workers, and policymakers across the country find new and innovative ways to
address these challenges and meet the unique needs of older workers, individuals, families,
employers, and the national economy as a whole will benefit.
129Lisa Greenwald, Craig Copeland, and Jack VanDerhei, “The 2017 Retirement Confident Survey: Many Workers Lack Retirement Confidence
and Feel Stressed About Retirement Preparations,” Employee Benefit Research Institute, 2017, at https://www.ebri.org/pdf/briefspdf/EBRI_IB_431_RCS.21Mar17.pdf; Government Accountability Office, “Retirement Security: Most
Households Approaching Retirement Have Low Savings,” 2015, at http://www.gao.gov/assets/680/670153.pdf.
36
Chapter 3: Employer Responses to the Aging
Workforce
The aging American workforce presents a novel development to employers. While employers are
aware of this phenomenon, and a significant share consider their workplaces age-friendly, most
have not yet modified internal policies or adopted practices in response to the changing
demographics of their employees.
In 2017, in responses to the U.S. Senate Special Committee on Aging’s request for comments,
stakeholders noted that there is a large and growing gap between what aging workers aspire to do
and what they actually do.130 This discrepancy between the inclinations of America’s aging
workers and the lack of adaptions among employers and other organizations is partially the result
of “structural lag.” A classic example of structural lag occurred when the Baby Boom generation
entered the nation’s elementary school system and necessitated a change in structures and
processes to meet the demands of a larger and more diverse student body (e.g., need to hire more
teachers, build more classrooms, etc.).131 As Baby Boomers and successive generations continue
to work into older age, we again face a structural lag as employers and other organizations are
presented with new demands and opportunities to alter structures and processes that support
aging employees.
This chapter describes how employers are already responding to the aging of the workforce and
highlights what types of employer programs and policies can be particularly beneficial to older
workers. Among the key takeaways from this analysis are:
The aging workforce presents opportunities to employers, and the business case for
accommodating the aging workforce is well-established.
Several employers have developed viable responses and best practices which are
diverse in their structure and implementation.
Organizations that are responding to the aging workforce have human resource
professionals who are knowledgeable about the aging of the workforce and trained in
aging-related matters.
The Opportunities Presented by an Aging Workforce
The continued aging of the American workforce presents employers with a number of
opportunities. As highlighted in Chapter 1, the size of the older workforce is expected to grow
substantially in the next several years while the size of the younger workforce will remain
comparatively dormant. Employers will be increasingly drawing on older workers to address
130 J. Rogers, Vice President of Government Affairs, AARP. Letter Submitted in Response to the Senate Special Committee on Aging July 31,
2017. 131 For an explanation of the structural lag concept, see Janet Wilmoth, “Aging Policy and Structural Lag,” in The New Politics of Old Age Policy,
2nd ed. Robert B. Hudson, (Baltimore, MD: Johns Hopkins Press, 2010), pp. 42-63.
37
their workforce needs and can benefit from older workers’ experience, productivity, and
engagement.
There are a number of benefits to hiring and retaining older workers.132 In a national survey of
large and small firms across several industries, seven out of every ten human resource
professionals identified older workers’ experience, maturity, and work ethic as the main
advantages of employing persons age 55 and above.133 Another advantage cited by over six in
ten human resource professionals is older workers’ ability to serve as mentors to younger
workers.134 Mentoring and sharing of knowledge and skills between employees can help
organizations meet current demands and better prepare for the future by reducing the amount of
institutional knowledge that is lost when older workers retire.
Another valuable characteristic of older workers is the high levels of workplace engagement they
display. Engagement can be described in different ways, but generally refers to employees’
personal involvement and connection with their job. Older workers consistently show high levels
of engagement at work, which have been associated with improved employer outcomes such as
lower turnover and increased productivity.135
The Business Case
When the opportunities and challenges are contrasted, a strong business case for employing
aging workers remains, and recruiting and retaining older workers can be critical to employers’
success. One such case model is based on five key points: (1) the aging workforce is growing at
a time when 40 percent of employers report having difficulty filling jobs, and recruiting and
retaining older workers may address these workforce shortfalls; (2) the increased levels of
engagement among older worker corresponds with increased revenue for the firm; (3) resource
commitments to aging workers and other workers can be largely indistinguishable (4) aging
workers stay longer in their positions and expect to remain in the workforce longer, and (5)
employers increasingly have found that strategies developed to recruit and retain older workers
132 For discussion of “soft” organizational benefits of hiring and retaining older workers, see (AARP, Business Executives’ Attitudes Toward the
Aging Workforce: Aware But Not Prepared, October 2006, at https://assets.aarp.org/rgcenter/econ/aging_workforce.pdf; Cheryl Paullin, “The
Aging Workforce: Leveraging the Talents of Mature Employees,” SHRM Foundation, Effective Practice Guidelines Series, 2014, at https://www.shrm.org/hr-today/trends-and-forecasting/special-reports-and-expert-views/Documents/Aging-Workforce-Talents-Mature-
Employees.pdf.
133 Society for Human Resource Management, “SHRM Survey Findings: The Aging Workforce – Basic and Applied Skill,” 2015, at https://www.shrm.org/hr-today/trends-and-forecasting/research-and-surveys/Documents/2014-Older-Workers-Survey-Overall-Results-Part3-
Basic-and-Applied-Skills.pdf.
134 ibid.
135 For examples of measurements of employee engagement and discussion of its connection to employer outcomes, see, for example: Roselyn
Feinsod and Erika Illiano, A Business Case for Workers Age 50+: A look at the Value of Experience, a report prepared for AARP by Aon Hewitt,
(2015), at http://www.aarp.org/content/dam/aarp/research/surveys_statistics/general/2015/A-Business-Case-Report-for-Workers%20Age%2050Plus-res-gen.pdf; Marcie Pitt-Catsouphes and Chrstine Matz-Costa, Engaging the 21st Century Multi-Generational
Workforce, Sloan Center on Aging & Work, (2009), at
https://www.bc.edu/content/dam/files/research_sites/agingandwork/pdf/publications/IB20_Engagement.pdf; Jim Harter and Sangeeta Agrawal, Older Baby Boomers More Engaged at Work Than Younger Boomers, Gallup, (2015), at http://www.gallup.com/poll/181298/older-baby-
boomers-engaged-work-younger-boomers.aspx; Susan Sorenson, How Employee Engagement Drives Growth, Gallup, (2013), at
http://www.gallup.com/businessjournal/163130/employee-engagement-drives-growth.aspx; Francine Tishman, Sara Van Looy, and Susanne Bruyère, Employer Strategies for Responding to an Aging Workforce, National Technical Assistance and Research Leadership Center, (2012), at
https://www.dol.gov/odep/pdf/NTAR_Employer_Strategies_Report.pdf.

38
spillover and can be applied to their entire workforce.136 The bottom line is that the benefits of
recruiting and retaining aging workers can be significant.
Employer Policies and Programs for Older Workers
Employers can and are developing a range of policies and programs to support the increasing
number of older workers they employ. These policies and programs can facilitate opportunities
as well as address the challenges facing older workers described in Chapter 2, including helping
workers receive training and acquire new skills, continue to work while managing physical
limitations, work while meeting caregiving responsibilities, and prepare financially for
retirement.137 Such efforts range from health initiatives aligned with employee health insurance
benefits, wellness programs, and employee assistance programs to the active promotion of
increased retirement savings and provision of financial education. Employers can also help
facilitate successful transitions from work into a second career or into retirement via educational
programs, training programs, and other workplace supports to retain and attract older workers,
and arrangements to enable older employees who wish to move from full-time positions to more
flexible, part-time positions to do so.138 An in-depth discussion of the ways in which employers
are responding to the needs of their older workers is presented below.
Training and Skill Development
Employers can play a critical role in helping their older employees improve their knowledge base
and acquire new skills so as to stay up-to-date with the requirements of the modern labor force.
Employer programs can range from on-the-job training programs for current employees, to
supporting employees receiving education or training outside of work. Still, a recent survey of
1,731employers revealed that only 42% have increased their training and cross-training efforts in
response to the aging workforce.139
Alternatively, employers more often rely on and sometimes partner with government, labor
unions, non-profits, or other organizations to improve the skills of their current and prospective
employees. Such programs are not only beneficial to older workers themselves, but can also
136 Roselyn Feinsod and Erika Illiano, A Business Case for Workers Age 50+: A look at the Value of Experience, a report prepared for AARP by
Aon Hewitt, (2015), at http://www.aarp.org/content/dam/aarp/research/surveys_statistics/general/2015/A-Business-Case-Report-for-
Workers%20Age%2050Plus-res-gen.pdf. 137 Lauren Eyster, Richard W. Johnson, and Eric Toder. Current Strategies to Employ and Retain Older Workers, The Urban Institute, January
2008, at https://www.urban.org/sites/default/files/publication/31531/411626-Current-Strategies-to-Employ-and-Retain-Older-Workers.PDF. 138 For an example on how institutions of higher education are educating employees about successful work transitions, see Conrad S. Ciccotello,
E. Jill Pollock, and Paul J. Yakoboski, “Understanding the Reluctant Retiree on Campus: Helping Individuals Make the Right Retirement
Decision,” TIAA-CREF Institute, Trends and Issues, July 2011, at https://www.tiaainstitute.org/sites/default/files/presentations/2017-02/ti_reluctantretirees_0711a.pdf; TIAA-CREF Institute, Creating a Path Forward for Reluctant Retirees, 2014,
https://www.tiaa.org/public/pdf/C21232_Creating-a-path-forward-for-reluctant-retirees.pdf. For information on how employers can facilitate
employees’ transition to flexible work arrangements, Cheryl Paullin, “The Aging Workforce: Leveraging the Talents of Mature Employees,” SHRM Foundation, Effective Practice Guidelines Series, 2014, at https://www.shrm.org/hr-today/trends-and-forecasting/special-reports-and-
expert-views/Documents/Aging-Workforce-Talents-Mature-Employees.pdf.
139 Society for Human Resource Management, “SHRM Survey Findings: The Aging Workforce – Basic and Applied Skill,” 2015, at https://www.shrm.org/hr-today/trends-and-forecasting/research-and-surveys/Documents/2014-Older-Workers-Survey-Overall-Results-Part3-
Basic-and-Applied-Skills.pdf.
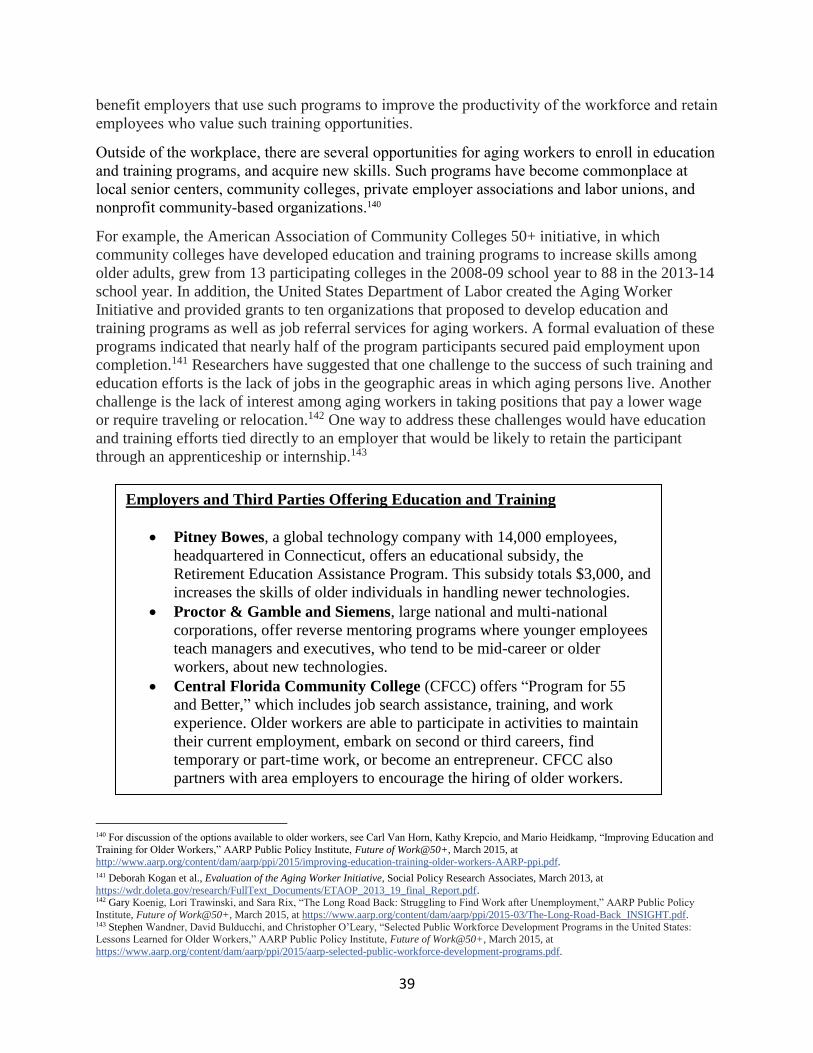
39
benefit employers that use such programs to improve the productivity of the workforce and retain
employees who value such training opportunities.
Outside of the workplace, there are several opportunities for aging workers to enroll in education
and training programs, and acquire new skills. Such programs have become commonplace at
local senior centers, community colleges, private employer associations and labor unions, and
nonprofit community-based organizations.140
For example, the American Association of Community Colleges 50+ initiative, in which
community colleges have developed education and training programs to increase skills among
older adults, grew from 13 participating colleges in the 2008-09 school year to 88 in the 2013-14
school year. In addition, the United States Department of Labor created the Aging Worker
Initiative and provided grants to ten organizations that proposed to develop education and
training programs as well as job referral services for aging workers. A formal evaluation of these
programs indicated that nearly half of the program participants secured paid employment upon
completion.141 Researchers have suggested that one challenge to the success of such training and
education efforts is the lack of jobs in the geographic areas in which aging persons live. Another
challenge is the lack of interest among aging workers in taking positions that pay a lower wage
or require traveling or relocation.142 One way to address these challenges would have education
and training efforts tied directly to an employer that would be likely to retain the participant
through an apprenticeship or internship.143
140 For discussion of the options available to older workers, see Carl Van Horn, Kathy Krepcio, and Mario Heidkamp, “Improving Education and
Training for Older Workers,” AARP Public Policy Institute, Future of Work@50+, March 2015, at
http://www.aarp.org/content/dam/aarp/ppi/2015/improving-education-training-older-workers-AARP-ppi.pdf. 141 Deborah Kogan et al., Evaluation of the Aging Worker Initiative, Social Policy Research Associates, March 2013, at
https://wdr.doleta.gov/research/FullText_Documents/ETAOP_2013_19_final_Report.pdf. 142 Gary Koenig, Lori Trawinski, and Sara Rix, “The Long Road Back: Struggling to Find Work after Unemployment,” AARP Public Policy
Institute, Future of Work@50+, March 2015, at https://www.aarp.org/content/dam/aarp/ppi/2015-03/The-Long-Road-Back_INSIGHT.pdf. 143 Stephen Wandner, David Bulducchi, and Christopher O’Leary, “Selected Public Workforce Development Programs in the United States: Lessons Learned for Older Workers,” AARP Public Policy Institute, Future of Work@50+, March 2015, at
https://www.aarp.org/content/dam/aarp/ppi/2015/aarp-selected-public-workforce-development-programs.pdf.
Employers and Third Parties Offering Education and Training
Pitney Bowes, a global technology company with 14,000 employees,
headquartered in Connecticut, offers an educational subsidy, the
Retirement Education Assistance Program. This subsidy totals $3,000, and
increases the skills of older individuals in handling newer technologies.
Proctor & Gamble and Siemens, large national and multi-national
corporations, offer reverse mentoring programs where younger employees
teach managers and executives, who tend to be mid-career or older
workers, about new technologies.
Central Florida Community College (CFCC) offers “Program for 55
and Better,” which includes job search assistance, training, and work
experience. Older workers are able to participate in activities to maintain
their current employment, embark on second or third careers, find
temporary or part-time work, or become an entrepreneur. CFCC also
partners with area employers to encourage the hiring of older workers.
40
Health, Wellness, and Disability Accommodation
Promoting employee health and enabling workers with work-impacting health conditions and
disabilities to succeed in the workplace can also benefit both older workers and their employers.
Employer programs and policies addressing these needs can range from providing quality health
insurance to employees, to putting in place programs that actively promote good health among
those who wish to participate, to appropriately accommodating workers’ disabilities.
A 2017 study reported that 79 percent of employers offer health insurance to their employees,144
and access to health insurance is particularly important to older employees. As noted in Chapter
2, older workers on average have poorer health and more complex medical conditions than do
younger workers, which makes access to affordable health insurance coverage particularly
important to them. For employers, employer-provided health insurance has been shown to
correlate with increased work output and reduced disability leaves.145 Via their health plans,
employers can also offer benefits that are particularly relevant to older workers such as access to
free vaccinations and programs designed to prevent, manage, or delay the onset of age-related
disease and disability.146 Older individuals who do not have access to stable coverage through
their employers may compensate in a variety of ways, including taking bridge jobs or working to
later ages.
Accommodating the needs of workers with work-impacting health conditions and disabilities is
another step that employers take to help older workers and the employer succeed. Although
older workers are more likely to have one or more conditions associated with a disease or
disability, these conditions do not need to prevent them from working.147 Research shows that
employers and maturing workers may benefit from strategies designed to support those workers
with health needs and with disabilities.148 Employers also have a legal obligation under the ADA
to provide reasonable accommodation to workers with disabilities, and failing to do so can
result in punitive action and leave employers vulnerable to lawsuits.
144 Catherine Collinson, All About Retirement: An Employer Survey. TransAmerica Center for Retirement Studies, August 2017, at
https://www.transamericacenter.org/docs/default-source/employer-research/tcrs2017_sr_employer_research.pdf. 145Kenneth Pelletier, “A review and analysis of the clinical and cost- effectiveness studies of comprehensive health promotion and disease management programs at the worksite: Update VI 2000– 2004,” American College of Occupational and Environmental Medicine, Journal of
Occupational a n d E n v i r o n m e n t a l M e d i c i n e , Vol. 47, No. 10, (October 2005). 146 Lauren Eyster, Richard W. Johnson, and Eric Toder. Current Strategies to Employ and Retain Older Workers, The Urban Institute, January 2008, at https://www.urban.org/sites/default/files/publication/31531/411626-Current-Strategies-to-Employ-and-Retain-Older-Workers.PDF. 147 Francine M. Tishman, Sara Van Looy, and Susanne M. Bruyere, Employer Strategies for Responding to an Aging Workforce, The NTAR
Leadership Center, March 2012. 148 Judith Mitchell, Rodney Adkins, and Bryan Kemp, “The Effects of Aging on Employment of People With and Without Disabilities,”
Rehabilitation Counseling Bulletin, Vol. 49, No. 3, pp. 157-165, (2006).
American Express, the financial services company headquartered in New York,
offers the Healthy Living Program, which supports employees of all ages,
including older workers. The program seeks to improve employee and
dependents' health with coaching, screenings, wellness centers, activity rooms,
and other offerings. The program also provides mental health support.
Employees of all ages are encouraged to lend a sympathetic ear and
participate in the “I Will Listen” campaign.
41
Well-designed voluntary employer-sponsored wellness programs may support aging employees
as well. While such programs must be carefully structured so as to ensure they do not
discriminate against any employee, studies suggest that effectively targeted wellness programs
can provide benefits to workers and correspond with cost savings for employers. In one large
study of 373,478 employees, implementation of comprehensive workplace cardiovascular health
initiatives was found to correspond with reductions in health risks and incidence of
cardiovascular disease, as well as decreased medical expenditures.149 In another study, Medicare-
eligible beneficiaries who participated in a comprehensive workplace wellness program that
offered more than a standard health risk assessment were shown to have lower out-of-pocket
health care costs.150 Employers, however, have been slow to develop wellness programs. A 2017
survey found that only 45 percent of employers consider such wellness programs to be
important, and less than one of every four employers actually offer such programs.151
Helping Workers who are Family Caregivers
Employers can also develop employee assistance programs that address older workers’
caregiving needs and help them balance their professional and personal responsibilities. Such
programs can include providing unpaid or paid leave, offering flexible work arrangements, or
providing information and referrals to formal supportive services for those employees who are
engaged as informal caregivers.152
Many employers recognize the impact that caregiving can have on their employees and believe
that caregiving-related issues will become more important to their organizations in the near
future.153 In addition to helping workers remain in the labor force and remain financially secure
while serving as caregivers, caregiving supports and programs can also provide significant
benefits to employers. Employees with unmet caregiving needs are more likely to alter their
roles in the workplace or leave their positions altogether to care for a loved one.154 The costs of
providing caregiver support can be small relative to the expenses associated with the
employee’s decreased productivity or finding a replacement.155
149 Ron Goetzel, et al., “Workplace Programs, Policies, And Environmental Supports To Prevent Cardiovascular Disease,” Project Hope, Health
Affairs, Vol. 36, No. 2, pp. 229-236, (2017), at https://healthmetrics.heart.org/wp-content/uploads/2017/10/Workplace-Programs-Policies-and-Environmental-Supports.pdf. 150 Ronald Loeppke, et al., “Advancing Workplace Health Protection and Promotion for an Aging Workforce,” American College of
Occupational and Environmental Medicine, Journal of Occupational a n d E n v i r o n m e n t a l M e d i c i n e , Vol. 55 , No. 5, (May 2013). 151 Catherine Collinson, All About Retirement: An Employer Survey. TransAmerica Center for Retirement Studies, August 2017, at
https://www.transamericacenter.org/docs/default-source/employer-research/tcrs2017_sr_employer_research.pdf. 152 M. Andersson, et al., “Strapped for Time, Stressed Out or Both? Predictors of Work Interruptions and Unmet Needs for Workplace Supports,” Journal of Aging and Health, (2017). 153 See for example, AARP, Solutions Center, and Northeast Business Group on Health, Caregiving and the Workplace: Employer Benchmarking
Survey, July 2017, at https://nebgh.org/wp-content/uploads/2017/07/NEBGH-AARP_CaregivingSurvey_2017.pdf. 154 M. Andersson, et al., “Strapped for Time, Stressed Out or Both? Predictors of Work Interruptions and Unmet Needs for Workplace Supports,”
Journal of Aging and Health, (2017). 155 See for example, Heather Boushey, Finding Time: The Economics of Work-Life Conflict, Washington Center for Equitable Growth, (Cambridge, MA: Harvard University Press, 2016); See discussion in U.S. Department of Labor, Navigating the Demands of Work and
Eldercare, at https://www.dol.gov/sites/default/files/NavigatingTheDemandsOfWorkAndEldercare.pdf.
42
For example, one study found that nearly one out of every four employees over the age of 50
was involved in an informal elder caregiving relationship, and these individuals often
experienced negative outcomes that were also detrimental to their employer (e.g., phantom
absences, increased use of personal health care).156 When employers addressed the unmet needs
of elder caregivers, for instance, by offering caregiving specific information and counseling and
by offering flex time, negative individual outcomes and corresponding organizational costs
were reduced.157 Some employers also believe offering caregiving supports can help them
attract talent. In one 2017 survey of benefits managers at mostly large U.S. employers, 75
percent of those surveyed either “agreed” or “strongly agreed” with the statement “Being a
more ‘caregiving-friendly’ workplace would attract and retain talent.”158
Formal supports for caregivers, however, are not commonplace and can take a variety of forms.
For example, many employers offer unpaid leave that can be used for caregiving, such as
federally mandated FMLA leave, or have policies allowing employees to use annual or sick
leave for caregiving, but only 13 percent of private-sector workers have access to paid family
leave at work.159 According to one survey looking specifically at employers’ approaches to
individuals with elder caregiving responsibilities, less than one of every ten human resource
156Julie Robison, et al., “A Broader View of Family Caregiving: Effects of Caregiving and Caregiver Conditions on Depressive Symptoms,
Health, Work, and Social Isolation,” Journal of Gerontology: Social Sciences, Vol. 64B, No. 6, pp. 788-798, (November 2009), at
http://dx.doi.org/10.1093/geronb/gbp015. 157 M. Andersson, et al., “Strapped for Time, Stressed Out or Both? Predictors of Work Interruptions and Unmet Needs for Workplace Supports,”
Journal of Aging and Health, (2017). 158 See for example, AARP, Solutions Center, and Northeast Business Group on Health, Caregiving and the Workplace: Employer Benchmarking
Survey, July 2017, at https://nebgh.org/wp-content/uploads/2017/07/NEBGH-AARP_CaregivingSurvey_2017.pdf. 159 BLS, Employee Benefits Survey, Leave Benefits: Access, at https://www.bls.gov/ncs/ebs/benefits/2017/ownership/private/table32a.htm. Paid family leave is defined in the National Compensation Survey as leave that “is granted to an employee to care for a family member and includes
paid maternity and paternity leave. The leave may be available to care for a newborn child, an adopted child, a sick child, or a sick adult relative.
Paid family leave is given in addition to any sick leave, vacation, personal leave, or short-term disability leave that is available to the employee.” See BLS, Employee Benefits Survey, National Compensation Survey: Glossary of Employee Benefit Terms, at
https://www.bls.gov/ncs/ebs/glossary20162017.htm.
L.L. Bean, a retail company headquartered in Maine, employs more than 5,000
individuals ranging from 16 to 91 years old. L.L. Bean believes its aging workers
are a great benefit, and aspires to be known as an employer with “ageless appeal.”
The L.L. Bean headquarters feature an exercise room and the company offers
seminars and classes geared toward aging employees and retirees. Given that
nearly one out of every six employees who contacted its Employee Assistance
Program were experiencing a challenging issue related to providing care to an
aging parent, the company established a variety of targeted supports including a
quarterly “Eldercare Seminar” and a leave-of-absence policy that extends beyond
typical family leave of six to 12 weeks. In addition, the company offers full- and
part-time positions with flexible scheduling options and varied statuses such as
seasonal and active retiree. L.L. Bean allows for telecommuting and working
from home. The company also offers other information and education focusing on
more general retirement issues such as Medicare and estate planning.
43
professionals surveyed had written a formal policy concerning elder caregiving, and less than
half offered any sort of program (e.g., caregiver referral) or support (e.g., allowing for flex time)
for employed informal elder caregivers.160 Additionally, even when supports are provided, many
employees may not be aware that such supports are available to them. One study of university
faculty and staff found that less than 30 percent over age 50 were aware of such age-relevant
options, and even fewer actually participated.161
Saving for Retirement
In the current retirement savings system, employers play a substantial role in helping their
employees prepare for retirement. As many older workers struggle to amass enough savings for
retirement and exhibit anxiety about their future financial security, there are many ways in which
employers can and are helping their employees financially prepare for retirement.
Many employers provide retirement plans. Increased savings in employer-based retirement plans
has been shown to correlate with a decreased need to work past the age of 65.162 The plans
offered by employers include both traditional defined-benefit (DB) plans in which employers
manage plan assets and provide retirees set benefits for the entirety of workers’ retirements, as
well as defined-contribution (DC) plans, like 401(k)s, in which workers manage their own
money and spend down whatever money they have accumulated themselves in retirement. In
recent decades the latter have come to largely displace the former in most private-sector settings,
which has resulted in a large transfer of risk from employers to workers as workers have become
increasingly responsible for managing their own savings and figuring out how to make sure they
will have enough in retirement.163 This transition from DB plans to DC plans also appears to
160 Catherine Collinson, All About Retirement: An Employer Survey. TransAmerica Center for Retirement Studies, August 2017, at
https://www.transamericacenter.org/docs/default-source/employer-research/tcrs2017_sr_employer_research.pdf. 161 Brian Kaskie, “The Academy is Aging in Place: Assessing Alternatives for Modifying Institutions of Higher Education,” The Gerontological
Society of America, The Gerontologist, pp. 1-8, (February 2016). 162 Nari Rhee & Ilana Boivie (2015) The Continuing Retirement Savings Crisis National Institute on Retirement Security Washington, DC. 163 In defined benefit (DB) pension plans, participants receive monthly payments in retirement that are based on a formula that typically uses a
combination of length of service, accrual rate, and average of final years' salary. For example, a plan might specify that retirees receive an amount equal to 1.5% of their pay for each year of service, where the pay is the average of a worker's salary during his or her highest-paid five years. The
benefit formulas of DB pensions are designed in conjunction with a specific normal retirement age, at which point participants are eligible to
receive their pension benefits. This normal retirement age, therefore, creates incentives to fully retire at that age in order to collect the DB pension. For more information on DB pensions, including current data on worker participation, see CRS Report R43439, Worker Participation in
Employer-Sponsored Pensions: A Fact Sheet, by John J. Topoleski, at https://fas.org/sgp/crs/misc/R43439.pdf.
Central Florida Health Alliance
Central Florida Health Alliance (CFH) is a locally owned and operated, 626-bed
non-profit health care system and the largest provider of health care services in
Central Florida. CFH prides itself on its age-diverse workforce, and
approximately 40 percent of CFH’s workforce is over 50 years old. To meet the
needs of its employees, CFH offers flexibility in scheduling and work hours, and
provides other benefits such as assistance with coordinating care of aging parents
and other issues that impact the lives of many older workers.
44
have resulted in workers expecting to work longer, and there is evidence that workers with DC
plans are more likely to reenter the workforce after an exit than those with DB plans.164
When workers have access to retirement plans, most will make contributions, but not all
employers offer retirement plans.165 Approximately a third of workers do not have access to a
retirement plan at work, including roughly half of those who work for businesses with fewer than
100 employees.166 More employers offering retirement plans and/or taking advantage of
available state-based retirement programs could significantly increase access to retirement
savings vehicles and information. Other proactive steps that can be taken by employers to help
older workers better prepare for retirement using retirement plans include expanding access to
retirement plans they offer to part-time workers, putting in place plan features such as auto-
enrollment that encourage greater employee participation, and working to ensure plan fees are as
low as possible.
Providing comprehensive retirement counseling can also be beneficial to older workers.
Counseling offers information about retirement savings and benefit payouts, health and long-
term care insurance, family and social support issues, and the psychological aspects of
retirement.167 While some employers outsource such counseling to financial services companies
that administer retirement saving programs, others engage in their own efforts to address the
nonfinancial aspects of work and retirement.168 Interventions provided for employees in the
workplace have been shown to have positive effects on household savings, which suggests that
counseling programs seeking to increase financial literacy can improve people’s engagement
with retirement accounts.169
164 In defined contribution (DC) plans—of which 401(k) plans, 403(b) plans, 457(b) plans, and the Thrift Savings Plan (TSP) are the most
common—workers contribute a percentage of their wages to an individual account established by the employer. Employers may also contribute a
match to the DC plan, which is an additional contribution equal to some or all of the worker's contribution. The account accrues investment returns and is then used as a basis for income in retirement. For more information on DC pensions, including current data on worker participation,
see CRS Report R43439, Worker Participation in Employer-Sponsored Pensions: A Fact Sheet, by John J. Topoleski, at
https://fas.org/sgp/crs/misc/R43439.pdf. 165 American Benefits Council, 401(k) Fast Facts, October 2017, at http://www.americanbenefitscouncil.org/pub/e613e1b6-f57b-1368-c1fb-
966598903769. 166 BLS, Economic News Release: Retirement Benefits: Access, Participation, and Take-up Rates, March 2016, at https://www.bls.gov/news.release/ebs2.t01.htm. 167 James Kirk and Robert Belovics, “Recommendations and Resources for Counseling Older Workers,” Journal of Employment Counseling, Vol.
42, No. 2, pp. 50-59, (June 2005). 168 Audrey Williams June, “College Leaders Discuss One Last Faculty Transition: Retirement,” Chronicle of Higher Education, July 2011,
at http://www.chronicle.com/article/College-Leaders-Discuss-One/128190. 169 William G. Gale, Benjamin H. Harris, and Ruth Levine, “Raising Household Saving: Does Financial Education Work?,” Social Security Office of Retirement and Disability Policy, Social Security Bulletin, Vol. 72, No. 2, (2012), at
https://www.ssa.gov/policy/docs/ssb/v72n2/v72n2p39.html.
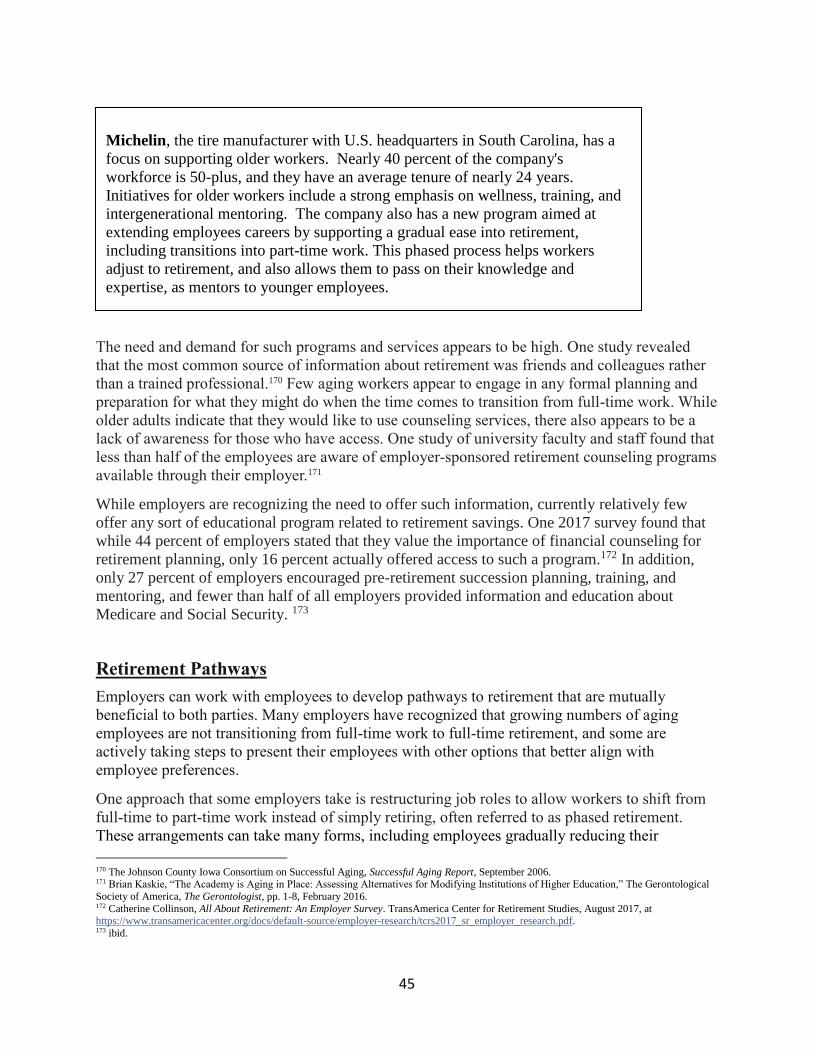
45
The need and demand for such programs and services appears to be high. One study revealed
that the most common source of information about retirement was friends and colleagues rather
than a trained professional.170 Few aging workers appear to engage in any formal planning and
preparation for what they might do when the time comes to transition from full-time work. While
older adults indicate that they would like to use counseling services, there also appears to be a
lack of awareness for those who have access. One study of university faculty and staff found that
less than half of the employees are aware of employer-sponsored retirement counseling programs
available through their employer.171
While employers are recognizing the need to offer such information, currently relatively few
offer any sort of educational program related to retirement savings. One 2017 survey found that
while 44 percent of employers stated that they value the importance of financial counseling for
retirement planning, only 16 percent actually offered access to such a program.172 In addition,
only 27 percent of employers encouraged pre-retirement succession planning, training, and
mentoring, and fewer than half of all employers provided information and education about
Medicare and Social Security. 173
Retirement Pathways
Employers can work with employees to develop pathways to retirement that are mutually
beneficial to both parties. Many employers have recognized that growing numbers of aging
employees are not transitioning from full-time work to full-time retirement, and some are
actively taking steps to present their employees with other options that better align with
employee preferences.
One approach that some employers take is restructuring job roles to allow workers to shift from
full-time to part-time work instead of simply retiring, often referred to as phased retirement.
These arrangements can take many forms, including employees gradually reducing their
170 The Johnson County Iowa Consortium on Successful Aging, Successful Aging Report, September 2006. 171 Brian Kaskie, “The Academy is Aging in Place: Assessing Alternatives for Modifying Institutions of Higher Education,” The Gerontological
Society of America, The Gerontologist, pp. 1-8, February 2016. 172 Catherine Collinson, All About Retirement: An Employer Survey. TransAmerica Center for Retirement Studies, August 2017, at https://www.transamericacenter.org/docs/default-source/employer-research/tcrs2017_sr_employer_research.pdf. 173 ibid.
Michelin, the tire manufacturer with U.S. headquarters in South Carolina, has a
focus on supporting older workers. Nearly 40 percent of the company's
workforce is 50-plus, and they have an average tenure of nearly 24 years.
Initiatives for older workers include a strong emphasis on wellness, training, and
intergenerational mentoring. The company also has a new program aimed at
extending employees careers by supporting a gradual ease into retirement,
including transitions into part-time work. This phased process helps workers
adjust to retirement, and also allows them to pass on their knowledge and
expertise, as mentors to younger employees.
46
workloads over time or even job sharing between employees. Despite their potential to provide
employers benefits related to worker retention, knowledge transfer, retirement transitions, and
workforce planning, formal phased retirement programs remain relatively rare, although data on
their uptake is limited.174 Employers that are more likely to adopt such programs tend to be
larger, and these programs are most common among more technical or professional workforces
(e.g., in the education, consulting, and high-tech industries).175 Outside of formal programs,
however, other employers sometimes provide more informal arrangements and find ways for
workers to gradually reduce their hours on an ad hoc basis.176 In a survey of 1,802 employers,
the majority recognized the retirement pathway preferences of aging workers but only 39
percent offered flexible scheduling options and 31 percent facilitated processes for moving from
full-time to part-time roles.177
A foundational study of the establishment of such programs looked at a program put in place by
the University of North Carolina (UNC) three campus system in the late 1990s.178 Until 1996,
UNC had no formal mechanism to reduce the workload of full professors, and even though
aging professors may have preferred to work in part-time positions, they rarely volunteered to
do so because moving to part-time resulted in a significant reduction in their pension payout. In
response, UNC developed a phased retirement program that allowed full-time professors to
move into part-time positions without penalty to their pensions. The program was observed over
a two-year period and researchers found while the number of faculty who transitioned from full-
time status to full-time retirement remained constant, a significant number of full-time faculty
chose to enter the phased retirement program. The researchers indicated that if the phased
retirement were not offered, the professors would have remained in full-time positions,
collecting full salary and benefits.
In 2006, Congress passed the Pension Protection Act, which amended the law to permit
employers to design their defined-benefit pension plans to allow employees to receive in-
service distributions from the plan as early as age 62.179 Now, some older employees who
otherwise would have chosen to continue working full time until reaching the plan’s normal
retirement age might instead reduce their work schedule and supplement their earnings with
pension income. Additionally, in 2012, Congress approved offering full-time employees
covered by the Civil Service Retirement System or the Federal Employees’ Retirement System
the option of moving to a part-time work schedule while simultaneously receiving partial
retirement benefits. This plan allows for the retention of qualified federal workers while
reducing costs associated with training new employees. Moreover, by increasing the availability
of flexible work schedules, they promote greater employee engagement, lower perceptions of
work overload, better physical and mental health and greater satisfaction with work-family
balance.
174 U.S. Government Accountability Office, “Older Workers: Phased Retirement Programs, Although Uncommon, Provide Flexibility for
Workers and Employers,” GAO-17-536, June 2017, at http://www.gao.gov/assets/690/685324.pdf. 175 ibid. 176 ibid. 177 Catherine Collinson, All About Retirement: An Employer Survey. TransAmerica Center for Retirement Studies, August 2017, at
https://www.transamericacenter.org/docs/default-source/employer-research/tcrs2017_sr_employer_research.pdf. 178 Linda S. Ghent, Steven G. Allen, and Robert L. Clark, “The Impact of a New Phased Retirement Option on Faculty Retirement
Decisions”, Sage Publications, Research on Aging, Vol. 23, No. 6, pp. 671-603 (November 2001); Robert Clark and P. Brett
Hammond, To Retire or Not? Retirement Policy and Practice in Higher Education, Pension Research Council of the Wharton School of the University of Pennsylvania, (Philadelphia: University of Pennsylvania Press, 2001), pp. 21–38. 179 Pension Protection Act of 2006, 29 USC §§ 1001, at https://www.congress.gov/109/plaws/publ280/PLAW-109publ280.pdf.
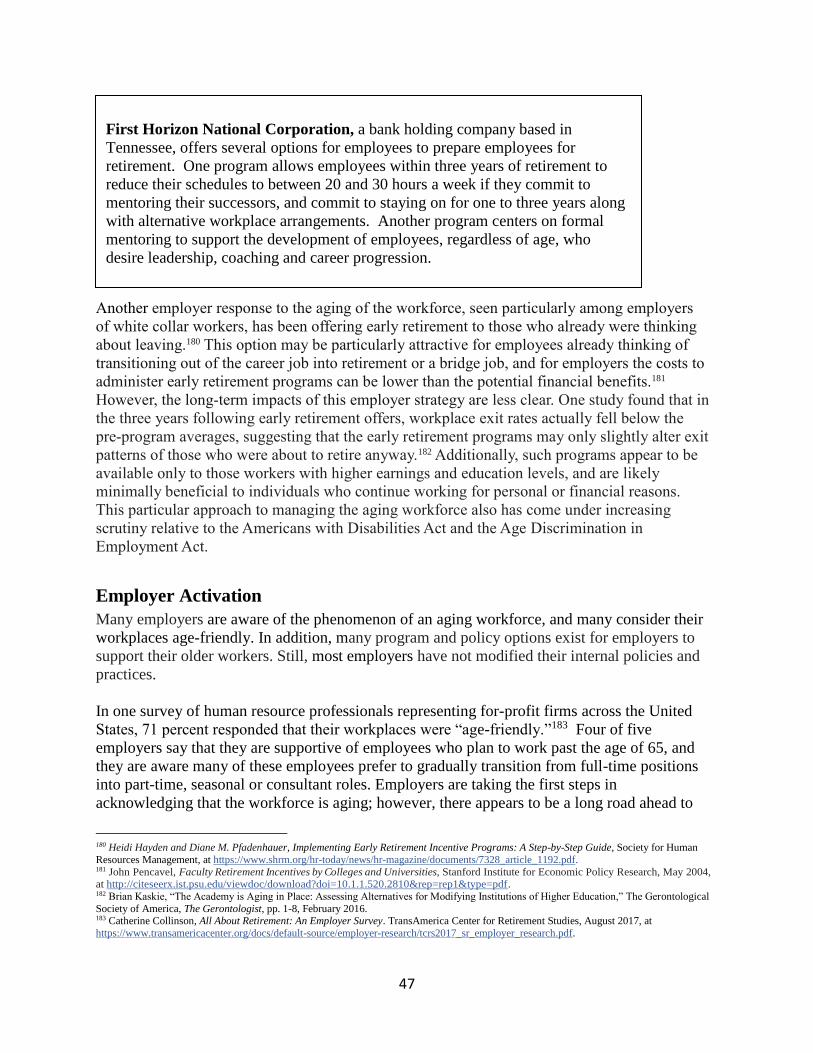
47
Another employer response to the aging of the workforce, seen particularly among employers
of white collar workers, has been offering early retirement to those who already were thinking
about leaving.180 This option may be particularly attractive for employees already thinking of
transitioning out of the career job into retirement or a bridge job, and for employers the costs to
administer early retirement programs can be lower than the potential financial benefits.181
However, the long-term impacts of this employer strategy are less clear. One study found that in
the three years following early retirement offers, workplace exit rates actually fell below the
pre-program averages, suggesting that the early retirement programs may only slightly alter exit
patterns of those who were about to retire anyway.182 Additionally, such programs appear to be
available only to those workers with higher earnings and education levels, and are likely
minimally beneficial to individuals who continue working for personal or financial reasons.
This particular approach to managing the aging workforce also has come under increasing
scrutiny relative to the Americans with Disabilities Act and the Age Discrimination in
Employment Act.
Employer Activation
Many employers are aware of the phenomenon of an aging workforce, and many consider their
workplaces age-friendly. In addition, many program and policy options exist for employers to
support their older workers. Still, most employers have not modified their internal policies and
practices.
In one survey of human resource professionals representing for-profit firms across the United
States, 71 percent responded that their workplaces were “age-friendly.”183 Four of five
employers say that they are supportive of employees who plan to work past the age of 65, and
they are aware many of these employees prefer to gradually transition from full-time positions
into part-time, seasonal or consultant roles. Employers are taking the first steps in
acknowledging that the workforce is aging; however, there appears to be a long road ahead to
180 Heidi Hayden and Diane M. Pfadenhauer, Implementing Early Retirement Incentive Programs: A Step-by-Step Guide, Society for Human
Resources Management, at https://www.shrm.org/hr-today/news/hr-magazine/documents/7328_article_1192.pdf. 181 John Pencavel, Faculty Retirement Incentives by Colleges and Universities, Stanford Institute for Economic Policy Research, May 2004, at http://citeseerx.ist.psu.edu/viewdoc/download?doi=10.1.1.520.2810&rep=rep1&type=pdf. 182 Brian Kaskie, “The Academy is Aging in Place: Assessing Alternatives for Modifying Institutions of Higher Education,” The Gerontological
Society of America, The Gerontologist, pp. 1-8, February 2016. 183 Catherine Collinson, All About Retirement: An Employer Survey. TransAmerica Center for Retirement Studies, August 2017, at
https://www.transamericacenter.org/docs/default-source/employer-research/tcrs2017_sr_employer_research.pdf.
First Horizon National Corporation, a bank holding company based in
Tennessee, offers several options for employees to prepare employees for
retirement. One program allows employees within three years of retirement to
reduce their schedules to between 20 and 30 hours a week if they commit to
mentoring their successors, and commit to staying on for one to three years along
with alternative workplace arrangements. Another program centers on formal
mentoring to support the development of employees, regardless of age, who
desire leadership, coaching and career progression.
48
prepare and respond adequately, especially as the aging workforce continues to grow and
diversify.
According to a nationally representative study, only 36 percent of human resource professionals
have made any changes to their managerial practices relative to aging workers.184 Less than five
percent of all employers have considered aging as part of their workplace diversity initiatives,
developed a formal strategy to retain aging workers, or prepared a formal recruitment strategy.
Less than ten percent of employers included “employee age” as a factor in developing
organizational workforce recruitment and retention strategies.185 Few human resource
professionals appear to consider issues pertaining to the “aging workforce” as an organizational
concern.
In one study focusing on human resource professionals’ responses to the aging workforce across
187 academic institutions, researchers found that 12 percent of the institutions implemented
three or more efforts focused on aging employees, and another 25 percent had developed one or
two programs.186 The majority of institutions have not done any strategic planning in regard to
offering health and wellness programs tailored for aging employees, counseling services about
retirement, or providing varied work-to-retirement pathways.
In another study, researchers found nearly three out of every four human resource professionals
from academic institutions had little to no knowledge about age-related issues, and even fewer
had completed any sort of formal training in aging as to be sufficiently aware of what might
constitute a viable response to the continued aging of the workforce.187 Human resource
professionals are instrumental in creating culture and climates as well as written organizational
policies concerning discrimination in the workplace, and some researchers suggest they should
be doing more to plan for an aging workforce, educate leaders and individual employees, and
develop tailored policies and practices.188
Whether employers initiate policies and programs addressing older workers differs by industry.
For example, human resource professionals representing government employers were
statistically more likely to have begun planning for an aging workforce (73 percent versus 46
percent of all other employers), and they were more likely to have initiated training efforts as
well as adjusted their retention and recruitment efforts relative to aging employees (49 percent
versus 41 percent).189 This may be in part due to the fact that the government workforce is
considered to be the “oldest” in the country, as 30 percent of employees currently are over the
184Society for Human Resource Management, “SHRM Survey Findings: The Aging Workforce – Basic and Applied Skill,” 2015, at
https://www.shrm.org/hr-today/trends-and-forecasting/research-and-surveys/Documents/2014-Older-Workers-Survey-Overall-Results-Part3-Basic-and-Applied-Skills.pdf. 185Society for Human Resource Management, “SHRM Survey Findings: The Aging Workforce – Recruitment and Retention,” 2015, at
https://www.shrm.org/hr-today/trends-and-forecasting/research-and-surveys/Documents/2014-Older-Workers-Survey-Overall-Results-Part2-
Recruitment and Retention.pdf. 186 Brian Kaskie, Mark Walker, and Matthew Andersson, “Efforts to Address the Aging Academic Workforce: Assessing Progress Through the
Three Stage Model of Institutional Change”, Innovations in Higher Education, Vol. 42, No. 3, pp. 225-237, (October 2016). 187 Brian Kaskie, “The Academy is Aging in Place: Assessing Alternatives for Modifying Institutions of Higher Education,” The Gerontological
Society of America, The Gerontologist, pp. 1-8, February 2016. 188 Cheryl Paullin, “The Aging Workforce: Leveraging the Talents of Mature Employees,” SHRM Foundation, Effective Practice Guidelines Series, 2014, at https://www.shrm.org/hr-today/trends-and-forecasting/special-reports-and-expert-views/Documents/Aging-Workforce-Talents-
Mature-Employees.pdf. 189 Society for Human Resources Management, Preparing for an Aging Workforce: Government Industry Report, 2015, at https://www.shrm.org/hr-today/trends-and-forecasting/research-and-surveys/Documents/Preparing_for_an_Aging_Workforce-
Government_Industry_Report.pdf.
49
age of 55.190 Government organizations may also be more likely to recognize the legal
obligation to uphold federal and state policies related to the Americans with Disabilities Act and
the Age Discrimination in Employment Act.191
In comparison, while 29 percent of persons who are working in finance, insurance, and real
estate companies are over the age of 55, human resource professionals representing these firms
were significantly less likely to be doing anything in regard to the aging workforce.192 Similarly,
human resource professionals representing other professional, scientific and technical services
including accountants and lawyers, were significantly less likely than all other employers to
examine policies and practices pertaining to aging employees; were less likely to conduct any
sort of formal analysis of workplace retirement patterns; and were more likely to resolve that
their firm needed to make no changes in addressing the aging workforce.193 Given that such
professions are occupied by more well educated, healthy and financially secure employees, the
employers simply may have less interest in developing a formal response. Instead, these
employers appear to address aging issues on an as-needed basis, engaging in executive search
firms to solve staffing challenges or transitioning aging employees into consultant or other roles
that can be categorized as “self-employed.”194
Moreover, even though the health and social service occupations (e.g., registered nurses,
personal care aides) are projected to be among the fastest growing in the next decade, human
resource professionals from these industries were not any more likely to formally consider the
aging of the workforce than any other industry. They also were less likely to offer
apprenticeship programs to recruit and retain aging workers. 195 The retail and hospitality
industry, which has the lowest proportion of workers over age 55, is significantly less likely
than all other industries to have considered aging workers in strategic planning or implemented
any specific policies or practices, and are less likely to assign a higher value to the experience,
knowledge, and skills of aging workers.196 These types of firms may simply not be large enough
to possess the resources needed to develop such targeted planning efforts or support the types of
benefit structures that are most desired by aging workers.197
In contrast, as the mining and manufacturing industries both experience decreasing growth, they
are more likely to be aware of issues concerning the aging workforce and have developed
specific retention and recruitment practices. For example, human resource professionals from
190 ibid. 191 ibid. 192 Society for Human Resources Management, Preparing for an Aging Workforce: Finance, Insurance and Real Estate Industry Report, 2015, at
https://www.shrm.org/hr-today/trends-and-forecasting/research-and-surveys/Documents/Preparing_for_an_Aging_Workforce- 193 Society for Human Resources Management, Preparing for an Aging Workforce: Professional and Technical Services Industry Report, 2015,
at https://www.shrm.org/hr-today/trends-and-forecasting/research-and-surveys/Documents/Preparing_for_an_Aging_Workforce- 194 Society for Human Resources Management, Preparing for an Aging Workforce: Finance, Insurance and Real Estate Industry Report, 2015, at
https://www.shrm.org/hr-today/trends-and-forecasting/research-and-surveys/Documents/Preparing_for_an_Aging_Workforce-
Finance_Insurance_and_Real_Estate_Industry_Report.pdf. 195 Society for Human Resources Management, Preparing for an Aging Workforce: Health Care and Social Insurance Industry Report, 2015, at
https://www.shrm.org/hr-today/trends-and-forecasting/research-and-surveys/Documents/Preparing_for_an_Aging_Workforce- 196 Society for Human Resources Management, Preparing for an Aging Workforce: Retail and Hospitality Industry Report, 2015, at
https://www.shrm.org/hr-today/trends-and-forecasting/research-and-surveys/Documents/Preparing_for_an_Aging_Workforce-
197 Cheryl Paullin, “The Aging Workforce: Leveraging the Talents of Mature Employees,” SHRM Foundation, Effective Practice Guidelines Series, 2014, at https://www.shrm.org/hr-today/trends-and-forecasting/special-reports-and-expert-views/Documents/Aging-Workforce-Talents-
Mature-Employees.pdf..
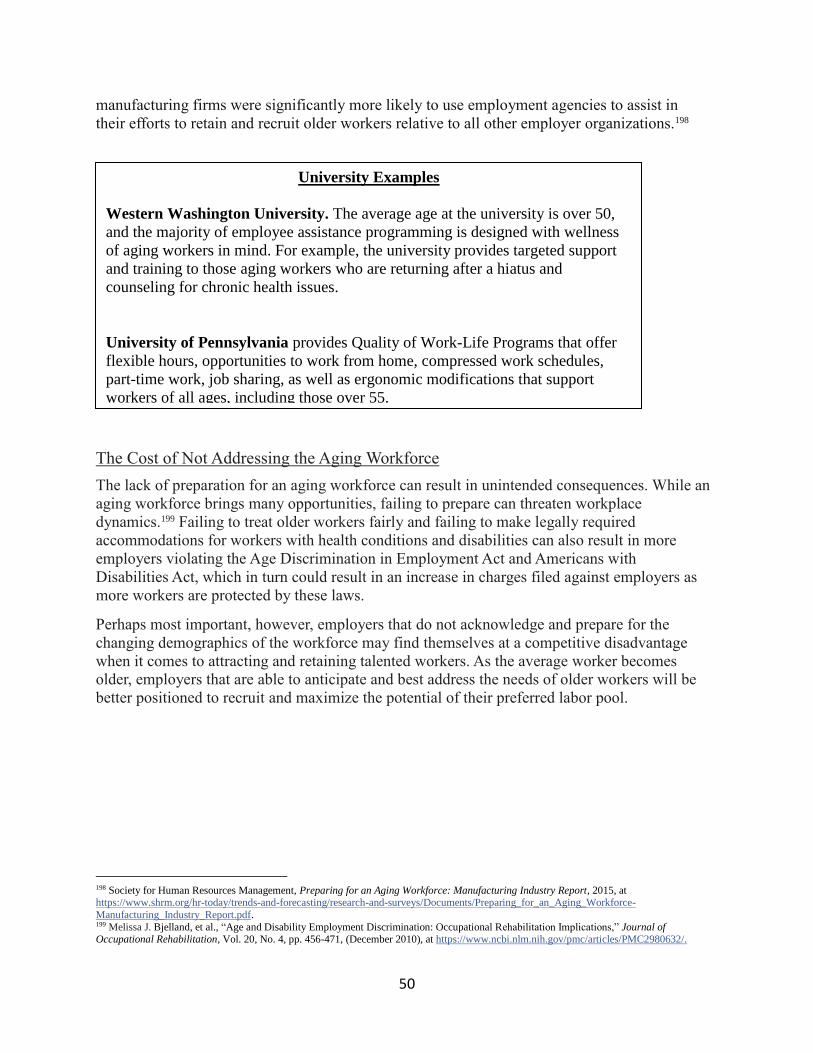
50
manufacturing firms were significantly more likely to use employment agencies to assist in
their efforts to retain and recruit older workers relative to all other employer organizations.198
The Cost of Not Addressing the Aging Workforce
The lack of preparation for an aging workforce can result in unintended consequences. While an
aging workforce brings many opportunities, failing to prepare can threaten workplace
dynamics.199 Failing to treat older workers fairly and failing to make legally required
accommodations for workers with health conditions and disabilities can also result in more
employers violating the Age Discrimination in Employment Act and Americans with
Disabilities Act, which in turn could result in an increase in charges filed against employers as
more workers are protected by these laws.
Perhaps most important, however, employers that do not acknowledge and prepare for the
changing demographics of the workforce may find themselves at a competitive disadvantage
when it comes to attracting and retaining talented workers. As the average worker becomes
older, employers that are able to anticipate and best address the needs of older workers will be
better positioned to recruit and maximize the potential of their preferred labor pool.
198 Society for Human Resources Management, Preparing for an Aging Workforce: Manufacturing Industry Report, 2015, at https://www.shrm.org/hr-today/trends-and-forecasting/research-and-surveys/Documents/Preparing_for_an_Aging_Workforce-
Manufacturing_Industry_Report.pdf. 199 Melissa J. Bjelland, et al., “Age and Disability Employment Discrimination: Occupational Rehabilitation Implications,” Journal of Occupational Rehabilitation, Vol. 20, No. 4, pp. 456-471, (December 2010), at https://www.ncbi.nlm.nih.gov/pmc/articles/PMC2980632/.
University Examples
Western Washington University. The average age at the university is over 50,
and the majority of employee assistance programming is designed with wellness
of aging workers in mind. For example, the university provides targeted support
and training to those aging workers who are returning after a hiatus and
counseling for chronic health issues.
University of Pennsylvania provides Quality of Work-Life Programs that offer
flexible hours, opportunities to work from home, compressed work schedules,
part-time work, job sharing, as well as ergonomic modifications that support
workers of all ages, including those over 55.
51
Conclusion The number of Americans who are working past age 55 is at a historic high. The United
States Senate Special Committee on Aging is committed to understanding the growth and
diversification of the aging workforce and to supporting older Americans in their journeys
through work and retirement. Aging workers experience substantial benefits through work,
including improved well-being, health, and financial security. They also experience challenges,
such as health conditions and disabilities that develop with age, caregiving responsibilities,
maintaining employment or returning to work after being out of the labor force, and workplace
discrimination. Other older workers do not have access to training opportunities that maintain
and develop new skills or lack support in developing retirement pathways best suited to them.
Too many older Americans have not accumulated sufficient savings for retirement, and a
significant number continue to work into older ages out of financial need.
Many employers are aware of the phenomenon of the aging American workforce. They
consider their workplaces age-friendly, and some have developed appropriate policies and
practices in response to the changing demographics of their workforces. Most employers,
however, have not yet modified internal policies or adopted new practices, and some employers
have little capacity or inclination to do so, despite the fact that the aging workforce presents
several potential benefits to employers and the business case for addressing the aging of the
workforce is well-established.
For more than three decades, the federal government has led the way in understanding the
aging of the American workforce, largely through research initiatives. The National Institute on
Aging has supported research examining labor force participation and retirement patterns among
aging Americans.200 The Center for Retirement Research at Boston College, supported by the
Social Security Administration, continues to advance research on retirement income and
savings.201 The National Institute on Occupational Safety and Health, under the Centers for
Disease Control and Prevention, established the National Center for Productive Aging and Work.
This center is advancing efforts to identify best practices, such as ergonomic office designs to
meet the needs of aging employees.202 In addition, the Bureau of Labor Statistics, the
Congressional Research Service, and the Government Accountability Office have conducted
several analyses and investigations concerning the aging labor force. These efforts range from
charting prolonged spells of unemployment among aging workers,203 to forecasting career
pathways for aging workers,204 to investigating formal phased retirement options offered by
200 U.S. Department of Health and Human Resources, National Institute on Aging and National Institutes of Health, Growing Older in America:
The Health & Retirement Study, March 2007, at https://www.nia.nih.gov/sites/default/files/2017-06/health_and_retirement_study_0.pdf.
201 Steven A. Sass, The Research Contributions of the Center for Retirement Research at Boston College, Social Security Administration, Office of Retirement and Disability Policy, Social Security Bulletin, Vol. 69, No. 4, 2009, at
https://www.ssa.gov/policy/docs/ssb/v69n4/v69n4p35.html.
202 Centers for Disease Control and Prevention, The National Institute for Occupational Safety and Health, Productive Aging and Work, at
https://www.cdc.gov/niosh/topics/productiveaging/default.html. 203 CRS Report R41559, The Trend in Long-Term Unemployment and Characteristics of Workers Unemployed for Two Years or More, by Gerald
Mayer, at https://fas.org/sgp/crs/misc/R41559.pdf. 204 Mitra Toossi and Elka Torpe, Older Workers: Labor Force Trends and Career Options, Bureau of Labor Statistics, Career Outlook, May
2017, at https://www.bls.gov/careeroutlook/2017/article/pdf/older-workers.pdf.
52
employers.205 These federally supported studies and initiatives provide a foundation for our
understanding of the opportunities and challenges of the aging American workforce and define
corresponding policy issues.
In 2005, the Senate Special Committee on Aging convened the Task Force on the Aging
American Workforce that identified key policy issues related to supporting the aging workforce.
The taskforce considered how employers were responding to the aging workforce, identified
opportunities for employment among aging workers, and illuminated corresponding legal and
regulatory issues. Since that time, both Congress and the executive branch have pursued a variety
of responses that address the challenges and opportunities presented by an aging workforce.
Most recently, positive steps have included the Workforce Innovation and Opportunity Act of
2014,206 the Older Americans Act Reauthorization of 2016,207 and the Workforce Innovation and
Opportunity Act Final Rules of 2016.208
These efforts have helped to lay the groundwork for addressing the aging of the labor
force, but sustained progress will only be possible if employers and employees work together
and prioritize the issues illuminated in this report and take action. Older workers and their
employers must continue to close the gaps that have made it harder for individuals to self-
determine their career and retirement paths.
State governments and non-governmental organizations are also examining the
opportunities and challenges presented by an aging workforce. For example, in 2017, the Tri-
State Learning Collaborative on Aging convened a workshop called “Grey is the New Green,”
calling together more than 170 employers from New Hampshire, Maine, and Vermont to identify
and promote strategies for recruiting and retaining older workers. Through the “Back to Work
50 Plus” program, AARP engages community colleges in training older adults to maintain and
develop new skills; connects older adults who are looking for work with information, support,
training, employer opportunities, and retirement planning; and also assists employers with
designing more age-friendly workplace cultures. The Society of Human Resources Management
(SHRM) Foundation recently completed a three–year national effort to highlight the value of
older workers and to identify best practices for an aging workforce. Many other organizations are
also taking proactive steps to assist older workers and help employers best meet older workers’
needs in the workplace.
Looking Ahead
The continued aging of the American population has significantly altered the labor force
landscape. Not only are an increasing number of aging Americans working into older ages, but
the manner in which they are choosing to do so has also expanded beyond a straightforward
205 U.S. Government Accountability Office, Older Workers: Phased Retirement Programs, Although Uncommon, Provide Flexibility for Workers
and Employers, GAO-17-536, June 2017, at https://www.gao.gov/products/GAO-17-536.
206 Workforce Innovations and Opportunity Act of 2014, 29 USC §§ 3101, at https://www.congress.gov/113/plaws/publ128/PLAW-
113publ128.pdf. 207 Older Americans Act Reauthorization Act of 2016, 42 USC §§ 3001, at https://www.congress.gov/114/plaws/publ144/PLAW-
114publ144.pdf. 208 U.S. Department of Labor, Employment and Training Administration, “Workforce Innovation and Opportunity Act,” 81 Federal Register
56071, August, 19, 2016, at https://www.federalregister.gov/documents/2016/08/19/2016-15975/workforce-innovation-and-opportunity-act.

53
transition from full-time work into retirement. Older workers have much to offer employers, and
employers often benefit from older workers’ accumulated experiences, intellectual and social
capital, and skill sets. Still, the preferences and needs of numerous aging workers remain unmet,
and most employers simply have not responded to the unique phenomena presented by the aging
workforce. Many still rely on conventional organizational policies and practices that do not
address the issues presented by an aging workforce.
Looking ahead, policies must be responsive to an aging workforce. Supportive policies
can help workers leverage benefits and overcome the challenges in ways that benefit not only
workers and their families, but their employers, their communities, and the nation overall. Such
policies should:
Allow for the flexibility of individuals to carve their own career paths and determine for
themselves when and how they retire.
Value and respect the decisions of older adults to continue working, to volunteer, or to
find another way to achieve their personal and professional goals.
Help workers remain financially secure while confronting challenges that may arise with
age, such as caregiving responsibilities or health conditions.
Allow employers the flexibility to creatively meet the individual needs of their workers
while ensuring that employees are provided ample opportunities to grow and thrive in the
workplace.
This report serves as a foundation for such policies, as the Senate Special Committee on Aging
continues its legacy of supporting today’s aging Americans and future generations of older
workers.