ambulatory blood pressure monitoring - sagepub.com · ambulatory blood pressure monitoring denise...
TRANSCRIPT
159
8Ambulatory BloodPressure Monitoring
DENISE JANICKI-DEVERTS
THOMAS W. KAMARCK
Accumulating evidence on theprognostic utility of ambulatoryblood pressure (ABP) is beginning
to shift the consensus on its potential valuefor clinical practice. This trend is evidencedby the increasing use of ABP monitoring(ABPM) (Mancia, Di Rienzo, & Parati, 1993)and by new Medicare policies approvingreimbursement of ABPM (CMS, 2001;Pickering et al., 2005). Concurrently, newtechnologies and methodologies are pro-viding us with the means of examining thedeterminants of ABP with greater precision(Fahrenberg & Myrtek, 2001; Shiffman &Stone, 1998). These converging trends yieldimportant opportunities for behavioralmedicine research. The purpose of this chap-ter is to explore the role of ABPM in con-temporary behavioral medicine researchand to outline a number of methodological
considerations that are critical for designingand implementing studies in this area.
WHY STUDY AMBULATORY BP?
Since 1966, when the results of automatedABP measures first were compared withclinic BP assessments (Sokolow, Werdegar,Kain, & Hinman, 1966), numerous studieshave shown that mean 24-hour ABP is astronger correlate of end organ damage (suchas left ventricular hypertrophy) than is BPmeasured in the clinic (Mancia & Parati,2000). The prognostic utility of ABPM hasbeen demonstrated as well. For example, anumber of studies conducted with hyperten-sive samples have shown that 24-hour ABPmeasures are more strongly associated withcardiovascular morbidity and mortality than
C H A P T E R
AUTHOR’S NOTE: This work was supported by the National Heart, Lung, and Blood Institute researchgrants HL56346 and HL040962, by an NHLBI training fellowship (HL07560), and by the PittsburghMind-Body Center (HL076852 [University of Pittsburgh], HL076858 [Carnegie Mellon University).
08 - Luecken - 45370.qxd 9/12/2007 4:44 PM Page 159
PART II: PHYSIOLOGICAL SYSTEMS AND ASSESSMENTS: CARDIOVASCULAR160
clinic-based measures and/or they are inde-pendent predictors of cardiovascular healthoutcomes in hypertensive persons after con-trolling for clinic pressures (Clement et al.,2003; Khattar, Senior, & Lahiri, 1998;Perloff, Sokolow, & Cowan, 1991; Redon et al., 1998; Staessen et al., 1999; Verdecchia,Porcellati, Schillaci et al., 1994; Verdecchiaet al., 2002). A small but growing body ofevidence has recently developed demonstrat-ing the prognostic value of ABP in the gen-eral population as well (Hansen, Jeppesen,Rasmussen, Ibsen, & Torp-Pedersen, 2005;Ohkubo et al., 2000; Sega et al., 2005).While most of these studies have used 24-hour averages for their assessment of ABP,some have also examined daytime and night-time BP separately. Findings are inconsistentregarding the relative importance of daytimeand nighttime ABP, with some (Sega et al.,2005; Staessen et al., 1999) showing thatnighttime BP is more predictive than daytimeABP and others (Fagard, Bielen, & Amery,1992; Hansen et al., 2005) showing thatABPs during the two periods of the day areequivalent in terms of their prognostic value.
That ABP readings may be more stronglypredictive of future cardiovascular morbidityand mortality raises questions about the com-parability of ambulatory and clinic assess-ments. Indeed, comparisons of the valuesobtained across these two methods of BP mea-surement reveal systematic differences. Becauseclinic BPs tend to be higher than pressurestaken during daily life (a phenomenon dubbedthe white coat effect), the American Society ofHypertension recommends that lower valuesbe used to define the upper limits of normal fordaytime ABP (<135/85) compared with clinicpressures (<140/80) (Pickering, 1996).
More important, the literature on the prog-nostic utility of ABP also raises questionsabout the value of relying on clinic measuresalone in diagnosing hypertension and identify-ing those in need of treatment. White coathypertension (WCH), a variant of the white
coat effect, is said to occur in individuals forwhom clinic BP values are in the hypertensiverange while ABP values are normal. Fifteen to20% of persons diagnosed with Stage 1 hyper-tension (140-159 mmHg systolic BP [SBP] or 90-99 mmHg diastolic BP [DBP]; JointNational Committee [JNC], 1997) have beenshown to fall within this group (Pickering et al., 2005), and the prevalence may be ashigh as 60% to 80% among persons with bor-derline increases in clinic BP (Staessen,O’Brien, Thijs, & Fagard, 2000). Identificationof WCH is important insofar as persons withWCH have been shown to be at reduced riskfor cardiovascular events compared to indi-viduals with more consistently elevated pres-sure. In the Syst-Eur Trial, for example, therisk associated with clinic SBP was reduced by20% for each 10-mmHg discrepancy betweendaytime ambulatory and clinic BP (Staessen et al., 1999). It is not clear whether the riskassociated with WCH is comparable to that of individuals with normal clinic pressures, orwhether the WCH group is at an intermediatelevel of risk (Pickering et al., 2005).
A smaller but equally important phe-nomenon is represented by persons showingnormal clinic pressures but elevated pressuresduring ambulatory recording (masked hyper-tension). Emerging evidence suggests that thisgroup also may be at elevated risk for clinicallymanifest cardiovascular disease (CVD) relativeto those with ABP in the normal range, againreflecting the prognostic value of assessing BPduring daily life (Bobrie et al., 2004).
ABP monitoring has permitted investiga-tors to identify individuals whose BP profilesare characterized by unusual patterns of noc-turnal as well as diurnal activity. BP typicallydeclines as individuals transition from wake-fulness to sleep, a phenomenon referred to as dipping (O’Brien, Sheridan, & O’Malley,1988). However, some individuals show anabsence of nocturnal BP decline (nondipping,usually defined as a failure to show nighttimeABP decreases of 10% or more). Elevated
08 - Luecken - 45370.qxd 9/12/2007 4:44 PM Page 160
nocturnal BP has been hypothesized to con-tribute to overall pressor load, hastening thedevelopment of target organ damage. Forexample, nondippers are overrepresentedamong those with damage to the kidney(microalbuminuria; Bianchi, Bigazzi, Baldari,Sgherri, & Campese, 1994), heart (left ven-tricular hypertrophy; Verdecchia, Porcellati,Zampi, et al., 1994), and brain (silent lacunarinfarction; Kario, Pickering et al., 2001;Pickering & Kario, 2001). Nondipping isprospectively associated with increased riskfor cardiovascular morbidity and mortality(Amar et al., 2000; Kario, Schwartz, Davidson,& Pickering, 2001; Sturrock et al., 2000;Verdecchia, Porcellati, Schillaci et al., 1994),even among unselected community samples(Ohkubo et al., 1997).
According to recent consensus reports,identification of WCH, masked hypertension,and nondipping BP pattern are among themost important clinically useful applicationsof ABPM (O’Brien et al., 2003; Pickering et al., 2005). JNC guidelines cite hypotensivesymptoms following treatment, episodichypertension, and autonomic dysfunctionas additional indicators for use of ABPM(JNC, 1997).
EXPLANATIONS FORDIFFERENTIAL UTILITY OF ABP
It frequently is assumed that the differentialutility of ABP as a marker of CVD risk stemsfrom the fact that ABP captures the effects onBP of lifestyle and behavioral influences thatcannot be observed in the clinic (Devereux et al., 1983). Under the assumption that med-ical morbidity risk from hypertension increasesas a function of cumulative BP exposure or“load,” measurement conditions that willbest reflect the degree of cumulative exposureshould yield more accurate assessment of risk.
In addition to ABP measures being morerepresentative of cumulative pressure exposure,
other measurement features associated withABPM also could account for its differentialutility. Ambulatory measures typically arebased on the average of 50 to 100 observa-tions taken over the course of a day(Pickering et al., 2005), whereas clinic mea-sures within a single session may be basedon as few as one to three BP assessmentscollected over the course of several minutes.Because ABP readings are automated, mea-surements also may be more standardizedand less prone to reader bias compared withclinic assessments (Fagard et al., 1992).Measurement standardization and use ofmultiple observations are both associatedwith enhanced reliability; therefore, eachof these features of ABPM could plausiblycontribute to the enhanced prognostic valueof ABP.
Insofar as the methodological factorsdescribed here might account for the prognos-tic superiority of ABP, it is possible that simi-lar prognostic effects might be obtained moreefficiently simply by increasing the number ofassessments in the clinic. A small number ofstudies have examined this possibility by aug-menting the number of clinic BP readingstaken within a given session or increasing the number of days of clinic BP assessment(Fagard et al., 1992; Fagard, Staessen, Thijs,& Amery, 1995; Fagard, Staessen, & Thijs,1997). As expected, most of these studiesshowed some increase in the predictive powerof clinic measures relative to ABP, when thesemethodological refinements were adopted(Fagard et al., 1992, 1997).
In an effort not only to minimize but toeliminate methodological differences betweenthe two types of assessments, we recentlycompared the predictive power of ABP and clinic assessment when both methodsemployed the same types of measurementdevices, the same number of observations,and the same intervals of measurement.Specifically, we sampled four automatedreadings over a 2.5-hour period in the
Ambulatory Blood Pressure Monitoring 161
08 - Luecken - 45370.qxd 9/12/2007 4:44 PM Page 161
laboratory (clinic) and in the field (ABP) in a sample of 216 healthy older adults (ages 50-70) (Kamarck, Polk, Sutton-Tyrrell, &Muldoon, 2002) using ambulatory BP deviceswithin each setting. We averaged across thefour laboratory readings to obtain measuresof clinic BPs (SBP and DBP) for each person,and across the four field assessments, in turn,to obtain measures of ABP. Having con-trolled for methodological differences betweenthese two types of assessment, we examinedwhether ABP continued to be superior toclinic BP in terms of its cross-sectional associ-ation with carotid artery intima medial thick-ness (IMT), as measured by ultrasonography.1
Even under the conservative conditionsdescribed here, the statistical associationbetween BP and IMT was stronger when BPwas measured in the field relative to in theclinic (r = .30 for SBP for ambulatory vs.r = .23 for clinic assessments). Moreover,ambulatory measures were stronger indepen-dent correlates of IMT than clinic measures inthis study (ABP measures were significantcorrelates of IMT in multivariate models,which included clinic BP assessed by manualmanometry, whereas the automated clinicmeasures were not significant predictors in the same models). Those in the top quartile of ambulatory SBP showed a significantlyincreased risk for observable carotid arteryplaque as well as IMT, with the odds ofobserving one or more plaques being 4.7 timesgreater in the top quartile than in those in thebottom quarter of the distribution, even afteradjusting for comparable clinic measures.
WHY STUDY PSYCHOSOCIALPROCESSES AND ABP?
These findings, which rule out simplemethodological explanations for the incre-mental effects of ABP, highlight instead thepotential importance of daily life influencesand, by extension, psychosocial processes,
in accounting for the incremental prognos-tic value of ABP. The central role of ABPboth as a prognostic marker and as a window on psychosocial processes that may contribute to cardiovascular risk marksthis area of study as an important one forbehavioral scientists interested in cardiovas-cular disease.
Our own work suggests that ABP mayfluctuate with changes in psychosocial chal-lenges during daily life, and that such associ-ations may help explain some of the linksbetween psychosocial variables and CVDrisk (Kamarck et al., 2004, 2005). We andothers have also examined psychosocialfactors as predictors of ABP dipping (Ituarte,Kamarck, Thompson, & Bacanu, 1999;Kario, Schwartz et al., 2001) under theassumption that nocturnal physiology may bealtered by daytime behaviors and concerns(Hall et al., 2004). Overall, however, surpris-ingly little research, to date, has examined theextent to which daytime ABP or nocturnalchanges in ABP may mediate the effects ofpsychosocial processes on CVD risk. Theseare questions that we believe have importantclinical significance and thus are ripe forfurther investigation.
METHODOLOGICALCONSIDERATIONS
In the following pages, we discuss severalissues that are important considerationswhen planning and conducting an ABPMstudy. First, we discuss factors to considerwhen choosing an ambulatory monitor.Second, we describe the types of training that should be provided to research staff and study participants. Third, we discuss theimportance of detecting artifactual BP read-ings, and list several methods that have beendevised to handle them. Finally, we discuss anumber of general design issues, as well asrelevant data analytic strategies.
PART II: PHYSIOLOGICAL SYSTEMS AND ASSESSMENTS: CARDIOVASCULAR162
08 - Luecken - 45370.qxd 9/12/2007 4:44 PM Page 162
Choosing an Ambulatory Monitor
Choice of an appropriate monitor is ofparamount importance to ABPM. A numberof factors influence this decision: (1) accu-racy of monitor, (2) auscultatory or oscillo-metric detection techniques, (3) participantcomfort, and (4) cost.
Accuracy of Monitor. The British HypertensionSociety (BHS) protocol and the standard set by the United States Association for theAdvancement of Medical Instrumentation(AAMI) are the two most widely used proto-cols for validating the accuracy of automatedBP devices (AAMI, 1993; O’Brien et al.,1993). Briefly, both protocols involve assess-ing the agreement of automated devices witha mercury standard. For a device to be rec-ommended, it must fulfill the AAMI criteriafor both SBP and DBP, and receive a grade ofA or B according to the BHS criteria for bothparameters (O’Brien, Waeber, Parati, Staessen,& Myers, 2001). In order to receive an Agrade, 60% of all readings taken with theautomated device must be within ±5 mmHgof the standard, 85% within ±10 mmHg ofthe standard, and 95% within ±15 mmHgof the standard. Corresponding percentagesfor a grade of B are 50%, 75%, and 90%,respectively (O’Brien et al., 2001). A list ofcurrently available ambulatory monitors thathave met BHS and AAMI criteria is availableon the dabl® Educational Trust website (dablEducational Trust).
Auscultatory Versus Oscillometric Techniques.Another factor to consider when choosing an ambulatory monitor is whether the deviceuses auscultatory or oscillometric detectionmethods. Auscultatory monitors detect theonset and disappearance of Korotkoffsounds (K-sounds) with a transducer (micro-phone) that is placed on the skin over thebrachial artery and beneath the compressioncuff. Thus, this automated technique mimics
the standard auscultatory mercury columnmethod that involves an observer detectingK-sounds with a stethoscope. An advantageof auscultatory monitors that is relevant toABPM is the relative resistance of ausculta-tory measurements to movement artifact dur-ing physical activity (Pickering et al., 2005).Microphone transducers are, however, sensi-tive to excess background noise or vibrations.Oscillometric monitors rely on oscillations incuff pressure to detect SBP and DBP. Specifi-cally, oscillations in cuff pressure duringgradual deflation correspond to mean intraar-terial pressure, such that oscillations begin atapproximately SBP and continue below DBP.From the oscillations, SBP and DBP are esti-mated indirectly according to a manufac-turer-specific, empirically derived algorithm.Oscillometric measurements are more likelyto be influenced by arm movement thanthose taken with auscultatory devices. Asreadings do not require the use of a micro-phone, however, oscillometric measurementsare not influenced by background noise.
Both auscultatory and oscillometric techniques have been validated insofar asreadings from monitors using either detectionmethod have been found to correlate reason-ably well with intraarterial BP (Henschel, dela Vega, & Taylor, 1954). However, auscul-tation has been found to be more accuratethan oscillometry when validated against a standard mercury column (Imai et al.,1989; Keavney, Bird, Caiazza, Casadei, &Conway, 2000; Pannarale et al., 1993). It isimportant to note that individual readingsfrom either type of monitor may differ con-siderably from intraarterial standards.
Despite the generally superior accuracy ofauscultatory monitors, most currently avail-able ambulatory devices employ oscillometry.The shift toward oscillometry likely is due tothe relative ease of cuff application: partici-pants need not be trained in the proper posi-tioning of an auscultatory transducer over thebrachial artery. In addition to presenting less
Ambulatory Blood Pressure Monitoring 163
08 - Luecken - 45370.qxd 9/12/2007 4:44 PM Page 163
burden to the participant, this feature of oscillometric monitors may enhance data collection. Two studies that employed ABPMdevices capable of recording by both oscillo-metric and auscultatory methods showed ahigher percentage of missed auscultatorycompared to oscillometric readings (Keavneyet al., 2000; Raikkonen, Matthews, Flory, &Owens, 1999).
Participant Comfort. Participant comfort isanother important consideration when select-ing an ambulatory monitor. In the primarycare setting, ABPM tends to receive lowerpatient acceptability ratings than other formsof BP monitoring (Beltman et al., 1996; Littleet al., 2002). Common complaints includeinconvenience, discomfort, sleep disturbance,noise, pain, skin irritation, and bruising(Beltman et al., 1996). Although ambulatorymonitoring in and of itself can be expected tocause participants some degree of discomfort,patient acceptability ratings of individualmonitors may differ in terms of comfort and convenience (Westhoff et al., 2005).Monitors that are fitted with D-ring cuffs, forexample, facilitate unassisted instrumentationby participants, but such cuffs also may beassociated with somewhat greater discomforton inflation for some individuals. Researcherswould benefit from screening potentialdevices with regard to these issues. Becauseinconvenience and discomfort may reducecompliance with ABPM, reducing the fre-quency of these complaints may lead to morecomplete data collection. Moreover, a moretolerable device may result in less restrictionof daily activities and thus provide a betterassessment of “typical” daily BP. In theabsence of formal published studies compar-ing monitors of interest on these dimensions,researchers should pilot test selected devicesbefore purchase.
Cost. ABPM research requires a considerablemonetary investment. The current price for
ABP monitors ranges from about $2,600 to$3,400 per unit, depending on the model andchoice of accessories.
Additional Considerations
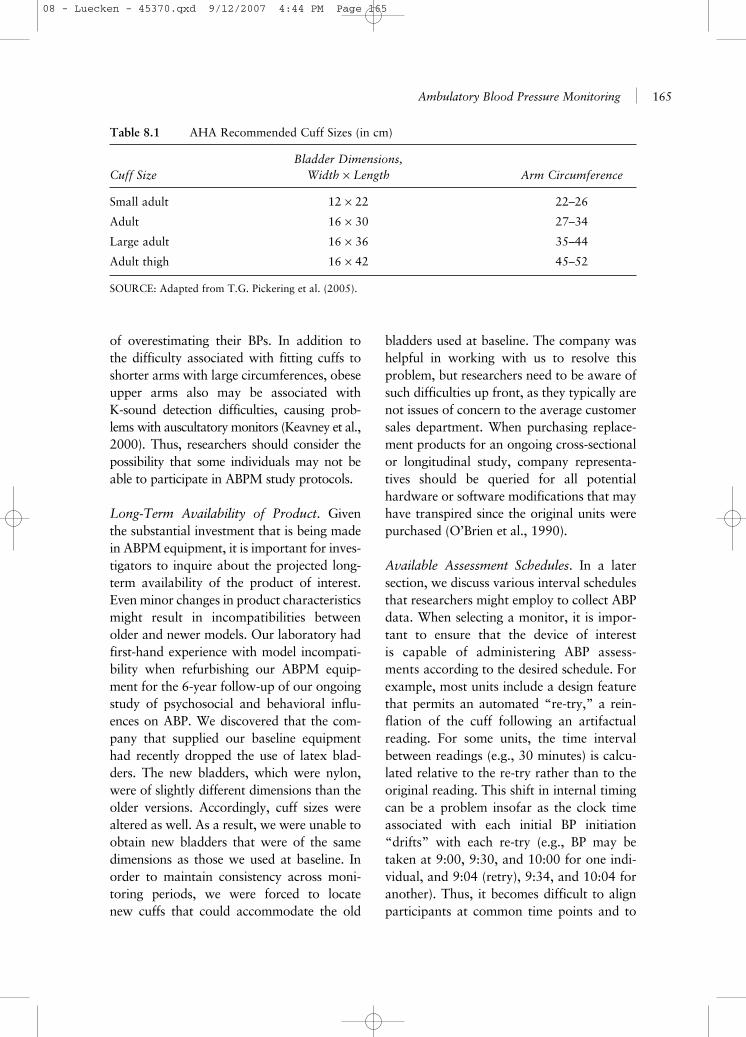
Cuff Sizing. The consensus recommendationof the American Heart Association (AHA) isthat the “ideal” BP cuff should have a blad-der width that is at least 40%, and a lengththat is at least 80% of the arm circumference(Pickering et al., 2005). A bladder that is toonarrow or too short will result in overesti-mation of BP readings, whereas a bladderthat is too wide or too long may cause under-estimation of readings. Table 8.1 displaysAHA recommended dimensions for adultcuff bladder sizes based on these criteria. Itshould be emphasized that AHA recommen-dations are only guidelines. Despite AHArecommendations, bladder dimensions corre-sponding to small adult, adult, and largeadult cuff sizes may differ across manufac-turers or within manufacturers over time.When selecting an ABPM device, it is in the best interest of the researcher to choose a manufacturer that produces cuffs withdimensions that correspond to those recom-mended by the AHA. Given the potentialinfluence of cuff size on BP readings, it isessential that the same bladder size be used ifABPM is conducted during multiple assess-ment periods. Likewise, bladders of the samesize must be used for ABP and clinic BPassessment if both types of data are collected(Staessen, Fagard, Thijs, & Amery, 1995).
Although the AHA cuff size recommenda-tions are appropriate in most situations, insome instances they may be difficult to apply.For example, the large adult cuff may not beappropriate for obese participants with rela-tively short upper arms, as the extra widthof the large adult cuff may exceed the lengthof the upper arm (Pickering et al., 2005). Asmaller cuff may be more comfortable forthese individuals, but its use increases the risk
PART II: PHYSIOLOGICAL SYSTEMS AND ASSESSMENTS: CARDIOVASCULAR164
08 - Luecken - 45370.qxd 9/12/2007 4:44 PM Page 164
of overestimating their BPs. In addition to the difficulty associated with fitting cuffs toshorter arms with large circumferences, obeseupper arms also may be associated withK-sound detection difficulties, causing prob-lems with auscultatory monitors (Keavney et al.,2000). Thus, researchers should consider thepossibility that some individuals may not beable to participate in ABPM study protocols.
Long-Term Availability of Product. Giventhe substantial investment that is being madein ABPM equipment, it is important for inves-tigators to inquire about the projected long-term availability of the product of interest.Even minor changes in product characteristicsmight result in incompatibilities betweenolder and newer models. Our laboratory hadfirst-hand experience with model incompati-bility when refurbishing our ABPM equip-ment for the 6-year follow-up of our ongoingstudy of psychosocial and behavioral influ-ences on ABP. We discovered that the com-pany that supplied our baseline equipmenthad recently dropped the use of latex blad-ders. The new bladders, which were nylon,were of slightly different dimensions than theolder versions. Accordingly, cuff sizes werealtered as well. As a result, we were unable toobtain new bladders that were of the samedimensions as those we used at baseline. Inorder to maintain consistency across moni-toring periods, we were forced to locatenew cuffs that could accommodate the old
bladders used at baseline. The company washelpful in working with us to resolve thisproblem, but researchers need to be aware ofsuch difficulties up front, as they typically arenot issues of concern to the average customersales department. When purchasing replace-ment products for an ongoing cross-sectionalor longitudinal study, company representa-tives should be queried for all potential hardware or software modifications that mayhave transpired since the original units werepurchased (O’Brien et al., 1990).
Available Assessment Schedules. In a latersection, we discuss various interval schedulesthat researchers might employ to collect ABPdata. When selecting a monitor, it is impor-tant to ensure that the device of interest is capable of administering ABP assess-ments according to the desired schedule. Forexample, most units include a design featurethat permits an automated “re-try,” a rein-flation of the cuff following an artifactualreading. For some units, the time intervalbetween readings (e.g., 30 minutes) is calcu-lated relative to the re-try rather than to theoriginal reading. This shift in internal timingcan be a problem insofar as the clock timeassociated with each initial BP initiation“drifts” with each re-try (e.g., BP may betaken at 9:00, 9:30, and 10:00 for one indi-vidual, and 9:04 (retry), 9:34, and 10:04 foranother). Thus, it becomes difficult to alignparticipants at common time points and to
Ambulatory Blood Pressure Monitoring 165
Table 8.1 AHA Recommended Cuff Sizes (in cm)
Bladder Dimensions, Cuff Size Width × Length Arm Circumference
Small adult 12 × 22 22–26
Adult 16 × 30 27–34
Large adult 16 × 36 35–44
Adult thigh 16 × 42 45–52
SOURCE: Adapted from T.G. Pickering et al. (2005).
08 - Luecken - 45370.qxd 9/12/2007 4:44 PM Page 165
synchronize the ABP device with, forexample, handheld computers for coordi-nated program routines. Once again, featuressuch as this one may have little consequencefor routine clinical practice, but may beproblematic for research. Such featuresshould be tested and inquired about whenselecting an ABP monitor.
Option to Turn Off Display. Most, if not allmonitors display ABP readings on a smallLCD screen. Because participants’ knowl-edge of their BPs might influence subsequentreadings, availability of the option to turn offthe LCD display is important.
Software. All ABP monitors come with soft-ware that performs functions such as plottingABP profiles, performing selected statisticalanalyses, and facilitating export of data formore comprehensive research analysis.Researchers might evaluate software prod-ucts on ease of use, compatibility with plat-forms in use by analysis workstations, andcapacity for data security.
Risk. Risks associated with ambulatory monitoring are few and minor, and typicallyinvolve superficial reactions followingrepeated cuff application, such as skin irrita-tion and bruising (Beltman et al., 1996).Researchers might be advised to consult withindividual manufacturers to determinewhether any additional risks might be associ-ated with their product.
Training
Research Staff Training. Research staffshould be familiar with principles of conven-tional BP measurement, such as palpation ofthe brachial artery, auscultation, and cuff fit-ting (Perloff et al., 1993). Skill in manual BPmeasurement techniques is necessary becauseambulatory monitors must be calibrated
against a manual manometry standardbefore participants are sent into the field.The protocol for calibration involves con-necting the ambulatory device to a mercurysphygmomanometer with a Y or T connec-tion. The automatic pressure system and BPdetection mechanisms of the ambulatorydevice are disabled, and thus the device actssimply as a pressure gauge. Pressures withinthis system are compared to measurementsdisplayed on the mercury column. Using thisprotocol, BP measurements taken with theambulatory device must fall within 5 mmHgof a mercury standard (Pickering et al.,2005). In our lab, research associates taketwo readings of participants’ pressures. Ifeither automated measurement fails to meetthe 5 mmHg criterion, the monitor isreplaced and a second set of calibration pro-cedures is conducted.
Research staff also should understand theprocedure for downloading ABP data to aPC, and be fluent in the use of relevant soft-ware. We have found it helpful to provideimmediate feedback to participants whenthey returned their monitors to the lab. Beingable to produce a readable printout of par-ticipants’ ambulatory readings facilitates dis-cussions with participants about their BPdata, which can be an important motiva-tional factor for study participation.
In addition to being trained in the opera-tion of the ambulatory monitor, staffmembers should be well versed in the work-ings of the device, and thus able to trou-bleshoot problems that might arise forparticipants while monitoring in the field.Researchers might be advised to place a staffmember on call 24 hours a day while partici-pants are monitoring. In our laboratory, on-call staff members receive two to three callsfrom participants per week. A typical problemreported during these calls is the need forinstruction on how to replace the batteries inthe monitor.
PART II: PHYSIOLOGICAL SYSTEMS AND ASSESSMENTS: CARDIOVASCULAR166
08 - Luecken - 45370.qxd 9/12/2007 4:44 PM Page 166

Participant Training. Participants should beinstructed on proper use and maintenance ofthe ambulatory monitor. In our laboratory,two research associates conduct training ses-sions among groups of one to five participantsusing a standard script and Power Point pre-sentation. Several types of information shouldbe related to participants during training.First of all, participants should be providedwith basic information on what to expectwhile monitoring, such as how frequently BPwill be assessed, and how the monitor soundsand feels during cuff inflation. Furthermore,participants should be reminded that theresearcher is interested in collecting informa-tion on BP during activities that are typical indaily life, and they therefore should try tomaintain their usual routines during monitor-ing. Some participants attempt to adjust theirroutines to reduce discomfort with the moni-tor, such as monitoring only during nonworkdays. This strategy is obviously not optimal,because BP data obtained during nonworkdays may not be generalizable to work days.Moreover, given that full-time employeesspend more days during a typical week atwork than in nonwork settings, nonwork BPsmay not be entirely representative of typicaldaily pressures.
Also fundamental to participant training isinstruction on how to properly remove andreplace the compression cuff. Participantsshould be instructed on where to place the cuffon the arm, and how tightly to wrap the cuffso that it remains stable during monitoring,but does not impair circulation. Use of an aus-cultatory monitor requires additional trainingbecause participants must be instructed onproper positioning of the transducer (micro-phone). Our research associates use a semiper-manent marker to indicate where on the armthe microphone should be placed. Many, ifnot most, research protocols do not ask par-ticipants to perform their own instrumenta-tion. The main benefit of instrumentation in
the lab is that trained staff can ensure thatcuffs are fitted correctly. However, if monitor-ing is to take place over several days, havingparticipants return to the lab for instrumenta-tion every morning creates substantial burden.
Another issue that needs to be addressedduring training is movement and position ofthe arm during measurement. Participantsshould be told to keep their arm immobilewhile measurements are being made.Participants also should be encouraged tomaintain consistent posture throughout theperiod of measurement, as changes in posturemay influence readings (O’Brien et al., 2003).For example, if a participant is standing whileSBP is being measured, but seated while DBPis being measured, the resulting pulse pressurewill be artificially wide. If participants areundergoing 24-hour monitoring, they can beinstructed to place the monitor on the bed orunder a pillow (to reduce noise during cuffinflation) when they go to bed at night(O’Brien et al., 2000). Participants should becautioned against sleeping with the monitoredarm on top of the pillow that is covering themonitor, because this vertical displacement ofthe arm can lead to artificially lower BP read-ings, and thus create the appearance of exag-gerated dipping (Kammila, Campbell, Brant,deJong, & Culleton, 2002).
Finally, participants should be instructedin the proper care and maintenance of theirmonitors. Participants should be instructedto keep monitors away from water, to avoiddropping or bumping the monitor, and toavoid pulling or jerking the tubing that con-nects the monitor to the compression cuff.
We recommend that participants have anopportunity to practice monitoring beforedata collection begins. We typically followtraining with a “shakedown day” and feed-back session, which gives participants anopportunity to troubleshoot any difficultiesthey may have with the monitor. In someinstances, the first few readings during an
Ambulatory Blood Pressure Monitoring 167
08 - Luecken - 45370.qxd 9/12/2007 4:44 PM Page 167
ABPM period may be abnormally high, aphenomenon that may result from initialheightened awareness of the monitoring situ-ation (Owens, Lyons, Rodriguez, & O’Brien,1998). If such initial readings are included aspart of a training period, they can be dis-carded without loss of actual data.
Artifact
ABP data generally include a percentageof BP readings that lie outside of the partici-pant’s usual range and likely do not representgenuine BP values. Various editing methodshave been designed to identify and eliminateoutlying values in the raw ABP data. It is inthe best interest of the researcher, however,to identify sources of artifactual readings,and incorporate safeguards into their proce-dures to minimize the number of outlyingvalues. In other words, concern for outlyingvalues should begin at data collection ratherthan at data analysis.
Sources of Artifact. Three important sourcesof artifactual readings are arm movement,cuff or microphone displacement, and posi-tion of the arm relative to the heart. Armmovement is a common cause of failed read-ings (Palatini, 2001), and is especially prob-lematic when an oscillometric device is beingused. Motion artifact can be minimized tosome extent by instructing participants toabstain from moving the arm to which thecuff is attached while a BP measurement isbeing taken. By comparison, cuff displace-ment is a more significant source of errorwhen an auscultatory monitor is being used.Movement of the cuff may result in disloca-tion of the transducer from the site of thebrachial artery, thus hindering the ability todetect K-sounds. Microphone displacementmight be avoided by taping the transducer tothe participant’s arm. In our lab, participantsare provided with Lycra sleeves that aredesigned to be worn under the compression
cuff, and contain a small pocket in which toplace the transducer.
Handling Artifact. Accurate identificationand elimination of outlying values is essen-tial to proper interpretation of ABP data.Rejection of outliers can substantially alterABP data (Berardi, Chau, Chanudet, Vilar, &Larroque, 1992; Winnicki, Canali, Mormino,& Palatini, 1997), even to the point of reduc-ing the ratio of individuals in a given samplewhose data meet diagnostic criteria for hyper-tension (Winnicki et al., 1997). A review ofseveral outlier rejection methods identifiedthree basic approaches: univariate, multi-variate, and temporal (Berardi et al., 1992).Univariate approaches reject BP readings if they fall outside of a specified range. TheCasadei method, for example, rejects SBPreadings that are greater than 240 mmHg or less than 50 mmHg (Casadei et al., 1988).Multivariate approaches examine simultane-ous readings of SBP, DBP, and heart rate, andreject values based on some combination ofthese parameters, such as pulse pressure orthe SBP/DBP ratio. More complicated multi-variate methods consider the influence ofcovariates, such as exercise concurrent withthe ABP measurement, and incorporate these factors into mathematically complexalgorithms (Clark et al., 1987). Temporalapproaches are based on the slope of the SBPand DBP versus time curves, and reject BPreadings that diverge too far from the associ-ated models.
Comparison across studies of the variousoutlier rejection methods does not result in theidentification of a single set of criteria that isunequivocally superior to others in distin-guishing artifactual readings from true ABPvalues (Berardi et al., 1992). In a single studythat compared several editing methods byassessing their effects on a single set of data,Winnicki and colleagues observed that meth-ods may differ with respect to improving thereproducibility of ABP (Winnicki et al., 1997).
PART II: PHYSIOLOGICAL SYSTEMS AND ASSESSMENTS: CARDIOVASCULAR168
08 - Luecken - 45370.qxd 9/12/2007 4:44 PM Page 168
Their results suggested that a modified versionof the cutpoints designed by Casadei and colleagues (Casadei et al., 1988) appeared toprovide the most reproducible results. Theauthors acknowledged, however, that repro-ducibility may not be the most appropriatecriterion on which to judge the accuracy ofoutlier rejection techniques. Judgment mightbetter be based on comparison of edited ABPvalues with intraarterial BP readings. To date,no published study has compared edited ABPvalues that have been obtained by various outlier rejection methods with intraarterialmeasurements. In the absence of empirical evidence to support the superiority of one out-lier rejection method over the rest, recent con-sensus statements (O’Brien et al., 2003;Pickering et al., 2005) have made no recom-mendations. It has been suggested, however,that if a sufficient number of measurementsexist, editing is not necessary to calculatemean ABP values, and only grossly deviantreadings should be deleted from the dataset(O’Brien et al., 2003).
Design Issues
Sample Size. Of fundamental concern whenplanning an ABPM study is establishing anappropriate sample size. Depending on theresearch question of interest, the “sample”might be composed of (a) the number of par-ticipants who are enrolled in the study, (b) thenumber of ABP readings per participant,and/or (c) the total number of collected ABPreadings (i.e., the number of ABP readings per participant multiplied by the number ofparticipants in the study). Relevant factorsinfluencing appropriate sample size includegeneralizability of the ABP data, analytic strat-egy and desired statistical power, and cost.
Generalizability. The extent to which col-lected ABP data are generalizable to “typi-cal” daily BPs is determined, in large part,by the number of ABP readings that are
collected per subject. Llabre and colleaguesapplied generalizability theory to BP mea-surements that were collected in various con-texts (Llabre et al., 1988). The results of theanalysis suggest that at least 6 replications ofSBP and 6 to 10 replications of DBP at workand at home, respectively, may be required to ensure acceptable levels of generalizabilityto typical pressures in each of those settings(Llabre et al., 1988).
Analytic Strategy and Statistical Power. Thepreferred method for analyzing ABP datainvolves the use of complex multilevel mod-els (Schwartz & Stone, 1998), which are dis-cussed in greater detail in the next section. Inreference to these statistical techniques, onefrequently cited rule of thumb is that samplesizes should be composed of at least 30 sub-jects with at least 30 observations per subject(Hox, 2002). This recommendation, ofcourse, is intended only as a general guide-line. A more accurate method for determin-ing sample size is to consider the desiredpower to predict anticipated effects. A dis-cussion of power analysis for multilevel mod-els is beyond the scope of the present chapter.However, detailed information can be obtainedelsewhere (Hox, 2002; Raudenbush & Liu,2000; Snijders & Bosker, 1999).
Cost. In addition to considering the factorsalready discussed, investigators must weighthe cost—in terms of time, money, and par-ticipant burden associated with the design,including whether it would be more efficientto include additional persons or additionalobservations (Hox, 2002).
Frequency and Schedule of Sampling. Studiesinvolving ambulatory data collection might beclassified according to whether the initiationof a measurement is contingent on temporalor event-based criteria (Bolger, Davis, &Rafaeli, 2003). Designs that use temporal-based criteria can be further divided into
Ambulatory Blood Pressure Monitoring 169
08 - Luecken - 45370.qxd 9/12/2007 4:44 PM Page 169
fixed- and variable-schedule protocols. Infixed-schedule designs, assessments are takeneither at specific times of the day (e.g., 9:00a.m., noon, and 4:00 p.m.) or at specific timeintervals (e.g., every hour, every 3 hours,daily). The length of the interval betweenassessments is an important considerationwhen employing a fixed-schedule design.Intervals that are too long may result in loss ofimportant information, whereas intervals thatare too short might increase the signal-to-noise ratio and place unnecessary burden onparticipants. Bolger and colleagues conclude itis best to err on the side of shorter rather thanlonger intervals (Bolger et al., 2003). In ourresearch on psychosocial and behavioral cor-relates of daily BP, we assessed ABP and con-current psychological and physical state at45-minute intervals during waking hours.This interval is slightly longer than those usu-ally employed in ABP studies, which typicallyrange from every 15 to every 30 minutes. Wechose 45 minutes rather than a more frequentinterval because of the time-consuming natureof the self-report psychosocial and behavioralassessment that our participants completedconcurrently with each ABP recording. Weavoided a strict hourly interval in order toreduce synchronization with daily activities,such as classes or meetings, which frequentlystart and stop on the hour.
In variable-schedule designs, assessmentsof the phenomena of interest are distributedaccording to a random pattern to which par-ticipants are blinded. An advantage associ-ated with variable-schedule designs is thatrandom assessments may reduce potentialfor biased reporting (Bolger et al., 2003). Byway of illustration, consider a study whereinparticipants are asked to report on the levelof stress they are experiencing at the time ofeach ABP assessment. If ABP is assessed atregular intervals, participants might beginto attend specifically to stressful aspects oftheir experience during times that they antic-ipate cuff inflation. Assessment at random
intervals would reduce the risk of such antic-ipatory bias. Variable-schedule designs maybe associated with greater participant bur-den, however, because participants may havegreater difficulty accommodating to the ran-dom distribution of assessments.
In event-based designs, assessments takeplace only within the context of a clearlydefined triggering event. Thus, event-basedsampling is appropriate when interest is inassessing the variable of interest during rare orspecialized situations that may not be cap-tured with time-based strategies. For example,in their study of social relationships and ABP,Holt-Lunstad and colleagues instructed partic-ipants to initiate an ABP reading approxi-mately 5 minutes into every social interaction.Participants also completed a brief paper-and-pencil diary report concurrent with each ABPassessment (Holt-Lunstad, Uchino, Smith,Olson-Cerny, & Nealey-Moore, 2003). Fromthese data, the authors were able to assesswhether ABP levels during social interactionsdiffered as a function of (a) interaction partnerand (b) affective quality of the interaction(Holt-Lunstad et al., 2003). Bolger and col-leagues describe two potential risks associatedwith event-contingent designs, the first havingto do with participant compliance with proto-col and the second with investigators’ treat-ment of the data (Bolger et al., 2003). Withregard to the first risk, the success of event-contingent data collection depends largely onthe ability of participants to recognize andrespond to the trigger event. Thus, insofar asparticipants are unreliable in either regard,substantial relevant data may be lost. Withregard to the second risk, investigators may betempted to overgeneralize from event-basedassessments, which are not strictly representa-tive of participants’ general experiences.
Definitions of Daytime and Nighttime. Ifmonitoring is to take place over 24 hours,researchers must determine how best todefine periods of daytime wakefulness and
PART II: PHYSIOLOGICAL SYSTEMS AND ASSESSMENTS: CARDIOVASCULAR170
08 - Luecken - 45370.qxd 9/12/2007 4:44 PM Page 170
nighttime rest. As discussed in an earliersection, BP tends to follow a diurnal rhy-thm wherein pressures are higher during theday and lower at night (the dipping phe-nomenon), with the primary determinants ofthis rhythm being posture, activity, andarousal (Pickering, Schwartz, & Stone, 1996).Inaccurate specification of daytime and night-time, then, can lead to poor estimation ofaverage day (waking) and night (sleep) pres-sures. ABPM software packages typicallycontain a default day-night definition (e.g.,day 6:00 to 22:00; night 22:00 to 6:00).However, evidence suggests that default defi-nitions do not correspond to all participants’actual periods of sleep and wakefulness, andthus “default” day and night pressures maydiffer markedly from actual day and nightvalues (Eissa, Yetman, Poffenbarger, &Portman, 1999; Gatzka & Schmieder, 1995).Thus, researchers might be advised to includemeasures of participants’ actual times ofawakening and going to sleep. Several ABPMstudies have incorporated self-report diaryreports of participants’ waking and sleepingtimes (Gatzka & Schmieder, 1995; Loimaalaet al., 1997; Robles, Cancho, Ruiz-Calero,Angulo, & Sanchez-Casado, 2003; Shapiro& Goldstein, 1998). The main advantage ofusing diary reports rather than default day-night definitions is that diary reports allowfor the possibility that participants’ true wak-ing and sleeping times differ from (a) thetimes used to define default day and nightperiods and (b) other participants’ wakingand sleeping times. A limitation of thisapproach is that it creates additional burdenfor participants.
Another method that might be used toidentify participants’ true periods of wakingand sleeping is asking them to wear an acti-graph in addition to the ABP monitor (Eissa,Poffenbarger, & Portman, 2001; Eissa et al.,1999). Like diary reports, actigraphy datahave the advantage of providing individual-ized information on participants’ actual
sleep-wake patterns. Moreover, unlike diarymethods, actigraphy presents no additionalparticipant burden, save for the wearing ofthe actigraph. An obvious limitation of usingactigraph data to define awake and sleepperiods is the cost associated with the pur-chase of additional equipment.
A novel approach to identifying sleep-wake patterns involves analysis of heart rate(HR) data. Pekarski and colleagues developeda mathematical algorithm for identifyingnighttime rest as a period of low ambulatoryHR values (Pekarski, Mordovin, Triss, Semke,& Kolodina, 2002). Advantages associatedwith this method are that examination of HRdoes not require purchase of additionalequipment (discrete HR measures can beobtained from the ABPM device) and it doesnot place additional burden on participants(Pekarski et al., 2002). On the other hand (forexample, in the measurement of BP dipping),such measures may reflect a confoundbetween the independent (activity level) anddependent (cardiovascular assessments) vari-ables of interest.
Monitoring for More Than 24 Hours. Theduration of ABPM studies often is limited to a single 24-hour period. Depending on the interests of the researcher, however, theremay be some advantage to extending themonitoring period to longer than 24 hours. Inone of our studies, for example, we collectedambulatory data (i.e., ABP and concurrentdiary data) during two 3-day periods (wakinghours only) that were separated by about 4months. Our intention with this design was toenhance the likelihood that we were captur-ing a “representative slice” of participants’lives. Holt-Lunstad and colleagues monitoredparticipants during the course of a single 3-day period. In this case, a multiple-day moni-toring period was selected in order to obtaina broader sampling of participants’ socialinteractions (Holt-Lunstad et al., 2003).Increasing the duration of the monitoring
Ambulatory Blood Pressure Monitoring 171
08 - Luecken - 45370.qxd 9/12/2007 4:44 PM Page 171
period also might be an alternative approachto increasing the power of the study if increas-ing the frequency of ABP measurements is notfeasible (Raudenbush & Xiao-Feng, 2001).
Handling Metabolic andBehavioral Influences on ABP
ABP may be influenced substantially bymetabolic and behavioral activities that areongoing at the time a reading is taken. Thus,it may be useful to instruct participants toreport on level of activity, posture, or inges-tion of food, drink, caffeine, tobacco, or med-ication concurrent with ABP assessments. Anumber of ambulatory diaries have beendeveloped for this purpose, and most involvepaper-and-pencil recording of metabolic andbehavioral influences. An alternative strategyis to use an electronic diary that can be displayed on a handheld computer. Evidencesuggests that patient compliance with elec-tronic diaries is superior to that shown withpaper diaries (Stone, Shiffman, Schwartz,Broderick, & Hufford, 2002). In one of ourrecent studies, participants provided, on aver-age, 105 complete observations with validelectronic diary and ABP readings, represent-ing 75% of all possible observations over two 3-day monitoring periods, which suggeststhat such systems are feasible and can be asso-ciated with a reasonable level of compliance(Kamarck et al., 2007). Accelerometry-basedphysical activity monitors also may be usedfor indexing physical activity correlates ofABP (Kario, Schwartz, et al., 2001).
ANALYTIC ISSUES
To fully appreciate the wealth of informationthat ABPM data have to offer, researchersmust acknowledge the complex, multilevelstructure of the data and employ analytic tech-niques that can accommodate that structure.
Structure of ABP Data andQuestions That Can Be Asked of It
ABPM is one example of ecologicalmomentary assessment (EMA) (Stone &Shiffman, 1994), which involves collectingrepeated measurements of behavioral, psy-chological, or physiological phenomena asthey occur in the natural setting. An impor-tant feature of EMA research is two-stagesampling. For example, in an ABP study, thefirst stage occurs when participants are sam-pled from the larger population of individu-als; in the second stage, ABP measurementsare sampled from the larger population ofparticipants’ daily pressures. In this way,data from ABPM research comprise a hierar-chical system (Hox, 2002) wherein ABP mea-surements are “nested” within participants.
The multilevel structure of ABP data sug-gests at least two sources of random variation:between-person and within-person. Thus,ambulatory monitoring allows researchers toexamine the effects of between- and within-person differences on daily BP, as well aspotential cross-level interactions. In theirexcellent discussion of analytic strategies foruse in EMA research, Schwartz and Stonedescribe three types of questions that multi-level data might address: (1) Do participantcharacteristics (between-person factors) pre-dict differences in mean levels of an outcome?(2) do contextual features (within-personfactors) predict momentary fluctuationsamong individual assessments? and (3) doparticipant characteristics predict differencesin within-person associations? (Schwartz &Stone, 1998). Specifically with regard toABP research, one might investigate whethera given psychological trait, such as hostility,predicts between-person differences in aver-age ABP (Raikkonen et al., 1999). Onealso might examine whether momentaryreports of social conflict at the time of ABPmeasurement predict within-person changes
PART II: PHYSIOLOGICAL SYSTEMS AND ASSESSMENTS: CARDIOVASCULAR172
08 - Luecken - 45370.qxd 9/12/2007 4:44 PM Page 172
in momentary ABP levels, and whether thatwithin-person association depends on between-person differences in hostility (Brondolo et al.,2003).
A number of statistical techniques thatemploy ordinary least squares (OLS) estima-tion have been used to analyze multilevel datalike those obtained from ABPM. These includeordinary analysis of variance (ANOVA) orcovariance (ANCOVA), nested ANOVA andANCOVA, and pooled within-person regres-sion analysis. Schwartz and Stone provide adetailed description of these techniques, andthe extent to which each is more or less appro-priate for analysis of EMA data (Schwartz &Stone, 1998). In brief, the authors concludedthat the majority of standard statistical meth-ods are not appropriate for use in EMAresearch because multilevel data frequentlyexhibit one or more of the following features:nonindependence, autocorrelation, unbal-anced design, and heteroscedasticity.
Nonindependence. Because ABP readings are nested within participants, individualABP observations are not completely inde-pendent. Specifically, average correlationsbetween ABP measurements that are takenfrom a single individual will tend to be higherthan correlations between ABP measure-ments taken from different individuals.Standard OLS statistics rely on the assump-tion of independence of observations.Violation of this assumption results in stan-dard errors that are too small, and thus ahigher probability of Type 1 error.
Autocorrelation. Because each participant’sABP measurements are collected sequentially,the residuals will tend to show a certaindegree of autocorrelation. In other words, fora given participant, ABP readings takenwithin close temporal proximity will tendto be more similar than ABP readings thatare separated by a large temporal distance.
Failure to control for autocorrelation tends toresult in overestimation of between-personvariability, underestimation of within-personvariability, and increased risk of Type 1 error in the analysis of within-person effects(Schwartz & Stone, 1998).
Unbalanced Design and Heteroscedasticity.Balanced designs are rare among ABPMstudies because data are frequently missing,thus leading to unequal numbers of observa-tions between participants. As within-personvariability is determined, in part, by thenumber of observations, unequal numbers ofobservations across participants will lead tounequal error variances, or heteroscedastic-ity. Heteroscedasticity in the data reduces theefficiency of estimates of model parameters,resulting in tests of significance that canelevate the possibility of either Type 1 orType 2 error, depending on the pattern ofheterogeneity.
Multilevel Modeling
Multilevel models that use maximum like-lihood (ML) estimating techniques have beenrecommended as an alternative to conven-tional OLS statistics for analyzing EMA data(Schwartz & Stone, 1998). One of the mainadvantages of multilevel models is that theyuse all available data, rather than excludingcases with missing observations. In otherwords, they can accommodate unbalanceddesigns. This feature of multilevel models isof particular relevance to ABP data, as it iscommon for a significant proportion of par-ticipants to be missing at least one observa-tion. Another advantage of multilevel modelsis that they allow for the specification oferror variance, and thus permit accurate andefficient effect estimation in the presence ofheteroscedasticity, which is common to ABPdata. An additional advantage of multilevelmodels is that they permit the modeling of
Ambulatory Blood Pressure Monitoring 173
08 - Luecken - 45370.qxd 9/12/2007 4:44 PM Page 173
autocorrelation. More thorough discussionsof the theory behind multilevel models andassociated analytic techniques is providedelsewhere (Bryk & Raudenbush, 1992; Hox,2002; Singer & Willett, 2003; Snijders &Bosker, 1999).
Available Software
Several statistical packages capable of per-forming multilevel analyses with maximumlikelihood estimation have become availableduring the past decade, and a number of thesehave been reviewed (Kreft, deLeeuw, &Vander Leeden, 1994; Zhou, Perkins, & Hui,1999). Currently, HLM (Bryk, Raudenbush,& Congdon, 1996) and MLwinN (Rasbash,Steele, & Browne, 2003) are the two majorspecialized programs. Less well knownspecialized programs include MIXREG(Hedeker & Gibbons, 1996b) and MIXOR(Hedeker & Gibbons, 1996a), for continuousand dichotomous or ordinal data, respec-tively. Also available are multilevel modulesincluded in major statistical packages, such asthe SAS multilevel procedure, PROC MIXED(Littell, Milliken, Stroup, & Wolfinger, 1996;SAS Institute, 1992), and the SPSS multilevelprocedure, MIXED (SPSS for Windows, Rel.11.5 2001. Chicago: SPSS Inc). One advan-tage of the SAS and SPSS procedures is that asingle statistical package can be used for management and analysis of multilevel data.Singer has written an excellent tutorial forusing SAS PROC MIXED for fitting multi-level models (Singer, 1998). A similar tutorialfor SPSS MIXED is provided by Peugh andEnders, who duplicate Singer’s analyses usingthe SPSS procedure (Peugh & Enders, 2005).
REPORTING FINDINGSFROM ABPM RESEARCH
Given the methodological rigor of ABPMresearch and the complexity of ABP data,
special care must be taken to include appro-priate detail when presenting the findings ofan ABPM study. Stone and Shiffman havewritten an excellent paper that outlinesseveral features of EMA research, in general,that would be helpful to discuss in reports ofEMA study findings (Stone & Shiffman,2002). These features include (1) the ratio-nale for choosing an EMA design, (2) theprocedure for collecting EMA data, (3) detailsof the monitoring apparatus, (4) participantcompliance with the sample procedure,(5) participant training, (6) data manage-ment procedures, and (7) the data analyticapproach (Stone & Shiffman, 2002).
CONCLUSION
The ability to assess BP in the field as indi-viduals go about their daily routines providesan opportunity for behavioral medicineresearchers to identify psychosocial corre-lates of fluctuations in cardiovascular activ-ity. Given the demonstrated prognosticutility of ABPM, the ability to identify psy-chosocial and behavioral correlates of dailypressures ultimately may lead to a betterunderstanding of the role played by thesefactors in the emergence of clinical CVD.
In exchange for the potential benefitsafforded by ABPM, researchers must be will-ing to invest considerable time and resourcesin preparation for and in the actual conductof an ABPM study. Researchers must be educated in which factors to consider whenselecting an ambulatory monitor and be pre-pared to make a substantial initial mone-tary investment in equipment. Research staffmust be trained in the operation and mainte-nance of ABPM equipment, and be able toanswer questions and troubleshoot any prob-lems that might arise while research partici-pants are monitoring. Research participants,as well, must be trained in the proper careand use of their monitors. The design of an
PART II: PHYSIOLOGICAL SYSTEMS AND ASSESSMENTS: CARDIOVASCULAR174
08 - Luecken - 45370.qxd 9/12/2007 4:44 PM Page 174

ABPM study must be informed by issues per-taining to definitions of daytime and night-time, whether monitoring will take place formore than 24-hours, and how best to mea-sure the effects of behavioral factors (such asposture and ingestion of food or drink) on
ABP. Finally, researchers must be educated inhow to interpret, edit, and analyze the ABPdata they have collected. It is our hope thatthe information provided in this chapter willaid interested investigators in furtheringresearch in this area.
Ambulatory Blood Pressure Monitoring 175
SUGGESTED READINGS
Kamarck, T. W., Schwartz, J., Shiffman, S., Muldoon, M. F., Sutton-Tyrrell, K., &Janicki, D. L. (2005). Psychosocial stress and cardiovascular risk: What is therole of daily experience? Journal of Personality, 73, 1749–1774.
O’Brien, E., Asmar, R., Beilin, L., Imai, Y., Mallion, J.-M., Mancia, G., et al.(2003). European Society of Hypertension recommendations for conventional,ambulatory and home blood pressure measurement. Journal of Hypertension,21(5), 821–848.
Pickering, T. G., Hall, J. E., Appel, L. J., Falkner, B. E., Graves, J., Hill, M. N., et al. (2005). Recommendations for blood pressure measurement in humansand experimental animals part I: Blood pressure measurement in humans.Hypertension, 45, 142–161.
Pickering, T. G., & Kario, K. (2001). Nocturnal non-dipping: What does it augur?Current Opinion in Nephrology & Hypertension, 10(5), 611–616.
Schwartz, J. E., & Stone, A. A. (1998). Strategies for analyzing ecological momen-tary assessment data. Health Psychology, 17(1), 6–16.
NOTE
1. Carotid IMT has been shown to be associated with autopsy measures ofatherosclerosis (Pignoli, Tremoli, Poli, Oreste, & Raoletti, 1986; Wong, Edelstein,Wollman, & Bond, 1993), and to correlate with risk for heart attack and stroke(Aronow & Schoenfeld, 1992; Hodis, Mack, & LaBree, 1998; O’Leary, Polak, &Kronmal, 1999; Salonen & Salonen, 1991; Sutton-Tyrrell, Alcorn, Herzog, Kelsey,& Kuller, 1995).
REFERENCES
Amar, J., Vernier, I., Rossignol, E., Bongard, V., Arnaud, C., Conte, J. J., et al.(2000). Nocturnal blood pressure and 24-hour pulse pressure are potent indicators of mortality in hemodialysis patients. Kidney International, 57(6),2485–2491.
Aronow, W. S., & Schoenfeld, M. R. (1992). Forty-five-month follow-up ofextracranial carotid arterial disease for new coronary events in elderly patients.Coronary Artery Disease, 3, 249–251.
Association for the Advancement of Medical Instrumentation. (1993). Americannational standard. Electronic or automated sphygmomanometers. ANSI/AAMISP 10-1992. Arlington, VA: AAMI.
08 - Luecken - 45370.qxd 9/12/2007 4:44 PM Page 175

Beltman, F. W., Heesen, W. F., Smit, A. J., May, J. F., Lie, K. I., & Meyboom-deJong, B. (1996). Acceptance and side effects of ambulatory blood pressuremonitoring: Evaluation of a new technology. Journal of Human Hypertension,10(suppl 3), S39–S42.
Berardi, L., Chau, N. P., Chanudet, X., Vilar, J., & Larroque, P. (1992).Ambulatory blood pressure monitoring: A critical review of the current meth-ods to handle outliers. Journal of Hypertension, 10, 1243–1248.
Bianchi, S., Bigazzi, R., Baldari, G., Sgherri, G., & Campese, V. M. (1994). Diurnalvariations of blood pressure and microalbuminuria in essential hypertension.American Journal of Hypertension, 7(1), 23–29.
Bobrie, G., Chatellier, G., Genes, N., Clerson, P., Vaur, L., Vaisse, B., et al. (2004).Cardiovascular prognosis of “masked hypertension” detected by blood pres-sure self-measurement in elderly treated hypertensive patients. JAMA, 291,1342–1349.
Bolger, N., Davis, A., & Rafaeli, E. (2003). Diary methods: Capturing life as it islived. Annual Review of Psychology, 54, 579–616.
Brondolo, E., Rieppi, R., Erickson, S. A., Bagiella, E., Shapiro, P. A., McKinley, P.,et al. (2003). Hostility, interpersonal interactions, and ambulatory blood pres-sure. Psychosomatic Medicine, 65, 1003–1011.
Bryk, A. S., & Raudenbush, S. W. (1992). Hierarchical linear models. London: Sage.Bryk, A. S., Raudenbush, S. W., & Congdon, R. J. (1996). HLM: Hierarchical
linear and nonlinear modeling with the HLM/2L and HLM/3L programs.Chicago: Scientific Software International.
Casadei, B., Parati, G., Pomidossi, G., Groppelli, A., Trazzi, S., Di Rienzo, M., et al. (1988). 24-hour blood pressure monitoring: Evaluation of Spacelabs5300 monitor by comparison with intra-arterial blood pressure recording inambulant subjects. Journal of Hypertension, 6(10), 797–803.
Clark, L. A., Denby, L., Pregibon, D., Harshfield, G. A., Pickering, T. G., Blank, S.,et al. (1987). A data-based method for bivariate outlier detection: Applicationto automatic blood pressure recording devices. Psychophysiology, 24(1), 119–125.
Clement, D. L., De Buyzere, M. L., De Bacquer, D. A., de Leeuw, P. W., Duprez, D. A.,Fagard, R. H., et al. (2003). Prognostic value of ambulatory blood-pressurerecordings in patients with treated hypertension. New England Journal ofMedicine, 348(24), 2407–2415.
CMS. (2001). Centers for Medicare & Medicaid Services. Medicare coveragepolicy—decisions. ABPM Monitoring (#CAG-00067N). Accessed at http://www.hcfa.gov/coverage/8b3-ff.htm
dabl Educational Trust. Accessed November 15, 2005 at http://www.dableducational.org/sphygmomanometers.html
Devereux, R. B., Pickering, T. G., Harshfield, G. A., Kleinert, H. D., Denby, L.,Clark, L., et al. (1983). Left ventricular hypertrophy in patients with hyperten-sion: Importance of blood pressure response to regularly recurring stress.Circulation, 68(3), 470–476.
Eissa, M. A. H., Poffenbarger, T., & Portman, R. J. (2001). Comparison of the actigraph versus patients’ diary information in defining circadian time periodsfor analyzing ambulatory blood pressure monitoring data. Blood PressureMonitoring, 6(1), 21–25.
Eissa, M. A. H., Yetman, R. J., Poffenbarger, T., & Portman, R. J. (1999). Comparisonof arbitrary definitions of circadian time periods with those determined by
PART II: PHYSIOLOGICAL SYSTEMS AND ASSESSMENTS: CARDIOVASCULAR176
08 - Luecken - 45370.qxd 9/12/2007 4:44 PM Page 176

wrist actigraphy in analysis of ABPM data. Journal of Human Hypertension,13, 759–763.
Fagard, R., Bielen, E., & Amery, A. (1992). Automated versus observer blood pres-sure as determinants of left ventricular structure. European Heart Journal, 13,1373–1379.
Fagard, R. H., Staessen, J. A., & Thijs, L. (1997). Prediction of cardiac structureand function by repeated clinic and ambulatory blood pressure. Hypertension,29, 22–29.
Fagard, R., Staessen, J. A., Thijs, L., & Amery, A. (1995). Multiple standardizedclinic blood pressures may predict left ventricular mass as well as ambulatorymonitoring: A metaanalysis of comparative studies. American Journal of Hyper-tension, 8, 533–540.
Fahrenberg, J., & Myrtek, M. (Eds.). (2001). Progress in ambulatory assessment:Computer-assisted psychological and psychophysiological methods in monitor-ing and field studies. Ashland, OH: Hogrefe & Huber.
Gatzka, C. D., & Schmieder, R. E. (1995). Improved classification of dippers byindividualized analysis of ambulatory blood pressure profiles. AmericanJournal of Hypertension, 8(suppl 7), 666S–671S.
Hall, M., Vasko, R., Buysse, D., Ombao, H., Chen, Q., Cashmere, J. D., et al.(2004). Acute stress affects heart rate variability during sleep. PsychosomaticMedicine, 66, 56–62.
Hansen, T., Jeppesen, J., Rasmussen, S., Ibsen, H., & Torp-Pedersen, C. (2005).Ambulatory blood pressure and mortality: A population-based study.Hypertension, 45(4), 499–504.
Hedeker, D., & Gibbons, R. D. (1996a). MIXOR: A computer program for mixed-effects ordinal probit and logistic regression analysis. Computer Methods andPrograms in Biomedicine, 49, 157–176.
Hedeker, D., & Gibbons, R. D. (1996b). MIXREG: A computer program formixed-effects regression analysis with autocorrelated errors. ComputerMethods and Programs in Biomedicine, 49, 229–252.
Henschel, A., de la Vega, F., & Taylor, H. L. (1954). Simultaneous direct and indi-rect blood pressure measurements in man at rest and work. Journal of AppliedPhysiology, 6, 506–508.
Hodis, H. N., Mack, W. J., & LaBree, L. (1998). The role of carotid artery intima-media thickness in predicting clinical coronary events. Annals of InternalMedicine, 128, 262–269.
Holt-Lunstad, J., Uchino, B. N., Smith, T. W., Olson-Cerny, C., & Nealey-Moore,J. B. (2003). Social relationships and ambulatory blood pressure: Structural andqualitative predictors of cardiovascular function during everyday social inter-actions. Health Psychology, 22(4), 388–397.
Hox, J. (2002). Multilevel Analysis: Techniques and applications. Mahwah, NJ:Lawrence Erlbaum.
Imai, Y., Abe, K., Sasaki, S., Minami, N., Munakata, M., Sakuma, H., et al. (1989).Clinical evaluation of semiautomatic and automatic devices for home bloodpressure measurement: Comparison between cuff-oscillometric and micro-phone methods. Journal of Hypertension, 7, 983–990.
Ituarte, P. H. G., Kamarck, T. W., Thompson, H. W., & Bacanu, S. (1999).Psychosocial mediators of racial differences in nighttime blood pressure dip-ping among normotensive adults. Health Psychology, 18, 393–402.
Ambulatory Blood Pressure Monitoring 177
08 - Luecken - 45370.qxd 9/12/2007 4:44 PM Page 177

Joint National Committee. (1997). The 6th report of the Joint National Committeeon Detection, Evaluation, and Treatment of High Blood Pressure. Archives ofInternal Medicine, 157, 2413–2446.
Kamarck, T. W., Muldoon, M. F., Shiffman, S., Sutton-Tyrrell, K., Gwaltney, C.,& Janicki, D. L. (2004). Experiences of demand and control in daily life as cor-relates of subclinical carotid atherosclerosis in a healthy older sample. HealthPsychology, 23(1), 24–32.
Kamarck, T. W., Polk, D. E., Sutton-Tyrrell, K., & Muldoon, M. F. (2002). Theincremental value of ambulatory blood pressure persists after controlling formethodological confounds: Associations with carotid atherosclerosis in ahealthy sample. Journal of Hypertension, 20(8), 1535–1541.
Kamarck, T. W., Schwartz, J., Shiffman, S., Muldoon, M. F., Sutton-Tyrrell, K., &Janicki, D. L. (2005). Psychosocial stress and cardiovascular risk: What is therole of daily experience? Journal of Personality, 73, 1749–1774.
Kamarck, T. W., Shiffman, S. S., Muldoon, M. F., Sutton-Tyrrell, K., Gwaltney, C. J.,Janicki, D. L., et al. (2007). Ecological momentary assessment as a resource forsocial epidemiology. In A. Stone, S. Shiffman, A. Atienza, & R. Nebeling (Eds.),The science of real-time data capture: Self-report in health research. Oxford,UK: Oxford University Press.
Kammila, S., Campbell, N. R., Brant, R., deJong, R., & Culleton, B. (2002).Systematic error in the determination of nocturnal blood pressure dipping sta-tus by ambulatory blood pressure monitoring. Blood Pressure Monitoring,7(2), 131–134.
Kario, K., Pickering, T. G., Matsuo, T., Hoshide, S., Schwartz, J. E., & Shimada, K.(2001). Stroke prognosis and abnormal nocturnal blood pressure falls in olderhypertensives. Hypertension, 38(4), 852–857.
Kario, K., Schwartz, J. E., Davidson, K. W., & Pickering, T. G. (2001). Gender dif-ferences in associations of diurnal blood pressure variation, awake physicalactivity, and sleep quality with negative affect: The work site blood pressurestudy. Hypertension, 38(5), 997–1002.
Keavney, B., Bird, R., Caiazza, A., Casadei, B., & Conway, J. (2000). Measurementof blood pressure using the auscultatory and oscillometric methods in the samecuff deflation: Validation and field trial of the A&D TM2421 monitor. Journalof Human Hypertension, 14, 573–579.
Khattar, R. S., Senior, R., & Lahiri, A. (1998). Cardiovascular outcome in white-coat versus sustained mild hypertension: A 10-year follow-up study. Circula-tion, 98, 1892–1897.
Kreft, I. G. G., deLeeuw, J., & Vander Leeden, R. (1994). Review of five multilevelanalysis programs: BMDP-5V, GENMOD, HLM, ML3, VARCL. AmericanStatistician, 48(324–335).
Littell, R. C., Milliken, G. A., Stroup, W. W., & Wolfinger, R. D. (1996). SASsystem for mixed models. Cary, NC: SAS Institute.
Little, P., Barnett, J., Barnsley, L., Marjoram, J., Fitzgerald-Barron, A., & Mant, D.(2002). Comparison of acceptability of and preferences for different methodsof measuring blood pressure in primary care. British Medical Journal,325(7358), 258–259.
Llabre, M. M., Ironson, G. H., Spitzer, S. B., Gellman, M. D., Weidler, D. J., &Schneiderman, N. (1988). How many blood pressure measurements areenough? An application of generalizability theory to the study of blood pres-sure reliability. Psychophysiology, 25(1), 97–106.
PART II: PHYSIOLOGICAL SYSTEMS AND ASSESSMENTS: CARDIOVASCULAR178
08 - Luecken - 45370.qxd 9/12/2007 4:44 PM Page 178

Loimaala, A., Turjanmaa, V., Vuori, I., Oja, P., Pasanen, M., & Uusitalo, A.(1997). Variation of ambulatory blood pressure in healthy middle-aged men.Journal of Human Hypertension, 11(4), 227–231.
Mancia, G., Di Rienzo, M., & Parati, G. (1993). Ambulatory blood pressure mon-itoring: Use in hypertension research and clinical practice. Hypertension, 21,500–524.
Mancia, G., & Parati, G. (2000). Ambulatory blood pressure monitoring and organdamage. Hypertension, 36, 894–900.
O’Brien, E., Asmar, R., Beilin, L., Imai, Y., Mallion, J.-M., Mancia, G., et al.(2003). European Society of Hypertension recommendations for conventional,ambulatory and home blood pressure measurement. Journal of Hypertension,21(5), 821–848.
O’Brien, E., Coats, A., Owens, P., Petrie, J., Padfield, P. L., Littler, W. A., et al.(2000). Use and interpretation of ambulatory blood pressure monitoring:Recommendations of the British Hypertension Society. British Medical Journal,320, 1128–1134.
O’Brien, E., Petrie, J., Littler, W., de Swiet, M., Padfield, P. L., O’Malley, K.,et al. (1990). The British Hypertension Society protocol for the evaluationof automated and semi-automated blood pressure measuring deviceswith special reference to ambulatory systems. Journal of Hypertension, 8,607–619.
O’Brien, E., Petrie, J., Littler, W. A., de Swiet, M., Padfield, P. L., Altman, D., et al.(1993). The British Hypertension Society protocol for the evaluation of bloodpressure measuring devices. Journal of Hypertension, 11(suppl 2), S43–S63.
O’Brien, E., Sheridan, J., & O’Malley, K. (1988). Dippers and non-dippers. Lancet,2, 397.
O’Brien, E., Waeber, B., Parati, G., Staessen, J. A., & Myers, M. G. (2001). Bloodpressure measuring devices: Recommendations of the European Society ofHypertension. British Medical Journal, 322, 531–536.
Ohkubo, T., Hozawa, A., Nagai, K., Kikuya, M., Tsuji, I., Ito, S., et al. (2000).Prediction of stroke by ambulatory blood pressure monitoring versus screeningblood pressure measurement in a general population: The Ohasama Study.Journal of Hypertension, 18, 847–854.
Ohkubo, T., Imai, Y., Tsuji, I., Nagai, K., Watanabe, N., Minami, N., et al. (1997).Relation between nocturnal decline in blood pressure and mortality. TheOhasama Study. American Journal of Hypertension, 10(11), 1201–1207.
O’Leary, D., Polak, J. F., & Kronmal, R. A. (1999). Carotid-artery intima andmedia thickness as a risk factor for myocardial infarction and stroke in olderadults. New England Journal of Medicine, 340, 14–22.
Owens, P. E., Lyons, S. P., Rodriguez, S. A., & O’Brien, E. T. (1998). Is elevationof clinic blood pressure in patients with white coat hypertension who have nor-mal ambulatory blood pressure associated with target organ changes? Journalof Human Hypertension, 12, 743–748.
Palatini, P. (2001). Reliability of ambulatory blood pressure monitoring. BloodPressure Monitoring, 6, 291–295.
Pannarale, G., Bebb, G., Clark, S., Sullivan, A., Foster, C., & Coats, A. J. (1993).Bias and variability in blood pressure measurement with ambulatory recorders.Hypertension, 22, 591–598.
Pekarski, S. E., Mordovin, V. F., Triss, S. V., Semke, G. V., & Kolodina, M. V.(2002). Improved automatic analysis of ambulatory blood pressure data based
Ambulatory Blood Pressure Monitoring 179
08 - Luecken - 45370.qxd 9/12/2007 4:44 PM Page 179

on precise detection of individual night-time from diurnal profile of heart rate.Blood Pressure Monitoring, 7, 117–121.
Perloff, D., Grim, C., Flack, J., Frohlich, E. D., Hill, M. N., McDonald, M., et al.(1993). Human blood pressure determination by sphygmomanometry.Circulation, 88, 2460–2470.
Perloff, D., Sokolow, M., & Cowan, R. (1991). The prognostic value of ambula-tory blood pressure monitoring in treated hypertensive patients. Journal ofHypertension, 9(1), S33–S39.
Peugh, J. L., & Enders, C. K. (2005). Using the SPSS MIXED procedure to fit cross-sectional and longitudinal multilevel models. Educational and PsychologicalMeasurement, 65(5), 717–741.
Pickering, T. G. (1996). Recommendations for the use of home (self. and ambula-tory blood pressure monitoring. American Journal of Hypertension, 9, 1–11.
Pickering, T. G., Hall, J. E., Appel, L. J., Falkner, B. E., Graves, J., Hill, M. N., et al. (2005). Recommendations for blood pressure measurement in humansand experimental animals part I: Blood pressure measurement in humans.Hypertension, 45, 142–161.
Pickering, T. G., & Kario, K. (2001). Nocturnal non-dipping: what does it augur?Current Opinion in Nephrology & Hypertension, 10(5), 611–616.
Pickering, T. G., Schwartz, J. E., & Stone, A. (1996). Behavioral influences on diur-nal blood pressure rhythms. Annals of the New York Academy of Sciences,783, 132–140.
Pignoli, P., Tremoli, E., Poli, A., Oreste, P., & Raoletti, R. (1986). Intimal plusmedial thickness of the arterial wall: A direct measurement with ultrasoundimaging. Circulation, 74, 1399–1406.
Raikkonen, K., Matthews, K. A., Flory, J. D., & Owens, J. F. (1999). Effects of hos-tility on ambulatory blood pressure and mood during daily living in healthyadults. Health Psychology, 18(1), 44–53.
Rasbash, J., Steele, F., & Browne, W. (2003). A user’s guide to MLwiN version 2.0.London: Institute of Education, University of London.
Raudenbush, S. W., & Liu, X. (2000). Statistical power and optimal design for mul-tisite randomized trials. Psychological Methods, 5(2), 199–213.
Raudenbush, S. W., & Xiao-Feng, L. (2001). Effects of study duration, frequencyof observation, and sample size on power in studies of group differences inpolynomial change. Psychological Methods, 6(4), 387–401.
Redon, J., Campos, C., Narciso, M. L., Rodicio, J. L., Pascual, J. M., & Ruilope, L. M.(1998). Prognostic value of ambulatory blood pressure monitoring in refrac-tory hypertension: A prospective study. Hypertension, 31(2), 712–718.
Robles, N. R., Cancho, B., Ruiz-Calero, R., Angulo, E., & Sanchez-Casado, E.(2003). Nighttime blood pressure fall in renal disease patients. Renal Failure,25(5), 829–837.
Salonen, R., & Salonen, J. T. (1991). Determinants of carotid intima-media thickness:A population-based ultrasonography study in Eastern Finnish men. Journal ofInternal Medicine, 229, 225–231.
SAS Institute. (1992). SAS/STAT software: Changes and enhancements (SASTechnical Report P-229) (Release 6.07) [Computer software manual]). Cary,NC: Author.
Schwartz, J. E., & Stone, A. A. (1998). Strategies for analyzing ecological momen-tary assessment data. Health Psychology, 17(1), 6–16.
PART II: PHYSIOLOGICAL SYSTEMS AND ASSESSMENTS: CARDIOVASCULAR180
08 - Luecken - 45370.qxd 9/12/2007 4:44 PM Page 180

Sega, R., Facchetti, R., Bombelli, M., Cesana, G., Corrao, G., Grassi, G., et al.(2005). Prognostic value of ambulatory and home blood pressures comparedwith office blood pressure in the general population: Follow-up results from thePressioni Arteriose Monitorate e Loro Associazioni (PAMELA) study.Circulation, 111(14), 1777–1783.
Shapiro, D., & Goldstein, I. B. (1998). Wrist actigraph measures of physical activitylevel and ambulatory blood pressure in healthy elderly persons. Psychophysiology,35(3), 305–312.
Shiffman, S., & Stone, A. A. (1998). Introduction to the Special Section: Ecologicalmomentary assessment in health psychology. Health Psychology, 17(1), 3–5.
Singer, J. D. (1998). Using SAS PROC MIXED to fit multilevel models, hierarchicalmodels, and individual growth models. The Journal of Educational andBehavioral Statistics, 24, 323–355.
Singer, J. D., & Willett, J. B. (2003). Applied longitudinal data analysis: Modelingchange and event occurrence. New York: Oxford University Press.
Snijders, T. A. B., & Bosker, R. (1999). Multilevel analysis: An introduction to basicand advanced multilevel modeling. London: Sage Publications.
Sokolow, M., Werdegar, D., Kain, H. K., & Hinman, A. T. (1966). Relationshipbetween level of blood pressure measured casually and by portable recordersand severity of complications in essential hypertension. Circulation, 34(2),279–298.
Staessen, J. A., Fagard, R., Thijs, L., & Amery, A. (1995). A consensus view on the technique of ambulatory blood pressure monitoring. Hypertension, 26,912–918.
Staessen, J. A., O’Brien, E. T., Thijs, L., & Fagard, R. H. (2000). Modernapproaches to blood pressure measurement. Occupational and EnvironmentalMedicine, 57, 510–520.
Staessen, J. A., Thijs, L., Fagard, R., O’Brien, E. T., Clement, D., de Leeuw, P. W.,et al. (1999). Predicting cardiovascular risk using conventional vs ambulatoryblood pressure in older patients with systolic hypertension. JAMA, 282,539–546.
Stone, A. A., & Shiffman, S. (1994). Ecological momentary assessment (EMA) inbehavioral medicine. Annals of Behavioral Medicine, 16(3), 199–202.
Stone, A. A., & Shiffman, S. (2002). Capturing momentary, self-report data: A pro-posal for reporting guidelines. Annals of Behavioral Medicine, 24(3), 236–243.
Stone, A. A., Shiffman, S., Schwartz, J. E., Broderick, J. E., & Hufford, M. R.(2002). Patient non-compliance with paper diaries. British Medical Journal,324, 1193–1194.
Sturrock, N. D., George, E., Pound, N., Stevenson, J., Peck, G. M., & Sowter, H.(2000). Non-dipping circadian blood pressure and renal impairment are asso-ciated with increased mortality in diabetes mellitus. Diabetic Medicine, 17(5),360–364.
Sutton-Tyrrell, K., Alcorn, H. G., Herzog, H., Kelsey, S. F., & Kuller, L. H. (1995).Morbidity, mortality, and antihypertensive treatment effects by extent ofatherosclerosis in older adults with isolated systolic hypertension. Stroke, 26,1319–1324.
Verdecchia, P., Porcellati, C., Schillaci, G., Borgioni, C., Ciucci, A., Battistelli, M.,et al. (1994). Ambulatory blood pressure. An independent predictor of prog-nosis in essential hypertension. Hypertension, 24(6), 793–801.
Ambulatory Blood Pressure Monitoring 181
08 - Luecken - 45370.qxd 9/12/2007 4:44 PM Page 181