ambulance crashes - ems.gov the purpose of this presentation is to provide an overview of roadway...
TRANSCRIPT

The National Highway Traffic Safety Administration and Ground
Ambulance Crashes
April 2014
Objectives The purpose of this presentation is to provide an
overview of roadway ambulance crashes in the U.S. and show how the National Highway Traffic Safety Administration (NHTSA): • Uses databases to record/analyze Ambulance
Crashes • Investigates Ambulance Crashes • Documents and Reports on Ambulance Crashes
2
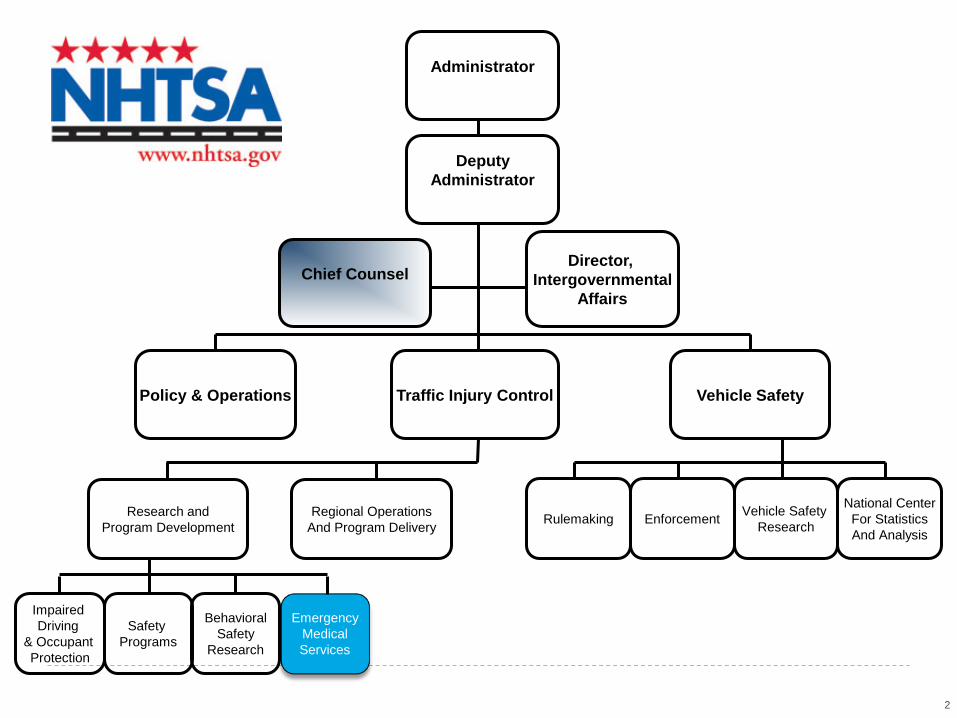
Administrator
Deputy
Administrator
Director, Intergovernmental
Affairs Chief Counsel
Policy & Operations Traffic Injury Control Vehicle Safety
Research and Program Development
Regional Operations And Program Delivery
Vehicle Safety Research Enforcement Rulemaking
National Center For Statistics And Analysis
2
Impaired Driving
& Occupant Protection
Safety Programs
Behavioral Safety
Research
Emergency Medical Services

The Office of Emergency Medical Services (OEMS)
4
Mission Statement
To reduce death and disability by providing leadership and coordination to the EMS community in assessing, planning, developing, and promoting
comprehensive, evidence-based emergency medical services and 9-1-1 systems.
The NHTSA Approach to Ground Ambulance Safety
Collect comprehensive traffic crash data and conduct research
Collaborate with national organizations & Federal
partners to provide EMS leaders with the information they need to improve ground ambulance safety
Foster consensus around strategies to promote safe EMS systems
Support projects of national significance to accelerate improvements in ground ambulance safety
Comprehensive Traffic Crash Data
6
Fatality Analysis Reporting System (FARS) FARS is a nationwide census of fatal traffic crashes within the 50 states and
DC and Puerto Rico*
National Automotive Sampling System General Estimates System (NASS GES) NASS GES data are obtained from a nationally representative probability
sample selected from police-reported crashes Data collected can be used to: Identify highway safety problem areas Provide a basis for regulatory and consumer information initiatives Evaluate cost and benefit analyses of highway safety initiatives Identify behaviors involved in crashes and develop countermeasures to
deter unsafe behaviors *Data from Puerto Rico are not included in this presentation
NHTSA and Ground Ambulance Crashes
Analyzing Fatality Analysis Reporting System (FARS) National Automotive Sampling System General Estimates System
(NASS GES)
Investigating Special Crash Investigations (SCI) Supports an EMS worker nonfatal injury survey conducted by the
National Institute for Occupational Safety and Health using the National Electronic Injury Surveillance System work supplement (NEISS-Work).
Documenting and National Reporting Model Minimum Uniform Crash Criteria (MMUCC) Annual NHTSA Traffic Safety Facts
7
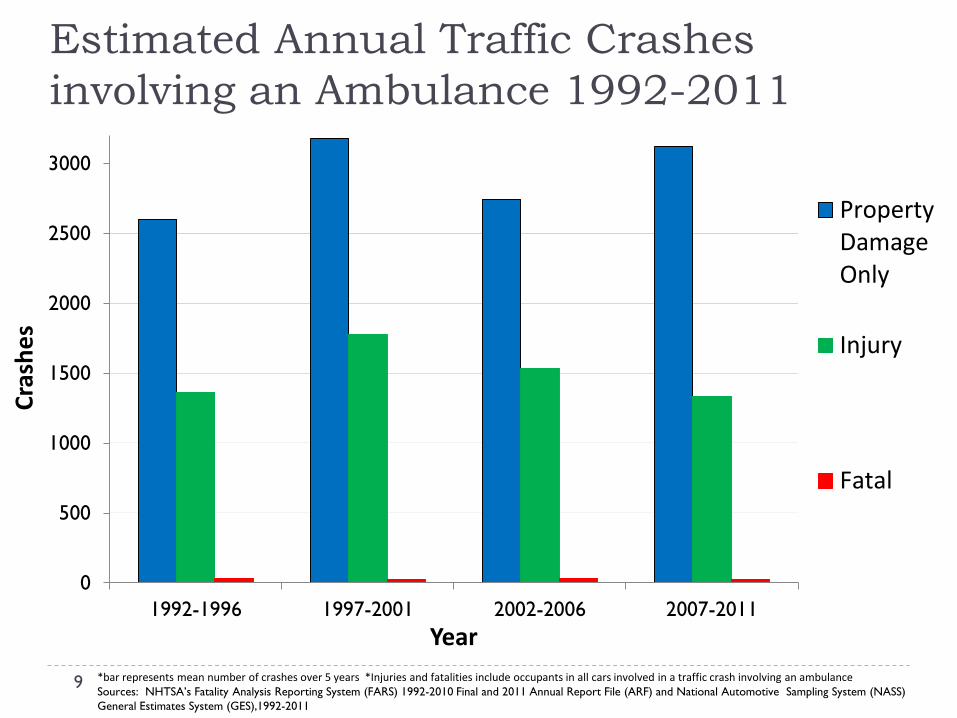
An Overview of Ground Ambulance Crashes in the US Between 1992-2011 (20 years), there were an annual estimated mean of 4,500 motor vehicle traffic crashes involving an ambulance. Of these crashes: 65% resulted in property damage (only) 34% resulted in an injury/injuries <1% resulted in a fatality/fatalities
*Injuries and fatalities include occupants in all cars involved in a traffic crash involving an ambulance
Sources: NHTSA’s Fatality Analysis Reporting System (FARS) 1992-2010 Final and 2011 Annual Report File (ARF) and National Automotive Sampling System (NASS) General Estimates System (GES),1992-2011
8
9
Estimated Annual Traffic Crashes involving an Ambulance 1992-2011
*bar represents mean number of crashes over 5 years *Injuries and fatalities include occupants in all cars involved in a traffic crash involving an ambulance Sources: NHTSA’s Fatality Analysis Reporting System (FARS) 1992-2010 Final and 2011 Annual Report File (ARF) and National Automotive Sampling System (NASS) General Estimates System (GES),1992-2011
0
500
1000
1500
2000
2500
3000
1992-1996 1997-2001 2002-2006 2007-2011
Cras
hes
Year
PropertyDamageOnly
Injury
Fatal
Analyzing Ambulance Crashes
Fatality Analysis Reporting System (FARS)
National Automotive Sampling System General Estimates System (NASS GES)
10

Fatality Analysis Reporting System (FARS)
11
Provides the data required to support the development, implementation, and assessment of highway safety programs. Obtained from many documents including: Police Crash Reports Medical Examiner Reports State highway Department Data Other Records
Fatality Analysis Reporting System (FARS)
12
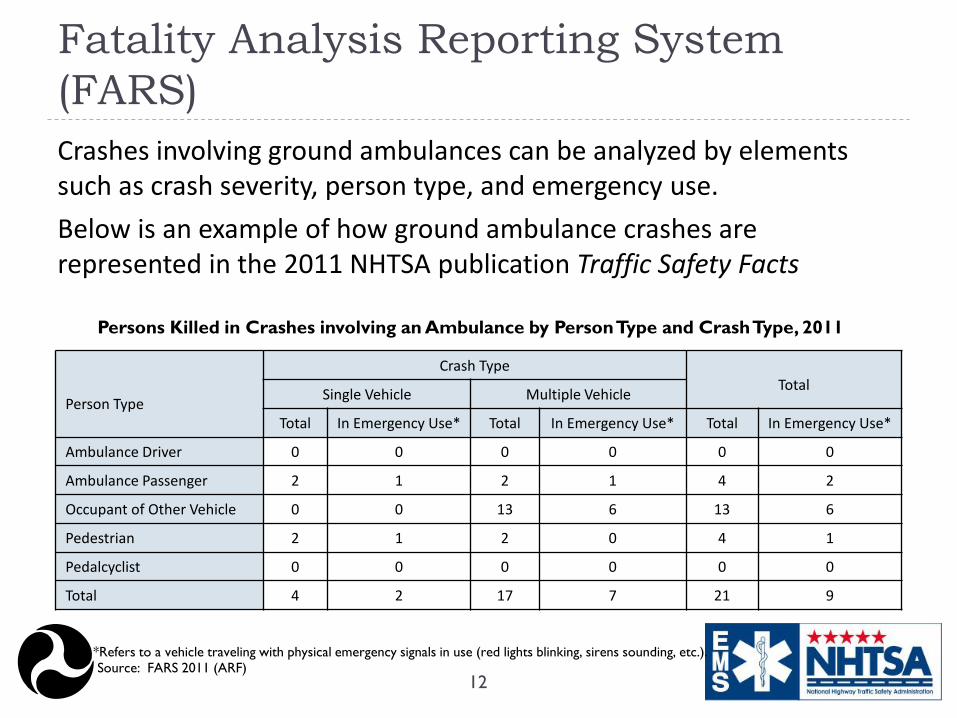
Crashes involving ground ambulances can be analyzed by elements such as crash severity, person type, and emergency use. Below is an example of how ground ambulance crashes are represented in the 2011 NHTSA publication Traffic Safety Facts
Source: FARS 2011 (ARF) *Refers to a vehicle traveling with physical emergency signals in use (red lights blinking, sirens sounding, etc.).
Person Type
Crash Type Total Single Vehicle Multiple Vehicle
Total In Emergency Use* Total In Emergency Use* Total In Emergency Use*
Ambulance Driver 0 0 0 0 0 0
Ambulance Passenger 2 1 2 1 4 2
Occupant of Other Vehicle 0 0 13 6 13 6
Pedestrian 2 1 2 0 4 1
Pedalcyclist 0 0 0 0 0 0
Total 4 2 17 7 21 9
Persons Killed in Crashes involving an Ambulance by Person Type and Crash Type, 2011
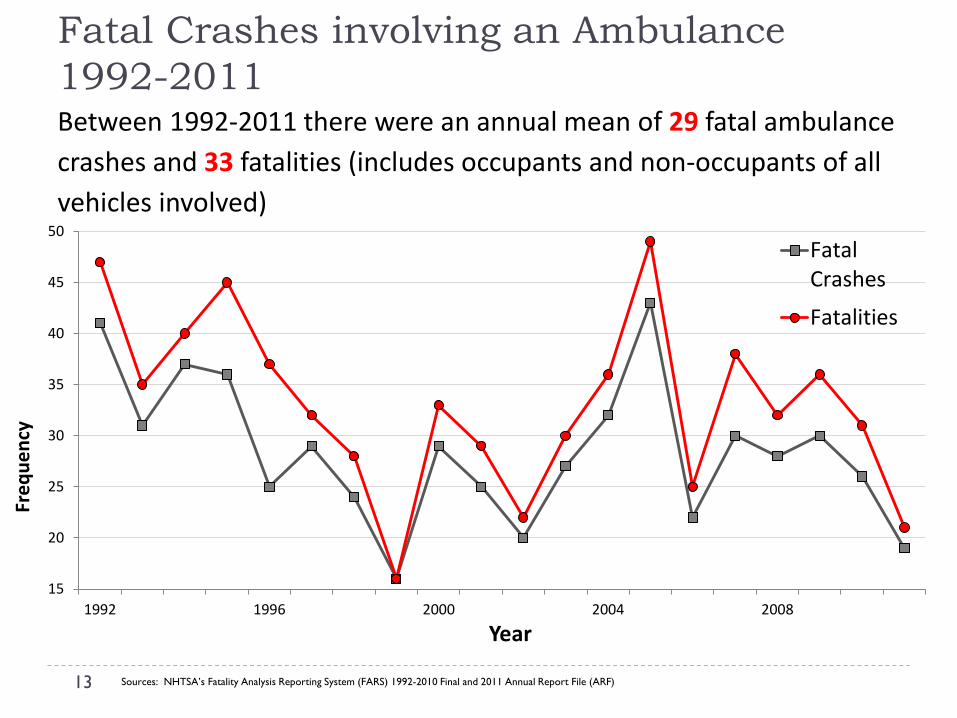
Between 1992-2011 there were an annual mean of 29 fatal ambulance crashes and 33 fatalities (includes occupants and non-occupants of all vehicles involved)
Fatal Crashes involving an Ambulance 1992-2011
Sources: NHTSA’s Fatality Analysis Reporting System (FARS) 1992-2010 Final and 2011 Annual Report File (ARF) 13
15
20
25
30
35
40
45
50
1992 1996 2000 2004 2008
Freq
uenc
y
Year
FatalCrashes
Fatalities

National Automotive Sampling System General Estimates System (NASS GES)
14
Used to estimate how many motor vehicle crashes of different kinds take place, and what happens when they occur. Data are obtained from police reported crashes only. Collected from more than 400 police jurisdictions in 60
sites around the US Randomly sample about 57,000 police crash reports per
year Estimates from NASS GES can be based on fewer than 50
crashes per year.
15
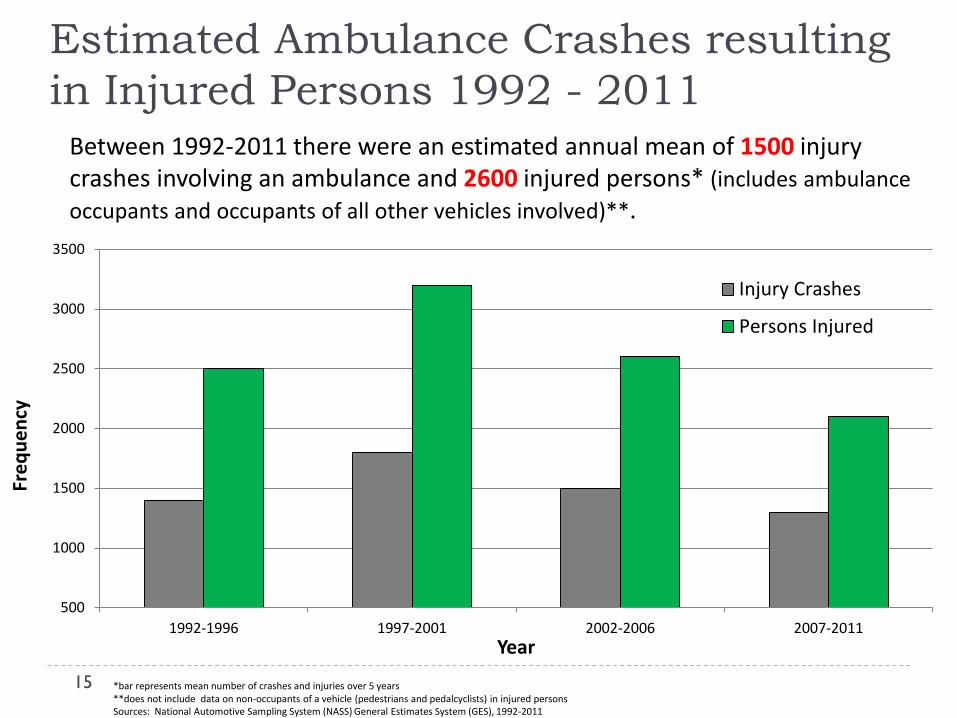
Estimated Ambulance Crashes resulting in Injured Persons 1992 - 2011
Between 1992-2011 there were an estimated annual mean of 1500 injury crashes involving an ambulance and 2600 injured persons* (includes ambulance occupants and occupants of all other vehicles involved)**.
*bar represents mean number of crashes and injuries over 5 years **does not include data on non-occupants of a vehicle (pedestrians and pedalcyclists) in injured persons Sources: National Automotive Sampling System (NASS) General Estimates System (GES), 1992-2011
500
1000
1500
2000
2500
3000
3500
1992-1996 1997-2001 2002-2006 2007-2011
Freq
uenc
y
Year
Injury Crashes
Persons Injured
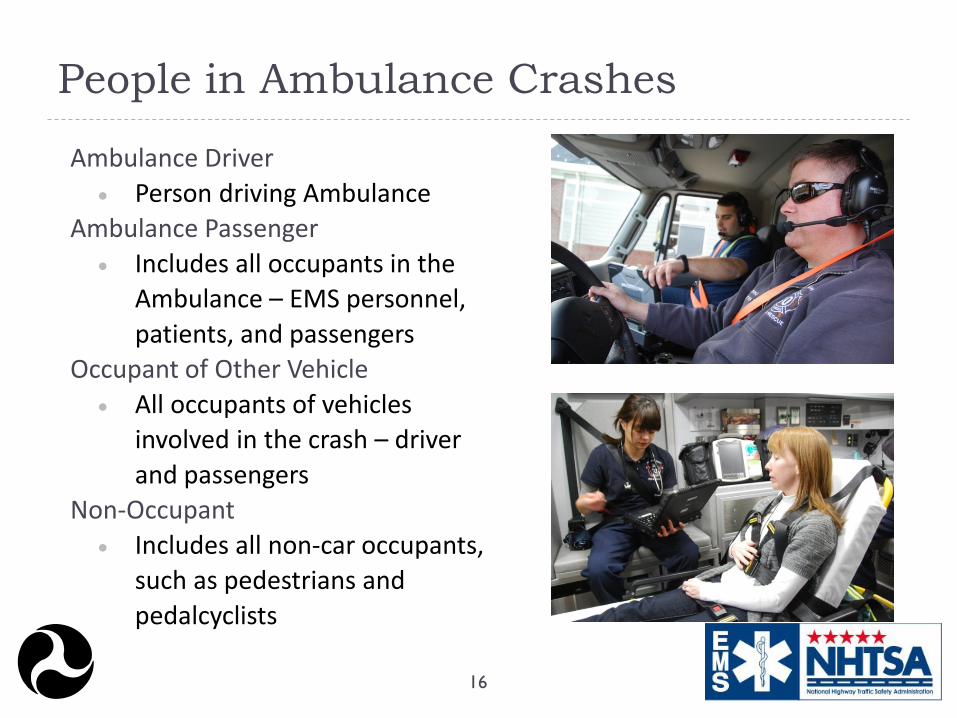
People in Ambulance Crashes
16
Ambulance Driver • Person driving Ambulance
Ambulance Passenger • Includes all occupants in the
Ambulance – EMS personnel, patients, and passengers
Occupant of Other Vehicle • All occupants of vehicles
involved in the crash – driver and passengers
Non-Occupant • Includes all non-car occupants,
such as pedestrians and pedalcyclists

Persons Killed in Crashes Involving an Ambulance: 1992-2011
N = 662
Sources: NHTSA’s Fatality Analysis Reporting System (FARS) 1992-2010 Final and 2011 Annual Report File (ARF)
Ambulance Driver
4%
Ambulance Passenger
21%
Non-Occupant 12%
Occupant of Other Vehicle
63%

Estimated* Injured Persons** in Crashes Involving an Ambulance: 1992-2011
*data represent mean number of crashes and injuries over 5 years **does not include data on non-occupants of a vehicle (pedestrians and pedalcyclists) in injured persons Sources: National Automotive Sampling System (NASS) General Estimates System (GES), 1992-2011
Ambulance Driver 17%
Ambulance Passenger
29%
Occupant of Other Vehicle
54%
N = 10,400
Emergency Use in Crashes involving a Ground Ambulance 1992-2011 Of the annual mean 29 fatal crashes involving an
ambulance:
58% while in emergency use 42% while in non-emergency use
Of the estimated annual mean 1,500 injury crashes*: 59% while in emergency use 34% while in non-emergency use
These percentages do not account for proportion of time ambulances spent in emergency vs. non-emergency mode.
19
*7% unknown if in emergency use/non-emergency use
Sources: NHTSA’s Fatality Analysis Reporting System (FARS) 1992-2010 Final and 2011 Annual Report File (ARF) and National Automotive Sampling System (NASS) General Estimates System (GES),1992-2011

20
Emergency Use in Fatal Ambulance Crashes* 1992 - 2011
Sources: NHTSA’s Fatality Analysis Reporting System (FARS) 1992-2010 Final and 2011 Annual Report File (ARF) and National Automotive Sampling System (NASS) General Estimates System (GES),1992-2011
5
10
15
20
25
1992 1996 2000 2004 2008
Tota
l Cra
shes
Year
Emergency Use
Non-Emergency Use
Limitations of the Analysis
21
Only includes crashes that occur on a road way customarily open to the public
Not all vehicle crashes in the country are reported to the police Police may not record ambulances accurately on crash report Does not distinguish between ambulance types Does not determine when the crash occurred (en route to
scene, en route to hospital) Does not collect data showing the proportion of time an
ambulance is on the road Does not currently differentiate ambulance occupants in the
passenger seat or patient compartment of the ambulance

Analyzing Ambulance Crashes: Summary
22
Between 1992 – 2011 (20 Years) Annual estimated mean of 4,500 crashes involving a ground
ambulance 29 Fatal Crashes* 1,500 Injury Crashes**
33 Fatalities 2600 Injured Persons
• 4% Ambulance Driver • 21% Ambulance Passenger • 63% Occupant of Other Vehicle • 12% Non-Occupant
• 17% Ambulance Driver • 29% Ambulance Passenger • 54% Occupant of Other Vehicle
58% Emergency Use 42% Non-Emergency Use
59% Emergency Use 34% Non-Emergency Use
*all fatal column data are annual means **all injury column data are annual estimated means *** injured persons data does not include non-occupants Sources: NHTSA’s Fatality Analysis Reporting System (FARS) 1992-2010 Final and 2011 Annual Report File (ARF) and National Automotive Sampling System (NASS) General Estimates System (GES),1992-2011

Investigating Ambulance Crashes
Special Crash Investigations (SCI)
EMS Injury and Illness Surveillance-National Electronic Injury Surveillance System Work Component (NEISS-Work)
23
NHTSA Special Crash Investigations (SCI) Program
24
NHTSA Special Crash Investigations (SCI) investigate many roadway ambulance crashes that result in significant or fatal injury to occupants inside the ambulance
The SCI investigates: Pre-crash activities of the persons
involved Contributing factors to serious/fatal
injuries sustained in crash Environmental/Roadway factors Vehicle/Equipment factors

NHTSA Special Crash Investigations (SCI) Program
25
Since 2001 the SCI has investigated 38 ambulance crashes and published 32 reports from 20 different states.
Data provided in the Ambulance SCI final reports is currently being analyzed to identify areas of concern for ambulance safety. Analysis Report due in Spring
2014
Photo from SCI Report CA12034
EMS Injury and Illness Surveillance (NEISS-Work)
NEISS-Work collects data on work-related nonfatal injuries and illnesses treated in emergency departments (ED). Records data on EMS workers treated in a national sample
of hospital EDs for an occupational injury or illness >95% of patients treated and released from emergency
department NEISS-Work characterizes the events associated with job injury/illness to EMS personnel 2011 NEISS-Work data indicates Transportation Incidents were
associated with 9% of non-fatal, ED treated EMS worker injuries/illnesses
26

EMS Injury and Illness Surveillance System (NEISS-Work)
27
EMS Worker Injury and Illness Data is available at: http://www.cdc.gov/niosh/topics/ems/data.html
Accessed 7/23/2013. http://www.cdc.gov/niosh/topics/ems/data.html
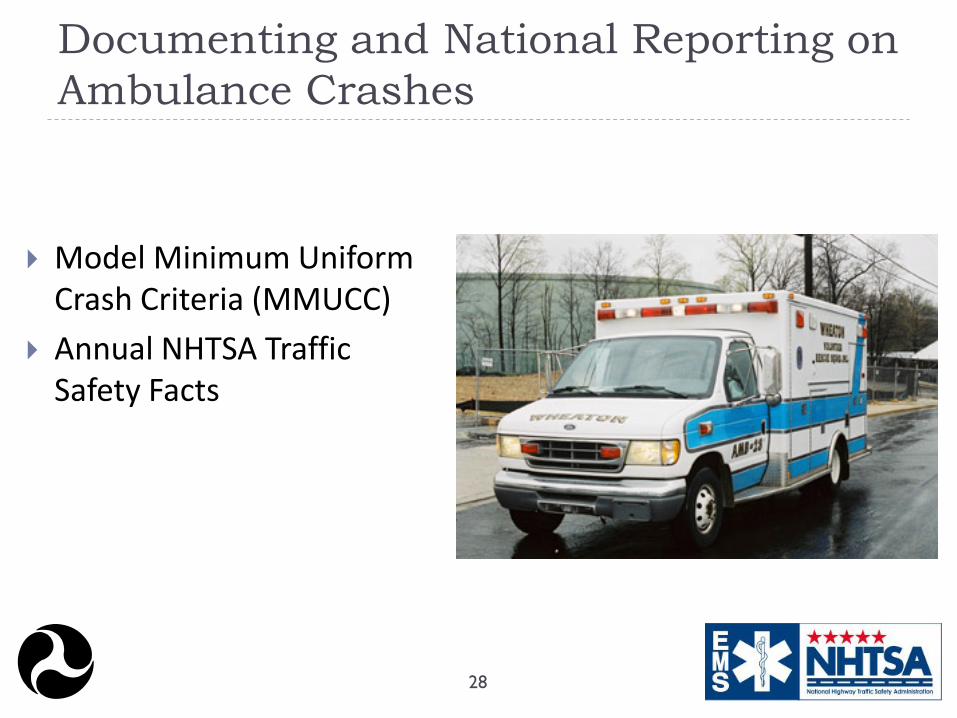
Documenting and National Reporting on Ambulance Crashes
Model Minimum Uniform Crash Criteria (MMUCC)
Annual NHTSA Traffic Safety Facts
28

Model Minimum Uniform Crash Criteria
29
The Model Minimum Uniform Crash Criteria (MMUCC) developed to help states improve and standardize motor vehicle crash data
Guidelines suggest voluntary minimum criteria that police use for crash reports
Data elements expanded in 2012 to include ambulance attributes: Emergency/Non-Emergency Transport Emergency Operation/Warning Equipment
in Use/Not in Use Ambulance Seating/Positioning

30
Governor's Highway Safety Association. Model Minimum Uniform Crash Criteria (MMUCC) Forth Edition (2012). Department of Transportation. 8718-070212 http://www-nrd.nhtsa.dot.gov/Pubs/811631.pdf

Annual NHTSA Traffic Safety Facts
31
Fatal crash data from FARS and nonfatal crash data from NASS GES. Additional information can be found by contacting the National Center for Statistical Analysis. To access the published FARS and GES files: ftp://ftp.nhtsa.dot.gov/GES ftp://ftp.nhtsa.dot.gov/FARS
What is NHTSA doing to Increase Ground Ambulance Safety?
32
Ground Ambulance Safety
Activities
NHTSA’s Ground Ambulance Safety Activities NHTSA Office of Special Crash Investigations
Ongoing investigations of ground ambulance crashes NHTSA Office of Defect Investigations
Track ground ambulance safety issues NHTSA Office of Emergency Medical Services
Collaborating with NIOSH in a 4-year effort to improve existing ground ambulance standards
Implementing the National Strategy for an EMS Culture of Safety Distributing Safely Transporting Children in Ambulances Participating as a non-voting ex-officio committee member on National Fire
Protection Agency (NFPA 1917: Standard for Automotive Ambulances) NHTSA Office of Behavioral Safety Research
Analysis of special crash investigations involving ground ambulances
33
Resources Model Minimum Uniform Crash Criteria (MMUCC) Fourth Edition (2012)
http://www-nrd.nhtsa.dot.gov/Pubs/811631.pdf NHTSA Traffic Safety Fact Sheets http://www-
nrd.nhtsa.dot.gov/cats/listpublications.aspx?Id=A&ShowBy=DocType Bureau of Labor Statistics. 2012, BLS Handbook of Methods - Chapter 9:
Occupational Safety and Health Statistics. http://www.bls.gov/opub/hom/pdf/homch9.pdf
NHTSA Traffic Safety Facts 2011: A compilation of Motor Vehicle Crash Data from the Fatality Analysis Reporting System and the General Estimates System
NHTSA Special Crash Investigations http://www-nass.nhtsa.dot.gov/BIN/logon.exe/airmislogon
National Institute for Occupational Health and Safety EMS Workers Injury and Illness Data (2011 Data) http://www.cdc.gov/niosh/topics/ems/data2011.html
Working Group Best-Practice Recommendations for the Safe Transportation of Children in Emergency Ground Ambulances http://www.ems.gov/BestPracticeRecomendations.htm 34