amazonian indigenous peoples territories and their forests ... · amazonian indigenous peoples...
TRANSCRIPT

Amazonian Indigenous Peoples Territories and Their Forests Related to Climate Change: Analyses and Policy Options
October 2017
Executive Summary .......................................................................................3
About the Authors of this report .....................................................................5
Deforestation Analysis Results ......................................................................6
Brazil ..............................................................................................................9
Colombia ......................................................................................................11
Ecuador .......................................................................................................13
Peru .............................................................................................................15
Biomass and Indigenous Territories Analysis .............................................17
Political Concerns and Relevance ...............................................................20
Methodology ................................................................................................24
Table of contents

3
Executive Summary
This paper reviews two scientific analyses – different, but associated – that
examine the role of Amazonian Indigenous Territories (IT) and Protected
Natural Areas (PNA) in the conservation of forests and the carbon stocks
found in them. One analysis finds that at the Amazonian Basin level from
2000-2015, while forest in Indigenous Territories and Protected Natural
Areas represents 52% of the Amazonian total, only 17% of deforestation
occurred in their boundaries – a percentage significantly lower than the
83% of deforestation coming from the forests of areas outside of their
delimitations. However, at a country level analysis, the findings were not
homogenous. Additionally, an important trend observed at a Basin level was
the increase in rates of deforestation loss in Indigenous Territories without
legal recognition.
The other analysis examined the above ground biomass – i.e. forest carbon
stocks – located in Indigenous Territories and Protected Natural Areas
and existing pressures and threats from various extractive activities and
infrastructure. The analysis uses new forest carbon stock data from 2014
found in a just published journal article1.
It finds that 53% of the Basin’s forest carbon stocks are found in Indigenous
Territories and Protected Natural Areas. Additionally, forest carbon stocks
located in Indigenous Territories which endure pressure and threat,
correspond to 12% of the Basin’s total. This is particularly relevant to
1 A. Baccini1,*, W. Walker1, L. Carvalho2, M. Farina1, D. Sulla-Menashe3, R.
A. ‘Tropical forests are a net carbon source based on aboveground measurements
of gain and loss’ Houghton1, Science, 2017. http://science.sciencemag.org/
content/358/6360/230
4
the Amazonian Basin countries due to commitments in their Nationally
Determined Contributions (NDCs) to the UNFCCC and Paris Agreement to
take action in their forest sectors.
Finally, the paper discusses policy changes that are necessary to ensure
continued lower rates of deforestation in Indigenous Territories and the
protection of forest carbon stocks found in them. It is important to note
that forests are not only valuable to Indigenous Peoples and humanity for
their role in climate change mitigation and providing other environmental
services, but also because of their cultural and socio-economic roles in the
communities who live in them. Recent policy changes and actions in some
Amazonian countries (Colombia) are complimentary to conserving forests in
Indigenous Territories and Protected Natural Areas, while others (Brazil and
Bolivia) are significantly eroding the existing policies used by their inhabitants
to protect them.
Policy makers at the global level, donor countries supporting Amazonian
forest conservation efforts, and Amazonian basin country domestic policy
makers need to heed the science and recommendations in this report
to ensure that Indigenous Peoples and the forests in their territories can
continue to play the important role they do in mitigating climate change.

5
About the Authors of this report
This report was produced by an innovative consortium of Indigenous Peoples
organizations, scientists, and environmental and human rights advocates.
The members of the consortium come from the United States and the
Amazon Basin countries. The report is jointly produced with each member
contributing their specific expertise and a rigorous consultation and writing
process to ensure not only the science is the best, but that the Indigenous
Peoples partners are primary actors in the partnership.
Funding for this report was generously provided by
the Norwegian Government.

6
Deforestation Analysis Results
Significant differences in the percentage of Amazonian gross deforestation
exist between forests located inside Indigenous Territories (IT) and Protected
Natural Areas (PNA) compared to forests located outside of them. Many
recent reports and journal articles2 point towards this conclusion, but this is
the first report to analyze the phenomenon from a regional or biome level
(the Amazon basin countries) and length of time (15 years). Why that this is
the case is a question this report does not answer.
Eighty three percent of all the gross deforestation in that period occurred
outside of Indigenous Territories and Protected Natural Areas leaving only
17% to have occurred inside them. Interestingly, only 48% of the total area of
forests in the Amazon is found outside of the IT and PNA.
Figure 1. Distribution of forests by category in 2000 for the Amazon (RAISG
limit) and deforestation by category in the period 2000-2015.
2 http://www.pnas.org/content/114/16/4123.full
Forest area by 2000
Outside IT and PNA
19%
5%
28%
48%
83%
8%2% 7%
Indigenous territories (IT)
IT/PNA overlap Natural protected areas (PNA)
Deforestation 2000-2015

7
Amazonian deforestation rates external and internal of Indigenous Territories
demonstrated a trend downward from 2000-2015. The total amount of
deforestation found inside Indigenous Territories fell from 9,195 km2 during
the 2000-05 period to 6,586 km2 during the 2010-15 period – a reduction
of 28.4%. However the trend was not homogenous for all countries in the
region. Brazil, Colombia, and Ecuador all had trends that went downward
while French Guyana and Venezuela shared an upward trend.
Figure 2. Deforestation by category in the period 2000-2015 for the Amazon
basin (km2). (RAISG limit).
Outside IT and PNA
120000,0
100000,0
80000,0
60000,0
40000,0
20000,0
Indigenous territories (IT)
Natural protected areas (PNA)
One concerning trend found was that gross deforestation in Indigenous
Territories without legal recognition increased more than 50% from 976
km2 in the 2000-05 period to 1,501 km2 in the 2010-15 period. Lands with
title to them are known to reduce the prevalence of deforestation3. This is
concerning because of the lack of progress titling Indigenous Territories in
the region and more recent backsliding in the key country of Brazil.
3 https://www.cgdev.org/publication/ft/stopping-deforestation-what-works-and-what-doesnt

8
Table 1. Deforestation by category in the period 2000-2015 for the Amazon
basin (RAISG limit).
CategoryForest area 2000 (km2)
Deforestation by period (km2) Total
deforestation 2000-2015
Percent (%) deforestation
of the 2000 forest
2000-2005
2005-2010
2010-2015
Outside IT and PNA
2,340,206 97,519 64,965 35,250 197,734 8.45
Indigenous Territories
1,934,142 9,195 9,109 6,586 24,890 1.29
IT without legal recognition
348,910 976 1,250 1,501 3,727 1.07
Proposed indigenous reserve
40,910 16 32 28 76 0.18
Reserved territory* and Exclusion zone (Zona Intangible)**
30,370 47 35 12 95 0.31
IT legally recognized
1,513,953 8,156 7,792 5,045 20,993 1.39
Protected Natural Areas
1,445,688 7,888 7,086 5,468 20,442 1.41
* In Peru, Territorial Reserves are declared to protect the indigenous peoples in voluntary
isolation and in situation of initial contact in the Peruvian Amazon.
**Zonas Intangibles in the Ecuadorian Amazon are protected areas of exceptional cultural
and biological importance in which no extractive activity can be carried out. One of these
areas is inhabited by indigenous peoples in voluntary isolation.

9
4 Articles about the increasing deforestation in the Brazilian Amazon: http://
www.greenpeace.org/brasil/pt/Blog/colocando-mais-gasolina-na-motosserra/blo
g/58707/?gclid=Cj0KEQjw1JbPBRCr05aKy7HnmJsBEiQA4qPY-R0f7j4y6mWU_
R2MJ5rfX8ADQaqoukWy0zFETstKgyoaAmuP8P8HAQ; https://www.socioambiental.org/
pt-br/noticias-socioambientais/desmatamento-na-amazonia-explode-entre-2015-e-2016
Brazil
In the specific case of Brazil, the trend was very positive for the amount of
deforestation occurring in Indigenous Territories. However, that trend is not
probably holding with the recent upturn in overall deforestation in Brazil and
policy changes made to reduce protections of Indigenous Territories and
facilitate more deforestation by the agriculture sector4.

10
During the time period from 2000-2015, only 11,313 km2 of gross
deforestation occurred in Indigenous Territories, which equaled a loss of
1.2% of their forest cover over the time period. For PNA and the same time
period, there was slightly more at 13,757 km2, which means a loss of 1.7%.
The rate for land outside of Indigenous Territories and Protected Natural
Areas equaled 159,031 km2 and a loss of 11.5% of the forest cover over the
time period. Interestingly in the case of Brazil and similar to what is found
in the region, while 55% of forest cover in 2000 was found in Indigenous
Territories and PNA, only 14% of total deforestation came from those forests.
Thus, 86% - the vast majority – occurred in forests outside of Indigenous
Territories and PNA even though it contains only 45% of the forest cover.
Table 2. Deforestation by category in the period 2000-2015 for the Brazilian
Amazon (RAISG limit).
Category Forest
area 2000 (km2)
Deforestation by period (km2) Total
deforestation 2000-2015
Percent (%) deforestation of the 2000 forest 2000-
2005 2005-2010
2010-2015
Brazilian Amazon total
3,088,505 94,989 58,767 29,627 183,383 5.94
Outside IT and PNA
1,380,355 84,827 50,523 23,681 159,031 11.52
Indigenous Territories legally recognized*
952,984 4,642 4,036 2,635 11,313 1.19
Protected Natural Areas
802,256 5,908 4,420 3,429 13,757 1.71
*Although there are unfinished IT legalization processes, due to the fact that the Federal
Constitution recognizes them independent of the completion of the administrative process,
our analysis considers all Brazilian IT as legally recognized. In addition, RAISG estimates
that there are another 200 IT requests that have not started the legalization process in Brazil.
(Source RAISG, 201: https://www.amazoniasocioambiental.org/wp-content/uploads/2017/04/
cartografia_historica_ANP_TI_06abril.pdf)

11
Colombia
Deforestation in the Colombian Amazon during the 2000-15 period continued
its dynamics in the Andean foothills of the Amazon, due to the expansion
of the agricultural frontier and, in some areas, illicit coca cultivation. The
increase in population due to mining activities in the north and east of the
Amazon, also contributed to the increase in deforestation due to the demand
for wood and agricultural products. In general, deforestation declined in the
forests located in the Indigenous Territories during the period, while external
deforestation doubled in the middle period of 2005-10, but returned to the
original levels in the last period.
In the period 2000-2015, the Indigenous Territories and Protected Natural
Areas of Colombia experienced a percentage loss of their forest cover of
1.37% (0.83% in IT) compared to 7.38% outside their territories and of
the ANP. That means in Colombia that percentage of forest loss was an
astonishing 537% greater outside of Indigenous Territories. Fortunately for
Colombia, almost 75% of Amazonian forests are found in IT and PNA and

12
Category Forest
area 2000 (km2)
Deforestation by period (km2) Total
deforestation 2000-2015
Percent (%) deforestation of the 2000 forest 2000-
2005 2005-2010
2010-2015
Colombian Amazon total
423,994 3,445 6,092 3,360 12,896 3.04
Outside IT and PNA
111,698 1,935 4,281 2,025 8,242 7.38
Indigenous Territories legally recognized
246,735 779 770 491 2,040 0.83
Protected Natural Areas
97,145 802 1,114 765 2,681 2.76
only 34% of Amazonian deforestation occurred in them. That means that the
other 66% of deforestation occurred in forests outside of IT and ANP.
Within the framework of the first peace agreement with a guerrilla group in
Colombia, there is a greater need for land for the demobilized and easier
access to areas previously restricted by the armed conflict, which can
translate into greater pressure to convert the Amazonian forests. With most
of them in IT and PNA, additional monitoring is necessary to ensure that any
early signs of increased deforestation can be addressed promptly.
Table 3. Deforestation by category in the period 2000-2015 for the
Colombian Amazon (RAISG limit).
13
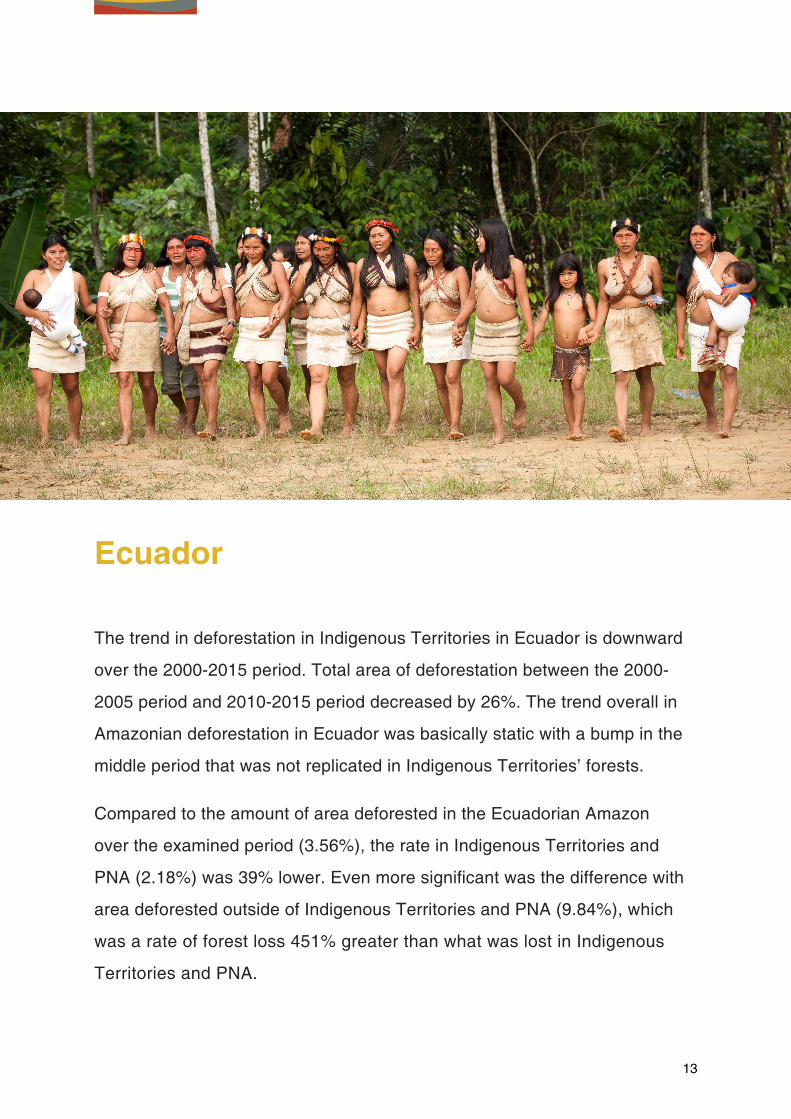
Ecuador
The trend in deforestation in Indigenous Territories in Ecuador is downward
over the 2000-2015 period. Total area of deforestation between the 2000-
2005 period and 2010-2015 period decreased by 26%. The trend overall in
Amazonian deforestation in Ecuador was basically static with a bump in the
middle period that was not replicated in Indigenous Territories’ forests.
Compared to the amount of area deforested in the Ecuadorian Amazon
over the examined period (3.56%), the rate in Indigenous Territories and
PNA (2.18%) was 39% lower. Even more significant was the difference with
area deforested outside of Indigenous Territories and PNA (9.84%), which
was a rate of forest loss 451% greater than what was lost in Indigenous
Territories and PNA.

14
Table 4. Deforestation by category in the period 2000-2015 for the
Ecuadorian Amazon (RAISG limit).
CategoryForest area 2000 (km2)
Deforestation by period (km2) Total
deforestation 2000-2015
Percent (%) deforestation
of the 2000 forest
2000-2005
2005-2010
2010-2015
Ecuadorian Amazon total
87,053 1,054 1,090 957 3,101 3.56
Outside IT and PNA
14,968 476 540 457 1,473 9.84
Indigenous Territories
58,394 482 427 356 1,266 2.17
IT without legal recognition
1,153 5 15 16 37 3.18
IT legally recognized
55,978 457 410 339 1,206 2.15
Exclusion zone (Zona Intangible)
1,262 20 2 1 23 1.85
Protected Natural Areas
29,286 240 206 199 645 2.20

15
Peru
In the case of Peru, the amount of deforestation in Indigenous Territories
trended downward as there was less forest loss in the 2010-2015 period
than the starting period of 2000-2005. During the middle period of 2005-
2010, deforestation rose in the Peruvian Amazon overall and in Indigenous
Territories at the same rate. In the case of IT, the increase occurred in
two categories: Riparian Peasant Communities, which are accounted for
between recognized IT and Proposed Indigenous Reserve (comparable to
unrecognized IT), with an increase of 61% and 100% respectively. Similar to
a trend at the regional level, an increasing rate of deforestation in Indigenous
Territories without recognition is observed.
The rate of forest loss in Indigenous Territories (1.96%) was only 29% less
than the overall rate for the entire Peruvian Amazon (2.76%). It should be
taken into account that in Peru IT represent almost 1,400 communities, many

16
of them with small territories, so the percentage of deforestation relative to its
own area yields higher levels compared to regional data. Still, the difference
in rates between Indigenous Territories and PNA (1.32%) and outside of
Indigenous Territories and PNA (4.41%) was 335% - more than triple.
Table 5. Deforestation by category in the period 2000-2015 for the Peruvian
Amazon (RAISG limit).
CategoryForest area 2000 (km2)
Deforestation by period (km2) Total
deforestation 2000-2015
Percent (%) deforestation
of the 2000 forest
2000-2005
2005-2010
2010-2015
Peruvian Amazon total
705,882 6,919 7,371 5,167 19,458 2.76
Outside IT and PNA
341,665 5,203 5,255 4,595 15,053 4.41
Indigenous Territories
211,127 1,439 1,538 1,153 4,130 1.96
IT without legal recognition
10,917 44 41 62 147 1.35
Proposed indigenous reserve
40,910 16 32 28 76 0.18
Reserved territory
29,108 27 34 11 71 0.25
IT legally recognized
130,192 1,353 1,432 1,051 3,835 2.95
Protected Natural Areas
184,886 264 618 205 1,087 0.59
17
Biomass and Indigenous Territories Analysis
While it is important that Indigenous Territories were barriers to
deforestation, it is concerning that a significant amount of the forest inside
them are under significant pressures and threats. It is considered that there
are pressures if there is already intervention in the territory and threats
if there are projects that will be implemented in the future. Our analysis
examined the above ground biomass – i.e. forest carbon stocks – located in
Indigenous Territories (IT) and Protected Natural Areas (PNA) and existing
pressures and threats from various activities, an analysis similar to that
published in 2014 by the same consortium (Walker et al. 2014)5. In this
case, the analysis uses new forest carbon stock data from 2014 provided by
Baccini et al. (2017)6 to quantify carbon storage within Indigenous Territories
and Protected Natural Areas (RAISG 2016)7. The results reveal that 53%
of the Basin’s forest carbon is stored within Indigenous Territories and
Protected Natural Areas and that 12% of the total Amazon carbon stocks,
which are also inside IT and PNA, are under significant pressure and threat.
5 W. Walker, A. Baccini, S. Schwartzman, S. Ríos, M. Oliveira-Miranda, C. Augusto,
M. Romero Ruiz, C. Soria Arrasco, B. Ricardo, R. Smith, C. Meyer C., J. Jintiach,
E. Vasquez Campos ‘Forest carbon in Amazonia: the unrecognized contribution of
indigenous territories and protected natural areas’. Journal Carbon Management Volume
5, 2014 - Issue 5-6. http://www.tandfonline.com/doi/full/10.1080/17583004.2014.990680
6 A. Baccini1,*, W. Walker1, L. Carvalho2, M. Farina1, D. Sulla-Menashe3, R.
A. ‘Tropical forests are a net carbon source based on aboveground measurements
of gain and loss’ Houghton1, Science, 2017. http://science.sciencemag.org/
content/358/6360/230
7 Data published by RAISG: https://www.amazoniasocioambiental.org/wp-content/
uploads/2017/04/AMAZONIA2016_english_18maio.pdfA

The pressures and threats to these areas consist of mining and fossil fuel
concessions, roads which drive agriculture expansion, and fires recorded
during the period, also, announced large infrastructure projects such as
new roads. While these pressures and threats are not necessarily new,
they are always there and represent significant higher probability of further
deforestation and degradation to be realized.
If that 12% biomass stored in IT and PNA was to be lost, it would equate to
nearly 80 Gigatons of CO2 emissions – more than twice the global emissions
in 2015.
Trying to calculate the risk against the Amazon Basin countries’ Nationally
Determined Contributions is difficult because of the use of different
methodologies to create them. However, one could do a simple comparison
19
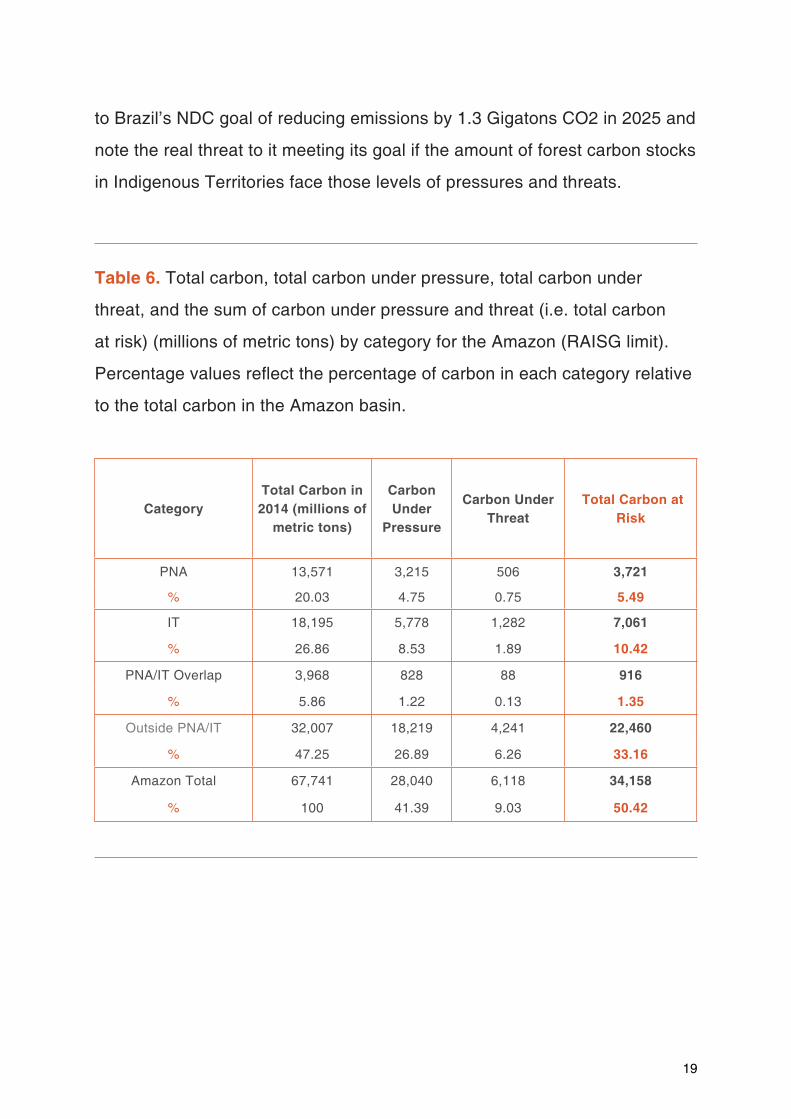
CategoryTotal Carbon in 2014 (millions of
metric tons)
Carbon Under
Pressure
Carbon Under Threat
Total Carbon at Risk
PNA 13,571 3,215 506 3,721
% 20.03 4.75 0.75 5.49
IT 18,195 5,778 1,282 7,061
% 26.86 8.53 1.89 10.42
PNA/IT Overlap 3,968 828 88 916
% 5.86 1.22 0.13 1.35
Outside PNA/IT 32,007 18,219 4,241 22,460
% 47.25 26.89 6.26 33.16
Amazon Total 67,741 28,040 6,118 34,158
% 100 41.39 9.03 50.42
to Brazil’s NDC goal of reducing emissions by 1.3 Gigatons CO2 in 2025 and
note the real threat to it meeting its goal if the amount of forest carbon stocks
in Indigenous Territories face those levels of pressures and threats.
Table 6. Total carbon, total carbon under pressure, total carbon under
threat, and the sum of carbon under pressure and threat (i.e. total carbon
at risk) (millions of metric tons) by category for the Amazon (RAISG limit).
Percentage values reflect the percentage of carbon in each category relative
to the total carbon in the Amazon basin.

20
Political Concerns and Relevance
It is readily apparent from the scientific analysis presented that the
forests located in Indigenous Peoples territories are not only important
mitigating climate change by storing significant amounts of carbon, but
also demonstrate significant lower rates of deforestation. At the same time,
one must also recognize the value of the forests located in Indigenous
Territories for the multiple other environmental services they provide, such
as the regulation of the hydrological cycle and the climate. Their cultural
and livelihood values are even of more importance to Indigenous Peoples.
All of those benefits are lost when deforestation occurs – not only affecting
the Indigenous Peoples, but humanity in general – and existing policy at
multiple levels is not facilitating their conservation and rather, facilitating their
destruction in many places.
One example of a recent positive policy action taken by a country is in
Colombia where it recently approved the formal recognition of indigenous
territories with significant forest assets in the Amazon8. Additionally, the
Peruvian government set an example of including Indigenous Peoples
in forest conservation policy making by including components of their
Indigenous Amazonian REDD+ proposal into its National REDD+ Strategy
document that is to be submitted to the UNFCCC9.
8 Article on the recent expansion of indigenous reserves in Colombia: https://news.
mongabay.com/2017/07/colombia-expands-indigenous-reserves-near-key-deforestation-
hotspot/
9 The National REDD Strategy of Peru: http://www.gruporeddperu.com/
estrategia-nacional/
21
Unfortunately, not all countries are moving in the right direction. In Bolivia,
the government is once again moving to building a road through the Tipnis
reservation without securing the consent of the Indigenous Peoples living
there10. Additionally, the government of Brazil recently made it harder for
Indigenous Peoples with existing claims for their traditional lands to receive
formal recognition to them11.
The Coordinating Body of the Indigenous Organizations of the Amazon Basin
(COICA) and its base organizations that represent the Amazonian regions
in the 9 Amazon basin countries advocate the following policy changes to
ensure their ability to continue conserving the forests in their territories:
1. Titling of unsecured lands:
Recognition of the rights of indigenous peoples and forest communities to
land tenure has widely been proved to be a viable strategy for mitigating
climate change. Nevertheless, progress on the recognition of these rights
worldwide has slowed recently, and in some cases such as Brazil, being
walked back. A renewed focus on these efforts and resources to implement
the titling are necessary.
10 Article on Tipnis: https://www.theguardian.com/environment/2017/aug/15/bolivia-
approves-highway-in-amazon-biodiversity-hotspot-as-big-as-jamaica
11 Article on negative policy changes on indigenous and environmental issues
in Brazil: http://blogs.edf.org/climatetalks/2017/08/21/temers-rollback-of-brazils-
environmental-and-indigenous-protections-threatens-livelihoods-and-worlds-climate-goals/
22
2. Inclusion of Indigenous Peoples in the elaboration and implementation of Nationally Determined Contributions (NDCs):
At COP23, additional guidance to countries on what needs to be included
in their NDCs will be approved. This guidance should not only include a
requirement to discuss how Indigenous Peoples are being included in plans
for implementing NDCs, but also require their active participation in the
elaboration and development of the NDC of each of their countries. Such
guidance for Indigenous Peoples “full and effective participation” would be
consistent with existing UNFCCC guidance in the Cancun Safeguards for
REDD+.
3. Direct Access to climate finance:
Despite significant efforts by indigenous peoples to defend and preserve
their territories, they have yet to receive adequate recognition from climate
financing mechanisms such as the Green Climate Fund. The majority of
resources for forest conservation are passed through governments or civil
society intermediaries, which result in less resources being available to
those actually living in and protecting the forests. Therefore, more balanced
and direct funding for indigenous peoples organizations and communities is
paramount to provide the resources necessary to continue to conserve these
important forests and therefore ensure climate change mitigation.

23
4. Implementation of free, prior, and informed consent:
This principle is fundamental to reaching working operational frameworks
of governance supported by mutual consensus between local and
external actors. Moreover, it is key to ensure that the considerable upfront
investments in climate change initiatives are not lost due to the denial of
consent by indigenous peoples.
5. Recognition of Amazonian Indigenous Peoples’ traditional knowledge as a climate solution:
The platform for traditional knowledge from Indigenous Peoples and Local
Communities needs to be approved at COP23. This platform will facilitate
the collection and use in an appropriate manner the traditional knowledge
of Indigenous Peoples that is of utmost importance when considering the
challenges the world faces to adapt to and mitigate climate change.
24
Methodology
First, a deforestation analysis for the period 2000-2013 was carried out
according to a methodological program developed by the member institutions
of RAISG. This protocol is based on the ImgTools software, created by the
Institute of People and the Environment of the Amazon (IMAZON) , which
allows the processing of Landsat 5, 7 and 8 satellite images. ImgTools is
software written in programming language IDL (Interactive Data Language)
spectral mixture, NDFI (Normalized Difference Fraction Index) and performs
classifications using decision trees. Satellite images, with the lowest
percentage possible of cloud coverage, are acquired through USGS (US
Geological Survey) servers.
The year 2000 was defined as baseline and the years 2005, 2010 and
2013 as cut-off points for the analysis. Since there are not enough images
of the necessary quality for the same year, for 2000, images were taken
between June 1998 and July 2002; for 2005, images between June 2003
and July 2007 were considered, and for 2010, images between June 2008
and September 2011 were used. Finally, for 2013 images were considered
between August 2012 and March 2014.
For the analysis of the period 2013-2015, the methodological protocol
migrated to the Google Earth Engine (GEE) platform, a Google service
that offers a large collection of Landsat satellite images at various levels
of processing. The new protocol required an interface on the GEE
platform for the development of the codes that made it as robust as for the
construction of a large library of algorithms for processing satellite images.
The updated methodological protocol allows to process all the images in a
Deforestation analysis 2000 - 2015

25
Threatened biomass analysis
cloud computing “Google Cloud Computer”, it also allows the use of several
images of a single region to compose a temporal mosaic and reduce areas
with the presence of clouds. The protocol included auxiliary layers such as
elevation, incorporated to facilitate the differentiation of the deforested areas
from the shadows generated by the relief.
For the calculation of deforestation in each period, August 1st was taken
as a cut-off point, so that the annual rates consider forest losses that occur
from August 1st of a year, i.e. 2000, until 31 July of the following year, in
this case would be 2001. Thus, the defined periods go from August 1st
2000 to July 31 2005, from August 1st 2005 to July 31 2010, and August
1st 2010 to July 31 2013.
A 2015 deforestation map was created following the same procedures, and
new deforestation occurred between August 1st 2013 and July 31 2015, was
added to obtain a deforestation total for 2010 – 2015.
The pressures and threats used in the analysis correspond to the collection
of information that RAISG makes with the contribution of institutions in
each country, obtaining information from the most appropriate sources
in each case. The topics considered were roads, fires, mining, gas, and
oil concessions, these being considered as pressures if there is already
intervention in the territory and as threats if they correspond to projects to be
implemented in the future. Given the period of the biomass data used for the
analysis (2003-2014), the used pressure layer was defined up to 2014, while
the threats were updated to 2016. In the case of roads, an area of influence
(buffer) of 10 km was created on each side of the road axis.
26
Images and Pictures: Fundación EcoCiencia, Archivo de la COICA, Nicolás Kingman,
Afuera Producciones, Belo Monte by Juliana Spinola, Juliana Splendore.
The amount of biomass under pressure areas is calculated for all the areas
where at least one of the mentioned pressures is present, obtaining a
unique mask for all the Amazonian area analyzed. The same process was
performed with threat areas, obtaining also a mask and amounts of biomass
for the areas where at least one threat exist.
For the methodology used to calculate the above ground biomass,
please see the recent Baccini et al.: http://science.sciencemag.org/
content/358/6360/230.