alum rock school district - arusd.org · alum rock school district 2015/16 first interim report dr....
TRANSCRIPT
Alum Rock School District 2015/16 First Interim Report
Dr. Hilaria Bauer, Superintendent
Prepared and Presented By: Sandra J. Harrington,
Assistant Superintendent Business Services Accuracy, Transparency, Communication, Collaboration, Customer Service

Budget: What, Who, Why
General Fund: What Changed?
Assumptions: The Why
Multi-Year Projections & Assumptions
Areas of Interest, Opportunity, Recognition and Concern Questions
Agenda
AB1200 County Oversight (1992)
Defines Budget Process
Going Concern
Certification
Public Disclosure
County/State interventions
Why: Fiscal Accountability
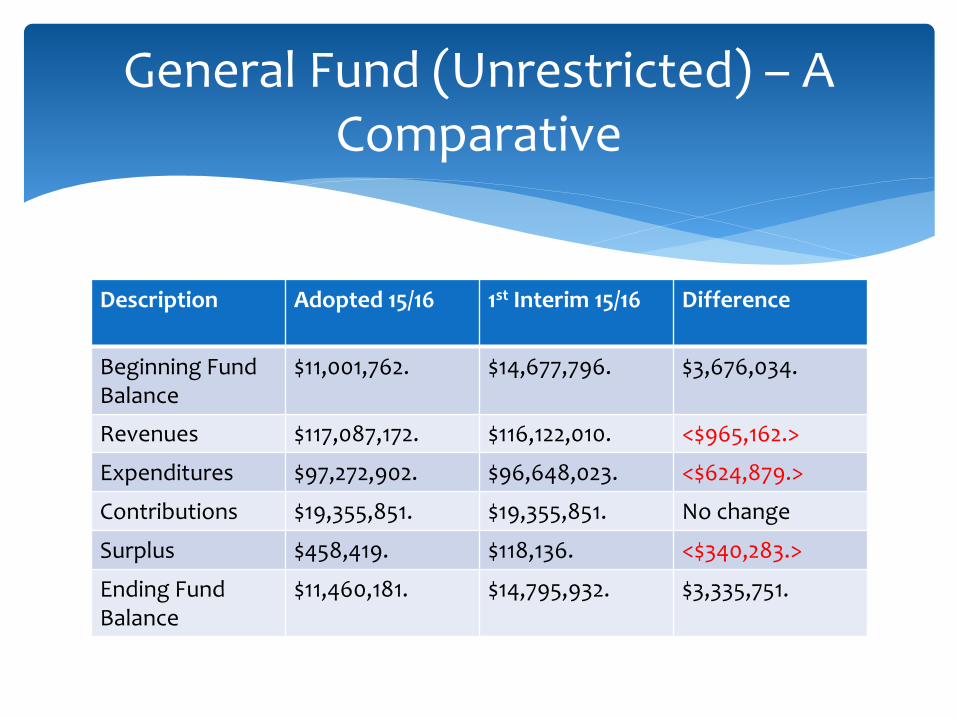
Description Adopted 15/16 1st Interim 15/16
Difference
Beginning Fund Balance
$11,001,762. $14,677,796. $3,676,034.
Revenues $117,087,172. $116,122,010. <$965,162.>
Expenditures $97,272,902. $96,648,023. <$624,879.>
Contributions $19,355,851. $19,355,851. No change
Surplus $458,419. $118,136. <$340,283.>
Ending Fund Balance
$11,460,181. $14,795,932. $3,335,751.
General Fund (Unrestricted) – A
Comparative
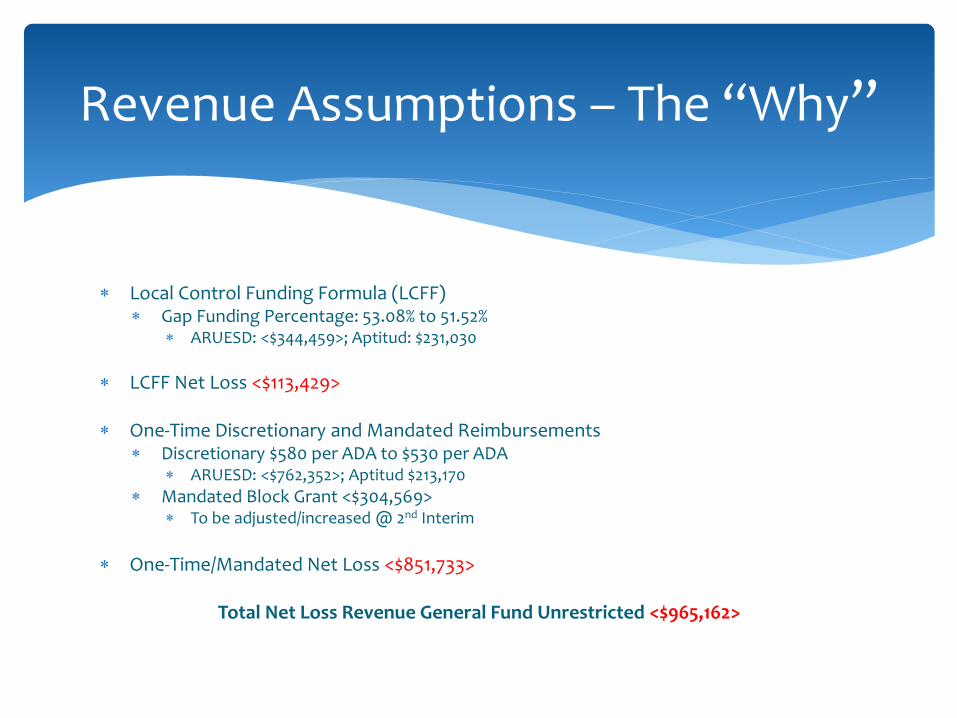
Local Control Funding Formula (LCFF) Gap Funding Percentage: 53.08% to 51.52%
ARUESD: <$344,459>; Aptitud: $231,030
LCFF Net Loss <$113,429>
One-Time Discretionary and Mandated Reimbursements Discretionary $580 per ADA to $530 per ADA
ARUESD: <$762,352>; Aptitud $213,170
Mandated Block Grant <$304,569> To be adjusted/increased @ 2nd Interim
One-Time/Mandated Net Loss <$851,733>
Total Net Loss Revenue General Fund Unrestricted <$965,162>
Revenue Assumptions – The “Why”
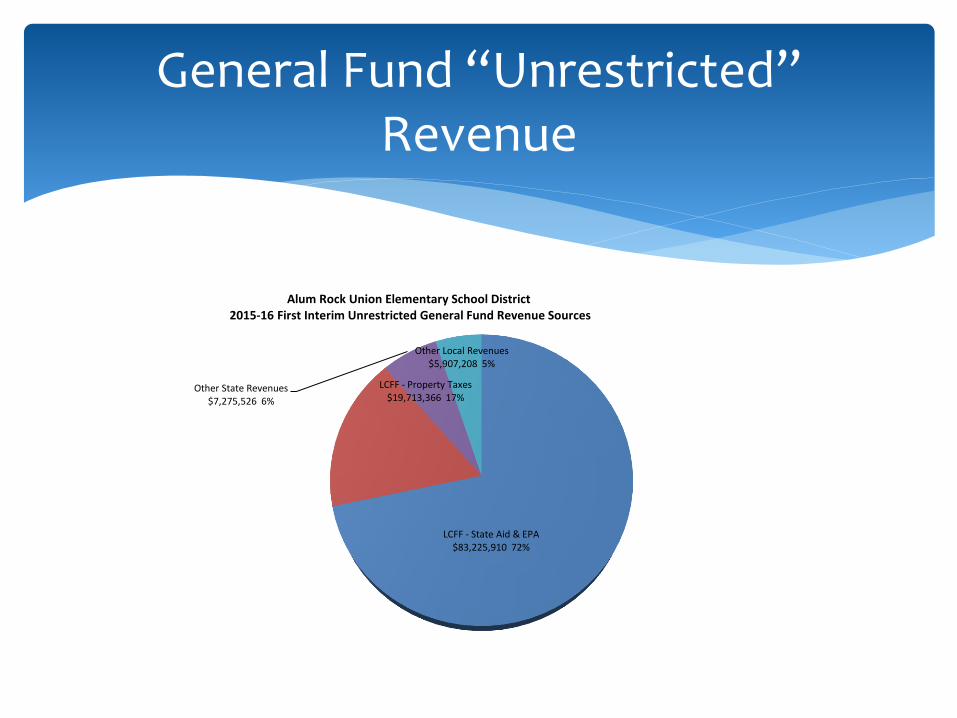
LCFF - State Aid & EPA $83,225,910 72%
LCFF - Property Taxes $19,713,366 17%
Other State Revenues $7,275,526 6%
Other Local Revenues $5,907,208 5%
Alum Rock Union Elementary School District 2015-16 First Interim Unrestricted General Fund Revenue Sources
General Fund “Unrestricted” Revenue
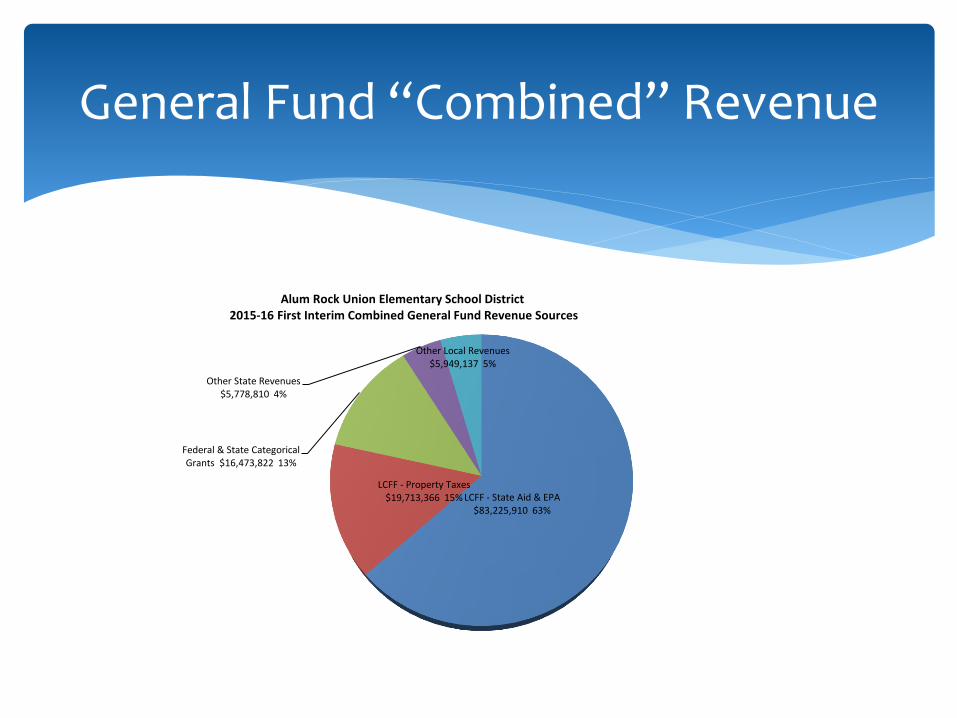
LCFF - State Aid & EPA $83,225,910 63%
LCFF - Property Taxes $19,713,366 15%
Federal & State Categorical Grants $16,473,822 13%
Other State Revenues $5,778,810 4%
Other Local Revenues $5,949,137 5%
Alum Rock Union Elementary School District 2015-16 First Interim Combined General Fund Revenue Sources
General Fund “Combined” Revenue
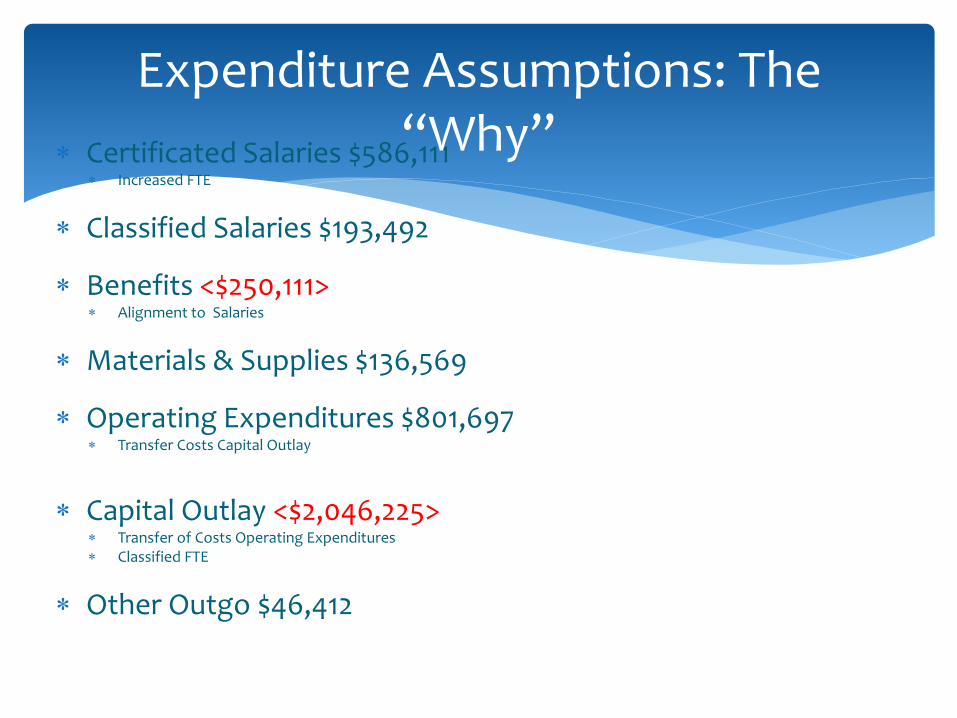
Certificated Salaries $586,111 Increased FTE
Classified Salaries $193,492
Benefits <$250,111> Alignment to Salaries
Materials & Supplies $136,569
Operating Expenditures $801,697 Transfer Costs Capital Outlay
Capital Outlay <$2,046,225>
Transfer of Costs Operating Expenditures Classified FTE
Other Outgo $46,412
Expenditure Assumptions: The “Why”
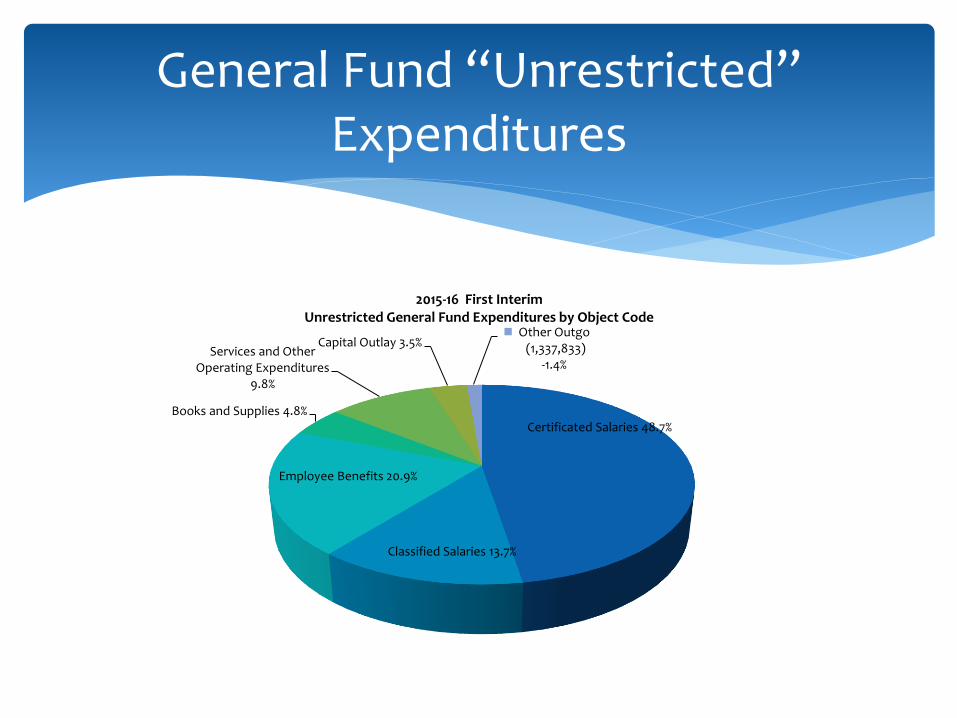
Certificated Salaries 48.7%
Classified Salaries 13.7%
Employee Benefits 20.9%
Books and Supplies 4.8%
Services and Other Operating Expenditures
9.8%
Capital Outlay 3.5% Other Outgo (1,337,833)
-1.4%
2015-16 First Interim Unrestricted General Fund Expenditures by Object Code
General Fund “Unrestricted” Expenditures
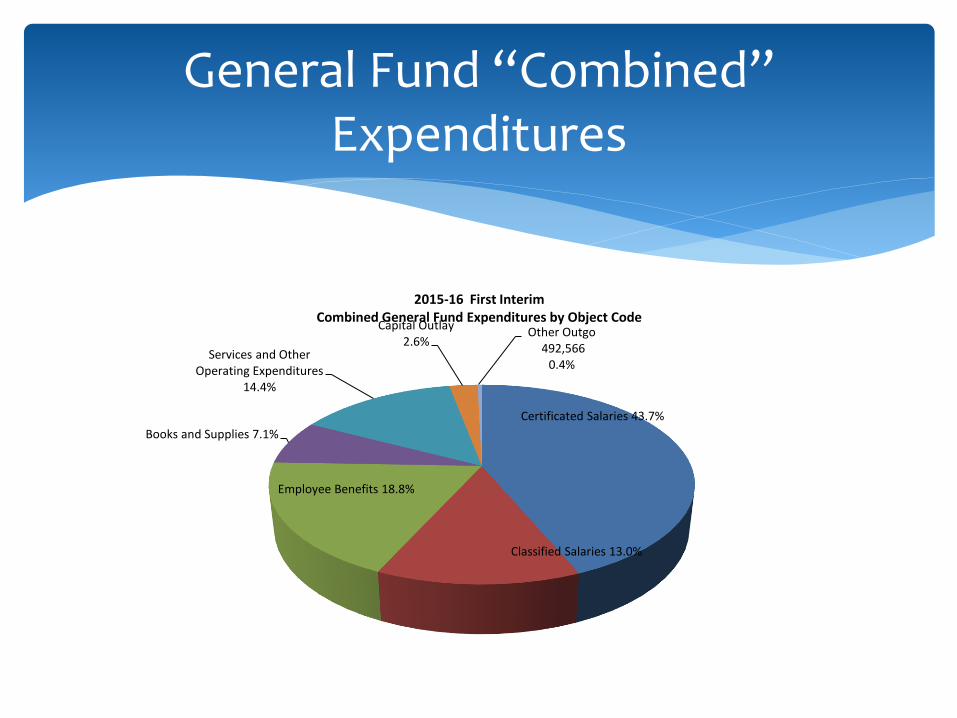
Certificated Salaries 43.7%
Classified Salaries 13.0%
Employee Benefits 18.8%
Books and Supplies 7.1%
Services and Other Operating Expenditures
14.4%
Capital Outlay 2.6%
Other Outgo 492,566
0.4%
2015-16 First Interim Combined General Fund Expenditures by Object Code
General Fund “Combined” Expenditures
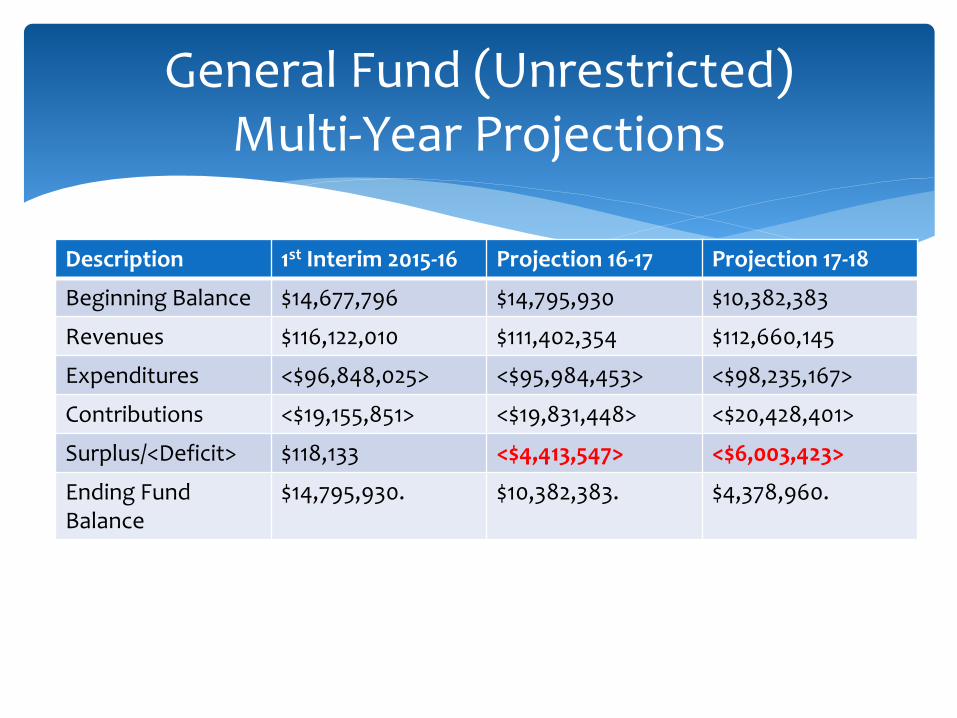
Description 1st Interim 2015-16 Projection 16-17 Projection 17-18
Beginning Balance $14,677,796 $14,795,930 $10,382,383
Revenues $116,122,010 $111,402,354 $112,660,145
Expenditures <$96,848,025> <$95,984,453> <$98,235,167>
Contributions <$19,155,851> <$19,831,448> <$20,428,401>
Surplus/<Deficit> $118,133 <$4,413,547> <$6,003,423>
Ending Fund Balance
$14,795,930. $10,382,383. $4,378,960.
General Fund (Unrestricted) Multi-Year Projections
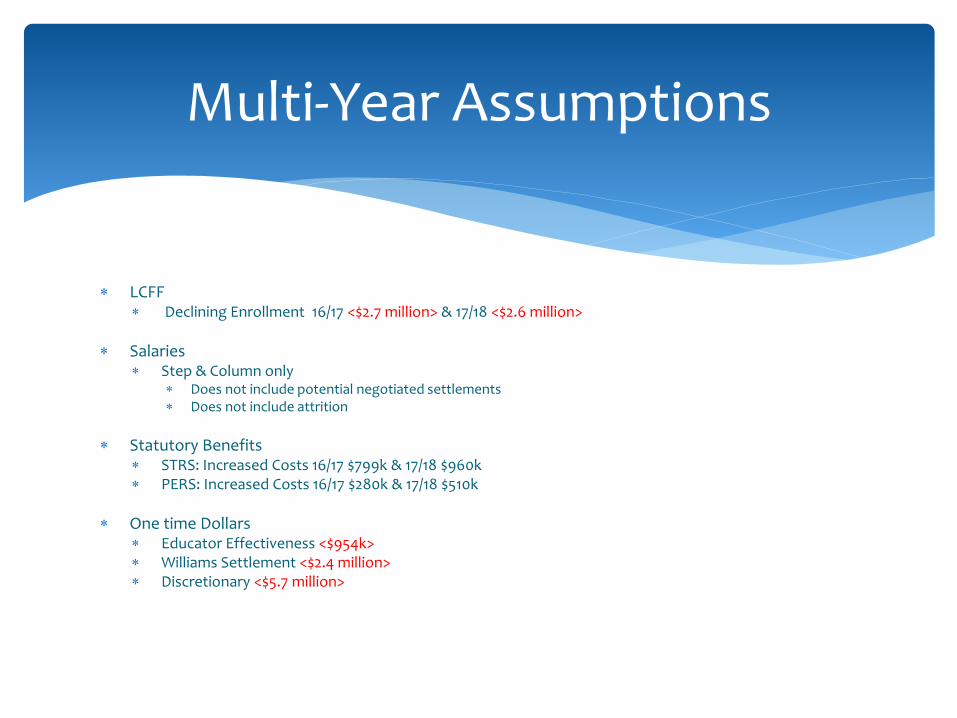
LCFF Declining Enrollment 16/17 <$2.7 million> & 17/18 <$2.6 million>
Salaries Step & Column only
Does not include potential negotiated settlements Does not include attrition
Statutory Benefits STRS: Increased Costs 16/17 $799k & 17/18 $960k PERS: Increased Costs 16/17 $280k & 17/18 $510k
One time Dollars Educator Effectiveness <$954k> Williams Settlement <$2.4 million> Discretionary <$5.7 million>
Multi-Year Assumptions
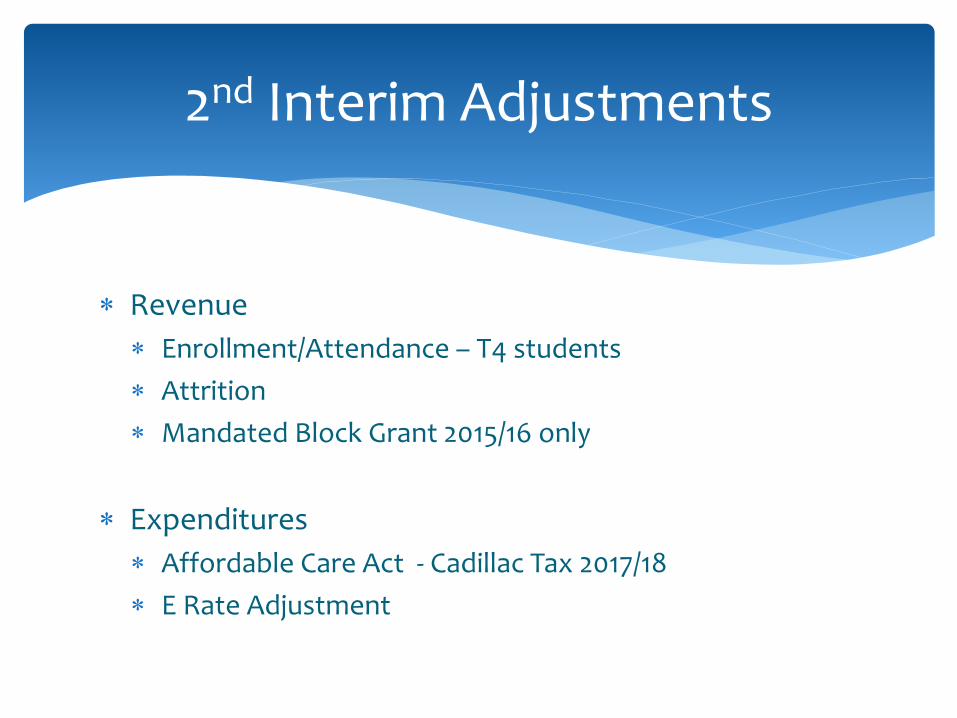
Revenue
Enrollment/Attendance – T4 students
Attrition
Mandated Block Grant 2015/16 only
Expenditures
Affordable Care Act - Cadillac Tax 2017/18
E Rate Adjustment
2nd Interim Adjustments
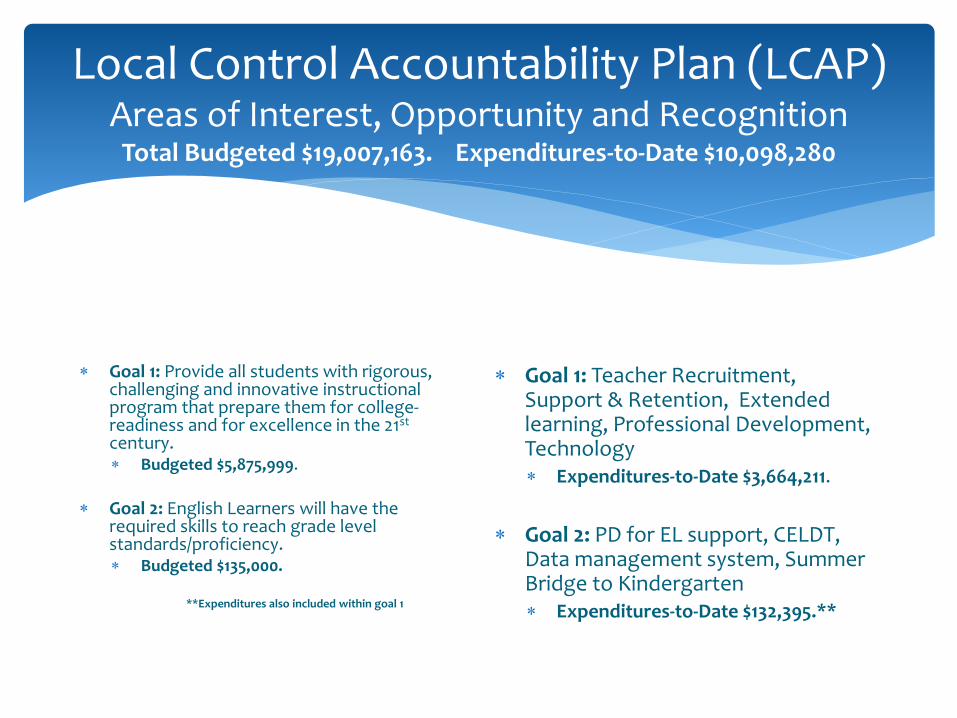
Local Control Accountability Plan (LCAP) Areas of Interest, Opportunity and Recognition
Total Budgeted $19,007,163. Expenditures-to-Date $10,098,280
Goal 1: Provide all students with rigorous, challenging and innovative instructional program that prepare them for college-readiness and for excellence in the 21st century. Budgeted $5,875,999.
Goal 2: English Learners will have the
required skills to reach grade level standards/proficiency. Budgeted $135,000.
**Expenditures also included within goal 1
Goal 1: Teacher Recruitment, Support & Retention, Extended learning, Professional Development, Technology Expenditures-to-Date $3,664,211.
Goal 2: PD for EL support, CELDT, Data management system, Summer Bridge to Kindergarten Expenditures-to-Date $132,395.**
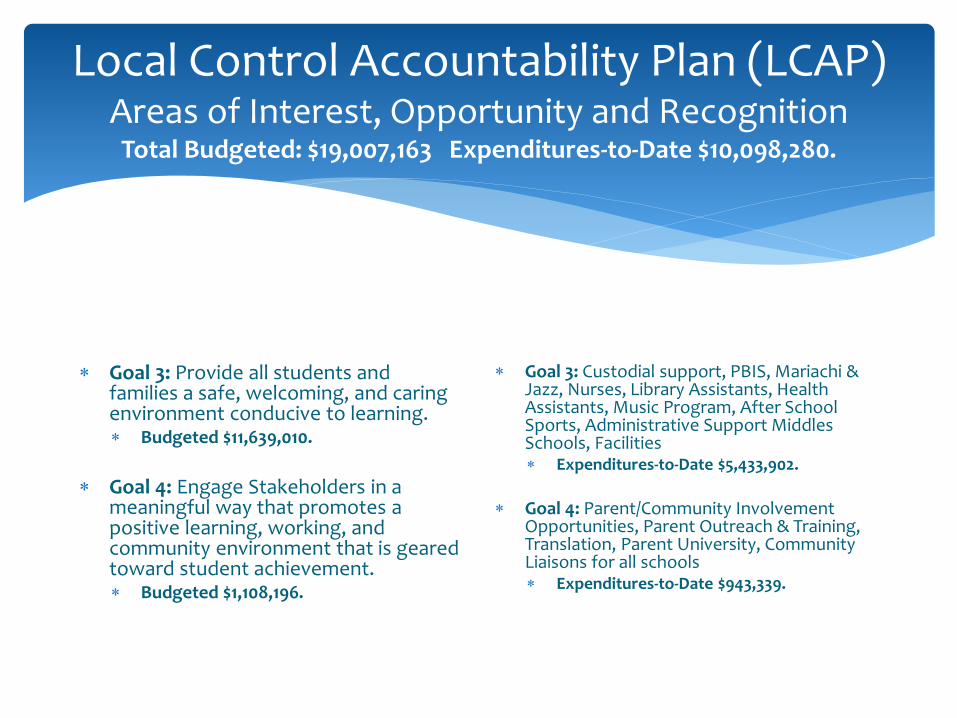
Local Control Accountability Plan (LCAP)
Areas of Interest, Opportunity and Recognition Total Budgeted: $19,007,163 Expenditures-to-Date $10,098,280.
Goal 3: Provide all students and families a safe, welcoming, and caring environment conducive to learning. Budgeted $11,639,010.
Goal 4: Engage Stakeholders in a
meaningful way that promotes a positive learning, working, and community environment that is geared toward student achievement. Budgeted $1,108,196.
Goal 3: Custodial support, PBIS, Mariachi & Jazz, Nurses, Library Assistants, Health Assistants, Music Program, After School Sports, Administrative Support Middles Schools, Facilities Expenditures-to-Date $5,433,902.
Goal 4: Parent/Community Involvement
Opportunities, Parent Outreach & Training, Translation, Parent University, Community Liaisons for all schools Expenditures-to-Date $943,339.
0
2000
4000
6000
8000
10000
12000
14000
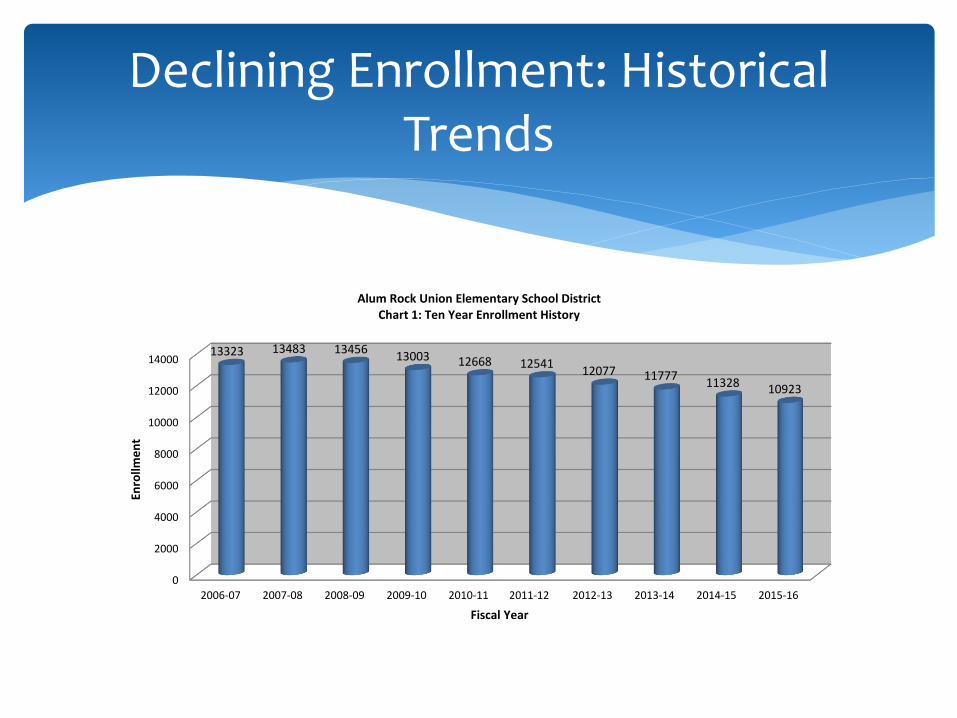
2006-07 2007-08 2008-09 2009-10 2010-11 2011-12 2012-13 2013-14 2014-15 2015-16
13323 13483 13456 13003 12668 12541
12077 11777 11328 10923
Enro
llme
nt
Fiscal Year
Alum Rock Union Elementary School District Chart 1: Ten Year Enrollment History
Declining Enrollment: Historical Trends
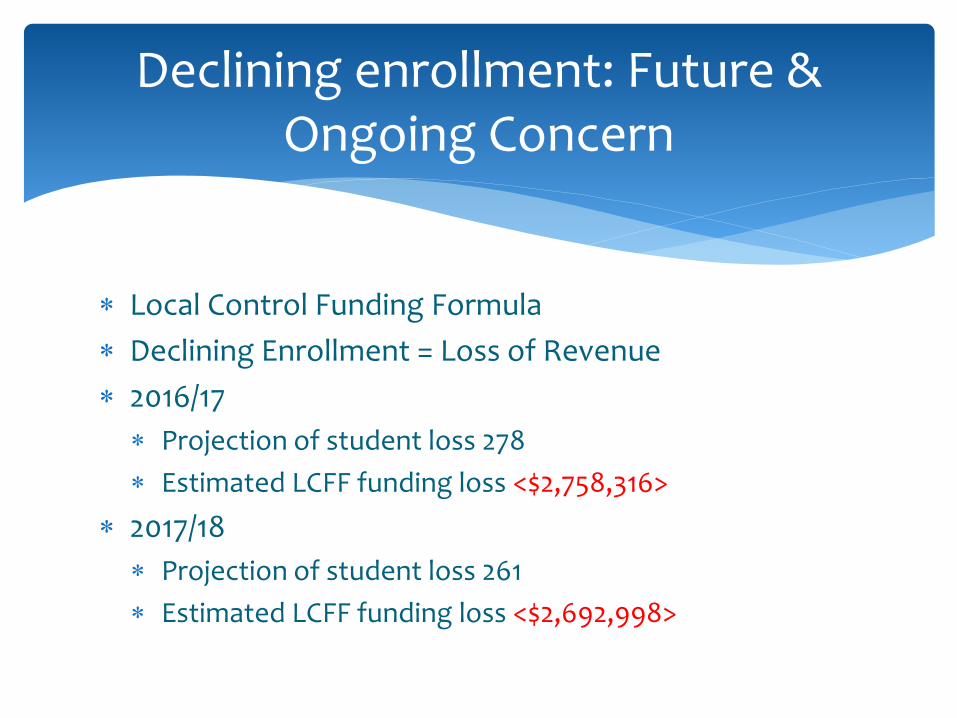
Local Control Funding Formula
Declining Enrollment = Loss of Revenue
2016/17
Projection of student loss 278
Estimated LCFF funding loss <$2,758,316>
2017/18
Projection of student loss 261
Estimated LCFF funding loss <$2,692,998>
Declining enrollment: Future & Ongoing Concern
Declining Enrollment
Affordable Care Act
Professional Development
Technology Replacement
Expansion of TK for 4 y/o
Attrition
Health Plan
Facilities
Areas of Concern/Opportunity
January Governors Budget Projections
Budget Development Begins
Collaborative Effort – Align with LCAP
2nd Interim
LCAP – continued Collaboration
May Revise
Public Hearing
Budget Adoption
Next Steps – Budget Timeline

Questions Thank you