altered hydrology flashiness - oehha · pdf file2 flashiness figure 2. onceptual model of the...
TRANSCRIPT
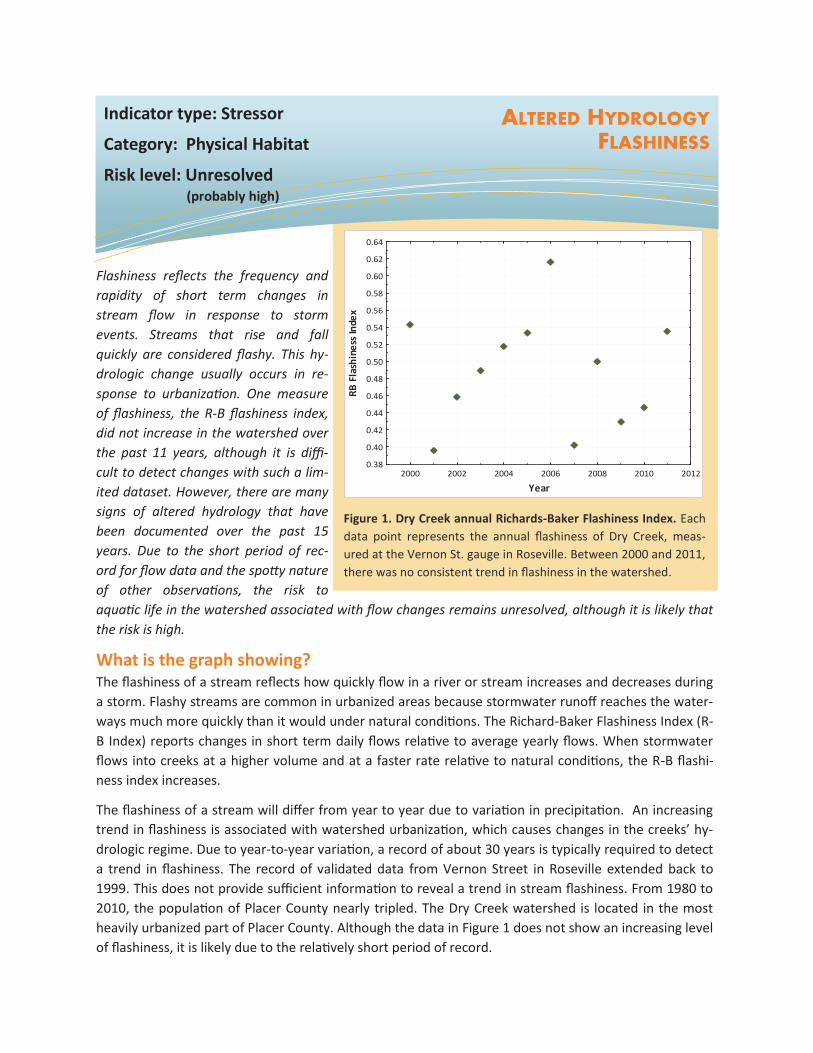
Flashiness reflects the frequency and
rapidity of short term changes in
stream flow in response to storm
events. Streams that rise and fall
quickly are considered flashy. This hy-
drologic change usually occurs in re-
sponse to urbanization. One measure
of flashiness, the R-B flashiness index,
did not increase in the watershed over
the past 11 years, although it is diffi-
cult to detect changes with such a lim-
ited dataset. However, there are many
signs of altered hydrology that have
been documented over the past 15
years. Due to the short period of rec-
ord for flow data and the spotty nature
of other observations, the risk to
aquatic life in the watershed associated with flow changes remains unresolved, although it is likely that
the risk is high.
What is the graph showing? The flashiness of a stream reflects how quickly flow in a river or stream increases and decreases during
a storm. Flashy streams are common in urbanized areas because stormwater runoff reaches the water-
ways much more quickly than it would under natural conditions. The Richard-Baker Flashiness Index (R-
B Index) reports changes in short term daily flows relative to average yearly flows. When stormwater
flows into creeks at a higher volume and at a faster rate relative to natural conditions, the R-B flashi-
ness index increases.
The flashiness of a stream will differ from year to year due to variation in precipitation. An increasing
trend in flashiness is associated with watershed urbanization, which causes changes in the creeks’ hy-
drologic regime. Due to year-to-year variation, a record of about 30 years is typically required to detect
a trend in flashiness. The record of validated data from Vernon Street in Roseville extended back to
1999. This does not provide sufficient information to reveal a trend in stream flashiness. From 1980 to
2010, the population of Placer County nearly tripled. The Dry Creek watershed is located in the most
heavily urbanized part of Placer County. Although the data in Figure 1 does not show an increasing level
of flashiness, it is likely due to the relatively short period of record.
ALTERED HYDROLOGY FLASHINESS
Indicator type: Stressor
Category: Physical Habitat
Risk level: Unresolved (probably high)
Figure 1. Dry Creek annual Richards-Baker Flashiness Index. Each
data point represents the annual flashiness of Dry Creek, meas-
ured at the Vernon St. gauge in Roseville. Between 2000 and 2011,
there was no consistent trend in flashiness in the watershed.
2000 2002 2004 2006 2008 2010 20120.38
0.40
0.42
0.44
0.46
0.48
0.50
0.52
0.54
0.56
0.58
0.60
0.62
0.64
ear
RB Flashiness Index

2
FLASHINESS
Figure 2. Conceptual model of the links between urbanization, altered hydrology, erosion and entrench-ment, and harm to aquatic life. Entrenchment estimates of the long-term effects of erosion within the stream corridor while erosion reflects sloughing of the banking and downcutting into the streambed. Scour refers to the washing away of the stream bed/bank due to the force of water. Scour is known to damage redds or salmon egg nests (Montgomery et. al., 1994).
Reports on the consequences of altered hydrology
Although the R-B flashiness index does not show an increase in flashiness in recent years, numerous
reports and studies in the Dry Creek watershed have identified many of the consequences of flashi-
ness and altered hydrology. Holland (2000) reported that the banks of some of the lower reaches of
Secret Ravine had eroded 5 to 15 feet in the previous few decades, linked to an increase in hard-
scape associated with urbanization. A pilot study evaluating erodibility of six of the ten established
sampling sites in the watershed found the risk of bank and channel erosion was high (Wieland et al.,
2010). Erodibility scores were also correlated with percentage of impervious cover at all spatial
scales examined. Similarly, Swanson (2003) determined that the erosion potential of 85-90% of the
banks in the study area along Dry Creek (south of the Miner’s and Secret Ravines Confluence & Dar-
ling Way) was in the high to extremely high range. In this report, Swanson described “dramatic chan-
nel incision or increases in width, or both”, as signs of altered hydrology and flashiness. A survey of
71 reaches in the Dry Creek and its tributaries documented extensive incision (Bishop, 1997). Finally,
many of the indicators in this report, such as Percentage of Fine Particles in the Streambed and Tur-
bidity, are consequences of altered hydrology and were ranked respectively as high and moderate
stressors of aquatic life. Taken together, these reports and analyses clearly point to high likelihood
that flashiness/hydromodification is the mediator of the changes that impact aquatic life. The linkag-
es between hydrologic changes and aquatic life are illustrated in Figure 2.

3
FLASHINESS
Why are flashiness and hydrologic changes in Dry Creek important? One of the main effects of urbanization on the environment is an alteration in the water cycle. In a
forest or grassland landscapes, only about 10 percent of rain ends up as runoff; the remainder per-
colates into the ground or evaporates. In an urban environment, greater than 50 percent of the rain
ends up as runoff, producing large volumes of stormwater. This change takes on particular im-
portance for the aquatic ecosystem because waterways have evolved over thousands of years to
convey a certain range of flows. When more water enters the waterway at a faster rate, as occurs in
urban areas, it causes erosion of the stream bed and bank, having a detrimental effect on aquatic
habitat and changing the channel shape and size (Cappiella et al. 2012). The erosive force of water
causes incision, forming steep banks, denuded of most vegetation. These changes mobilize large
amounts of fine particulates which are carried away by the water, eventually settling in the
streambed. The combination of alterations in flow and habitat adversely affects communities of
aquatic organisms, especially benthic insects and salmon that prefer rocky stream bottoms. Further,
many stream organisms rely on a stable range of flows to thrive. Sensitive benthic insects cannot
survive while more disturbance-tolerant organisms move into this habitat, reducing biological diver-
sity (DeGasperi et al. 2009; Richards et al., 2010). Salmonids cannot spawn successfully in streambed
dominated by fine particles (Montgomery et. al., 1994), as is the case in many reaches of the Dry
Creek watershed
What factors in Dry Creek influence flashi-
ness and hydrologic changes?
Anthropogenic
Urbanization is the primary cause of flashiness and hy-
drologic alterations. Increased stream flashiness in urban
areas is typically a result of increased hardscape, soil
compaction, and the increased hydraulic efficiency of
traditional stormwater and flood management practices
that are designed to quickly drain urban areas. Managed
flow releases could be another factor that could affect
stream flashiness. Some of the tributaries in the Dry
Creek watershed receive releases from the Yuba and
Bear rivers through a system of canals (Placer County
Water Agency, 2008). These releases occur in the sum-
mer, to provide water for irrigation. Periodically, large
amounts of water are released into the canals to flush
out accumulated sediment. There flushing flows are rela-
tively infrequent and limited in scope so that their impact
is likely minimal.
Natural
Natural conditions may also contribute to stream flashiness. For example, regions with little attenua-
tion of runoff, such as an area with clay soils or rock layers, typically have higher base flashiness than
areas with more permeable soils. The impact on flow typically intensifies during winter months
Figure 3. Pre and post-development stream
hydrograph. Difference in the flow in an
urban stream (red line) and an undeveloped
watershed stream (yellow line) with respect
to flow and time (hydrograph). The urban
hydrograph reflects more drastic spikes and
changes in flow patterns due to increased
flow rates, runoff volumes/events, and long-
term-flow durations as a result of urban
development and more impervious surfaces.
Pre-development
Post-development
Time
Discharge
4
FLASHINESS
Stressor Identification Analysis
The flashiness indicator was not evaluated using the Stressor ID methodology due to the nature of
the available data. This was due, in part, to the fact that data was available only from a single site,
the USGS gauge at Vernon Street in Roseville. However, there was extensive evidence of the conse-
quences of an altered hydrologic regime and increased flashiness. Stream incision and other altera-
tions in stream morphology are widespread but this data comes from one-time studies or surveys
performed in different parts of the watershed. Some of the indicators in this report that ranked as
high-risk stressors were reviewed, using the Stressor ID methods, are also consequences of hydro-
logic changes. The weight of this evidence is significant. Unfortunately, the information in these re-
ports is not readily adaptable to review using two of the three key Stressor ID criteria: spatial co-
occurrence and stressor-response relationship, which are reviewed in detail in the Causal Assess-
ment Methodology chapter. Analysis of the causal pathway in a stepwise fashion, as performed for
other indicators, was not possible with flow data due to the limitations of available data. However, a
conceptual model illustrating the linkages between land use, altered hydrology, changes in aquatic
habitat, and the effects on aquatic life are illustrated in figure 2. These relationships have been
and the beginning of spring, as there is a smaller degree
of absorption and evaporation due to a lack of vegetation
and cooler temperatures (Schoonover et al., 2006).
Eco-region and watershed size also influences the R-B
Index. There is a greater degree of variability in flow (i.e.,
higher flashiness) in smaller watersheds. The slope sur-
rounding creeks can also increase flashiness. Many of the
creeks found in Roseville, Rocklin, and further up in the
foothills are confined within ravines with steep banks,
which make this watershed a more flashy system inde-
pendent of urbanization. Many of the smaller sub-
watersheds such as Secret and Miner’s Ravine tend to be
flashier since the energy of increased flows cannot be
dissipated on large, low floodplains (Baker, 2004) such as
found at lower elevations. Dry Creek is a relatively small
watershed of about 100 square miles. The smaller size,
numerous ravines, and varying gradients and slopes
found within the Dry Creek watershed all contribute to
some degree to the natural flashiness of this watershed.
TECHNICAL CONSIDERATIONS
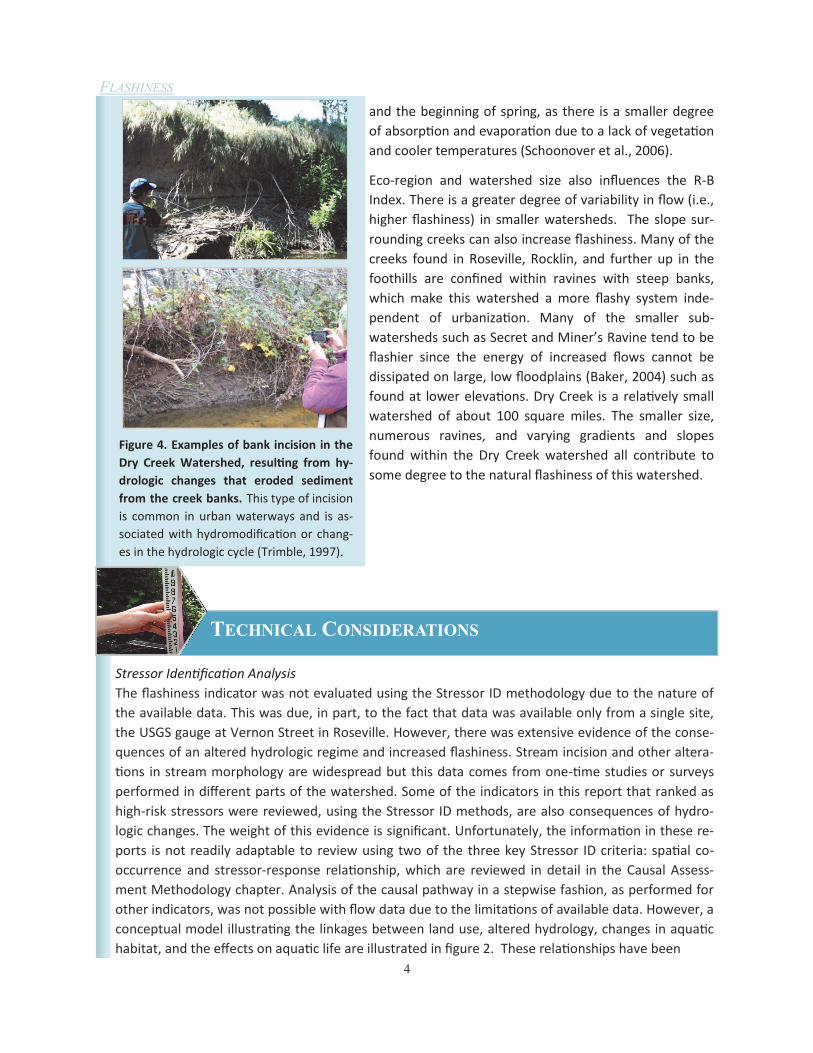
Figure 4. Examples of bank incision in the
Dry Creek Watershed, resulting from hy-
drologic changes that eroded sediment
from the creek banks. This type of incision
is common in urban waterways and is as-
sociated with hydromodification or chang-
es in the hydrologic cycle (Trimble, 1997).

5
FLASHINESS
extensively documented in peer-reviewed literature (See Urbanization Indicator). Taken together,
this information suggests changes in flashiness have likely occurred over a period of decades and its
consequences have been widely reported. Because of these challenges, altered hydrology and flashi-
ness remain an unresolved stressor. The parenthetical “probably high” reflects that the professional
judgment of the scientific team was that with additional information, it is likely that altered hydrolo-
gy could be identified as a high risk stressor.
Calculations of Flashiness
Fifteen-minute flow data from the Vernon Street gauge was obtained from the United States Geo-
logical Survey (USGS). It was converted to average daily flows to calculate the R-B Index. This index
was calculated over each water year from October 1, 1999 to May 1, 2011. The R-B Index uses daily
flow data to determine the frequency and rapidity of changes in flow. The R-B Index is calculated
with Equation 1. This equation measures oscillations in daily flow measured compared to total flow.
The sum of the differences between flows on two consecutive days is divided by the total daily aver-
age flow. Larger fluctuations in flow will result in a higher R-B Index value, while a stable stream flow
will have a value closer to zero. Since the R-B Index is based on differences in flow, it is more sensi-
tive to changing trends than flow rate data (Baker, 2004).
To identify trends in the Dry Creek data, the R-B index values were evaluated using the Mann-
Kendall test, a non-parametric test useful for small datasets. The analysis of the Dry Creek data sug-
gested it was unlikely (a 2-sided probability value of 0.95) that there was an increase in flashiness
over the 11 year period of record.
The lack of a change in flashiness during a period of significant urbanization is likely explained by the
short period of record. DeGasperi et al (2009) applied eight hydrologic metrics to an urbanizing wa-
tershed with 47 years of data. They found significant correlations between the R-B Index and B-IBI
scores as well as between the R-B Index and the total
impervious area. They concluded that the R-B Index is
the most sensitive of the eight metrics they tested to
detect trends in urbanization (Figure 5).
Data in Figure 5 confirms the need for long-term data
record. For example, in the years between 1980 and
1990, it appears that the R-B Index values might have
actually declined. However, over the entire 50+ period
of record, there is a significant positive relationship.
Subsequent communication with hydrologists using
this and other metrics of hydrologic alteration (B.
Bledsoe, Colorado State, March 20, 2013 and C. Kon-
rad, USGS, April 30, 3013, personal communications)
suggest that a minimum of 30 years of flow data is
needed to identify trends. A valid dataset of covering
this length of time was unavailable for Dry Creek.
Figure 5. Time series plot showing the trend in
flashiness for an urbanizing watershed in the
state of Washington (DeGasperi et. al., 2009).
The R-B Index had the highest Mann-Kendall tau
value of any hydrologic metrics evaluated, sug-
gesting it was a sensitive indicator of change.
𝑹 − 𝑩 𝑰𝒏𝒅𝒆𝒙 = 𝒒𝒊 − 𝒒𝒊−𝟏 𝒏𝒊=𝟏
𝒒𝒊𝒏𝒊=𝟏
Year
R-B
Ind
ex

6
FLASHINESS
References
Placer County Water Agency (PCWA) & US Army Corps of Engineers (2008). East Loomis Basin Canal Efficiency
Study. Available through PCWA only.
Baker, D., P. Richards, T. Loftus and J. Kramer (2004). A new flashiness index: Characteristics and applications to
midwestern rivers and streams. J. Am. Water Res. Assoc.40(2): 503-522.
Bishop, D. 1997. An evalution of Dry Creek and its major tributaries in Placer County, California. M.S. Thesis,
CSUS.
Cappiella, K., W.P. Stack, L. Fraley-McNeal, C. Lane, & G. McMahon (2012). Strategies for Managing the Effects
of Urban development on Streams., USGS NAQWA Circular 1378.
DeGasperi, C., H. Berge, K. Whiting, J. Burkey, J. Cassin and R. Fuerstenberg (2009). Linking hydrologic alteration
to biological impairment in urbanizing streams of the Puget lowland, Washington, USA. J. Am. Water Res. As-
soc. 45(2): 512-533.
Montgomery, D.R., J.M. Buffington, N.P. Peterson, D. Schuett-Hames and T.P Quinn. 1994. Stream-bed scour,
egg burial depths and the influence of salmonid spawning on bed surface mobility and embryo survival. Ca. J.
Fish. Aquat. Sci. 53: 1061-1070.
Richards, K.D., Scudder, B.C., Fitzpatrick, F.A., Steuer, J.J., Bell, A.H., Peppler, M.C., Stewart, J.S., and Harris, M.A.,
2010, Effects of urbanization on stream ecosystems along an agriculture-to-urban land-use gradient, Milwaukee
to Green Bay, Wisconsin, 2003–2004: U.S. Geological Survey Scientific Investigations Report 2006–5101.
Schoonover, J., B. Lockaby and B. Helms (2006). "Impacts of Land Cover on Stream Hydrology in the West Geor-
gia Piedmont, USA." J. Environ. Qual. 35: 2123-2131.
Swanson, M. 2000. Reconnaissance hydrology and geomorphology: Study of Secret Ravine, Placer County, Cali-
fornia with emphasis on habitat conditions for fisheries. Report to Dry Creek Conservancy.
Swanson, M. 2003. Dry Creek bank erosion management plan. Report to the City of Roseville.
Trimble, S. 1997. Contributions of stream channel erosion to sediment yield in an urbanizing watershed. Sci-
ence.278: 1442-1444.
Wieland, W.W., L. Allen, K. Pulsipher, E. Berntsen, and B. Washburn, 2010. Estimating Channel Vulnerabiilty to
Erosion using Physical Habitat Data. 6th Biennial Bay-Delta Science Conference. Sacramento, CA.