altered belowground carbon cycling following land-use change to perennial bioenergy crops
TRANSCRIPT
Altered Belowground Carbon CyclingFollowing Land-Use Changeto Perennial Bioenergy Crops
Kristina J. Anderson-Teixeira,1,2,5 Michael D. Masters,1,2
Christopher K. Black,1,2,3 Marcelo Zeri,1,2,6 Mir Zaman Hussain,1
Carl J. Bernacchi,1,2,3,4 and Evan H. DeLucia1,2,3*
1Institute of Genomic Biology, University of Illinois, Urbana, Illinois, USA; 2Energy Bioscience Institute, University of Illinois, Urbana,
Illinois, USA; 3Department of Plant Biology, University of Illinois, Urbana, Illinois, USA; 4Photosynthesis Research Unit, USDepartment of Agriculture, University of Illinois, Urbana, Illinois, USA; 5Present Address: Smithsonian Institution, Center for Tropical
Forest Science-Smithsonian Institution Global Earth Observatory & Smithsonian Conservation Biology Institute, 1500 Remount Rd.,
Front Royal, Virginia 22630, USA; 6Present Address: Centro de Ciencia do Sistema Terrestre, Instituto Nacional de Pesquisas Espaciais,
Cachoeira Paulista, SP, Brazil
ABSTRACT
Belowground carbon (C) dynamics of terrestrial eco-
systemsplayan important role in theglobalCcycleand
thereby in climate regulation. Globally, land-use
change is a major driver of changes in belowground C
storage. The emerging bioenergy industry is likely to
drive widespread land-use changes, including the
replacement of annually tilled croplands with peren-
nial bioenergy crops, and thereby to impact the climate
system through alteration of belowground C dynam-
ics. Mechanistic understanding of how land-use
changes impact belowground C storage requires
elucidation of changes in belowground C flows; how-
ever, altered belowground C dynamics following land-
use change have yet to be thoroughly quantified
through field measurements. Here, we show that
belowground C cycling pathways of establishing
perennial bioenergy crops (0- to 3.5-year-old miscan-
thus, switchgrass, and a native prairie mix) were sub-
stantially altered relative to row crop agriculture
(corn-soy rotation); specifically, there were substantial
increases in belowground C allocation (>400%),
belowground biomass (400–750%), root-associated
respiration (up to 2,500%), moderate reductions in
litter inputs (20–40%), and respiration in root-free soil
(up to 50%). Thismore active root-associated C cycling
of perennial vegetation provides a mechanism for ob-
served net C sequestration by these perennial ecosys-
tems, as well as commonly observed increases in soil C
under perennial bioenergy crops throughout the
world. The more active root-associated belowground C
cycle of perennial vegetation implies a climate benefit
of grassland maintenance or restoration, even if bio-
mass is harvested annually for bioenergy production.
Key words: carbon cycle; root allocation; soil
respiration; belowground carbon allocation; bio-
energy/biofuels; soil organic carbon; perennial
grasses; establishment phase.
INTRODUCTION
Terrestrial ecosystems have a pervasive influence
on the global carbon (C) cycle, and thereby on
climate (Le Quere and others 2009; Pan and others
2011). A substantial and sometimes dominant
Received 11 September 2012; accepted 30 October 2012;
published online 5 January 2013
Author Contributions: K.J.A.T, C.J.B., and E.H.D. conceived of or
designed study, K.J.A.T, M.D.M., M.Z., and M.Z.H. performed research,
K.J.A.T., C.K.B., M.Z., and M.Z.H. analyzed data, all authors contributed
to write the article.
*Corresponding author; e-mail: [email protected]
Ecosystems (2013) 16: 508–520DOI: 10.1007/s10021-012-9628-x
� 2013 Springer Science+Business Media New York
508
proportion of an ecosystem’s greenhouse gas value
may be derived from belowground C storage or
ongoing sequestration (Anderson-Teixeira and
DeLucia 2011), and globally terrestrial ecosystems
contain approximately three times more C below-
ground than aboveground (Schlesinger 2005).
Land use profoundly affects belowground C stor-
age; land clearing and tillage for agriculture reduces
soil organic C (SOC) by on average 20–40%
(Davidson and Ackerman 1993; Murty and others
2002). On a global basis, it is estimated that 40–52
Pg CO2 has been released historically through
plowing of high-C soils such as those of native
prairies (Lal 2004). Conversely, agricultural prac-
tices that enhance belowground C, including con-
servation tillage and cultivation of perennial crops,
have the potential to restore some of this lost C,
with consequent climate benefits (Bernacchi and
others 2005, 2006; Lal 2004; DeLuca and Zabinski
2011).
Changes in SOC following land-use change have
frequently been quantified (Anderson-Teixeira and
others 2009; Davidson and Ackerman 1993; Murty
and others 2002; Guo and Gifford 2002), and a
number of mechanisms contributing to these
changes have been identified. Important mecha-
nisms include altered belowground C allocation
to roots (Fornara and Tilman 2008), changes in
the depth profile of C inputs to the soil system
(Matamala 2008; Frank and others 2004), changes
in the quantity or quality of litter inputs (Blanco-
Canqui 2010), and altered rates of organic matter
breakdown by microbial decomposers—driven, for
example, by physical disturbance of soil through
tillage (Grandy and Robertson 2007; Zenone and
others 2011). Our understanding of the response of
belowground C dynamics to land-use change
remains limited; however, in that the complete
suite of altered belowground C flows following
land-use change has yet to be thoroughly quanti-
fied through field measurements. Here, we quan-
tify belowground C inputs and outputs over a 3½
year period following land-use change from row
crop agriculture to perennial bioenergy crops.
Land-use changes associated with the emerging
bioenergy industry are likely to have substantial
impacts on the global C cycle (Fargione and others
2010; Melillo and others 2009; Searchinger and
others 2008). In the US, for example, the Energy
Independence and Security Act of 2007 (US Senate
2007) mandates production of 21 billion gallons of
ethanol from cellulosic sources by 2022—a target
that would imply widespread land-use change and
consequent alteration of biogeochemical dynamics
(Davis and others 2011; Robertson and others
2011). Perennial grasses hold promise as second-
generation bioenergy crops that could provide lig-
no-cellulosic material for ethanol while increasing
belowground C storage, sequestering C in extensive
root structures (McLaughlin and Kszos 2005;
Fornara and Tilman 2008; Monti and Zatta 2009;
Dohleman and others 2012) and accumulating
SOC at rates averaging 40–100 g C m-2 y-1
(Anderson-Teixeira and others 2009). Eddy-
covariance measurements of ecosystem–atmo-
sphere CO2 exchange over perennial agroecosys-
tems in Illinois have demonstrated that they act as
net C sinks (Zeri and others 2011). However, little
is known about the dynamics of belowground C
cycling in these ecosystems. Precise measurements
of belowground pools and fluxes are critical both to
understand the mechanisms behind C sequestra-
tion and to predict potential C cycle impacts of al-
tered management practices or climate change.
Here, we quantify multiple components of the
belowground C cycle in three potential perennial
bioenergy crop agroecosystems—switchgrass (Pan-
icum virgatum L.), miscanthus (Miscanthus x gigan-
teus), and a native prairie mix—as well as a row
crop control [corn–corn–soy (CCS) rotation]. We
test the hypothesis that, relative to row crops
agriculture, perennial agroecosystems have en-
hanced root-associated C cycling and greater po-
tential for long-term C sequestration. Specifically,
we predict that the perennials will allocate more C
to roots and rhizomes, resulting in greater below-
ground biomass and higher root-associated respi-
ration. However, offsetting this, we expect that
reduced litter inputs and cessation of tillage will
reduce heterotrophic respiration in the bulk soil. In
terms of the net belowground C balance, we predict
that—consistent with previous studies (Anderson-
Teixeira and others 2009; Zeri and others
2011)—perennial crop establishment will result in
net C sequestration.
METHODS
Study Site
The study was conducted at the University of Illi-
nois Energy Farm in Urbana, Illinois (40�3¢46¢¢N,
88�11¢46¢¢W, �220 m above sea level). Climate is
highly seasonal, with monthly average air tem-
peratures averaging below 0�C from December to
February and above 20�C from June–August. Mean
annual temperature is 11.1�C and mean annual
precipitation is 1,042 mm (Illinois State Water
Survey historic climate data, averaged from 1979 to
2009). Topography is minimal. The soil, typical of
Land-Use Change and Belowground Carbon 509
the region, is a deep and fertile Flanagan (fine,
montmorillonitic, mesic aquic Argiudoll) with
some low lying blocks of Drummer (typic Hap-
laquoll). Previously, the land was in continuous
cultivation of annual row crops for over 100 years.
Experimental Design
The experiment was a randomized block design
with five replicates of each crop type (miscanthus,
switchgrass, prairie, and a CCS rotation). Replicates
were arrayed in blocks to accommodate variation
in soil fertility and drainage. Four blocks contained
0.7-ha plots for each vegetation type (henceforth,
small plots). The fifth block consisted of 3.8 ha plots
(henceforth, large plots), which are larger to pro-
vide adequate fetch for eddy-covariance measure-
ments of surface atmosphere exchange made there
(Zeri and others 2011).
In spring 2008, the plots were planted with maize
(May 6, 2008), miscanthus (June 2–16, 2008),
switchgrass (May 28, 2008) and a mix of 28 native
prairie species (May 29, 2008; see Zeri and others
2011 for species list). Switchgrass and prairie crops
were sown with oats (Avena sativa L.) as a cover crop.
Because of poor establishment, additional miscan-
thus rhizomes were planted in small pots in 2009 and
in the large plot in 2010. Corn (maize) and soy were
rotated in a CCS pattern, with corn in 2008, 2009,
and 2011, and soy in 2010. Crops were planted and
managed according to standard agricultural practices
for the region (maize, soy) or best-known manage-
ment practices (perennials), as described in detail in
Zeri and others (2011). Nitrogen fertilizer was
applied to corn (168, 202, and 180 kg N ha-1 in
2008, 2009, and 2011, respectively) and switchgrass
(56 kg N ha-1 in 2010 and 2011), whereas soy,
miscanthus, and prairie were not fertilized because
of known or suspected nitrogen fixing abilities of
these crops (Davis and others 2010; Tilman and
others 2006). Corn and soy crops were harvested and
chisel-tilled in October or early November and all
residue was left on the field. Perennial crops were
harvested in the winter following the 2009, 2010,
and 2011 growing seasons; harvests occurred in
March 2010 (all perennials), November 2010
(switchgrass and prairie)/March 2011 (miscanthus),
and November 2011 (prairie)/December 2011
(switchgrass)/January 2012 (miscanthus). Vegeta-
tion was cut approximately 10 cm above the ground
and then baled using commercial disk-cutting
mowers and balers (Case New Holland; Burr Ridge,
Illinois, USA).
Aboveground Biomass and Litter
Aboveground biomass and litter stocks were mea-
sured periodically (monthly throughout the grow-
ing season, and before and after each harvest) at
randomly located positions within each plot (n = 2
for small plots, 4 for large plots). Quadrats were
0.45 9 0.45 m for switchgrass and prairie and
0.75 9 0.75 m for maize and miscanthus (to ac-
count for planting row separation). All vegetation
(live or dead) was clipped near ground level, and all
visible litter was collected. Samples were dried at
60�C for at least 48 h and weighed.
Subsamples were analyzed to determine C con-
tent. Dried plant material was ground to pass a 425-
lm mesh (Wiley mill; Thomas Scientific, Swedes-
boro, New Jersey, USA) and further ground into a
powder with a ball mill (GenoGrinder 2010; BT&C,
Lebanon, New Jersey, USA). C concentrations were
measured with a flash combustion chromatographic
separation elemental analyzer (Costech 4010
CHNSO Analyzer, Costech Analytical Technologies
Inc. Valencia, California, USA). The instrument was
calibrated with acetanilide obtained from Costech
Analytical Technologies, Inc. Average C content
(averaged by crop type) was multiplied by dry bio-
mass to convert units from dry biomass to C.
Belowground Biomass
Root and rhizome biomass was measured during
the growing season from 2009 to 2011. Late in the
2008 growing season and five times each
throughout the 2009 and 2010 growing seasons,
sets of three 5-cm cores were taken using an AMS
split core sampler at randomly located positions
within each plot (n = 2 for small plots, 4 for large
plots; same locations as biomass sampling). Cores
were taken to a depth of 30 cm, split into two
increments (0–10 and 10–30 cm), and the three
replicates from each location combined by depth
increment. In 2011, sampling frequency was re-
duced to once near peak belowground biomass (25
July–5 August; time of peak biomass estimated
based on previous years) to allow doubled sampling
intensity (4 sampling locations in small plots, 8 in
large plots) and paired measurements to greater
than 1 m depth. Deep root samples (>100 cm)
were taken using a Giddings probe (3.8 cm diam-
eter). At each sampling location (n = 4 for small
plots, 8 for large plots), three replicate cores were
extracted, divided by depth increment (0–10,
10–30, 30–50, 50–100, and 100+ cm), and repli-
cates combined by depth increment. Samples were
510 K. J. Anderson-Teixeira and others
immediately transferred to cold storage (4�C) until
processing. Roots and rhizomes were elutriated
from the soil with root washing devices as in
Roberts and others (1993). Roots and rhizomes
were oven dried at 60�C for at least 48 h and
weighed. Subsamples were analyzed and C content
was calculated as described above.
Litterfall
In each plot, four 0.6 9 0.6-m quadrats were
placed in semi-permanent positions (moved at each
harvest), and all new litter was collected periodi-
cally. Sampling frequency varied to account for
seasonal differences in litterfall and decomposition
rates; sampling was most intensive (up to once per
week) during summer and fall and less intensive
during winter and spring. Litterfall was also col-
lected following each harvest. Samples were dried,
weighed, and subsamples were analyzed for C
content (described above).
Cumulative litter inputs were calculated for each
year, and litterfall during any time gap between the
last litterfall collection and harvest was estimated
by comparison with subsequent changes in
aboveground biomass and litter stocks. Cumulative
annual litterfall inputs were calculated for each
growing season-harvest cycle (April–March).
Soil Respiration
Soil respiration (Rsoil) was quantified using both
survey and automated measurements. Survey
measurements characterized spatial variation (po-
tential block differences) and separated root and
rhizosphere respiration (Rroot+) from root-free soil
respiration (Rrfs), whereas automated measure-
ments characterized temporal variation.
In all blocks, survey measurements were used to
characterize both Rsoil and Rrfs. For Rsoil, 20 cm
diameter PCV collars (height 11.4 cm) were in-
serted to a depth of approximately 5 cm at random
locations within each plot (n = 4 in small plots, 12
in large plots). At four paired locations in each plot,
root exclosure collars (for Rrfs) were inserted to a
depth of about 50 cm (total height 55 cm). Starting
in 2009, depth was reduced to about 30 cm (total
height 35 cm) in corn and soy crops as these crops
lacked significant root biomass beyond this depth.
In the row crop treatment, collars were relocated
following tillage. Measurements were made
approximately every 3 to 5 weeks between mid-
May and late October using a 20-cm diameter gas
exchange chamber (LI-8100-103, LI-COR, Inc.).
Each survey took 2 to 3 days to complete and was
performed between the hours of 0900 and 1700
CST. Rroot+ was calculated as the difference
between Rsoil and Rrfs. Statistics were performed in
R (R Development Core Team 2008) using a linear
mixed-effects model fit by REML, where vegetation
type, year, and block were fixed effects, sampling
date was a random variable, and variance was
scaled as a power of fitted respiration.
In each large plot, continuous Rsoil measure-
ments were made using four 20-cm diameter long-
term chambers (LI-8100-101, LiCor, Inc.) con-
nected to an infrared gas analyzer (LI-8011, LiCor,
Inc.) through a multiplexer (LI-8150, LiCor, Inc.).
Each chamber made one measurement per half-
hour period. Soil temperature at 5 cm was mea-
sured continuously (Hydra Probe II Soil Sensors;
Stevens Water Monitoring Systems, Inc.) and used
to fill gaps in the Rsoil record. Measurements began
shortly after planting in 2008 and continued
through the end of 2011.
Automated Rsoil records were gap-filled and cor-
rected using code written in Matlab� v. 7.8.0. Gap
filling was performed by calculating a temperature-
independent reference respiration (Rref), filling gaps
through linear interpolation of Rref, and finally
calculating Rsoil based on complete Rref and soil tem-
perature (T; K) records. Previous analysis determined
that this method was the most accurate among sev-
eral gap-filling methods (Gomez-Casanovas and
others 2013). Specifically, Rref (lmol m-2 s-1 at
10�C) was calculated from Rsoil (lmol m-2 s-1) and T
(K) based upon the Lloyd and Taylor (1994) model
describing the temperature-sensitivity of soil respi-
ration:
Rsoil ¼ RrefeE0� 1
Tref�T0� 1
T�T0
� �ð1Þ
Here, E0 is a fitted parameter reminiscent of an
activation energy (here, 308.56 K; (Lloyd and
Taylor 1994), Tref (K) is the temperature at which
Rref is characterized (here, 283.15 K), and T0 is the
temperature intercept at which Rsoil = 0 (227.13 K,
following Lloyd and Taylor 1994). Second, gaps in
Rref were filled using linear interpolation. Third, the
gap-filled Rref records were compared to simulta-
neously measured Rref values from survey mea-
surements and corrected for any substantial
differences. When Rref fell outside of one standard
deviation of survey measurements (all blocks
combined), the difference between the two was
used to correct automated Rref at that time. Cor-
rection factors were linearly interpolated between
survey measurements, and the correction applied
over the frost-free period of the year (approxi-
mately March–November). Finally, the gap-filled,
Land-Use Change and Belowground Carbon 511
corrected record of Rref was used to calculate Rsoil
based on Eq. 1.
Net Belowground C Balance
Because the crops were harvested annually, there
was no net change in aboveground biomass from
year to year. Therefore, when calculated from one
harvest to the next, the net belowground C balance
(counting the litter layer as part of the soil system)
is equal to the net ecosystem C balance
(NECB)—that is, the net change in ecosystem C
storage, whose dominant components in this sys-
tem are net ecosystem exchange of CO2 (NEE) and
lateral transfer of C through harvest (Chapin
and others 2006). NECB also includes CO, CH4, and
volatile organic C (VOC) fluxes and leaching of
dissolved organic or inorganic C. In these ecosys-
tems, C leaching is minimal and does not differ
significantly among crops (Mark David, personal
communication), and fluxes of C compounds other
than CO2 are negligible (for VOC’s at this site, see
Miresmailli and others 2012).
NECB was calculated from NEE and harvest data.
NEE was estimated using eddy-covariance mea-
surements (large plots only) as described in Zeri
and others (2011). NEE was measured continu-
ously beginning shortly after planting in 2008 and
continuing through the end of 2011. Records were
gap-filled as described in Zeri and others (2011)
and summed to produce annual estimates (delin-
eated by calendar year). Uncertainty in NEE esti-
mates associated with random errors or with data
gaps was estimated as by Zeri and others (2011). C
removed through harvest was subtracted to yield
NECB. Miscanthus biomass from the 2011 growing
season was harvested in January 2012; however,
for the purposes of this analysis, the harvest was
counted for the 2011 calendar year.
RESULTS
Vegetation Establishment and Total CStocks
The perennial crops were planted in 2008, and
typically require 2–4 years to establish. Whereas the
switchgrass and prairie established well and reached
‘‘maturity’’ within about 3 years, the establishment
of miscanthus was substantially delayed by poor
initial establishment and planting of additional
rhizomes in 2009 and 2010. Miscanthus, therefore,
did not attain the biomass observed at a nearby site
(>1,720 g C m-2; Heaton and others 2008) within
the first four growing seasons (Figure 1).
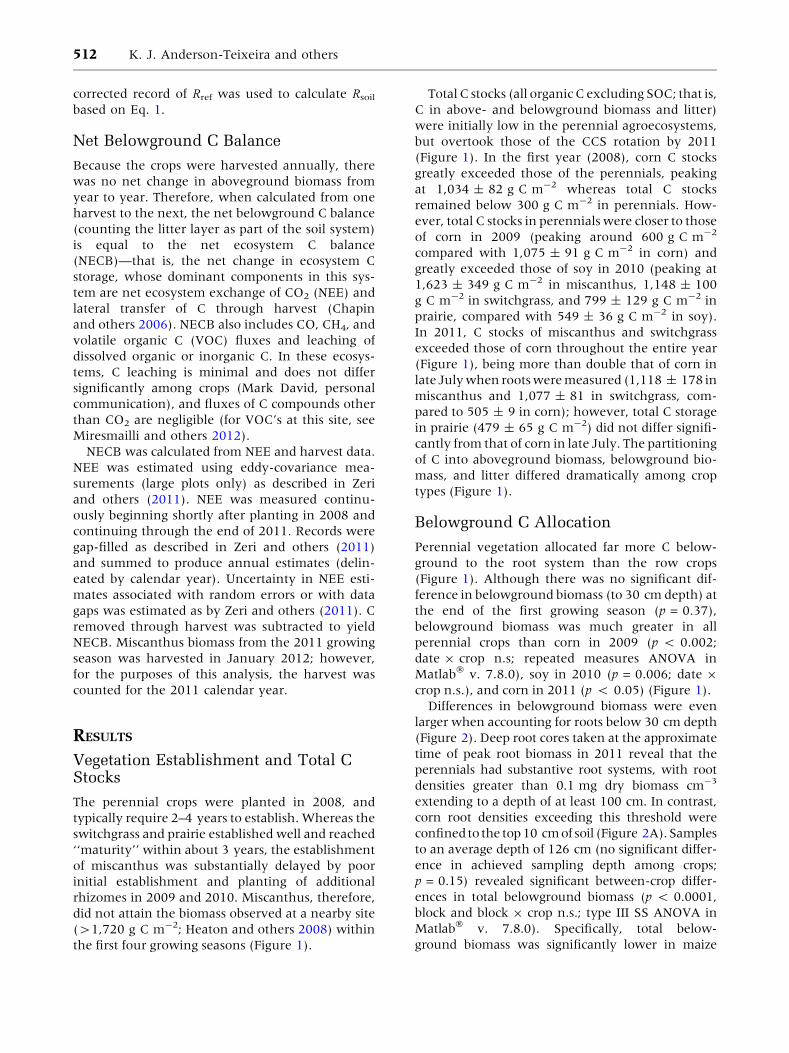
Total C stocks (all organic C excluding SOC; that is,
C in above- and belowground biomass and litter)
were initially low in the perennial agroecosystems,
but overtook those of the CCS rotation by 2011
(Figure 1). In the first year (2008), corn C stocks
greatly exceeded those of the perennials, peaking
at 1,034 ± 82 g C m-2 whereas total C stocks
remained below 300 g C m-2 in perennials. How-
ever, total C stocks in perennials were closer to those
of corn in 2009 (peaking around 600 g C m-2
compared with 1,075 ± 91 g C m-2 in corn) and
greatly exceeded those of soy in 2010 (peaking at
1,623 ± 349 g C m-2 in miscanthus, 1,148 ± 100
g C m-2 in switchgrass, and 799 ± 129 g C m-2 in
prairie, compared with 549 ± 36 g C m-2 in soy).
In 2011, C stocks of miscanthus and switchgrass
exceeded those of corn throughout the entire year
(Figure 1), being more than double that of corn in
late July when roots were measured (1,118 ± 178 in
miscanthus and 1,077 ± 81 in switchgrass, com-
pared to 505 ± 9 in corn); however, total C storage
in prairie (479 ± 65 g C m-2) did not differ signifi-
cantly from that of corn in late July. The partitioning
of C into aboveground biomass, belowground bio-
mass, and litter differed dramatically among crop
types (Figure 1).
Belowground C Allocation
Perennial vegetation allocated far more C below-
ground to the root system than the row crops
(Figure 1). Although there was no significant dif-
ference in belowground biomass (to 30 cm depth) at
the end of the first growing season (p = 0.37),
belowground biomass was much greater in all
perennial crops than corn in 2009 (p < 0.002;
date 9 crop n.s; repeated measures ANOVA in
Matlab� v. 7.8.0), soy in 2010 (p = 0.006; date 9
crop n.s.), and corn in 2011 (p < 0.05) (Figure 1).
Differences in belowground biomass were even
larger when accounting for roots below 30 cm depth
(Figure 2). Deep root cores taken at the approximate
time of peak root biomass in 2011 reveal that the
perennials had substantive root systems, with root
densities greater than 0.1 mg dry biomass cm-3
extending to a depth of at least 100 cm. In contrast,
corn root densities exceeding this threshold were
confined to the top 10 cm of soil (Figure 2A). Samples
to an average depth of 126 cm (no significant differ-
ence in achieved sampling depth among crops;
p = 0.15) revealed significant between-crop differ-
ences in total belowground biomass (p < 0.0001,
block and block 9 crop n.s.; type III SS ANOVA in
Matlab� v. 7.8.0). Specifically, total below-
ground biomass was significantly lower in maize
512 K. J. Anderson-Teixeira and others
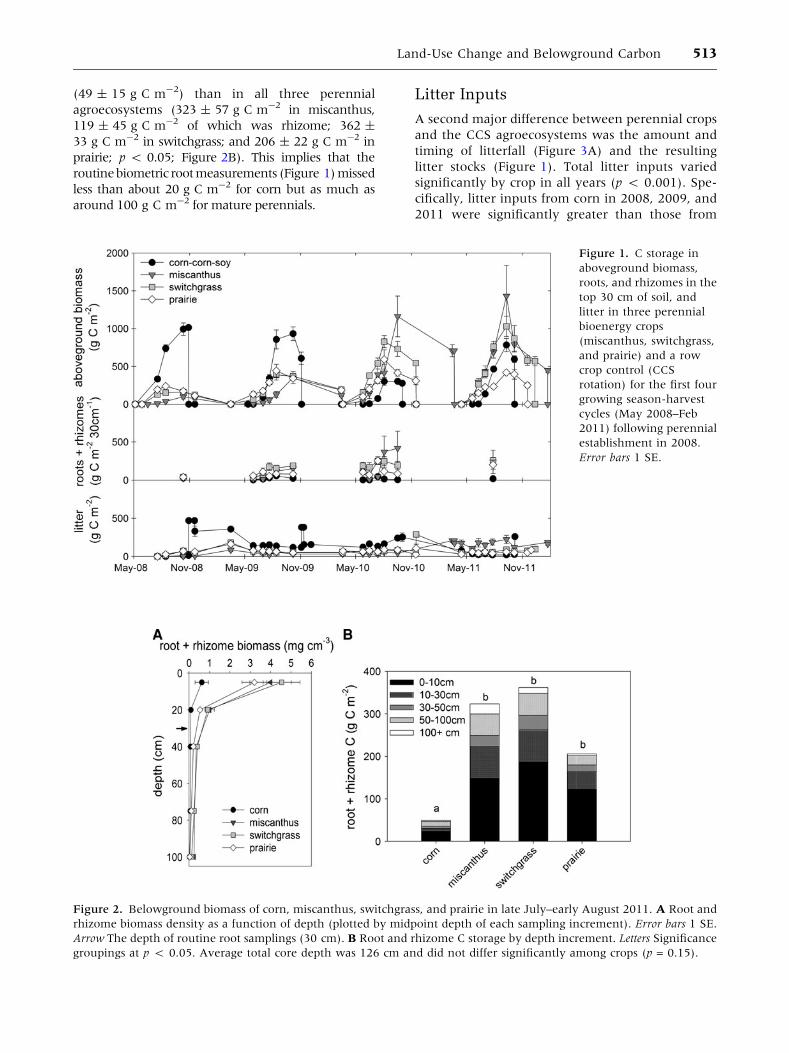
(49 ± 15 g C m-2) than in all three perennial
agroecosystems (323 ± 57 g C m-2 in miscanthus,
119 ± 45 g C m-2 of which was rhizome; 362 ±
33 g C m-2 in switchgrass; and 206 ± 22 g C m-2 in
prairie; p < 0.05; Figure 2B). This implies that the
routinebiometric rootmeasurements (Figure 1) missed
less than about 20 g C m-2 for corn but as much as
around 100 g C m-2 for mature perennials.
Litter Inputs
A second major difference between perennial crops
and the CCS agroecosystems was the amount and
timing of litterfall (Figure 3A) and the resulting
litter stocks (Figure 1). Total litter inputs varied
significantly by crop in all years (p < 0.001). Spe-
cifically, litter inputs from corn in 2008, 2009, and
2011 were significantly greater than those from
Figure 1. C storage in
aboveground biomass,
roots, and rhizomes in the
top 30 cm of soil, and
litter in three perennial
bioenergy crops
(miscanthus, switchgrass,
and prairie) and a row
crop control (CCS
rotation) for the first four
growing season-harvest
cycles (May 2008–Feb
2011) following perennial
establishment in 2008.
Error bars 1 SE.
Figure 2. Belowground biomass of corn, miscanthus, switchgrass, and prairie in late July–early August 2011. A Root and
rhizome biomass density as a function of depth (plotted by midpoint depth of each sampling increment). Error bars 1 SE.
Arrow The depth of routine root samplings (30 cm). B Root and rhizome C storage by depth increment. Letters Significance
groupings at p < 0.05. Average total core depth was 126 cm and did not differ significantly among crops (p = 0.15).
Land-Use Change and Belowground Carbon 513
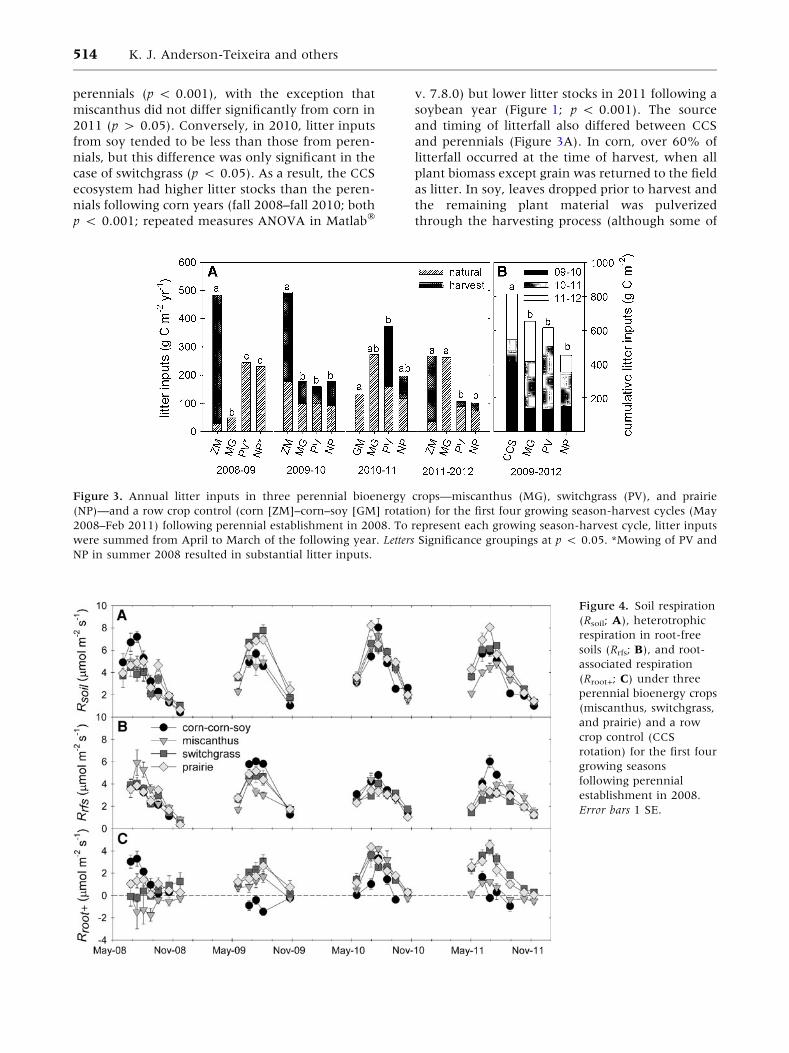
perennials (p < 0.001), with the exception that
miscanthus did not differ significantly from corn in
2011 (p > 0.05). Conversely, in 2010, litter inputs
from soy tended to be less than those from peren-
nials, but this difference was only significant in the
case of switchgrass (p < 0.05). As a result, the CCS
ecosystem had higher litter stocks than the peren-
nials following corn years (fall 2008–fall 2010; both
p < 0.001; repeated measures ANOVA in Matlab�
v. 7.8.0) but lower litter stocks in 2011 following a
soybean year (Figure 1; p < 0.001). The source
and timing of litterfall also differed between CCS
and perennials (Figure 3A). In corn, over 60% of
litterfall occurred at the time of harvest, when all
plant biomass except grain was returned to the field
as litter. In soy, leaves dropped prior to harvest and
the remaining plant material was pulverized
through the harvesting process (although some of
Figure 3. Annual litter inputs in three perennial bioenergy crops—miscanthus (MG), switchgrass (PV), and prairie
(NP)—and a row crop control (corn [ZM]–corn–soy [GM] rotation) for the first four growing season-harvest cycles (May
2008–Feb 2011) following perennial establishment in 2008. To represent each growing season-harvest cycle, litter inputs
were summed from April to March of the following year. Letters Significance groupings at p < 0.05. *Mowing of PV and
NP in summer 2008 resulted in substantial litter inputs.
Figure 4. Soil respiration
(Rsoil; A), heterotrophic
respiration in root-free
soils (Rrfs; B), and root-
associated respiration
(Rroot+; C) under three
perennial bioenergy crops
(miscanthus, switchgrass,
and prairie) and a row
crop control (CCS
rotation) for the first four
growing seasons
following perennial
establishment in 2008.
Error bars 1 SE.
514 K. J. Anderson-Teixeira and others
the pulverized material was returned to the eco-
system, it was below the size threshold of ‘‘litter’’).
Once they reached maturity, perennials generally
had higher natural litterfall rates than CCS. Litter-
fall inputs at time of harvest averaged less than
50% of the annual total for all perennials and were
strongly influenced by the efficiency of harvesting
equipment and the timing of harvest. In 2010 and
2011, relatively high miscanthus litterfall during
fall and winter built up litter stocks, which showed
no net increase following harvest.
Summed over a full corn–soy–corn rotation cycle
from spring 2009–spring 2012, total C inputs from
litterfall were higher in the row crop control
(935 g C m-2) than in the perennial crops (723,
626, and 463 g C m-2 in miscanthus, switchgrass,
and prairie, respectively; p < 0.05; Figure 3B).
CO2 Efflux Through Rsoil, Rrfs, and Rroot+
Survey measurements revealed that Rsoil (Figure 4A)
varied significantly by vegetation type (p < 0.001)
and by vegetation type 9 year (p < 0.001) with no
significant main effect of year (p = 0.87) or block
(p = 0.40). Initially, during the 2008 growing season,
Rsoil did not differ by crop except that miscanthus was
lower than the others (p = 0.005)—a fact that is not
surprising given the delayed establishment of mi-
scanthus. Starting in 2009, however, Rsoil was con-
sistently higher under perennial vegetation than in
CCS (all significant at p = 0.05 except switchgrass in
2010, where p = 0.06).
Respiration in root exclosure collars (Rrfs;
Figure 4B) varied significantly by vegetation type
(p < 0.001), vegetation type 9 year (p < 0.001),
and block (p < 0.001) with no significant main effect
of year (p = 0.10). In 2008, Rrfs was higher under
perennials than corn (all p < 0.03)—potentially be-
cause of more recent soil disturbance from planting,
particularly in the case of miscanthus rhizome
planting in June 2008. From 2009 on, all perennials
had lower Rrfs than CCS (all p < 0.05 except prairie
2009, where p = 0.11). In the perennial agroecosys-
tems, Rrfs decreased over time (p < 0.05).
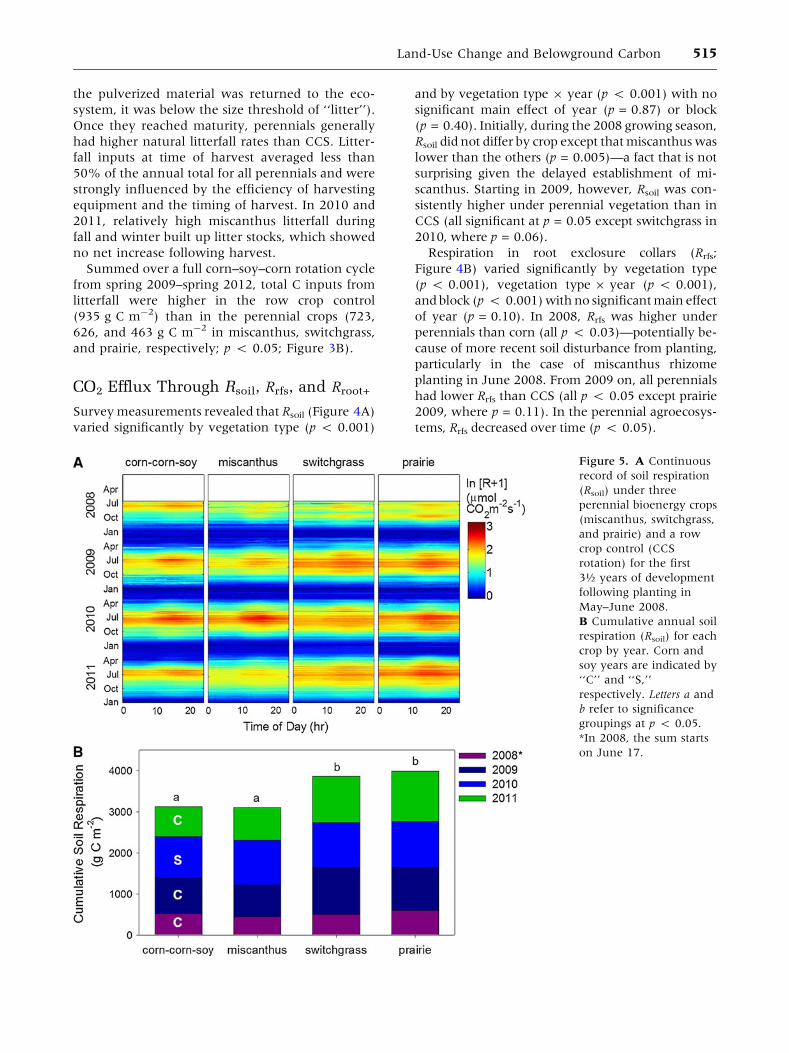
Figure 5. A Continuous
record of soil respiration
(Rsoil) under three
perennial bioenergy crops
(miscanthus, switchgrass,
and prairie) and a row
crop control (CCS
rotation) for the first
3½ years of development
following planting in
May–June 2008.
B Cumulative annual soil
respiration (Rsoil) for each
crop by year. Corn and
soy years are indicated by
‘‘C’’ and ‘‘S,’’
respectively. Letters a and
b refer to significance
groupings at p < 0.05.
*In 2008, the sum starts
on June 17.
Land-Use Change and Belowground Carbon 515
Root-associated respiration (Rroot+, the difference
between Rsoil and Rrfs; Figure 4C) varied signifi-
cantly by vegetation type (p < 0.001), vegetation
type 9 year (p < 0.001), and year (p = 0.003)
with no significant effect of block (p = 0.30). In
2008, Rroot+ was highest in corn (p < 0.05)—a fact
that is not surprising given that the gross primary
production of corn was twice that of the perennials
in 2008 (Zeri and others 2011). Starting in 2009,
Rroot+ of miscanthus, switchgrass, and prairie
greatly exceeded that of CCS (all p < 0.0001).
Continuous Rsoil Record
Automated measurements gave a continuous record
of Rsoil for the entire 3½-year period (Figure 5A).
Rsoil varied seasonally, peaking during the summer
and remaining minimal during the winter. Differ-
ences between perennials and CCS lay more in the
length of the season over which Rsoil was relatively
high than in maximum Rsoil (Figures 4, 5). Specifi-
cally, the length of the season over which weekly
Rsoil exceeded a given threshold tended to be
extended in the perennials—particularly switchgrass
and prairie—relative to CCS. For example, from 2009
to 2011, the average number of weeks per year that
Rsoil exceeded 10 g C m-2 week-1 was 17.7, 22.7,
and 21.3 for miscanthus, switchgrass, and prairie,
respectively, compared to only 16.0 weeks for CCS.
Similarly, the average number of weeks per year that
Rsoil exceeded 3 g C m-2 week-1 was 35.7, 39.0,
and 38.7 for miscanthus, switchgrass, and prairie,
respectively, compared to only 34.3 weeks for CCS.
In all years, annual Rsoil under perennial vege-
tation was greater than or equal to that of the row
crop control (Figure 5B). Annual Rsoil varied sig-
nificantly by crop type (p < 0.0001; type III SS
ANOVA in Matlab� v. 7.8.0), being higher in
switchgrass and prairie than in CCS and miscan-
thus (p < 0.05; no significant differences within
these two pairs). Annual Rsoil also varied by year
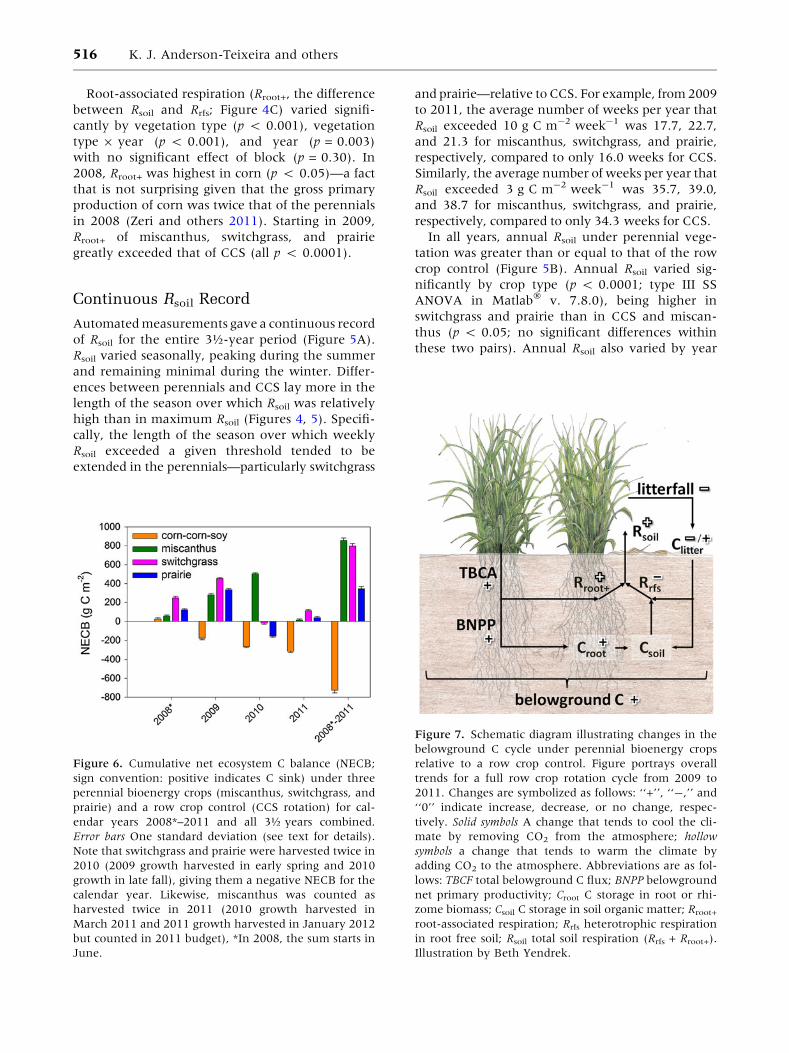
Figure 6. Cumulative net ecosystem C balance (NECB;
sign convention: positive indicates C sink) under three
perennial bioenergy crops (miscanthus, switchgrass, and
prairie) and a row crop control (CCS rotation) for cal-
endar years 2008*–2011 and all 3½ years combined.
Error bars One standard deviation (see text for details).
Note that switchgrass and prairie were harvested twice in
2010 (2009 growth harvested in early spring and 2010
growth in late fall), giving them a negative NECB for the
calendar year. Likewise, miscanthus was counted as
harvested twice in 2011 (2010 growth harvested in
March 2011 and 2011 growth harvested in January 2012
but counted in 2011 budget), *In 2008, the sum starts in
June.
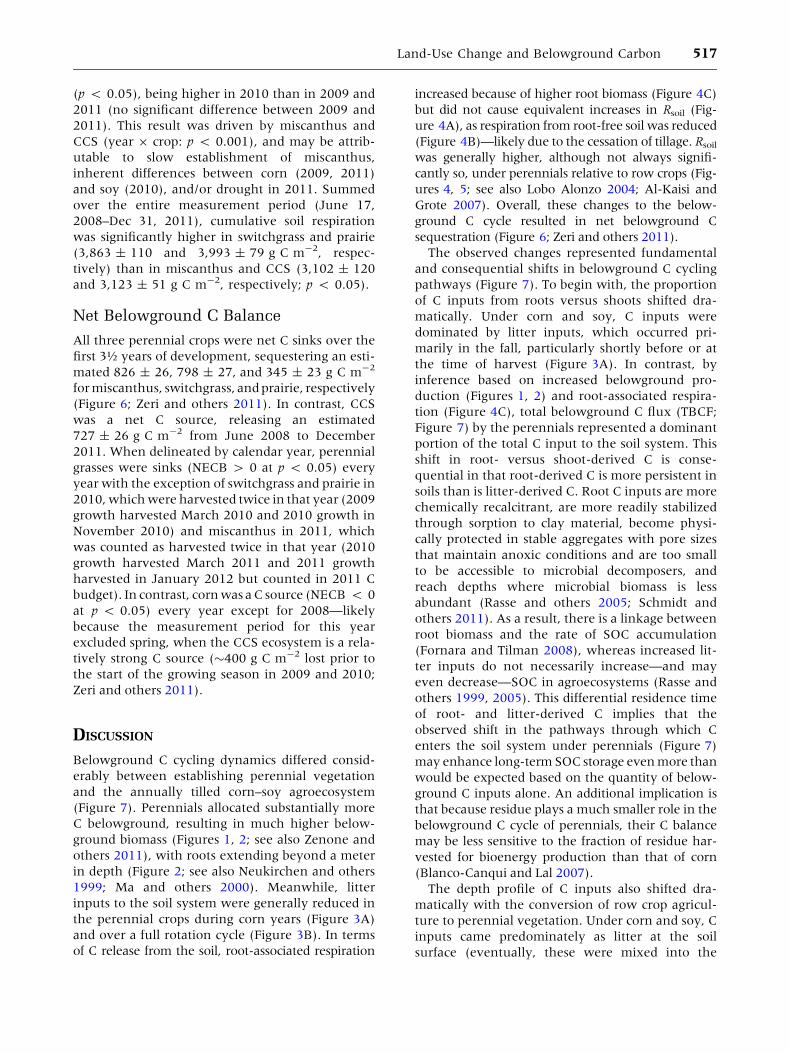
Figure 7. Schematic diagram illustrating changes in the
belowground C cycle under perennial bioenergy crops
relative to a row crop control. Figure portrays overall
trends for a full row crop rotation cycle from 2009 to
2011. Changes are symbolized as follows: ‘‘+’’, ‘‘-,’’ and
‘‘0’’ indicate increase, decrease, or no change, respec-
tively. Solid symbols A change that tends to cool the cli-
mate by removing CO2 from the atmosphere; hollow
symbols a change that tends to warm the climate by
adding CO2 to the atmosphere. Abbreviations are as fol-
lows: TBCF total belowground C flux; BNPP belowground
net primary productivity; Croot C storage in root or rhi-
zome biomass; Csoil C storage in soil organic matter; Rroot+
root-associated respiration; Rrfs heterotrophic respiration
in root free soil; Rsoil total soil respiration (Rrfs + Rroot+).
Illustration by Beth Yendrek.
516 K. J. Anderson-Teixeira and others
(p < 0.05), being higher in 2010 than in 2009 and
2011 (no significant difference between 2009 and
2011). This result was driven by miscanthus and
CCS (year 9 crop: p < 0.001), and may be attrib-
utable to slow establishment of miscanthus,
inherent differences between corn (2009, 2011)
and soy (2010), and/or drought in 2011. Summed
over the entire measurement period (June 17,
2008–Dec 31, 2011), cumulative soil respiration
was significantly higher in switchgrass and prairie
(3,863 ± 110 and 3,993 ± 79 g C m-2, respec-
tively) than in miscanthus and CCS (3,102 ± 120
and 3,123 ± 51 g C m-2, respectively; p < 0.05).
Net Belowground C Balance
All three perennial crops were net C sinks over the
first 3½ years of development, sequestering an esti-
mated 826 ± 26, 798 ± 27, and 345 ± 23 g C m-2
for miscanthus, switchgrass, and prairie, respectively
(Figure 6; Zeri and others 2011). In contrast, CCS
was a net C source, releasing an estimated
727 ± 26 g C m-2 from June 2008 to December
2011. When delineated by calendar year, perennial
grasses were sinks (NECB > 0 at p < 0.05) every
year with the exception of switchgrass and prairie in
2010, which were harvested twice in that year (2009
growth harvested March 2010 and 2010 growth in
November 2010) and miscanthus in 2011, which
was counted as harvested twice in that year (2010
growth harvested March 2011 and 2011 growth
harvested in January 2012 but counted in 2011 C
budget). In contrast, corn was a C source (NECB < 0
at p < 0.05) every year except for 2008—likely
because the measurement period for this year
excluded spring, when the CCS ecosystem is a rela-
tively strong C source (�400 g C m-2 lost prior to
the start of the growing season in 2009 and 2010;
Zeri and others 2011).
DISCUSSION
Belowground C cycling dynamics differed consid-
erably between establishing perennial vegetation
and the annually tilled corn–soy agroecosystem
(Figure 7). Perennials allocated substantially more
C belowground, resulting in much higher below-
ground biomass (Figures 1, 2; see also Zenone and
others 2011), with roots extending beyond a meter
in depth (Figure 2; see also Neukirchen and others
1999; Ma and others 2000). Meanwhile, litter
inputs to the soil system were generally reduced in
the perennial crops during corn years (Figure 3A)
and over a full rotation cycle (Figure 3B). In terms
of C release from the soil, root-associated respiration
increased because of higher root biomass (Figure 4C)
but did not cause equivalent increases in Rsoil (Fig-
ure 4A), as respiration from root-free soil was reduced
(Figure 4B)—likely due to the cessation of tillage. Rsoil
was generally higher, although not always signifi-
cantly so, under perennials relative to row crops (Fig-
ures 4, 5; see also Lobo Alonzo 2004; Al-Kaisi and
Grote 2007). Overall, these changes to the below-
ground C cycle resulted in net belowground C
sequestration (Figure 6; Zeri and others 2011).
The observed changes represented fundamental
and consequential shifts in belowground C cycling
pathways (Figure 7). To begin with, the proportion
of C inputs from roots versus shoots shifted dra-
matically. Under corn and soy, C inputs were
dominated by litter inputs, which occurred pri-
marily in the fall, particularly shortly before or at
the time of harvest (Figure 3A). In contrast, by
inference based on increased belowground pro-
duction (Figures 1, 2) and root-associated respira-
tion (Figure 4C), total belowground C flux (TBCF;
Figure 7) by the perennials represented a dominant
portion of the total C input to the soil system. This
shift in root- versus shoot-derived C is conse-
quential in that root-derived C is more persistent in
soils than is litter-derived C. Root C inputs are more
chemically recalcitrant, are more readily stabilized
through sorption to clay material, become physi-
cally protected in stable aggregates with pore sizes
that maintain anoxic conditions and are too small
to be accessible to microbial decomposers, and
reach depths where microbial biomass is less
abundant (Rasse and others 2005; Schmidt and
others 2011). As a result, there is a linkage between
root biomass and the rate of SOC accumulation
(Fornara and Tilman 2008), whereas increased lit-
ter inputs do not necessarily increase—and may
even decrease—SOC in agroecosystems (Rasse and
others 1999, 2005). This differential residence time
of root- and litter-derived C implies that the
observed shift in the pathways through which C
enters the soil system under perennials (Figure 7)
may enhance long-term SOC storage even more than
would be expected based on the quantity of below-
ground C inputs alone. An additional implication is
that because residue plays a much smaller role in the
belowground C cycle of perennials, their C balance
may be less sensitive to the fraction of residue har-
vested for bioenergy production than that of corn
(Blanco-Canqui and Lal 2007).
The depth profile of C inputs also shifted dra-
matically with the conversion of row crop agricul-
ture to perennial vegetation. Under corn and soy, C
inputs came predominately as litter at the soil
surface (eventually, these were mixed into the
Land-Use Change and Belowground Carbon 517
surface soil layer through tillage), and root C inputs
were minimal below the top 30 cm of soil
(Figure 2). In contrast, under perennial vegetation,
the majority of C inputs came through the roots,
which were most abundant near the surface but
extended to depths of over a meter (Figure 2).
Although it remains unclear whether depth per se
is important in controlling the rate of soil organic
matter decomposition, soil C does tend to be more
persistent at deeper layers (Rasse and others 2005).
Eventually, the deeper root distribution of peren-
nials results in a generally deeper SOC distribution
in grasslands (Jobbagy and Jackson 2000).
The source of CO2 released from the soil differed
substantially between perennials and the corn–soy
rotation (Figures 4, 6). Whereas high TBCF by the
establishing perennial vegetation fueled signifi-
cantly increased Rroot+ (Figure 4C), higher litterfall
inputs under row crops (Figure 3), combined with
soil disturbance through tillage, shifted the balance
toward Rrfs (Figures 4B, 6). As the majority of
respired CO2 is typically derived from recently fixed
C (either root or shoot material), this shift in par-
titioning of Rsoil between Rroot+ and Rrfs is best
interpreted as reflecting the shift in root versus
litter C inputs (Ryan and Law 2005), as well as the
reduction of soil disturbance through tillage
(Grandy and Robertson 2007). This study does not
allow us to differentiate between old versus recent
C sources for two reasons. First, Rrfs includes CO2
from litter decomposition in addition to breakdown
of older soil organic matter. In addition, there is the
possibility that high photosynthate input through
the extensive root systems of the perennial vege-
tation has a priming effect on microbial respiration,
thereby facilitating decomposition of old SOC
(Kuzyakov and others 2000; Fu and Cheng 2002;
Fontaine and others 2007; Schmidt and others
2011). Because this priming effect would be asso-
ciated with the roots (part of Rroot+), the root
exclusion technique used here cannot discern a
priming effect. Further research will be required to
determine whether there is a significant priming
effect in these ecosystems; however, the observa-
tion that the perennial systems are net C sinks
(Figure 6; Zeri and others 2011) implies that any
priming effect is more than offset by C inputs to the
soil system.
The increased belowground C allocation of
perennial vegetation results in net belowground
sequestration by these ecosystems (Figure 7). All
three perennial crops acted as C sinks over the first
three-and-a-half years of establishment, whereas
the corn–soy rotation was a CO2 source to the
atmosphere (Figure 6; Zeri and others 2011).
Because aboveground biomass is harvested annually
and litter stocks display no long-term directional
change, this net ecosystem C sequestration is
attributable to belowground processes. These
observations are consistent with observed C cycle
changes disproportionately favoring C sequestration
as opposed to CO2 release (Figure 7). Specifically,
under establishing perennial vegetation, below-
ground biomass was 400–750% greater than in CCS
(Figure 2), litterfall was reduced by only 20–45%
(Figure 3), and annual Rsoil increased by at most
30% (Figure 5). Thus, the shifts in belowground C
cycling observed here provide a mechanism for ob-
served net belowground C sequestration by these
perennial ecosystems (Figure 6; Zeri and others
2011) and also indicate that the perennial bioenergy
crops have ecosystem properties that should favor
the build-up and long-term persistence of SOC
(Schmidt and others 2011). Although changes in
SOC have not yet been quantified at this site, a mass
balance approach comparing NECB for 2008–2011
(Figure 6), belowground biomass as of summer 2011
(Figure 2B), and post-2011 harvest litter stocks
(Figure 1) suggests that the perennial grasses gained
SOC (�370, 340, and 55 g C m-2 for miscanthus,
switchgrass, and prairie, respectively) whereas CCS
lost SOC (�1,000 g C m-2). Future research will be
required to directly quantify changes in SOC in these
ecosystems and to close the C budget, as well as to
understand how C cycling changes with age of
perennial bioenergy crops.
By identifying the mechanisms through which
belowground C sequestration occurs, this study
reinforces previous findings that, even with annual
biomass harvest for bioenergy, perennial bioenergy
agroecosystems provide climate benefits through
CO2 sequestration (Anderson-Teixeira and others
2009; Robertson and others 2011; Zeri and others
2011; Gelfand and others 2011). This contrasts with
the opposite scenario, where replacing perennial
systems with soybean bioenergy crops results in net
CO2 release (Zenone and others 2011; Gelfand and
others 2011). Of course, the net climate effect of
ethanol production from perennial crops will ulti-
mately depend also on biomass yield and ethanol
production efficiency (Fargione and others 2010;
Somerville and others 2010), associated changes in
N2O emissions (Melillo and others 2009; Crutzen
and others 2007; Robertson and others 2011), any
associated land-use change (Fargione and others
2008; Melillo and others 2009; Searchinger and
others 2008), and biophysical climate effects of the
land-use conversion (Georgescu and others 2009,
2011; Vanloocke and others 2010; Anderson-
Teixeira and others 2012, 2011).
518 K. J. Anderson-Teixeira and others
Beyond the implications for the sustainability of
bioenergy production, the observed differences in
belowground C cycling between establishing
perennial vegetation and annual crops clarify the
mechanisms through which land-use changes alter
belowground C storage. This study documents how
land-use change results in simultaneous changes in
belowground C allocation and litterfall, which
drive changes in belowground biomass, root-asso-
ciated and bulk soil respiration, and total soil res-
piration (Figure 7). It demonstrates that land-use
change triggers multiple changes in belowground C
dynamics, the sum of which determine changes in
the belowground C balance. Overall, enhanced
root-associated C cycling under perennial vegeta-
tion fundamentally alters belowground C dynamics
and implies greater long-term capacity of perennial
ecosystems to sequester C.
ACKNOWLEDGMENTS
Thank you to Tom Voigt and Emily Thomas for
providing harvest yield data, to Tim Mies for help
with Energy Farm logistics, to Nuria Gomez-Casa-
novas for contributions to analysis of gap-filling
methods, and to Beth Yendrek for the illustration
in Figure 7. The Energy Biosciences Institute fun-
ded this research.
REFERENCES
Al-Kaisi MM, Grote JB. 2007. Cropping systems effects on
improving soil carbon stocks of exposed subsoil. Soil Sci Soc
Am J 71:1381.
Anderson-Teixeira KJ, DeLucia EH. 2011. The greenhouse gas
value of ecosystems. Glob Change Biol 17(1):425–38.
Anderson-Teixeira KJ, Davis SC, Masters MD, DeLucia EH.
2009. Changes in soil organic carbon under biofuel crops. GCB
Bioenergy 1(1):75–96.
Anderson-Teixeira KJ, Snyder PK, DeLucia EH. 2011. Do biofuels
life cycle analyses accurately quantify the climate impacts of
biofuels-related land use change? Ill Law Rev 2:589–622.
Anderson-Teixeira KJ, Snyder PK, Twine TE, Cuadra SV, Costa
MH, DeLucia EH. 2012. Climate-regulation services of natural
and agricultural ecoregions of the Americas. Nat Climate
Change 2(3):177–81.
Bernacchi CJ, Hollinger SE, Meyers TP. 2005. The conversion of
the corn/soybean ecosystem to no-till agriculture may result
in a carbon sink. Glob Change Biol 11(11):1872.
Blanco-Canqui H. 2010. Energy crops and their implications on
soil and environment. Agron J 102:403.
Blanco-Canqui H, Lal R. 2007. Soil and crop response to harvesting
corn residues for biofuel production. Geoderma 141(3–4):
355–62.
Chapin F, Woodwell G, Randerson J, Rastetter E, Lovett G,
Baldocchi D, Clark D, Harmon M, Schimel D, Valentini R et al.
2006. Reconciling carbon-cycle concepts, terminology, and
methods. Ecosystems 9(7):1041–50.
Crutzen PJ, Mosier AR, Smith KA, Winiwarter W. 2008. N2O
release from agro-biofuel production negates global warming
reduction by replacing fossil fuels. Atmos Chem Phys 8:
389–95.
Davidson E, Ackerman I. 1993. Changes in soil carbon inven-
tories following cultivation of previously untilled soils. Bio-
geochemistry 20:161–93.
Davis S, Parton W, Dohleman F, Smith C, Grosso S, Kent A,
DeLucia E. 2010. Comparative biogeochemical cycles of bio-
energy crops reveal nitrogen-fixation and low greenhouse gas
emissions in a miscanthus 9 giganteus agro-ecosystem. Eco-
systems 13(1):144–56.
Davis SC, Parton WJ, Del Grosso SJ, Keough C, Marx E, Adler
PR, DeLucia EH. 2011. Impact of second-generation biofuel
agriculture on greenhouse-gas emissions in the corn-growing
regions of the US. Front Ecol Environ. 110706144507005.
DeLuca TH, Zabinski CA. 2011. Prairie ecosystems and the car-
bon problem. Front Ecol Environ 9:407–13.
Dohleman FG, Heaton EA, Arundale RA, Long SP. 2012. Seasonal
dynamics of above- and below-ground biomass and nitrogen par-
titioning in miscanthus 9 giganteus and Panicum virgatum across
three growing seasons. GCB Bioenergy [Epub ahead of print].
doi:10.1111/j.1757-1707.2011.01153.x.
Fargione J, Hill J, Tilman D, Polasky S, Hawthorne P. 2008. Land
clearing and the biofuel carbon debt. Science 319(5867):1235–8.
Fargione JE, Plevin RJ, Hill JD. 2010. The ecological impact of
biofuels. Ann Rev Ecol Evol Syst 41(1):351–77.
Fontaine S, Barot S, Barre P, Bdioui N, Mary B, Rumpel C. 2007.
Stability of organic carbon in deep soil layers controlled by
fresh carbon supply. Nature 450(7167):277–80.
Fornara DA, Tilman D. 2008. Plant functional composition
influences rates of soil carbon and nitrogen accumulation.
J Ecol 96(2):314–22.
Frank AB, Berdahl JD, Hanson JD, Liebig MA, Johnson HA.
2004. Biomass and carbon partitioning in switchgrass. Crop
Sci 44(4):1391.
Fu S, Cheng W. 2002. Rhizosphere priming effects on the
decomposition of soil organic matter in C4 and C3 grassland
soils. Plant Soil 238(2):289–94.
Gelfand I, Zenone T, Jasrotia P, Chen J, Hamilton SK, Robertson
GP. 2011. Carbon debt of conservation reserve program (CRP)
grasslands converted to bioenergy production. Proc Natl Acad
Sci USA 108(33):13864–9.
Georgescu M, Lobell DB, Field CB. 2009. Potential impact of US
biofuels on regional climate. Geophys Res Lett 36(21):L21806.
Georgescu M, Lobell DB, Field CB. 2011. Direct climate effects of
perennial bioenergy crops in the United States. Proc Natl Acad
Sci USA 108(11):4307–12.
Gomez-Casanovas N, Anderson-Teixeira KJ, Zeri M, Bernacchi
C, DeLucia E. 2013. Gap filling strategies and error in esti-
mating annual soil respiration. Glob Change Biol
Grandy A, Robertson G. 2007. Land-use intensity effects on soil
organic carbon accumulation rates and mechanisms. Ecosys-
tems 10(1):59–74.
Guo LB, Gifford RM. 2002. Soil carbon stocks and land use
change: a meta analysis. Glob Change Biol 8(4):345–60.
Heaton E, Dohleman FG, Long SP. 2008. Meeting US biofuel
goals with less land: the potential of Miscanthus. Glob Change
Biol 14(9):2000–14.
Jobbagy EG, Jackson RB. 2000. The vertical distribution of soil
organic carbon and its relation to climate and vegetation. Ecol
Appl 10(2):423–36.
Land-Use Change and Belowground Carbon 519
Kuzyakov Y, Friedel J, Stahr K. 2000. Review of mechanisms
and quantification of priming effects. Soil Biol Biochem 32
(11–12):1485–98.
Lal R. 2004. Soil carbon sequestration impacts on global climate
change and food security. Science 304(5677):1623–7.
Le Quere C, Raupach MR, Canadell JG, Marland G et al. 2009.
Trends in the sources and sinks of carbon dioxide. Nat Geosci
2(12):831–6.
Lloyd J, Taylor J. 1994. On the temperature dependence of soil
respiration. Funct Ecol 8(3):315–23.
Lobo Alonzo PJ. 2004. Changes in soil carbon and nitrogen
associated with switchgrass production. College Station, TX:
M.S., Texas A&M University.
Ma Z, Wood CW, Bransby DI. 2000. Impacts of soil management
on root characteristics of switchgrass. Biomass Bioenergy
18(2):105–12.
Matamala RNL, Jastrow JD, Miller RMNL, Garten CT Jr. 2008.
Temporal changes in C and N stocks of restored prairie: impli-
cations for C sequestration strategies. Ecol Appl 18:1470–88.
McLaughlin SB, Kszos LA. 2005. Development of switchgrass
(Panicum virgatum) as a bioenergy feedstock in the United
States. Biomass Bioenergy 28(6):515.
Melillo JM, Reilly JM, Kicklighter DW, Gurgel AC, Cronin TW,
Paltsev S, Felzer BS, Wang X, Sokolov AP, Schlosser CA. 2009.
Indirect emissions from biofuels: how important? Science
326(5958):1397–9.
Miresmailli S, Zeri M, Zangerl AR, Bernacchi CJ, Berenbaum
MR, DeLucia EH. 2012. Impacts of herbaceous bioenergy
crops on atmospheric volatile organic composition and
potential consequences for global climate change. GCB
Bioenergy [Epub ahead of print]. doi:10.1111/j.1757-
1707.2012.01189.x.
Monti A, Zatta A. 2009. Root distribution and soil moisture
retrieval in perennial and annual energy crops in Northern
Italy. Agric Ecosyst Environ 132(3–4):252–9.
Murty D, Kirschbaum M, McMurtrie RE, McGilvray H. 2002.
Does conversion of forest to agricultural land change soil
carbon and nitrogen? A review of the literature. Glob Change
Biol 8:105–23.
Neukirchen D, Himken M, Lammel J, Czypionka-Krause U, Olfs
H-W. 1999. Spatial and temporal distribution of the root
system and root nutrient content of an established Miscanthus
crop. Eur J Agron 11(3–4):301–9.
Pan Y, Birdsey RA, Fang J, Houghton R, Kauppi PE, Kurz WA,
Phillips OL, Shvidenko A, Lewis SL, Canadell JG et al. 2011. A
large and persistent carbon sink in the world’s forests. Science
333(6045):988–93.
R Development Core Team. 2008. R: a language and environ-
ment for statistical computing. Vienna, Australia: R Founda-
tion for Statistical Computing. http://www.R-project.org.
Accessed 1 May 2011.
Rasse DP, Schabenberger O, Smucker AJM. 1999. Modifications
of soil nitrogen pools in response to alfalfa root systems and
shoot mulch. Agron J 91(3):471–7.
Rasse D, Rumpel C, Dignac M-F. 2005. Is soil carbon mostly root
carbon? Mechanisms for a specific stabilisation. Plant Soil
269(1):341–56.
Roberts MJ, Long SP, Tieszen LL, Beadle CL. 1993. Measurement
of plant biomass and net primary production of herbaceous
vegetation. In: Hall DO, Scurlock JMO, Bolhar-Nordenkampf
HR, Leegood RC, Long SP, Eds. Photosynthesis and production
in a changing environment: a field and laboratory manual.
London: Chapman and Hall.
Robertson GP, Hamilton SK, Del Grosso SJ, Parton WJ. 2011.
The biogeochemistry of bioenergy landscapes: carbon, nitro-
gen, and water considerations. Ecol Appl 21:1055–67.
Ryan MG, Law BE. 2005. Interpreting, measuring, and modeling
soil respiration. Biogeochemistry 73:3–27.
Schlesinger WH. 2005. Biogeochemistry: treatise on geochem-
istry, vol 8. 1st edn. Amsterdam: Elsevier Science.
Schmidt MWI, Torn MS, Abiven S, Dittmar T, Guggenberger G,
Janssens IA, Kleber M, Kogel-Knabner I, Lehmann J, Manning
DAC et al. 2011. Persistence of soil organic matter as an ecosys-
tem property. Nature 478(7367):49–56.
Searchinger T, Heimlich R, Houghton RA, Dong F, Elobeid A,
Fabiosa J, Tokgoz S, Hayes D, Yu T-H. 2008. Use of US crop-
lands for biofuels increases greenhouse gases through emis-
sions from land-use change. Science 319(5867):1238–40.
Somerville C, Youngs H, Taylor C, Davis SC, Long SP. 2010. Feed-
stocks for lignocellulosic biofuels. Science 329(5993):790–2.
Tilman D, Hill J, Lehman C. 2006. Carbon-negative biofuels
from low-input high-diversity grassland biomass. Science
314(5805):1598–600.
US Senate. 2007. Renewable Fuels, Consumer Protection, and
Energy Efficiency Act of 2007 (S. 1419). Washington, DC: US
Senate. June 21, 2007.
Vanloocke A, Bernacchi CJ, Twine TE. 2010. The impacts of
miscanthus 9 giganteus production on the Midwest US
hydrologic cycle. GCB Bioenergy 2(4):180–91.
Zenone T, Chen J, Deal MW, Wilske B, Jasrotia P, Xu J,
Bhardwaj AK, Hamilton SK, Philip RG. 2011. CO2 fluxes of
transitional bioenergy crops: effect of land conversion during
the first year of cultivation. GCB Bioenergy 3(5):401–12.
Zeri M, Anderson-Teixeira K, Hickman G, Masters M, DeLucia E,
Bernacchi CJ. 2011. Carbon exchange by establishing biofuel
crops in Central Illinois. Agric Ecosyst Environ 144(1):319–29.
520 K. J. Anderson-Teixeira and others