allocation of railway rolling stock for passenger …€¦ · - 1 - allocation of railway rolling...
TRANSCRIPT
No. 2002-43
ALLOCATION OF RAILWAY ROLLING STOCK FORPASSENGER TRAINS
By Erwin Abbink, Bianca van den Berg, Leo Kroon and Marc Salomon
April 2002
ISSN 0924-7815
- 1 -
Allocation of Railway Rolling Stock for Passenger Trains Erwin Abbink1 Bianca van den Berg2 Leo Kroon1,3 Marc Salomon4
1 NS Reizigers, Department of Logistics, Utrecht 2 Cap Gemini Ernst & Young, Amsterdam 3 Erasmus University Rotterdam, Rotterdam School of Management [email protected] 4 Catholic University of Brabant, Department of Economics, Tilburg Abstract For a commercially operating railway company, providing a high level of service for the passengers is of utmost importance. The latter requires a high punctuality of the trains and an adequate rolling stock capacity. Unfortunately, the latter is currently (2002) one of the bottlenecks in the service provision by the main Dutch railway operator NS Reizigers. Especially during the morning rush hours, many passengers cannot be transported according to the usual service standards due to a shortage of the rolling stock capacity. On the other hand, a more effective allocation of the available rolling stock capacity seems to be feasible, since there are also a few trains with some slack capacity.
The effectiveness of the rolling stock capacity is determined mainly by the allocation of the train types and subtypes to the lines. Therefore, we describe in this paper a model that can be used to find an optimal allocation of train types and subtypes to train series. This optimal allocation is more effective than the manually planned one, which is accomplished by minimizing the shortages of capacity during the rush hours.
The model is implemented in the modeling language OPL Studio 3.1, solved by CPLEX 7.0, and tested on several scenarios based on the 2001-2002 timetable of NS Reizigers. The results of the model were received positively, both by the planners and by the management in practice, since these results showed that a significant service improvement over the manually planned allocation can be achieved within a shorter throughput time of the involved part of the planning process.
- 2 -
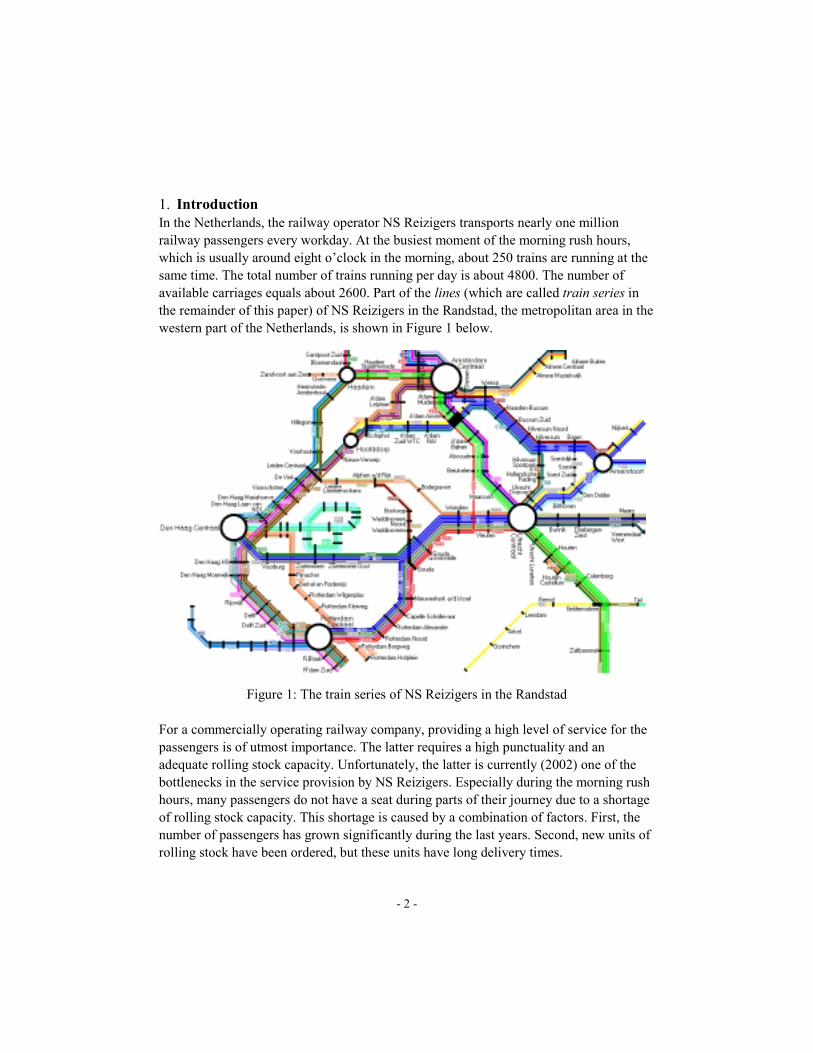
1. Introduction In the Netherlands, the railway operator NS Reizigers transports nearly one million railway passengers every workday. At the busiest moment of the morning rush hours, which is usually around eight o’clock in the morning, about 250 trains are running at the same time. The total number of trains running per day is about 4800. The number of available carriages equals about 2600. Part of the lines (which are called train series in the remainder of this paper) of NS Reizigers in the Randstad, the metropolitan area in the western part of the Netherlands, is shown in Figure 1 below.
Figure 1: The train series of NS Reizigers in the Randstad For a commercially operating railway company, providing a high level of service for the passengers is of utmost importance. The latter requires a high punctuality and an adequate rolling stock capacity. Unfortunately, the latter is currently (2002) one of the bottlenecks in the service provision by NS Reizigers. Especially during the morning rush hours, many passengers do not have a seat during parts of their journey due to a shortage of rolling stock capacity. This shortage is caused by a combination of factors. First, the number of passengers has grown significantly during the last years. Second, new units of rolling stock have been ordered, but these units have long delivery times.
- 3 -
Given the current situation, it is important to look for the most effective allocation of the available rolling stock capacity among the trains, especially during the rush hours. In fact, a better allocation than the manually planned one seems to be feasible, since at the same time there are also several trains with some slack capacity.
Most research on railway rolling stock deals with the routing and scheduling of locomotives and freight trains. For research in these areas, see for example the overview by Cordeau et al. (1998). However, also the rolling stock circulation for passenger trains received some attention recently. Examples of research in this area are provided by Ben-Khedher et al. (1998), Brucker et al. (1998), and Cordeau et al. (2001). The first paper deals with the scheduling of high speed train units of the French railway operator SNCF. The other papers deal with the routing of locomotive hauled carriages. Schrijver (1993), Groot (1996), Blom (1998), and Van Montfort (1998) describe research focusing on the rolling stock circulation of Dutch train units and locomotive hauled carriages.
All of the mentioned papers mainly deal with the operational problem of finding the most efficient schedule for a set of units of rolling stock, given a certain allocation of the train types and subtypes to the train series. In contrast with this, the current paper deals with the tactical problem of finding the most effective allocation of the train types, subtypes, and units of rolling stock to the train series, such that as many people as possible can be transported with a seat, especially during the rush hours.
The remaining part of this paper is structured as follows. In Section 2, we present some additional background information for providing a better understanding of the rolling stock allocation problem. In Section 3, we give a rough description of the planning process related to the rolling stock circulation. The details of the allocation problem are described in Section 4. Section 5 describes the assumptions underlying the model and the notation that we used to describe the model. Section 6 gives the details of the model. Section 7 presents our computational results based on several scenarios involving the 2001-2002 timetable of NS Reizigers. The paper is finished in Section 8 with conclusions and some subjects for further research. 2. Background information Before we go into the details of the rolling stock allocation problem, we first describe some background information pertaining to the rolling stock circulation of NS Reizigers. In the Netherlands, three different categories of trains for passenger transportation can be distinguished: Intercity trains, Inter-Regional trains, and Regional trains. The line system contains the train series, each of which connecting an origin station and a destination station with a certain frequency. Each train series belongs to one of the three train categories. The timetable gives the arrival and departure times of the trains at the relevant stations. The timetable of NS Reizigers is cyclic with a cycle length of one hour.
- 4 -
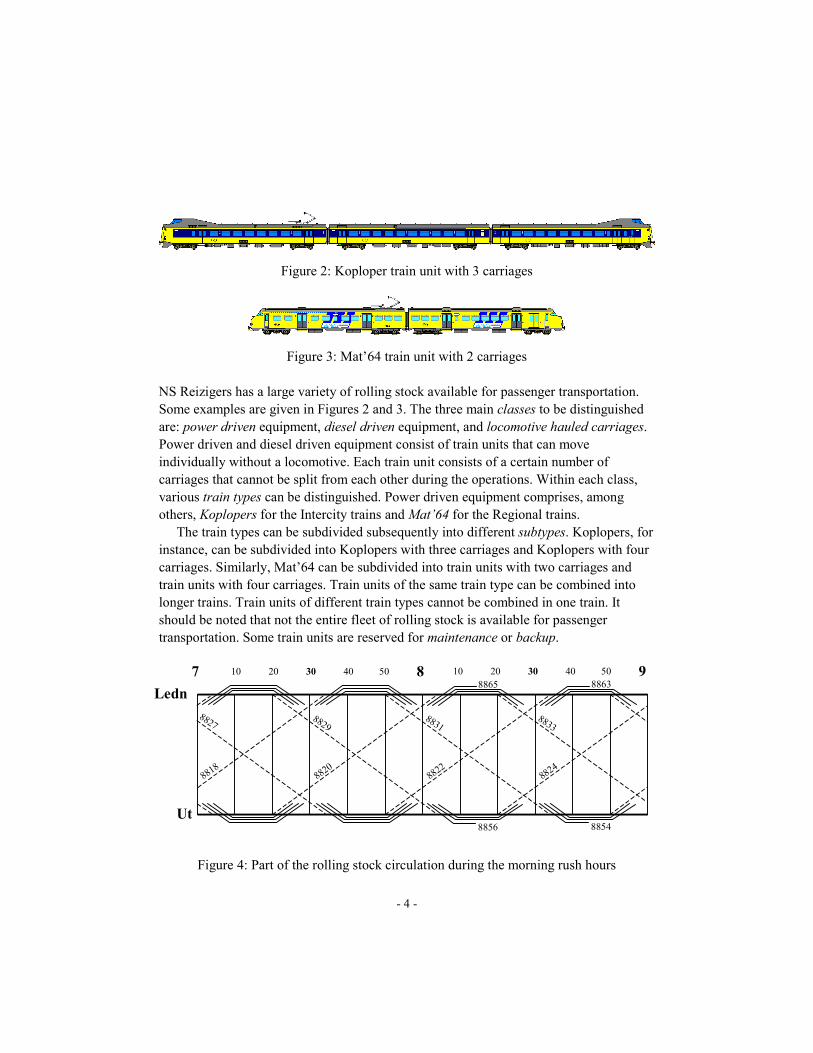
Figure 2: Koploper train unit with 3 carriages
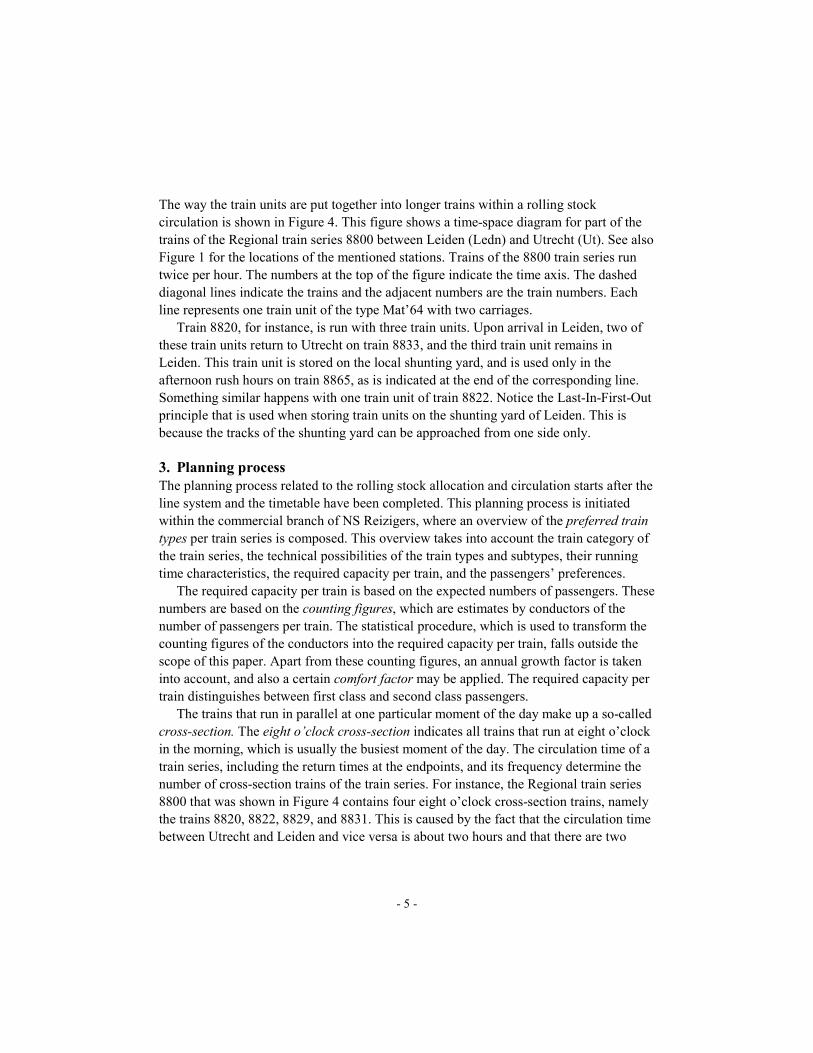
Figure 3: Mat’64 train unit with 2 carriages NS Reizigers has a large variety of rolling stock available for passenger transportation. Some examples are given in Figures 2 and 3. The three main classes to be distinguished are: power driven equipment, diesel driven equipment, and locomotive hauled carriages. Power driven and diesel driven equipment consist of train units that can move individually without a locomotive. Each train unit consists of a certain number of carriages that cannot be split from each other during the operations. Within each class, various train types can be distinguished. Power driven equipment comprises, among others, Koplopers for the Intercity trains and Mat’64 for the Regional trains. The train types can be subdivided subsequently into different subtypes. Koplopers, for instance, can be subdivided into Koplopers with three carriages and Koplopers with four carriages. Similarly, Mat’64 can be subdivided into train units with two carriages and train units with four carriages. Train units of the same train type can be combined into longer trains. Train units of different train types cannot be combined in one train. It should be noted that not the entire fleet of rolling stock is available for passenger transportation. Some train units are reserved for maintenance or backup.
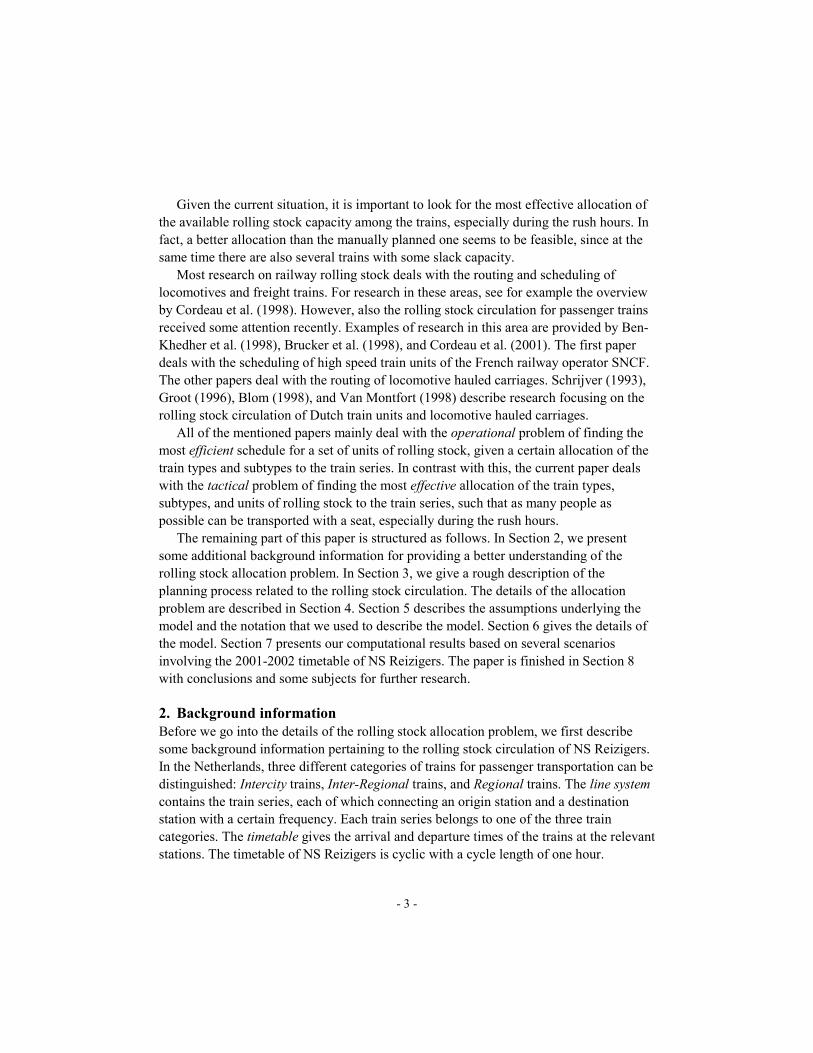
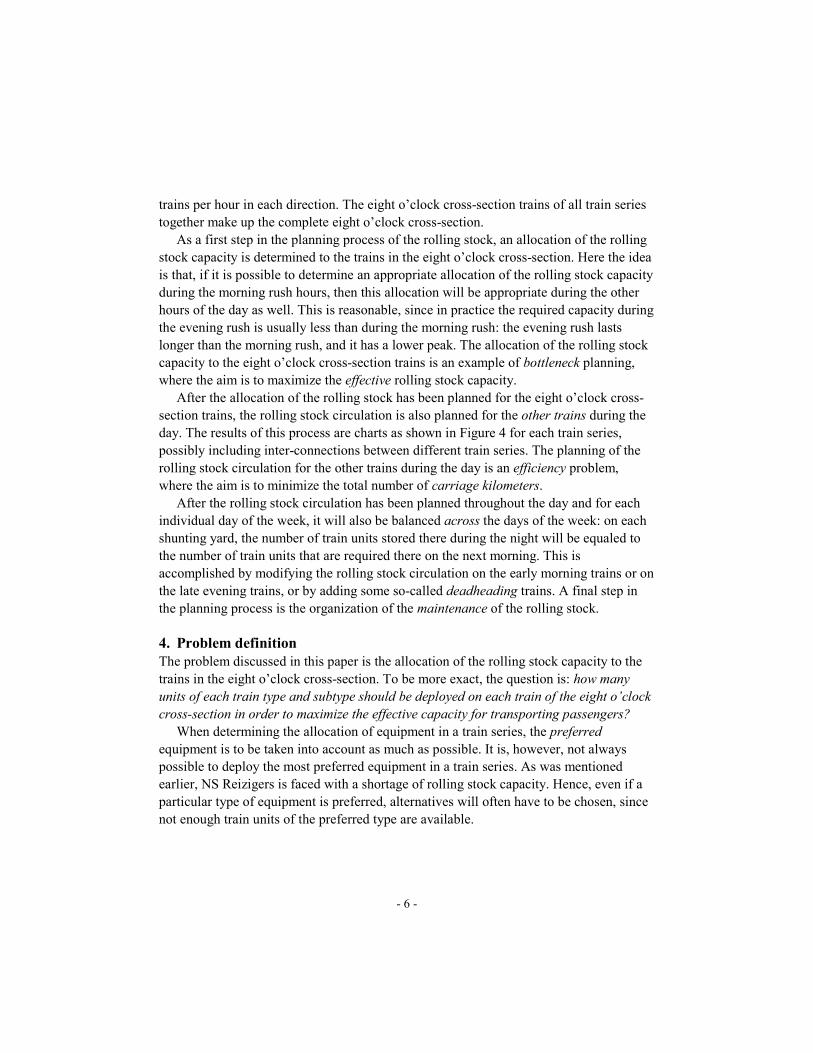
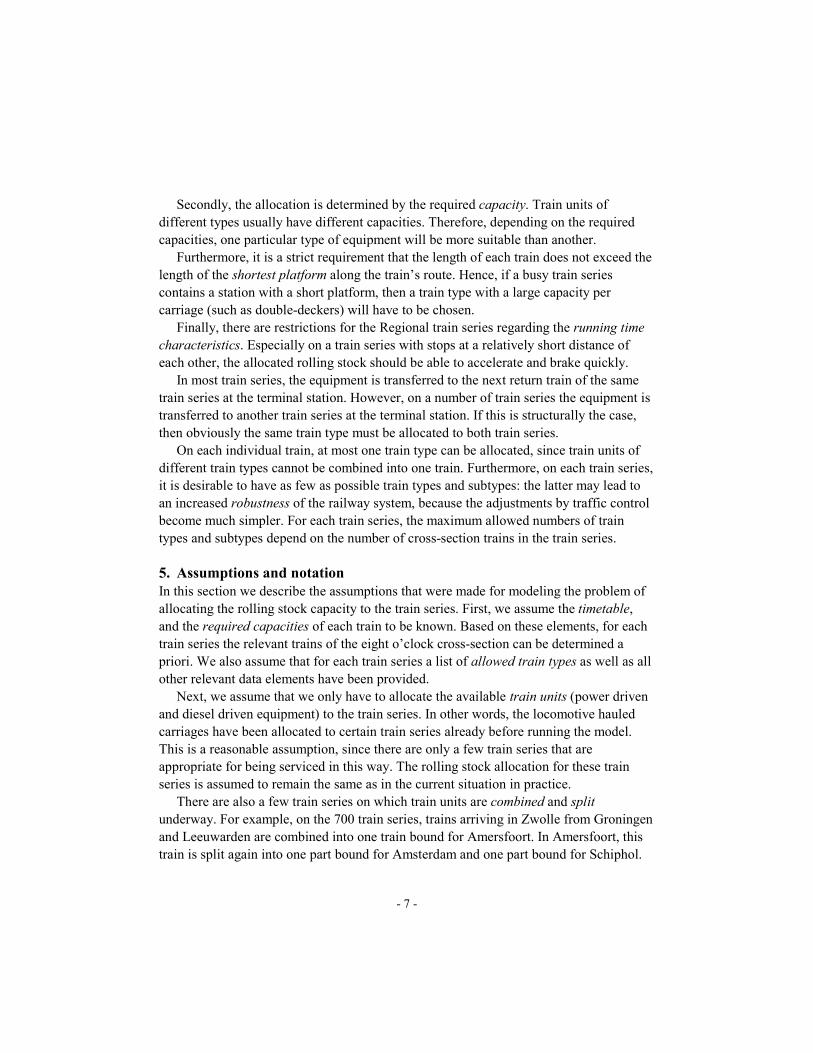
Figure 4: Part of the rolling stock circulation during the morning rush hours
810 20 30 40 507 910 20 30 40 50
Ut
Ledn
88188822
88248820
88338831
88298827
8856 8854
8865 8863
- 5 -
The way the train units are put together into longer trains within a rolling stock circulation is shown in Figure 4. This figure shows a time-space diagram for part of the trains of the Regional train series 8800 between Leiden (Ledn) and Utrecht (Ut). See also Figure 1 for the locations of the mentioned stations. Trains of the 8800 train series run twice per hour. The numbers at the top of the figure indicate the time axis. The dashed diagonal lines indicate the trains and the adjacent numbers are the train numbers. Each line represents one train unit of the type Mat’64 with two carriages.
Train 8820, for instance, is run with three train units. Upon arrival in Leiden, two of these train units return to Utrecht on train 8833, and the third train unit remains in Leiden. This train unit is stored on the local shunting yard, and is used only in the afternoon rush hours on train 8865, as is indicated at the end of the corresponding line. Something similar happens with one train unit of train 8822. Notice the Last-In-First-Out principle that is used when storing train units on the shunting yard of Leiden. This is because the tracks of the shunting yard can be approached from one side only. 3. Planning process The planning process related to the rolling stock allocation and circulation starts after the line system and the timetable have been completed. This planning process is initiated within the commercial branch of NS Reizigers, where an overview of the preferred train types per train series is composed. This overview takes into account the train category of the train series, the technical possibilities of the train types and subtypes, their running time characteristics, the required capacity per train, and the passengers’ preferences.
The required capacity per train is based on the expected numbers of passengers. These numbers are based on the counting figures, which are estimates by conductors of the number of passengers per train. The statistical procedure, which is used to transform the counting figures of the conductors into the required capacity per train, falls outside the scope of this paper. Apart from these counting figures, an annual growth factor is taken into account, and also a certain comfort factor may be applied. The required capacity per train distinguishes between first class and second class passengers.
The trains that run in parallel at one particular moment of the day make up a so-called cross-section. The eight o’clock cross-section indicates all trains that run at eight o’clock in the morning, which is usually the busiest moment of the day. The circulation time of a train series, including the return times at the endpoints, and its frequency determine the number of cross-section trains of the train series. For instance, the Regional train series 8800 that was shown in Figure 4 contains four eight o’clock cross-section trains, namely the trains 8820, 8822, 8829, and 8831. This is caused by the fact that the circulation time between Utrecht and Leiden and vice versa is about two hours and that there are two
- 6 -
trains per hour in each direction. The eight o’clock cross-section trains of all train series together make up the complete eight o’clock cross-section.
As a first step in the planning process of the rolling stock, an allocation of the rolling stock capacity is determined to the trains in the eight o’clock cross-section. Here the idea is that, if it is possible to determine an appropriate allocation of the rolling stock capacity during the morning rush hours, then this allocation will be appropriate during the other hours of the day as well. This is reasonable, since in practice the required capacity during the evening rush is usually less than during the morning rush: the evening rush lasts longer than the morning rush, and it has a lower peak. The allocation of the rolling stock capacity to the eight o’clock cross-section trains is an example of bottleneck planning, where the aim is to maximize the effective rolling stock capacity.
After the allocation of the rolling stock has been planned for the eight o’clock cross-section trains, the rolling stock circulation is also planned for the other trains during the day. The results of this process are charts as shown in Figure 4 for each train series, possibly including inter-connections between different train series. The planning of the rolling stock circulation for the other trains during the day is an efficiency problem, where the aim is to minimize the total number of carriage kilometers.
After the rolling stock circulation has been planned throughout the day and for each individual day of the week, it will also be balanced across the days of the week: on each shunting yard, the number of train units stored there during the night will be equaled to the number of train units that are required there on the next morning. This is accomplished by modifying the rolling stock circulation on the early morning trains or on the late evening trains, or by adding some so-called deadheading trains. A final step in the planning process is the organization of the maintenance of the rolling stock. 4. Problem definition The problem discussed in this paper is the allocation of the rolling stock capacity to the trains in the eight o’clock cross-section. To be more exact, the question is: how many units of each train type and subtype should be deployed on each train of the eight o’clock cross-section in order to maximize the effective capacity for transporting passengers?
When determining the allocation of equipment in a train series, the preferred equipment is to be taken into account as much as possible. It is, however, not always possible to deploy the most preferred equipment in a train series. As was mentioned earlier, NS Reizigers is faced with a shortage of rolling stock capacity. Hence, even if a particular type of equipment is preferred, alternatives will often have to be chosen, since not enough train units of the preferred type are available.
- 7 -
Secondly, the allocation is determined by the required capacity. Train units of different types usually have different capacities. Therefore, depending on the required capacities, one particular type of equipment will be more suitable than another.
Furthermore, it is a strict requirement that the length of each train does not exceed the length of the shortest platform along the train’s route. Hence, if a busy train series contains a station with a short platform, then a train type with a large capacity per carriage (such as double-deckers) will have to be chosen.
Finally, there are restrictions for the Regional train series regarding the running time characteristics. Especially on a train series with stops at a relatively short distance of each other, the allocated rolling stock should be able to accelerate and brake quickly.
In most train series, the equipment is transferred to the next return train of the same train series at the terminal station. However, on a number of train series the equipment is transferred to another train series at the terminal station. If this is structurally the case, then obviously the same train type must be allocated to both train series.
On each individual train, at most one train type can be allocated, since train units of different train types cannot be combined into one train. Furthermore, on each train series, it is desirable to have as few as possible train types and subtypes: the latter may lead to an increased robustness of the railway system, because the adjustments by traffic control become much simpler. For each train series, the maximum allowed numbers of train types and subtypes depend on the number of cross-section trains in the train series. 5. Assumptions and notation In this section we describe the assumptions that were made for modeling the problem of allocating the rolling stock capacity to the train series. First, we assume the timetable, and the required capacities of each train to be known. Based on these elements, for each train series the relevant trains of the eight o’clock cross-section can be determined a priori. We also assume that for each train series a list of allowed train types as well as all other relevant data elements have been provided.
Next, we assume that we only have to allocate the available train units (power driven and diesel driven equipment) to the train series. In other words, the locomotive hauled carriages have been allocated to certain train series already before running the model. This is a reasonable assumption, since there are only a few train series that are appropriate for being serviced in this way. The rolling stock allocation for these train series is assumed to remain the same as in the current situation in practice.
There are also a few train series on which train units are combined and split underway. For example, on the 700 train series, trains arriving in Zwolle from Groningen and Leeuwarden are combined into one train bound for Amersfoort. In Amersfoort, this train is split again into one part bound for Amsterdam and one part bound for Schiphol.
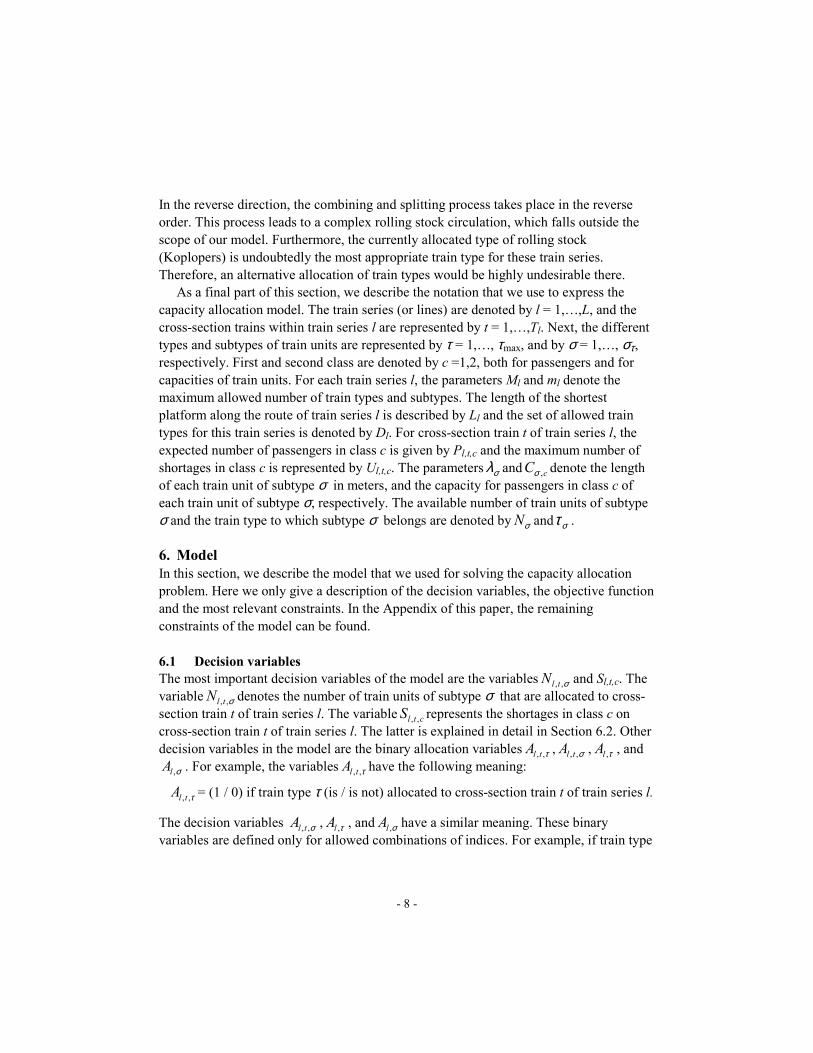
- 8 -
In the reverse direction, the combining and splitting process takes place in the reverse order. This process leads to a complex rolling stock circulation, which falls outside the scope of our model. Furthermore, the currently allocated type of rolling stock (Koplopers) is undoubtedly the most appropriate train type for these train series. Therefore, an alternative allocation of train types would be highly undesirable there.
As a final part of this section, we describe the notation that we use to express the capacity allocation model. The train series (or lines) are denoted by l = 1,…,L, and the cross-section trains within train series l are represented by t = 1,…,Tl. Next, the different types and subtypes of train units are represented by τ = 1,…, τmax, and by σ = 1,…, στ, respectively. First and second class are denoted by c =1,2, both for passengers and for capacities of train units. For each train series l, the parameters Ml and ml denote the maximum allowed number of train types and subtypes. The length of the shortest platform along the route of train series l is described by Ll and the set of allowed train types for this train series is denoted by Dl. For cross-section train t of train series l, the expected number of passengers in class c is given by Pl,t,c and the maximum number of shortages in class c is represented by Ul,t,c. The parameters σλ and cC ,σ denote the length of each train unit of subtype σ in meters, and the capacity for passengers in class c of each train unit of subtype σ, respectively. The available number of train units of subtype σ and the train type to which subtype σ belongs are denoted by σN and στ . 6. Model In this section, we describe the model that we used for solving the capacity allocation problem. Here we only give a description of the decision variables, the objective function and the most relevant constraints. In the Appendix of this paper, the remaining constraints of the model can be found. 6.1 Decision variables The most important decision variables of the model are the variables σ,,tlN and Sl,t,c. The variable σ,,tlN denotes the number of train units of subtype σ that are allocated to cross-section train t of train series l. The variable ctlS ,, represents the shortages in class c on cross-section train t of train series l. The latter is explained in detail in Section 6.2. Other decision variables in the model are the binary allocation variables τ,,tlA , σ,,tlA , τ,lA , and
σ,lA . For example, the variables τ,,tlA have the following meaning:
τ,,tlA = (1 / 0) if train type τ (is / is not) allocated to cross-section train t of train series l.
The decision variables σ,,tlA , τ,lA , and σ,lA have a similar meaning. These binary variables are defined only for allowed combinations of indices. For example, if train type
- 9 -
τ does not belong to the set of allowed train types of train series l, then the variables τ,,tlA and τ,lA are not defined, and the same holds for the variables σ,,tlA and σ,lA if τ = τσ.
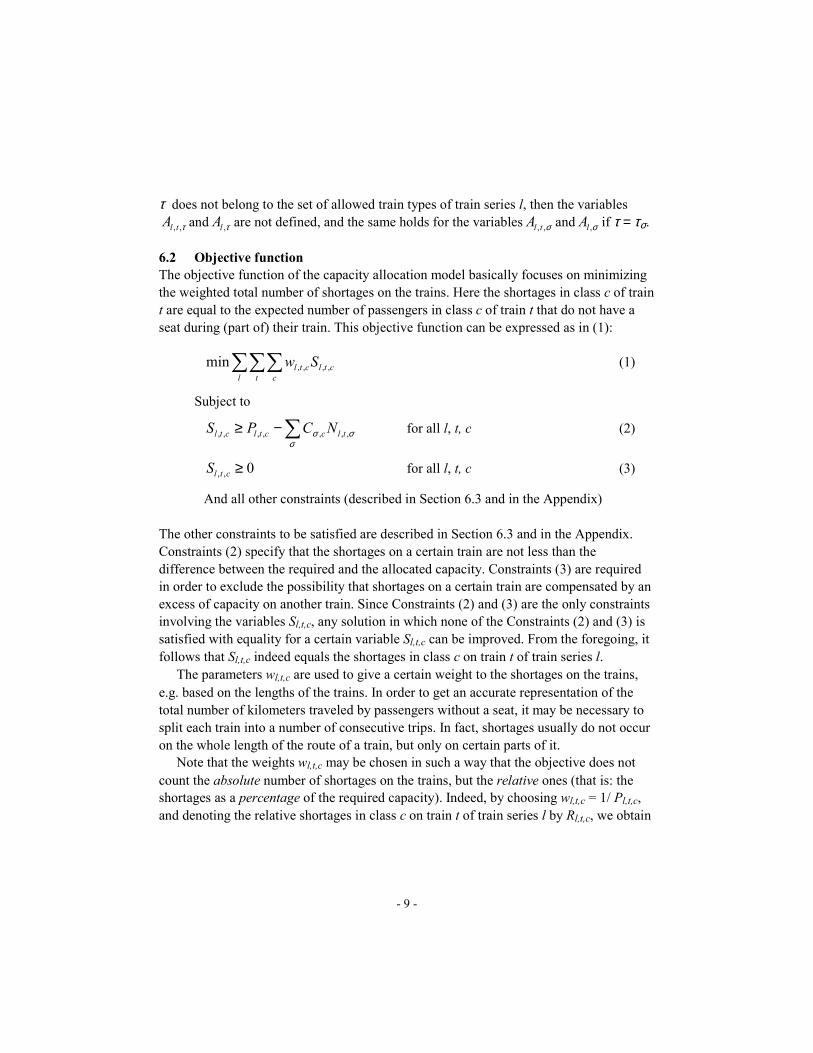
6.2 Objective function The objective function of the capacity allocation model basically focuses on minimizing the weighted total number of shortages on the trains. Here the shortages in class c of train t are equal to the expected number of passengers in class c of train t that do not have a seat during (part of) their train. This objective function can be expressed as in (1):
∑∑∑l t c
ctlctl Sw ,,,,min (1)
Subject to
∑−≥σ
σσ ,,,,,,, tlcctlctl NCPS for all l, t, c (2)
0,, ≥ctlS for all l, t, c (3)
And all other constraints (described in Section 6.3 and in the Appendix) The other constraints to be satisfied are described in Section 6.3 and in the Appendix. Constraints (2) specify that the shortages on a certain train are not less than the difference between the required and the allocated capacity. Constraints (3) are required in order to exclude the possibility that shortages on a certain train are compensated by an excess of capacity on another train. Since Constraints (2) and (3) are the only constraints involving the variables Sl,t,c, any solution in which none of the Constraints (2) and (3) is satisfied with equality for a certain variable Sl,t,c can be improved. From the foregoing, it follows that Sl,t,c indeed equals the shortages in class c on train t of train series l.
The parameters wl,t,c are used to give a certain weight to the shortages on the trains, e.g. based on the lengths of the trains. In order to get an accurate representation of the total number of kilometers traveled by passengers without a seat, it may be necessary to split each train into a number of consecutive trips. In fact, shortages usually do not occur on the whole length of the route of a train, but only on certain parts of it.
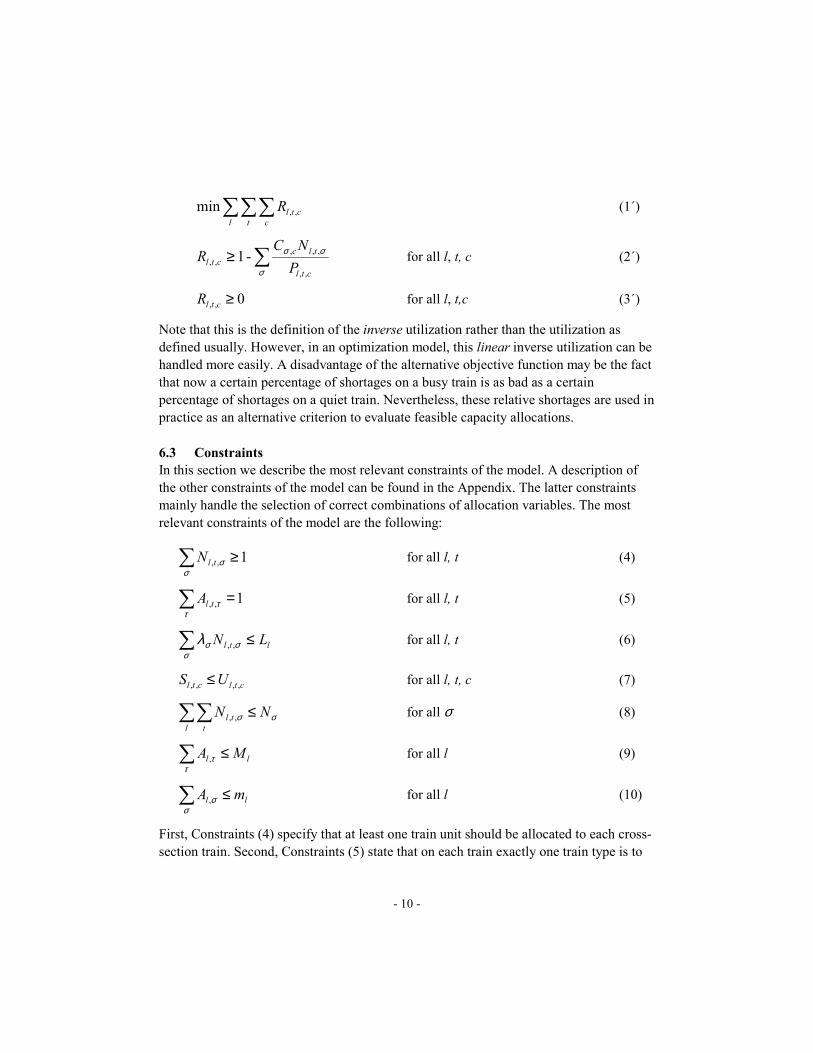
Note that the weights wl,t,c may be chosen in such a way that the objective does not count the absolute number of shortages on the trains, but the relative ones (that is: the shortages as a percentage of the required capacity). Indeed, by choosing wl,t,c = 1/ Pl,t,c, and denoting the relative shortages in class c on train t of train series l by Rl,t,c, we obtain
- 10 -
∑∑∑l t c
ctlR ,,min (1´)
∑≥σ
σσ
ctl
tlcctl P
NCR
,,
,,,,, -1 for all l, t, c (2´)
0,, ≥ctlR for all l, t,c (3´)
Note that this is the definition of the inverse utilization rather than the utilization as defined usually. However, in an optimization model, this linear inverse utilization can be handled more easily. A disadvantage of the alternative objective function may be the fact that now a certain percentage of shortages on a busy train is as bad as a certain percentage of shortages on a quiet train. Nevertheless, these relative shortages are used in practice as an alternative criterion to evaluate feasible capacity allocations. 6.3 Constraints In this section we describe the most relevant constraints of the model. A description of the other constraints of the model can be found in the Appendix. The latter constraints mainly handle the selection of correct combinations of allocation variables. The most relevant constraints of the model are the following:
∑ ≥σ
σ 1,,tlN for all l, t (4)
∑ =τ
τ 1,,tlA for all l, t (5)
∑ ≤σ
σσλ ltl LN ,, for all l, t (6)
ctlctl US ,,,, ≤ for all l, t, c (7)
∑∑ ≤l t
tl NN σσ,, for all σ (8)
∑ ≤τ
τ ll MA , for all l (9)
ll mA ≤∑σ
σ, for all l (10)
First, Constraints (4) specify that at least one train unit should be allocated to each cross-section train. Second, Constraints (5) state that on each train exactly one train type is to
- 11 -
be allocated. This is important since train units of different train types cannot be combined into one single train. Constraints (6) describe that on each train the total length of the allocated train units should not exceed the length of the shortest platform along the route. Constraints (7) guarantee that the shortages on each cross-section train respect the upper limit Ul,t,c. Next, Constraints (8) describe that for each subtype the number of allocated train units should not exceed the available number of units. According to Constraints (9), the number of train types allocated to each train series should not exceed the upper bound Ml. Similarly, Constraints (10) specify that the number of subtypes allocated to each train series should not exceed the upper bound ml. 7. Computational results In order to test the model, we implemented it in OPL Studio 3.1 using CPLEX 7.0. The hardware that we applied was a Pentium III processor with 1 GHz and 256 Mb RAM.
We studied the allocation of the available rolling stock to 50 Regional train series of the 2001-2002 timetable of NS Reizigers. This is almost the complete set of Regional train series of NS Reizigers. The number of cross-section trains in this data set equals 188, which gives a model with about 2800 decision variables and 6600 constraints.
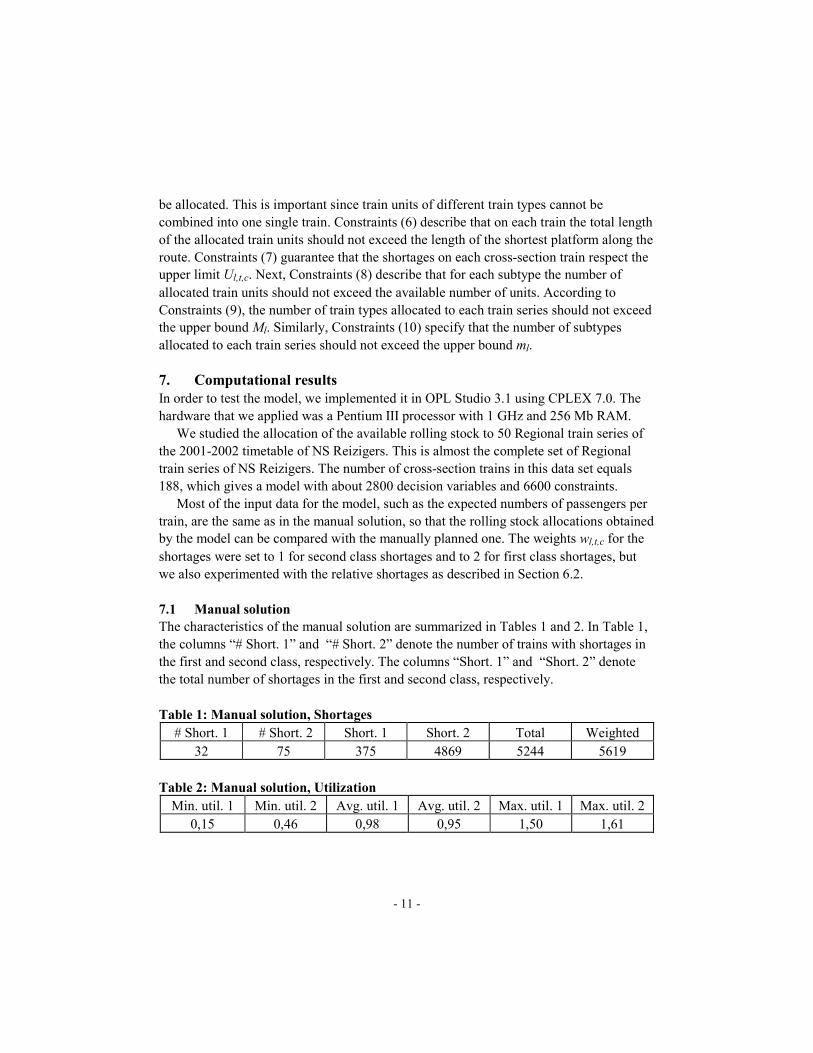
Most of the input data for the model, such as the expected numbers of passengers per train, are the same as in the manual solution, so that the rolling stock allocations obtained by the model can be compared with the manually planned one. The weights wl,t,c for the shortages were set to 1 for second class shortages and to 2 for first class shortages, but we also experimented with the relative shortages as described in Section 6.2. 7.1 Manual solution The characteristics of the manual solution are summarized in Tables 1 and 2. In Table 1, the columns “# Short. 1” and “# Short. 2” denote the number of trains with shortages in the first and second class, respectively. The columns “Short. 1” and “Short. 2” denote the total number of shortages in the first and second class, respectively. Table 1: Manual solution, Shortages
# Short. 1 # Short. 2 Short. 1 Short. 2 Total Weighted 32 75 375 4869 5244 5619
Table 2: Manual solution, Utilization
Min. util. 1 Min. util. 2 Avg. util. 1 Avg. util. 2 Max. util. 1 Max. util. 2 0,15 0,46 0,98 0,95 1,50 1,61
- 12 -
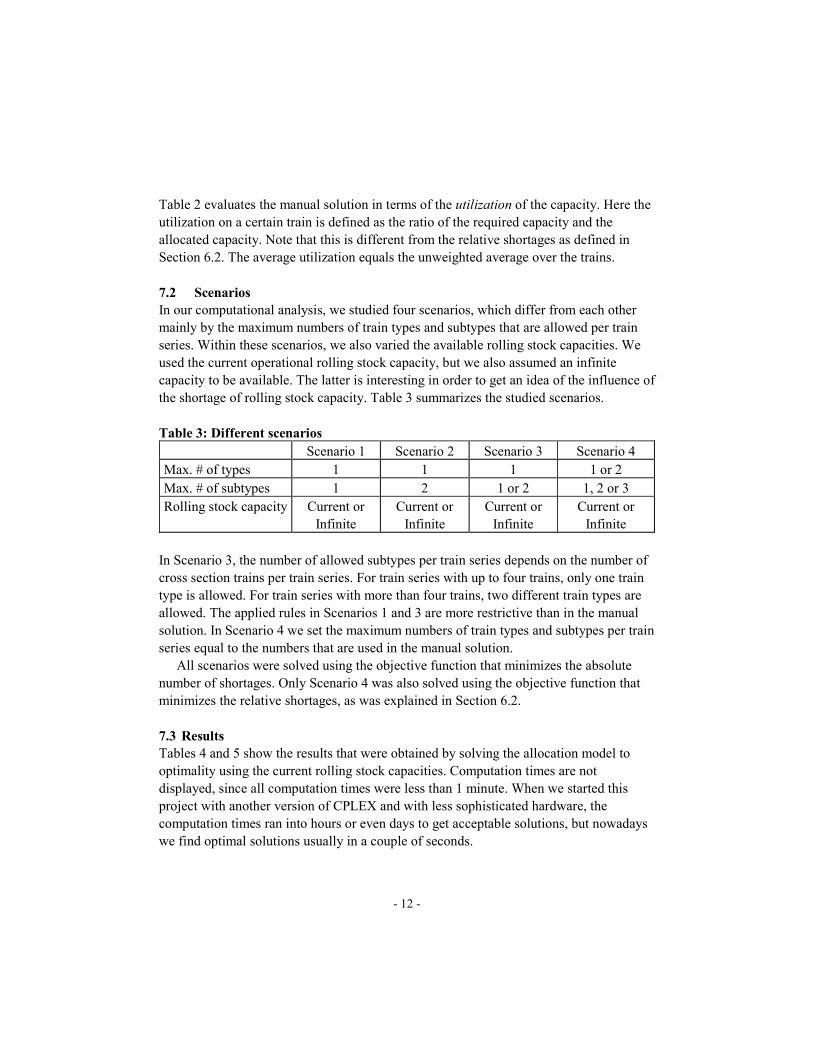
Table 2 evaluates the manual solution in terms of the utilization of the capacity. Here the utilization on a certain train is defined as the ratio of the required capacity and the allocated capacity. Note that this is different from the relative shortages as defined in Section 6.2. The average utilization equals the unweighted average over the trains. 7.2 Scenarios In our computational analysis, we studied four scenarios, which differ from each other mainly by the maximum numbers of train types and subtypes that are allowed per train series. Within these scenarios, we also varied the available rolling stock capacities. We used the current operational rolling stock capacity, but we also assumed an infinite capacity to be available. The latter is interesting in order to get an idea of the influence of the shortage of rolling stock capacity. Table 3 summarizes the studied scenarios. Table 3: Different scenarios Scenario 1 Scenario 2 Scenario 3 Scenario 4 Max. # of types 1 1 1 1 or 2 Max. # of subtypes 1 2 1 or 2 1, 2 or 3 Rolling stock capacity Current or
Infinite Current or
Infinite Current or
Infinite Current or
Infinite In Scenario 3, the number of allowed subtypes per train series depends on the number of cross section trains per train series. For train series with up to four trains, only one train type is allowed. For train series with more than four trains, two different train types are allowed. The applied rules in Scenarios 1 and 3 are more restrictive than in the manual solution. In Scenario 4 we set the maximum numbers of train types and subtypes per train series equal to the numbers that are used in the manual solution.
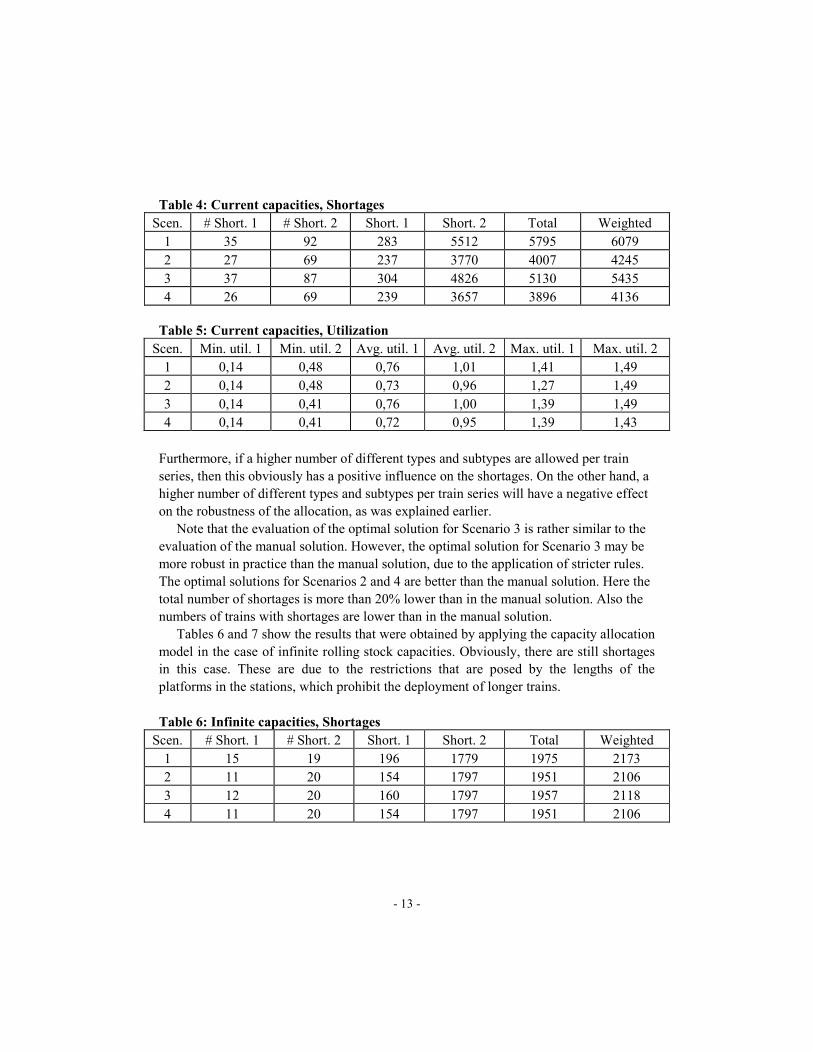
All scenarios were solved using the objective function that minimizes the absolute number of shortages. Only Scenario 4 was also solved using the objective function that minimizes the relative shortages, as was explained in Section 6.2. 7.3 Results Tables 4 and 5 show the results that were obtained by solving the allocation model to optimality using the current rolling stock capacities. Computation times are not displayed, since all computation times were less than 1 minute. When we started this project with another version of CPLEX and with less sophisticated hardware, the computation times ran into hours or even days to get acceptable solutions, but nowadays we find optimal solutions usually in a couple of seconds.
- 13 -
Table 4: Current capacities, Shortages Scen. # Short. 1 # Short. 2 Short. 1 Short. 2 Total Weighted
1 35 92 283 5512 5795 6079 2 27 69 237 3770 4007 4245 3 37 87 304 4826 5130 5435 4 26 69 239 3657 3896 4136
Table 5: Current capacities, Utilization
Scen. Min. util. 1 Min. util. 2 Avg. util. 1 Avg. util. 2 Max. util. 1 Max. util. 2 1 0,14 0,48 0,76 1,01 1,41 1,49 2 0,14 0,48 0,73 0,96 1,27 1,49 3 0,14 0,41 0,76 1,00 1,39 1,49 4 0,14 0,41 0,72 0,95 1,39 1,43
Furthermore, if a higher number of different types and subtypes are allowed per train series, then this obviously has a positive influence on the shortages. On the other hand, a higher number of different types and subtypes per train series will have a negative effect on the robustness of the allocation, as was explained earlier.
Note that the evaluation of the optimal solution for Scenario 3 is rather similar to the evaluation of the manual solution. However, the optimal solution for Scenario 3 may be more robust in practice than the manual solution, due to the application of stricter rules. The optimal solutions for Scenarios 2 and 4 are better than the manual solution. Here the total number of shortages is more than 20% lower than in the manual solution. Also the numbers of trains with shortages are lower than in the manual solution.
Tables 6 and 7 show the results that were obtained by applying the capacity allocation model in the case of infinite rolling stock capacities. Obviously, there are still shortages in this case. These are due to the restrictions that are posed by the lengths of the platforms in the stations, which prohibit the deployment of longer trains. Table 6: Infinite capacities, Shortages
Scen. # Short. 1 # Short. 2 Short. 1 Short. 2 Total Weighted 1 15 19 196 1779 1975 2173 2 11 20 154 1797 1951 2106 3 12 20 160 1797 1957 2118 4 11 20 154 1797 1951 2106
- 14 -
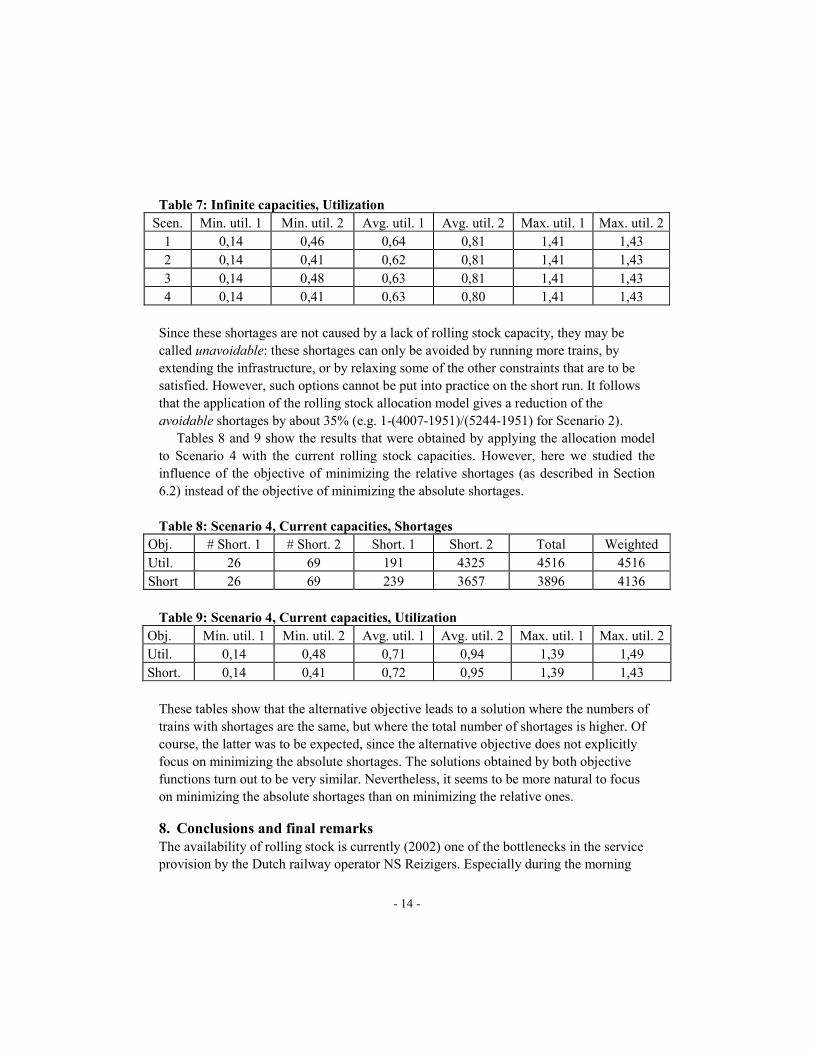
Table 7: Infinite capacities, Utilization Scen. Min. util. 1 Min. util. 2 Avg. util. 1 Avg. util. 2 Max. util. 1 Max. util. 2
1 0,14 0,46 0,64 0,81 1,41 1,43 2 0,14 0,41 0,62 0,81 1,41 1,43 3 0,14 0,48 0,63 0,81 1,41 1,43 4 0,14 0,41 0,63 0,80 1,41 1,43
Since these shortages are not caused by a lack of rolling stock capacity, they may be called unavoidable: these shortages can only be avoided by running more trains, by extending the infrastructure, or by relaxing some of the other constraints that are to be satisfied. However, such options cannot be put into practice on the short run. It follows that the application of the rolling stock allocation model gives a reduction of the avoidable shortages by about 35% (e.g. 1-(4007-1951)/(5244-1951) for Scenario 2).
Tables 8 and 9 show the results that were obtained by applying the allocation model to Scenario 4 with the current rolling stock capacities. However, here we studied the influence of the objective of minimizing the relative shortages (as described in Section 6.2) instead of the objective of minimizing the absolute shortages. Table 8: Scenario 4, Current capacities, Shortages
Obj. # Short. 1 # Short. 2 Short. 1 Short. 2 Total Weighted Util. 26 69 191 4325 4516 4516 Short 26 69 239 3657 3896 4136
Table 9: Scenario 4, Current capacities, Utilization
Obj. Min. util. 1 Min. util. 2 Avg. util. 1 Avg. util. 2 Max. util. 1 Max. util. 2Util. 0,14 0,48 0,71 0,94 1,39 1,49 Short. 0,14 0,41 0,72 0,95 1,39 1,43
These tables show that the alternative objective leads to a solution where the numbers of trains with shortages are the same, but where the total number of shortages is higher. Of course, the latter was to be expected, since the alternative objective does not explicitly focus on minimizing the absolute shortages. The solutions obtained by both objective functions turn out to be very similar. Nevertheless, it seems to be more natural to focus on minimizing the absolute shortages than on minimizing the relative ones. 8. Conclusions and final remarks The availability of rolling stock is currently (2002) one of the bottlenecks in the service provision by the Dutch railway operator NS Reizigers. Especially during the morning
- 15 -
rush hours, many passengers cannot be transported according to the usual service standards. In this paper we therefore described a model that can be used to find an optimal allocation of the available train types and subtypes to the train series, thereby aiming at minimizing the shortages during the morning rush hours. The model was implemented in the modeling language OPL Studio and solved by CPLEX 7.0.
The first experiences with the model were received quite positively. In Scenarios 2 and 4, both the total shortages and the numbers of trains with shortages obtained by the model were significantly lower than in the manual solution. Both the planners and the management of the Logistics department of NS Reizigers were satisfied by the obtained allocations, not only because of the improved quality of the obtained allocations, but also because of the reduction in the throughput time of the planning process that will be enabled by the application of the model. Also the possibility to analyze several allocation scenarios instead of just one is considered as quite useful.
We intend to extend the model in the near future in order to make it even more useful for practical application. In particular, we will focus on train series involving combining and splitting of train units, and we will focus on combining the rolling stock allocation problem for the morning rush hours and the rolling stock allocation problem for the afternoon rush hours into one single model. A further extension of the model may also involve the incorporation of the locomotive hauled carriages.
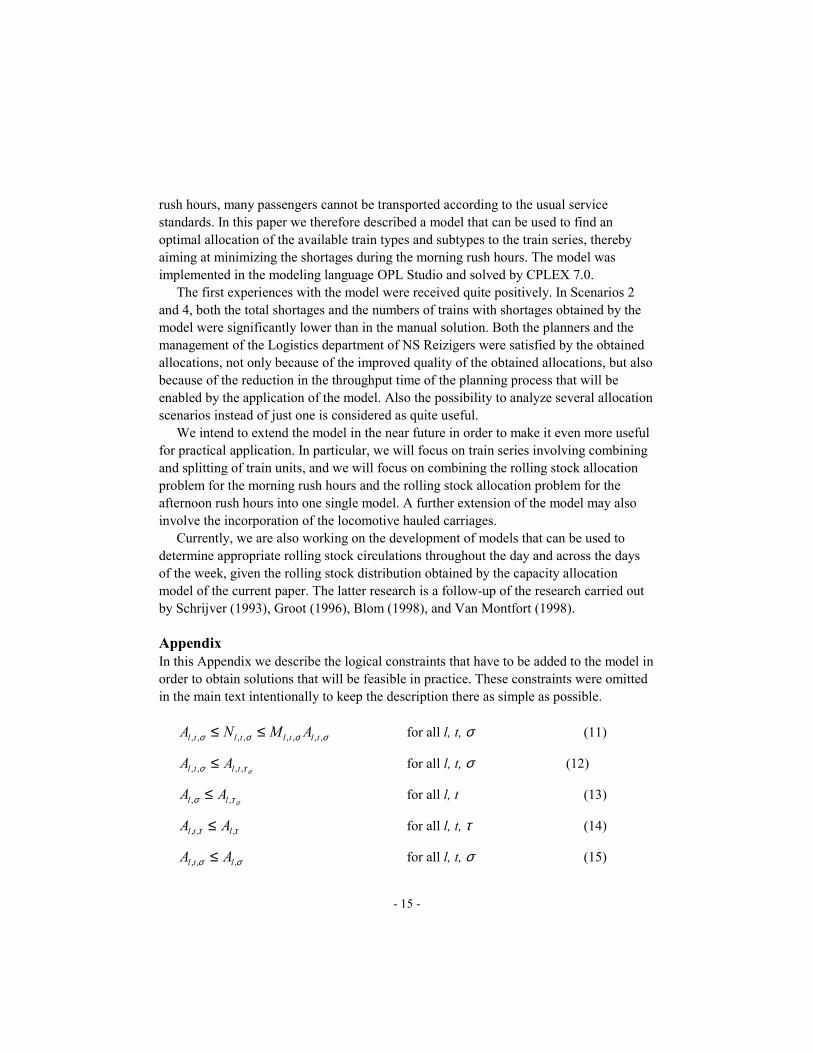
Currently, we are also working on the development of models that can be used to determine appropriate rolling stock circulations throughout the day and across the days of the week, given the rolling stock distribution obtained by the capacity allocation model of the current paper. The latter research is a follow-up of the research carried out by Schrijver (1993), Groot (1996), Blom (1998), and Van Montfort (1998). Appendix In this Appendix we describe the logical constraints that have to be added to the model in order to obtain solutions that will be feasible in practice. These constraints were omitted in the main text intentionally to keep the description there as simple as possible.
σσσσ ,,,,,,,, tltltltl AMNA ≤≤ for all l, t, σ (11)
στσ ,,,, tltl AA ≤ for all l, t, σ (12)
στσ ,, ll AA ≤ for all l, t (13)
ττ ,,, ltl AA ≤ for all l, t, τ (14)
σσ ,,, ltl AA ≤ for all l, t, σ (15)
- 16 -
Here Constraints (11) describe that a positive number of train units Nl,t,σ of subtype σ can be allocated to cross-section train t of train series l if and only if Al,t,σ = 1. Here the parameter Ml,t,σ is a fixed positive upper bound on the number of train units of subtype σ
on train t of train series l. Constraints (12) guarantee that a certain subtype σ can be allocated to train t of train series l only if the corresponding train type τσ has been allocated to that train as well. Similarly, Constraints (13) guarantee that subtype σ can be allocated to train series l only if the corresponding train type τσ has been allocated to that train series as well. Next, constraints (14) specify that train type τ can be allocated to train t of train series l only if this type τ has been allocated to train series l. Constraints (15) have a similar interpretation for the subtypes. Acknowledgements The third author was partly sponsored by the Human Potential Program of the European Union under contract no. HPRN-CT-1999-00104 (AMORE). References Ben-Khedher, N., J. Kintanar, C. Queille, and W. Strainling. Schedule optimization at
SNCF: from conception to day of departure. Interfaces, 28: 6-23, 1998.
Blom, M. Minimum circulation of railway stock on a network, an integer programming approach. Master’s thesis, University of Amsterdam, 1998.
Brucker, P., J. Hurink, and T. Rolfes. Routing of railway carriages. Osnabrücker Schriften zur Mathematik, Reihe P, Heft 205, 1998.
Cordeau, J.-F., P. Toth and D. Vigo. A survey of optimization models for train routing and scheduling. Transportation Science, 32: 380-404, 1998.
Cordeau, J.-F., F. Soumis, and J. Desrosiers. Simultaneous assignment of locomotives and cars to passenger trains. Operations Research, 49: 531-548, 2001.
Groot, R. Minimum circulation of railway stock, an integer programming algorithm. Master’s thesis, University of Amsterdam, 1996.
Montfort, J. van. Optimizing railway carriage circulation with integer linear programming. Master’s thesis, University of Amsterdam, 1997.
Schrijver, A. Minimum circulation of railway rolling stock. CWI Quarterly, 6: 205-217, 1993.