alliances,rivalry,andfirmperformancein ...bus.emory.edu/ram/papers/alliances_chellappa_saraf.pdf ·...
TRANSCRIPT

Information Systems ResearchVol. 21, No. 4, December 2010, pp. 849–871issn 1047-7047 �eissn 1526-5536 �10 �2104 �0849
informs ®
doi 10.1287/isre.1090.0278©2010 INFORMS
Alliances, Rivalry, and Firm Performance inEnterprise Systems Software Markets:
A Social Network Approach
Ramnath K. ChellappaGoizueta Business School, Emory University, Atlanta, Georgia 30322, [email protected]
Nilesh SarafSimon Fraser University, Burnaby, British Columbia V5A 1S6, Canada, [email protected]
Enterprise systems software (ESS) is a multibillion dollar industry that produces systems components to sup-port a variety of business functions for a widerange of vertical industry segments. Even if it forms the core
of an organization’s information systems (IS) infrastructure, there is little prior IS research on the competitivedynamics in this industry. Whereas economic modeling has generally provided the methodological frameworkfor studying standards-driven industries, our research employs social network methods to empirically exam-ine ESS firm competition. Although component compatibility is critical to organizational end users, there isan absence of industry-wide ESS standards and compatibility is ensured through interfirm alliances. First, ourresearch observes that this alliance network does not conform to the equilibrium structures predicted by eco-nomics of network evolution supporting the view that it is difficult to identify dominant standards and leadersin this industry. This state of flux combined with the multifirm multicomponent nature of the industry limitsthe direct applicability of extant analytical models. Instead, we propose that the relative structural positionacquired by a firm in its alliance network is a reasonable proxy for its standards dominance and is an indicatorof its performance. In lieu of structural measures developed mainly for interpersonal networks, we develop ameasure of relative firm prominence specifically for the business software network where benefits of alliancesmay accrue through indirect connections even if attenuated. Panel data analyses of ESS firms that account forover 95% of the industry revenues, show that our measure provides a superior model fit to extant social net-work measures. Two interesting counterintuitive findings emerge from our research. First, unlike other softwareindustries compatibility considerations can trump rivalry concerns. We employ quadratic assignment procedureto show that firms freely form alliances even with their rivals. Second, we find that smaller firms enjoy a greatervalue from acquiring a higher structural position as compared to larger firms.
Key words : technology standards; software industry; enterprise resource planning (ERP); software architecture;partnerships; social network theory; standards competition
History : Vallabh Sambamurthy, Senior Editor; Ram Gopal, Associate Editor. This paper was received onAugust 14, 2007, and was with the authors 8 12 months for 2 revisions. Published online in Articles in AdvanceMarch 17, 2010.
1. IntroductionEnterprise systems software (ESS) represents one ofthe largest software groups with sales exceeding60 billion in 2003 and approximately 100 billionin 2006 (AMR Research—http://www.amrresearch.com). Firms such as SAP, Oracle, and JD Edwardshave emerged as market leaders in this product space.The architecture of enterprise systems comprises of adatabase management system (DBMS) serving as thecentral repository of data, and a group of functionalmodules or ESS components that support business
processes in areas such as production, payroll, supplychain, and human resources (Davenport 1998). Clientorganizations1 purchase these components from oneor more ESS firms (Markus 2000). Despite the com-ponents being acquired from a diverse set of ven-dors, a critical requirement from customers is that the
1 Throughout this article, we use the terms “vendors” or “firms”to refer to producers of ESS components, and we use the term“client organizations” or “organizations” to refer to users of ESScomponents.
849

Chellappa and Saraf: Alliances, Rivalry, and Firm Performance in ESS Markets850 Information Systems Research 21(4), pp. 849–871, © 2010 INFORMS
components work seamlessly with each other to bebeneficial to the user organization. However, there areno dominant open (de jure) or proprietary (de facto)standards to facilitate interoperability between prod-ucts of different ESS firms. Although standardsfor low level communication between informationtechnology components exist, there are no uniformhigh-level compatibility rules to enable plug-n-playbetween products of different vendors (Yang andPapazoglou 2000). Therefore, component compatibil-ity is established only through explicit alliances2 suchas those involving licensing of proprietary applica-tion programming interfaces (APIs), product develop-ment, and release agreements (David and Greenstein1990). Although there have been a number of studiesin information systems (IS) research that have exam-ined the implementation or usage of these systemsby organizations, there is little empirical research thathas examined the competitive dynamics of softwarecompetition.A variety of questions arise as firms develop their
competitive strategies. Currently, there is little priorresearch that studies the formation of alliances inbusiness software industries and the impact of suchalliances on business performance. First, it is not clearif the alliance network is approaching equilibrium,which would be an indication that one (or a few) stan-dards have achieved dominance. Second, althoughfrom a standards point of view it has been commonlyasserted that firms should not engage in allianceswith rivals (Axelrod et al. 1995), we suggest that ESSfirms may not have that luxury due to the multicom-ponent nature of the industry where the likelihood ofrivalry with any firm in this subsector is quite higheither currently, or in the near future. Third, follow-ing the previous point, although alliances can bringperformance benefits due to the resulting product-to-product compatibility, they are not only expensive toinitiate and maintain, but also have the potential tolose customer base to the alliance partner if it alreadyhas a competing module or in the near future whenthe partner can likely launch one. Further perfor-mance benefits of their alliances may accrue to firms
2 Consistent with Gulati’s (1998, p. 293) characterization, we areusing a broad definition of alliances as “voluntary arrangementsbetween firms involving exchange, sharing or codevelopment ofproducts, technologies or services.”
through both direct and indirect connections. Finally,an interesting question is if all firms stand to gainin the same manner from alliances, or if firms of acertain size are more uniquely positioned to betterextract overall alliance benefits.In several manufacturing sectors or other physi-
cal service industries alliances are generally consid-ered to be “supply-side” motivated, i.e., a way toacquire resources (Das and Teng 2000, Eisenhardtand Schoonhoven 1996), e.g., in airlines, logistics,and automobile sectors. However, in most economics-based literature on software industries the centralpremise is that alliances are mostly “demand-side”motivated. That is, the primary (if not only) reasonfor a vendor to form alliances is to signal to the clientorganizations that its products are compatible withmany other products and to actually maintain a highdegree of compatibility. Indeed, we see that even plat-form leaders such as SAP, Oracle, and Microsoft, whohave a great amount of required supply-side resourcesengage in alliances for the purposes of componentinteroperability with other vendors. It is however notclear if alliances are generally as beneficial such asin the airline sector where code-sharing alliances areformed to satisfy unserved sectors (Brueckner 2001,Morrish and Hamilton 2002), or in the semiconductorindustry where costly technological knowhow is a rea-son for interfirm partnerships (Appleyard 1996, Hartand Estrin 1991).Barring some recent exceptions (Chen and Forman
2006, West and Dedrick 2000), prior research in IShas largely ignored market level dynamics of systemsvendors and focused more on corporate implemen-tation of enterprise systems. Similarly, whereas theimpact of maintaining compatible standards on firmperformance has been studied by analytical models ineconomics (Economides 1989, Matutes and Regibeau1988), the dyadic models considered in these fieldsare limited in their applicability to the ESS industrywhere there is a network of relationships. Thus, thereis a paucity of empirical work in this area. We addressthese gaps in prior research by using social networkanalysis (Nohria and Eccles 1992) to better representthe competitive and alliance dynamics of ESS firms.From a technology standpoint, a focal ESS firm’s
decision to form alliances with selective other firmsis of strategic importance, as “� � �market selection
Chellappa and Saraf: Alliances, Rivalry, and Firm Performance in ESS MarketsInformation Systems Research 21(4), pp. 849–871, © 2010 INFORMS 851
and incremental innovations induce each firm to con-verge towards the dominant standard and less adap-tive firms are pushed out of the market,” (Antonelli1994, p. 204). In the ESS industry, alliances not onlyserve to accomplish technical compatibility, but theyare also critical in enhancing the compatibility percep-tions of the organizational end users. These percep-tions are created and maintained by social interactionsamong alliance partners during joint conferences,trade shows, and training sessions that result inknowledge exchange among the partnering ESS firms,the implementation consultants, and other third par-ties. These perceptions are important in that clientorganizations require compatibility between compo-nents; by hosting such conferences ESS firms directlyinfluence consultants (who are typical attendees ofthese conferences, and primary sales channel part-ners) and also client-organizations. Thus, vendoralliances help satisfy the demand-side need for com-patibility. These perceptions can also be interpreted asa form of indirect network externality (Gupta et al.1999) wherein the utility of product to a consumerincreases with the number of other products the focalproduct is compatible with. In other words it pro-vides the consumer with a greater number of productoptions.Our thesis is that although firms incur costs of form-
ing and maintaining an alliance with a direct part-ner, they gain access to social and technical resourcesthrough their ties with both directly and indirectly con-nected partners. Thus, central to our paper is the argu-ment that because firms form alliances with multiplepartners who form further partnerships, any perfor-mance benefits from standards-related network exter-nalities should be studied in the context of the entirealliance network rather than by individually examin-ing the multiple dyadic partnerships. Therefore, weadapt from prior literature a structural measure of firmprominence3 that takes into account both, directly andindirectly connected partners while suitably attenuat-ing the flow of network benefits to a focal from otherfirms as the network distance between them increases.The data for our empirical analyses is drawn
from multiple sources including a business software
3 We use the terms “status” and “prominence” interchangeably torefer to a firm’s structural position in this paper.
trade group’s publications, Mergent Online companydatabase, Security and Exchange Commission fil-ings, Gale Group database, and OneSource BusinessBrowser. The final list of firms, component markets,and alliances was then vetted by a manager and seniormanager at Ernst & Young (now Cap Gemini Ernst &Young) for industry inputs. We employ two statisticalmethods. First, we employ the quadratic assignmentprocedure (QAP) commonly used in social networkanalysis. It is a resampling based method, for calcu-lating the correct standard errors in network data. Weuse it to examine the relationship between rivalry andalliance formation. Second, we performed a panel dataanalysis to examine the relationship between networkstructural measures (both extant and our own derived)and firm performance.The paper is organized as follows. In §2 we dis-
cuss the appropriateness of social network methodsfor this context and proceed with hypotheses develop-ment motivated by prior research. Section 3 describesthe data and measures used in the study along withthe results of the exploratory and confirmatory anal-yses. In §4 we present a discussion of our resultsalong with their implications and avenues for furtherresearch.
2. Framework to StudyStandards-Driven IT Industries
Literature on competition in standards-driven indus-try is somewhat limited in IS research; however, thereis a significant amount of work done in this areain economics. For example, this research has stud-ied the early VCR industry where VHS emerged asthe winning standard (Grindley 1995), and the oper-ating systems markets where multiple separate stan-dards such as Unix, Windows, MacOS, etc. continueto coexist (Axelrod et al. 1995). The main emphasisof these models is on the accumulation of external-ity benefits, either by adopting a common standardor by constructing adapters to enable compatibilitywith competing products. Along these lines, Katz andShapiro (1985) have argued that in a duopoly, firmswith small user bases have strong incentives to maketheir products compatible with products of firms withlarger user bases, and later work extends this find-ing to markets with multiple firms and components
Chellappa and Saraf: Alliances, Rivalry, and Firm Performance in ESS Markets852 Information Systems Research 21(4), pp. 849–871, © 2010 INFORMS
(Economides 1989). Generally, the analytical modelsconclude that it is beneficial for a firm to adoptthe leading or dominant standard. However, thereis little or no empirical support for most of theseconclusions. Furthermore, prior works also acknowl-edge that when there are no explicit leading stan-dards, the applicability of these models becomessomewhat limited (Economides 1989, p. 1184). Thusalthough analytical models have been the preferredmode of studying firms facing standards-related deci-sions, their appropriateness for empirically studyingESS firms is limited thus requiring the exploration ofalternative methods.The relationship between standards and alliances
was first suggested by Saloner (1990) who observedthat implicit and explicit alliances can facilitate thedevelopment of common standards ensuring productcompatibility. Whereas this study still argued at thefirm-dyad level, another study on software standards(Axelrod et al. 1995) examines standard coalitions andcompetition between them. This work also acknowl-edges that using economic models such as conven-tional game-theoretic analysis to empirically studycomplex alliance compositions is “especially diffi-cult because payoffs for each firm depend upon thechoices made by all other firms” (p. 1497); althoughan important assertion in this study is that firms willavoid rivals in forming coalitions. In the ESS industryalthough there are no distinct coalitions,4 firms indeedform alliances with multiple partners leading to a net-work of alliances. Thus although there is a need toabstract and capture a firm’s competitive positioningwithin the network, lack of distinct coalitions doesnot allow us study group competition, rather there isstill a need to characterize an individual ESS firm’srelative power vis-à-vis other ESS firms.Just as one approach to analyzing firm behav-
ior in markets is through economic paradigms,theories from social sciences such as economic soci-ology (Walker et al. 1997), and actor network the-ory (Monteiro 2000) are also increasingly employed to
4 A preliminary clique analysis of the alliance network throughUCINET confirms this. For example, in a two-path length analysis,three firms (SAP, Microsoft and Oracle), are members of a major-ity of cliques, i.e., these three firms are never more than two pathlengths away in a majority of the cliques. There is great common-ality amongst the cliques.
represent complex social, economic, and technologicalperspectives (Chellappa and Saraf 2000, Fomin andKeil 2000). ESS firms achieve compatibility by form-ing alliances and because they form multiple alliancepartnerships we employ a social network approach tostudy both the strategic behavior regarding allianceformation as well as the resulting impact on firm per-formance. Thus, a richer and more suitable approachto study the ESS industry is through the use of meth-ods developed in social network analysis.
2.1. Using Social Network Theory to Studythe ESS Industry
Social network theory has typically been used to studya set of individuals with links between them repre-senting specific social ties, including interaction ties(Contractor et al. 1996), friendship ties (Zeggelinket al. 1996), and marital ties (Padgett and Ansell 1993).Research in organizational behavior, human commu-nication, and computer-mediated communication hasalso adapted this approach to study networks of mem-bers within an organization (Barley 1990). Most of thisearly work in social networks focused on within-firmissues where the actors typically represent employ-ees and the relationship linkages were enclosed withinthe boundaries of the particular organization. Duringthe last decade, the social network metaphor pro-posed earlier by Tichy et al. (1979) has been consider-ably extended to analyze market level behavior wherelinkages in the network represent various types ofrelationships between firms (Ahuja 2000). For exam-ple, such networks have been used to study pricingstrategies of investment banks (Podolny 1993), powerrelations between corporations and investment banks(Baker 1992), and niche overlap in a patent citationsin the semiconductor industry (Podolny et al. 1996).More recently, IS research has also begun to employsocial network theory, e.g., to study virtual groups(Ahuja and Carley 1999) and electronic networks ofpractice (Wasko and Faraj 2005), albeit at the individ-ual level.Whereas one goal is to realistically represent the
alliance structure in the ESS industry, our objective isalso to empirically consider the net value to an ESSfirm from such alliances and its overall effect on thefocal firm’s performance. Social network research pro-vides a number of structural measures, particularlymeasures of status (Burt 2000), that serve as a useful

Chellappa and Saraf: Alliances, Rivalry, and Firm Performance in ESS MarketsInformation Systems Research 21(4), pp. 849–871, © 2010 INFORMS 853
starting point to capture the relative net value fromalliances. The ESS alliance network has firms as itsnodes and linkages representing the alliances betweenthem. The main theses of our research is that firmsaugment their status by virtue of their alliances; and ifthis status or (relative) firm prominence can be appro-priately computed based on the mechanics in the ESSindustry, it will serve as a performance indicator.The theoretical basis for linking a network measure
and firm performance stems from other models of net-worked firms (Podolny 1993), wherein the prominenceof an actor or node is determined by linkages withother firms. There are two competing views of net-works, the pipes and prisms views (Podolny 2001).Although the former is a more common view of net-works in early research, the latter is finding increasingacceptance in recent sociological research on markets,“In this second view, a tie between two market actorsis not only to be understood as a pipe conveyingresources between those two actors; in addition, thepresence (or absence) of a tie between two marketactors is an informational cue on which others rely tomake inferences about the underlying quality of one orboth of the market actors” (Podolny 2001, p. 34). In astudy of investment banks, Podolny (1993) shows thatsyndicate relations between these banks may not onlylead to resource transfers but that the relationshipsmay provide some basis of status ordering to othermarket actors such as corporate issuers and investors.He goes on to suggest that others may rely on theseinformational cues from a focal actor’s pattern of rela-tions to make inferences on the quality of the focalactor. We draw upon this prism interpretation for char-acterizing alliance networks in the ESS industry.In the ESS alliance networks as well, along the
lines of other industries, there is a potential for accessto knowledge, technological capabilities, newer mar-kets, production know-how, research and develop-ment (R&D) joint ventures, etc. (Liebeskind et al. 1996,Walker et al. 1997). However, our research suggeststhat the significance of alliances lies in signaling stan-dards dominance where consumers can make infer-ences about the overall component compatibility ofthe focal actor. Podolny (2001) suggests that in suchprism views of networks status indicators such as cen-trality measures enumerate the significance of a net-work rather than structural holes (Burt 1992). Further-more, for reasons discussed later in this section, we do
not adopt an extant measure as is but develop a spe-cific prominence measure that accurately captures thesignificance of linkages for our particular context, theESS industry. However, we shall first examine allianceformation itself so as to understand the selectiveness(or lack thereof) of alliance-partner choices.
2.2. Strategic Issues During Alliance FormationWhereas the impact of alliances on partnering firmshas been often examined, recent literature notes thatprior research has often ignored the important ques-tion of how alliance partners are selected (Chung et al.2000). Any complexity in alliance partner selection isonly exacerbated in the ESS industry; multicompo-nent firms are more likely to be rivals and althoughalliances are costly to initiate, absence of uniform stan-dards means that alliances are the key way a firm canmake its components compatible. It has been assertedthat in the software industry rivalry is avoided whenstandards coalitions are set up (Axelrod et al. 1995).Indeed literature on alliance success suggests that fail-ure can occur from rivalry as it can act as a destabiliz-ing characteristic within an alliance (Park and Ungson2001). One underlying logic is a game theoretic expla-nation wherein it has been suggested that a prisoner’sdilemma problem (where in firms have an incentiveto deviate from institutional rules) might emerge inalliances between rivals (Parkhe 1993). Thus the collec-tive benefit of an alliance might be foregone for indi-vidual performance gains leading to the failure of analliance with rivals.The most important argument against forming
alliances with rivals comes from the resource-basedview of the firm. Alliance with a rival was seenas a way to internalize partner skills (Hamel 1991),and in fact such alliances are reported to have beenthe cause of erosion of U.S. firm’s resource basesand competitive advantages to Japanese alliance part-ners (Mankin and Reich 1986). In another theoreticalwork (Khanna et al. 1998) it has been suggested thatthe impact of rivalry on rival partners needs to beaccommodated particularly when considering learn-ing alliances. This is consistent with the results of astudy on a multi-industry sample of alliances, whichfound a reduction in knowledge transfer in alliancesbetween rivals (Mowery et al. 1996). Thus some extant
Chellappa and Saraf: Alliances, Rivalry, and Firm Performance in ESS Markets854 Information Systems Research 21(4), pp. 849–871, © 2010 INFORMS
alliance research might make a strong case that ratio-nal firms will avoid alliances with rivals.Although it is true that ESS firms might also pre-
fer not to provide any advantages to their rivals, inthe absence of an explicit alliance and industry-wideopen standards, an ESS firm’s potential customer basewould be reduced to only those customers that havealready implemented components from the focal firm.For example, for PeopleSoft’s human resources mod-ule to be appealing to customers who do not havePeopleSoft components for financials, accounting andother business components, an alliance between Peo-pleSoft and these companies becomes essential. Infor-mal interviews with ESS vendors also highlighted thepredicament of choosing a competitor as an alliancepartner but they uniformly expressed the view thatthis did not necessarily deter their alliances with them.This implies that i2 Technologies may have an incen-tive to form an alliance with PeopleSoft even if theyhave many software components in common. BecauseESS firms operate in the same strategic segments, theyare likely to have high similarity in terms of theirknowledge bases (Cohen and Levinthal 1990). There-fore, alliances enable transfer of highly specific knowl-edge related to product interface designs, customers,and more generally about their technological trajec-tories. In the absence of alliances such exchanges arenot possible and rivalry considerations might put upa weak opposition to alliance benefits in this industry.Literature in technology innovation and dominant
design also provides some insights into alliances inhigh-technology industries. This work provides anunderstanding of the process through which a certaintechnology might become dominant (Henderson andClark 1990, Suarez and Utterback 1995), and suggeststhat firms invest their resources so as to align withdominant technological designs, and competenciesare acquired through exchange of knowledge basesand by aligning information processing structures.Alliances allow vendors to extend their influencethroughout the industry and from a technology view-point it provides a bigger “functionality footprint”implying that the focal firm’s technical architecture islikely to become embedded in the directly as well asindirectly connected partner’s products. Thus in thisindustry it could be argued that a combination of user-driven compatibility needs and the possibility of prop-agating one’s own technical architecture overwhelms
any rivalry considerations in alliance formation. Gen-erally, literature on alliances suggests avoidance ofrivals, however under special circumstances such asin the absence of a dominant firm and a single obvi-ous technology, the creation of implicit and explicitalliances among rivals or potential rivals is a dis-tinct possibility (Saloner 1990). Indeed Chan-Olmstedand Jamison (2001) argue that in many technologicalrealms where competition in one area spills over toanother, cooperation with rivals may be a necessity.Rivalry manifests itself in two market dimensions:
first, the commonality in the software componentmarkets; and second, the commonality in the differ-ent vertical industry segments for which these com-ponents are offered. Thus we examine the rivalryalong both these dimensions in studying the choice ofalliance partners.
Hypothesis 1. Extent of rivalry is unlikely to impactthe choice of an alliance partner for an ESS firm.
Alliances in this industry are driven by the demand-side need for compatibility amongst software compo-nents, in the absence of explicit common standards.The question therefore is if a firm should simply formalliances with as many firms as possible to signal com-patibility with all products in the market? Or is there amanner in which overall benefits accrue thus helpingfirm performance? To answer these questions we firstexamine the alliances linkages and benefits flow in theESS industry.
2.3. Alliances and Firm PerformanceAlliances in the ESS industry are explicitly initiatedfor the purpose of managing technological compati-bility. These result in both technical compatibility andperceptions of compatibility to client organizations.We call the latter social compatibility. Technical com-patibility results when the partners align their prod-uct interface designs at the data, application, andbusiness process levels (Yang and Papazoglou 2000).Economic models of standards competition primarilydescribe technical compatibility as providing accessto user bases of partners (Katz and Shapiro 1985,Matutes and Regibeau 1988). Performance benefitsfrom technical compatibility have been documentedin both economics and IS literature (Brynjolfsson andKemerer 1996, Kaufman et al. 2000). Social compati-bility between two vendors represents the presence
Chellappa and Saraf: Alliances, Rivalry, and Firm Performance in ESS MarketsInformation Systems Research 21(4), pp. 849–871, © 2010 INFORMS 855
of human skills, in terms of expertise of third-partyintegration vendors, consultants, and implementerstrained in integrating components from the two ven-dors. Thus higher social compatibility between twovendors signals a lower cost of integration of theircomponents to the marketplace. Alliance partnersalso engage in joint presales efforts, technical confer-ences, and trade shows where third party integratorsand consultants get to learn about custom integra-tion through middleware technologies (McKeen andSmith 2002). Thus social compatibility resulting fromalliances serves to also increase the market’s percep-tion of compatibility between alliance partners. IS lit-erature also espouses the notion of soft IT skills orhuman IT skills (Bharadwaj 2000), which underlieIT-based competitive advantage of firms (Boynton1994). Our concept of social compatibility builds onthis dimension wherein through alliances firms canenjoy alliance partners’ soft-skill resources. Interest-ingly, because literature in economics only considersan adoption of standards rather than formation ofalliances, the increased perception of compatibility tothe market is generally ignored. Indeed the nontech-nical advantages of alliances such as access to soft-skill resources have to be separately modeled, oftenthrough adapters (Matutes and Regibeau 1988).Our theses is that if a vendor has a greater user base,
better technology, or a higher reputation, its alliancepartner is likely to benefit from its linkage with thefocal firm due to both higher technical and social com-patibility. Prior social network literature also clearlydistinguishes between resources themselves and theability to obtain them by virtue of memberships in dif-ferent social structures (Portes 1998). Thus actors canattain a certain “status” or “power” or “prominence”by virtue of their alliance choices that determines theirstructural position in the alliance network. We use thedefinition of status (or prominence) as in Knoke andBurt (1983): “An actor is prominent if the ties of theactor make the actor particularly visible to the otheractors in the network” (p. 172). In the ESS industry,prominence captures the relative power of the prod-uct standards of the focal firm. Prominent firms aremore selective in their partnerships as they are keen onavoiding any dilution of their reputation and are oftenstricter in enforcing quality standards (Stuart et al.1999). To form an alliance with a partner of higher
prominence, the focal firm may have to invest inupgrading its own technology, and develop additionalcapabilities that are complementary and useful to part-nering firms, e.g., hiring a high profile CIO, engagingin high-profile advertising or developing relationshipswith specific consultants and implementers. To exploitand sustain the opportunities afforded by relation-ships with partner firms, organizations also have toinvest in continuous learning mechanisms (Metcalfeand Miles 1994). These costs are in addition to thedirect costs of licensing fees and the cost of incorporat-ing the partnering firms’ technologies. Typically, dom-inant firms continually adapt newer technologies andthey expect their smaller alliance partners to rapidlyfollow the technological trajectories set by them. Attimes it may also require partner firms to invest injointly sponsoring user conventions, trade shows, etc.Thus, these costs not only include the cost of makingproduct interfaces compatible (maintaining technicalcompatibility) but also include the cost of maintainingthe market’s perceptions of compatibility with alliancepartners (social compatibility).Client organizations not only implement compo-
nents from ESS firms that have partnerships, but theyalso purchase and implement components from unre-lated firms. This is particularly true of client orga-nizations that are multinational and where decisionmaking is often decentralized. This implies that if athird ESS firm is compatible with a direct partnerof a focal firm, then the third firm’s components arelikely to be more compatible with the focal firm ascompared to the components of a completely uncon-nected firm. Thus product bundling across differentcomponent makers can provide further market accessto even indirect affiliates. The prism view of networks(Podolny 2001, p. 35) suggests that the pattern ofexchange relationships in which a firm engages “isnot only relevant because of the resources that flowbetween firms but also because of how the patternof those resource flows affect the perceptions of thirdparties.” Such perceptions are related to “altercentricuncertainty,” one where client organizations may beuncertain of firms’ product compatibility. As long asthere is some form of uncertainty in this dimension,status becomes relevant in a market.There are two fundamental aspects of status or
prominence acquisition; status in these markets is a
Chellappa and Saraf: Alliances, Rivalry, and Firm Performance in ESS Markets856 Information Systems Research 21(4), pp. 849–871, © 2010 INFORMS
signal of quality (or compatibility and technologicaldominance) and therefore firms will be exclusive intheir choice of partners. Second, there is also a consen-sus among network scholars that prominence shouldbe measured by looking not only at the direct or adja-cent links but also indirect paths involving intermedi-aries (Marsden and Friedkin 1993). At the same timeit has also been suggested that indirect ties are oftenmediated by the intermediate relationships (Holmet al. 1999, p. 475). Thus, although firms may notincur the actual cost of an indirect connection, benefits(both real and perceptual) may be available throughthese indirect linkages because of the partners theyhave chosen. We summarize these characteristics ofESS alliances vis-à-vis the development of a promi-nence metric in the appendix.In other words, by virtue of its direct and indi-
rect linkages, an ESS firm can be understood to haveaccess to an aggregate network resource that we callthe sociotechnical capital of the firm. Unlike in eco-nomic models, this is simply not a sum of user bases;this term is derived from an umbrella concept called“social capital” that is understood to be the sum ofresources accruing to an individual or group by virtueof their location in the network of their more or lessdurable social relations (Adler and Kwon 2000). Thisresource is not a substitute for intrinsic capabilityand exogenous to the network; rather it is a comple-ment to these exogenous abilities of the firm (Portes1998). Note that a difference in the ESS context is thatsuch resources are not merely supply-side resources,rather the primary network resources are acquiredthrough the compatibility gains from the client orga-nizations and the resulting benefits to the ESS firms.There are many measures that operationalize the netrelative status or prominence acquired by an actorby virtue of access to social capital (Burt 2000). Thesimplest way to capture prominence in an alliancenetwork is to directly use the number of alliancesformed by and with the focal firm, called out-degreesand in-degrees, respectively (Freeman 1978). However,because these simplistic measures do not capture theinfluence of indirect ties, Freeman’s (1978) closenessand betweeness measures have been used (Ibarra andAndrews 1993) to measure the structural position ofan actor. These still face limitations in that they do notweigh influences from other actors by their structural
position. Therefore, in order to accommodate theunique characteristics of ESS alliance networks, wherewe can consider direct benefits and costs as wellas attenuated indirect benefits, we adapted our ownstructural measure of centrality using Braun (1997)and Bonacich (1987). The derivation of our promi-nence measure is described in the appendix and spe-cific differences between Bonacich’s (1987), and oursis discussed in the online appendix.5
Prior research that employs social network methodssuggests prominence in alliances results in betterperformance in many different industries. As dis-cussed earlier, these are generally from supply-sidefirm transfers, e.g., preferential treatment from sup-pliers and higher returns from quality (Benjamin andPodolny 1999), better access to specialized knowl-edge, R&D resources, etc. (Podolny et al. 1996). Wesuggest that an ESS firm with a high status in thenetwork of alliances is most attractive to client orga-nizations and hence is likely to perform better than alower status counterpart. Hence we propose the fol-lowing hypothesis.
Hypothesis 2. The performance of an ESS firm isrelated to its prominence within its network of directly andindirectly connected partners.
Firm size is an indicator of a firm’s internalresources, and it is generally supposed that smallfirms will be less able to appropriate benefits ofalliances than their larger counterparts. An obviousrisk is the encroachment of a smaller firm’s market bya larger firm. A more long-term risk is when a largerfirm, once it has acquired know-how of the smallerfirm, begins to charge a premium for licensing andother relationships over time (Henderson and Clark1990). More recently, a study by Lavie (2007, p. 1189)argues that even in software “alliances with well-endowed partners may in fact undermine the mar-ket performance of firms.” The reasoning behind thisargument is that although alliances between large andsmall firms can create overall value to the alliance,value appropriation becomes the forte of the largerfirm due to bargaining power. So evidently it is criti-cal to distinguish between the network resources from
5 Additional information is contained in an online appendix to thispaper that is available on the Information Systems Research website(http://isr.pubs.informs.org/ecompanion.html).

Chellappa and Saraf: Alliances, Rivalry, and Firm Performance in ESS MarketsInformation Systems Research 21(4), pp. 849–871, © 2010 INFORMS 857
alliances and the relative power of partners in thatportfolio (Bae and Gargiulo 2004). Others (Hagedoornand Schakenraad 1994, p. 300) have also suggestedthat large firms are in a better position to extract valuefrom alliances where, “although firms of all sizes willoccasionally be engaged in a process of restructur-ing, in particular large firms are more suited to chan-nel their restructuring activities through joint venturesand other forms of interfirm cooperation.”On the other hand, resource dependence theory
(Pfeffer and Salancik 1978) suggests that it is thelarge firms that are more dependent on alliances thansmall firms when it comes to technological alliances.It has been argued that “Larger firms usually seekout smaller, innovative firms for their technologicalknow-how. Therefore, the relative bargaining powerof the small partner in a strategic alliance, and espe-cially in a technological alliance, will be significantlyhigher than that of the large partner,” (Das et al. 1998,p. 31). In fact from a management of alliances perspec-tive, literature suggests that small firms can not onlyrespond to market opportunities more quickly thanlarger firms, they are also more effective than theirlarger counterpart in managing alliances. Hoang andRothaermel (2005) suggest that although small firmsgenerally have one top-level manager to take respon-sibility for all of their alliances, the organizationalcomplexity of large companies makes it difficult forthem to collectively share know-how acquired fromalliances or to capitalize on the market access pro-vided by their partners. Although this work studiesthe pharmaceutical industry, the authors note that thefindings are particularly applicable to other alliance-heavy technology industries such as the ESS indus-try. The organizational complexity of large firms is anobstacle to exploiting scope advantages, whereas forsmall firms alliances help them to offset their scaleand scope disadvantages (Sarkar et al. 2001).Thus extant research clearly differs on whether
large or small firms are better suited to extract valuefrom alliances, and who benefits most from alliances.In Hypothesis 2, we had suggested that all firms bene-fit from forming alliances and increasing their promi-nence. However we argue that smaller ESS firmsstand to gain more from their alliances than theirlarger counterparts if they strategically raise theirprominence by increasing the number of partnerships
they form or by ensuring that these are with higherstatus firms. Note that our main thesis is ESS firmsgain from internalizing the perceived and true com-patibility on the client side. Because an importantway in which a smaller firm acquires prominence isthrough alliances with other prominent firms, it hasa relatively higher opportunity to appeal to a largerbase (by virtue of its partnership with other firms)than a larger firm has (because the smaller firm beginswith a smaller intrinsic base). This argument findssome support from a study of networks involving sta-tus transfer where young and small firms are knownto benefit more from large alliance partners than doold and large organizations (Stuart 2000). Thereforewe have the following hypothesis.
Hypothesis 3. The impact of network prominence onfirm performance is greater for smaller firms.
3. Methods and ModelsIn this section, we shall first describe the unique dataset used in this study along with the constructionof measures. But before we empirically analyze thisdata to test our propositions, we first provide a visualdescription of the network data so as to underscorethe alliance dynamics at work in this industry.
3.1. DataWe collected data from two independent sources;our first source is an unbiased (not related to anyESS firm or user organization) industry group (ReedElsevier Inc.) that employed a consulting organizationto collect revenue and other information for nearly acomplete set of ESS firms to be included in its pub-lication (MSI index and newsletter). Because most ofthe firms in the ESS industry are privately held firms,the only way to acquire revenue, component mar-kets competed in, and other information is to directlysolicit this information from the firms. To this end,the consulting organization sends out a survey everyother year to collect this information and nearly allESS firms (big and small) participate in this survey.Although the term “survey” is used, it is actually areporting of factual numbers from the top 100 firms inthis field, i.e., the survey does not include subjectiveor perceptual questions. The list of firms, to whom thesurvey is sent to, is compiled by a group of consul-tants who are highly experienced professionals in the
Chellappa and Saraf: Alliances, Rivalry, and Firm Performance in ESS Markets858 Information Systems Research 21(4), pp. 849–871, © 2010 INFORMS
industry. Over the three time periods considered inour research, the actual sample consisted of only 97,98, and 95 firms (even if it is a Top 100 list) becausethere was incomplete data from a few firms.Although this data source provides much of the re-
venue and product portfolio information of ESS firms,additional elements such as firm size and allianceshad to be acquired from other independent sources.These include Mergent Online company database,Security and Exchange Commission filings, GaleGroup database, and OneSource Business Browser;we compared the information from the primary datasource with publicly available ones and found nodiscrepancy.Data on alliances was gathered through a formal-
ized process. First, we collect the list of partnersfrom a focal firm’s business website (on an ongo-ing basis and updated for each time period). Second,for public firms we had a research assistant comparethis list with formalized agreements announcements(available on public databases such Lexis-Nexis andMergent). Partnership data on websites of most ESSvendors is reported under the label of “Partners” or“Complementary Software Providers” and most part-nerships were accompanied by a release that couldbe verified through Lexis-Nexis. Each firm in the listwas contacted over telephone by a revolving groupof research assistants over the data collection period.Once this list was drawn, it was compared with amanager and senior manager at Ernst & Young (nowCGEY) who have extensive knowledge on the part-nerships between ESS firms because they implementmost of these modules. Implementation consultantshave a list of firms that have entered into formal-ized agreements as it is critical to component compat-ibility and application programming interface (API)information. For some private firms, follow-up phonecalls were necessary to confirm that online informa-tion was up to date. We were able to verify this infor-mation with CGEY for the first two time periods, forthe third period we had to rely largely on our researchassistants’ expertise as our contacts had left the firm.To the best of our knowledge this is a comprehen-sive list, as there are no secondary data sources thatmaintain this information.Alliances are time-bound agreements (usually re-
lated to software versions), and firms update this
information. In our context, an alliance refers toany formalized interorganizational arrangement thatincludes basic technology licensing agreements to jointresearch and development. This abstraction is alsoconsistent with Gulati’s (1998), who defines strategicalliances as “voluntary arrangements between firmsinvolving exchange, sharing or co-development ofproducts, technologies or services” (p. 293). As perour coding scheme, whenever an ESS firm had analliance with another firm in the list of vendors weassigned that as a “one” in our alliance matrix. Notethat whereas a few firms categorize the type of alliancepartnerships, most do not; and even those that docategorize are not consistent with each other in thedefinition of their categories. However, when a part-nership is initiated by a focal firm it is not alwaysnecessary that the partner firm also announces thispartnership even though products from both firms arecompatible. For example at times Firm A initiates apartnership with Firm B and then Firm A announcesthat it is Firm B compatible. Firm B on the other handmay make no announcement at all. However, irre-spective of who initiates and declares the partnershipproducts of both firms are now considered compatiblein the marketplace. Implementation consultants co-pitch these products once such announcements havebeen made. We also code these differences as partner-ships initiated by and with the focal ESS firm.Firms compete in a number of different software
component markets, e.g., enterprise resource plan-ning; customer relationship management; advancedplanning and scheduling; supply chain planning;transportation; and logistics, business intelligencemodules. In addition these firms also customize theirgeneric products for specific vertical industry seg-ments, e.g., aerospace and defense, automotive, con-sumer packaged goods, electronics and computerindustry, food and beverages, pharmaceuticals, ser-vice parts, etc. The information about the specificcomponents was acquired from a combination of theabove-mentioned sources. Note that these categoriza-tions are part of the MSI Index. Overall, we have datafor three time cross sections between 1999 and 2003for an initial panel of 69 ESS firms with a total of 182usable observations.

Chellappa and Saraf: Alliances, Rivalry, and Firm Performance in ESS MarketsInformation Systems Research 21(4), pp. 849–871, © 2010 INFORMS 859
3.2. Descriptive and Visual Analyses ofNetwork Data
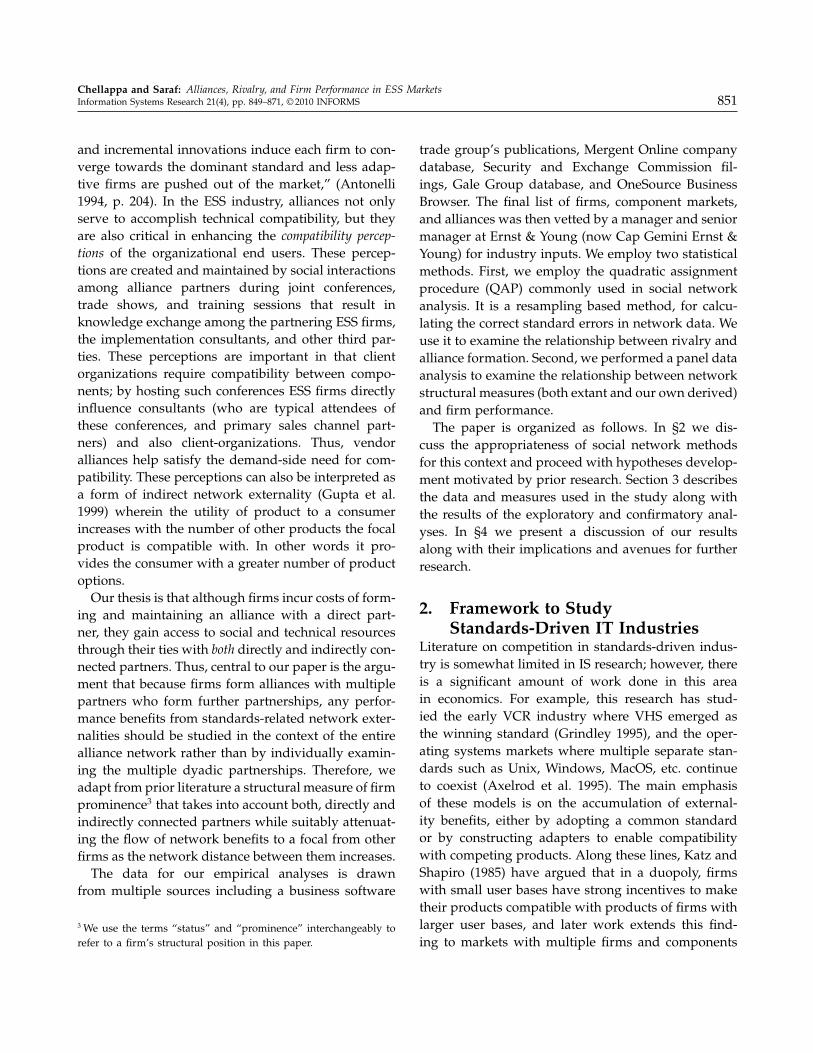
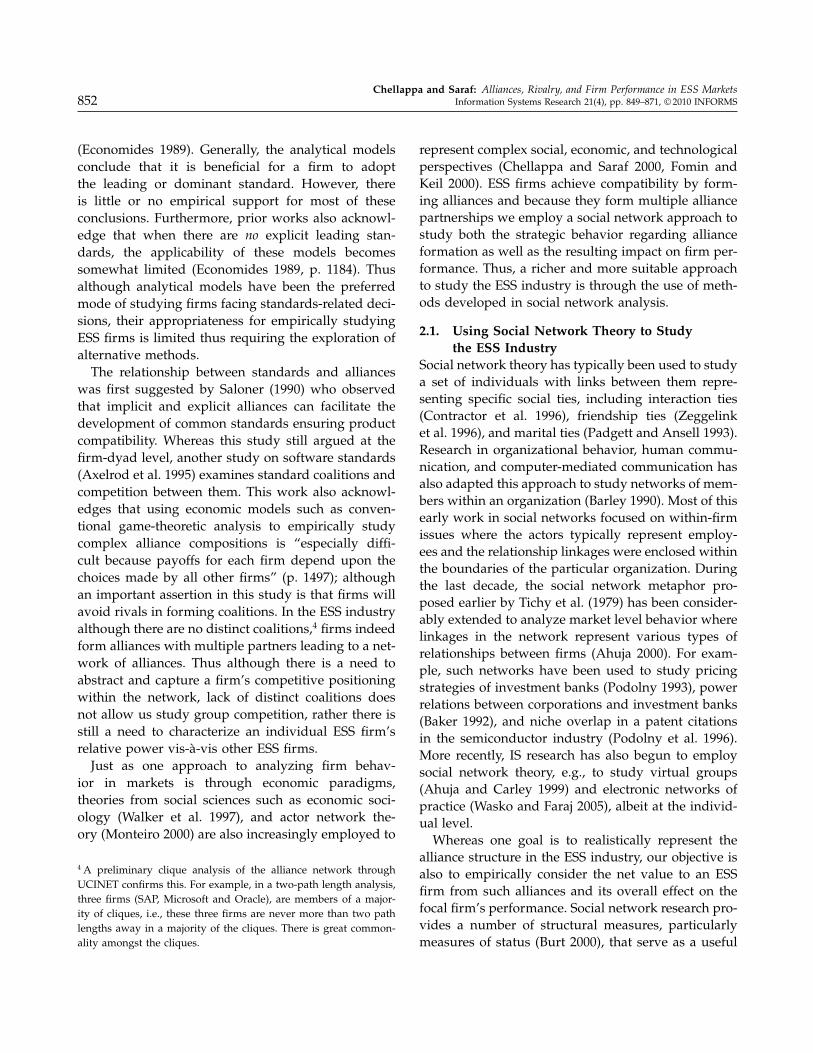
Just as summary statistics provide a description ofdata for typical empirical studies, descriptive networkstatistics and network visualization tools provide pre-liminary insights into network data. One networkmeasure that provides some insights into the net-work structure is the degree centrality (Freeman 1979)measure. For example, Figure 1 provides the distribu-tion of degree centrality for one sample time cross-section in our analysis. In the visual representationof this data (Figure 2), each ESS firm would be nodeor actor. We can see that whereas some nodes appearto be highly central, the distribution of degree isskewed. We can draw two qualitative inferences fromthis visualization. The first pertains to whether thenetwork is random or if it is a manifestation of anunderlying phenomenon, possibly one we are theo-rizing. For this we examine the density of alliancelinkages in the network for the year under considera-tion. The theoretical limit of alliance network densityis (i.e., number of possible links) n!/��n−2�!2!�= 2�080(Wasserman and Faust 1994). Against this, in our net-work there are a total of 196 links that suggests anetwork density of approximately 9.4% (196/2,080).Prior literature on technology alliances (Hagedoornand Duysters 1999) refers to networks with 40% den-sity as being highly dense, and hence by comparisonour network with less than 10% density is a lightlydense network. The graph implies that firms havenot formed alliances with every other firm suggest-ing that the ESS firms have selectively invested in
Figure 1 Firm Degree Distribution (1999)
0
5
10
15
20
25
2510 20155
Degree centrality
Fre
quen
cy
alliances—an indication of underlying rational deci-sion making.A second observation from the alliance data is that
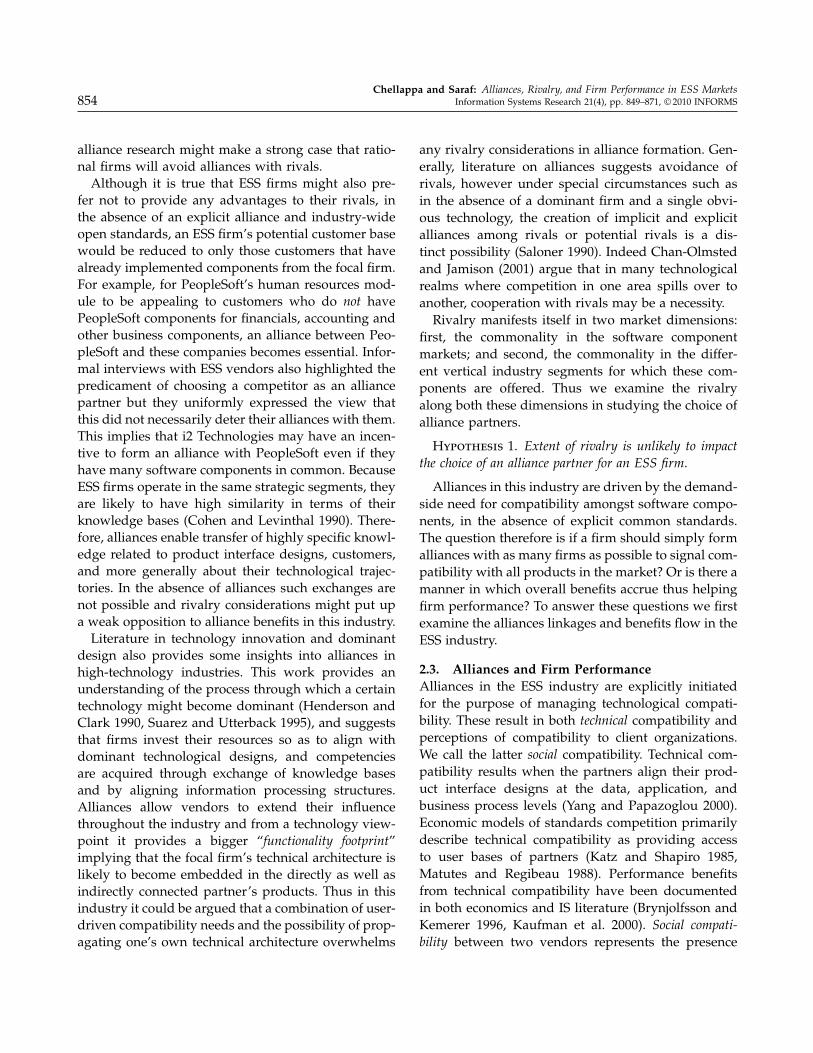
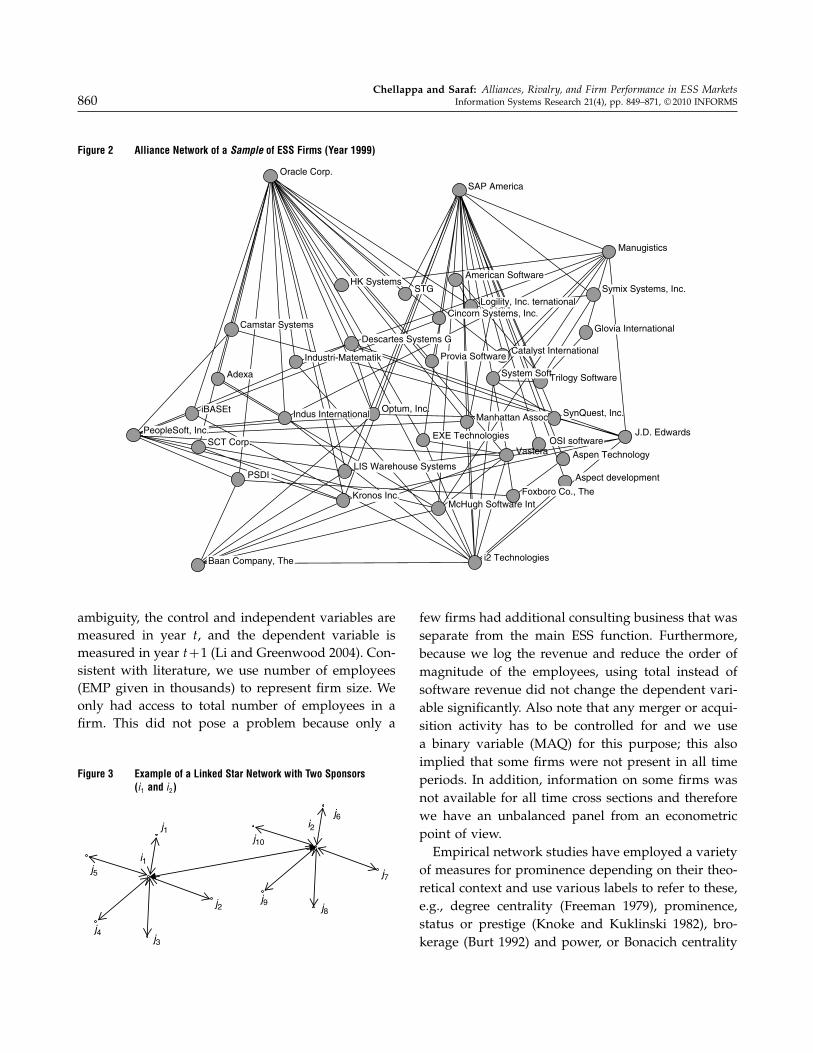
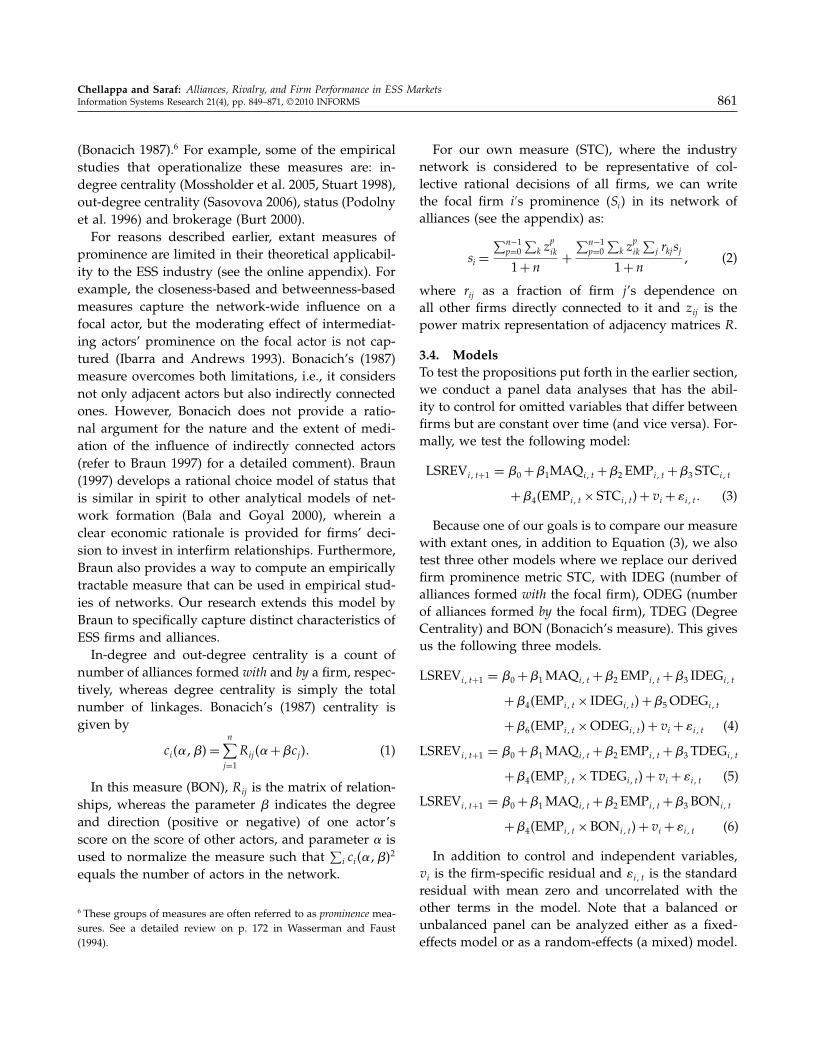
some firms (e.g., SAP, i2, Manugistics, Baan & People-Soft with more than 10 links each) with high degreecentrality are also linked to each other. In this regard,a recent analytical work on network formation pro-vides a useful lens to interpret this feature. Work byBala and Goyal (2000) suggests that when linkagesbetween profit-maximizing firms (actors) are a resultof rational decisions of the actors, then certain distinctnetwork structures will emerge in equilibrium. Theyobserve (see Figure 3), “in the case of two-way flow ofbenefits, networks with a single star and linked starsare strict Nash.” (p. 1186). More specifically, their find-ings are that if all actors are rational then eventuallythe networks will be empty or if connected, they willconverge to a limit network with a star or a linked-star configuration.Extending this observation to the ESS industry, and
comparing Figures 2 and 3, we can see that the ESSindustry has many peripheral nodes connecting toeach other even if there are a few likely candidatesfor central nodes. This suggests that perhaps thisindustry is in a continuous state of flux or at someintermediate stage (Bala and Goyal 2000). A simi-lar observation can be made for subsequent years aswell. An important guidance provided by this obser-vation is that the equilibrium findings of analyticaleconomic models require further empirical examina-tion. Note that, for illustrative purposes, in this sec-tion we used all firms available during year 1999,even if they dropped out of the sample during lateryears. The network data for later years also has thesame characteristics.
3.3. MeasuresESS firms report total and software revenues sepa-rately, where the former also includes consulting rev-enues for some firms, whereas the latter is exclu-sively from sales or licensing of their software. For ourcontext software revenues (LSREV) is the appropri-ate dependent variable to indicate firm performance.Along the lines of extant studies (Jayachandran et al.1999), we use natural log transformation for thedependent variable due to high variances in this firmperformance metric. Furthermore, to avoid any causal
Chellappa and Saraf: Alliances, Rivalry, and Firm Performance in ESS Markets860 Information Systems Research 21(4), pp. 849–871, © 2010 INFORMS
Figure 2 Alliance Network of a Sample of ESS Firms (Year 1999)
Baan Company, The
PSDI
SCT Corp.
iBASEt
Adexa
Camstar Systems
HK Systems
Oracle Corp.
SAP America
Manugistics
Symix Systems, Inc.
Glovia International
J.D. Edwards
Aspect development
Foxboro Co., TheMcHugh Software Int
Kronos Inc.
LIS Warehouse Systems
Optum, Inc.Indus International
Industri-Matematik
STG
Descartes Systems G
American Software
Cincorn Systems, Inc.
Provia SoftwareCatalyst International
System SoftTrilogy Software
SynQuest, Inc.Manhattan Assoc
OSI software
Aspen TechnologyVastera
EXE Technologies
Logility, Inc. ternational
i2 Technologies
PeopleSoft, Inc.
ambiguity, the control and independent variables aremeasured in year t, and the dependent variable ismeasured in year t+1 (Li and Greenwood 2004). Con-sistent with literature, we use number of employees(EMP given in thousands) to represent firm size. Weonly had access to total number of employees in afirm. This did not pose a problem because only a
Figure 3 Example of a Linked Star Network with Two Sponsors(i1 and i2)
j3
j1
j2
j4
j5i1
j8
j7
j9
j10
i2j6
few firms had additional consulting business that wasseparate from the main ESS function. Furthermore,because we log the revenue and reduce the order ofmagnitude of the employees, using total instead ofsoftware revenue did not change the dependent vari-able significantly. Also note that any merger or acqui-sition activity has to be controlled for and we usea binary variable (MAQ) for this purpose; this alsoimplied that some firms were not present in all timeperiods. In addition, information on some firms wasnot available for all time cross sections and thereforewe have an unbalanced panel from an econometricpoint of view.Empirical network studies have employed a variety
of measures for prominence depending on their theo-retical context and use various labels to refer to these,e.g., degree centrality (Freeman 1979), prominence,status or prestige (Knoke and Kuklinski 1982), bro-kerage (Burt 1992) and power, or Bonacich centrality
Chellappa and Saraf: Alliances, Rivalry, and Firm Performance in ESS MarketsInformation Systems Research 21(4), pp. 849–871, © 2010 INFORMS 861
(Bonacich 1987).6 For example, some of the empiricalstudies that operationalize these measures are: in-degree centrality (Mossholder et al. 2005, Stuart 1998),out-degree centrality (Sasovova 2006), status (Podolnyet al. 1996) and brokerage (Burt 2000).For reasons described earlier, extant measures of
prominence are limited in their theoretical applicabil-ity to the ESS industry (see the online appendix). Forexample, the closeness-based and betweenness-basedmeasures capture the network-wide influence on afocal actor, but the moderating effect of intermediat-ing actors’ prominence on the focal actor is not cap-tured (Ibarra and Andrews 1993). Bonacich’s (1987)measure overcomes both limitations, i.e., it considersnot only adjacent actors but also indirectly connectedones. However, Bonacich does not provide a ratio-nal argument for the nature and the extent of medi-ation of the influence of indirectly connected actors(refer to Braun 1997) for a detailed comment). Braun(1997) develops a rational choice model of status thatis similar in spirit to other analytical models of net-work formation (Bala and Goyal 2000), wherein aclear economic rationale is provided for firms’ deci-sion to invest in interfirm relationships. Furthermore,Braun also provides a way to compute an empiricallytractable measure that can be used in empirical stud-ies of networks. Our research extends this model byBraun to specifically capture distinct characteristics ofESS firms and alliances.In-degree and out-degree centrality is a count of
number of alliances formed with and by a firm, respec-tively, whereas degree centrality is simply the totalnumber of linkages. Bonacich’s (1987) centrality isgiven by
ci����=n∑j=1
Rij�+�cj�� (1)
In this measure (BON), Rij is the matrix of relation-ships, whereas the parameter � indicates the degreeand direction (positive or negative) of one actor’sscore on the score of other actors, and parameter isused to normalize the measure such that
∑i ci����
2
equals the number of actors in the network.
6 These groups of measures are often referred to as prominence mea-sures. See a detailed review on p. 172 in Wasserman and Faust(1994).
For our own measure (STC), where the industrynetwork is considered to be representative of col-lective rational decisions of all firms, we can writethe focal firm i′s prominence �Si� in its network ofalliances (see the appendix) as:
si =∑n−1
p=0∑
k zp
ik
1+n+
∑n−1p=0
∑k z
p
ik
∑j rkj sj
1+n� (2)
where rij as a fraction of firm j’s dependence onall other firms directly connected to it and zij is thepower matrix representation of adjacency matrices R.
3.4. ModelsTo test the propositions put forth in the earlier section,we conduct a panel data analyses that has the abil-ity to control for omitted variables that differ betweenfirms but are constant over time (and vice versa). For-mally, we test the following model:
LSREVi� t+1 = �0+�1MAQi� t +�2 EMPi� t +�3 STCi� t
+�4�EMPi� t × STCi� t�+ vi + �i� t� (3)
Because one of our goals is to compare our measurewith extant ones, in addition to Equation (3), we alsotest three other models where we replace our derivedfirm prominence metric STC, with IDEG (number ofalliances formed with the focal firm), ODEG (numberof alliances formed by the focal firm), TDEG (DegreeCentrality) and BON (Bonacich’s measure). This givesus the following three models.
LSREVi� t+1 = �0+�1MAQi� t +�2 EMPi� t +�3 IDEGi� t
+�4�EMPi� t × IDEGi� t�+�5 ODEGi� t
+�6�EMPi� t ×ODEGi� t�+ vi + �i� t (4)
LSREVi� t+1 = �0+�1MAQi� t +�2 EMPi� t +�3 TDEGi� t
+�4�EMPi� t ×TDEGi� t�+ vi + �i� t (5)
LSREVi� t+1 = �0+�1MAQi� t +�2 EMPi� t +�3 BONi� t
+�4�EMPi� t ×BONi� t�+ vi + �i� t (6)
In addition to control and independent variables,vi is the firm-specific residual and �i� t is the standardresidual with mean zero and uncorrelated with theother terms in the model. Note that a balanced orunbalanced panel can be analyzed either as a fixed-effects model or as a random-effects (a mixed) model.
Chellappa and Saraf: Alliances, Rivalry, and Firm Performance in ESS Markets862 Information Systems Research 21(4), pp. 849–871, © 2010 INFORMS
The difference in the two analyses essentially relatesto the assumptions made on the firm-specific resid-ual. Although the fixed-effects models make a strongassumption that �v = 0 (firms are unchanged overtime), we can instead think of each firm as having itsown systematic baseline where each intercept is theresult of a random deviation from some mean inter-cept. In the random-effects model, the intercept is a drawfrom some distribution for each firm and instead oftrying to estimate n (number of firms) parameters asin the fixed effects case, we only need to estimateparameters describing the distribution and hence a�v is reported. More importantly the results from therandom-effects model can be generalized to a timeperiod outside the sample period.
3.5. Regression ResultsWe used the alliance matrices of the ESS firms inorder to compute the centrality measures. For STC,the matrix was symmetrized and transformed to anormalized column matrix. For example, for all 23partners who maintained alliances with a top focalfirm, the strength of relationship of each alliance part-ner with the focal firm was normalized to 1/23 in thematrix. The matrix resulting from such normalizationwas asymmetric because each firm had varying num-ber alliance linkages. The strength of each individualrelationship is therefore reduced thus capturing thenonexclusivity in the relationship.Such careful considerations are not present in the
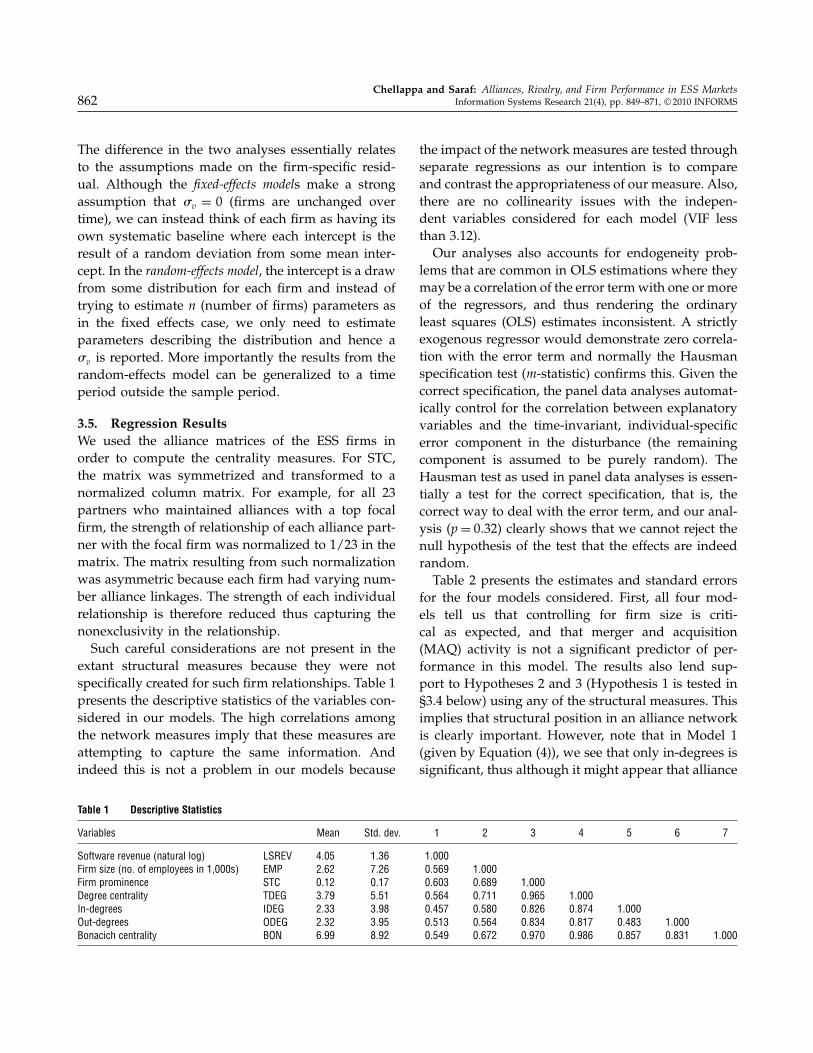
extant structural measures because they were notspecifically created for such firm relationships. Table 1presents the descriptive statistics of the variables con-sidered in our models. The high correlations amongthe network measures imply that these measures areattempting to capture the same information. Andindeed this is not a problem in our models because
Table 1 Descriptive Statistics
Variables Mean Std. dev. 1 2 3 4 5 6 7
Software revenue (natural log) LSREV 4�05 1�36 1�000Firm size (no. of employees in 1,000s) EMP 2�62 7�26 0�569 1�000Firm prominence STC 0�12 0�17 0�603 0�689 1�000Degree centrality TDEG 3�79 5�51 0�564 0�711 0�965 1�000In-degrees IDEG 2�33 3�98 0�457 0�580 0�826 0�874 1�000Out-degrees ODEG 2�32 3�95 0�513 0�564 0�834 0�817 0�483 1�000Bonacich centrality BON 6�99 8�92 0�549 0�672 0�970 0�986 0�857 0�831 1�000
the impact of the network measures are tested throughseparate regressions as our intention is to compareand contrast the appropriateness of our measure. Also,there are no collinearity issues with the indepen-dent variables considered for each model (VIF lessthan 3.12).Our analyses also accounts for endogeneity prob-
lems that are common in OLS estimations where theymay be a correlation of the error termwith one or moreof the regressors, and thus rendering the ordinaryleast squares (OLS) estimates inconsistent. A strictlyexogenous regressor would demonstrate zero correla-tion with the error term and normally the Hausmanspecification test (m-statistic) confirms this. Given thecorrect specification, the panel data analyses automat-ically control for the correlation between explanatoryvariables and the time-invariant, individual-specificerror component in the disturbance (the remainingcomponent is assumed to be purely random). TheHausman test as used in panel data analyses is essen-tially a test for the correct specification, that is, thecorrect way to deal with the error term, and our anal-ysis �p= 0�32� clearly shows that we cannot reject thenull hypothesis of the test that the effects are indeedrandom.Table 2 presents the estimates and standard errors
for the four models considered. First, all four mod-els tell us that controlling for firm size is criti-cal as expected, and that merger and acquisition(MAQ) activity is not a significant predictor of per-formance in this model. The results also lend sup-port to Hypotheses 2 and 3 (Hypothesis 1 is tested in§3.4 below) using any of the structural measures. Thisimplies that structural position in an alliance networkis clearly important. However, note that in Model 1(given by Equation (4)), we see that only in-degrees issignificant, thus although it might appear that alliance

Chellappa and Saraf: Alliances, Rivalry, and Firm Performance in ESS MarketsInformation Systems Research 21(4), pp. 849–871, © 2010 INFORMS 863
Table 2 Random Effects Model of Firm Performance
Independent variables Model 1 Model 2 Model 3 Model 4
Intercept 4�023∗∗∗ 4�044∗∗∗ 4�020∗∗∗ 4�024∗∗∗
�0�114� �0�114� �0�115� �0�113�Firm size EMP 0�096∗∗∗ 0�101∗∗∗ 0�103∗∗∗ 0�096∗∗∗
�0�019� �0�019� �0�021� �0�020�Firm merged or 0�147 0�170 0�171 0�175
acquired MAQ �0�146� �0�145� �0�146� �0�146�In-degrees IDEG 0�075∗∗
�0�036�Out-degrees ODEG 0�035
�0�035�Degree centrality TDEG 0�086∗∗∗
�0�023�IDEG× EMP −0�002∗∗
�0�001�ODEG× EMP −0�000
�0�001�TDEG× EMP −0�002∗∗
�0�001�Bonacich centrality BON 0�039∗∗∗
�0�013�BON× EMP −0�001∗
�0�000�ESS firm prominence STC 2�630∗∗∗
�0�700�STC× EMP −0�059∗∗
�0�036��� 0�686∗∗∗ 0�680∗∗∗ 0�684∗∗∗ 0�632∗∗∗
�� 0�465∗∗∗ 0�475∗∗∗ 0�490∗∗∗ 0�496∗∗∗
BIC 545.7 538.2 541.9 537.8No. of observations 182 182 182 182
Note. Standard errors are in parentheses.∗p < 0�1; ∗∗p < 0�05; ∗∗∗p < 0�01.
formed by a firm is not important, Model 2 (given byEquation (5)) sheds further light. Model 2, which usestotal degrees, essentially counts two firms to havean alliance irrespective of the fact whether one orboth firms have declared the alliance. The BIC ofthis model tells us that Model 2 is a much better fitthan Model 1 suggesting that alliances are importantperformance indicators irrespective of who initiatesthem. We use the Schwarz’ Bayesian information cri-terion (BIC) to compare the models where, givenany two estimated models, the model with the lowervalue of BIC is the one to be preferred. The BIC isa decreasing function of residual sum of squares, thegoodness of fit, and an increasing function of thenumber of free parameters to be estimated. The BICpenalizes free parameters more strongly than does the
Akaike information criterion (AIC) and is generallyconsidered to be a better metric than AIC or −2 log-likelihood measures.In both BON and STC, two firms are considered
to have an alliance independent of whether one ofboth parties have announced because it is clear thatalliances formed by a firm are important as well. Thusfrom a significance point of view although all mea-sures of structural position, namely, degree central-ity, Bonacich centrality and our own measure of sta-tus are all predictors of firm performance; comparingBIC we can clearly see our extended measure pro-vides the best model fit. This suggests that not onlyare alliances important but also suitably attenuatingimpacts of indirect partners is a better abstraction ofcompatibility benefits from alliances in this industry.Furthermore, although the main effects are positive,the interaction of all alliance measures with firm sizeis negative, indicating that the impact of allianceson firm performance decreases as firm size increases.This implies that as long as the alliance measure issignificant, smaller firms always benefit more throughalliances than larger firms. Table 2 also reports thevariance of firm-specific residuals and uncorrelatederror term with zero mean; both these estimates arehighly significant suggesting that the firm-specificeffect on firm performance can be drawn from a dis-tribution whose variance is 0.632 (from Model 4).
3.6. Results of QAP (Quadratic AssignmentProcedure) Analysis
To test Hypothesis 2, we used the quadratic assign-ment procedure (QAP), developed by Hubert (1987)and used in prior organizational research (Krackhardtand Kilduff 1986). Note that this hypothesis suggeststhat extent of rivalry does not deter alliance forma-tion, and because we cannot directly test the nonex-istence of a relationship, one appropriate approachwould be to test the existence of a relationship betweennonrivalry, i.e., commonality in software componentofferings and the probability of alliance formation.QAP is a nonparametric data analytic method that
can be used to examine the degree of similaritybetween structures. QAP correlation essentially tellsus if two N ×N matrices representing connections aresimilar to each other beyond a level that one couldbe expected through chance arrangement. In a QAP
Chellappa and Saraf: Alliances, Rivalry, and Firm Performance in ESS Markets864 Information Systems Research 21(4), pp. 849–871, © 2010 INFORMS
regression, the dependent variable matrix is regressedon one or more independent matrices, and the sig-nificance of R-square and regression coefficients pro-vides the model fit. QAP has several advantages overtraditional linear model hypothesis in that it takesadvantage of the dyadic information represented ineach matrix. Besides, it also does not make any para-metric assumptions about the data and is generallyused for nonindependent relationships (Krackhardtand Kilduff 1986). The biggest advantage of QAP isthat it is immune to the highly complex autocorrela-tion structure of network data that cannot be analyzedusing standard regression approaches such as logitor probit models7 (Krackhardt 1987, 1988). The algo-rithm proceeds by first performing a standard multi-ple regression analysis across the corresponding cellsof the dependent and independent matrices. Then therows and columns of the independent matrix are ran-domly permuted and the standard multiple regres-sion analysis is performed again to get the R-squareand the coefficient values. The significance is deter-mined by repeating the regression hundreds of timesand comparing the coefficients of randomly generatedmatrices with those from the actual matrix regres-sion (Krackhardt and Porter 1986). QAP was used byStohl (1993) to compare a semantic network of man-agers’ interpretation of the word “participation” andother matrices of similarity. Barley (1990) used QAP todetermine whether the observed social network in aradiology department departed significantly from aninstitutional ideal network.For our analyses, QAP regression was performed
using the symmetrized alliance matrix as the depen-dent matrix. Three additional types of matrices werecreated that were used as dependent matrices. First,an N × N adjacency matrix (SFTOVLP) that has thedyadic software component overlap in its cells wascomputed; one matrix for each of the three years. Thatis, the cell entries represent the number of softwarecomponents two firms offer in common. Second, theN ×N market overlap matrix (MKTOVLP) was alsocomputed whose cells represent the number of ver-tical industry segments two firms compete in. Third,
7 Even after penalizing the standard errors for clustered observa-tions belonging to the same actor (as done in logit models), themore complex interdependencies because of the network ties can-not be filtered out (Krackhardt 1987, 1988).
we also created a matrix (SFTOVLP×MKTOVLP)8 asan interaction effect. Three market overlap matriceswere created, one for each year. Diagonals of thesematrices represent the number of software compo-nents offered by a firm and the number of verticalindustry segments it competes in, respectively. Diago-nals were ignored during the QAP regression. We ranthe QAP regressions for alliances formed each yearand as discussed earlier, the number of ESS vendorfirms varies due to various mergers and acquisitionsin this market. For Year 1, we have 76 firms, for Year 2,our data has 81 firms and in the third time period wehave a total of 70 firms.Multiple regression quadratic assignment proce-
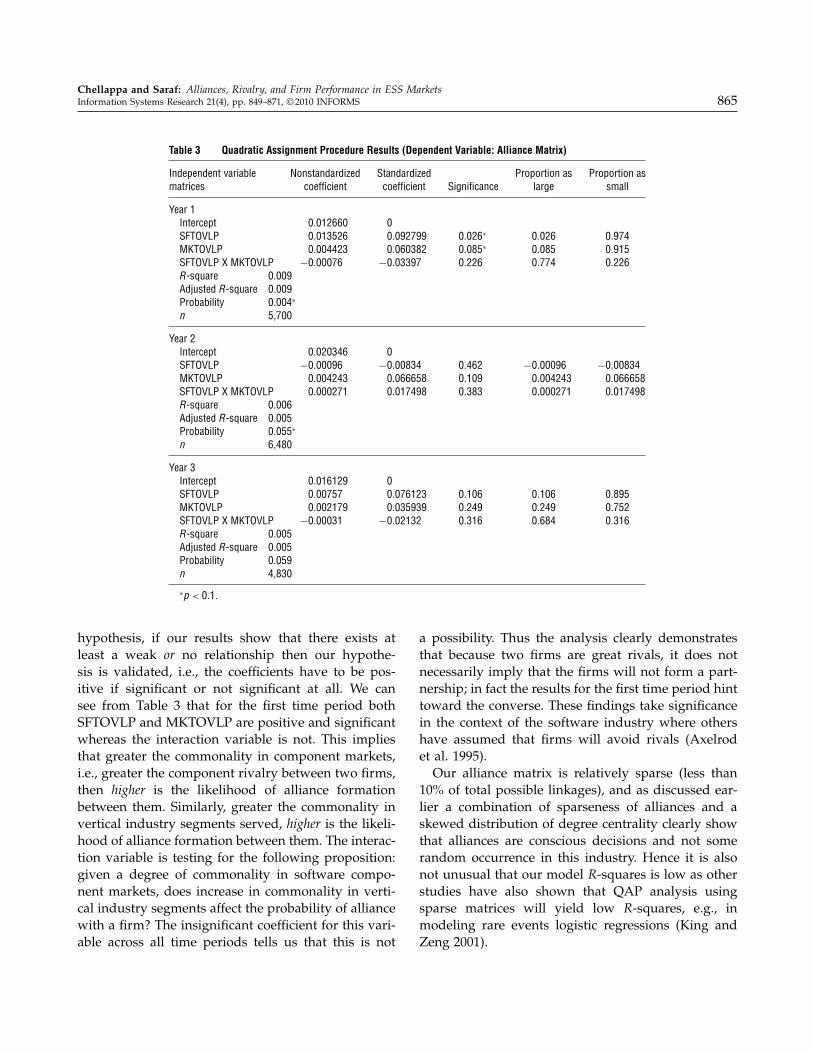
dure as implemented in UCINET 6 (Borgatti et al.2002) was used to test Hypothesis 1. We used thesemi-partialling MR-QAP test that is robust againstmulticollinearity (Dekker et al. 2003), and the resultsare reported in Table 3. Because the number of com-panies differs across years, the total number of obser-vations (given by n�n − 1�) for the first year is76× 75= 5�700, and 6,480 and 4,830, respectively, forthe second and third time periods. For our data anal-ysis, we ran over ten thousand iterations in UCINETto determine the significance levels of the coefficientestimates of the SFTOVLP, MKTOVLP, and the inter-action matrices and their R-squares. Significance ofthe coefficients is computed nonparametrically as thenumber of permutations UCINET performed on therandomly generated matrices that had the coefficientssmaller than the estimates from the regression involv-ing the actual sample matrices. Thus, for example, inYear 1, the significance of the coefficient (column 4) ofSOFTOVLP (0.026) indicates that 2.6% of the regres-sions using the randomly generated matrices yieldedcoefficients of SOFTOVLP that were larger than 0.0927(column 3). A similar computation is done to find thesignificance of the R-squares. All regressions are sig-nificant (p-values 0.004, 0.055, 0.059) considering thethreshold p-value at 0.1. However, the coefficients forYear two and three are not significant at p-value of 0.1.Our results show support for Hypothesis 1. Because
we are testing for the converse of the proposed
8 For example, if a firm offered a software component X and alsocompeted in a vertical industry segment Y, then it was coded asparticipating in the market segment XY.
Chellappa and Saraf: Alliances, Rivalry, and Firm Performance in ESS MarketsInformation Systems Research 21(4), pp. 849–871, © 2010 INFORMS 865
Table 3 Quadratic Assignment Procedure Results (Dependent Variable: Alliance Matrix)
Independent variable Nonstandardized Standardized Proportion as Proportion asmatrices coefficient coefficient Significance large small
Year 1Intercept 0�012660 0SFTOVLP 0�013526 0�092799 0�026∗ 0�026 0�974MKTOVLP 0�004423 0�060382 0�085∗ 0�085 0�915SFTOVLP X MKTOVLP −0�00076 −0�03397 0�226 0�774 0�226R-square 0.009Adjusted R-square 0.009Probability 0.004∗
n 5,700
Year 2Intercept 0�020346 0SFTOVLP −0�00096 −0�00834 0�462 −0�00096 −0�00834MKTOVLP 0�004243 0�066658 0�109 0�004243 0�066658SFTOVLP X MKTOVLP 0�000271 0�017498 0�383 0�000271 0�017498R-square 0.006Adjusted R-square 0.005Probability 0.055∗
n 6,480
Year 3Intercept 0�016129 0SFTOVLP 0�00757 0�076123 0�106 0�106 0�895MKTOVLP 0�002179 0�035939 0�249 0�249 0�752SFTOVLP X MKTOVLP −0�00031 −0�02132 0�316 0�684 0�316R-square 0.005Adjusted R-square 0.005Probability 0.059n 4,830
∗p < 0�1.
hypothesis, if our results show that there exists atleast a weak or no relationship then our hypothe-sis is validated, i.e., the coefficients have to be pos-itive if significant or not significant at all. We cansee from Table 3 that for the first time period bothSFTOVLP and MKTOVLP are positive and significantwhereas the interaction variable is not. This impliesthat greater the commonality in component markets,i.e., greater the component rivalry between two firms,then higher is the likelihood of alliance formationbetween them. Similarly, greater the commonality invertical industry segments served, higher is the likeli-hood of alliance formation between them. The interac-tion variable is testing for the following proposition:given a degree of commonality in software compo-nent markets, does increase in commonality in verti-cal industry segments affect the probability of alliancewith a firm? The insignificant coefficient for this vari-able across all time periods tells us that this is not
a possibility. Thus the analysis clearly demonstratesthat because two firms are great rivals, it does notnecessarily imply that the firms will not form a part-nership; in fact the results for the first time period hinttoward the converse. These findings take significancein the context of the software industry where othershave assumed that firms will avoid rivals (Axelrodet al. 1995).Our alliance matrix is relatively sparse (less than
10% of total possible linkages), and as discussed ear-lier a combination of sparseness of alliances and askewed distribution of degree centrality clearly showthat alliances are conscious decisions and not somerandom occurrence in this industry. Hence it is alsonot unusual that our model R-squares is low as otherstudies have also shown that QAP analysis usingsparse matrices will yield low R-squares, e.g., inmodeling rare events logistic regressions (King andZeng 2001).

Chellappa and Saraf: Alliances, Rivalry, and Firm Performance in ESS Markets866 Information Systems Research 21(4), pp. 849–871, © 2010 INFORMS
4. Discussion and ConclusionsWe have argued here that user requirements gov-ern important aspects of competition in the businesssoftware industry. Therefore it is perhaps as criticalfor IS researchers to study the firm and industry-level aspects of enterprise systems software as it isto examine their intra-organizational adoption andusage. Currently, little is known about the competi-tion between vendors who supply these enterprisesystems components. Research in economics providessome insights on competition in industries drivenand defined by standards and compatibility; how-ever, these are generally highly stylized analyticalmodels involving duopolies and usually two com-ponents (Economides 1989, Matutes and Regibeau1988). Furthermore, there has been a distinct paucityof empirical research in this field, which is perhapsreflective of the difficulty in acquiring firm-level infor-mation in such industries. This paper aims at address-ing this gap by employing social network methods asan alternative framework to study this industry.Competition in enterprise systems software (ESS)
is defined by lack of common standards where theESS firms produce multiple components and clientorganizations often build a system through compo-nents from multiple firms. So, even if ESS firms arecapable of producing components for multiple func-tional areas and even if they would prefer that orga-nizational end users purchased all components fromthem, these firms form alliances to maintain techni-cal compatibility as well as to signal compatibility toclient organizations. Thus alliances are mainly moti-vated by demand-side need for compatibility ratherthan typical reasons of resource sharing, specializa-tion, etc. (as commonly seen in extant research onalliances in strategy). Although not a direct networkeffect, the demand-side hint at the existence of indi-rect network externality benefits. This is consistentwith phenomenon observed in interdependent hard-ware and software markets where firms often “havean incentive to free-ride on each others’ demand cre-ation efforts” (Gupta et al. 1999, p. 396).First, we see that the current configuration of
alliance networks is not in equilibrium, suggestingthat equilibrium findings of analytical models can-not be directly applied. This implies that there are nodominant standards that characterize the settings in
stylized analytical models of firm competition. Sec-ond, we examine the formation of linkages them-selves and show that compatibility considerations cantrump rivalry concerns, i.e., firms form alliances evenwith rivals—at the very least rivalry does not pre-vent alliance considerations. Third, we propose anapproach to measure the standards dominance ofan ESS firm given there is no de jure or de factor(monopolistic or oligopolistic) standard in the mar-ket. Because extant structural measures were primarilyconceived for interpersonal networks and do not accu-rately capture the net value from forming linkages, wederive our own measure (based on an extant measure)by including attenuated benefits from indirectly con-nected firms. We then show this prominence measureindeed is a performance indicator even after control-ling for size of the firm. We also compare our measureagainst extant structural measures. Finally we showthat small firms stand to gain more by forming part-nerships with prominent firms and thus acquiring ahigher prominence than larger firms do.
4.1. ConclusionsAn important contribution of our work to IS researchis that it develops a cogent link between corporate ITstandards (a well-developed concept in IS research)and ESS firm competition. Corporate IT standardsunderscore the need for common standards within anorganization. This requirement often contradicts thebehavior of functional groups that prefer to buy sys-tem components that are the best-of-breed. ESS firmshave to internalize these client-side requirements intheir competitive strategies. One option is to makethemselves attractive by forming alliances and thusappearing to be compatible with a wide range offirms. Our research suggests that firms can achievethis through a careful selection of alliance partners—not based on rivalry considerations but rather basedon their prominence within the network of alliances.Recent research in economics is now developing styl-ized models of platform competition where firmslearn to internalize network effects on the client side(Rochet and Tirole 2006). There is also some evidenceof such demand-side forces directing firm relation-ships in marketing (Stewart 1996), e.g., co-brandinginitiatives. In co-branding two firms form an alliancenot because of resource considerations, but rather
Chellappa and Saraf: Alliances, Rivalry, and Firm Performance in ESS MarketsInformation Systems Research 21(4), pp. 849–871, © 2010 INFORMS 867
to jointly promote a product containing componentsfrom both firms, e.g., Intel-inside and AT&T andiPhone campaigns. Firms engage in these initiativesbecause consumers value “compatibility” betweentwo brands they prefer. Our research would suggestthat if the market is not in equilibrium and there are nofirms owning a dominant standard, the relative domi-nance can be determined through their prominence ina co-branding network. Our research would also rec-ommend nonexclusive relationships across multiplepartners, and that it is key for small firms to engagein these relationships.Although we do see the social network approach
increasingly adopted in IS research, it has largelyfocused on studying individual level interactionsrather than firm relationships, e.g., teams within hos-pitals (Kane and Alavi 2008). When studying firm-level relationships, our research also suggests that anynetwork analysis should be preceded by descriptivevisual analysis so as to compare with equilibriumstructures. If firms engage in strategic partnerships asa result of their cost-benefit analyses, the visual analy-ses provide insights about how far away the industryis from the emergence of monopolistic or oligopolisticmarkets. This observation might be helpful for futurework on entry and exit into an industry sector. Fur-thermore, we also recommend that a rational choicemodel such as Braun’s (1997) can be extended easily toaccommodate unique elements of a particular sector,just as we were able to do for the ESS industry.
4.2. Limitations and Future ResearchOur study has the general limitations of any empiri-cal study, namely the availability of data. As the datafor alliances and revenue had to be collected fromindependent sources, we are limited to a three time-period sample of ESS firms. Furthermore, data on thenumber of site licenses, individual component rev-enues and other fine-grained measures are unavail-able due to the fact that a sizable number of ESS firmsare privately held and public information on themis not forthcoming. Although this does not detractfrom our analysis, such fine-grained measures canalso lend greater insights into product-line decisionsof ESS vendors. In this study we only consider the ESSfirms in the actor network; implementers, consultants,and middle-ware vendors are not included. Given
their significant impact on alliances in the ESS indus-try it might be interesting to incorporate their rolein any future studies by using a multimode networkapproach that allows for inclusion of heterogonousactors. Similarly we have not explicitly parameterizedthe number of markets in which firms compete ver-sus cooperate; this may be needed for an empiricalextension to this study.Note that alliances serve as a proxy for both social
and technical resources. In this empirical study, weare unable to segregate the types of resources suchas knowledge spillover effects, reputation effects, andaccess to larger user bases from product compat-ibility. It should be noted however that networkanalysis using such multidimensional ties becomesincreasingly complex and therefore most studies oninterfirm networks consider an alliance to be repre-sentative of more than one type of resource flow. Typ-ically a qualitative approach through interviews ofmanagers and clients of ESS firms is useful for iso-lating the nature of distinct types of resource trans-fers. Perhaps, future empirical studies can employthe survey method to empirically distinguish betweendifferent dimensions of compatibility and their dif-ferential implications to ESS vendors and IT buyersalike. Similarly, there are no explicit measures of tiestrength although alliances range from licensing to co-development. However, there are no industry-widenorms that we can use to explicate these differences.
AcknowledgmentsNilesh Saraf acknowledges financial support from theSocial Sciences and Humanities Research Council of Canada(SSHRC).
Appendix. Deriving the ProminenceMeasure for the ESS IndustryConsider a network of n ESS firms and a set of linkagesamong these representing alliances. We assume that eachfirm has made a rational decision at a particular point intime in terms of the choice of its alliances. Furthermore, ithas also invested in its relationships such that its net bene-fits (less costs incurred in maintaining these) are maximized,that is, every vendor seeks to maximize access to resourcesin excess of costs. Thus, the profit maximization function ofeach firm is maxj �bi − ci�, where ci, and bi are the costs andbenefits of a focal firm i across all directly and indirectlyconnected firms j . As discussed in the body of the paper, thedistinct characteristics of ESS alliances can be summarizedinto the following three assumptions.
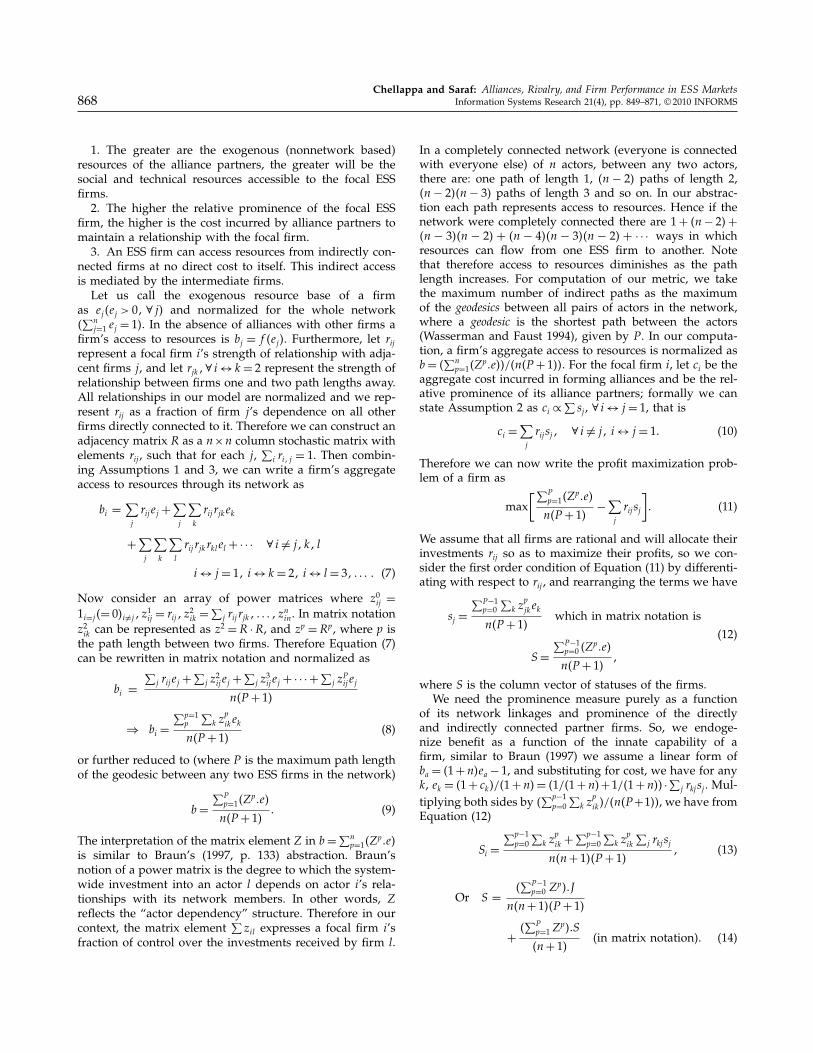
Chellappa and Saraf: Alliances, Rivalry, and Firm Performance in ESS Markets868 Information Systems Research 21(4), pp. 849–871, © 2010 INFORMS
1. The greater are the exogenous (nonnetwork based)resources of the alliance partners, the greater will be thesocial and technical resources accessible to the focal ESSfirms.2. The higher the relative prominence of the focal ESS
firm, the higher is the cost incurred by alliance partners tomaintain a relationship with the focal firm.3. An ESS firm can access resources from indirectly con-
nected firms at no direct cost to itself. This indirect accessis mediated by the intermediate firms.Let us call the exogenous resource base of a firm
as ej �ej > 0� ∀ j� and normalized for the whole network�∑n
j=1 ej = 1�. In the absence of alliances with other firms afirm’s access to resources is bj = f �ej �. Furthermore, let rijrepresent a focal firm i’s strength of relationship with adja-cent firms j , and let rjk�∀ i↔ k= 2 represent the strength ofrelationship between firms one and two path lengths away.All relationships in our model are normalized and we rep-resent rij as a fraction of firm j’s dependence on all otherfirms directly connected to it. Therefore we can construct anadjacency matrix R as a n×n column stochastic matrix withelements rij , such that for each j ,
∑i ri� j = 1. Then combin-
ing Assumptions 1 and 3, we can write a firm’s aggregateaccess to resources through its network as
bi =∑j
rij ej +∑j
∑k
rij rjkek
+∑j
∑k
∑l
rij rjkrklel + · · · ∀ i �= j� k� l
i↔ j = 1� i↔ k= 2� i↔ l= 3� � � � � (7)Now consider an array of power matrices where z0ij =1i=j �= 0�i �=j � z1ij = rij � z
2ik =
∑j rij rjk� � � � � z
nin. In matrix notation
z2ik can be represented as z2 =R ·R, and zp =Rp, where p is
the path length between two firms. Therefore Equation (7)can be rewritten in matrix notation and normalized as
bi =∑
j rij ej +∑
j z2ij ej +
∑j z3ij ej + · · ·+∑
j zPij ej
n�P + 1�
⇒ bi =∑p=1
p
∑k z
pikek
n�P + 1� (8)
or further reduced to (where P is the maximum path lengthof the geodesic between any two ESS firms in the network)
b=∑P
p=1�Zp�e�
n�P + 1� � (9)
The interpretation of the matrix element Z in b=∑np=1�Z
p�e�is similar to Braun’s (1997, p. 133) abstraction. Braun’snotion of a power matrix is the degree to which the system-wide investment into an actor l depends on actor i’s rela-tionships with its network members. In other words, Zreflects the “actor dependency” structure. Therefore in ourcontext, the matrix element
∑zil expresses a focal firm i’s
fraction of control over the investments received by firm l.
In a completely connected network (everyone is connectedwith everyone else) of n actors, between any two actors,there are: one path of length 1, �n − 2� paths of length 2,�n− 2��n− 3� paths of length 3 and so on. In our abstrac-tion each path represents access to resources. Hence if thenetwork were completely connected there are 1+ �n− 2�+�n − 3��n − 2� + �n − 4��n − 3��n − 2� + · · · ways in whichresources can flow from one ESS firm to another. Notethat therefore access to resources diminishes as the pathlength increases. For computation of our metric, we takethe maximum number of indirect paths as the maximumof the geodesics between all pairs of actors in the network,where a geodesic is the shortest path between the actors(Wasserman and Faust 1994), given by P . In our computa-tion, a firm’s aggregate access to resources is normalized asb= �
∑np=1�Z
p�e��/�n�P + 1��� For the focal firm i, let ci be theaggregate cost incurred in forming alliances and be the rel-ative prominence of its alliance partners; formally we canstate Assumption 2 as ci ∝
∑sj , ∀ i↔ j = 1, that is
ci =∑j
rij sj � ∀ i �= j� i↔ j = 1� (10)
Therefore we can now write the profit maximization prob-lem of a firm as
max[∑P
p=1�Zp�e�
n�P + 1� −∑j
rij sj
]� (11)
We assume that all firms are rational and will allocate theirinvestments rij so as to maximize their profits, so we con-sider the first order condition of Equation (11) by differenti-ating with respect to rij , and rearranging the terms we have
sj =∑P−1
p=0∑
k zpjkek
n�P + 1� which in matrix notation is
S =∑P−1
p=0 �Zp�e�
n�P + 1� �
(12)
where S is the column vector of statuses of the firms.We need the prominence measure purely as a function
of its network linkages and prominence of the directlyand indirectly connected partner firms. So, we endoge-nize benefit as a function of the innate capability of afirm, similar to Braun (1997) we assume a linear form ofba = �1+n�ea − 1, and substituting for cost, we have for anyk, ek = �1+ ck�/�1+n�= �1/�1+n�+1/�1+n�� ·∑j rkj sj . Mul-tiplying both sides by �
∑p−1p=0
∑k z
pik�/�n�P+1��, we have from
Equation (12)
Si =∑p−1
p=0∑
k zpik +
∑p−1p=0
∑k z
pik
∑j rkj sj
n�n+ 1��P + 1� � (13)
Or S = �∑P−1
p=0 Zp��J
n�n+ 1��P + 1�
+ �∑P
p=1Zp��S
�n+ 1� (in matrix notation)� (14)
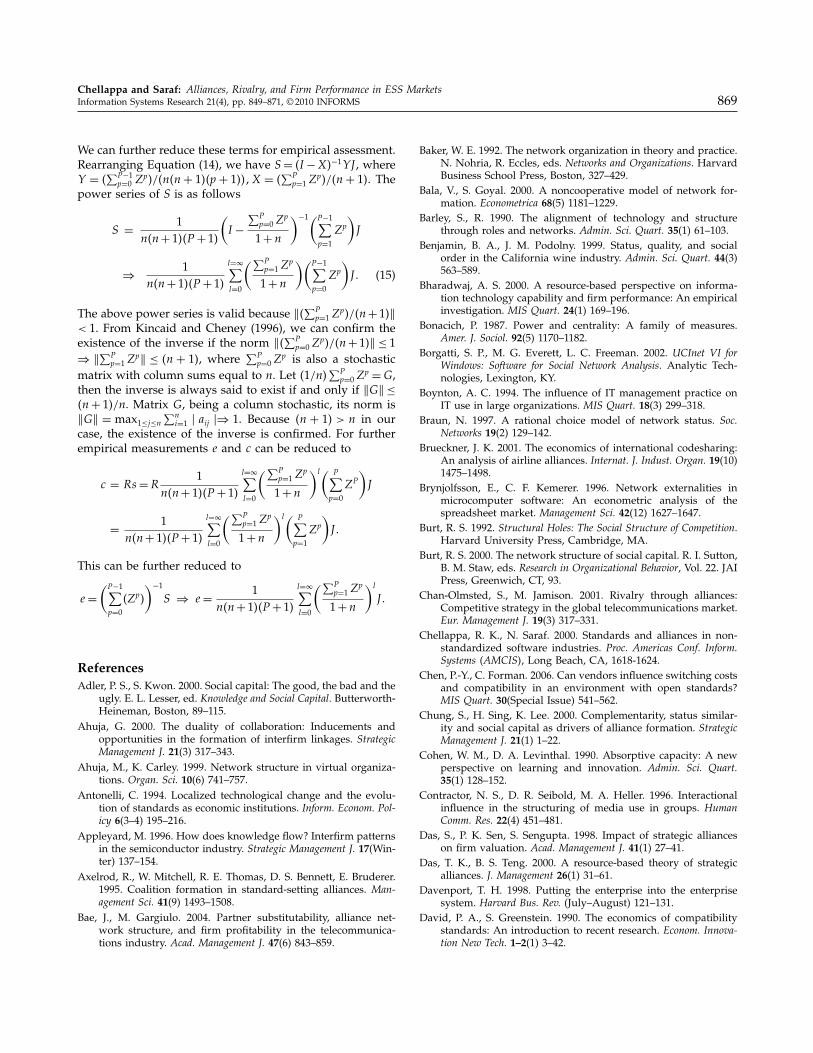
Chellappa and Saraf: Alliances, Rivalry, and Firm Performance in ESS MarketsInformation Systems Research 21(4), pp. 849–871, © 2010 INFORMS 869
We can further reduce these terms for empirical assessment.Rearranging Equation (14), we have S = �I −X�−1YJ , whereY = �
∑P−1p=0 Z
p�/�n�n+ 1��p + 1���X = �∑P
p=1Zp�/�n+ 1�. The
power series of S is as follows
S = 1n�n+ 1��P + 1�
(I −
∑Pp=0Z
p
1+n
)−1(P−1∑p=1
Zp
)J
⇒ 1n�n+ 1��P + 1�
l=�∑l=0
(∑Pp=1Z
p
1+n
)(P−1∑p=0
Zp
)J � (15)
The above power series is valid because ��∑Pp=1Z
p�/�n+ 1��< 1. From Kincaid and Cheney (1996), we can confirm theexistence of the inverse if the norm ��∑P
p=0Zp�/�n+ 1�� ≤ 1
⇒ �∑Pp=1Z
p� ≤ �n + 1�, where ∑Pp=0Z
p is also a stochasticmatrix with column sums equal to n. Let �1/n�
∑Pp=0Z
p =G,then the inverse is always said to exist if and only if �G� ≤�n+ 1�/n. Matrix G, being a column stochastic, its norm is�G� = max1≤j≤n
∑ni=1 � aij �⇒ 1. Because �n + 1� > n in our
case, the existence of the inverse is confirmed. For furtherempirical measurements e and c can be reduced to
c = Rs =R1
n�n+ 1��P + 1�l=�∑l=0
(∑Pp=1Z
p
1+n
)l( P∑p=0
ZP
)J
= 1n�n+ 1��P + 1�
l=�∑l=0
(∑Pp=1Z
p
1+n
)l( P∑p=1
Zp
)J �
This can be further reduced to
e=(P−1∑
p=0�Zp�
)−1S ⇒ e= 1
n�n+ 1��P + 1�l=�∑l=0
(∑Pp=1Z
p
1+n
)l
J �
ReferencesAdler, P. S., S. Kwon. 2000. Social capital: The good, the bad and the
ugly. E. L. Lesser, ed. Knowledge and Social Capital. Butterworth-Heineman, Boston, 89–115.
Ahuja, G. 2000. The duality of collaboration: Inducements andopportunities in the formation of interfirm linkages. StrategicManagement J. 21(3) 317–343.
Ahuja, M., K. Carley. 1999. Network structure in virtual organiza-tions. Organ. Sci. 10(6) 741–757.
Antonelli, C. 1994. Localized technological change and the evolu-tion of standards as economic institutions. Inform. Econom. Pol-icy 6(3–4) 195–216.
Appleyard, M. 1996. How does knowledge flow? Interfirm patternsin the semiconductor industry. Strategic Management J. 17(Win-ter) 137–154.
Axelrod, R., W. Mitchell, R. E. Thomas, D. S. Bennett, E. Bruderer.1995. Coalition formation in standard-setting alliances. Man-agement Sci. 41(9) 1493–1508.
Bae, J., M. Gargiulo. 2004. Partner substitutability, alliance net-work structure, and firm profitability in the telecommunica-tions industry. Acad. Management J. 47(6) 843–859.
Baker, W. E. 1992. The network organization in theory and practice.N. Nohria, R. Eccles, eds. Networks and Organizations. HarvardBusiness School Press, Boston, 327–429.
Bala, V., S. Goyal. 2000. A noncooperative model of network for-mation. Econometrica 68(5) 1181–1229.
Barley, S., R. 1990. The alignment of technology and structurethrough roles and networks. Admin. Sci. Quart. 35(1) 61–103.
Benjamin, B. A., J. M. Podolny. 1999. Status, quality, and socialorder in the California wine industry. Admin. Sci. Quart. 44(3)563–589.
Bharadwaj, A. S. 2000. A resource-based perspective on informa-tion technology capability and firm performance: An empiricalinvestigation. MIS Quart. 24(1) 169–196.
Bonacich, P. 1987. Power and centrality: A family of measures.Amer. J. Sociol. 92(5) 1170–1182.
Borgatti, S. P., M. G. Everett, L. C. Freeman. 2002. UCInet VI forWindows: Software for Social Network Analysis. Analytic Tech-nologies, Lexington, KY.
Boynton, A. C. 1994. The influence of IT management practice onIT use in large organizations. MIS Quart. 18(3) 299–318.
Braun, N. 1997. A rational choice model of network status. Soc.Networks 19(2) 129–142.
Brueckner, J. K. 2001. The economics of international codesharing:An analysis of airline alliances. Internat. J. Indust. Organ. 19(10)1475–1498.
Brynjolfsson, E., C. F. Kemerer. 1996. Network externalities inmicrocomputer software: An econometric analysis of thespreadsheet market. Management Sci. 42(12) 1627–1647.
Burt, R. S. 1992. Structural Holes: The Social Structure of Competition.Harvard University Press, Cambridge, MA.
Burt, R. S. 2000. The network structure of social capital. R. I. Sutton,B. M. Staw, eds. Research in Organizational Behavior, Vol. 22. JAIPress, Greenwich, CT, 93.
Chan-Olmsted, S., M. Jamison. 2001. Rivalry through alliances:Competitive strategy in the global telecommunications market.Eur. Management J. 19(3) 317–331.
Chellappa, R. K., N. Saraf. 2000. Standards and alliances in non-standardized software industries. Proc. Americas Conf. Inform.Systems �AMCIS�, Long Beach, CA, 1618-1624.
Chen, P.-Y., C. Forman. 2006. Can vendors influence switching costsand compatibility in an environment with open standards?MIS Quart. 30(Special Issue) 541–562.
Chung, S., H. Sing, K. Lee. 2000. Complementarity, status similar-ity and social capital as drivers of alliance formation. StrategicManagement J. 21(1) 1–22.
Cohen, W. M., D. A. Levinthal. 1990. Absorptive capacity: A newperspective on learning and innovation. Admin. Sci. Quart.35(1) 128–152.
Contractor, N. S., D. R. Seibold, M. A. Heller. 1996. Interactionalinfluence in the structuring of media use in groups. HumanComm. Res. 22(4) 451–481.
Das, S., P. K. Sen, S. Sengupta. 1998. Impact of strategic allianceson firm valuation. Acad. Management J. 41(1) 27–41.
Das, T. K., B. S. Teng. 2000. A resource-based theory of strategicalliances. J. Management 26(1) 31–61.
Davenport, T. H. 1998. Putting the enterprise into the enterprisesystem. Harvard Bus. Rev. (July–August) 121–131.
David, P. A., S. Greenstein. 1990. The economics of compatibilitystandards: An introduction to recent research. Econom. Innova-tion New Tech. 1–2(1) 3–42.
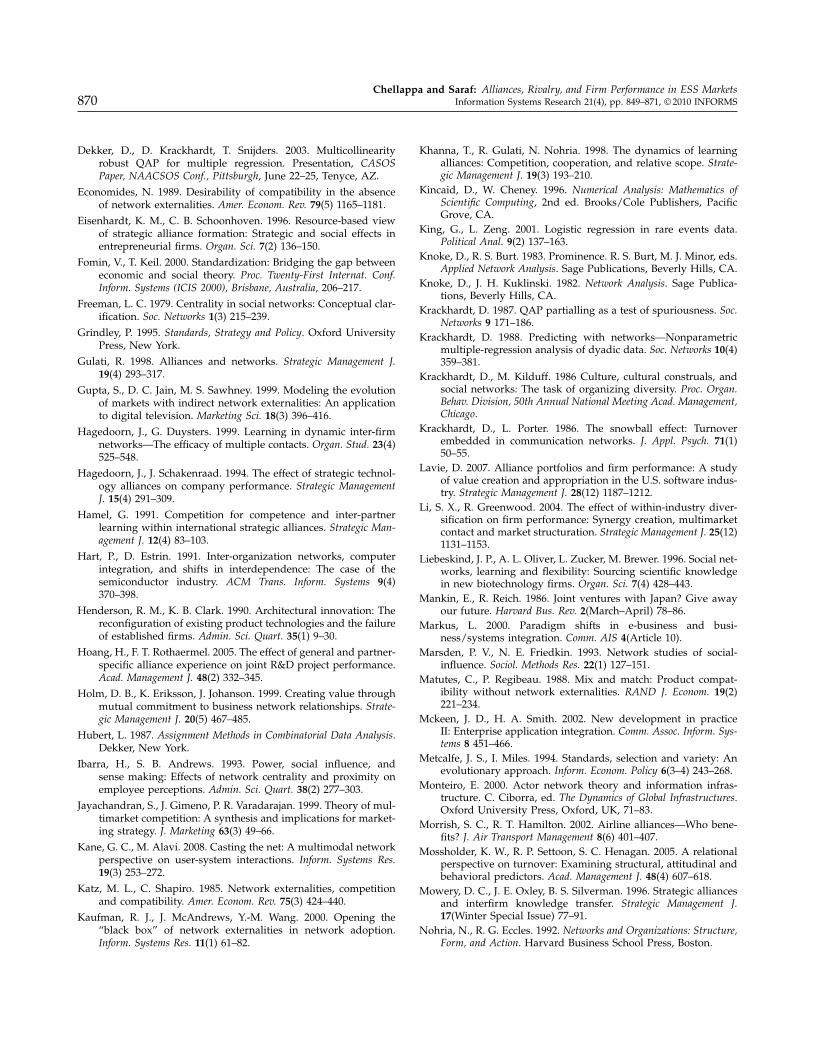
Chellappa and Saraf: Alliances, Rivalry, and Firm Performance in ESS Markets870 Information Systems Research 21(4), pp. 849–871, © 2010 INFORMS
Dekker, D., D. Krackhardt, T. Snijders. 2003. Multicollinearityrobust QAP for multiple regression. Presentation, CASOSPaper, NAACSOS Conf., Pittsburgh, June 22–25, Tenyce, AZ.
Economides, N. 1989. Desirability of compatibility in the absenceof network externalities. Amer. Econom. Rev. 79(5) 1165–1181.
Eisenhardt, K. M., C. B. Schoonhoven. 1996. Resource-based viewof strategic alliance formation: Strategic and social effects inentrepreneurial firms. Organ. Sci. 7(2) 136–150.
Fomin, V., T. Keil. 2000. Standardization: Bridging the gap betweeneconomic and social theory. Proc. Twenty-First Internat. Conf.Inform. Systems (ICIS 2000), Brisbane, Australia, 206–217.
Freeman, L. C. 1979. Centrality in social networks: Conceptual clar-ification. Soc. Networks 1(3) 215–239.
Grindley, P. 1995. Standards, Strategy and Policy. Oxford UniversityPress, New York.
Gulati, R. 1998. Alliances and networks. Strategic Management J.19(4) 293–317.
Gupta, S., D. C. Jain, M. S. Sawhney. 1999. Modeling the evolutionof markets with indirect network externalities: An applicationto digital television. Marketing Sci. 18(3) 396–416.
Hagedoorn, J., G. Duysters. 1999. Learning in dynamic inter-firmnetworks—The efficacy of multiple contacts. Organ. Stud. 23(4)525–548.
Hagedoorn, J., J. Schakenraad. 1994. The effect of strategic technol-ogy alliances on company performance. Strategic ManagementJ. 15(4) 291–309.
Hamel, G. 1991. Competition for competence and inter-partnerlearning within international strategic alliances. Strategic Man-agement J. 12(4) 83–103.
Hart, P., D. Estrin. 1991. Inter-organization networks, computerintegration, and shifts in interdependence: The case of thesemiconductor industry. ACM Trans. Inform. Systems 9(4)370–398.
Henderson, R. M., K. B. Clark. 1990. Architectural innovation: Thereconfiguration of existing product technologies and the failureof established firms. Admin. Sci. Quart. 35(1) 9–30.
Hoang, H., F. T. Rothaermel. 2005. The effect of general and partner-specific alliance experience on joint R&D project performance.Acad. Management J. 48(2) 332–345.
Holm, D. B., K. Eriksson, J. Johanson. 1999. Creating value throughmutual commitment to business network relationships. Strate-gic Management J. 20(5) 467–485.
Hubert, L. 1987. Assignment Methods in Combinatorial Data Analysis.Dekker, New York.
Ibarra, H., S. B. Andrews. 1993. Power, social influence, andsense making: Effects of network centrality and proximity onemployee perceptions. Admin. Sci. Quart. 38(2) 277–303.
Jayachandran, S., J. Gimeno, P. R. Varadarajan. 1999. Theory of mul-timarket competition: A synthesis and implications for market-ing strategy. J. Marketing 63(3) 49–66.
Kane, G. C., M. Alavi. 2008. Casting the net: A multimodal networkperspective on user-system interactions. Inform. Systems Res.19(3) 253–272.
Katz, M. L., C. Shapiro. 1985. Network externalities, competitionand compatibility. Amer. Econom. Rev. 75(3) 424–440.
Kaufman, R. J., J. McAndrews, Y.-M. Wang. 2000. Opening the“black box” of network externalities in network adoption.Inform. Systems Res. 11(1) 61–82.
Khanna, T., R. Gulati, N. Nohria. 1998. The dynamics of learningalliances: Competition, cooperation, and relative scope. Strate-gic Management J. 19(3) 193–210.
Kincaid, D., W. Cheney. 1996. Numerical Analysis: Mathematics ofScientific Computing, 2nd ed. Brooks/Cole Publishers, PacificGrove, CA.
King, G., L. Zeng. 2001. Logistic regression in rare events data.Political Anal. 9(2) 137–163.
Knoke, D., R. S. Burt. 1983. Prominence. R. S. Burt, M. J. Minor, eds.Applied Network Analysis. Sage Publications, Beverly Hills, CA.
Knoke, D., J. H. Kuklinski. 1982. Network Analysis. Sage Publica-tions, Beverly Hills, CA.
Krackhardt, D. 1987. QAP partialling as a test of spuriousness. Soc.Networks 9 171–186.
Krackhardt, D. 1988. Predicting with networks—Nonparametricmultiple-regression analysis of dyadic data. Soc. Networks 10(4)359–381.
Krackhardt, D., M. Kilduff. 1986 Culture, cultural construals, andsocial networks: The task of organizing diversity. Proc. Organ.Behav. Division, 50th Annual National Meeting Acad. Management,Chicago.
Krackhardt, D., L. Porter. 1986. The snowball effect: Turnoverembedded in communication networks. J. Appl. Psych. 71(1)50–55.
Lavie, D. 2007. Alliance portfolios and firm performance: A studyof value creation and appropriation in the U.S. software indus-try. Strategic Management J. 28(12) 1187–1212.
Li, S. X., R. Greenwood. 2004. The effect of within-industry diver-sification on firm performance: Synergy creation, multimarketcontact and market structuration. Strategic Management J. 25(12)1131–1153.
Liebeskind, J. P., A. L. Oliver, L. Zucker, M. Brewer. 1996. Social net-works, learning and flexibility: Sourcing scientific knowledgein new biotechnology firms. Organ. Sci. 7(4) 428–443.
Mankin, E., R. Reich. 1986. Joint ventures with Japan? Give awayour future. Harvard Bus. Rev. 2(March–April) 78–86.
Markus, L. 2000. Paradigm shifts in e-business and busi-ness/systems integration. Comm. AIS 4(Article 10).
Marsden, P. V., N. E. Friedkin. 1993. Network studies of social-influence. Sociol. Methods Res. 22(1) 127–151.
Matutes, C., P. Regibeau. 1988. Mix and match: Product compat-ibility without network externalities. RAND J. Econom. 19(2)221–234.
Mckeen, J. D., H. A. Smith. 2002. New development in practiceII: Enterprise application integration. Comm. Assoc. Inform. Sys-tems 8 451–466.
Metcalfe, J. S., I. Miles. 1994. Standards, selection and variety: Anevolutionary approach. Inform. Econom. Policy 6(3–4) 243–268.
Monteiro, E. 2000. Actor network theory and information infras-tructure. C. Ciborra, ed. The Dynamics of Global Infrastructures.Oxford University Press, Oxford, UK, 71–83.
Morrish, S. C., R. T. Hamilton. 2002. Airline alliances—Who bene-fits? J. Air Transport Management 8(6) 401–407.
Mossholder, K. W., R. P. Settoon, S. C. Henagan. 2005. A relationalperspective on turnover: Examining structural, attitudinal andbehavioral predictors. Acad. Management J. 48(4) 607–618.
Mowery, D. C., J. E. Oxley, B. S. Silverman. 1996. Strategic alliancesand interfirm knowledge transfer. Strategic Management J.17(Winter Special Issue) 77–91.
Nohria, N., R. G. Eccles. 1992. Networks and Organizations: Structure,Form, and Action. Harvard Business School Press, Boston.
Chellappa and Saraf: Alliances, Rivalry, and Firm Performance in ESS MarketsInformation Systems Research 21(4), pp. 849–871, © 2010 INFORMS 871
Padgett, J. F., C. K. Ansell. 1993. Robust action and the rise of theMedici, 1400–1434. Amer. J. Sociol. 98(6) 1259–1319.
Park, S. H., G. R. Ungson. 2001. Interfirm rivalry and managerialcomplexity: A conceptual framework of alliance failure. Organ.Sci. 12(1) 37–53.
Parkhe, A. 1993. Strategic alliance structuring: A game theoretic andtransaction cost examination of interfirm cooperation. Acad.Management J. 36(4) 794–829.
Pfeffer, J., G. R. Salancik. 1978. The External Control of Organizations:A Resource Dependence Perspective. Harper & Row, New York.
Podolny, J. M. 1993. A status-based model of market competition.Amer. J. Sociol. 98(4) 829–872.
Podolny, J. M. 2001. Networks as the pipes and prisms of the mar-ket. Amer. J. Sociol. 107(1) 33–60.
Podolny, J. M., T. E. Stuart, M. T. Hannan. 1996. Networks, knowl-edge and niches: Competition in the worldwide semiconductorindustry, 1984–1991. Amer. J. Sociol. 102(2) 659–89.
Portes, A. 1998. Social capital: Its origins and applications in mod-ern sociology. Annual Rev. Sociol. 24 1–24.
Rochet, J. C., J. Tirole. 2006. Two-sided markets: A progress report.RAND J. Econom. 37(3) 645–667.
Saloner, G. 1990. Economic issues in computer interface standard-ization. Econom. Innovation New Tech. 1(1–2) 135–156.
Sarkar, M. B., R. A. J. Echambadi, J. S. Harrison. 2001. Allianceentrepreurship and firm market performance. Strategic Man-agement J. 22(6–7) 701–711.
Sasovova, Z. 2006. To dislike and to be liked: Self monitoring, affect-intensive relations and work performance. Proc. 66th AnnualMeeting Acad. Management, Atlanta.
Stewart, D. 1996. Managing market structure: Achieving compet-itive advantage and market dominance. J. Management Issues8(1) 13–34.
Stohl, C. 1993. European manager’s interpretations of participation.Human Comm. Res. 20(1) 97–117.
Stuart, T. E. 1998. Network positions and propensities to collabo-rate: An investigation of strategic alliance formation in a high-technology industry. Admin. Sc. Quart. 43(3) 668–698.
Stuart, T. E. 2000. Interorganizational alliances and the perfor-mance of firms: A study of growth and innovation ratesin a high-technology industry. Strategic Management J. 21(8)791–811.
Stuart, T. E., H. Hoang, R. C. Hybels. 1999. Interorganizationalendorsements and the performance of entrepreneurial ven-tures. Admin. Sci. Quart. 44(2) 315–349.
Suarez, F. F., J. M. Utterback. 1995. Dominant designs and the sur-vival of firms. Strategic Management J. 16(6) 415–430.
Tichy, N. M., M. L. Tushman, C. Fombrun. 1979. Social networkanalysis for organizations. Acad. Management Rev. 4(4) 507–519.
Walker, G., B. Kogut, W. Shan. 1997. Social capital, structural holesand the formation of an industry network. Organ. Sci. 8(2)109–125.
Wasko, M. M., S. Faraj. 2005. Why should I share? Examining socialcapital and knowledge contribution in electronic networks ofpractice. MIS Quart. 29(1) 35–58.
Wasserman, S., K. Faust. 1994. Social Network Analysis. CambridgeUniversity Press, Cambridge, UK.
West, J., J. Dedrick. 2000. Innovation and control in standards archi-tectures: The rise and fall of Japan’s PC-98. Inform. Systems Res.11(2) 197–216.
Yang, J., M. P. Papazoglou. 2000. Interoperation support for elec-tronic business. Comm. ACM 43(6) 39–47.
Zeggelink, E. P. H., F. N. Stokman, G. G. Van De Bunt. 1996. Theemergence of groups in the evolution of friendship networks.J. Math. Sociol. 21(1–2) 29–55.