all means all -...
TRANSCRIPT

ALL
MEANS
ALL
2017-18 Budget
Work SessionJan. 26, 2017

Agenda
• Technology
• Professional Development
• Instructional Departments
• Equity & Access Initiative

ALL
MEANS
ALL
2017-18 Budget
Work SessionTechnology
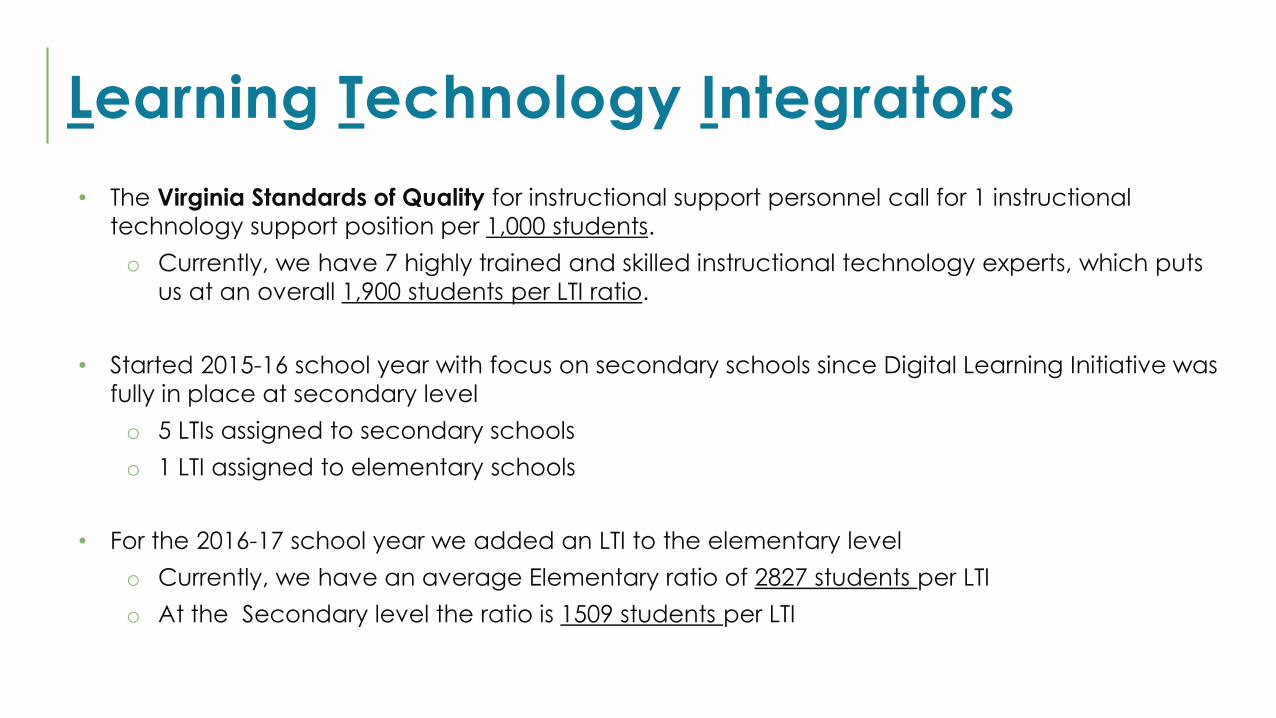
Learning Technology Integrators
• The Virginia Standards of Quality for instructional support personnel call for 1 instructional
technology support position per 1,000 students.
o Currently, we have 7 highly trained and skilled instructional technology experts, which puts
us at an overall 1,900 students per LTI ratio.
• Started 2015-16 school year with focus on secondary schools since Digital Learning Initiative was
fully in place at secondary level
o 5 LTIs assigned to secondary schools
o 1 LTI assigned to elementary schools
• For the 2016-17 school year we added an LTI to the elementary level
o Currently, we have an average Elementary ratio of 2827 students per LTI
o At the Secondary level the ratio is 1509 students per LTI
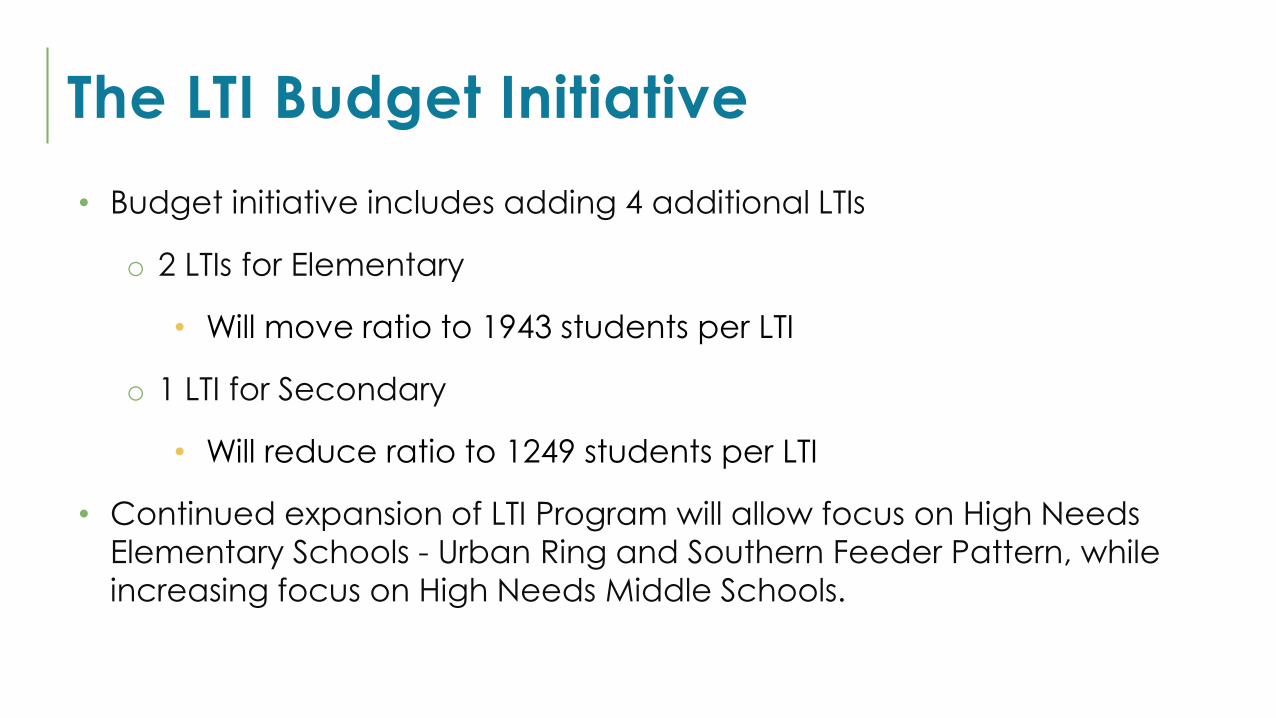
The LTI Budget Initiative
• Budget initiative includes adding 4 additional LTIs
o 2 LTIs for Elementary
• Will move ratio to 1943 students per LTI
o 1 LTI for Secondary
• Will reduce ratio to 1249 students per LTI
• Continued expansion of LTI Program will allow focus on High Needs
Elementary Schools - Urban Ring and Southern Feeder Pattern, while
increasing focus on High Needs Middle Schools.
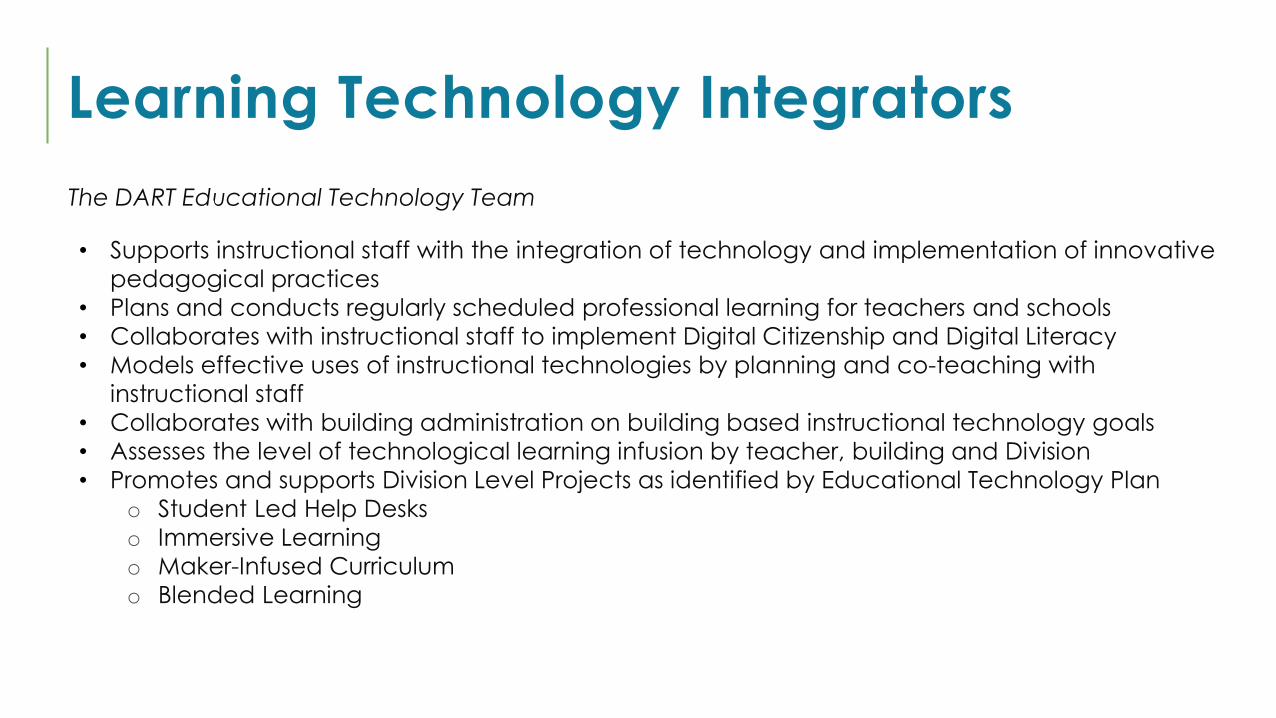
Learning Technology Integrators
The DART Educational Technology Team
• Supports instructional staff with the integration of technology and implementation of innovative
pedagogical practices
• Plans and conducts regularly scheduled professional learning for teachers and schools
• Collaborates with instructional staff to implement Digital Citizenship and Digital Literacy
• Models effective uses of instructional technologies by planning and co-teaching with
instructional staff
• Collaborates with building administration on building based instructional technology goals
• Assesses the level of technological learning infusion by teacher, building and Division
• Promotes and supports Division Level Projects as identified by Educational Technology Plan
o Student Led Help Desks
o Immersive Learning
o Maker-Infused Curriculum
o Blended Learning
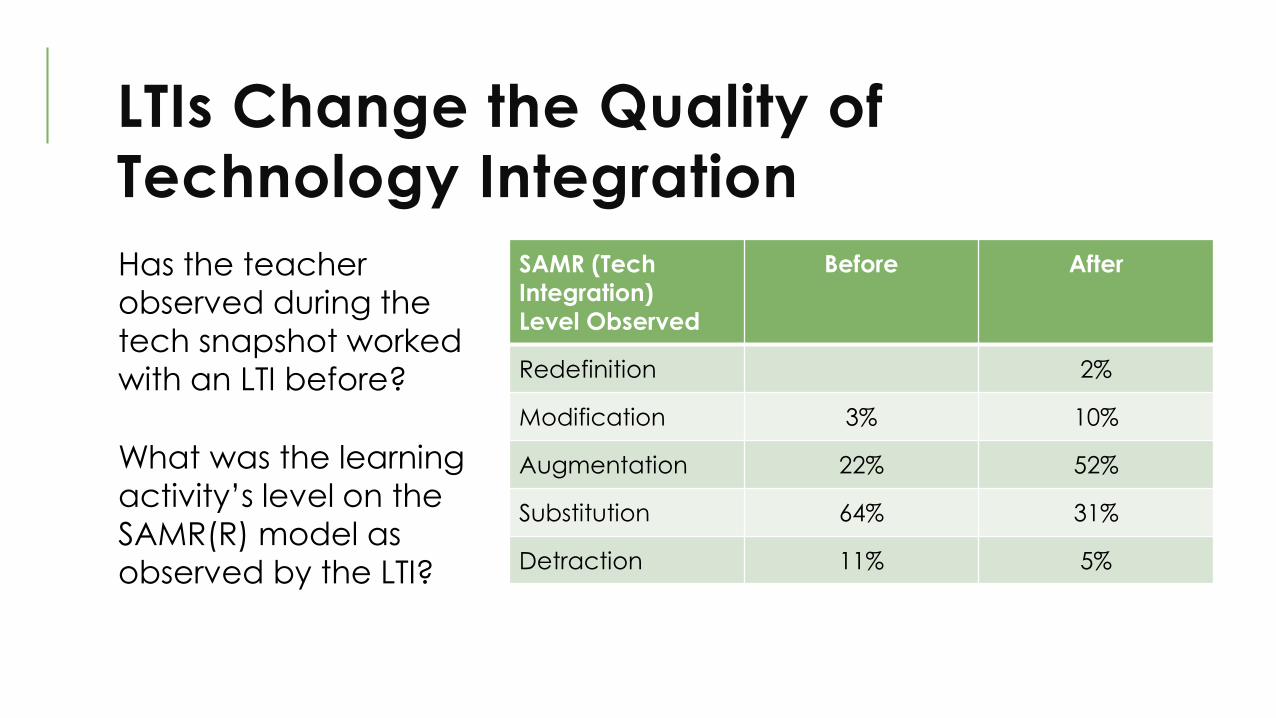
LTIs Change the Quality of
Technology Integration
Has the teacher
observed during the
tech snapshot worked
with an LTI before?
What was the learning
activity’s level on the
SAMR(R) model as
observed by the LTI?
SAMR (Tech
Integration)
Level Observed
Before After
Redefinition 2%
Modification 3% 10%
Augmentation 22% 52%
Substitution 64% 31%
Detraction 11% 5%
Learning Technology Integrators
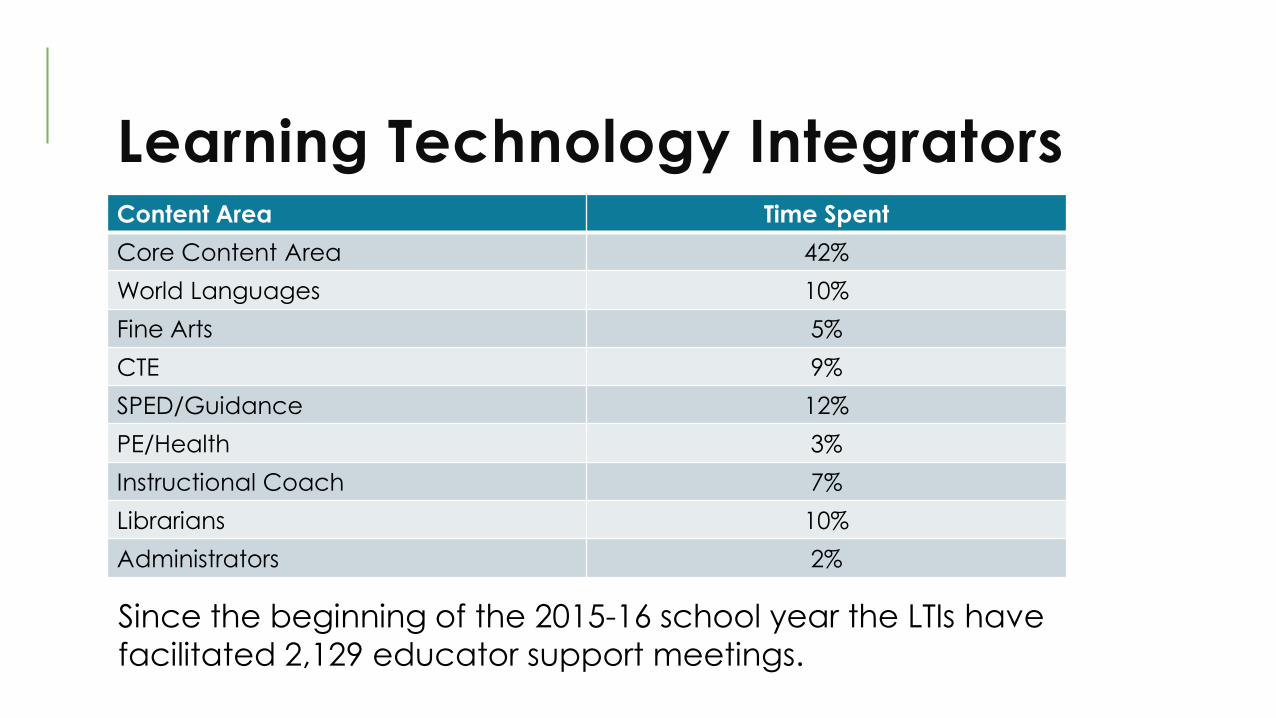
Since the beginning of the 2015-16 school year the LTIs have
facilitated 2,129 educator support meetings.
Content Area Time Spent
Core Content Area 42%
World Languages 10%
Fine Arts 5%
CTE 9%
SPED/Guidance 12%
PE/Health 3%
Instructional Coach 7%
Librarians 10%
Administrators 2%
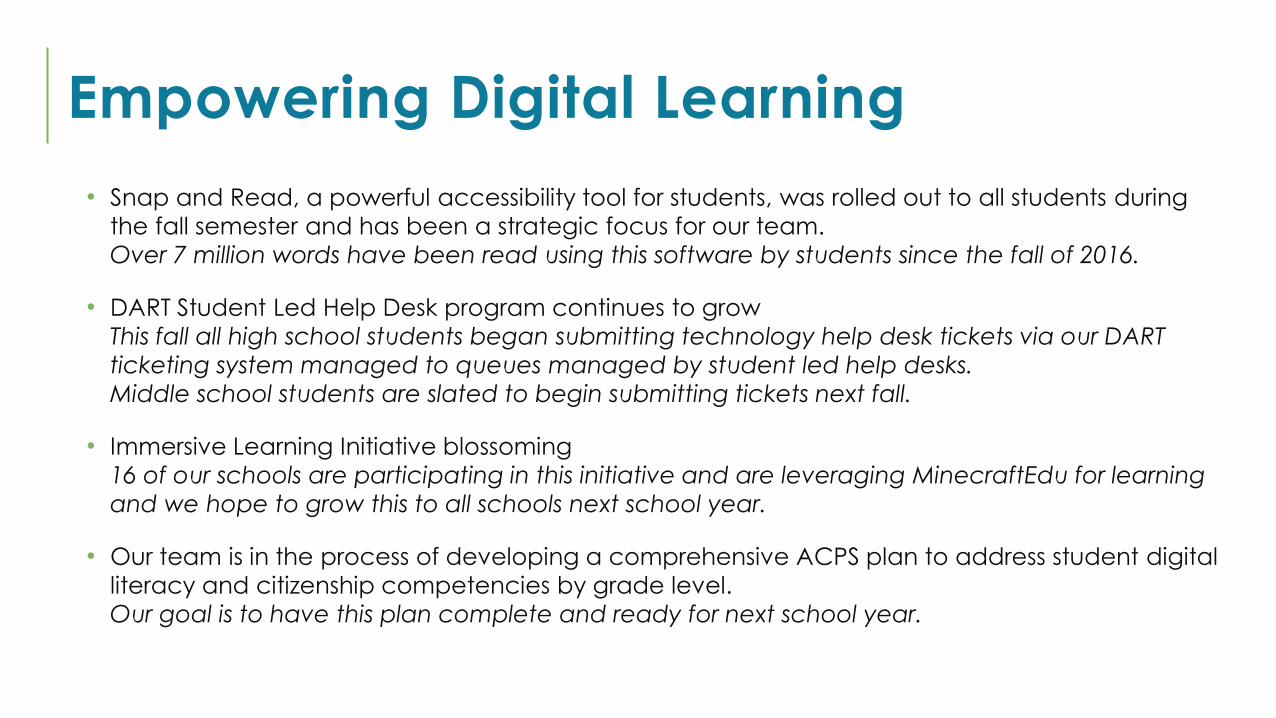
Empowering Digital Learning
• Snap and Read, a powerful accessibility tool for students, was rolled out to all students during
the fall semester and has been a strategic focus for our team.
Over 7 million words have been read using this software by students since the fall of 2016.
• DART Student Led Help Desk program continues to grow
This fall all high school students began submitting technology help desk tickets via our DART
ticketing system managed to queues managed by student led help desks.
Middle school students are slated to begin submitting tickets next fall.
• Immersive Learning Initiative blossoming
16 of our schools are participating in this initiative and are leveraging MinecraftEdu for learning
and we hope to grow this to all schools next school year.
• Our team is in the process of developing a comprehensive ACPS plan to address student digital
literacy and citizenship competencies by grade level.
Our goal is to have this plan complete and ready for next school year.

ALL
MEANS
ALL
2017-18 Budget
Work SessionProfessional
Development
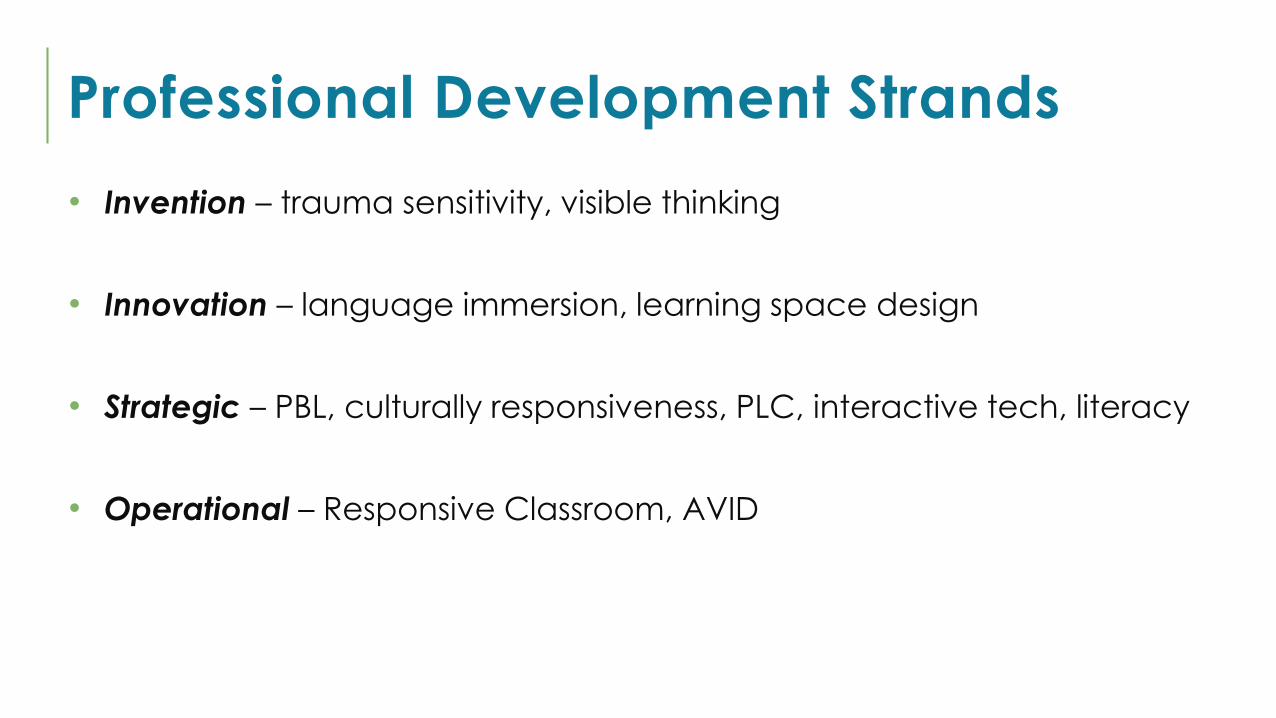
Professional Development Strands
• Invention – trauma sensitivity, visible thinking
• Innovation – language immersion, learning space design
• Strategic – PBL, culturally responsiveness, PLC, interactive tech, literacy
• Operational – Responsive Classroom, AVID
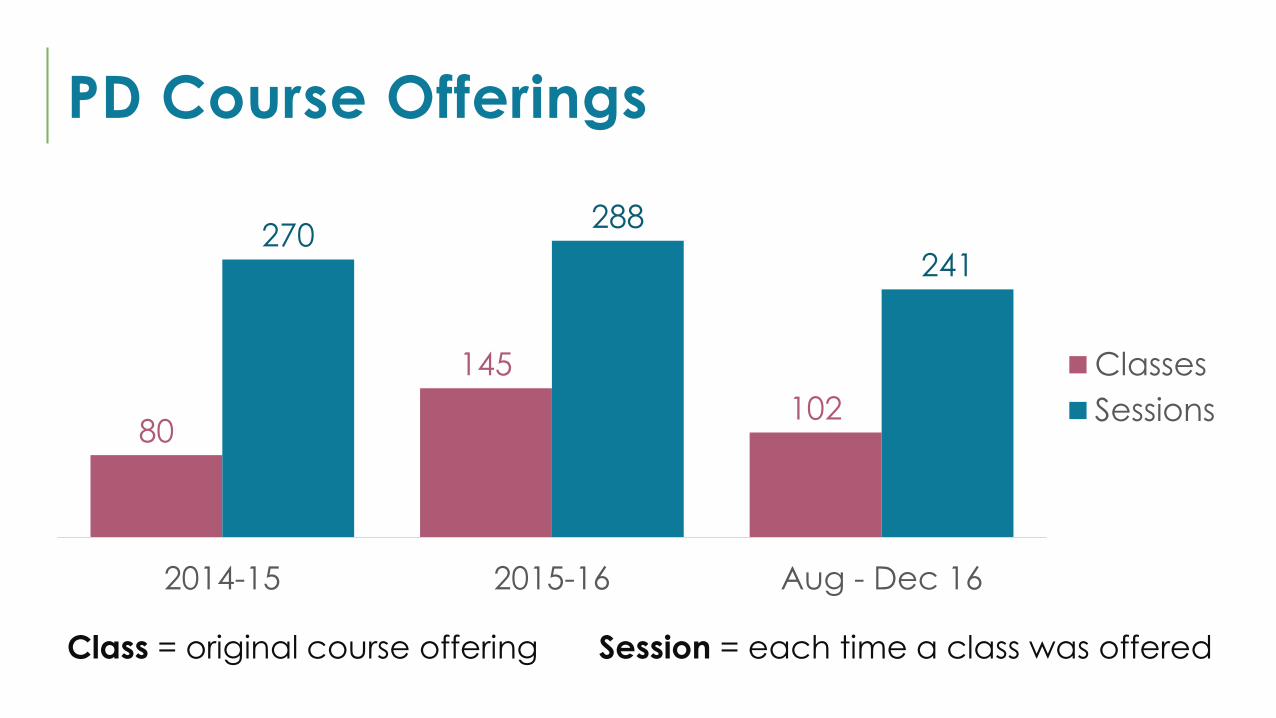
PD Course Offerings
Class = original course offering Session = each time a class was offered
80
145
102
270288
241
2014-15 2015-16 Aug - Dec 16
Classes
Sessions

ALL
MEANS
ALL
2017-18 Budget
Work SessionInstructional
Departments
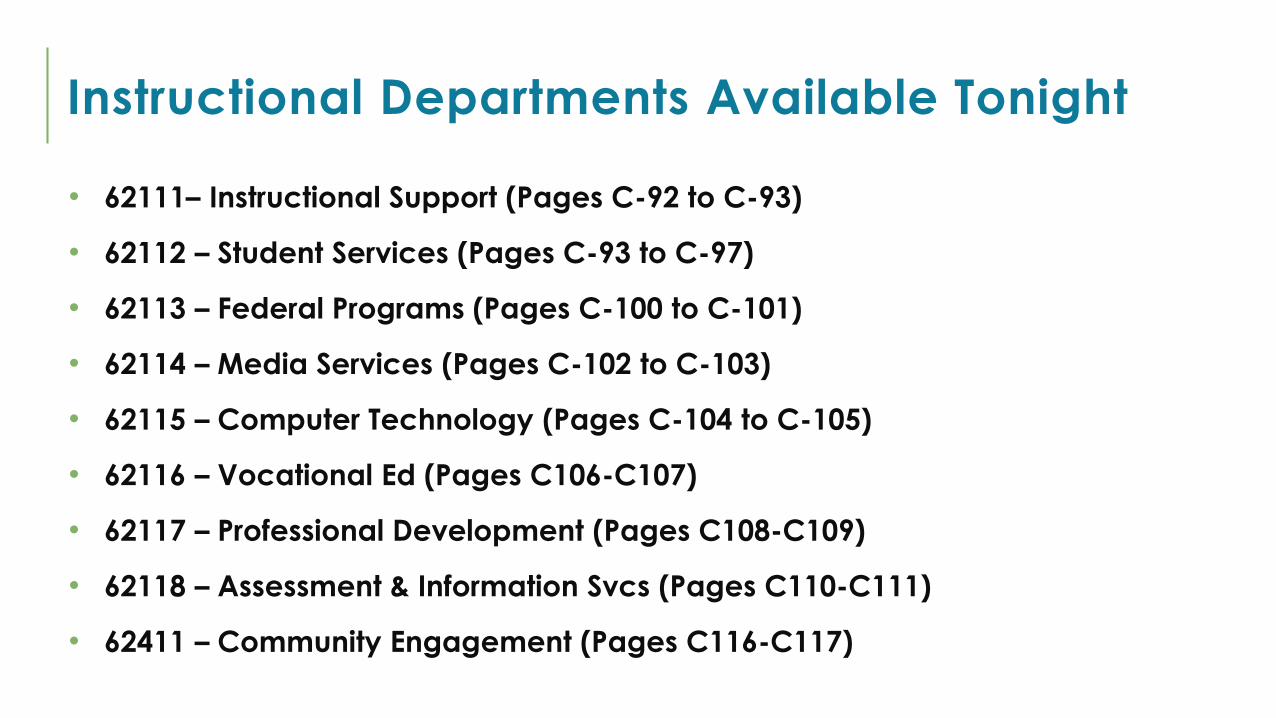
Instructional Departments Available Tonight
• 62111– Instructional Support (Pages C-92 to C-93)
• 62112 – Student Services (Pages C-93 to C-97)
• 62113 – Federal Programs (Pages C-100 to C-101)
• 62114 – Media Services (Pages C-102 to C-103)
• 62115 – Computer Technology (Pages C-104 to C-105)
• 62116 – Vocational Ed (Pages C106-C107)
• 62117 – Professional Development (Pages C108-C109)
• 62118 – Assessment & Information Svcs (Pages C110-C111)
• 62411 – Community Engagement (Pages C116-C117)

ALL
MEANS
ALL
2017-18 Budget
Work SessionEquity & Access
Initiative
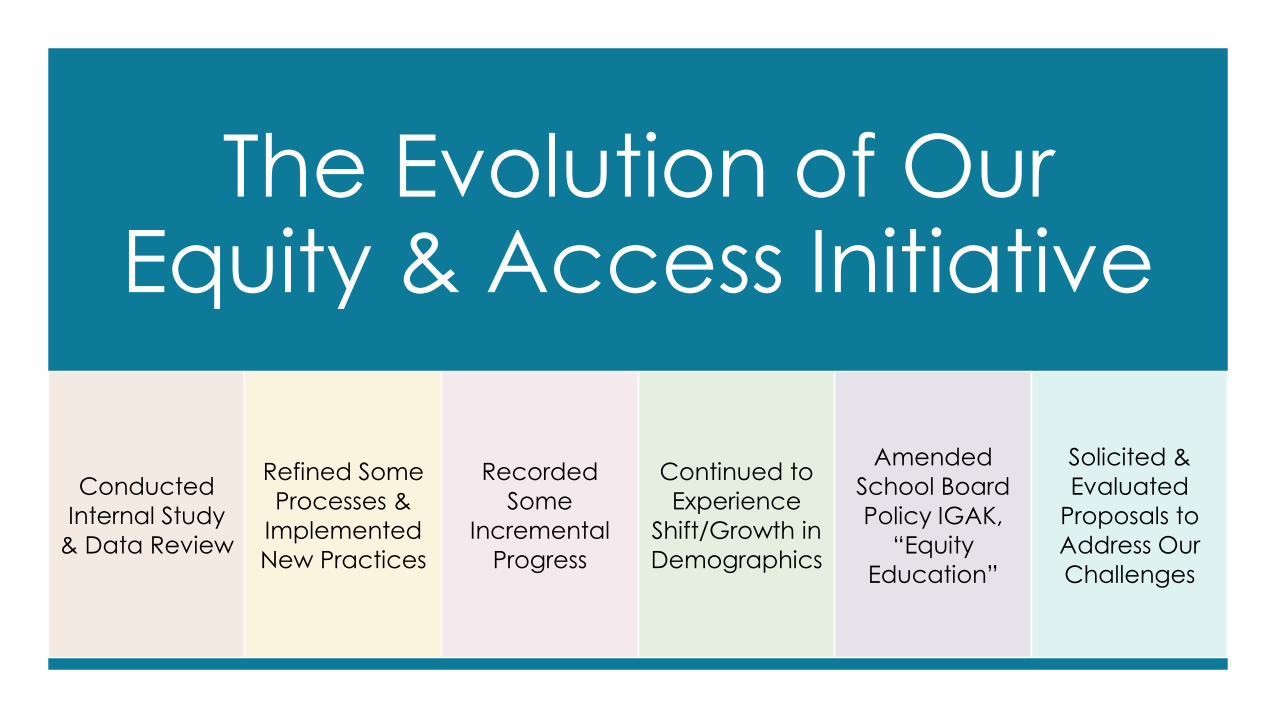
The Evolution of Our Equity & Access Initiative
Conducted
Internal Study
& Data Review
Refined Some
Processes &
Implemented
New Practices
Recorded
Some
Incremental
Progress
Continued to
Experience
Shift/Growth in
Demographics
Amended
School Board
Policy IGAK,
“Equity
Education”
Solicited &
Evaluated
Proposals to
Address Our
Challenges

ALL
MEANS
ALL
Equity & AccessDemographics
& Gaps in Data
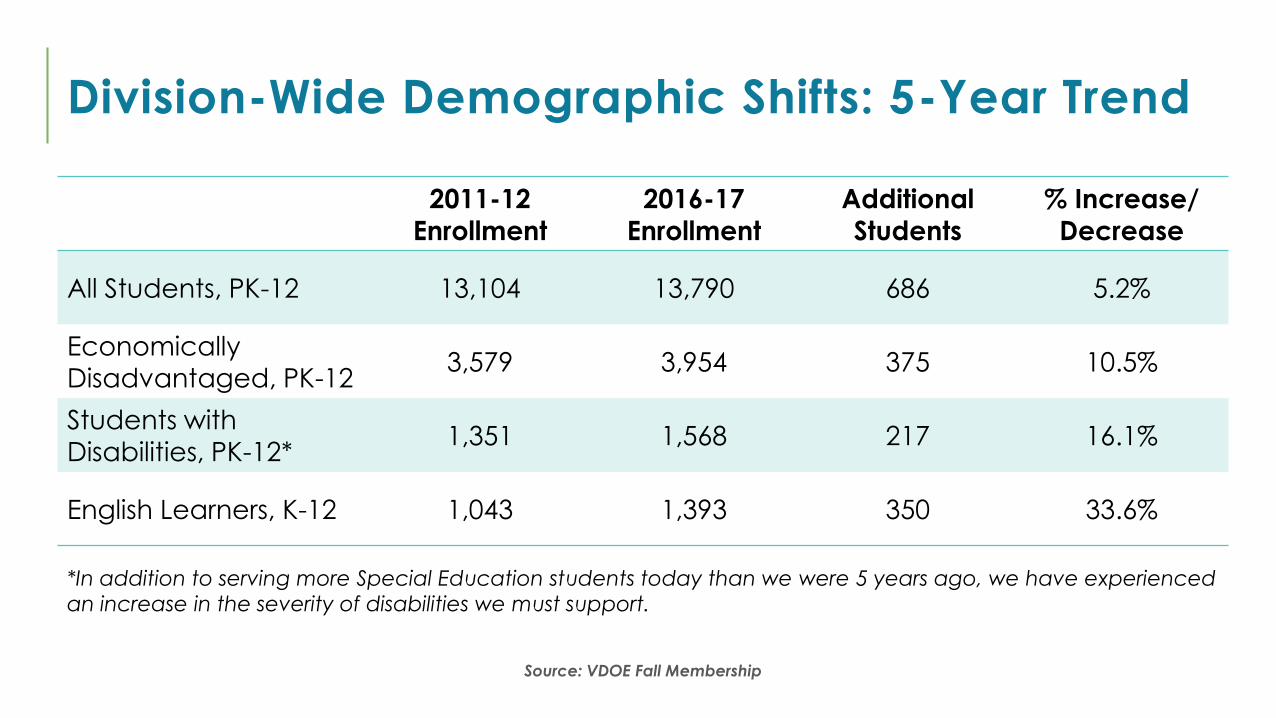
Division-Wide Demographic Shifts: 5-Year Trend
2011-12
Enrollment
2016-17
Enrollment
Additional
Students
% Increase/
Decrease
All Students, PK-12 13,104 13,790 686 5.2%
Economically
Disadvantaged, PK-123,579 3,954 375 10.5%
Students with
Disabilities, PK-12*1,351 1,568 217 16.1%
English Learners, K-12 1,043 1,393 350 33.6%
*In addition to serving more Special Education students today than we were 5 years ago, we have experienced
an increase in the severity of disabilities we must support.
Source: VDOE Fall Membership
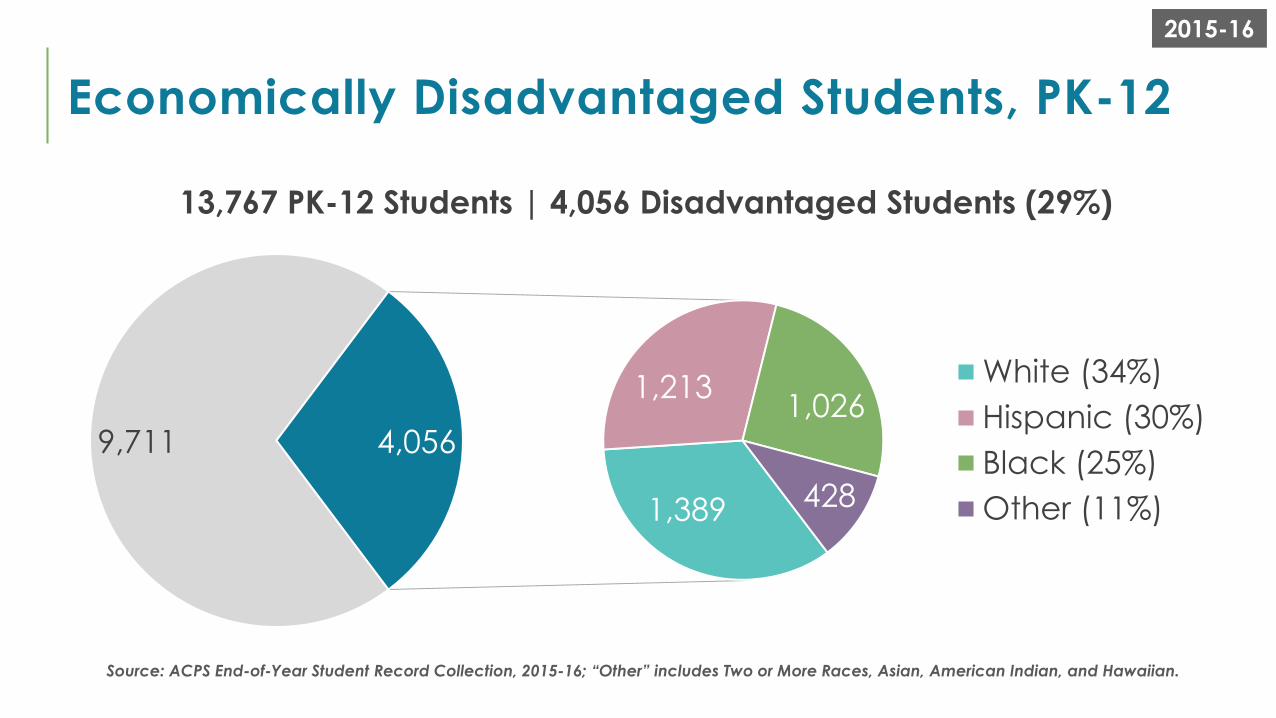
Economically Disadvantaged Students, PK-12
2015-16
9,711
1,389
1,2131,026
428
4,056
White (34%)
Hispanic (30%)
Black (25%)
Other (11%)
Source: ACPS End-of-Year Student Record Collection, 2015-16; “Other” includes Two or More Races, Asian, American Indian, and Hawaiian.
13,767 PK-12 Students | 4,056 Disadvantaged Students (29%)
Influence of Poverty on Education
“A large number of students coming to school from poverty live in a
chronic state of stress.”
– Eric Jensen, veteran educator and brain expert; author of "Teaching with Poverty in
Mind" and "Engaging Students with Poverty in Mind"
“Research has been very consistent in showing that children who live in
poverty and have grown up in poverty need more resources in school to
level the playing field and make sure they have access to some of the
resources, or most of the resources, that their more affluent peers have.”
– Nancy Loome, Executive Director at The Parents' Campaign
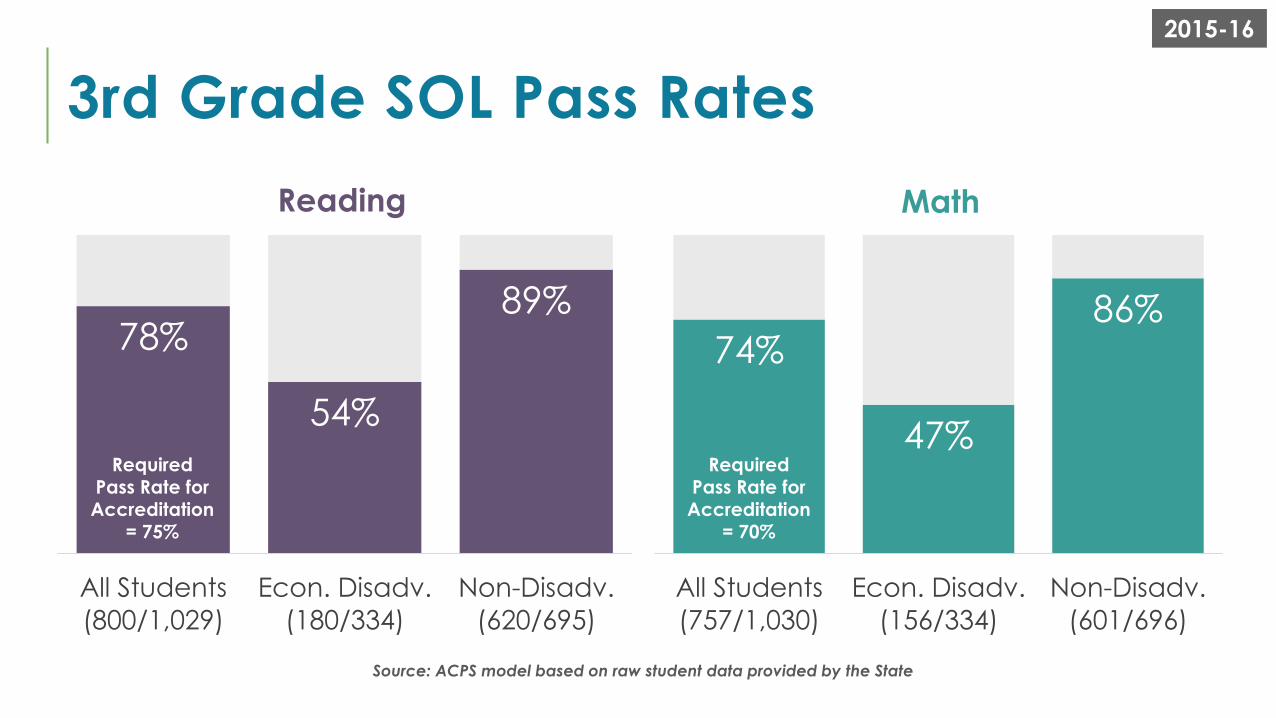
3rd Grade SOL Pass Rates
78%
54%
89%
All Students
(800/1,029)
Econ. Disadv.
(180/334)
Non-Disadv.
(620/695)
Reading
74%
47%
86%
All Students
(757/1,030)
Econ. Disadv.
(156/334)
Non-Disadv.
(601/696)
Math
2015-16
Source: ACPS model based on raw student data provided by the State
Required Pass Rate for Accreditation
= 75%
Required Pass Rate for Accreditation
= 70%
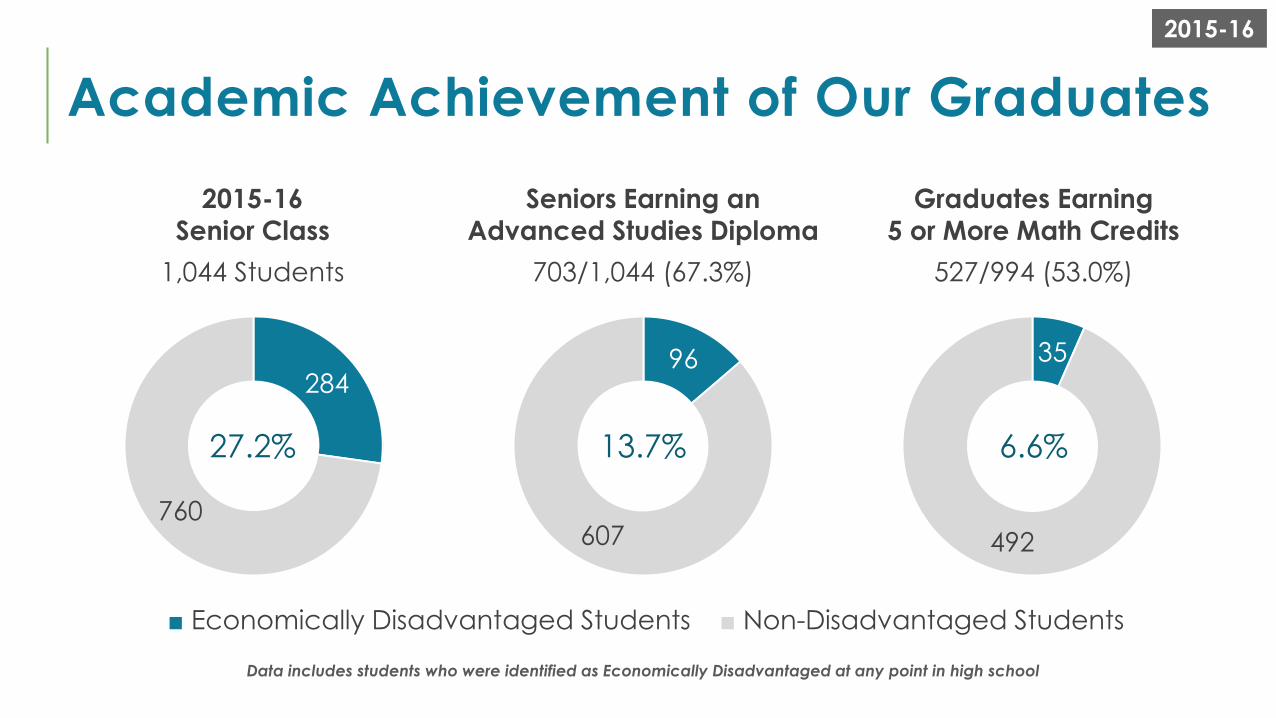
284
760
Academic Achievement of Our Graduates
2015-16
Senior Class
Seniors Earning an
Advanced Studies Diploma
Graduates Earning
5 or More Math Credits
1,044 Students 703/1,044 (67.3%) 527/994 (53.0%)
2015-16
Data includes students who were identified as Economically Disadvantaged at any point in high school
35
492
96
607
27.2% 13.7% 6.6%
■ Economically Disadvantaged Students ■ Non-Disadvantaged Students
4,056
9,711
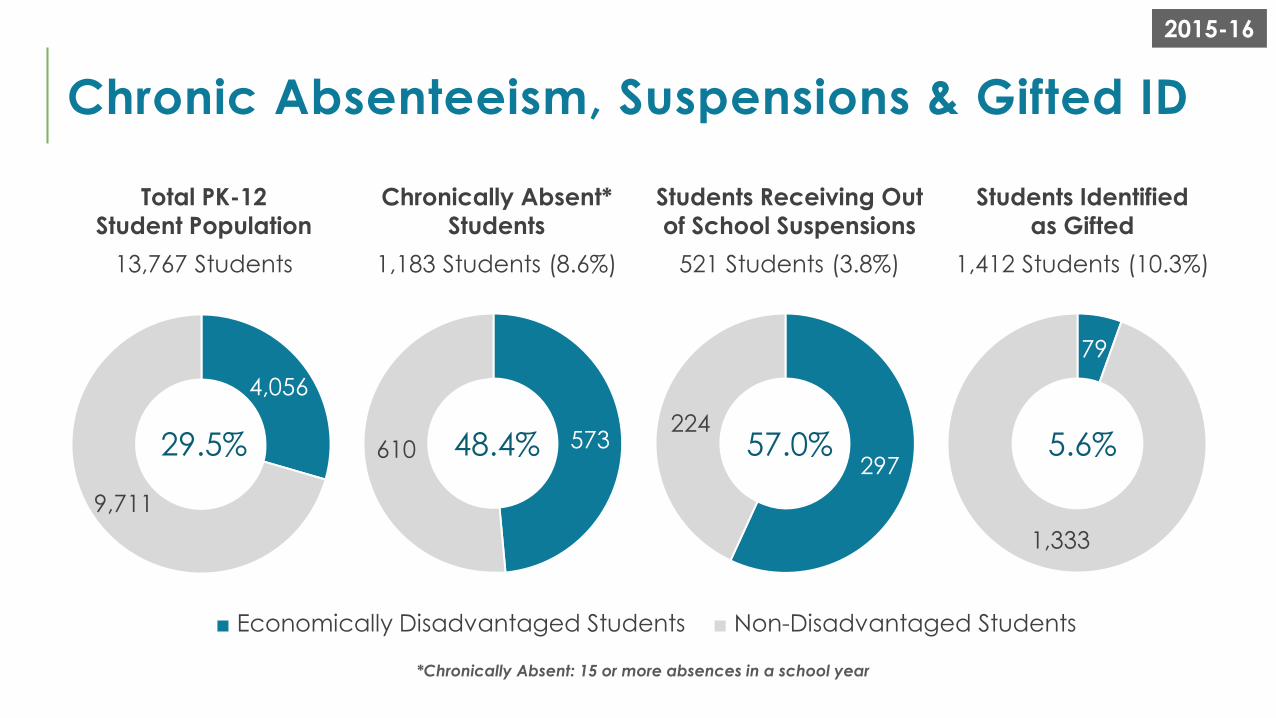
Chronic Absenteeism, Suspensions & Gifted ID
Total PK-12
Student Population
Chronically Absent*
Students
Students Receiving Out
of School Suspensions
Students Identified
as Gifted
13,767 Students 1,183 Students (8.6%) 521 Students (3.8%) 1,412 Students (10.3%)
2015-16
■ Economically Disadvantaged Students ■ Non-Disadvantaged Students
*Chronically Absent: 15 or more absences in a school year
573610297
224
79
1,333
29.5% 48.4% 57.0% 5.6%

ALL
MEANS
ALL
Equity & AccessUrban Ring
Elementary
Schools
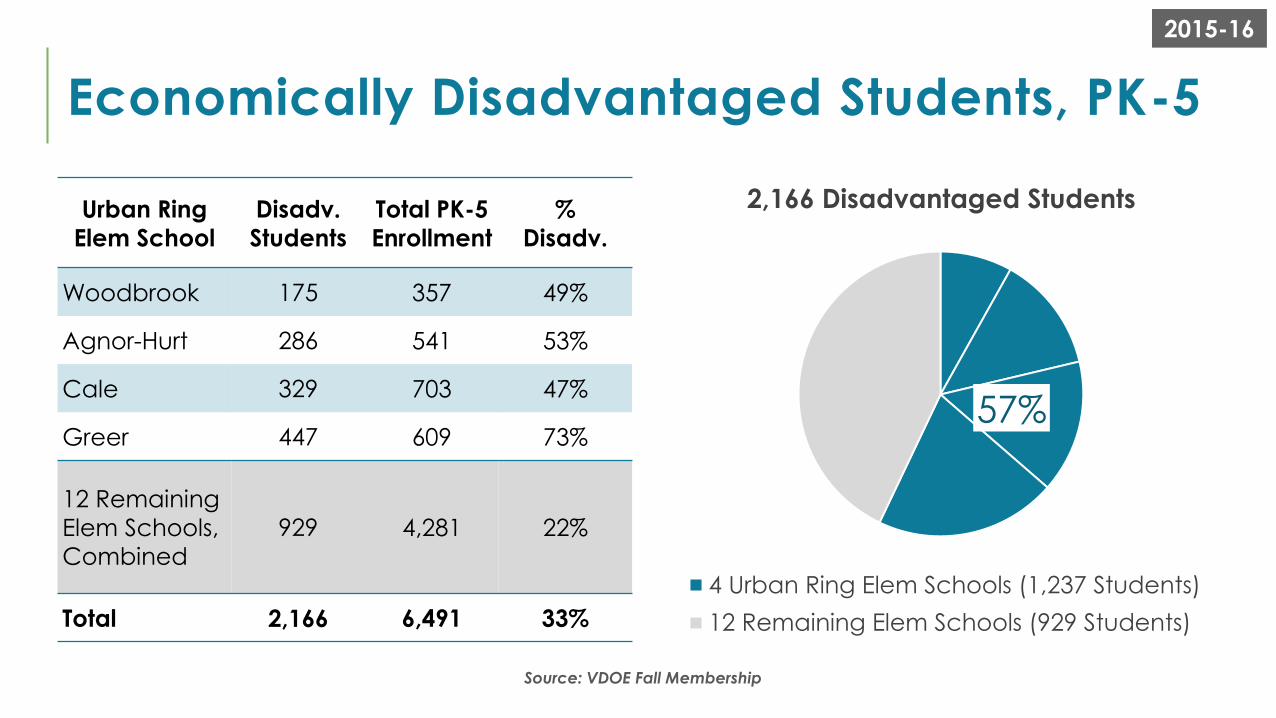
Economically Disadvantaged Students, PK-5
2015-16
Urban Ring
Elem School
Disadv.
Students
Total PK-5
Enrollment
%
Disadv.
Woodbrook 175 357 49%
Agnor-Hurt 286 541 53%
Cale 329 703 47%
Greer 447 609 73%
12 Remaining
Elem Schools,
Combined
929 4,281 22%
Total 2,166 6,491 33%
57%
4 Urban Ring Elem Schools (1,237 Students)
12 Remaining Elem Schools (929 Students)
Source: VDOE Fall Membership
2,166 Disadvantaged Students
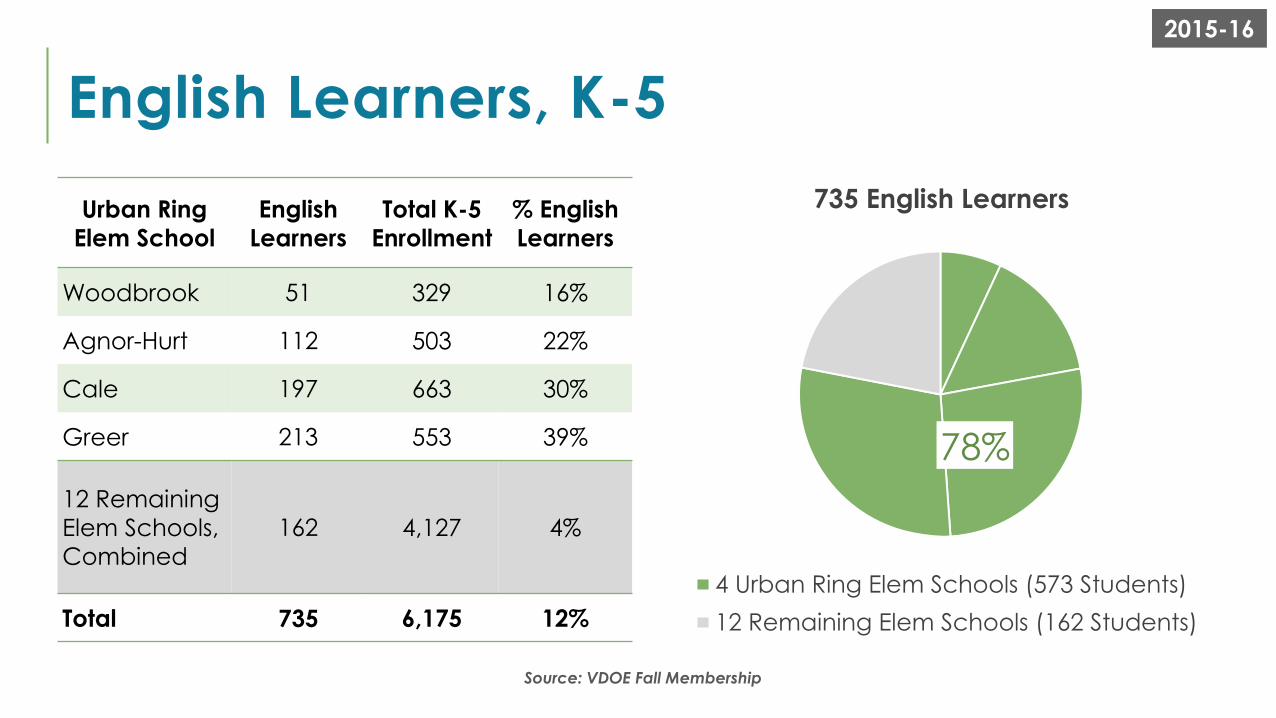
English Learners, K-5
2015-16
Urban Ring
Elem School
English
Learners
Total K-5
Enrollment
% English
Learners
Woodbrook 51 329 16%
Agnor-Hurt 112 503 22%
Cale 197 663 30%
Greer 213 553 39%
12 Remaining
Elem Schools,
Combined
162 4,127 4%
Total 735 6,175 12%
Source: VDOE Fall Membership
735 English Learners
78%
4 Urban Ring Elem Schools (573 Students)
12 Remaining Elem Schools (162 Students)
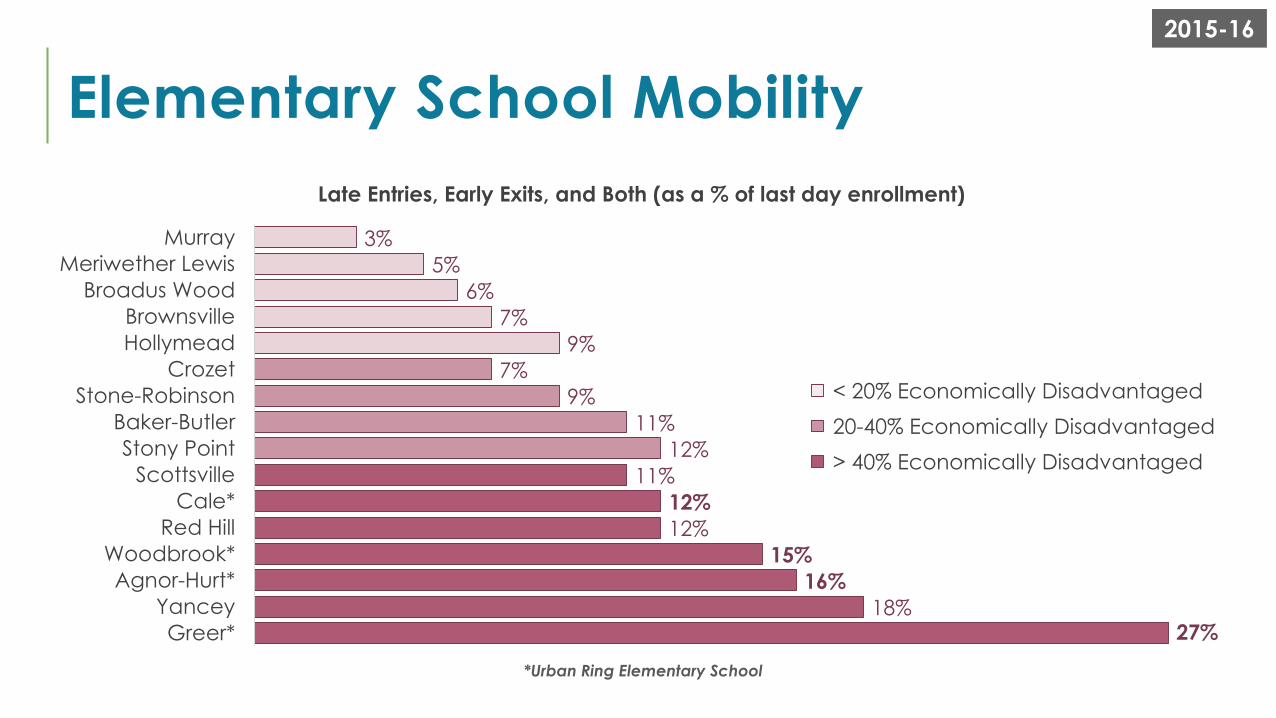
Elementary School Mobility
3%
5%
6%
7%
9%
7%
9%
11%
12%
11%
12%
12%
15%
16%
18%27%
Murray
Meriwether Lewis
Broadus Wood
Brownsville
Hollymead
Crozet
Stone-Robinson
Baker-Butler
Stony Point
Scottsville
Cale*
Red Hill
Woodbrook*
Agnor-Hurt*
Yancey
Greer*
Late Entries, Early Exits, and Both (as a % of last day enrollment)
< 20% Economically Disadvantaged
20-40% Economically Disadvantaged
> 40% Economically Disadvantaged
2015-16
*Urban Ring Elementary School
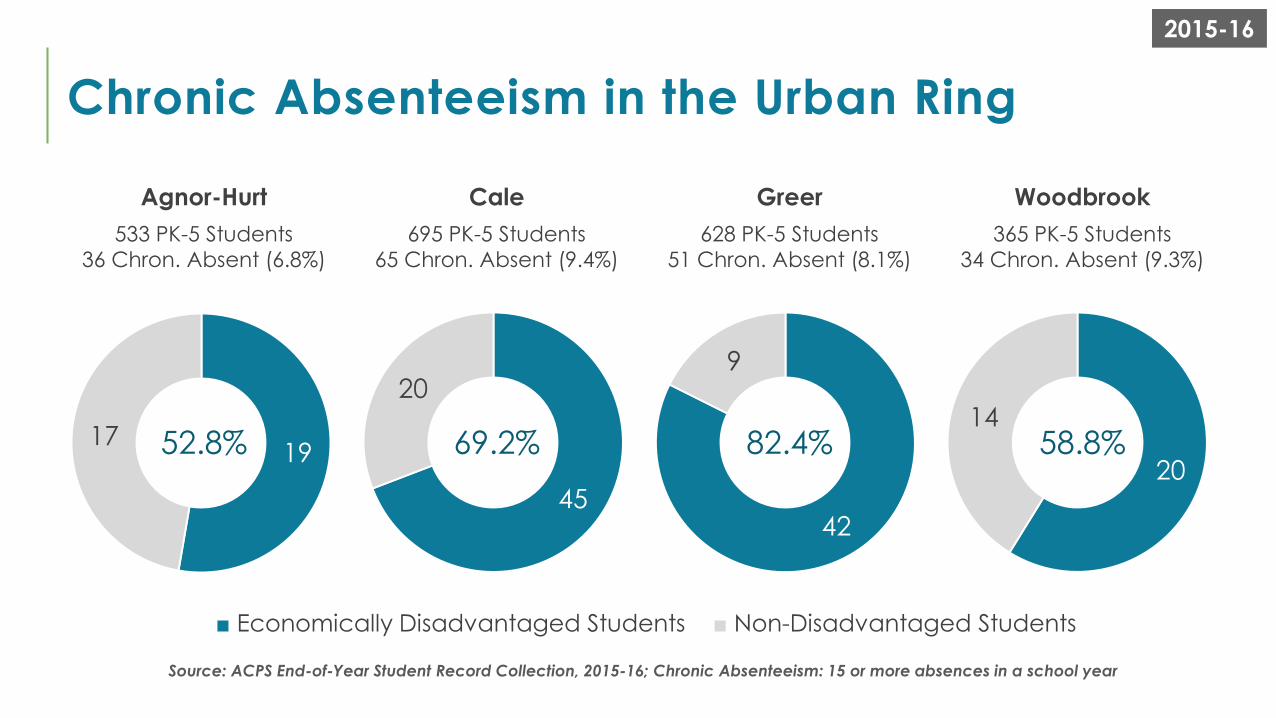
1917
Chronic Absenteeism in the Urban Ring
Agnor-Hurt Cale Greer Woodbrook
533 PK-5 Students
36 Chron. Absent (6.8%)
695 PK-5 Students
65 Chron. Absent (9.4%)
628 PK-5 Students
51 Chron. Absent (8.1%)
365 PK-5 Students
34 Chron. Absent (9.3%)
2015-16
■ Economically Disadvantaged Students ■ Non-Disadvantaged Students
Source: ACPS End-of-Year Student Record Collection, 2015-16; Chronic Absenteeism: 15 or more absences in a school year
45
20
42
9
20
1452.8% 69.2% 82.4% 58.8%
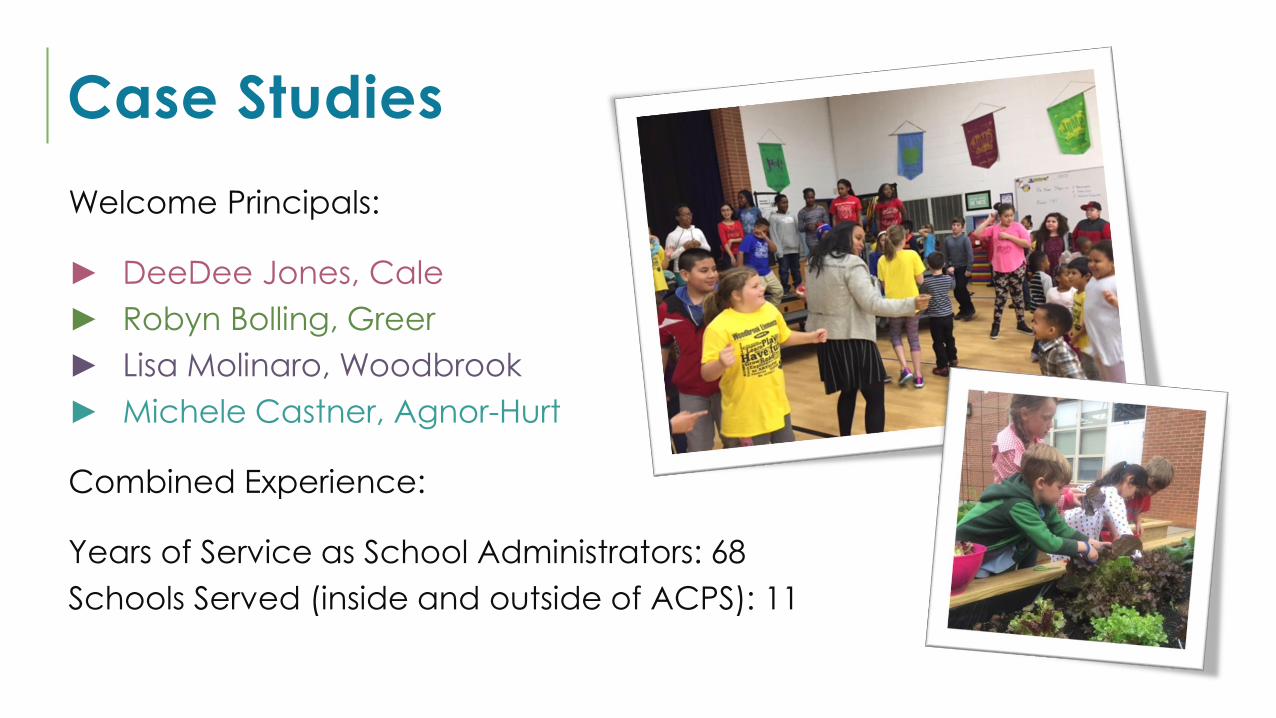
Case Studies
Welcome Principals:
► DeeDee Jones, Cale
► Robyn Bolling, Greer
► Lisa Molinaro, Woodbrook
► Michele Castner, Agnor-Hurt
Combined Experience:
Years of Service as School Administrators: 68
Schools Served (inside and outside of ACPS): 11

ALL
MEANS
ALL
Equity & Access2017-18 Budget
Initiative
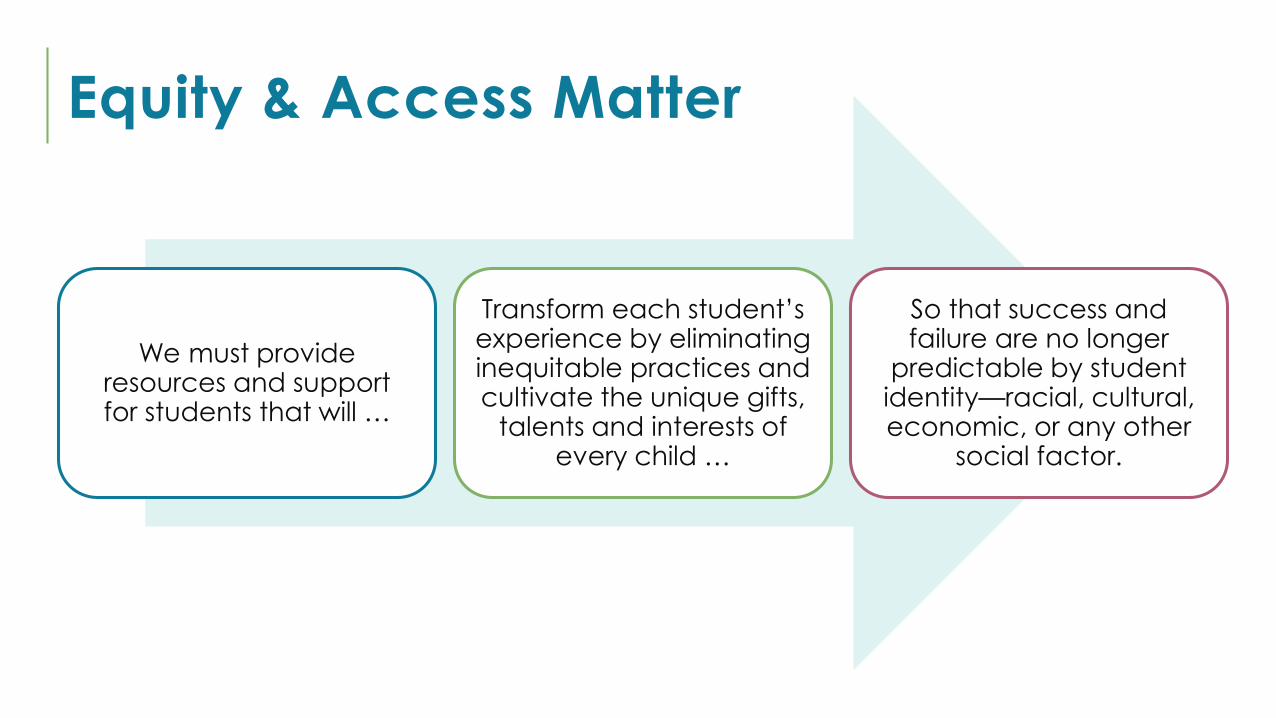
Equity & Access Matter
We must provide resources and support for students that will …
Transform each student’s experience by eliminating inequitable practices and cultivate the unique gifts,
talents and interests of every child …
So that success and failure are no longer
predictable by student identity—racial, cultural, economic, or any other
social factor.
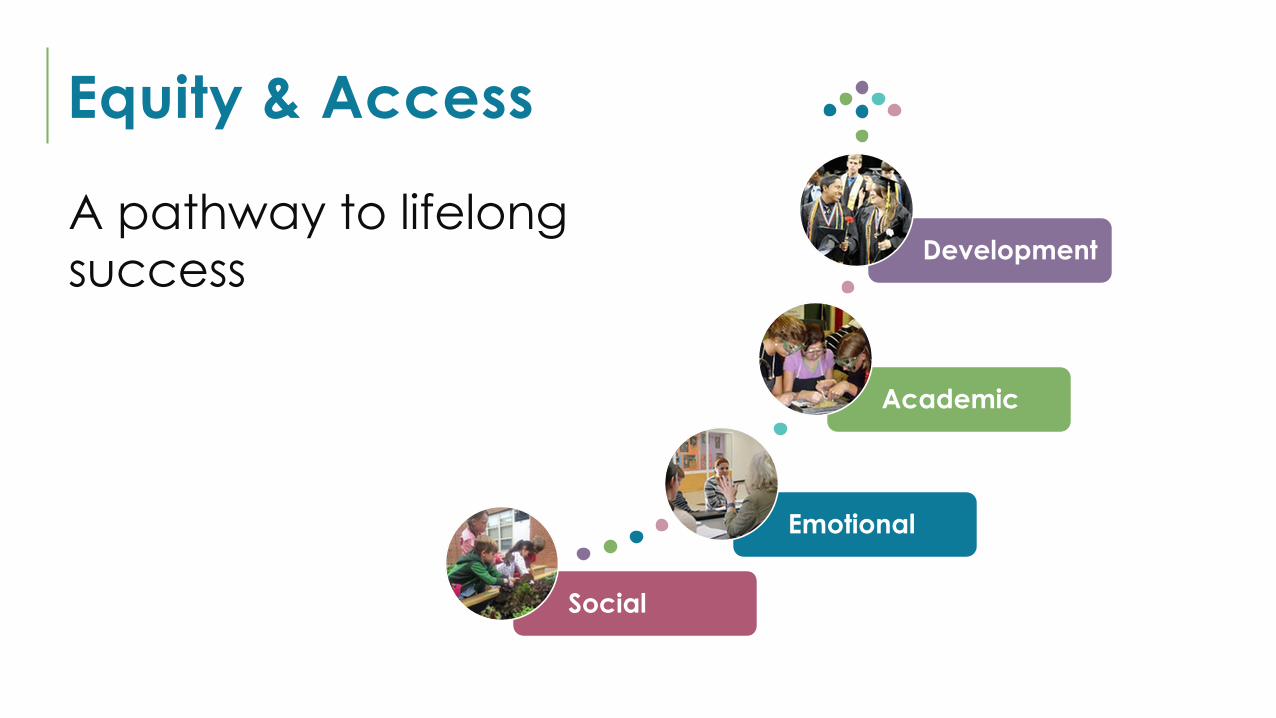
Equity & Access
A pathway to lifelong
success
Social
Emotional
Academic
Development

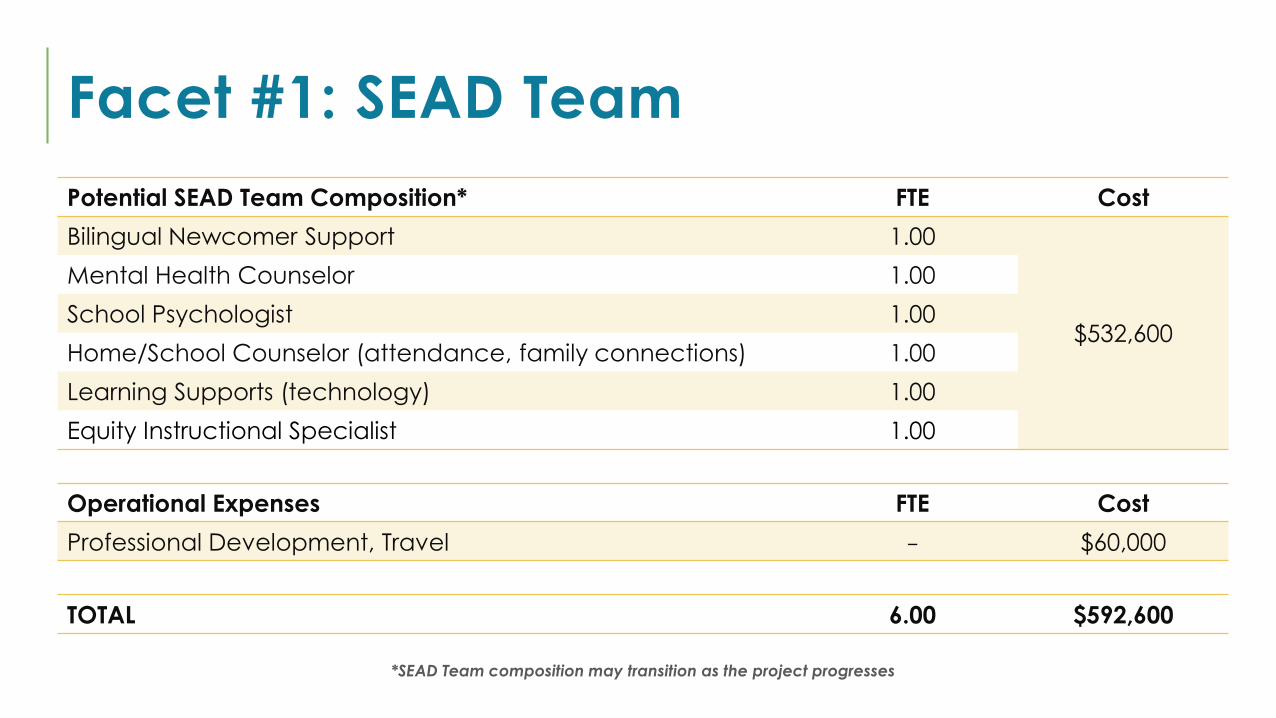
Facet #1: SEAD Team
*SEAD Team composition may transition as the project progresses
Potential SEAD Team Composition* FTE Cost
Bilingual Newcomer Support 1.00
$532,600
Mental Health Counselor 1.00
School Psychologist 1.00
Home/School Counselor (attendance, family connections) 1.00
Learning Supports (technology) 1.00
Equity Instructional Specialist 1.00
Operational Expenses FTE Cost
Professional Development, Travel – $60,000
TOTAL 6.00 $592,600
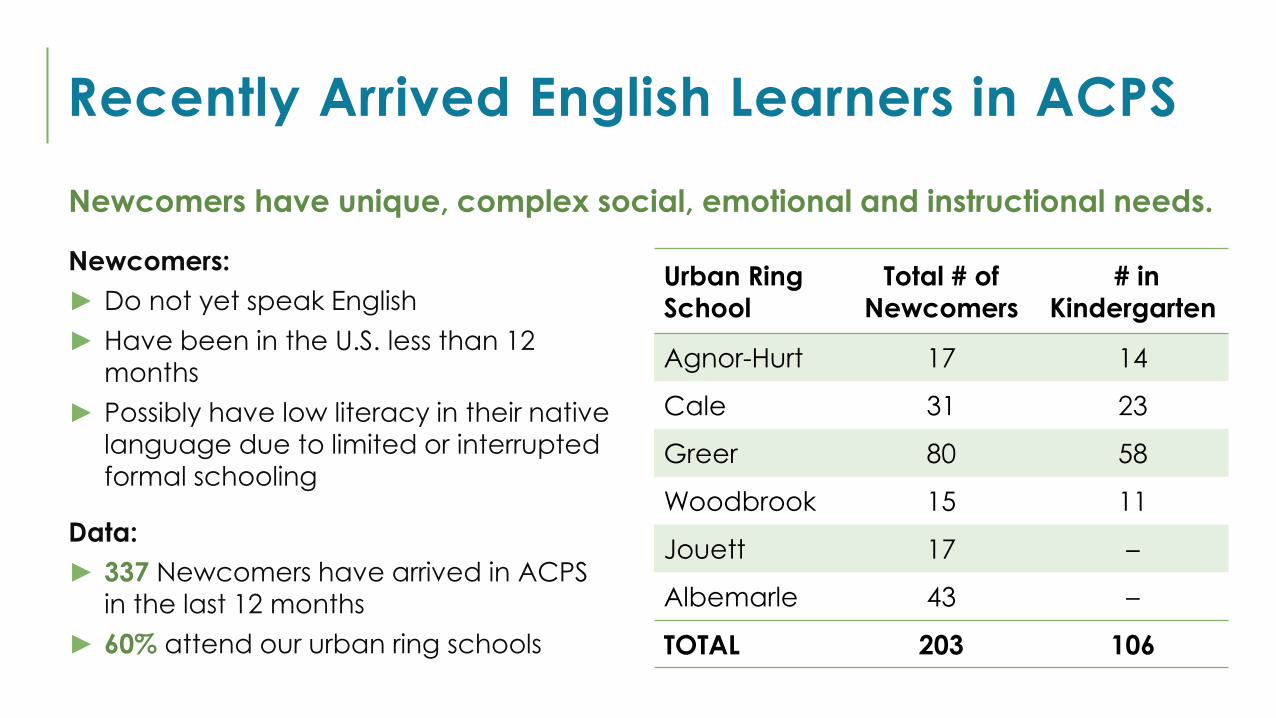
Newcomers:
► Do not yet speak English
► Have been in the U.S. less than 12
months
► Possibly have low literacy in their native
language due to limited or interrupted
formal schooling
Data:
► 337 Newcomers have arrived in ACPS in the last 12 months
► 60% attend our urban ring schools
Recently Arrived English Learners in ACPS
Urban Ring
School
Total # of
Newcomers
# in
Kindergarten
Agnor-Hurt 17 14
Cale 31 23
Greer 80 58
Woodbrook 15 11
Jouett 17 –
Albemarle 43 –
TOTAL 203 106
Newcomers have unique, complex social, emotional and instructional needs.
Facet #1: SEAD Team
*SEAD Team composition may transition as the project progresses
Potential SEAD Team Composition* FTE Cost
Bilingual Newcomer Support 1.00
$532,600
Mental Health Counselor 1.00
School Psychologist 1.00
Home/School Counselor (attendance, family connections) 1.00
Learning Supports (technology) 1.00
Equity Instructional Specialist 1.00
Operational Expenses FTE Cost
Professional Development, Travel – $60,000
TOTAL 6.00 $592,600
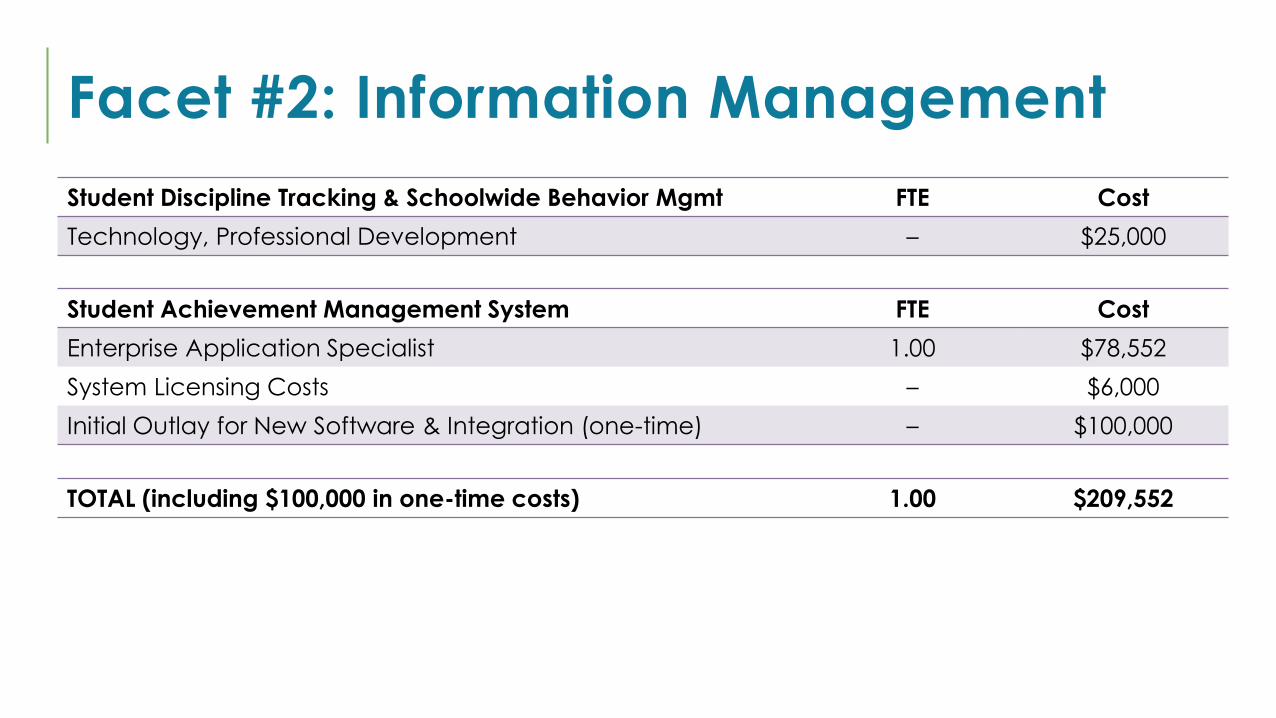
Facet #2: Information Management
Student Discipline Tracking & Schoolwide Behavior Mgmt FTE Cost
Technology, Professional Development – $25,000
Student Achievement Management System FTE Cost
Enterprise Application Specialist 1.00 $78,552
System Licensing Costs – $6,000
Initial Outlay for New Software & Integration (one-time) – $100,000
TOTAL (including $100,000 in one-time costs) 1.00 $209,552
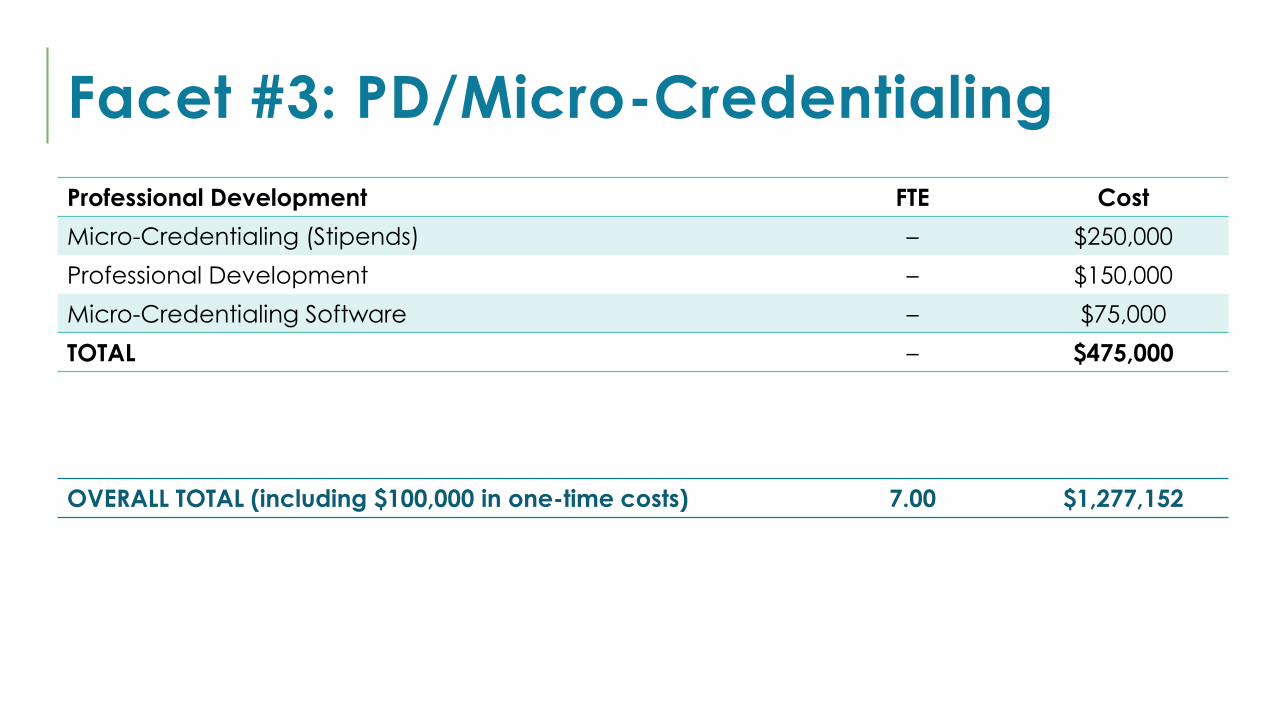
Facet #3: PD/Micro-Credentialing
Professional Development FTE Cost
Micro-Credentialing (Stipends) – $250,000
Professional Development – $150,000
Micro-Credentialing Software – $75,000
TOTAL – $475,000
OVERALL TOTAL (including $100,000 in one-time costs) 7.00 $1,277,152

Professional Development
Micro-Credentialing:
► What is it?
► Stipends & Development
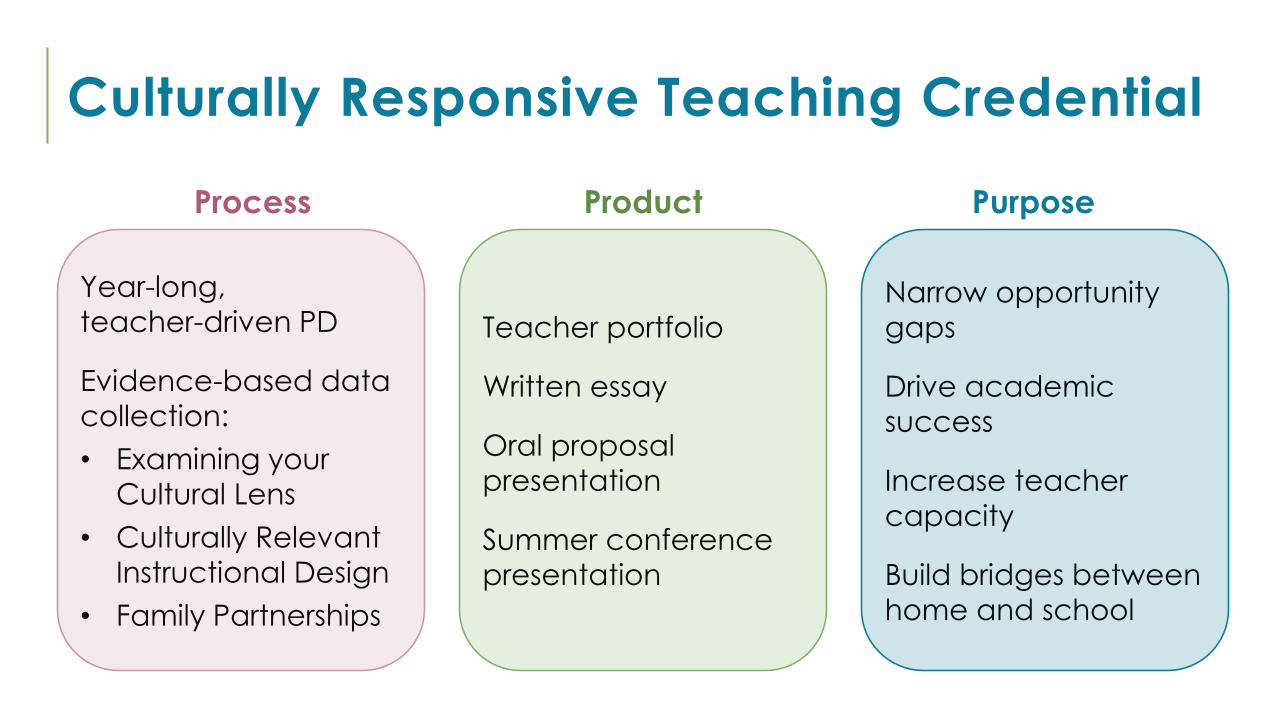
Year-long,
teacher-driven PD
Evidence-based data
collection:
• Examining your
Cultural Lens
• Culturally Relevant
Instructional Design
• Family Partnerships
Narrow opportunity
gaps
Drive academic
success
Increase teacher
capacity
Build bridges between
home and school
Teacher portfolio
Written essay
Oral proposal
presentation
Summer conference
presentation
Process Product Purpose
Culturally Responsive Teaching Credential
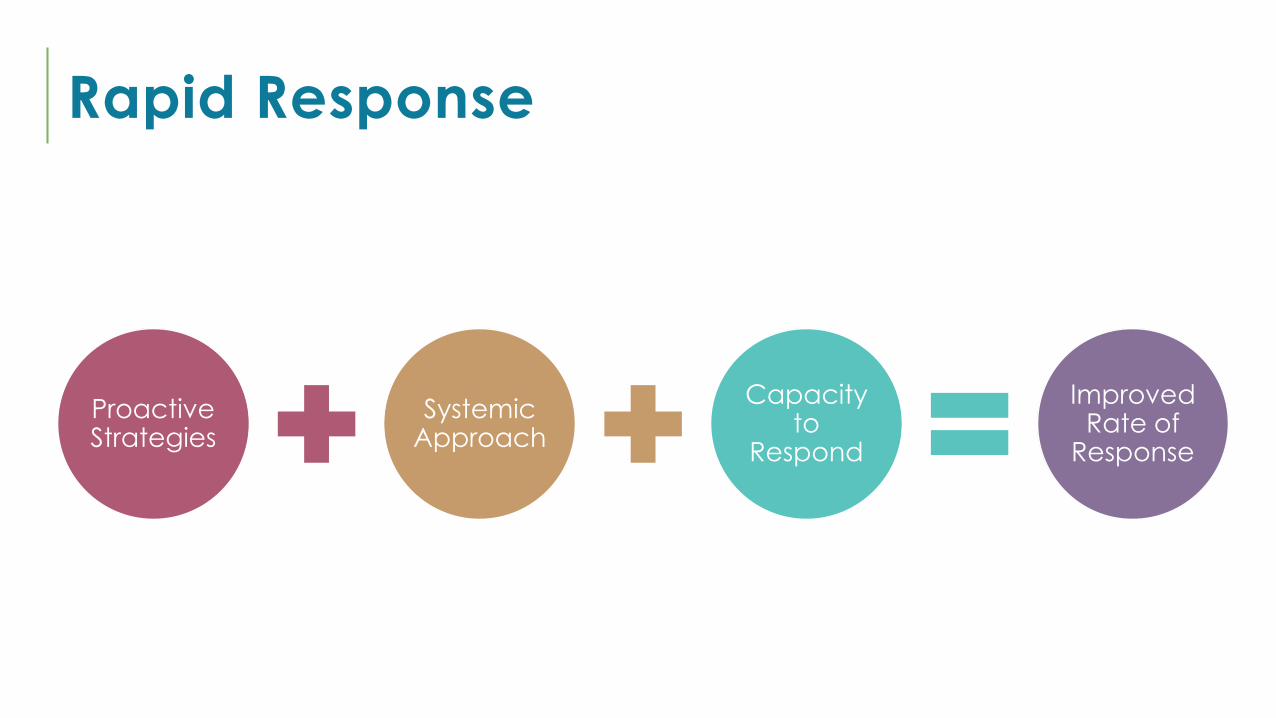
Rapid Response
Proactive Strategies
Systemic Approach
Capacity to
Respond
Improved Rate of
Response
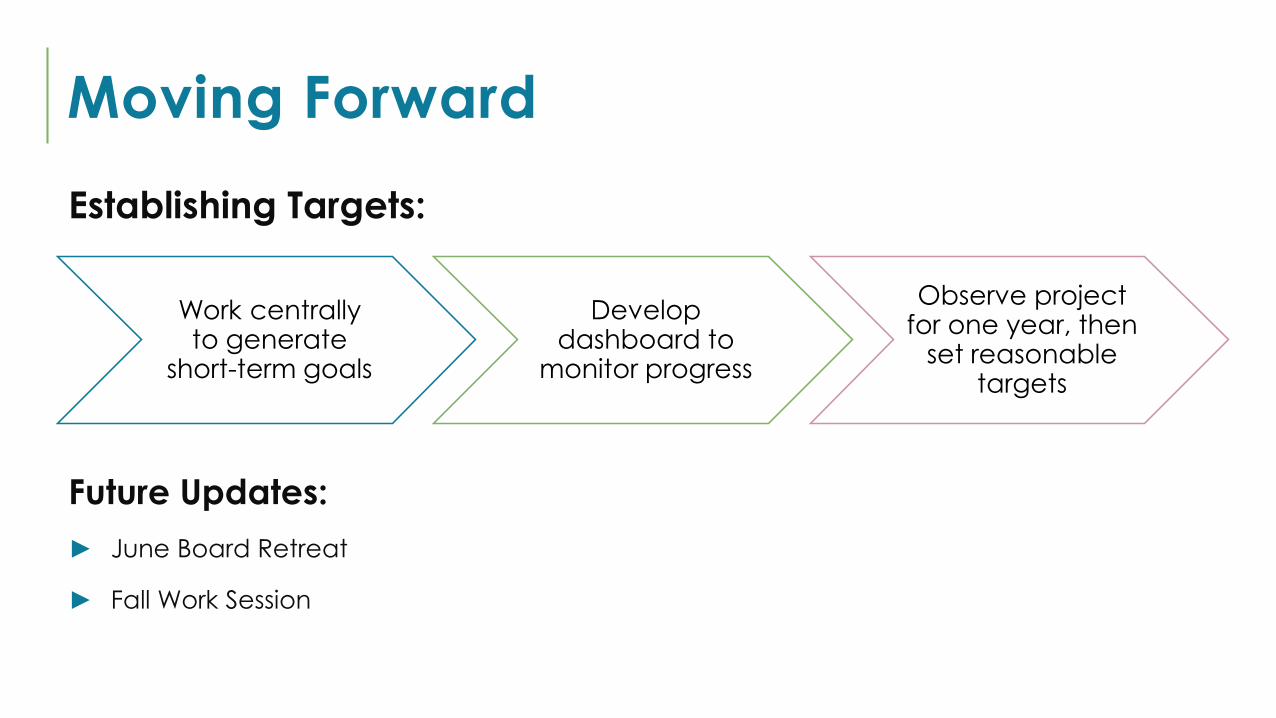
Moving Forward
Work centrally to generate
short-term goals
Develop dashboard to
monitor progress
Observe project for one year, then
set reasonable targets
Future Updates:
► June Board Retreat
► Fall Work Session
Establishing Targets:

ALL
MEANS
ALL
Equity & Access Questions?

Budget Review Schedule
Jan. 19 Special School Board Meeting
Superintendent’s Request
Presentation
Jan. 24 Special Budget Work Session
Overview of Budget
Compensation and BenefitsGrowth/Continuing Initiatives
Non-Instructional Departments
Jan. 26 School Board Work Session
Equity and Access Initiative
Technology
Professional Development
Instructional Departments
Jan. 31 Public Hearing/Special Budget Work Session
Special Revenue Funds:
Food Services, EDEP & Other
Discussion
Feb. 7 Tentative Special Budget Work Session (if needed)
Feb. 9 School Board Regular Meeting
Finalize School Board’s Request
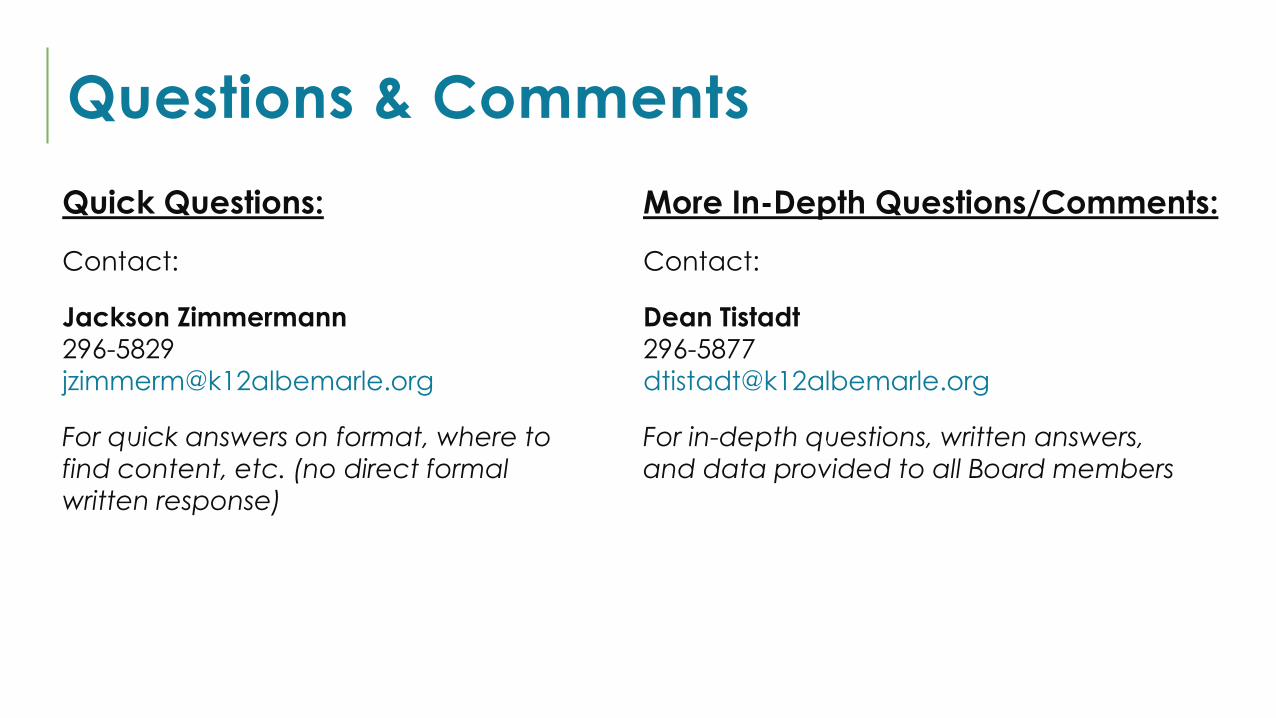
Questions & Comments
Quick Questions:
Contact:
Jackson Zimmermann
296-5829
For quick answers on format, where to
find content, etc. (no direct formal
written response)
More In-Depth Questions/Comments:
Contact:
Dean Tistadt
296-5877
For in-depth questions, written answers,
and data provided to all Board members