alginate polymers for drug delivery · namely, polymer stabilized emulsions are currently under...
TRANSCRIPT
Project Number: MQP TAC-FR08
Alginate Polymers for Drug Delivery
A Major Qualifying Project Report
submitted to the Faculty of
WORCESTER POLYTECHNIC INSTITUTE
in fulfillment of the requirements for the
Degree of Bachelor of Science
by
_______________________________________
Michael Brunetti
_______________________________________
Anne St. Martin
Date: April 27, 2006
Approved:
______________________________________
Professor Terri A. Camesano, Advisor
______________________________________
Professor W. Grant McGimpsey, Co-Advisor
i
Acknowledgements
We would like to express our gratitude to everyone who advised and assisted with our research
throughout our time at ENSIC. We sincerely appreciate their time and efforts.
Professor Terri Camesano, WPI, Project Advisor
Professor Grant McGimpsey, WPI, Project Advisor
Monsieur Alain Durand, LCPM, ENSIC, Site Advisor
Madame Michèle Léonard, LCPM, ENSIC, Site Advisor
Madame Marie-Christine Grassiot, LCPM, ENSIC, Professor
Monsieur Frédéric Vallée, LCPM, ENSIC, Etudiant Doctorate
ii
Abstract
The goal of this project was to investigate the properties of alginate stabilized emulsions and
their potential role for drug delivery. The polymer acts as a barrier between phases in oil-in-
water emulsions to increase stability. An emulsion consisting of 10% oil by volume with 1.4
mg/mL alginate as a surfactant was found to be most stable. Kinetic release experiments showed
that using the emulsion provided a controlled release of the model drug when compared to no
emulsion at all.
iii
Table of Contents
Acknowledgements........................................................................................................ i
Abstract.......................................................................................................................... ii
Table of Contents......................................................................................................... iii
Table of Figures............................................................................................................. v
Introduction ................................................................................................................... 1
Background ................................................................................................................... 4
Alginate Chemistry......................................................................................................................................................4 Sources of Alginate...................................................................................................................................................4 Chemical Structure ...................................................................................................................................................5
Gel Formation ..............................................................................................................................................................6 Large Bead Preparation.............................................................................................................................................7 Matrix Gels, Fibers, and In Situ Gelling Systems.....................................................................................................7 Microbead Preparation..............................................................................................................................................8 Alginate as Surfactant in Emulsion Bead Formation ................................................................................................9 Emulsion Formation .................................................................................................................................................9 Polymeric Surfactants .............................................................................................................................................10 Dry Emulsions ........................................................................................................................................................10
Physical Properties of Alginate Beads .....................................................................................................................11 Chemical Reactivity................................................................................................................................................11 Release of Matrix Encapsulated Particles...............................................................................................................12 Release of Emulsion Encapsulated Particles...........................................................................................................12
Biological Properties of Alginate ..............................................................................................................................15 Immunogenicity ......................................................................................................................................................15 Bioadhesion ............................................................................................................................................................16
Possible Applications of Alginate Polymer Controlled Drug Release Systems ....................................................16
Methodology................................................................................................................ 18
Alginate Synthesis......................................................................................................................................................18
Polymer Characterization.........................................................................................................................................19
Analysis of Chemical Properties of Lidocaine.........................................................................................................20 Extinction Coefficient Determination.....................................................................................................................21 Solubility of Lidocaine ...........................................................................................................................................22 Partition Coefficient (Kp) ........................................................................................................................................22 Oil Purity ................................................................................................................................................................23
Emulsions ...................................................................................................................................................................24 Emulsion Preparation..............................................................................................................................................24 Emulsification.........................................................................................................................................................24 Particle Size Analysis .............................................................................................................................................25 Emulsion Stability...................................................................................................................................................26
Lidocaine Encapsulation...........................................................................................................................................26
Lidocaine Release Kinetics........................................................................................................................................27
Results and Discussion.............................................................................................. 29 Rate of C12 Fixation ................................................................................................................................................29 Extinction Coefficient Determination.....................................................................................................................30 Partition Coefficient (Kp) ........................................................................................................................................31 Emulsion Stability...................................................................................................................................................32
iv
Lidocaine Encapsulation.........................................................................................................................................34 Lidocaine Release Experiments ..............................................................................................................................34
Conclusions and Recommendations ........................................................................ 37
Bibliography ................................................................................................................ 39
Appendix A: Equipment and Experimental Procedure ............................................ 44
A.1. High Performance Particle Sizer (HPPS) ........................................................................................................44 Software Set Up ......................................................................................................................................................44 Sample Measurements ............................................................................................................................................45
A.3. Emulsification ....................................................................................................................................................48
A.4. Centrifugation....................................................................................................................................................50
A.6. UV Spectroscopy................................................................................................................................................55
A.7. Dialysis Membrane ............................................................................................................................................57
Appendix B: Data ........................................................................................................ 58
B.1. Particle Sizer Data .............................................................................................................................................58
B.2. Partition Coefficient Data..................................................................................................................................60
B.2. Release Kinetics Data.........................................................................................................................................61 Alginate Stabilized Emulsion with Lidocaine.........................................................................................................61 Lidocaine and Alginate ...........................................................................................................................................62
Appendix C: Calculations........................................................................................... 63
C.1. Calculation of Volume of 1-Bromo-dodecane to add for certain rate of alkyl chain addition ....................63
v
Table of Figures Figure 1. Blood Circulation Drug Level With Oral Drug Delivery (a) and Controlled Drug Delivery (b) .................2 Figure 2. The chemical structure of alginate with β-D-mannuronic (M) acid blocks and α-L-gluronic (G) acid
blocks ..........................................................................................................................................................6 Figure 3. Egg-Box association of poly-L-guluronate sequences of alginate and conversion of random coils to
ribbon structures when cross-linked with calcium ions...............................................................................7 Figure 4. (A) Two immiscible liquids not emulsified (B) An emulsion of phase B dispersed in Phase A (C) The
unstable emulsion (D) The purple surfactant as an emulsion stabilizer ......................................................9 Figure 5. Creaming & Sedimentation ........................................................................................................................13 Figure 6. Flocculation ...............................................................................................................................................14 Figure 7. Coalescence ...............................................................................................................................................14 Figure 8. Ostwald Ripening........................................................................................................................................15 Figure 9. Alginate Synthesis .......................................................................................................................................18 Figure 10 Alginate Synthesis: Addition of 1-Bromo-dodecane ...................................................................................18 Figure 11. Alginate Synthesis (continued)..................................................................................................................19 Figure 12. Lidocaine chemical structure....................................................................................................................20 Figure 13. Calibration curve for substitution ratio determination.............................................................................29 Figure 14. Calibration curve for extinction coefficient at 262nm ..............................................................................30 Figure 15. Partition coefficients for different oils tested............................................................................................31 Figure 16. Initial particles sizes of various emulsions ...............................................................................................32 Figure 17. Stability of 10% oil emulsions over time...................................................................................................33 Figure 18. Lidocaine release kinetics comparison: Lidocaine, Lidocaine and Alginate, and Alginate Emulsion .....35 Figure 19: Correlation Function.................................................................................................................................46 Figure 20: High Performance Particle Sizer...............................................................................................................47 Figure 21 Sonication Box ............................................................................................................................................49 Figure 22: Centrifuge System......................................................................................................................................52 Figure 23: Labcono Freeze Drying System.................................................................................................................54 Figure 24: UV Spectrophotometer ..............................................................................................................................56
1
Introduction
In the field of medicinal chemistry a substantial challenge lies in developing drugs that
can be administered by the traditional oral methods. During drug research and development,
molecules that are not suitable for these classic delivery systems are typically discarded due to
the high costs of developing corresponding delivery systems. A drug delivery system capable of
releasing drugs with poor oral bioavailability would greatly increase the development rate of
novel medications.
Recent investigations in the area of controlled drug delivery have the potential to solve
the problem of poor bioavailability through polymer-drug combinations that are able to release
the active drug in a pre-designed manor. This release can be either cyclic or over a long period
of time, and it may be triggered by external environmental events. In either case, the exact
mechanism is studied and developed to ensure the successful delivery of drug therapies while
preventing the problems of both over and under dosing. In addition, controlled drug delivery
allows for the maintenance of a desired range of drug levels, requires fewer administrations, and
optimizes the therapeutic use of the drug. Specifically these delivery systems are ideal for the
slow release of water soluble drugs, the fast release of low-solubility drugs, drug delivery to
specific sites, drug delivery using nanoparticulate systems, delivery of two or more agents with
the same formulation, and systems based on carriers that can dissolve or degrade and be readily
eliminated. An ideal system should be mechanically strong, inert, comfortable to administer,
biocompatible, safe from accidental release, easy to fabricate and sterilize, and capable of
loading high levels of the desired drug (Brannon-Peppas, 1997).
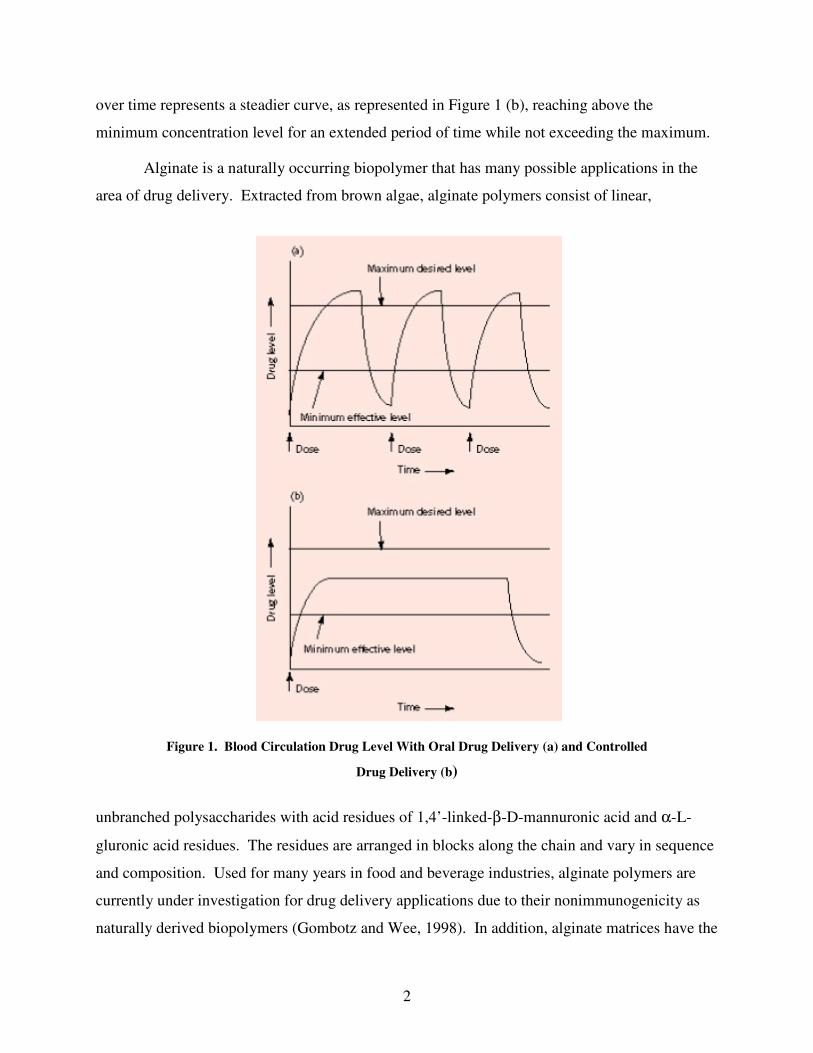
The ultimate goal within controlled drug delivery investigations is to yield an optimally
high blood level of the drug over an extended period of time. With traditional oral and injection
methods, the blood drug level follows a pattern as illustrated in Figure 1(a) as the specific level
rises after each administration and decreases quickly until the next administration (Brannon-
Peppas, 1997).
The aim of drug administration is to maintain a steady blood level of the specific drug
over an extended time period that does not go below a minimum concentration of effectiveness,
or above a maximum level of possible toxicity. With controlled drug delivery, the drug level
2
over time represents a steadier curve, as represented in Figure 1 (b), reaching above the
minimum concentration level for an extended period of time while not exceeding the maximum.
Alginate is a naturally occurring biopolymer that has many possible applications in the
area of drug delivery. Extracted from brown algae, alginate polymers consist of linear,
unbranched polysaccharides with acid residues of 1,4’-linked-β-D-mannuronic acid and α-L-
gluronic acid residues. The residues are arranged in blocks along the chain and vary in sequence
and composition. Used for many years in food and beverage industries, alginate polymers are
currently under investigation for drug delivery applications due to their nonimmunogenicity as
naturally derived biopolymers (Gombotz and Wee, 1998). In addition, alginate matrices have the
Figure 1. Blood Circulation Drug Level With Oral Drug Delivery (a) and Controlled
Drug Delivery (b)
3
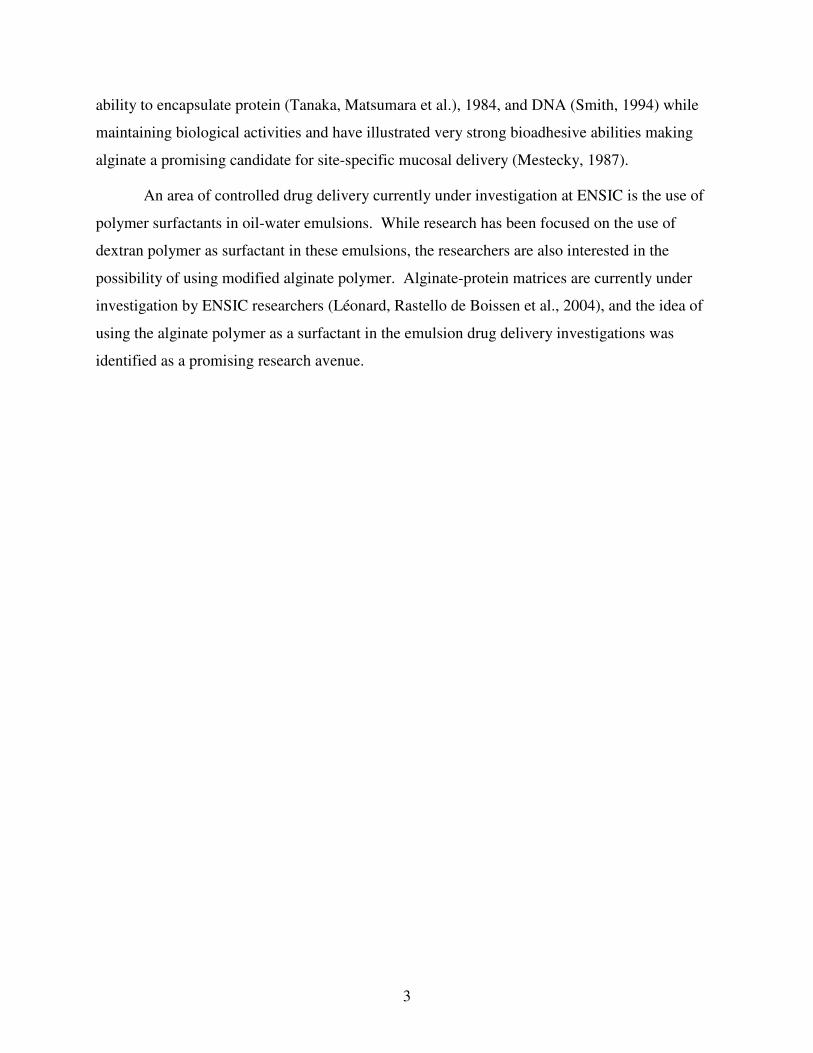
ability to encapsulate protein (Tanaka, Matsumara et al.), 1984, and DNA (Smith, 1994) while
maintaining biological activities and have illustrated very strong bioadhesive abilities making
alginate a promising candidate for site-specific mucosal delivery (Mestecky, 1987).
An area of controlled drug delivery currently under investigation at ENSIC is the use of
polymer surfactants in oil-water emulsions. While research has been focused on the use of
dextran polymer as surfactant in these emulsions, the researchers are also interested in the
possibility of using modified alginate polymer. Alginate-protein matrices are currently under
investigation by ENSIC researchers (Léonard, Rastello de Boissen et al., 2004), and the idea of
using the alginate polymer as a surfactant in the emulsion drug delivery investigations was
identified as a promising research avenue.
4
Background
Research is currently being conducted at ENSIC on various methods for controlled drug
delivery. Namely, polymer stabilized emulsions are currently under investigation using
hydrophobically modified dextran polymers, and the results have merited further investigation.
In addition, alginate polymer-protein matrices have also been under investigation for controlled
drug release, and have also proven to be very promising. Our research was designed to
investigate the possible use of hydrophobically modified alginate polymers as stabilizers in
oil/water emulsions, and then to test the drug encapsulation and release kinetics of these
emulsions.
This section outlines the theory behind polymer-stabilized emulsions for drug release, as
well as the use of alginate polymer in various areas of controlled drug delivery investigation.
Alginate Chemistry
As a naturally occurring biopolymer, alginate has been used successfully in the food and
beverage industry as a gelling agent and colloidal stabilizer, and holds strong potential in the area
of drug delivery. Extracted from brown algae, alginate polymers consist of linear, unbranched
polysaccharides with acid residues of 1,4’-linked-β-D-mannuronic acid and α-L-gluronic acid
residues. The residues are arranged in blocks along the chain and vary in sequence and
composition. There are numerous physical characteristics possessed by alginate that enable it to
form matrices to encapsulate and deliver various proteins and cells in vivo. Specifically, alginate
matrices contain aqueous internal environments ideal for the encapsulation of proteins and small
molecules. These encapsulations form at room temperature, independent of organic solvents,
and they have a high rate of macromolecular diffusion due to their porous gel state that may be
controlled through specific coating procedures. In addition, alginate matrices are very
biodegradable and can be broken down under normal physiological conditions (Gombotz and
Wee, 1998).
Sources of Alginate
Alginate is extracted for commercial purposes from various species of kelp, or brown
algae including Laminaria hyperborean, Ascophyllum nodosum, and Macrocysis pyrifera
(Smidsrod and Skjak-Braek, 1990). Within the kelp species, alginate is found in the intracellular
5
matrix where it constitutes up to 40% of the dry weight. The alginate forms mixed slats with
various cations naturally found in sea water including Mg2+
, Ca2+
, Sr2+
, Ba2+
, and Na+, and the
native species is usually found as an insoluble Ca2+
cross-linked gel (Sutherland, 1991).
When alginate is harvested, the algae is mechanically collected and dried, then the
material is milled and treated with dilute acid to remove and dissociate neutral
homopolysaccharides and exchange the alkaline earth cations with H+ before the alginate in
extracted. With the addition of sodium carbonate below pH 10, the alginate is then converted to
the soluble sodium salt from the insoluble protonated form and can be further purified and sold
in salt or acid form (Sutherland, 1991).
Due to the natural extraction process used to obtain alginate, there are many impurities
that may potentially contaminate the product. These impurities include heavy metals, endotoxin,
proteins, other carbohydrates, and polyphenals contained in the kelp (Smidsrod and Skjak-Braek,
1973). When harvested alginate is used in food and drug industries small traces of theses
impurities are acceptable, but when it comes to medicinal applications they must be removed.
New methods of harvesting and purification have been developed to address the problem of
contamination, and now pharmaceutical grade alginate is available from numerous chemical
manufactures.
Chemical Structure
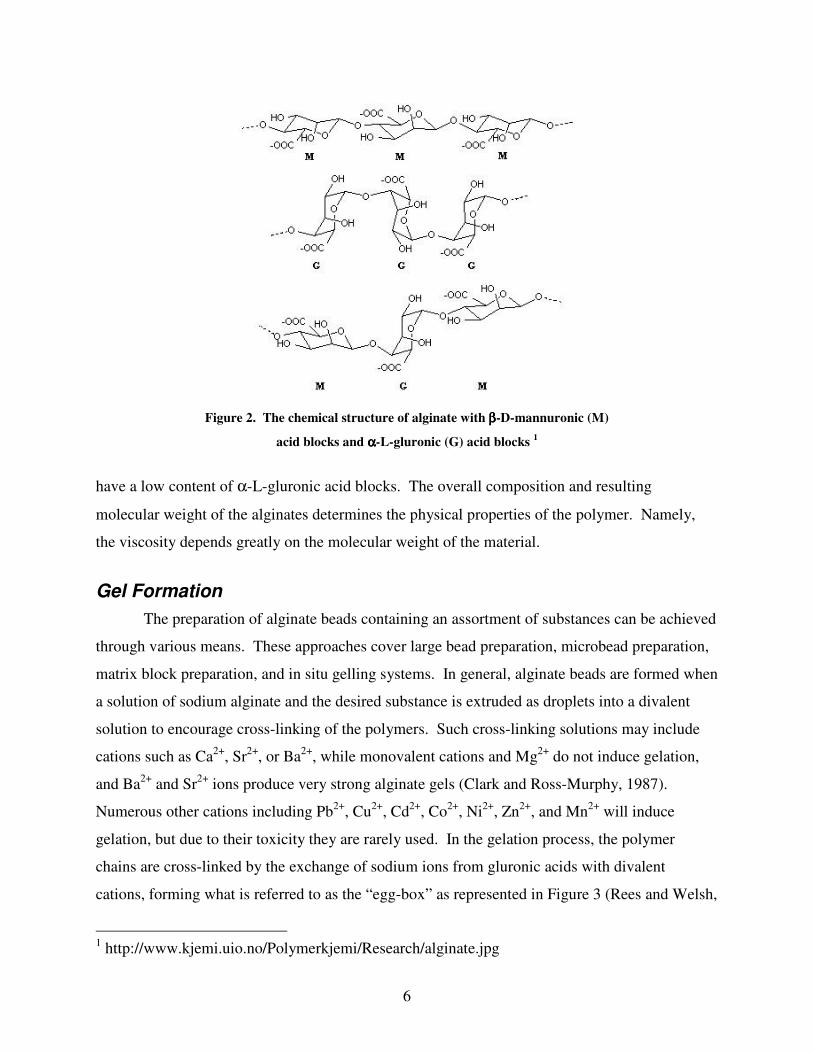
Alginate polymers are linear unbranched polysaccharides consisting of 1,4’-linked-β-D-
mannuronic acid and α-L-gluronic acid residues as represented in Figure 2. The pattern held by
these residues varies greatly and are arranged in a block pattern along the length of the chain
backbone.
The homopolymeric regions of β-D-mannuronic acid blocks and α-L-gluronic acid
blocks are interdispersed with alternating regions of 1,4’-linked-β-D-mannuronic-acid-α-L-
gluronic acid blocks as seen in Figure 2 (Haug, Larsen et al., 1967). The distribution of
monomers along the polymer chain is random and therefore alginates do not have a repeating
unit. However, the molecular variability of the polymer is reflective of the organism from which
the polymer is extracted. For instance, alginates isolated from L. hyperboea kelp have a high
number of α-L-gluronic acid residues, while alginates isolated from A. nodosum and L. japonica
6
have a low content of α-L-gluronic acid blocks. The overall composition and resulting
molecular weight of the alginates determines the physical properties of the polymer. Namely,
the viscosity depends greatly on the molecular weight of the material.
Gel Formation
The preparation of alginate beads containing an assortment of substances can be achieved
through various means. These approaches cover large bead preparation, microbead preparation,
matrix block preparation, and in situ gelling systems. In general, alginate beads are formed when
a solution of sodium alginate and the desired substance is extruded as droplets into a divalent
solution to encourage cross-linking of the polymers. Such cross-linking solutions may include
cations such as Ca2+
, Sr2+
, or Ba2+
, while monovalent cations and Mg2+
do not induce gelation,
and Ba2+
and Sr2+
ions produce very strong alginate gels (Clark and Ross-Murphy, 1987).
Numerous other cations including Pb2+
, Cu2+
, Cd2+
, Co2+
, Ni2+
, Zn2+
, and Mn2+
will induce
gelation, but due to their toxicity they are rarely used. In the gelation process, the polymer
chains are cross-linked by the exchange of sodium ions from gluronic acids with divalent
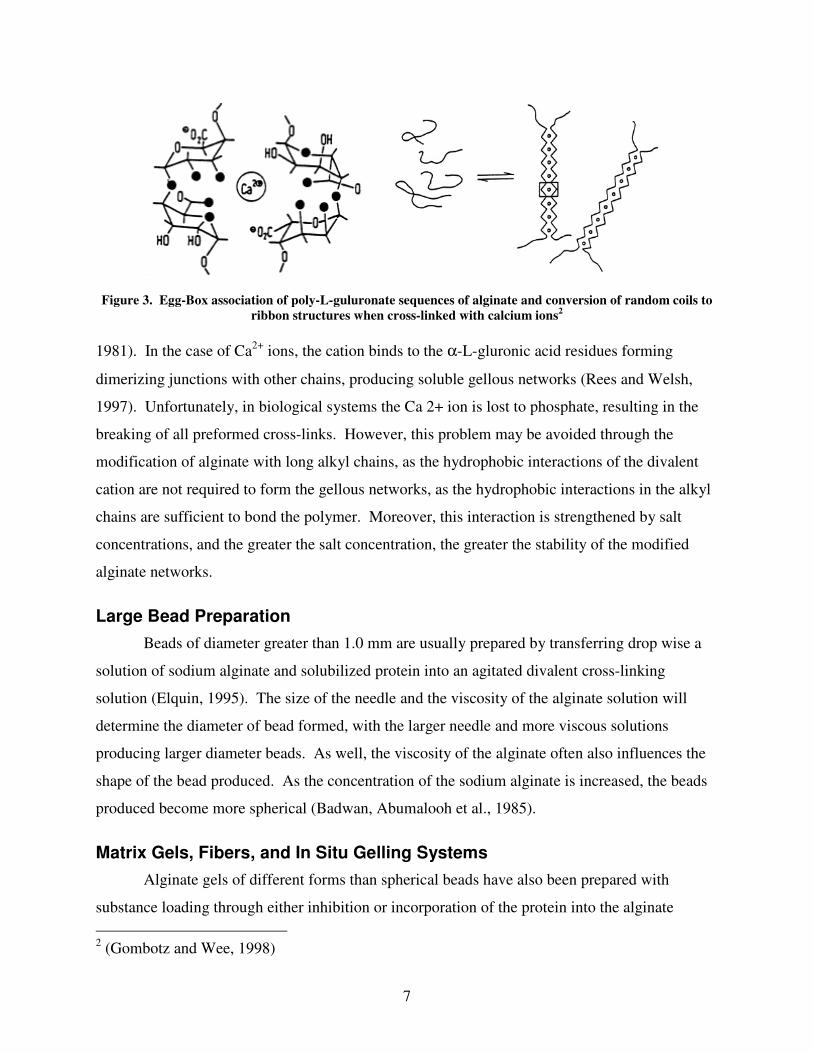
cations, forming what is referred to as the “egg-box” as represented in Figure 3 (Rees and Welsh,
1 http://www.kjemi.uio.no/Polymerkjemi/Research/alginate.jpg
Figure 2. The chemical structure of alginate with ββββ-D-mannuronic (M)
acid blocks and αααα-L-gluronic (G) acid blocks 1
7
1981). In the case of Ca2+
ions, the cation binds to the α-L-gluronic acid residues forming
dimerizing junctions with other chains, producing soluble gellous networks (Rees and Welsh,
1997). Unfortunately, in biological systems the Ca 2+ ion is lost to phosphate, resulting in the
breaking of all preformed cross-links. However, this problem may be avoided through the
modification of alginate with long alkyl chains, as the hydrophobic interactions of the divalent
cation are not required to form the gellous networks, as the hydrophobic interactions in the alkyl
chains are sufficient to bond the polymer. Moreover, this interaction is strengthened by salt
concentrations, and the greater the salt concentration, the greater the stability of the modified
alginate networks.
Large Bead Preparation
Beads of diameter greater than 1.0 mm are usually prepared by transferring drop wise a
solution of sodium alginate and solubilized protein into an agitated divalent cross-linking
solution (Elquin, 1995). The size of the needle and the viscosity of the alginate solution will
determine the diameter of bead formed, with the larger needle and more viscous solutions
producing larger diameter beads. As well, the viscosity of the alginate often also influences the
shape of the bead produced. As the concentration of the sodium alginate is increased, the beads
produced become more spherical (Badwan, Abumalooh et al., 1985).
Matrix Gels, Fibers, and In Situ Gelling Systems
Alginate gels of different forms than spherical beads have also been prepared with
substance loading through either inhibition or incorporation of the protein into the alginate
2 (Gombotz and Wee, 1998)
Figure 3. Egg-Box association of poly-L-guluronate sequences of alginate and conversion of random coils to
ribbon structures when cross-linked with calcium ions2
8
solution before cross-linking (Liu, Ng et al., 1997). To form a block matrix the alginate solution
with substance is poured into a container and leveled before being placed in the cross-linking
solution for gelation. This process may take several hours, and afterwards the gels may be cut
into the desired shapes. With the inhibition method, the block gel is immersed in a solution of
the protein of interest, however this method requires a greater amount of protein and a greater
length of time to form (Bhakoo, Woerly et al., 1991).
Microbead Preparation
When the desired beads are less than 0.2mm in diameter, there are three main methods
used for microbead preparation; atomization, coacervation, and emulsification, the method used
in our drug release experiments.
In general atomization preparation, microbeads are prepared from well mixed solutions of
alginate and substance which are loaded into a syringe mounted on a pump, and pressured
through an atomization device with a small diameter orifice at the tip. The orifice usually spans
~1mm in diameter, and although smaller diameter tips may be used, they run the risk of
becoming clogged by the viscous alginate solution. In the case of microbead preparation, the
size of the beads can be controlled by either the flow-rate of the syringe pump, the pressure of
the infusing nitrogen gas, or the distance between the orifice and the surface of the cross-linking
solution. When cross-linked with the divalent solution, the fine droplets of alginate/substance
solution will form microbeads, which may then be coated (Kwok, Groves et al., 1991).
Another method of microbead preparation is the complex coacervation of oppositely
charges polyelectrolytes. With this method, specific conditions of polyion concentration, pH and
ionic strength, the mixture will separate into a dense coacertive phase containing the microbeads
and a dilute equilibrium phase (Bugenberg de Jon, 1949). For example, complex coacervation
between alginic acid and chitosan was achieved by spraying the sodium alginate solution into the
chitosan solution, producing strong microbeads that remained stable over a large range of pH.
For the best yield with coacervative bead preparation conditions should be set to a pH of 3.9, an
ionic strength of 1 mM, and a 0.15% w/v total polyion concentration (Daly and Knorr, 1988).
9
Alginate as Surfactant in Emulsion Bead Formation
Another method of microbead preparation involves the use of alginate polymer as a
surfactant stabilizer in oil-water emulsions. Alginate surfactants serve to lower the interfacial
energy between the phases, thereby increasing the stability and lifetime of the emulsion.
Emulsion Formation
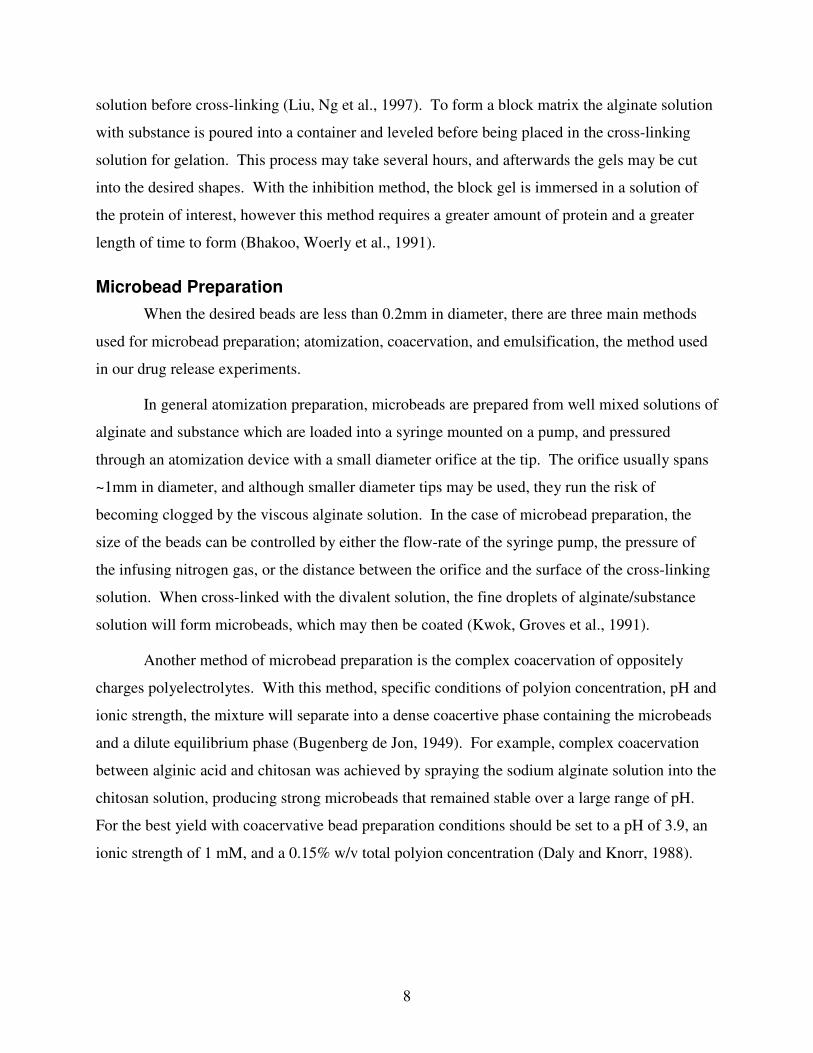
Emulsions are formed when two immiscible substances are combined, with one substance
being dispersed in the continuous phase substance as can be observed in Figure 4. Emulsions
fall into a greater class of two-phase systems known as colloids, with the special characteristic
that both the dispersed and continuous phases are liquid. Depending on the volume fraction of
the phases, both water-in-oil and oil-in-water emulsions can be formed. There is a rule which
governs the emulsion formation, known as the Bancroft Rule: emulsifiers and emulsifying
particles tend to promote dispersion of the phase in which they do not dissolve well; for example,
proteins dissolve better in water than in oil and therefore tend to form oil-in-water emulsions,
promoting the dispersion of oil droplets throughout a continuous phase of water
(www.wikipedia.org). Emulsions often have a cloudy appearance due to the scattering of light
as it passes through the many interfaces contained within the emulsion.
Emulsions can be prepared through various methods of agitation, as the two phases are
immiscible and droplets will not form spontaneously. Methods for emulsion preparation include
sonication, which can produce droplets of 100 to 400nm. When investigating emulsions for drug
release experiments, the desired drug is dissolved into the oil, and then combined with the
A B
C D
Figure 4. (A) Two immiscible liquids not emulsified (B) An emulsion of phase B dispersed in Phase A (C) The
unstable emulsion (D) The purple surfactant as an emulsion stabilizer
10
alginate and aqueous phase and agitated to form polymer stabilized oil-in-water emulsions
containing the desired drug.
Polymeric Surfactants
When emulsions are formed, they are thermodynamically unstable, the result of the
degree of mechanical energy needed to form the emulsion droplets in compensation for the
increasing of interface area between the two (Sadtler, Imbert et al. 2002). Polymeric surfactants
on these emulsions have been used to solve this problem of instability by lowering the surface
tension between the liquid phases. Polymeric surfactants are widely used as emulsions
stabilizers in biotechnology and drug delivery processes, and are commonly referred to as
emulsifiers, detergents, or dispersants.
As amphiphilic molecules, polymers have two main regions, a soluble lyophilic region,
and an insoluble lyophobic region. The polymer chain coils itself around the oil droplets, with
the hydrophobic regions anchoring into the oil and the hydrophilic regions branch out to the
aqueous phase. The anchoring of hydrophilic branches provides stability against washing, while
increasing steric stability and overall emulsion stability (Tadros, Vandamme et al., 2004). As
well, these surfactants provide steric repulsion between oil droplets, and help protect against
aggregation. Polymer surfactants are highly researched because of their strong ability to lower
surface tension and thicken the aqueous phase of emulsions. Moreover, their biocompatibility
makes them prime candidates for biological applications.
Dry Emulsions
Once emulsions are formed, they can be dried to increase stability for drug delivery and
ensure a longer shelf life. Liquid state emulsions are physically unstable, and the stability of the
emulsion beads is greatly increased upon removal of the solvent (Dollo, Corre et al., 2004). This
can be accomplished through freeze-drying, where the aqueous phase is frozen and then removed
with a vacuum through sublimation. Freeze-drying, also known as lyophilization, further
stabilizes the emulsion because it is a very unobtrusive method and avoids higher temperatures
usually involved with solvent removal. Once the emulsions are dried, they can them be
compressed into pill form for easier administration, or they can be stored in solid state for an
extended period of time. Dried emulsions can be easily reconstituted by adding a specific
amount of the continuous phase as was previously removed, and using light vortex and
11
sonication techniques. However, it is difficult to reconstitute emulsions of the same size before
freeze drying as droplets usually aggregate during the drying process and often form larger
particles (Christensen, Pedersen et al., 2001).
Physical Properties of Alginate Beads
The properties of cation cross-linked alginate beads are dependent on the structure,
composition, and molecular size of the polymer beads (Martinsen, Skjak-Braek et al., 1991).
The polymer solution flexibility is dependent on the concentration of β-D-mannuronic acid and
α-L-gluronic acid blocks in the order MG>MM>GG (Haug, Larsen et al., 1967). Beads with
lowest shrinkage, greater porosity, mechanical strength, and highest stability towards
monovalent cations consist mainly of α-L-gluronic acid, with an average content of at least 70%
and an average α-L-gluronic acid block length of 15. Referred to as High G alginates, when
these polymers have a molecular weight exceeding 2.4×10⁵, the strength of the gel will be
independent of the molecular weight (Martinsen, Skjak-Braek et al., 1991). While gels made
with low α-L-gluronic acid content will be more elastic, those produced with a high α-L-
gluronic acid content will be more brittle (Chapman and Chapman 1980). In addition, alginate
will form stable gels within the temperature range of 0-100°C, however the higher the
temperature during formation, the less rigid the gels produced will be (Gacesa, 1988).
Chemical Reactivity
Due to the high water content of alginate beads, which is around 95%, the
microenvironment of alginate is usually inert to protein drugs and cells. However, a positively
charged protein can compete with calcium ions for available carboxylic acid sites on the alginate
chains (Segi, Yotsuyangi et al., 1989). It has been observed with the case of transforming
growth factor-beta (TGF-β1) that such interactions may inactivate the protein, and additives must
be used to protect the active protein site form the alginate polymer. For example, when the
anionic polymer poly (arylic acid) was added to the TGF-β1 alginate complex, the polymer
shielded the TGF-β1 from interactions with the alginate, allowing the protein to retain full
activity even while complexed with the alginate (Murnper, Hoffman et al., 1994).
12
Release of Matrix Encapsulated Particles
There are two mechanisms of release associated with protein encapsulation in alginate
matrices; diffusion of the protein through polymer network pores, and release of protein through
polymer degradation.
Diffusion
Electron microscopy investigation has revealed the pore sizes of calcium alginate beads
range in diameter from 5 to 200nm (Anderson, Skipnes et al., 1977). Diffusion of small
molecules is independent of the matrix, while diffusion of larger molecules, such as proteins, is
dependent on the molecular weight of the alginate matrix. Successful protein diffusion has been
reported involving immunogloben G (Tanaka, Matsumara et al., 1984), and insulin (Gray and
Dowsett, 1988). Increasing the concentration of alginate within the beads can decrease the rate
of diffusion of the protein from alginate beads. As well, gels with higher α-L-gluronic acid
blocks exhibit larger pore structures and produce the highest protein diffusion rates (Matinsen,
Skjak-Braek et al., 1991). In addition, the rate of the diffusion may be influenced by the charge
on the matrixed protein. A protein with a net positive charge will form interactions with
negatively charged polymer and inhibit diffusion from the matrix (Mumper, Hoffman et al.,
1994).
Degradation
As well, protein may be released from encapsulation following the degradation of the
cross-linked alginate gel. A chelating agent such as lactate, citrate, phosphate, or a high
concentration of ions can be used to remove the cross-linking Ca2+
ions, resulting in the
breakdown of the matrix gel (Sutherland, 1991). This in turn will release encapsulated protein,
and allow for protein solubility in surrounding environments.
Release of Emulsion Encapsulated Particles
The release of encapsulated drug from oil in water emulsions will occur when the
emulsions are placed in another solvent medium through natural diffusion. However, the rate of
diffusion will vary greatly with degradation of the emulsions particles through various
mechanisms of emulsion aging. Although the use of polymer surfactant greatly reduces the rate
and occurrence of the various forms of degradation, factors such as time, temperature, solubility,
13
density, viscosity and particle size will nevertheless have a strong influence on the rate of
inevitable emulsion decomposition.
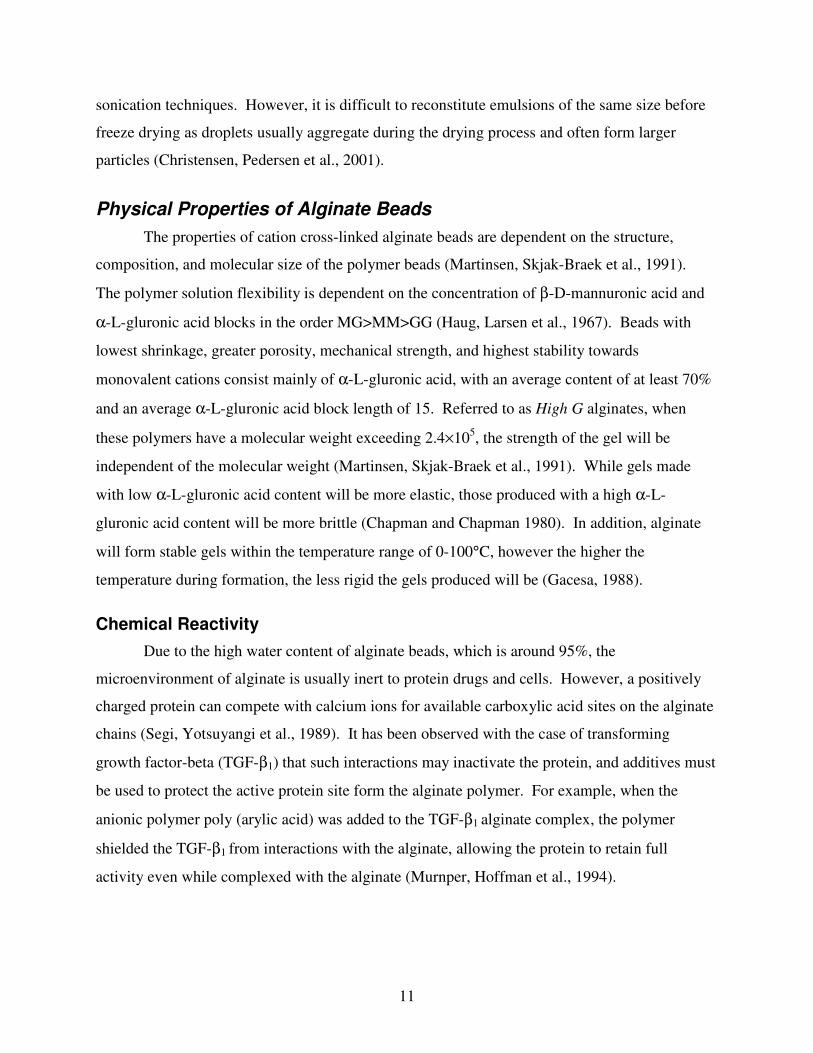
Creaming & Sedimentation
If there is a substantial difference between the densities of the droplets and the
surrounding solvent, then creaming or sedimentation is likely to occur. These are cases where
the droplets will shift within the continuous phase as seen in Figure 5. When the droplets are
lower in density then the continuous phase, then creaming will result where the droplets float
towards the surface of the solvent. In contrast, if the droplets are higher in density than the
continuous phase, then sedimentation will occur where the droplets will be pulled to the bottom
of the continuous phase by gravity (Bibette, Roux et al., 1992).
These processes can be prevented through the use of oil and solvent with similar
densities, and through the use of increased amounts of continuous phase, resulting in smaller
droplet size, and reducing the gravitational pull.
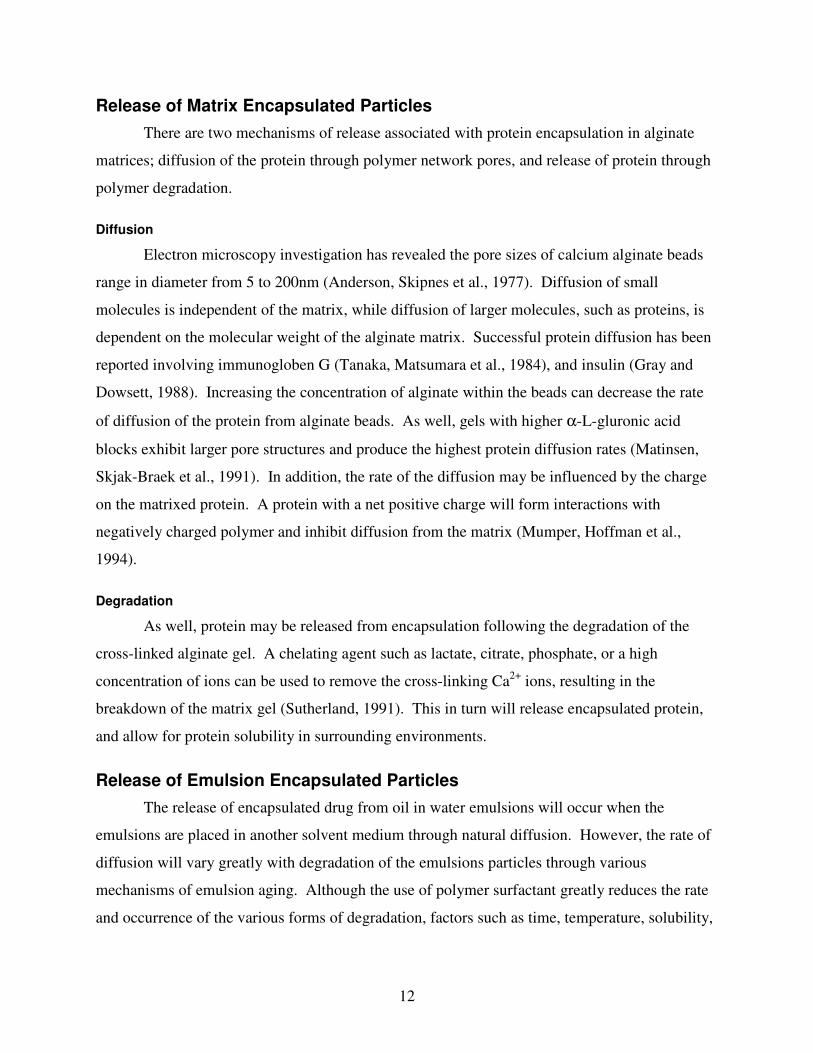
Flocculation
When droplet particles group together within the continuous phase, a phenomena known
as flocculation occurs as observed in
3 http://www.hanasc.co.kr/formulaction/ma2000.html
Figure 5. Creaming & Sedimentation 3
14
Figure 6. The groups are formed as the result of electrostatic interactions, intramolecular
forces, and hydrogen bonding, and occur independently of the densities of the phases. This
aggregation can be avoided through the use of a more viscous continuous phase fluid that will
reduce the movement of droplets within the medium. As well, flocculation may be avoided by
altering the pH of the continuous phase to repel the droplets (Blijdenstein, Zoet et al., 2004).
Flocculation does not involve coalescence, and therefore does not result in a change of particle
size.
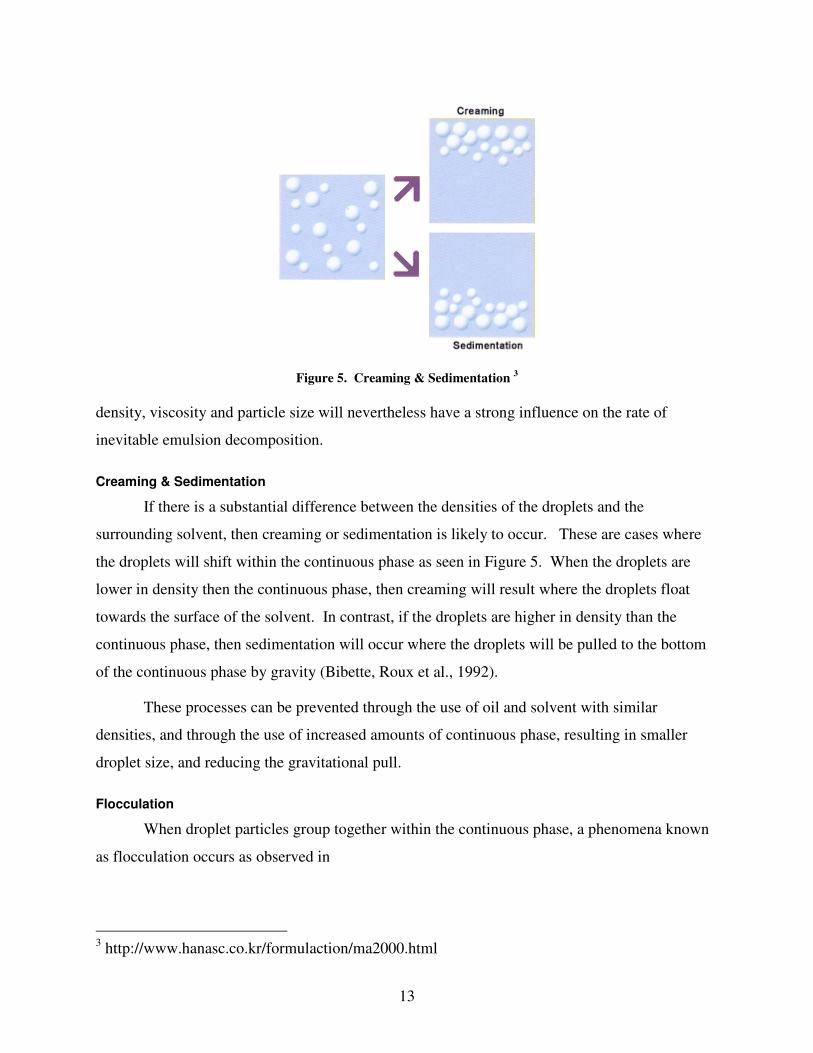
Coalescence
When flocculation occurs it is possible for the films that separate the droplets to rupture,
resulting in the joining of droplets and an increase in particle size. This is referred to as
coalescence as can be observed in Figure 7. Coalescence often occurs in the absence of or with
an inadequate amount of surfactant. After a period of time, coalescence will result in the
complete disassociation of the droplets, and the two phases will separate more distinctly.
Coalescence cannot occur without flocculation, so if flocculation can be prevented than
coalescence should not be a concern. As well, the proper use of an emulsifying agent, such as
4 (Correia et.al, 2005)
5 http://www.press.uillinois.edu/epub/books/brown/images/fig7.4b.gif
Figure 6. Flocculation 4
Figure 7. Coalescence 5
15
alginate polymer, will ensure stabilization of the particles and lower interfacial tensions, greatly
reducing the threat of coalescence (Imbert, Satdler et al., 2002).
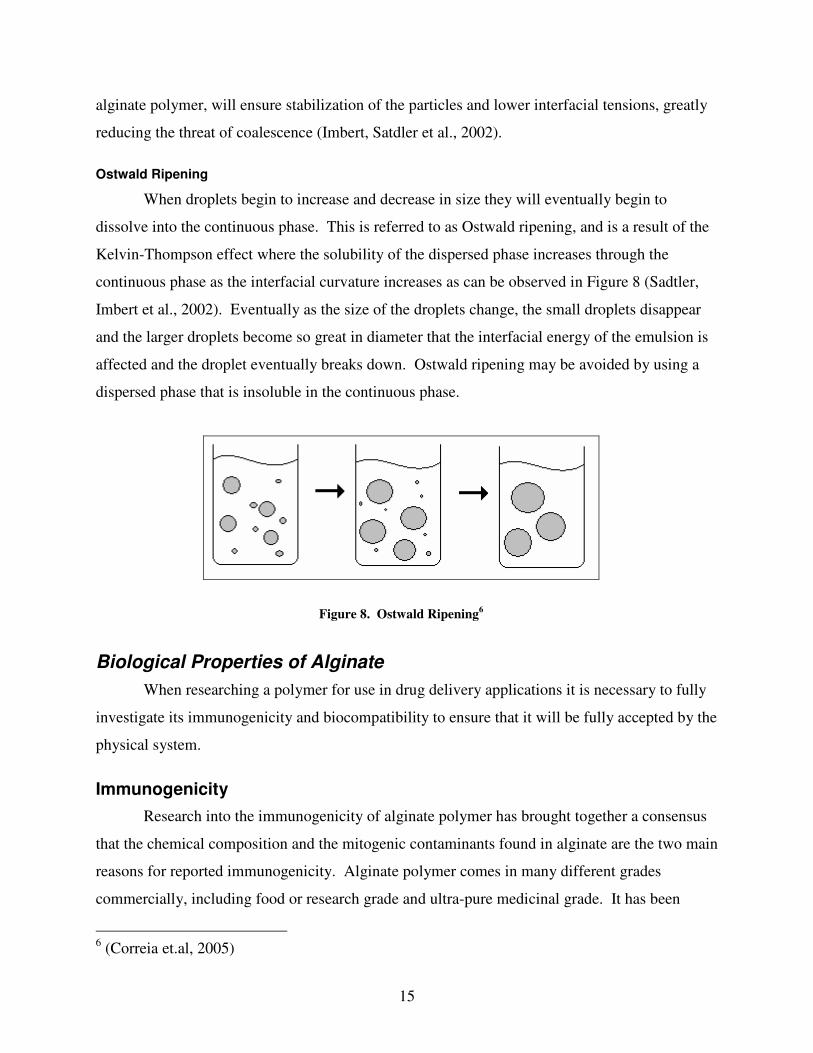
Ostwald Ripening
When droplets begin to increase and decrease in size they will eventually begin to
dissolve into the continuous phase. This is referred to as Ostwald ripening, and is a result of the
Kelvin-Thompson effect where the solubility of the dispersed phase increases through the
continuous phase as the interfacial curvature increases as can be observed in Figure 8 (Sadtler,
Imbert et al., 2002). Eventually as the size of the droplets change, the small droplets disappear
and the larger droplets become so great in diameter that the interfacial energy of the emulsion is
affected and the droplet eventually breaks down. Ostwald ripening may be avoided by using a
dispersed phase that is insoluble in the continuous phase.
Biological Properties of Alginate
When researching a polymer for use in drug delivery applications it is necessary to fully
investigate its immunogenicity and biocompatibility to ensure that it will be fully accepted by the
physical system.
Immunogenicity
Research into the immunogenicity of alginate polymer has brought together a consensus
that the chemical composition and the mitogenic contaminants found in alginate are the two main
reasons for reported immunogenicity. Alginate polymer comes in many different grades
commercially, including food or research grade and ultra-pure medicinal grade. It has been
6 (Correia et.al, 2005)
Figure 8. Ostwald Ripening6
16
shown that the impurities found in commercial alginate are responsible for the side affects
observed, including cytokine release and inflammatory reactions (Zimmerman, Klock et al.,
1995). However it is also proven that pure alginate does not contain these impurities and
therefore does not induce any side effects. In addition, researchers have proven that there is a
correlation between the level of mannuronic acid blocks and cytokine production (Otterlei,
Ostgaard et al., 1991), therefore it is recommended that pure alginate rich in α-L-gluronic acid is
used for in vivo research to avoid inflammatory reactions (Spargo, Rudolph et al., 1994).
Further research into the use of alginate as surgical gauzes and films reports full
biodegradability of the polymer in animal tissues with very little reaction (Blaine, 1947). As
well, when used as implants, alginate high in α-L-gluronic acid has proven to produce less of an
immunological response then polyvinyl alcohol and agarose gels (Spargo, Rudolph et al., 1994).
Moreover, investigations involving implantation of high α-L-gluronic acid alginate into the
upper nasophrynx of mice produced little or no inflammatory response, making alginate a very
promising drug delivery agent for mucosal delivery (Schuh, Fanslow et al., 1996).
Bioadhesion
Alginate polymer has a very strong bioadhesive property, which again makes it a viable
candidate for mucosal delivery. With carboxyl end groups, alginate is classified as an anionic
mucoadhesive polymer. Research has shown that polymers with charge density are strong
mucoadhesive agents (Chickering, Jacob et al., 1995). It is believed that penetration of the
polymer chain across a polymer-mucosa interface is responsible for the great adhesion (Jabari,
Wisniewski et al., 1993). Alginate has proven to have the greatest mucoadhesive strength when
compared with other polymers including polystyrene, chitosan, carboxy-methylcellulose, and
poly (lactic acid). Alginate’s strong bioadhesive properties will serve to localize the drug upon
release, and therefore would potentially improve the overall drug effectiveness with mucosal
delivery.
Possible Applications of Alginate Polymer Controlled Drug Release Systems
There are numerous possible applications of alginate polymer drug delivery systems
using both encapsulation with matrices and encapsulation with alginate surfactant oil in water
17
emulsions as delivery agents. Primarily, there is an increasingly strong market for vaccines to
numerous pathogens, and the traditional perenternal delivery route for these vaccines has proven
ineffective when treating against airborne or mucosal-related respiratory diseases (Mestecky,
1987).
Immunologists have recognized the potential of immunizing using the mucosal surfaces,
where the protective antibody, secretory immunoglobulin A (IgA), is produced (Mestecky,
1987). As alginate exhibits strong bioadhesion and biocompatibility for mucosal use, it is an
ideal candidate for mucosal vaccine and other drug delivery developments designed for the upper
respiratory tract. In addition, the slow release mechanism of alginate matrices has proven very
successful, and is potentially very useful for the release of therapeutic proteins. Several studies
have proven the in vitro and in vivo efficacy of slow alginate matrix drug release.
Moreover, investigations have been made into the encapsulation and release of other
materials, including DNA, microspheres, and liposomes. The successful encapsulation of DNA
has been observed, and release was achieved at pH 6.5 without denaturation of the DNA
molecule. There is potential to use this delivery method to target nucleic acids as agents in gene
transfer (Smith, 1994). In addition, alginate beads were prepared with encapsulated
microspheres by dispersing the microspheres in an aqueous solution of sodium alginate, and
dropping the resulting solution in a cross-linking CaCl2 bath. This has potential for an oral
delivery system of micro- and or nanoparticles (Bodemeier, Chen et al., 1989). As well,
liposomes have also been successfully encapsulated in alginate spheres after coating with
phospholipase C, D, or A2, and subsequent release was triggered by the enzymatic degradation of
the phospholipids by the phospholipases at 37°C. It is believed that by altering the
phospholipase used to coat the liposomes, the release of the liposomes may be controlled (Igari,
Kibat et al., 1990).
Overall, there have been many promising investigations into various potential methods of
alginate drug delivery, and due to its high biocompatibility and bioadhesive properties, alginate
is an ideal candidate for further investigation.
18
Methodology
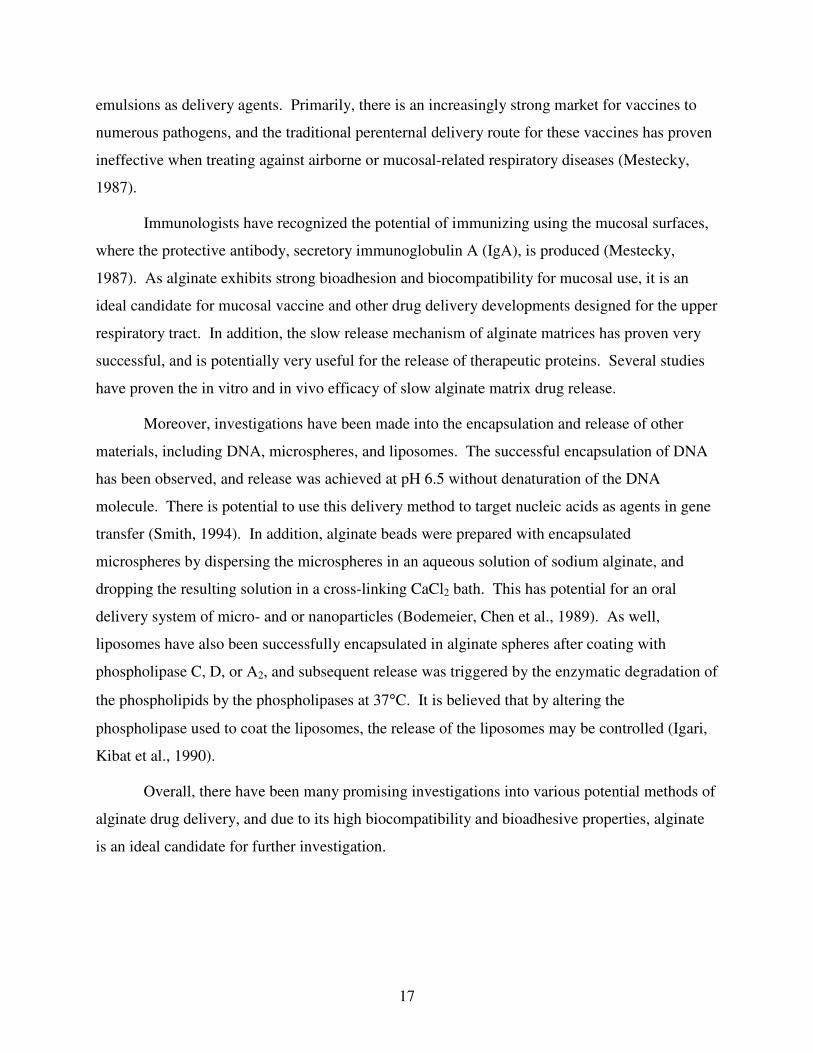
Alginate Synthesis
The modified alginate that was used in all experiments was prepared using the following
method. A solution of 10g AANa (sodium alginate) in ethanol (70%) with 10 ml HCl (37%,
12N) was stirred in an ice bath at 4°C for 30min, then filtered, washed with 2L ethanol (70%)
and 0.5L acetone. The product was dried in a vacuum for 2hrs, and redissolved in 0.5L H2O.
TBA OH (0.15M) was then titrated into the alginate solution until a neutral pH of 7.0 was
achieved. The solution was very viscous during the first steps of titration, but became much
more manageable with the increase in pH. The resulting solution of AATBA was divided into
five flasks, frozen, and lyophilized for 2 days. The product was collected and massed at 15.31g,
a 75% yield.
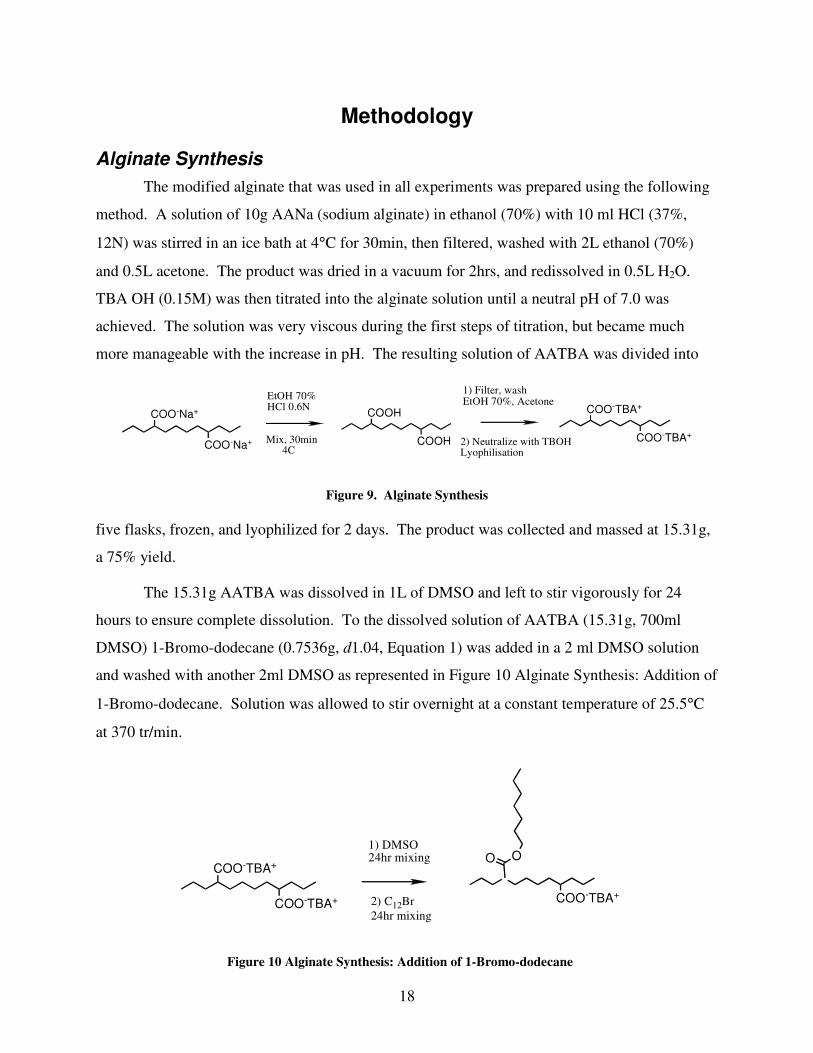
The 15.31g AATBA was dissolved in 1L of DMSO and left to stir vigorously for 24
hours to ensure complete dissolution. To the dissolved solution of AATBA (15.31g, 700ml
DMSO) 1-Bromo-dodecane (0.7536g, d1.04, Equation 1) was added in a 2 ml DMSO solution
and washed with another 2ml DMSO as represented in Figure 10 Alginate Synthesis: Addition of
1-Bromo-dodecane. Solution was allowed to stir overnight at a constant temperature of 25.5°C
at 370 tr/min.
COO-Na+
COO-Na+
EtOH 70%HCl 0.6N
Mix, 30min 4C
COOH
COOH
1) Filter, wash EtOH 70%, Acetone
2) Neutralize with TBOHLyophilisation
COO-TBA+
COO-TBA+
Figure 9. Alginate Synthesis
COO-TBA+
COO-TBA+
1) DMSO24hr mixing
2) C12Br
24hr mixing
COO-TBA+
OO
Figure 10 Alginate Synthesis: Addition of 1-Bromo-dodecane
19
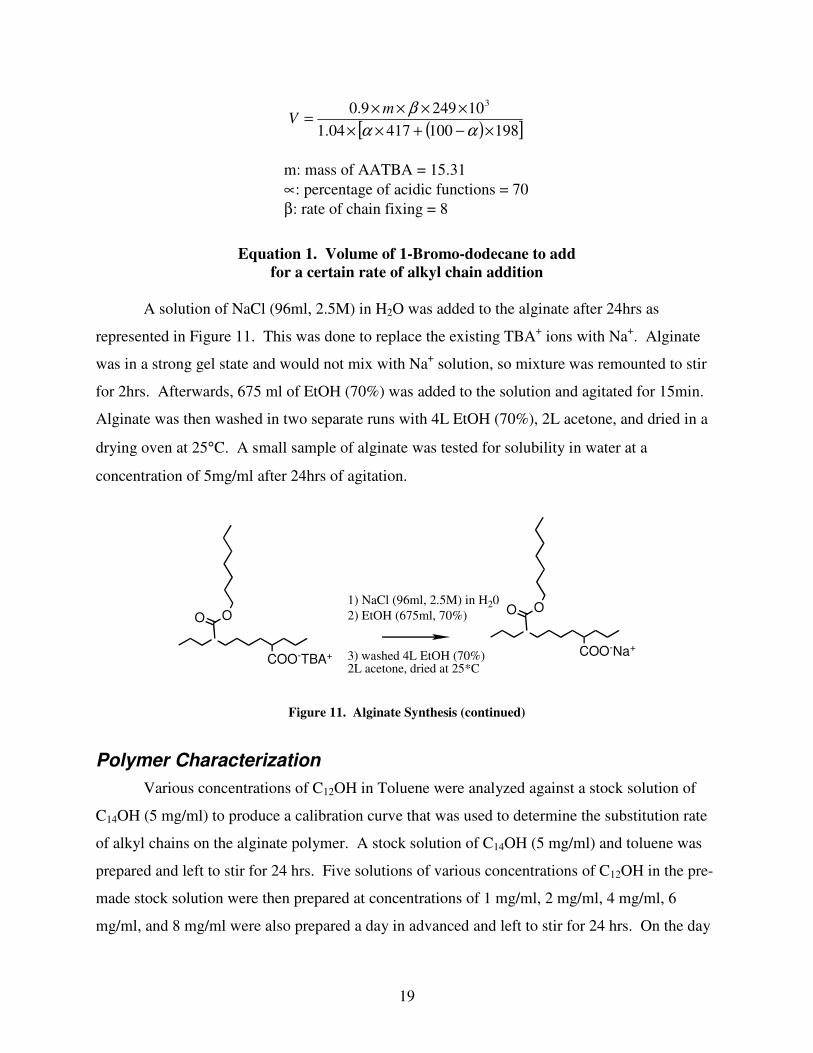
A solution of NaCl (96ml, 2.5M) in H2O was added to the alginate after 24hrs as
represented in Figure 11. This was done to replace the existing TBA+ ions with Na
+. Alginate
was in a strong gel state and would not mix with Na+ solution, so mixture was remounted to stir
for 2hrs. Afterwards, 675 ml of EtOH (70%) was added to the solution and agitated for 15min.
Alginate was then washed in two separate runs with 4L EtOH (70%), 2L acetone, and dried in a
drying oven at 25°C. A small sample of alginate was tested for solubility in water at a
concentration of 5mg/ml after 24hrs of agitation.
Polymer Characterization
Various concentrations of C12OH in Toluene were analyzed against a stock solution of
C14OH (5 mg/ml) to produce a calibration curve that was used to determine the substitution rate
of alkyl chains on the alginate polymer. A stock solution of C14OH (5 mg/ml) and toluene was
prepared and left to stir for 24 hrs. Five solutions of various concentrations of C12OH in the pre-
made stock solution were then prepared at concentrations of 1 mg/ml, 2 mg/ml, 4 mg/ml, 6
mg/ml, and 8 mg/ml were also prepared a day in advanced and left to stir for 24 hrs. On the day
( )[ ]19810041704.1
102499.0 3
×−+××
××××=
αα
βmV
m: mass of AATBA = 15.31
∝: percentage of acidic functions = 70
β: rate of chain fixing = 8
Equation 1. Volume of 1-Bromo-dodecane to add
for a certain rate of alkyl chain addition
1) NaCl (96ml, 2.5M) in H20
2) EtOH (675ml, 70%)
3) washed 4L EtOH (70%)2L acetone, dried at 25*C
COO-Na+
OO
COO-TBA+
OO
Figure 11. Alginate Synthesis (continued)
20
of analysis, a solution of 100 mg alginate in 1ml NaOH solution (4N) and 4 ml H2O was
prepared. The solutions of C12OH at various concentrations were analyzed with Gas
Chromatography on a GC-17A Shimodzu Gas Chromatograph.
Analysis of Chemical Properties of Lidocaine
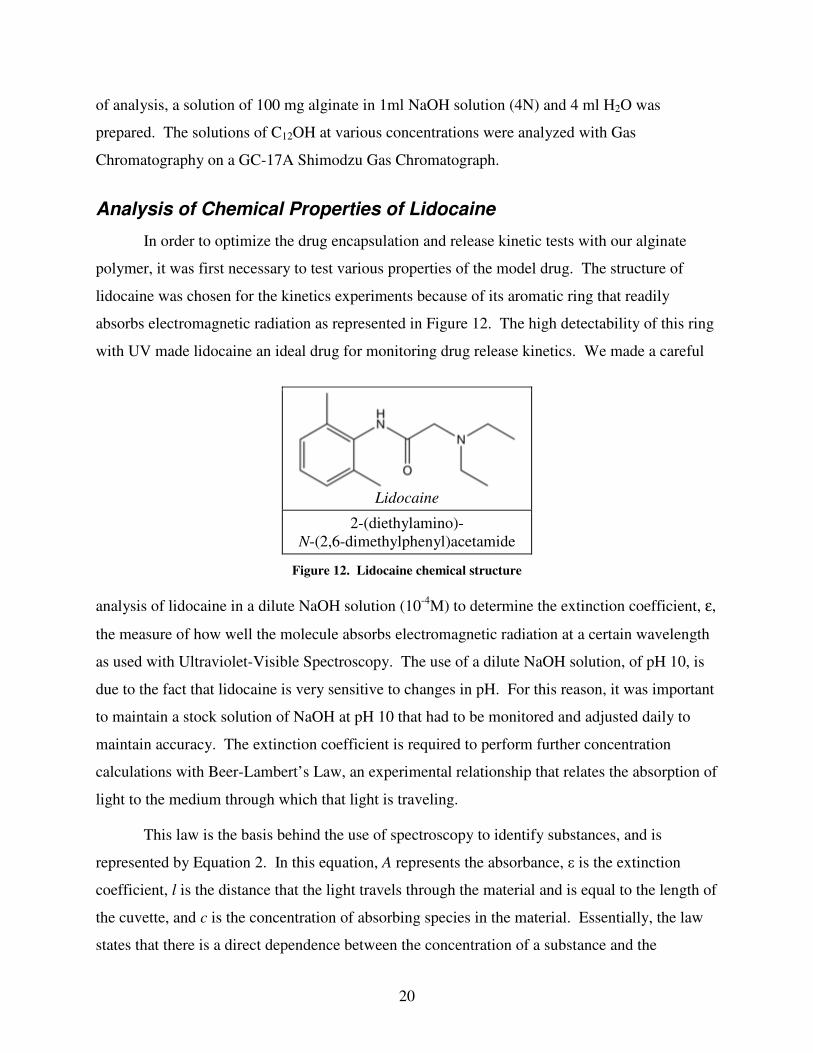
In order to optimize the drug encapsulation and release kinetic tests with our alginate
polymer, it was first necessary to test various properties of the model drug. The structure of
lidocaine was chosen for the kinetics experiments because of its aromatic ring that readily
absorbs electromagnetic radiation as represented in Figure 12. The high detectability of this ring
with UV made lidocaine an ideal drug for monitoring drug release kinetics. We made a careful
analysis of lidocaine in a dilute NaOH solution (10-4
M) to determine the extinction coefficient, ε,
the measure of how well the molecule absorbs electromagnetic radiation at a certain wavelength
as used with Ultraviolet-Visible Spectroscopy. The use of a dilute NaOH solution, of pH 10, is
due to the fact that lidocaine is very sensitive to changes in pH. For this reason, it was important
to maintain a stock solution of NaOH at pH 10 that had to be monitored and adjusted daily to
maintain accuracy. The extinction coefficient is required to perform further concentration
calculations with Beer-Lambert’s Law, an experimental relationship that relates the absorption of
light to the medium through which that light is traveling.
This law is the basis behind the use of spectroscopy to identify substances, and is
represented by Equation 2. In this equation, A represents the absorbance, ε is the extinction
coefficient, l is the distance that the light travels through the material and is equal to the length of
the cuvette, and c is the concentration of absorbing species in the material. Essentially, the law
states that there is a direct dependence between the concentration of a substance and the
Lidocaine
2-(diethylamino)-
N-(2,6-dimethylphenyl)acetamide
Figure 12. Lidocaine chemical structure
21
absorbance of light in the substance, as well as the length of material that the light travels
through. Therefore, if the variables l and ε are known, the concentration of the substance can be
calculated from the amount of light that is absorbed.
Extinction Coefficient Determination
To determine the extinction coefficient of lidocaine, a plot of the concentration of
lidocaine in solution versus its absorbance was required. The plot would be linear for lidocaine
concentrations less than 1 g/L and the slope of the line would be the extinction coefficient since
the length of the cuvette was 1cm. A stock solution of approximately 1 g/L lidocaine in 10-4
M
NaOH was prepared for the analysis. The exact amount of lidocaine and 10-4
M NaOH used to
make the solution were weighed using a precision scale to determine the exact concentration of
the solution as weighing is more accurate than measuring by volume as long as the density of the
solution is known. Since 10-4
M NaOH is very dilute, the density was assumed to be equal to
water. In this case, 0.026 g of lidocaine was combined with 25.755 g of 10-4
M NaOH solution
to obtain a lidocaine solution of 0.999 g/L. The solution was allowed to stir overnight to ensure
that it was completely dissolved before UV spectroscopy tests were performed.
Before the UV spectrophotometer could be used, it had to be calibrated. The 10-4
M
NaOH solution was used as the baseline calibration for the machine. A spectrum scan was then
run to on the NaOH solution to verify that no light was absorbed at all wavelengths. Once the
machine was calibrated, the stock solution of lidocaine was taken and three additional dilutions
were made so that the approximate concentrations of the solutions were 0.25 g/L, 0.5 g/L, 0.75
g/L and the original 1 g/L. Each of these dilutions was prepared using the precision scale so that
the exact concentration of each was known. Each solution was then run through the UV
spectrophotometer and the absorbance at the peak of each spectrum scan, corresponding to a
wave length of 262nm, was recorded. Each absorbance was then plotted against its respective
concentration and a trend line was added, giving the slope of the line and thus the extinction
coefficient of lidocaine.
clA ⋅⋅= ε
Equation 2. Beer-Lamberts Law
22
Solubility of Lidocaine
Once the extinction coefficient had been determined, UV spectroscopy could be used to
determine the solubility of lidocaine. Approximately 1g of lidocaine was placed in 100 mL of
10-4
M NaOH solution and allowed to stir overnight. Then the lidocaine solution was
centrifuged to collect the undissolved lidocaine so that the saturated lidocaine solution could be
removed. The concentration of the saturated lidocaine solution was assumed to be greater than 1
g/L and thus it needed to be diluted for UV analysis. A one to six dilution ratio was chosen and
both the amount of saturated solution and 10-4
M NaOH solution added were weighed using the
precision scale. The diluted sample was then analyzed using UV spectroscopy and the
absorbance was recorded. Using the extinction coefficient previously determined, the
concentration of the sample was less than 1 g/L and no further dilution was needed. The actual
saturation concentration of the lidocaine was then back calculated based on the amount the
sample was diluted.
Partition Coefficient (Kp)
The partition coefficient, Kp, is the measure of differential solubility of a compound in
two immiscible solvents. Kp is defined as the ratio of the concentration of the solute in one
solvent to its concentration in the other solvent, as represented in Equation 3. The standard
method for Kp determination is the shake-flask method, where a known amount of substance is
dissolved in a known volume of either solvent. After mixing well and allowing adequate time to
reach equilibrium, the concentration in one of the solvents is recorded using UV spectroscopy.
In this case, the goal was to determine the partition coefficient for lidocaine in oil versus in a
dilute solution of 10-4
M NaOH.
Two different approaches were used for this experiment. In the first trials a known
amount of lidocaine was dissolved in the NaOH solution at a concentration close to the
saturation value (about 4 mg/mL). This aqueous lidocaine solution was mixed with four
different clean oils: dicaprylyl carbonate, caprylic/capric triglyceride, octyldodecanol, and
aqueousin lidocaine
oilin lidocaine
C
CK P =
Equation 3. Partition Coefficient Determination

23
miglyol. Three trials were performed using different volume ratios of oil to aqueous and
different total volumes.
1) 3:5 (oil:aqueous), 4 mL total
2) 3:5 (oil:aqueous), 10 mL total
3) 1:1 (oil:aqueous), 10 mL total
In each case, the samples were mixed well overnight and allowed to settle until the
phases were visually separated. In the second trials, the lidocaine was dissolved in oil (6
mg/mL) and mixed with the pure NaOH solution at a ratio of 1:1 (oil:aqueous), 10 mL total.
Like in the previous trials, the samples were shaken overnight, and then allowed to settle.
In each case, the aqueous phase was analyzed using UV spectroscopy and the previously
determined extinction coefficient in order to determine the resulting concentration of lidocaine in
that phase. Since the initial concentrations were known, the equilibrium lidocaine concentration
in the oil could be calculated.
It was very important that the lidocaine was given adequate time to dissolve in the
primary solvent before the second solvent was added to the solution. In addition, it was
necessary to thoroughly disturb the oil and water mixture with a stir bar to ensure that the drug
had adequate time to move between phases. Likewise, it was equally important to let the two
phases separate afterwards to ensure that only the aqueous phase was removed for UV analysis.
Oil Purity
There were four oils available for drug encapsulation studies and it was necessary to
investigate the purity of the oils in addition to the partition coefficients to determine the oil most
suitable for emulsification. The purity of the oils has a strong affect on emulsion preparation and
stability, so the cleaner the oil the better the emulsification procedures and analysis will run. In
order to determine the purity of the oils, small amounts of each oil (5ml) was washed three times
with the dilute NaOH solution, then on the third washing samples of the aqueous solution were
tested with UV to determine purity. The pure oils would reveal clean NaOH solutions, while the
aqueous from the still impure oils would give unwanted peaks against the baseline NaOH. The
four oils under investigation were dicaprylyl carbonate, caprylic/capric triglyceride,
octyldodecanol, and miglyol. The miglyol and the caprylic/capric triglyceride proved to be the
24
least pure out of the four chosen, while the dicaprylyl carbonate was the second purest and
octyldodecanol was the purest oil tested. Based on the partition coefficient results and the oil
purity results, it was determined that octyldodecanol was the most suitable oil for
experimentation, and a large volume (300 ml) was washed three times with the dilute NaOH
soultion to ensure purity.
Emulsions
Emulsion preparation was a major part of the investigation, as alginate emulsions had not
yet been closely investigated by ENSIC and the optimal conditions for emulsification were
unknown. Therefore, we attempted to form emulsions at a variety of concentrations and
solvent/oil ratios to properly optimize the emulsification process. This section outlines the steps
for emulsion preparation, and the analysis of emulsions produced including particle size and
stability.
Emulsion Preparation
A solution of lidocaine at a measured concentration was prepared the day before
emulsification and stirred for 24hrs to ensure complete dissolution. Emulsions were first
prepared with concentrations ranging from 0.1mg/ml to 4mg/ml and tested for particle size and
strength until an optimal concentration was found, as described in the results section. The
solution was then combined at a specific ratio of 10% to 30% oil to yield 10ml total, and the
resulting oil/aqueous mixture was vortexed using a Yellow Line vortexer at a speed of 2500 rpm
for a period of one minute. The solutions were then ready for emulsification.
Emulsification
Emulsions were prepared by sonication with a Vibra-Cell emulsifier (Bioblock
Scientific). Sonication is a technique that irritates the solution with high frequency sound waves
that increases the rate of reaction and stabilizes the oil/water mixture. After the initial oil/water
solutions were vortexed they were introduced to the sonicator device and the sonic probe was
carefully inserted in the vial at the point of oil/water separation ensuring that it did not touch any
sides of the surrounding vial, and the vial was fastened with a clamp. The depth of probe
insertion was recorded so that the same experimental conditions could be reproduced in future
emulsifications. A water bath was then placed around the vial to absorb the heat of the
25
anticipated reaction, and the sonication procedure was started. The sonicator was adjusted for a
time of 3 minutes with a 50% active cycle and a power level of 5, or approximately 100 W.
These settings were kept constant through the remaining emulsification experiments.
The intensive shock waves as applied during emulsification speed up the reaction rate of
the oil/polymer solution, producing one homogeneous emulsified solution. The solution
produced was then ready to be investigated for particle size and stability.
Particle Size Analysis
Once the emulsions were prepared it was necessary to determine the size of the emulsion
particles, as the aim was to optimize the emulsion procedure to produce the smallest and most
stable emulsion particles possible. The particle sizes were investigated using a Malvern
Instrument High Performance Particle Sizer produced by Spectris Co. This HPPS contains a
Neon-Helium laser with a high sensitivity that overcomes the multiple angle scattering produced
by the particles. HPPS analytical equipment is capable of measuring particle sizes from 0.6 to
6000 nm, and is able to minimize error from sources such as dust particles and occasional large
emulsion droplets by taking readings at different angles within the cuvette.
The emulsions samples were prepared by adding a drop of emulsion to approximately
3ml of prepared NaCl (10-3
M) solution, and mixed thoroughly with a pipette. The vial was then
inserted in the particle sizer and data was gathered as described in the results section of this
report. In accordance with the observed particle sizes, sizes for various emulsion were explored
from 0.1 to 4.0mg/ml alginate concentration in both NaOH solution and 10-2
M NaCl solution,
and in both 10% and 20% octyldodecanol mixtures. The cuvette with the diluted emulsion
samples was introduced into the HPPS after a warm up period of ten minutes, allowing the
particle sizer to adjust to 25°C. Once the proper temperature was reached the parameter settings
were adjusted as outlined in Appendix A1. Once the settings were optimized, the cuvette
samples were run 3 times, with each run involving between 8 and 20 various sub-measurements.
These measurements were then averaged out and the average particle size and polydispersity
values, or the range of particle size in solution, for each sample were obtained. The emulsions
prepared which retained relatively small particle sizes and decent polydispersity values over a
period of a couple days were then tested for stability.
26
Emulsion Stability
The stability of the emulsions was investigated through both lyophilization and
centrifugation, and the sizes of the emulsions were re-measured after disturbance. Primarily,
lyophilization allows for the drying of a specific sample without changing the structure. A small
amount of the emulsion (1 ml) was placed in a 5 ml plastic tube, and a collection of these plastic
tubes were bound together and immersed in liquid nitrogen. When the emulsions inside the
tubes were completely frozen, the bundle was then put into a larger flask that was then connected
to the lyophilizer and allowed to freeze-dry for 48hrs. Lyophilization itself involves the
vacuuming of the solvent at a low temperature, entirely avoiding high temperatures that might
interfere with chemical structure. This method is used often in organic chemistry as it
successfully removes solvent, leaving only the desired chemical compound that can then be
processed and stored as desired. However, with our investigations the lyophilized emulsions
were then reconstituted in 1 ml MilliQ water, and sonicated to ensure complete dissolution
before they were tested again for particle size.
In addition, centrifugation was also used a method to test particle stability. Samples of
promising emulsions were placed in centrifuge tubes and centrifuged at 110 g for 10 min. These
samples were then investigated for oil/water separation, but fortunately no separation was
observed. The centrifuged samples were then also tested for particle size, and all data was
recorded.
The methods of lyophilization and centrifugation were both used to test against
coalescence of the emulsion particles, and emulsion which were able to retain their former
particle size after freeze drying and centrifugation were identified as promising, while only the
optimal emulsions were chosen for drug release experimentation.
Lidocaine Encapsulation
After the conditions for emulsion preparation were optimized the experimentation with
lidocaine encapsulation and release was started. It had been determined that emulsions prepared
with 1.4mg/ml alginate in NaCl (10-2
M) were the most stable, so three emulsions were prepared
at the same concentration with the addition of 25mg/ml lidocaine in the octyldodecanol. The
emulsions were tested for particle size reproducibility, and then combined for lidocaine release
analyses.
27
Lidocaine Release Kinetics
Experiments were carried out to determine the volume of lidocaine released from the
emulsion into an external solution. As desired with drug release experiments, a release curve
that maintained a constant rate of release after a certain period of time was desired. In order to
make proper calculations, a sample run of lidocaine in NaOH solution was tested, a solution with
lidocaine and alginate was tested, and finally the lidocaine emulsions were tested for release rate
into a dilute NaOH bath.
In order to test the release kinetics of the various solutions, the emulsions were
transferred into clean, washed membranes, which were then tied shut, rinsed, and submersed in
the bath which was subjected to light stirring with a magnetic stir bar. For samples, UV tests
were carried out periodically on about 1.5 mL of the bath solution to determine the concentration
of lidocaine and subsequently the release kinetics. When samples were removed from the bath,
they were later returned to the bath to maintain a constant volume.
The lidocaine release test consisted of a 10 mL solution of 3mg/ml lidocaine in dilute
NaOH. This lidocaine solution was placed inside of a dialysis bag, which in turn was put in a 60
mL bath of the base NaOH solution. Samples were taken from the bath regularly, tested for UV
absorbance, and then returned to the bath.
A test of lidocaine and alginate (no emulsion) was performed to see if there was any
difference in release simply from alginate being present. For this experiment, a 10 mL solution
was prepared containing 10-4
M NaOH, 1.4 mg/mL alginate, and 2.5 mg/mL lidocaine. The
solution was placed inside of a dialysis bag, which was put in a 100mL bath of the dilute NaOH
solution. As described previously, samples were taken from the bath, tested for UV absorbance,
and returned to the bath.
The final test that was performed analyzed the release of lidocaine from an alginate-
stabilized emulsion. The emulsion created for this test contained 25 mg/mL lidocaine in
octyldodecanol which was combined with an aqueous solution consisting of 1.4mg/mL modified
alginate in dilute NaOH and 10-2
M NaCl. The oil to aqueous volume ratio used was 1:9, as this
yielded the best results from the emulsion stability experiments. The emulsion was created as
described previously in the section on emulsification. In total, 30 mL of emulsion was placed
28
inside a dialysis bag, which was then put in a bath of 100 mL dilute NaOH solution. Samples
were taken in the same manner as the other release experiments.
29
Results and Discussion
Rate of C12 Fixation
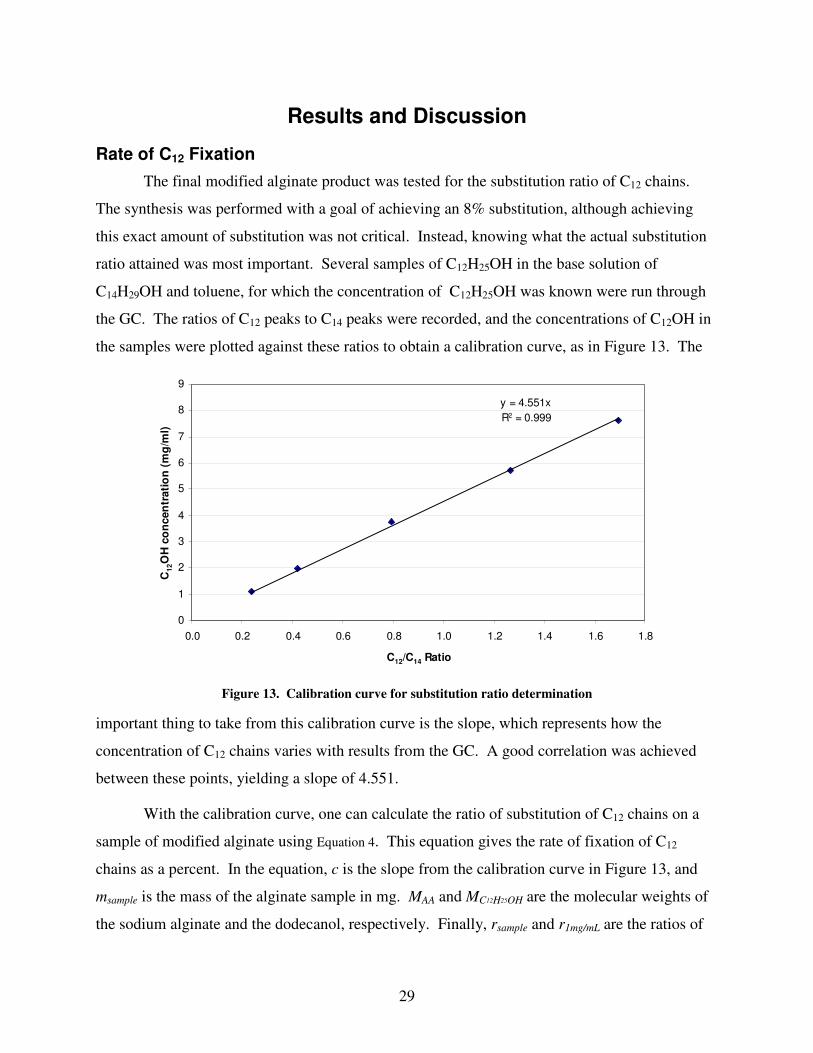
The final modified alginate product was tested for the substitution ratio of C12 chains.
The synthesis was performed with a goal of achieving an 8% substitution, although achieving
this exact amount of substitution was not critical. Instead, knowing what the actual substitution
ratio attained was most important. Several samples of C12H25OH in the base solution of
C14H29OH and toluene, for which the concentration of C12H25OH was known were run through
the GC. The ratios of C12 peaks to C14 peaks were recorded, and the concentrations of C12OH in
the samples were plotted against these ratios to obtain a calibration curve, as in Figure 13. The
important thing to take from this calibration curve is the slope, which represents how the
concentration of C12 chains varies with results from the GC. A good correlation was achieved
between these points, yielding a slope of 4.551.
With the calibration curve, one can calculate the ratio of substitution of C12 chains on a
sample of modified alginate using Equation 4. This equation gives the rate of fixation of C12
chains as a percent. In the equation, c is the slope from the calibration curve in Figure 13, and
msample is the mass of the alginate sample in mg. MAA and MC12H25OH are the molecular weights of
the sodium alginate and the dodecanol, respectively. Finally, rsample and r1mg/mL are the ratios of
y = 4.551x
R2 = 0.999
0
1
2
3
4
5
6
7
8
9
0.0 0.2 0.4 0.6 0.8 1.0 1.2 1.4 1.6 1.8
C12/C14 Ratio
C1
2O
H c
on
cen
trati
on
(m
g/m
l)
Figure 13. Calibration curve for substitution ratio determination
30
the C12 areas to the C14 areas on the GC for the alginate sample and the 1mg/mL sample,
respectively. Plugging the values into the equation gives a rate of C12 fixation of 5.3%. This is
slightly lower than the target of 8%, however knowing the actual rate is more important.
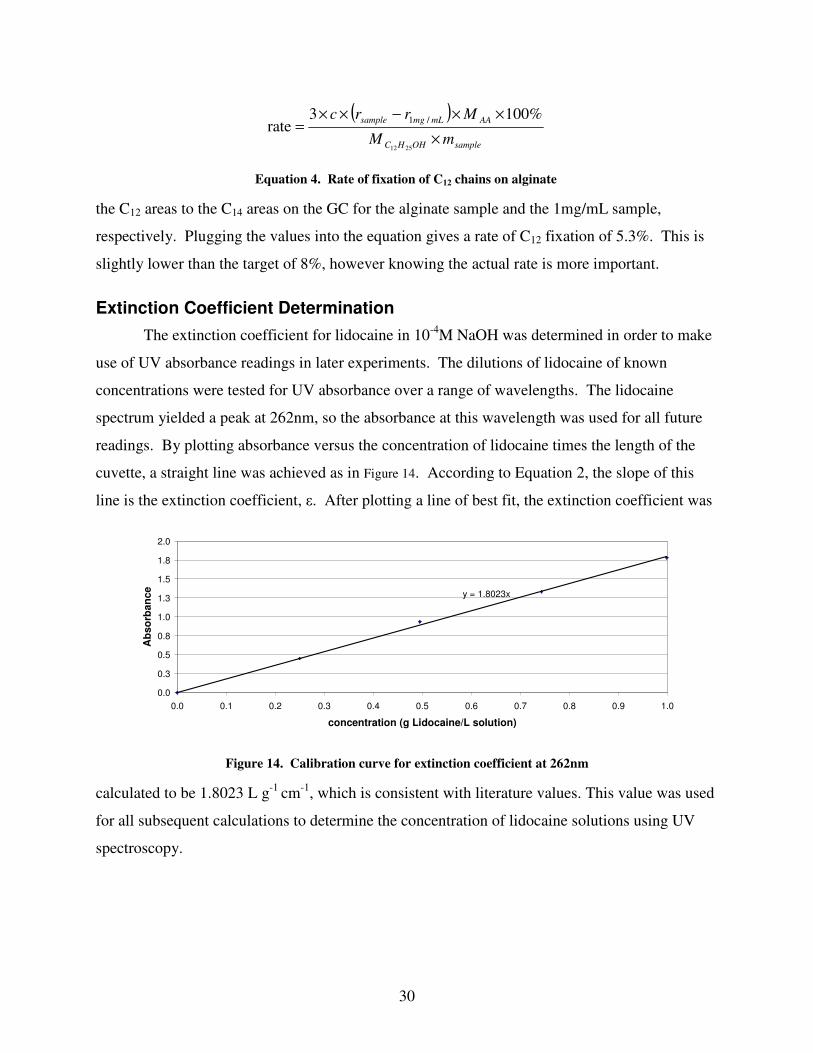
Extinction Coefficient Determination
The extinction coefficient for lidocaine in 10-4
M NaOH was determined in order to make
use of UV absorbance readings in later experiments. The dilutions of lidocaine of known
concentrations were tested for UV absorbance over a range of wavelengths. The lidocaine
spectrum yielded a peak at 262nm, so the absorbance at this wavelength was used for all future
readings. By plotting absorbance versus the concentration of lidocaine times the length of the
cuvette, a straight line was achieved as in Figure 14. According to Equation 2, the slope of this
line is the extinction coefficient, ε. After plotting a line of best fit, the extinction coefficient was
calculated to be 1.8023 L g-1
cm-1
, which is consistent with literature values. This value was used
for all subsequent calculations to determine the concentration of lidocaine solutions using UV
spectroscopy.
( )sampleOHHC
AAmLmgsample
mM
Mrrc
×
××−××=
2512
%1003rate
/1
Equation 4. Rate of fixation of C12 chains on alginate
y = 1.8023x
0.0
0.3
0.5
0.8
1.0
1.3
1.5
1.8
2.0
0.0 0.1 0.2 0.3 0.4 0.5 0.6 0.7 0.8 0.9 1.0
concentration (g Lidocaine/L solution)
Ab
so
rban
ce
Figure 14. Calibration curve for extinction coefficient at 262nm
31
Partition Coefficient (Kp)
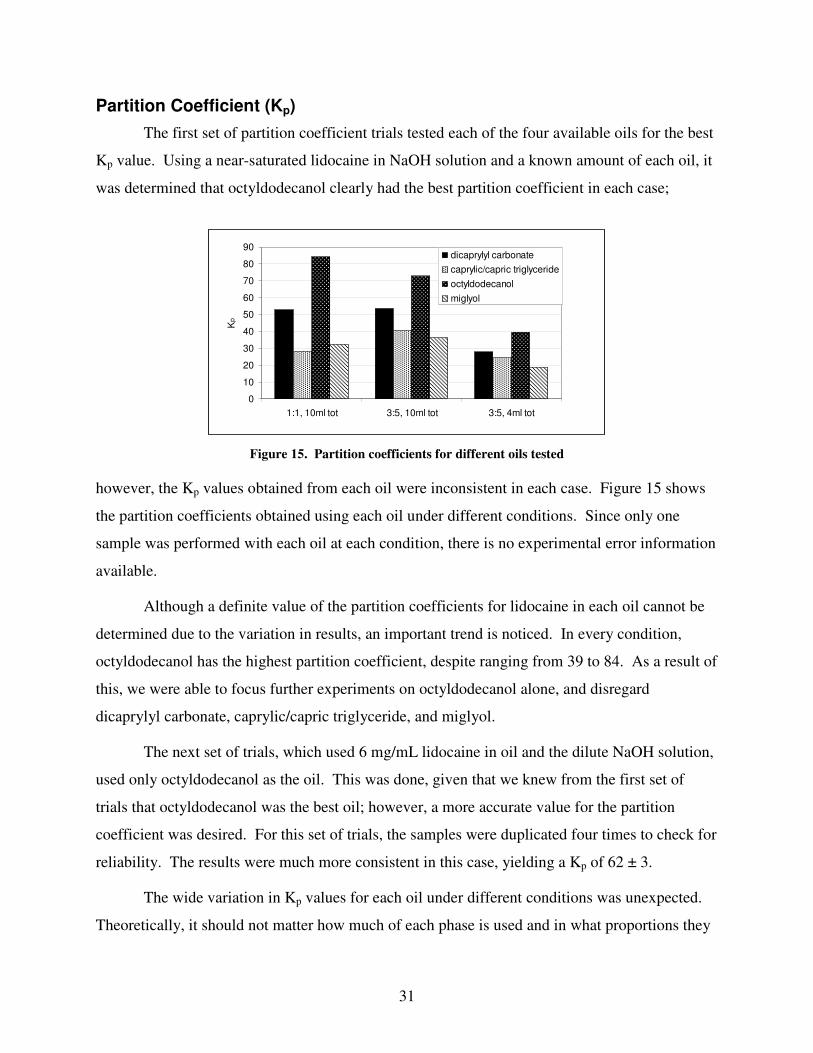
The first set of partition coefficient trials tested each of the four available oils for the best
Kp value. Using a near-saturated lidocaine in NaOH solution and a known amount of each oil, it
was determined that octyldodecanol clearly had the best partition coefficient in each case;
however, the Kp values obtained from each oil were inconsistent in each case. Figure 15 shows
the partition coefficients obtained using each oil under different conditions. Since only one
sample was performed with each oil at each condition, there is no experimental error information
available.
Although a definite value of the partition coefficients for lidocaine in each oil cannot be
determined due to the variation in results, an important trend is noticed. In every condition,
octyldodecanol has the highest partition coefficient, despite ranging from 39 to 84. As a result of
this, we were able to focus further experiments on octyldodecanol alone, and disregard
dicaprylyl carbonate, caprylic/capric triglyceride, and miglyol.
The next set of trials, which used 6 mg/mL lidocaine in oil and the dilute NaOH solution,
used only octyldodecanol as the oil. This was done, given that we knew from the first set of
trials that octyldodecanol was the best oil; however, a more accurate value for the partition
coefficient was desired. For this set of trials, the samples were duplicated four times to check for
reliability. The results were much more consistent in this case, yielding a Kp of 62 ± 3.
The wide variation in Kp values for each oil under different conditions was unexpected.
Theoretically, it should not matter how much of each phase is used and in what proportions they
0
10
20
30
40
50
60
70
80
90
1:1, 10ml tot 3:5, 10ml tot 3:5, 4ml tot
Kp
dicaprylyl carbonate
caprylic/capric triglyceride
octyldodecanol
miglyol
Figure 15. Partition coefficients for different oils tested
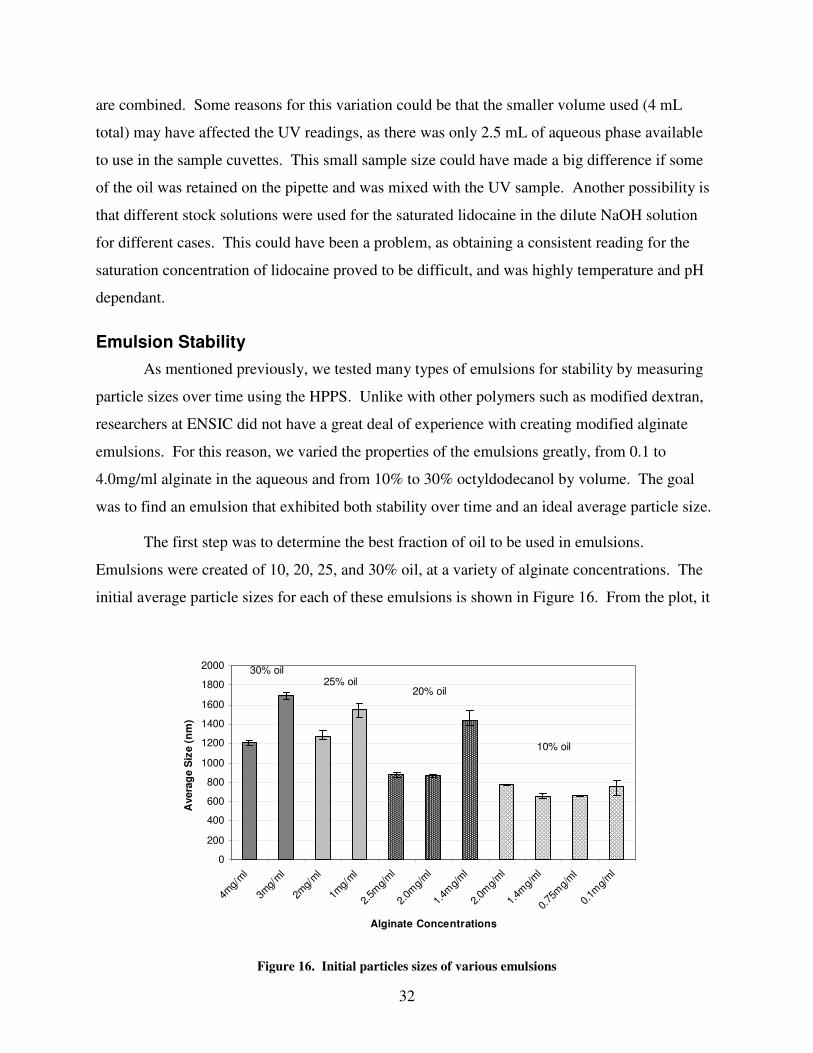
32
are combined. Some reasons for this variation could be that the smaller volume used (4 mL
total) may have affected the UV readings, as there was only 2.5 mL of aqueous phase available
to use in the sample cuvettes. This small sample size could have made a big difference if some
of the oil was retained on the pipette and was mixed with the UV sample. Another possibility is
that different stock solutions were used for the saturated lidocaine in the dilute NaOH solution
for different cases. This could have been a problem, as obtaining a consistent reading for the
saturation concentration of lidocaine proved to be difficult, and was highly temperature and pH
dependant.
Emulsion Stability
As mentioned previously, we tested many types of emulsions for stability by measuring
particle sizes over time using the HPPS. Unlike with other polymers such as modified dextran,
researchers at ENSIC did not have a great deal of experience with creating modified alginate
emulsions. For this reason, we varied the properties of the emulsions greatly, from 0.1 to
4.0mg/ml alginate in the aqueous and from 10% to 30% octyldodecanol by volume. The goal
was to find an emulsion that exhibited both stability over time and an ideal average particle size.
The first step was to determine the best fraction of oil to be used in emulsions.
Emulsions were created of 10, 20, 25, and 30% oil, at a variety of alginate concentrations. The
initial average particle sizes for each of these emulsions is shown in Figure 16. From the plot, it
0
200
400
600
800
1000
1200
1400
1600
1800
2000
4mg/
ml
3mg/
ml
2mg/
ml
1mg/
ml
2.5m
g/m
l
2.0m
g/m
l
1.4m
g/m
l
2.0m
g/m
l
1.4m
g/m
l
0.75
mg/
ml
0.1m
g/m
l
Alginate Concentrations
Avera
ge S
ize (
nm
)
10% oil
20% oil25% oil
30% oil
Figure 16. Initial particles sizes of various emulsions
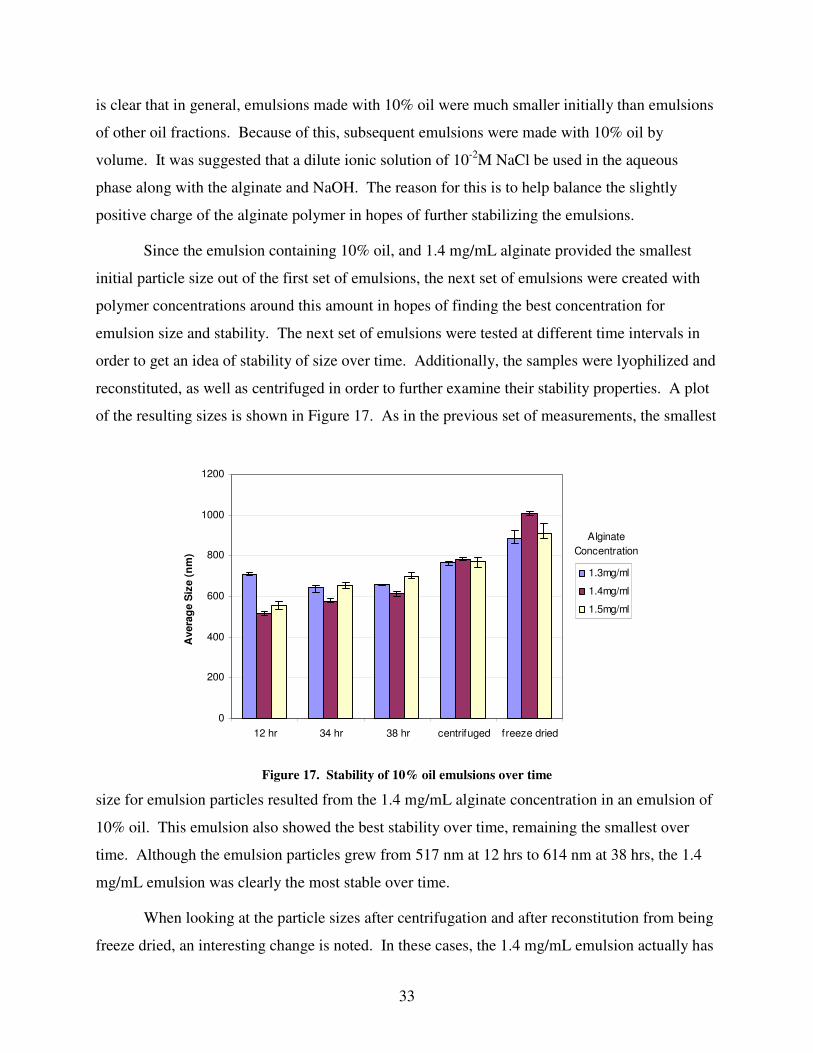
33
is clear that in general, emulsions made with 10% oil were much smaller initially than emulsions
of other oil fractions. Because of this, subsequent emulsions were made with 10% oil by
volume. It was suggested that a dilute ionic solution of 10-2
M NaCl be used in the aqueous
phase along with the alginate and NaOH. The reason for this is to help balance the slightly
positive charge of the alginate polymer in hopes of further stabilizing the emulsions.
Since the emulsion containing 10% oil, and 1.4 mg/mL alginate provided the smallest
initial particle size out of the first set of emulsions, the next set of emulsions were created with
polymer concentrations around this amount in hopes of finding the best concentration for
emulsion size and stability. The next set of emulsions were tested at different time intervals in
order to get an idea of stability of size over time. Additionally, the samples were lyophilized and
reconstituted, as well as centrifuged in order to further examine their stability properties. A plot
of the resulting sizes is shown in Figure 17. As in the previous set of measurements, the smallest
size for emulsion particles resulted from the 1.4 mg/mL alginate concentration in an emulsion of
10% oil. This emulsion also showed the best stability over time, remaining the smallest over
time. Although the emulsion particles grew from 517 nm at 12 hrs to 614 nm at 38 hrs, the 1.4
mg/mL emulsion was clearly the most stable over time.
When looking at the particle sizes after centrifugation and after reconstitution from being
freeze dried, an interesting change is noted. In these cases, the 1.4 mg/mL emulsion actually has
0
200
400
600
800
1000
1200
12 hr 34 hr 38 hr centrifuged freeze dried
Avera
ge S
ize (
nm
)
1.3mg/ml
1.4mg/ml
1.5mg/ml
Alginate
Concentration
Figure 17. Stability of 10% oil emulsions over time
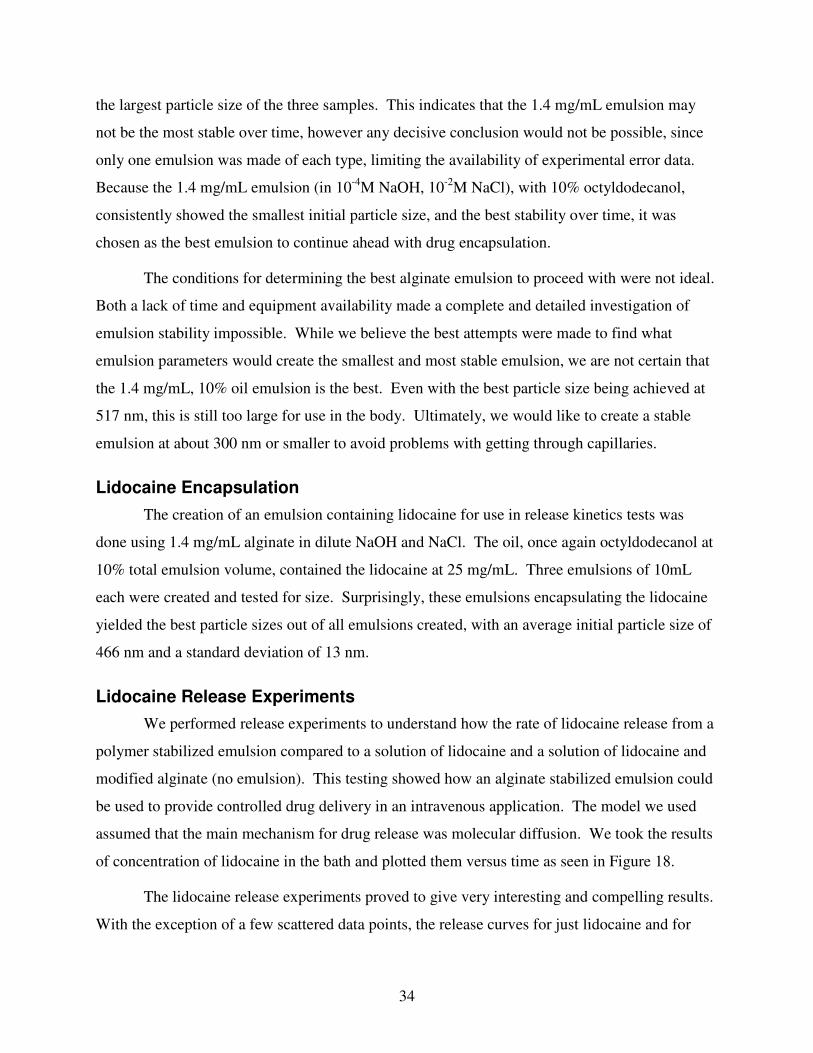
34
the largest particle size of the three samples. This indicates that the 1.4 mg/mL emulsion may
not be the most stable over time, however any decisive conclusion would not be possible, since
only one emulsion was made of each type, limiting the availability of experimental error data.
Because the 1.4 mg/mL emulsion (in 10-4
M NaOH, 10-2
M NaCl), with 10% octyldodecanol,
consistently showed the smallest initial particle size, and the best stability over time, it was
chosen as the best emulsion to continue ahead with drug encapsulation.
The conditions for determining the best alginate emulsion to proceed with were not ideal.
Both a lack of time and equipment availability made a complete and detailed investigation of
emulsion stability impossible. While we believe the best attempts were made to find what
emulsion parameters would create the smallest and most stable emulsion, we are not certain that
the 1.4 mg/mL, 10% oil emulsion is the best. Even with the best particle size being achieved at
517 nm, this is still too large for use in the body. Ultimately, we would like to create a stable
emulsion at about 300 nm or smaller to avoid problems with getting through capillaries.
Lidocaine Encapsulation
The creation of an emulsion containing lidocaine for use in release kinetics tests was
done using 1.4 mg/mL alginate in dilute NaOH and NaCl. The oil, once again octyldodecanol at
10% total emulsion volume, contained the lidocaine at 25 mg/mL. Three emulsions of 10mL
each were created and tested for size. Surprisingly, these emulsions encapsulating the lidocaine
yielded the best particle sizes out of all emulsions created, with an average initial particle size of
466 nm and a standard deviation of 13 nm.
Lidocaine Release Experiments
We performed release experiments to understand how the rate of lidocaine release from a
polymer stabilized emulsion compared to a solution of lidocaine and a solution of lidocaine and
modified alginate (no emulsion). This testing showed how an alginate stabilized emulsion could
be used to provide controlled drug delivery in an intravenous application. The model we used
assumed that the main mechanism for drug release was molecular diffusion. We took the results
of concentration of lidocaine in the bath and plotted them versus time as seen in Figure 18.
The lidocaine release experiments proved to give very interesting and compelling results.
With the exception of a few scattered data points, the release curves for just lidocaine and for
35
lidocaine and alginate line up almost exactly. This is as expected, since the alginate is not
encapsulating or in any way inhibiting or controlling the release of the lidocaine. This also
indicates that the alginate is not escaping from the dialysis bag and influencing the UV
absorbance reading.
The release kinetics for the alginate emulsion follows exactly the predicted trend. There
is a quick initial increase, corresponding closely with the plain lidocaine and the lidocaine and
alginate experiments. This is due to any unencapsulated lidocaine that is free in the aqueous
phase of the emulsion, which is expected due to an equilibrium distribution of lidocaine between
the oil and aqueous phase that is reached prior to emulsification. After approximately 50
minutes however, there is a noticeable change in the release kinetics for the emulsion. At this
point the release of lidocaine is nearly constant, indicated by the linear trend in the concentration
over time.
These results indicate that the alginate stabilized emulsion is quite effective in controlling
the release of lidocaine when compared to free lidocaine which is simply diffusion controlled
and follows first order release kinetics. There are a number of things to consider, however, when
look at these results. First of all, only one trial was performed for each case, meaning that
0.00
0.02
0.04
0.06
0.08
0.10
0.12
0.14
0.16
0 100 200 300 400 500
Time (min)
Co
ncen
rati
on
(m
g/m
L)
Lidocaine
Lidocaine & Alginate
Alginate Emulsion
Figure 18. Lidocaine release kinetics comparison: Lidocaine, Lidocaine and Alginate, and
Alginate Emulsion
36
information pertaining to experimental error is unavailable. Time restraints and equipment
availability became an issue and prevented further trials to confirm these results. Second, it
would have been better to continue the data collection for a longer period of time; however, the
use of a dilute NaOH solution for the bath prevented this. Maintaining a pH of 10 over the
course of the experiments proved to be difficult because of the number of times the experiment
needed to be uncovered for the removal of samples, which allowed the pH to drop slightly over
the day. The sensitivity of lidocaine to pH made it impossible to obtain accurate UV spectra for
the lidocaine as the pH dropped.
37
Conclusions and Recommendations
The objective of this study was to investigate the use of modified alginate as a surfactant
for oil in water emulsions. Our main goals were to synthesize some hydrophobically modified
alginate by fixing C12 chains to the alginate backbone, and then to use that modified alginate to
study its effect on the stability and size of emulsions as well as its impact on the release lidocaine
from those emulsions. The modified alginate was successfully synthesized and a rate of fixation
of C12 chains of 5.3% was achieved. We also performed several tests to determine the purity of
various oils, and then found the partition coefficients for lidocaine in those oils versus the
aqueous phase of dilute NaOH. It was determined that not only was octyldodecanol the cleanest
oil to start with, but it also had by far the highest partition coefficient for lidocaine with a Kp of
62 ± 3.
Once octyldodecanol was chosen as the best oil, a series of experiments were conducted
to find the ideal parameters for emulsion formation with modified alginate. Things to keep in
mind were average particle size, as well as emulsion stability. Emulsion stability was tested by
making size measurements over time as well as by centrifuging and lyophilizing then
reconstituting samples of the emulsions. Results for stability were not conclusive, however it
was determined that emulsions of 10% octyldodecanol by volume, and 1.4 mg/ml modified
alginate in the aqueous phase of 10-4
M NaOH and 10-2
M NaCl, provided the best stability over
time as well as the smallest average particle sizes. When 25 mg/mL lidocaine was encapsulated
in the oil, the resulting emulsions had very consistent size results, forming emulsions with an
average size of 466 nm.
The lidocaine release tests were the most promising results obtained, yielding exactly
what was desired from the alginate stabilized emulsion. After an initial quick release of
lidocaine, the emulsion released lidocaine at relatively constant rate. The trials in which
lidocaine was not contained in an emulsion resulted in a quick initial release of the drug which
soon leveled off, indicative of first order release kinetics.
While the results obtained show that modified alginate does have potential as a candidate
for stabilizing emulsions for controlled drug release, it should be noted that further studies need
to be performed with the alginate. A significant time restraint, as well as the unavailability of
equipment when needed considerably limited the number of experiments that we were able to
38
perform. Some recommendations include performing a more in-depth investigation into the
optimum parameters for creating modified alginate emulsions. With the right combination of
factors, smaller and more stable emulsions can probably be created. In addition, the lidocaine
release tests should be duplicated, in order to confirm our findings. It should be noted, however
that a means of stabilizing the pH of the NaOH solution should be considered, as the UV
absorbance of lidocaine is very dependant on pH.
39
Bibliography
Anderson, I.L, Skipnes, O., Smisrod, O., Ostgaard, K., Hemmer, P.C., Some Biological
Functions of Matrix Components in Benthic Algae in Relation to Their Chemistry and the
Composition of Seawater, ACS Sym. Ser. 48 (1997) 361-381.
Badwan, A.A., Abumalooh, A., Sallam, E., Abukalaf, A., Jawan, O., A Sustained Release Drug
Delivery System Using Calcium Alginate Beads, Drug Dev. Ind. Phard. 11 (1985)
Bhakoo, M., Woerly, S., Duncan, R., Release of Antibiotics and Antitumor Agents From
Alginate and Gellan Gum Gels, Proc. Int. Symp. Control. Release Bioact. Mater. 18 (1991) 441-
442.
Bibette, J., Roux, D., Pouligny, B. Creaming of Emulsions: The Role of Depletion Forces
Induced by Surfactants J. of Physics II France 2; (1992) 401-424
Blijdenstein, T.B.J., Zoet, F.D., van Vliet, T., van der Linden, E., van Aken, G. A. Dextran-
Induced Depletion Flocculation in Oil-in-Water Emulsions in the Presence of Sucrose. J. of Food
Hydrocolloids 18; (2004) 857-863
Blaine, M.G., Experimental Observations On Absorbable Algiante Products in Surgery, Ann.
Surg. 125 (1947) 102-114.
Bodemeier, R., Chen, H., Paeratakul, O., A Novel Appraoch to The Oral Delivery of Mocro- or
Nanoparticles, Pharm. Res. 6 (1989) 413-417.
Bourgault, A. J., Regan, M. J., Modified Dextran Polymers for Drug Delivery. MQP, Worcester
Polytechnic Institute, (2006).
Brannon-Peppas, L. Polymers in Controlled Drug Delivery. Biomaterials. Medical Device Link.
(1997). http://www.devicelink.com/mpb/archive/97/11/003.html
Bungenberg de Jong, M.G., Reversible Systems. In. G.R. Kruyt (Ed), Colloid Science, Vol. II,
Elsevier, New York, 1949, pp. 335-432.
Champan, V.J., Chapman, D.J., Seaweeds and Their Uses, Chapman and Hall, New York, 1980,
Chapter 6.
Chen, J., Chu, L., Shiao, M., Ray-Sea Hsu, B., Fu, S., Microencapsulation of Islets in PEG-
Amine Modified Alginate Poly(L-Lysine)-Alginate Microcapsules for Constructing Bioartificial
Pancreas, Journal of Fermentation and Bioengineering, Vol. 86, no.2 (1998) 185-190.
Chickering, D.E., Mathiowitz, E., Bioadhesive Microspheres: A Novel Electro-Based Method to
Study Adhesive Interactions Between Individual Microspheres and Intestinal Mucosa, J. Control.
Release 34 (1995) 251-261.
40
Christensen, K.L., Pedersen, G.P., Kristensen, H.G. Preparation of Redispersable Dry Emulsions
by Spray-Drying J. of Pharmaceutical Sciences 212; (2001) 187-194
Clark, A.H., Ross-Murphy, S.B., Structural and Mechanical Properties of Biopolymer Gels, Adv.
Polym. Sci. 83 (1987) 57-192.
Correia, R.C., McEleaney, K.S., Pinzon, P.A., Dextran C6 As Surfacant For Oil In Water
Emulsions. MQP, Worcester Polytechnic Institute (2005)
Daly, M.M., Knorr, D., Chitosan-alginate Complex Coacertive Capsules: Effects of Calcium,
Plasticizers, and Polyelectrolytes on Mechanical Stability, Biotech. Prog. 4 (1998) 76-81.
Dollo, G., Le Corre, P., Chevanne, F., Le Verge, R.,. Bupivacaine Containing Dry Emulsion Can
Prolong Epidural Anesthetic Effects in Rabbits. European Journal of Pharmaceutical Sciences 22
(2004) 63-70.
Durand, A., Marie, E., Rotureau, E., Léonard, M., Dellacherie, E., Amphiphilic Polysaccharides:
Useful Tools for the Preparation of Nanoparticles with Controlled Surface Characteristics.
Langmuir 20 (2004) 6956-6963.
Eiselt, P., Yeh, J., Latvala, R.K., Shea, L.D., Mooney, D.J., Porous Carriers for Biomedical
Applications Based on Alginate Hydrogels. Biomaterials 21 (2000) 1921-1927.
Elquin, Y.M., Encapsulation of Urease Enzyme in Xanthanalginate Spheres, Biomaterials 18
(1995) 1157-1161.
Gacesa, P., Alginates, Carbohydr. Polym. 8 (1998) 161-182.
Gray, C.J., Dowsett, J.,Retention of Insulin in Alginate Gel Beads, Biotech. Bioenf. 31 (1988)
607-612.
Gombotz, W.R., Wee, S.F., Protein Release From Algiante Matrices, Adv. Drug. Reviews 31
(1998) 267-285.
Haug, A., Larsen, B., Smidsrod, O., Studies on the Sequence of Uronic Acid residues in Alginic
Acid, Acta Chem. Scand. 21 (1967) 691-704
Huguet, M.L., Neufeld, R.J., Dellacherie, E., Calcium-Alginate Beads Coated With Polycationic
Polymers: comparison of Chitosan and DEAE-Dextran. Process Biochemistry Vol. 31, No, 4.
(1996) 347-353.
Igari, Y., Kibat, P.G., Langer, R., Optimization of a Microencapsulated Liposome System for
Enzymatically Controlled Release of Macromolecules. J. Control. Release 14 (1990) 263-267.
41
Imbert, P., Satdler, V.M., Dellacherie, E. Phenoxy-Substituted Dextrans as Emulsifying Agent:
Role of the Substitution Ratio on O/W Emulsion Stability and Interfacial Activity J. of Colloids
and Surfaces A: Physicochem. Engineering Aspects 211; (2002) 157-164
Jabari, E., Wisniewski, N., Peppas, A., Evidence of Mucoadhesion by Chain Interpretation at a
Poly(acrylic acid)/mucin Interface Using ATR-FTIR Spectroscopy, J. Control. Release 26 (1993)
99-108.
Kwok, K.K., Groves, M.J., Burgess, D.J., Production of 5-15µm Diameter Alginate-polylisine
Microcapsules by an Air Atomization Technique, Pharm. Res. 8 (1991) 341-344.
Kulkarni, A.R., Soppimath, K.S., Aminabhavi, T.M., Dave, A.M., Mehta, M.H., Gluteraldehyde
Crosslinked Sodium Alginate Beads Containing Liquid Pesticide for Soil Application. Journal of
Controlled Release 63 (2000) 97-105.
Léonard, M., Rastello de Boissen, M., Hubert, P., Dalençon, F., Dellacherie, E., Hydrophobically
modified Alginate Hydrogels as Protein Carriers With Specific Controlled Release Properties. J.
Controlled Release 98(3) (2004) 395-405
Léonard, M., Rastello de Boissen, M., Hubert, P., Dellacherie, E., Production of Microspheres
Based on Hydrophobically Associating Alginate Derivatives by Dispersion/Gelation in
Aquesous Sodium Chloride Solutions. J. Biomedical Materials Research. 68A(2). (1991) 335-
343
Liu, L.S., Liu, S.Q., Ng, S.Y., Froix, M., Ohno, T., Heller, J., Controlled Release of Interleukin-2
for Tumor Immunotherapy Using Alginate/Chitosan Porous Microspheres, J. Control. Release 43
(1997) 65-74.
Martinsen, A., Skjak-Braek, G., Smidsrod, O., Zanetti, F., Paoletti, S., Comparison of Different
Methods for Determination of Molecular Weight and Molecular Weight Distribution of
Alginates, Carbohydr. Polym. 15 (1991) 171-193.
Mestecky, J., The Common Mucosal Immune System and Current Strategies for Induction of
Immune Responses in External Secretions, J. Clin. Immunol. 7 (1987) 265-276.
Mestecky, J., McGhee, J.R., Immunoglobulin A (IgA): Molecular and Cellular Interactions
Involved in IgA Biosynthesis and Immune Response, Adv. Immunol. 40 (1987) 153-189.
Murnper, R.J., Hoffman, A.S., Puolakkainen, P., Bouchard, L.S., Gombotz, W.R., Calcium-
Alginate Beads For The Oral Delivery of Transforming Growth Factor-β1: Stabilization of TGF-
β1 by The Addition of Polyacrylic Acid Within Acid-Treated Beads, J. Control. Release 30
(1994) 241-251.
Otterlei, M., Ostgaard, K., Skjak-Brack, G., Smidsrod, O., Soon-Shiong, P., Espevik, T.,
Induction of Cytokine Production From Human Monocytes Stimulated With Alginate, J.
Immunother. 10 (1991) 286-291.
42
Rastello de Boissen, M., Léonard, M., Hubert, P., Marchal, P., Stequert, P., Castel, C., Favre, E.,
Dellacherie, E., Physical Alginate Hydrogels Based on Hydrophobic or Dual Hydrophobic/Ionic
Interactions, Bead Formation, Structure and Stability. J. Colloid Interface Science 273(1) (2004)
134-139.
Rees, D.A., Polysaccharide Shapes and Their Interactions – Some Recent Advances, Pure Appl.
Chem. 53 (1981) 1-14.
Rees, D.A., Welsh, E.J., Secondary and Tertiary Structure of Polysaccharides in Solution and
Gels, Angew. Chem. Int. Ed. Engl. 16 (1997) 214-224.
Rotureau, E., Léonard, M., Dellacherie, E., Durand, A., Amphiphilic Derivatives of Dextran:
Adsorption at Air/Water and Oil/Water Interfaces. Journal of Colloid and Interface Science 279
(2004) 68-77.
Rouzes, C., Durand, A., Léonard, M., Dellacherie, E., Surface Activity and Emulsification
Properties of Hydrophobically Modified Dextrans. Journal of Controlled and Interface Science
253 (2002) 217-223.
Rouzes, C., Léonard, M., Durand, A., Dellacherie, E., Influence of Polymeric Surficants on the
Properties of Drug-Loaded PLA Nanospheres. Colloids and Surfaces B: Biointerfaces 32 (2003)
125-135.
Sadtler, V., Imbert, P., Dellacherie, E. Ostwald Ripening of Oil-in-Water Emulsions Stabilized
by Phenoxy-Substituted Dextrans. J. of Colloid and Interface Science 254; (2002) 355-361
Schuh, J., Fanslow, W., Gombotz, W., Wee, S.F., Intransal Localization and Response to
Polycation-Coated Ovaencapsulated Algiante Microbeads, Vet. Pathol. 33(5) (1996) 581.
Segi, N., Yotsuyangi, T., Ikeda, K., Interaction of Calcium Induced Alginate Gel Beads With
Propranolol, Chem. Pharm. Bull. 37 (1989) 3092-3095.
Smidsrod, O., The Relative Extension of Alginates Having Different Chemical Composition,
Carbohyd. Res. 27 (1973) 107-118.
Smidsrod, O., Skjak-Braek, G., Alginate As Immobilization Matrix for Cells, TIBTECH 8
(1990) 71-78.
Smith, T.J., Calcium Algiante Hydrogel As a Matrix For Enteric Delivery of Nucleic Acids,
Biopharm. 4 (1994) 54-55.
Spargo, B.J., Rudolph, A.S., Rollwagen, F.M., Recruitment of Tissue Resident Cells to Hydrogel
Composites: in Vivo Response to Implant Materials, Biomaterials 15 (1994) 853-858.
43
Steenson, L.R., Klaenhammer, T.R., Conjugal Transfer of Plasmid DNA Between Streptococci
Imobilized in Calcium Alginate Gel Beads. Applied and Environmental Microbiology. (1987)
898-900.
Sutherland, I.W., Alginates, in: D. Byrom (Ed.), Biomaterials; Novel Materials from Biological
Sources, Stockton, New York, 1991, pp. 309-331.
Tadros, T.F., Vandamme, A., Booten, K., Levecke, B., Stevens, C.V. Stabilisation of emulsions
using hydrophobically modified inulin (polyfructose). J. of Colloids and Surfaces A:
Physicochem. Engineering Aspects 250; (2004) 133-140
Tanaka, H., Matsumara, M., Veliky, I.A., Diffusion Characteristics of Substrates in Ca-Alginate
Gel Beads, Biotech. Bioeng. 26 (1984) 53-58.
Vandenberg, G.W., Drolet, C., Scott, S.L., de la Noüe, J., Factors Affecting Protein Release
From Alginate-Chitosan Coacertive Microcapsules During Production and Gastric/Intestinal
Simulation. Journal of Controlled Release 77 (2001) 297-307.
Wan, L.S., Heng, P.W., Chan, L.W., Drug Encapsulation in Alginate Microspheres by
Emulsification, J. Microencapsulation 9 (1992) 309-316.
Zimmermann, U., Klock, G., Grohn, P., Jangaard, N.O., Wilkinson, C.K., Cell Encapsulation in
Alginate: Elimination of Foreign Body Reaction and Microcapsule Volume Minimization,
Monsanto Co. Newsletter, 1995.
http://www.kjemi.uio.no/Polymerkjemi/Research/alginate.jpg
44
Appendix A: Equipment and Experimental Procedure
A.1. High Performance Particle Sizer (HPPS)
Malvern Instruments Ltd., United Kingdom
Microsoft Windows 2000 software
Software Set Up
Before the emulsions were run in the HPPS machine it was necessary to create a Standard
Operating Procedure (SOP) to establish a set of parameters for emulsion investigation. It is
important to use an SOP to ensure that all emulsions are measured in the same way without
having to repeatedly set up the procedure.
To create and SOP, open the HPPS program called Dispersion and select New SOP in the
Configure menu. The Size measurement type was then chosen since it also measures Protein
Melting Point, Zeta Potential, Molecular Weight of the sample and trend. After selecting the type
of measurement a sample name must be selected, and general notes can also be included. It is
important to check on the box that says Show this page when the SOP is started to allow
changes in the name of the emulsion and modification of any comments made with previous
samples.
In the next screen the type of cell or cuvette that will be used with this equipment must be
specified since the accuracy of the measurements can vary significantly depending on the
material that the cell is made of. During this project a DTS0012-Disposable sizing cuvette was
chosen. The following table summarizes the properties of this type of cell.
Table 1: Choosing the correct (Size measurements) adapted from Zeta Nano Series User
Manual, p 4.4
Disposable Polystyrene (DTS0012)
Typical Solvent Water, Water/Ethanol
45
Optical Quality Good to very good
Minimum Sample Volume 1mL
Advantages Low cost
Single use disposable (No cleaning
necessary)
Disadvantages Not resistant to organic solvents
Unsuitable for use at high
temperatures (Above 50ºC)
Once this type of cell is chosen the software determines the conditions of measurement
for that cell type, i.e. cell position.
After clicking on Next, the sample settings have to be specified. During this investigation
only sample settings for size determination were set. The first step is to determine the material
and dispersant properties. In order to do so, the Dispersant tab must be selected which provides
us with a list of all the possible dispersants for that type of cell, such as decane, toluene and
water among others. Water was selected as our dispersant material for this project.
The next step was to set up the measurement properties. A temperature of 25ºC was
specified to keep our sample at room temperature during. The type of measurement duration was
set to Automatic, allowing the equipment to perform the same test with all the samples and
avoid variance in the measurement parameters. By setting the measurement duration to
automatic the measurements were divided into a number of runs of at least 10 seconds in length.
For accuracy of results, the number of measurements was set to 3 which this allowed us to
confirm how well the solution was mixed after being diluted.
Sample Measurements
Once the SOP file has been created and all the measurement properties for particle size
have been set the HPPS was ready to take measurements. After turning the HPPS on it was
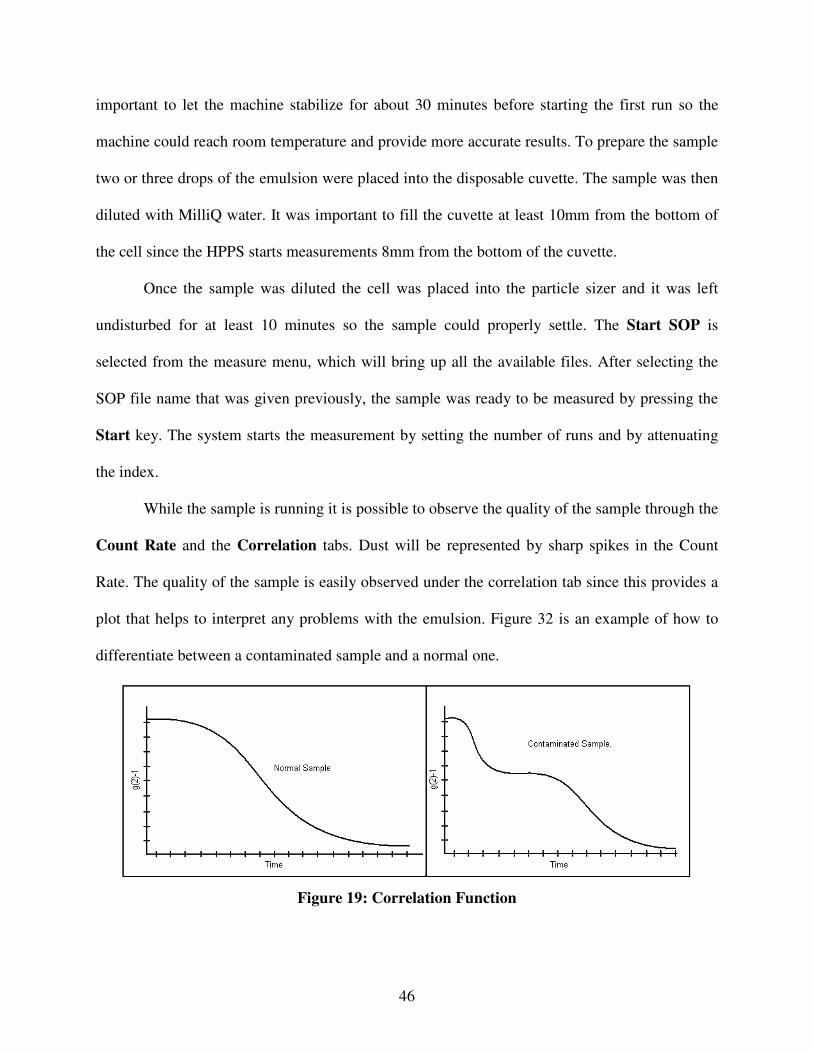
46
important to let the machine stabilize for about 30 minutes before starting the first run so the
machine could reach room temperature and provide more accurate results. To prepare the sample
two or three drops of the emulsion were placed into the disposable cuvette. The sample was then
diluted with MilliQ water. It was important to fill the cuvette at least 10mm from the bottom of
the cell since the HPPS starts measurements 8mm from the bottom of the cuvette.
Once the sample was diluted the cell was placed into the particle sizer and it was left
undisturbed for at least 10 minutes so the sample could properly settle. The Start SOP is
selected from the measure menu, which will bring up all the available files. After selecting the
SOP file name that was given previously, the sample was ready to be measured by pressing the
Start key. The system starts the measurement by setting the number of runs and by attenuating
the index.
While the sample is running it is possible to observe the quality of the sample through the
Count Rate and the Correlation tabs. Dust will be represented by sharp spikes in the Count
Rate. The quality of the sample is easily observed under the correlation tab since this provides a
plot that helps to interpret any problems with the emulsion. Figure 32 is an example of how to
differentiate between a contaminated sample and a normal one.
Figure 19: Correlation Function
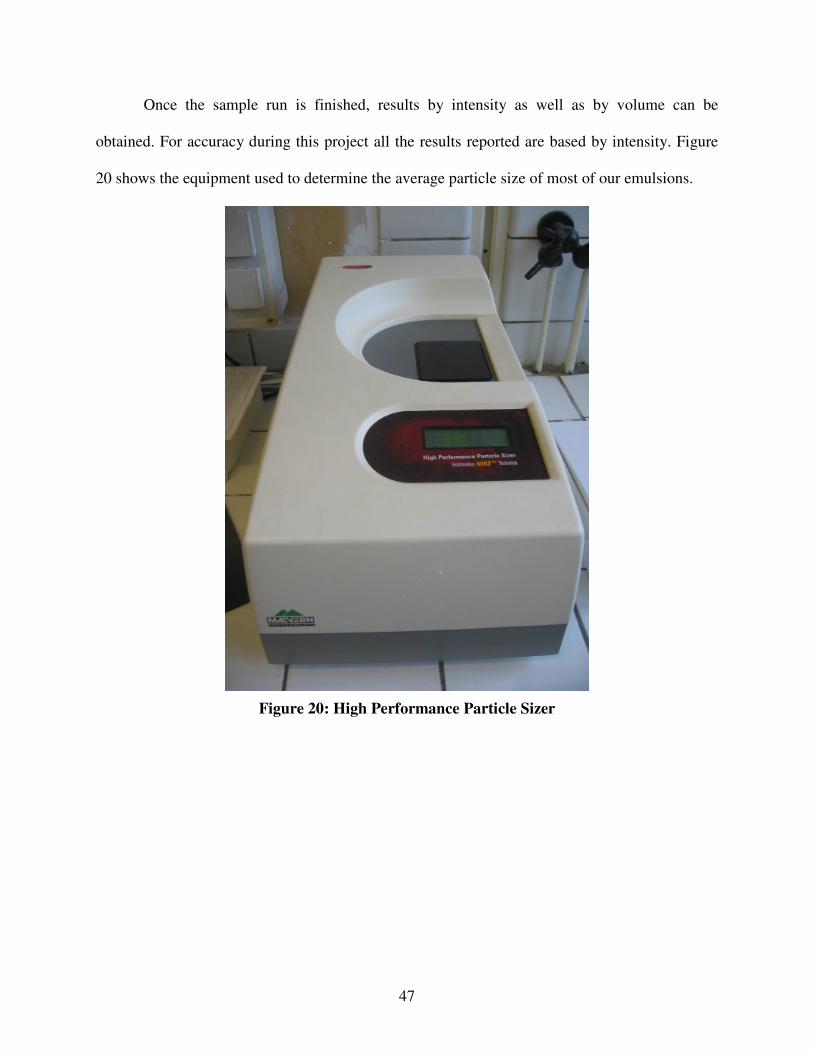
47
Once the sample run is finished, results by intensity as well as by volume can be
obtained. For accuracy during this project all the results reported are based by intensity. Figure
20 shows the equipment used to determine the average particle size of most of our emulsions.
Figure 20: High Performance Particle Sizer
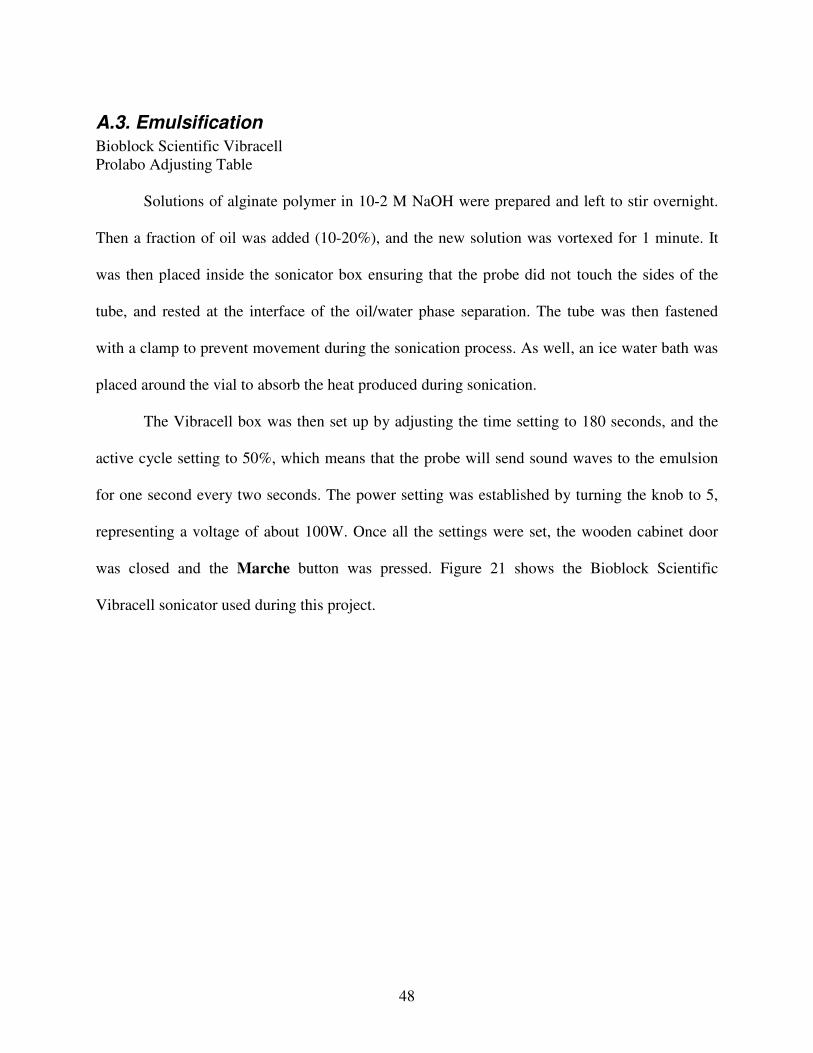
48
A.3. Emulsification
Bioblock Scientific Vibracell
Prolabo Adjusting Table
Solutions of alginate polymer in 10-2 M NaOH were prepared and left to stir overnight.
Then a fraction of oil was added (10-20%), and the new solution was vortexed for 1 minute. It
was then placed inside the sonicator box ensuring that the probe did not touch the sides of the
tube, and rested at the interface of the oil/water phase separation. The tube was then fastened
with a clamp to prevent movement during the sonication process. As well, an ice water bath was
placed around the vial to absorb the heat produced during sonication.
The Vibracell box was then set up by adjusting the time setting to 180 seconds, and the
active cycle setting to 50%, which means that the probe will send sound waves to the emulsion
for one second every two seconds. The power setting was established by turning the knob to 5,
representing a voltage of about 100W. Once all the settings were set, the wooden cabinet door
was closed and the Marche button was pressed. Figure 21 shows the Bioblock Scientific
Vibracell sonicator used during this project.
49
Figure 21 Sonication Box
50
A.4. Centrifugation
Apparatus:
Jouan GR 20 22
The centrifuge is used to separate the desired product from the undesired solvent. The
preparation of the centrifuge tubes is very important. There are six slots for the centrifuge tubes
that were used. Opposite sides of the rotor must be equally balanced. In this specific centrifuge,
the weight difference on opposite sides of the rotor must be within 50 mg of each other. If this
weight difference limit is not obeyed, the machine can break.
Place the centrifuge tubes in the rotor with the equal weight centrifuge tubes on the
opposite side of the rotor. Then with the hand wrench lightly secure the lid. Excessive force is
not necessary. Then close the hood of the centrifuge. Next set up the program desired.
Programming:
• Turn on the centrifuge with the switch located on the right side of the machine
• Press 'Prog'
• Output: "Numero Programme: _ _"
• Press 11 then enter
• Output: "Prog Numero 11 Exist"
• Press enter
• Output: "Rayon: _97mm"
• Press enter
• Output: "Duree/Int? (1/0): 1"
• Press enter
• Output: "Duree: _ _h_ _min"
• Enter desired length to centrifuge then press enter
51
• Output: "Temperature: 25 C"
• Enter desired temperature then press enter
• Output: "Delta Temp: 0 C"
• Press enter
• Output: "Acceleration: _"
• Enter desired acceleration (1-9) then press enter
• Output: "Frienage: _"
• Enter desired frienage (1-9) then press enter
• Output: "Vit/NBG? (1/0): 1"
• Press enter
• Output: "Vitesse: _ _ _ _ _ Tr/mn"
• Enter desired revolutions per minute (up to 18000) then press enter
• Output: "Ecrire Sous Le No: 11"
• Press enter
• Press start to begin program 11
Once the program has run through completion and the pressure inside the chamber returns to
atmospheric pressure, the hood can be opened using the switch on the right side of the machine.
Next remove the lid using the hand wrench. The centrifuge tubes can then be removed carefully
and with as little agitation as possible. It is even suggested to extract the aqueous face while the
tubes are at the centrifuge to stop the agitation created when walking with the samples. Figure 22
shows the centrifuge apparatus used during this investigation.
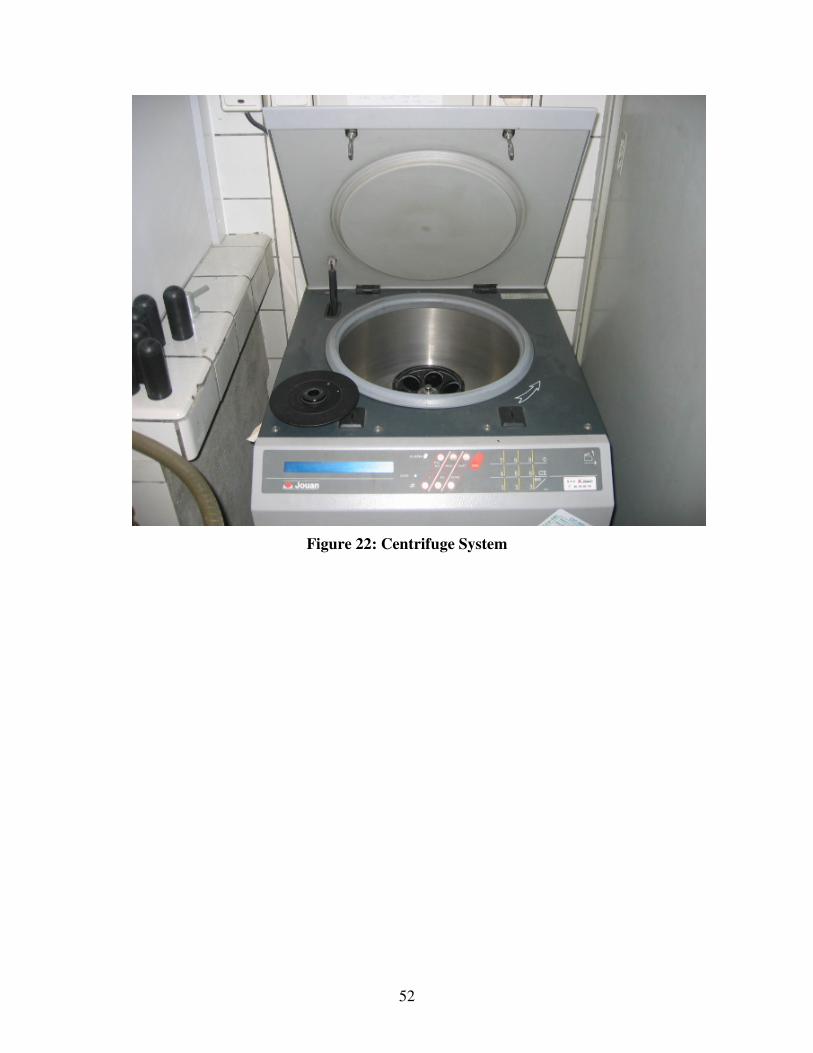
52
Figure 22: Centrifuge System
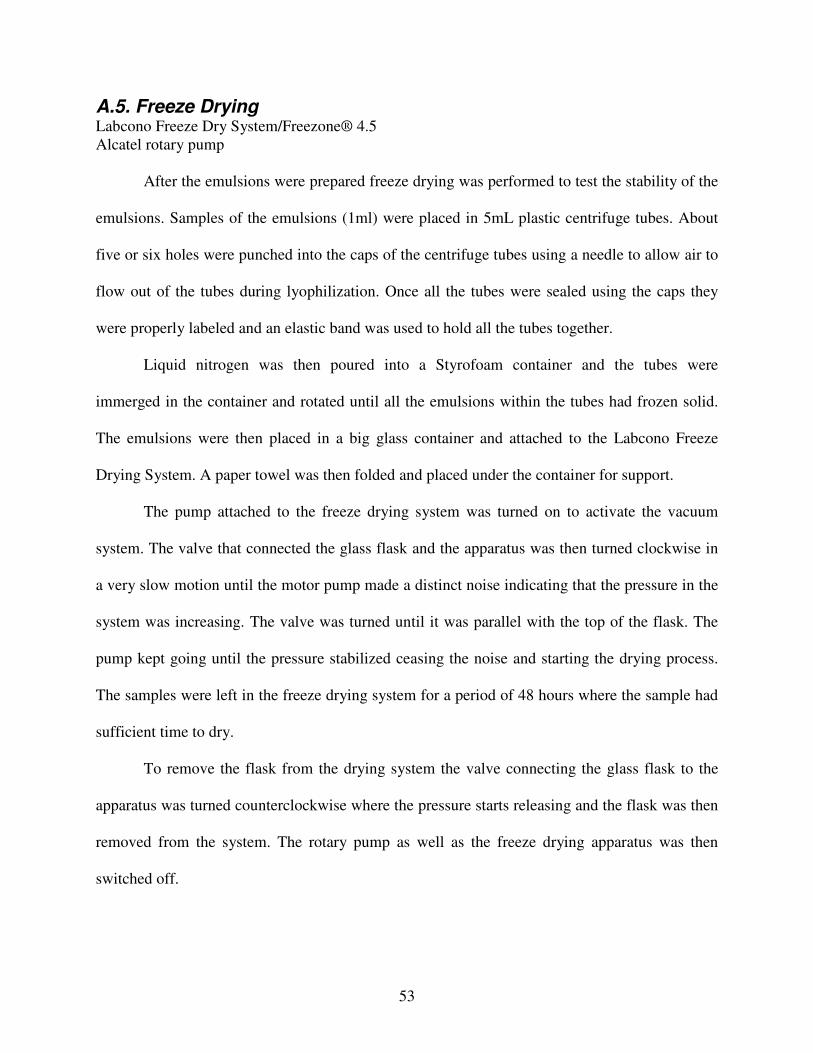
53
A.5. Freeze Drying Labcono Freeze Dry System/Freezone® 4.5
Alcatel rotary pump
After the emulsions were prepared freeze drying was performed to test the stability of the
emulsions. Samples of the emulsions (1ml) were placed in 5mL plastic centrifuge tubes. About
five or six holes were punched into the caps of the centrifuge tubes using a needle to allow air to
flow out of the tubes during lyophilization. Once all the tubes were sealed using the caps they
were properly labeled and an elastic band was used to hold all the tubes together.
Liquid nitrogen was then poured into a Styrofoam container and the tubes were
immerged in the container and rotated until all the emulsions within the tubes had frozen solid.
The emulsions were then placed in a big glass container and attached to the Labcono Freeze
Drying System. A paper towel was then folded and placed under the container for support.
The pump attached to the freeze drying system was turned on to activate the vacuum
system. The valve that connected the glass flask and the apparatus was then turned clockwise in
a very slow motion until the motor pump made a distinct noise indicating that the pressure in the
system was increasing. The valve was turned until it was parallel with the top of the flask. The
pump kept going until the pressure stabilized ceasing the noise and starting the drying process.
The samples were left in the freeze drying system for a period of 48 hours where the sample had
sufficient time to dry.
To remove the flask from the drying system the valve connecting the glass flask to the
apparatus was turned counterclockwise where the pressure starts releasing and the flask was then
removed from the system. The rotary pump as well as the freeze drying apparatus was then
switched off.
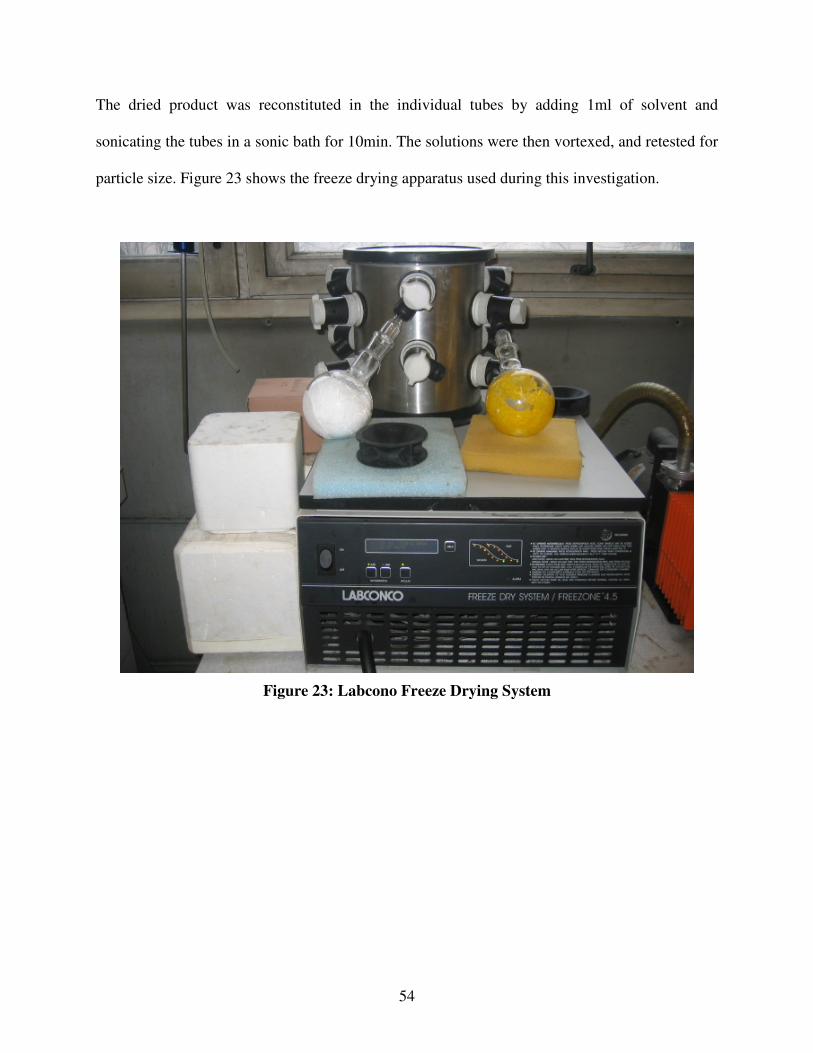
54
The dried product was reconstituted in the individual tubes by adding 1ml of solvent and
sonicating the tubes in a sonic bath for 10min. The solutions were then vortexed, and retested for
particle size. Figure 23 shows the freeze drying apparatus used during this investigation.
Figure 23: Labcono Freeze Drying System
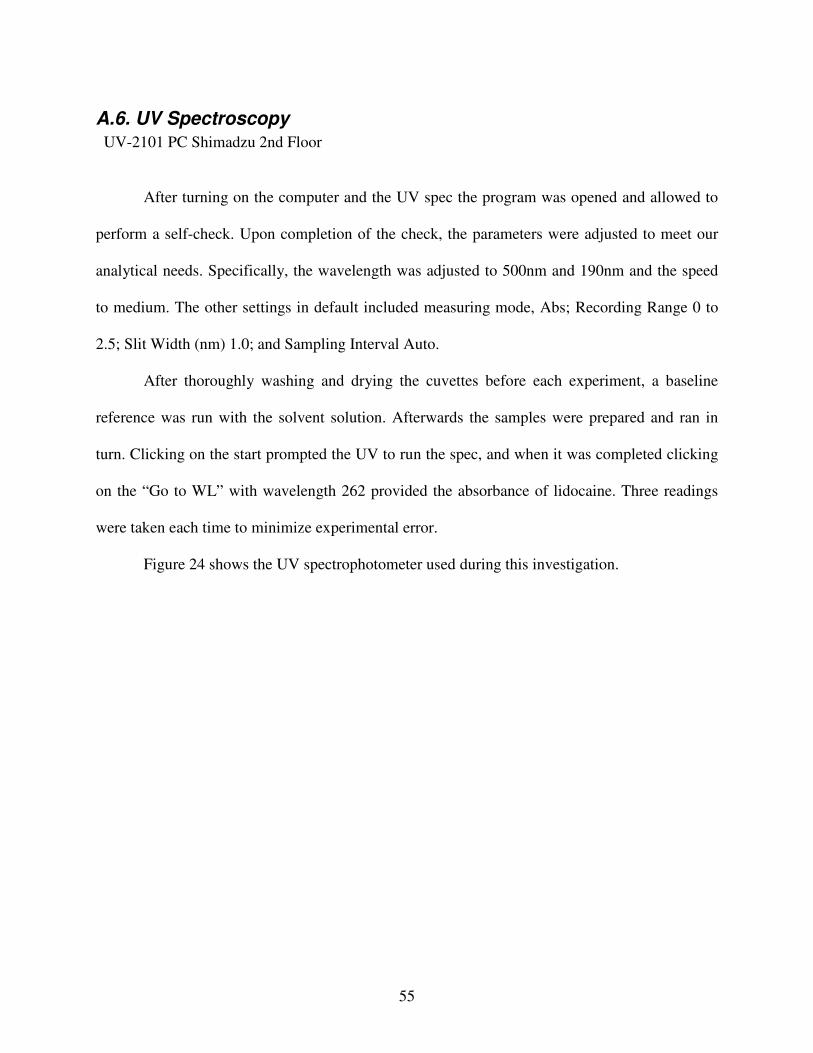
55
A.6. UV Spectroscopy
UV-2101 PC Shimadzu 2nd Floor
After turning on the computer and the UV spec the program was opened and allowed to
perform a self-check. Upon completion of the check, the parameters were adjusted to meet our
analytical needs. Specifically, the wavelength was adjusted to 500nm and 190nm and the speed
to medium. The other settings in default included measuring mode, Abs; Recording Range 0 to
2.5; Slit Width (nm) 1.0; and Sampling Interval Auto.
After thoroughly washing and drying the cuvettes before each experiment, a baseline
reference was run with the solvent solution. Afterwards the samples were prepared and ran in
turn. Clicking on the start prompted the UV to run the spec, and when it was completed clicking
on the “Go to WL” with wavelength 262 provided the absorbance of lidocaine. Three readings
were taken each time to minimize experimental error.
Figure 24 shows the UV spectrophotometer used during this investigation.
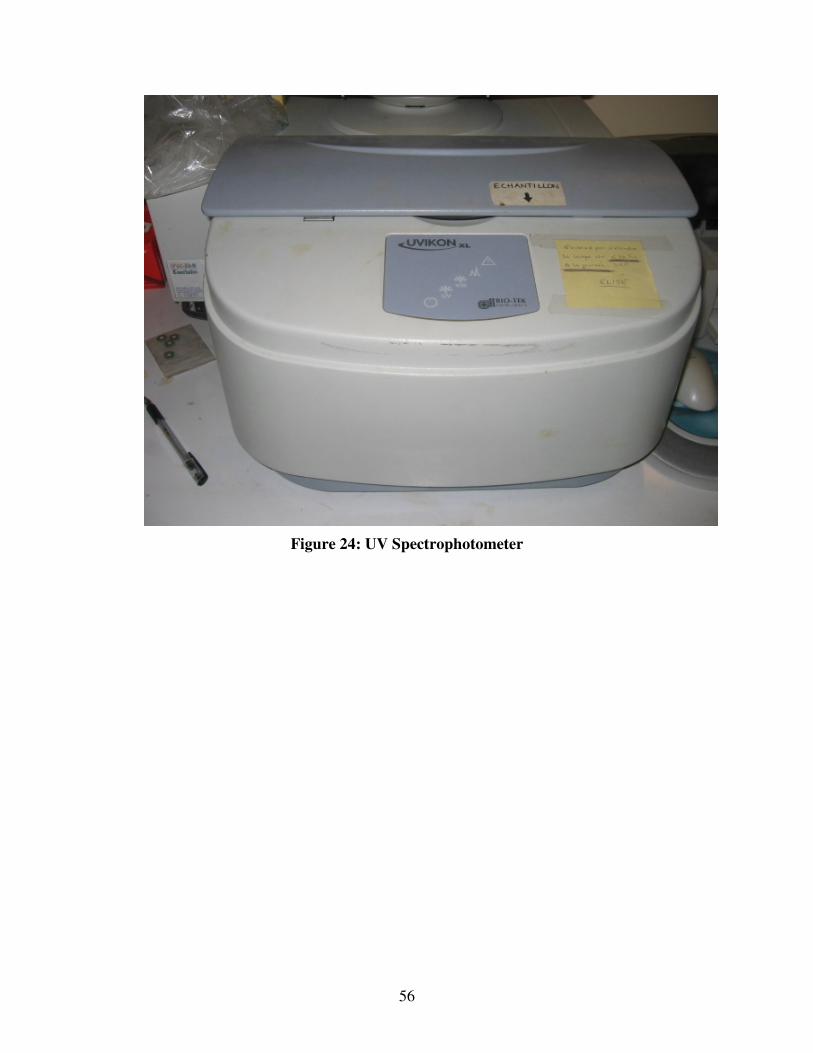
56
Figure 24: UV Spectrophotometer
57
A.7. Dialysis Membrane
The Spectra/Por membrane was used for drug release kinetics testing. In order to use the
membrane one must cut the desired length and place the membrane into a beaker filled with
MilliQ water to properly wash the membrane. The solution surrounding the membrane was
tested for purity with the UV, and replaced until there were no longer impurities coming from the
membrane.
Once clean, a desired about of membrane was cut, one end was tied closed, and the
emulsion solutions were poured into the remaining opening before it was also tied closed. The
membrane was rinsed off at the ends to remove excess emulsions, and then placed directly in the
solution bath for release experiments.
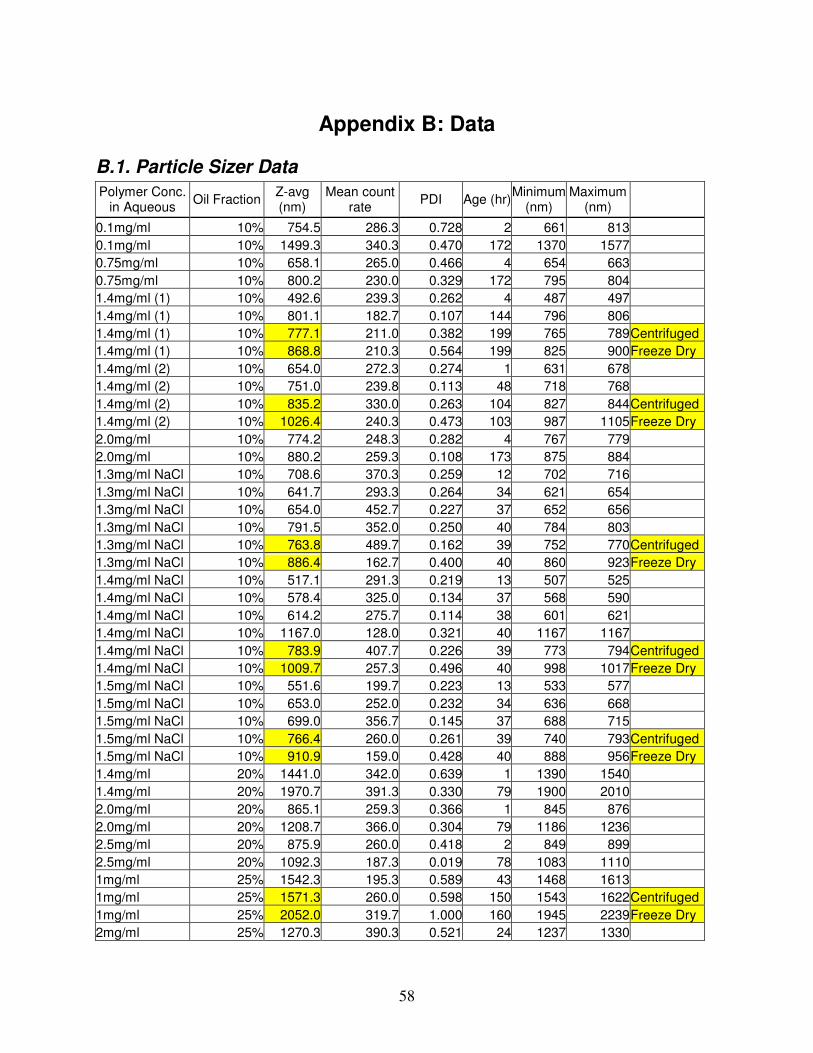
58
Appendix B: Data
B.1. Particle Sizer Data
Polymer Conc. in Aqueous
Oil Fraction Z-avg (nm)
Mean count rate
PDI Age (hr) Minimum
(nm) Maximum
(nm)
0.1mg/ml 10% 754.5 286.3 0.728 2 661 813
0.1mg/ml 10% 1499.3 340.3 0.470 172 1370 1577
0.75mg/ml 10% 658.1 265.0 0.466 4 654 663
0.75mg/ml 10% 800.2 230.0 0.329 172 795 804
1.4mg/ml (1) 10% 492.6 239.3 0.262 4 487 497
1.4mg/ml (1) 10% 801.1 182.7 0.107 144 796 806
1.4mg/ml (1) 10% 777.1 211.0 0.382 199 765 789 Centrifuged
1.4mg/ml (1) 10% 868.8 210.3 0.564 199 825 900 Freeze Dry
1.4mg/ml (2) 10% 654.0 272.3 0.274 1 631 678
1.4mg/ml (2) 10% 751.0 239.8 0.113 48 718 768
1.4mg/ml (2) 10% 835.2 330.0 0.263 104 827 844 Centrifuged
1.4mg/ml (2) 10% 1026.4 240.3 0.473 103 987 1105 Freeze Dry
2.0mg/ml 10% 774.2 248.3 0.282 4 767 779
2.0mg/ml 10% 880.2 259.3 0.108 173 875 884
1.3mg/ml NaCl 10% 708.6 370.3 0.259 12 702 716
1.3mg/ml NaCl 10% 641.7 293.3 0.264 34 621 654
1.3mg/ml NaCl 10% 654.0 452.7 0.227 37 652 656
1.3mg/ml NaCl 10% 791.5 352.0 0.250 40 784 803
1.3mg/ml NaCl 10% 763.8 489.7 0.162 39 752 770 Centrifuged
1.3mg/ml NaCl 10% 886.4 162.7 0.400 40 860 923 Freeze Dry
1.4mg/ml NaCl 10% 517.1 291.3 0.219 13 507 525
1.4mg/ml NaCl 10% 578.4 325.0 0.134 37 568 590
1.4mg/ml NaCl 10% 614.2 275.7 0.114 38 601 621
1.4mg/ml NaCl 10% 1167.0 128.0 0.321 40 1167 1167
1.4mg/ml NaCl 10% 783.9 407.7 0.226 39 773 794 Centrifuged
1.4mg/ml NaCl 10% 1009.7 257.3 0.496 40 998 1017 Freeze Dry
1.5mg/ml NaCl 10% 551.6 199.7 0.223 13 533 577
1.5mg/ml NaCl 10% 653.0 252.0 0.232 34 636 668
1.5mg/ml NaCl 10% 699.0 356.7 0.145 37 688 715
1.5mg/ml NaCl 10% 766.4 260.0 0.261 39 740 793 Centrifuged
1.5mg/ml NaCl 10% 910.9 159.0 0.428 40 888 956 Freeze Dry
1.4mg/ml 20% 1441.0 342.0 0.639 1 1390 1540
1.4mg/ml 20% 1970.7 391.3 0.330 79 1900 2010
2.0mg/ml 20% 865.1 259.3 0.366 1 845 876
2.0mg/ml 20% 1208.7 366.0 0.304 79 1186 1236
2.5mg/ml 20% 875.9 260.0 0.418 2 849 899
2.5mg/ml 20% 1092.3 187.3 0.019 78 1083 1110
1mg/ml 25% 1542.3 195.3 0.589 43 1468 1613
1mg/ml 25% 1571.3 260.0 0.598 150 1543 1622 Centrifuged
1mg/ml 25% 2052.0 319.7 1.000 160 1945 2239 Freeze Dry
2mg/ml 25% 1270.3 390.3 0.521 24 1237 1330
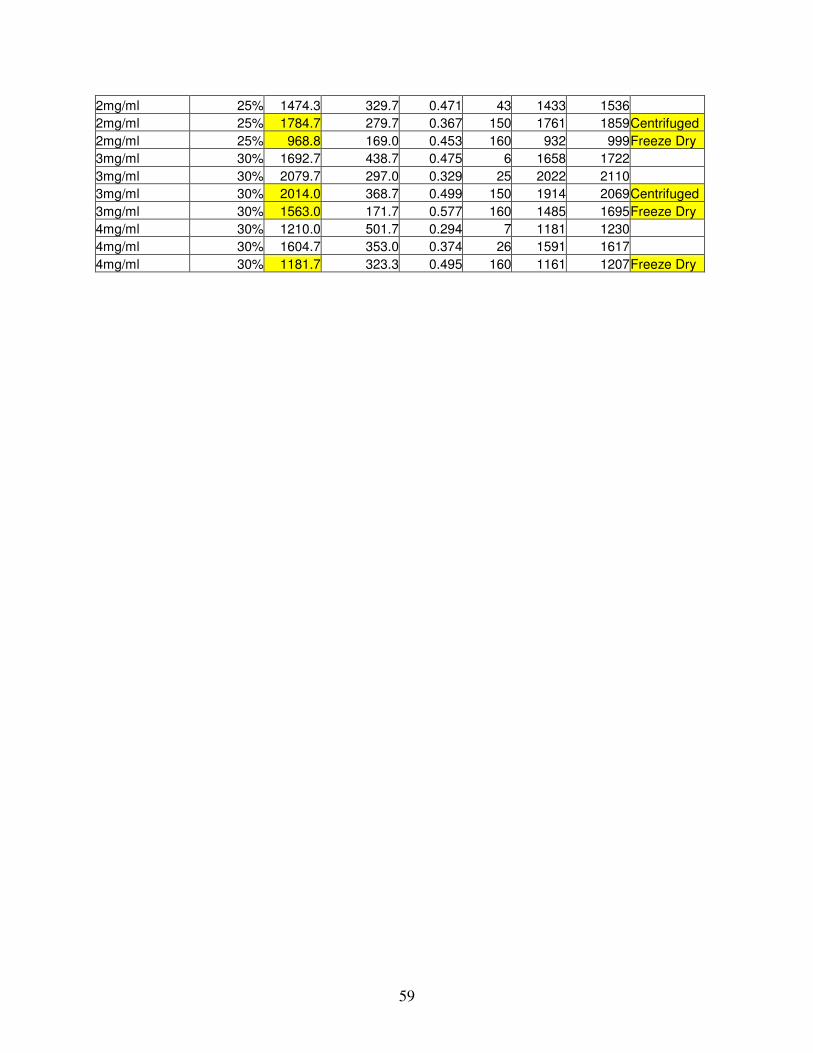
59
2mg/ml 25% 1474.3 329.7 0.471 43 1433 1536
2mg/ml 25% 1784.7 279.7 0.367 150 1761 1859 Centrifuged
2mg/ml 25% 968.8 169.0 0.453 160 932 999 Freeze Dry
3mg/ml 30% 1692.7 438.7 0.475 6 1658 1722
3mg/ml 30% 2079.7 297.0 0.329 25 2022 2110
3mg/ml 30% 2014.0 368.7 0.499 150 1914 2069 Centrifuged
3mg/ml 30% 1563.0 171.7 0.577 160 1485 1695 Freeze Dry
4mg/ml 30% 1210.0 501.7 0.294 7 1181 1230
4mg/ml 30% 1604.7 353.0 0.374 26 1591 1617
4mg/ml 30% 1181.7 323.3 0.495 160 1161 1207 Freeze Dry
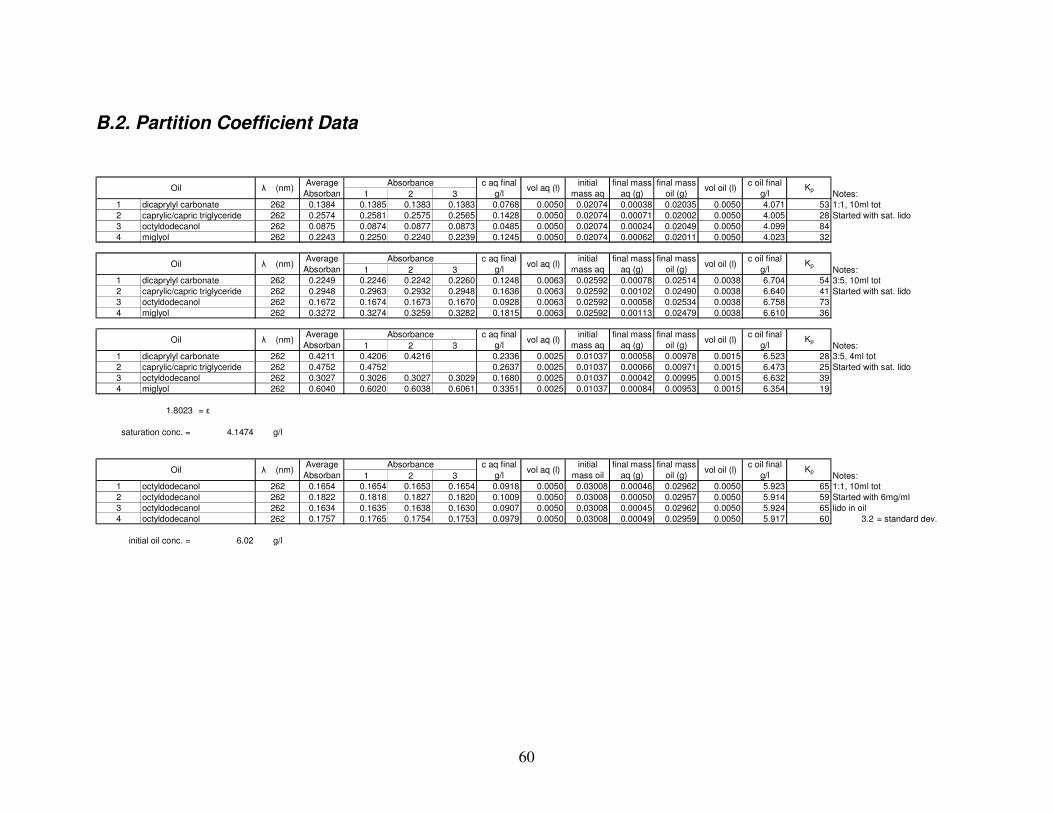
60
B.2. Partition Coefficient Data
1 2 3 Notes:
1 dicaprylyl carbonate 262 0.1384 0.1385 0.1383 0.1383 0.0768 0.0050 0.02074 0.00038 0.02035 0.0050 4.071 53 1:1, 10ml tot
2 caprylic/capric triglyceride 262 0.2574 0.2581 0.2575 0.2565 0.1428 0.0050 0.02074 0.00071 0.02002 0.0050 4.005 28 Started with sat. lido
3 octyldodecanol 262 0.0875 0.0874 0.0877 0.0873 0.0485 0.0050 0.02074 0.00024 0.02049 0.0050 4.099 84
4 miglyol 262 0.2243 0.2250 0.2240 0.2239 0.1245 0.0050 0.02074 0.00062 0.02011 0.0050 4.023 32
1 2 3 Notes:
1 dicaprylyl carbonate 262 0.2249 0.2246 0.2242 0.2260 0.1248 0.0063 0.02592 0.00078 0.02514 0.0038 6.704 54 3:5, 10ml tot
2 caprylic/capric triglyceride 262 0.2948 0.2963 0.2932 0.2948 0.1636 0.0063 0.02592 0.00102 0.02490 0.0038 6.640 41 Started with sat. lido
3 octyldodecanol 262 0.1672 0.1674 0.1673 0.1670 0.0928 0.0063 0.02592 0.00058 0.02534 0.0038 6.758 73
4 miglyol 262 0.3272 0.3274 0.3259 0.3282 0.1815 0.0063 0.02592 0.00113 0.02479 0.0038 6.610 36
1 2 3 Notes:
1 dicaprylyl carbonate 262 0.4211 0.4206 0.4216 0.2336 0.0025 0.01037 0.00058 0.00978 0.0015 6.523 28 3:5, 4ml tot
2 caprylic/capric triglyceride 262 0.4752 0.4752 0.2637 0.0025 0.01037 0.00066 0.00971 0.0015 6.473 25 Started with sat. lido
3 octyldodecanol 262 0.3027 0.3026 0.3027 0.3029 0.1680 0.0025 0.01037 0.00042 0.00995 0.0015 6.632 39
4 miglyol 262 0.6040 0.6020 0.6038 0.6061 0.3351 0.0025 0.01037 0.00084 0.00953 0.0015 6.354 19
1.8023 = ε
saturation conc. = 4.1474 g/l
1 2 3 Notes:
1 octyldodecanol 262 0.1654 0.1654 0.1653 0.1654 0.0918 0.0050 0.03008 0.00046 0.02962 0.0050 5.923 65 1:1, 10ml tot
2 octyldodecanol 262 0.1822 0.1818 0.1827 0.1820 0.1009 0.0050 0.03008 0.00050 0.02957 0.0050 5.914 59
3 octyldodecanol 262 0.1634 0.1635 0.1638 0.1630 0.0907 0.0050 0.03008 0.00045 0.02962 0.0050 5.924 65
4 octyldodecanol 262 0.1757 0.1765 0.1754 0.1753 0.0979 0.0050 0.03008 0.00049 0.02959 0.0050 5.917 60 3.2 = standard dev.
initial oil conc. = 6.02 g/l
Started with 6mg/ml
lido in oil
final mass
oil (g)vol oil (l)
c oil final
g/lKp
c aq final
g/lvol aq (l)
initial
mass oil
final mass
aq (g)Oil λ (nm)
Average
Absorban
Absorbance
final mass
oil (g)vol oil (l)
c oil final
g/lKp
c aq final
g/lvol aq (l)
initial
mass aq
final mass
aq (g)Oil λ (nm)
Average
Absorban
Absorbance
final mass
oil (g)vol oil (l)
c oil final
g/lKp
c aq final
g/lvol aq (l)
initial
mass aq
final mass
aq (g)Oil λ (nm)
Average
Absorban
Absorbance
final mass
oil (g)vol oil (l)
c oil final
g/lKp
c aq final
g/lvol aq (l)
initial
mass aq
final mass
aq (g)Oil λ (nm)
Average
Absorban
Absorbance
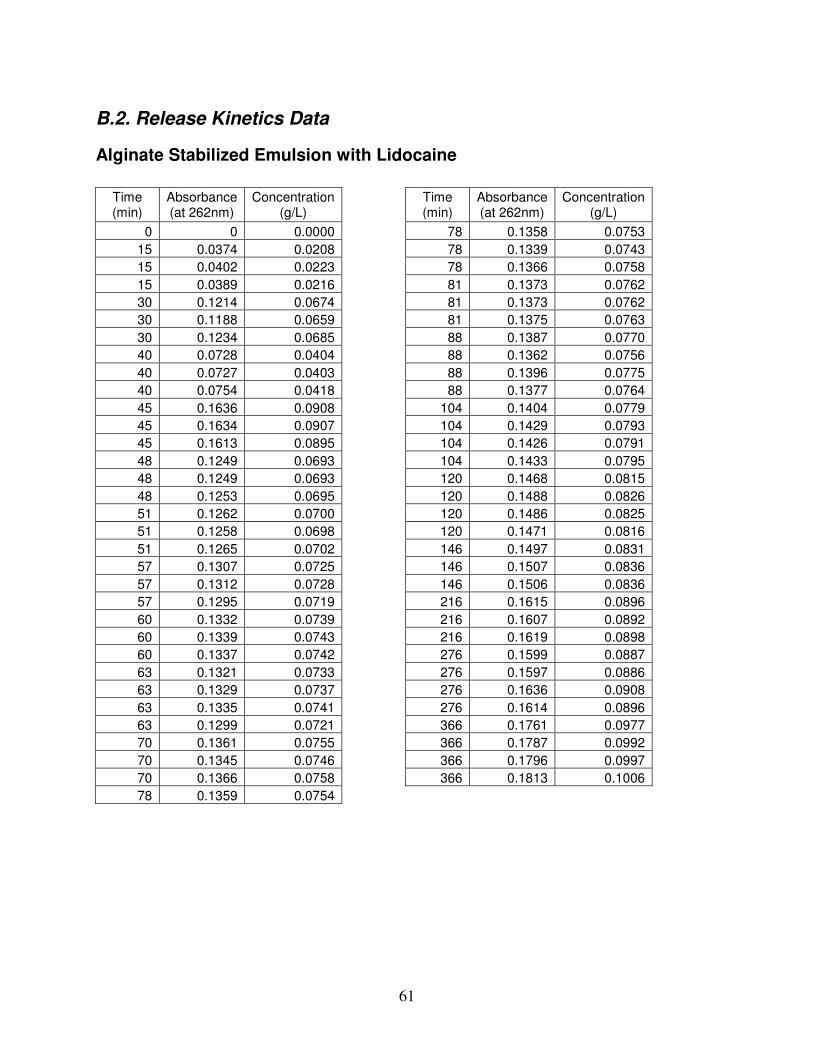
61
B.2. Release Kinetics Data
Alginate Stabilized Emulsion with Lidocaine
Time (min)
Absorbance (at 262nm)
Concentration (g/L)
Time (min)
Absorbance (at 262nm)
Concentration (g/L)
0 0 0.0000 78 0.1358 0.0753
15 0.0374 0.0208 78 0.1339 0.0743
15 0.0402 0.0223 78 0.1366 0.0758
15 0.0389 0.0216 81 0.1373 0.0762
30 0.1214 0.0674 81 0.1373 0.0762
30 0.1188 0.0659 81 0.1375 0.0763
30 0.1234 0.0685 88 0.1387 0.0770
40 0.0728 0.0404 88 0.1362 0.0756
40 0.0727 0.0403 88 0.1396 0.0775
40 0.0754 0.0418 88 0.1377 0.0764
45 0.1636 0.0908 104 0.1404 0.0779
45 0.1634 0.0907 104 0.1429 0.0793
45 0.1613 0.0895 104 0.1426 0.0791
48 0.1249 0.0693 104 0.1433 0.0795
48 0.1249 0.0693 120 0.1468 0.0815
48 0.1253 0.0695 120 0.1488 0.0826
51 0.1262 0.0700 120 0.1486 0.0825
51 0.1258 0.0698 120 0.1471 0.0816
51 0.1265 0.0702 146 0.1497 0.0831
57 0.1307 0.0725 146 0.1507 0.0836
57 0.1312 0.0728 146 0.1506 0.0836
57 0.1295 0.0719 216 0.1615 0.0896
60 0.1332 0.0739 216 0.1607 0.0892
60 0.1339 0.0743 216 0.1619 0.0898
60 0.1337 0.0742 276 0.1599 0.0887
63 0.1321 0.0733 276 0.1597 0.0886
63 0.1329 0.0737 276 0.1636 0.0908
63 0.1335 0.0741 276 0.1614 0.0896
63 0.1299 0.0721 366 0.1761 0.0977
70 0.1361 0.0755 366 0.1787 0.0992
70 0.1345 0.0746 366 0.1796 0.0997
70 0.1366 0.0758 366 0.1813 0.1006
78 0.1359 0.0754
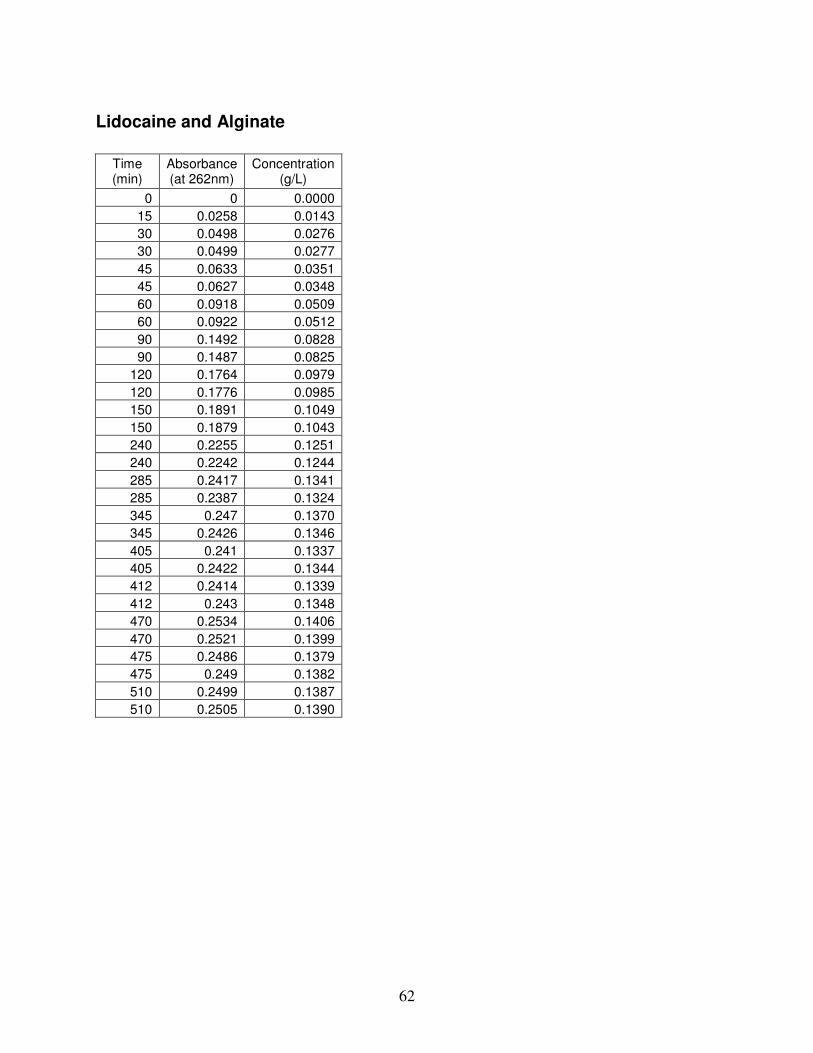
62
Lidocaine and Alginate
Time (min)
Absorbance (at 262nm)
Concentration (g/L)
0 0 0.0000
15 0.0258 0.0143
30 0.0498 0.0276
30 0.0499 0.0277
45 0.0633 0.0351
45 0.0627 0.0348
60 0.0918 0.0509
60 0.0922 0.0512
90 0.1492 0.0828
90 0.1487 0.0825
120 0.1764 0.0979
120 0.1776 0.0985
150 0.1891 0.1049
150 0.1879 0.1043
240 0.2255 0.1251
240 0.2242 0.1244
285 0.2417 0.1341
285 0.2387 0.1324
345 0.247 0.1370
345 0.2426 0.1346
405 0.241 0.1337
405 0.2422 0.1344
412 0.2414 0.1339
412 0.243 0.1348
470 0.2534 0.1406
470 0.2521 0.1399
475 0.2486 0.1379
475 0.249 0.1382
510 0.2499 0.1387
510 0.2505 0.1390
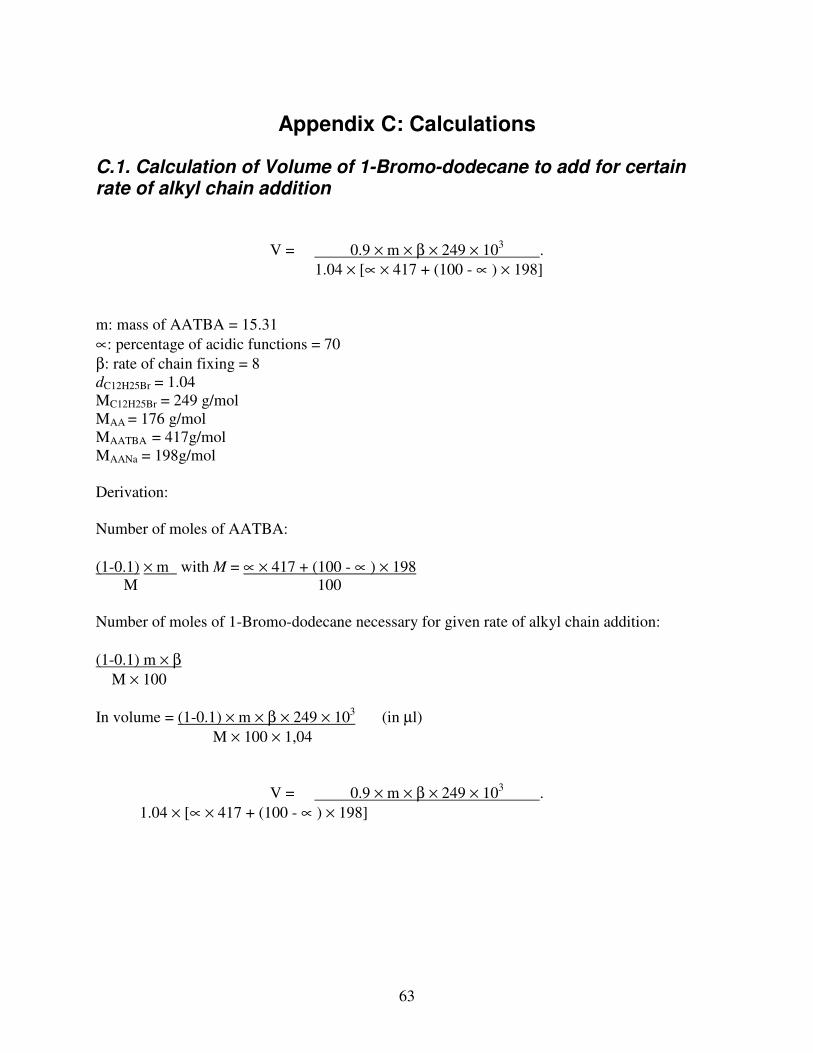
63
Appendix C: Calculations
C.1. Calculation of Volume of 1-Bromo-dodecane to add for certain rate of alkyl chain addition
V = 0.9 × m × β × 249 × 103 .
1.04 × [∝ × 417 + (100 - ∝ ) × 198]
m: mass of AATBA = 15.31
∝: percentage of acidic functions = 70
β: rate of chain fixing = 8
dC12H25Br = 1.04
MC12H25Br = 249 g/mol
MAA = 176 g/mol
MAATBA = 417g/mol
MAANa = 198g/mol
Derivation:
Number of moles of AATBA:
(1-0.1) × m with M = ∝ × 417 + (100 - ∝ ) × 198
M 100
Number of moles of 1-Bromo-dodecane necessary for given rate of alkyl chain addition:
(1-0.1) m × β
M × 100
In volume = (1-0.1) × m × β × 249 × 103
(in µl)
M × 100 × 1,04
V = 0.9 × m × β × 249 × 103 .
1.04 × [∝ × 417 + (100 - ∝ ) × 198]