algeria egypt libyan arab jamahiriya mauritania morocco sudan
TRANSCRIPT
What will be the impact on forests of future economic development, globalized trade and
increases in the world’s population? The 2009 edition of the biennial State of the World’s Forests
looks forward, with the theme “Society, forests and forestry: adapting for the future”.
Part 1 summarizes the outlook for forests and forestry in each region, based on FAO’s periodic
regional forest sector outlook studies. Past trends and projected demographic, economic,
institutional and technological changes are examined to outline the scenario to 2030.
Part 2 considers how forestry will have to adapt for the future, focusing on: the global outlook for
wood products demand; mechanisms for meeting the demand for environmental services
of forests; changes in forest sector institutions; and developments in science and technology.
This volume will serve as a source of information to support forest-related policy and research.
It is hoped that it will also stimulate creative thinking and debate to enhance the future of the
world’s forests. 2009
STATe OF The
World’s Forests
STATe O
F The
Wo
rld
’s Fo
re
sts
2009
Iss
N 1020-5705
FAoTC/M/I0350E/1/01.09/7000
ISBN 978-92-5-106057-5 ISSN 1020-5705
9 7 8 9 2 5 1 0 6 0 5 7 5

Cover photos:
Front, left: FAO/FO-6120/M.C. Yang
Front, centre: R. Faidutti
Front, right: FAO/FO-6664/M. Kashio
Copies of FAo publications can be requested from:
SALES & MARKETING GROUP
Communication Division
Food and Agriculture Organization of the United Nations
Viale delle Terme di Caracalla - 00153 Rome, Italy
E-mail: [email protected]
Fax: (+39) 06 57053360
Web site: www.fao.org
Back, left: FAO/FO-5043/B. héois
Back, centre: UK Forestry Commission/1057657/J. McFarlane
Back, right: FAO/FO-6003/B. Vivattana
2009State of the
World’s Forests
food and agriculture organization of the united nationS
rome, 2009

Produced by the
electronic Publishing Policy and support Branch
Communication division
FAo
the designations employed and the presentation of material in this information product do not imply the expression of any opinion whatsoever on the part of the food and agriculture organization of the united nations (fao) concerning the legal or development status of any country, territory, city or area or of its authorities, or concerning the delimitation of its frontiers or boundaries. the mention of specific companies or products of manufacturers, whether or not these have been patented, does not imply that these have been endorsed or recommended by fao in preference to others of a similar nature that are not mentioned.
the designations employed and the presentation of material in the maps do not imply the expression of any opinion whatsoever on the part of fao concerning the legal or constitutional status of any country, territory or sea area, or concerning the delimitation of frontiers.
iSBn 978-92-5-106057-5
all rights reserved. reproduction and dissemination of material in this information product for educational or other non-commercial purposes are authorized without any prior written permission from the copyright holders provided the source is fully acknowledged. reproduction of material in this information product for resale or other commercial purposes is prohibited without written permission of the copyright holders. applications for such permission should be addressed to the chief, electronic Publishing Policy and Support Branch, communication division, fao, Viale delle terme di caracalla, 00153 rome, italy or by e-mail to [email protected]
© FAO 2009

Contents
foreword vacknowledgements viabbreviations and acronyms viiSummary viii
Part 1regional outlook 1
Africa 2AsiaandthePacific 12Europe 22LatinAmericaandtheCaribbean 32NorthAmerica 42WesternandCentralAsia 52
Part 2adapting for the future 61
Globaldemandforwoodproducts 62Meetingthedemandforenvironmentalservicesofforests 72Changinginstitutions 80Developmentsinforestscienceandtechnology 88
Postscript challenges and opportunities in turbulent times 98
Annex
table 1Basicdataoncountriesandareas 102
table 2Forestareaandareachange 109
table 3Forestgrowingstock,biomassandcarbon 116
table 4Production,tradeandconsumptionofwoodfuel,roundwoodandsawnwood,2006 123
table 5Production,tradeandconsumptionofwood-basedpanels,pulpandpaper,2006 130
table 6Forestrysector’scontributiontoemploymentandgrossdomesticproduct,2006 137
references 145

iv
Contents

v
Contents
state of the World’s Forests,publishedbiennially,providesaglobalviewofmajordevelopmentsaffectingforests.Thethemeforthe2009editionis
“Society,forestsandforestry:adaptingforthefuture”.The2007issuereviewed“Progresstowardssustainable
forestmanagement”withanemphasisonthe“supplyside”,inparticularforestresources.State of the World’s Forests 2009placesmoreemphasisonthe“demandside”:Whatwillbetheimpactonforestsoffutureincreasesinglobalpopulation,economicdevelopmentandglobalization?Istheexplosioninglobaltradehavingpositiveornegativeeffectsontheworld’sforests?Willtheforestsectorcontinuetohaveamajorroleinprovidinglivelihoodsforruralcommunities?
Thiseightheditionlooksforward.Part1summarizestheoutlookforforestsandforestryineachregionoftheworld.FAOperiodicallycarriesoutregionalforestsectoroutlookstudiesincollaborationwithcountriesandorganizationsineachregion.Theresultsofstudiesforallregionsaresummarizedandpresentedhereforthefirsttimeinasinglepublication.Amainpatternthatemergesisastrongcorrelationbetweeneconomicdevelopmentandthestateofforests.Countriesthatareundergoingrapideconomicgrowthtendtostrugglewithimmensepressuresontheirforests.Incontrast,regionsthathavealreadyachievedahighlevelofeconomicdevelopmentareusuallyabletostabilizeorincreasetheirforestarea.However,thefactorsaffectingforestsarenumerousandcomplex,makingitdifficulttodrawsimpleconclusionsortomakereliableprojections.
Part2considershowforestrywillhavetoadaptforthefuture.Itbeginswithaglobaloutlookforwoodproductsdemandto2030,notingchangingpatternsinproduction,consumptionandtrade.Next,achapteronenvironmentalservicesofforestsprobesthevariousmarketandnon-marketmechanismsevolvingtohelpforestsandtreesfulfiltheirenvironmentalservicefunctionsofland,water
andbiodiversityprotection,carbonstorageandothers.Alookatprogressininstitutionaladaptationnotesthatmanyforestryinstitutionsarehavingdifficultyinadaptingtorapidchangesincommunications,globalizationandsociety’sexpectations.Thoseinstitutionsthatarewillingandabletoadaptaremorelikelytobesuccessfulinthefuture.Finally,Part2examinesdevelopmentsinscienceandtechnology,whichwillcontinuetohaveanenormousimpactonthefutureofforestsandforestry.Imagineaworldinwhichtreesareamajorsourceoffuelforcars,replacingoil.Onlyafewyearsago,thisseemedlikefantasy,buttodaythepossibilitymustbeseriouslyconsidered.
Asthiseditionwasgoingtopressinlate2008,theglobaleconomyhadspunintosharpdecline,sparkedbythecontractionofthehousingsectorandthesubprimemortgagecrisisintheUnitedStatesofAmerica.Almostallcountrieshavebeenaffectedbythisdownturn.WhiletheseeventsoccurredtoolatetobeincorporatedinthemaintextofState of the World’s Forests 2009,apostscripthasbeenaddedaddressingtheobservedandlikelyimpactsoftheeconomiccrisisonforestsandforestry.Itnotesthatwhilethereisconsiderableuncertaintyabouthowthesituationwillunfoldinthecomingyears,thecrisiscouldalsoprovideanopportunitytochartanewpathforthedevelopmentoftheforestsector.
State of the World’s Forests 2009hastwomaingoals.Aswithpasteditions,itisintendedtoserveasasourceofinformationtosupportpolicyandresearchrelatedtoforests.Inaddition,Ihopethatithelpstostimulatecreativethinkinganddebateaboutthefutureoftheworld’sforests.
Jan HeinoAssistantDirector-GeneralFAOForestryDepartment
Foreword
stAte oF the World’s Forests 2009vi
t hepreparationofState of the World’s Forests 2009wascoordinatedbyC.T.S.Nair.SpecialthanksgotoA.Perlis,whoeditedthepublication,andto
R.Rutt,whoprovidedresearchsupport.ThefollowingFAOstaffwroteorreviewedsectionsof
thereportorassistedwithtables,maps,graphicsorotherinformation:M.Achouri,G.Allard,B.Amado,S.Appanah,J.L.Blanchez,M.Boscolo,S.Braatz,A.Branthomme,J.Broadhead,C.Brown,J.Carle,C.Carneiro,F.Castañeda,M.Chihambakwe,R.Czudek,P.Durst,C.Eckelmann,T.Etherington,P.Evans,V.Ferreira,B.Foday,M.Gauthier,A.Gerrand,S.Grouwels,J.Heino,S.Hetsch,T.Hofer,P.Holmgren,A.Inoguchi,O.Jonsson,R.Jonsson,F.Kafeero,W.Killmann,D.Kneeland,P.Koné,M.Laverdiere,A.Lebedys,M.Lobovikov,Q.Ma,L.Marklund,R.M.Martin,M.Morell,E.Muller,F.Padovani,M.Paveri,E.Pepke,J.A.Prado,C.Prins,D.Reeb,D.Rugabira,O.Serrano,O.Souvannavong,R.Suzuki,T.Vahanen,P.Vantomme,A.Whiteman,M.L.WilkieandJ.Zapata-Andia.
FAOspecificallythanks,forcontributionsandreviews:L.AldenWily,D.BaskaranKrishnapillay,S.Boucher,M.Boyland,J.Campbell,J.Cinq-Mars,A.Kaudia,R.Keenan,L.Langner,J.Maini,E.Mansur,P.O’Neill,J.Parrotta,R.Persson,F.RagaCastellanos,M.A.Razak,R.Sedjo,J.SeverinoRomo,H.C.SimandE.Sirin.
FAOalsoacknowledgesmembersoftheCollaborativePartnershiponForests(CPF)fortheircontributionspresentedinPart2,specificallytheConventiononBiologicalDiversity(CBD),theCenterforInternationalForestryResearch(CIFOR),theInternationalTropicalTimberOrganization(ITTO),theInternationalUnionofForestResearchOrganizations(IUFRO),theGlobalMechanismoftheUnitedNationsConventiontoCombatDesertification(UNCCD),theUnitedNationsEnvironmentProgramme(UNEP),theUnitedNationsForumonForests(UNFF)andtheUnitedNationsFrameworkConventiononClimateChange(UNFCCC).
ThestaffoftheFAOElectronicPublishingPolicyandSupportBranchprovidededitorialandproductionsupport.
Acknowledgements
vii
Abbreviations and acronyms
CAMPFIRE CommunalAreasManagementProgrammeforIndigenousResources
CBD ConventiononBiologicalDiversityCDM CleanDevelopmentMechanismCIFOR CenterforInternationalForestryResearchCIS CommonwealthofIndependentStatesCPF CollaborativePartnershiponForestsECOWAS EconomicCommunityofWestAfricanStatesEFSOS EuropeanForestSectorOutlookStudyFECOFUN FederationofCommunityForestUsersNepalFLEG forestlawenforcementandgovernanceFSC ForestStewardshipCouncilGCC GulfCooperationCouncilGDP grossdomesticproductGIS geographicinformationsystemICT informationandcommunicationtechnologyIEA InternationalEnergyAgencyIIED InternationalInstituteforEnvironmentand
DevelopmentIPCC IntergovernmentalPanelonClimateChangeITTO InternationalTropicalTimberOrganizationIUCN InternationalUnionforConservationof
NatureIUFRO InternationalUnionofForestResearch
OrganizationsLULUCF landuse,land-usechangeandforestryMCPFE MinisterialConferenceontheProtectionof
ForestsinEuropeMTOE milliontonnesoilequivalentNAFTA NorthAmericanFreeTradeAgreementNGO non-governmentalorganization
NLBI Non-LegallyBindingInstrumentonAllTypesofForests
NWFP non-woodforestproductPEEN Pan-EuropeanEcologicalNetworkPEFC ProgrammefortheEndorsementofForest
CertificationSchemesPES paymentsforenvironmentalservicesR&D researchanddevelopmentREDD reducingemissionsfromdeforestationand
forestdegradationREIT realestateinvestmenttrustSADC SouthernAfricanDevelopmentCommunitySWF sovereignwealthfundTIMO timberinvestmentmanagementorganizationUN UnitedNationsUNCCD UnitedNationsConventiontoCombat
DesertificationUNCED UnitedNationsConferenceonEnvironment
andDevelopmentUNECE UnitedNationsEconomicCommissionfor
EuropeUNEP UnitedNationsEnvironmentProgrammeUNESCAP UnitedNationsEconomicandSocial
CommissionforAsiaandthePacificUNESCO UnitedNationsEducational,Scientificand
CulturalOrganizationUNFCCC UnitedNationsFrameworkConventionon
ClimateChangeUNFF UnitedNationsForumonForestsWRI WorldResourcesInstituteWRME woodraw-materialequivalent
viii
Summary
thiseighthbiennialissueofState of the World’s Forestsconsiderstheunfoldingfutureofforestsandforestryatthesubregional,regionalandgloballevels.Based
onthemostrecentofFAO’speriodicforestsectoroutlookstudies,itexaminestheimpactsthatexternalfactorssuchasdemographic,economic,institutionalandtechnologicalchangesmayhaveonforests.Withglobalizationandimprovedcommunications,theregionalscenarioswillbeincreasinglyinterlinked.However,somecountriesandregionsarebetterpreparedtofacetheupcomingchallengesandtakeadvantageofemergingopportunities,whileothersstilllackessentialinstitutional,legalandeconomicconditionstomanagetheirforestresourcesinasustainablemanner.
PArt 1: regionAl outlookAfricaTheforestsituationinAfricapresentsenormouschallenges,reflectingthelargerconstraintsoflowincome,weakpoliciesandinadequatelydevelopedinstitutions.Thegrowingpopulationandrisingpricesoffoodandenergywillexacerbatethesituation,especiallyasincreasedinvestmentsininfrastructureopenupnewareas.Progressinimplementingsustainableforestmanagementisexpectedtobeslow,withforestlosslikelytocontinueatcurrentrates.
Theforestoutlookwilldependgreatlyonpoliticalandinstitutionaldevelopments–onimprovedefficiencyandaccountabilityinthepublicsector;greaterinclusiveness,competitivenessandtransparencyinmarketinstitutions;andaninformalsectorthatprovidesincreasedlivelihoodopportunitiesforthepoor.Focusingonproductsandservicesrequiredlocallyandgloballyandstrengtheninglocalinstitutionscanbeimportantwaysofaddressingforestresourcedepletion.Sucheffortsshouldbuildonlocalknowledgeandexperienceofsustainableresourcemanagementintegratingagriculture,animalhusbandryandforestry.
Asia and the PacificConsideringthegreatdiversityinAsiaandthePacific,severalscenariosareexpectedtounfold.Whileforestareawillstabilizeandincreaseinmostofthedevelopedcountriesand
someoftheemergingeconomies,thelow-andmiddle-incomeforest-richcountrieswillwitnesscontinuingdeclinesasaresultofexpansionofagriculture,includingtheproductionofbiofuelfeedstock.
Demandforwoodandwoodproductswillcontinuetoincreaseinlinewiththegrowthinpopulationandincome.Growthinthedemandforprimarycommoditiesowingtorapidindustrializationofemergingeconomiesislikelytoresultinforestconversioninothercountrieswithinandoutsidetheregion.Whiletheregionisaleaderinplantedforestdevelopment,itwillcontinuetodependonwoodfromotherregions,aslandandwaterconstraintswilllimitthescopeforself-sufficiencyinwoodandwoodproducts.Thedemandforforestenvironmentalserviceswillincreaseasincomesrise,andconservationinvolvinglocalcommunitiesislikelytoreceivegreateremphasis.
europeForestresourcesinEuropeareexpectedtocontinuetoexpandinviewofdeclininglanddependence,increasingincome,concernforprotectionoftheenvironmentandwell-developedpolicyandinstitutionalframeworks.Theprovisionofenvironmentalserviceswillremainaprimaryconcern,especiallyinWesternEurope,andrulesandregulationswillmakewoodproductionlesscompetitivethaninotherregions.
Forestmanagementwillcontinuetoserveawidevarietyofpurposes.Economicviabilityislikelytoremainachallenge,especiallyforsmall-scaleforestowners,buttheincreaseddemandforwoodfuelcouldchangethis.Whiletheforestindustry,especiallyinWesternEurope,maycontinuetolosecompetitivenesswithotherregionsinlabour-intensivesegments,itislikelytoretainleadershipintheproductionoftechnologicallyadvancedproducts.Withintheregion,thedifferencesinforestrybetweenEasternandWesternEuropearelikelytodiminishasEasternEuropecatchesupeconomically.
latin America and the CaribbeanForestsandforestryinLatinAmericaandtheCaribbeanwillbeinfluencedbythepaceofeconomicdiversificationandchangesinlanddependence.InCentralAmerica
stAte oF the World’s Forests 2009
ix
andtheCaribbean,wherepopulationdensitiesarehigh,increasingurbanizationwillcauseashiftawayfromagriculture,forestclearancewilldeclineandsomeclearedareaswillreverttoforest.However,inSouthAmerica,thepaceofdeforestationisunlikelytodeclineinthenearfuturedespitelowpopulationdensity.Highfoodandfuelpriceswillfavourcontinuedforestclearanceforproductionoflivestockandagriculturalcropsforfood,feedandbiofueltomeettheglobaldemand.Sustainableforestmanagementwillcontinuetobeachallengeinanumberofcountrieswherelandtenureispoorlydefined.
LatinAmericaandtheCaribbeanhasconsiderableopportunitiestobenefitfromthegrowingdemandforglobalpublicgoodsprovidedbyforests,especiallycarbonsequestrationandstorage,butrealizingthepotentialwillrequiresubstantialimprovementsinpolicyandinstitutionalframeworks.Plantedforestswillincrease,promotedbyprivateinvestmentsandcontinuingglobaldemandforwoodandwoodproductsfromAsia.However,itisunlikelythattheincreasedplantingratewillbesufficienttooffsetcontinuingdeforestation.
north AmericaThenearfutureofNorthAmericanforestrywilldependonhowquicklytheregionreversestherecenteconomicdownturnanditsimpactonthedemandforwoodandwoodproducts,especiallyintheUnitedStatesofAmerica.Theforestsectorwillalsoneedtoaddresschallengesofclimatechange,includingincreasingfrequencyandseverityofforestfiresanddamagebyinvasivepestspecies.Woodwillbeincreasinglydemandedasasourceofenergy,especiallyifcellulosicbiofuelproductionbecomescommerciallyviable;thisdevelopmentwouldlikelyresultinmuchlargerinvestmentsinplantedforests.
CanadaandtheUnitedStatesofAmericawillcontinuetohavefairlystableforestareas,althoughthedivestmentofwoodlandsownedbylargeforestcompaniescouldaffecttheirmanagement.InMexico,changesinthedeforestationratewilldependonthepaceoftransitionfromanagrariantoanindustrialeconomyandreduceddependenceonlandasasourceofincomeandemployment.Whilethe
economicviabilityoftheforestindustrymayfluctuateandevendecline,theprovisionofenvironmentalserviceswillcontinuetogaininimportance,drivenbypublicinterest.
Western and Central AsiaTheoutlookforforestsandforestryinWesternandCentralAsiaismixed.Incomegrowthandurbanizationsuggestthattheforestsituationwillimproveorremainstableinsomecountries,butthepictureislesspromisingforanumberoflow-incomeagriculture-dependentcountries.Forestdegradationwillpersistincountriesthatarerelativelywelloffbuthaveweakinstitutions.Overall,theforestsectorisgivenlowpriorityinpublicinvestments.
Adversegrowingconditionslimittheprospectsforcommercialwoodproduction.Rapidlyincreasingincomesandhighpopulationgrowthratessuggestthattheregionwillcontinuetodependonimportstomeetdemandformostwoodproducts.Provisionofenvironmentalserviceswillremainthemainjustificationforforestry,especiallyarrestinglanddegradationanddesertification,protectingwatershedsandimprovingtheurbanenvironment.Institutionbuilding,particularlyatthelocallevel,isneededinordertofacilitateanintegratedapproachtoresourcemanagement.
PArt 2: AdAPting For the Futureglobal wood products demandTheincomethatownersderivefrommanagingforeststomeetthedemandforgoodsandservicesisaprimarydeterminantofinvestmentinforestmanagement.Demographicchanges,economicgrowth,regionaleconomicshiftsandenvironmentalandenergypolicieswillbedecisiveinthelong-termglobaldemandforwoodproducts.
Productionandconsumptionofkeywoodproductsandwoodenergyareexpectedtorisefromthepresentto2030,largelyfollowinghistoricaltrends.Themostdramaticchangewillbetherapidincreaseintheuseofwoodasasourceofenergy,particularlyinEurope,asaresultofpoliciespromotinggreateruseofrenewableenergy.ThehighestgrowthrateswillcontinuetobeinAsia,whichwill
summAry

stAte oF the World’s Forests 2009x
bethemajorproducerandconsumerofwood-basedpanelsandpaperandpaperboard(althoughpercapitaconsumptionwillremainhigherinEuropeandNorthAmerica).IndustrialroundwoodproductioninAsiawillbefarshortofconsumption,increasingthedependenceonimports.
Thepotentialforlarge-scalecommercialproductionofcellulosicbiofuelwillhaveunprecedentedimpactsontheforestsector.Increasingtransportcostswillalsoinfluencethedemandforwoodproducts.Thesefactorsandothers,includingchangesinexchangerates,willinfluencethecompetitivenessoftheforestsectorandaffectproductionandconsumptionofmostforestproducts.
Industrialroundwoodwillbeincreasinglylikelytocomefromplantedforestsinthefuture.Thiscontinuingshiftpresentsinterestingopportunitiesandchallengesforforestmanagement.
meeting the demand for environmental services of forestsGrowthinincomecoupledwithgreaterawarenesswillincreasethedemandforenvironmentalservicesprovidedbyforestssuchascleanairandwater,mitigationofclimatechangeandunspoiltlandscapes.Whileincomegrowthalsoenhancestheabilityofsocietytomeetthecostsofenvironmentalprotection,economicgrowthisoftenaccompaniedbyincreasedenvironmentalimpacts.Inparticular,countrieswithrapidlygrowingeconomiesoftengothroughaperiodwhenforestresourcesareexploitedandtheirenvironmentalservicesdeclineaccordingly.Maintainingforestenvironmentalservicesrequiresstrikingabalancebetweentheproductionofgoodsandtheprovisionofservices.
Regulatoryapproachesforhelpingtosecureforests’abilitytomeetthedemandforenvironmentalservicesincludeprotectedareas,instrumentsforsustainableforestmanagementandgreenpublicprocurementpolicies.
Marketapproachesincludecertification,carbonmarketsandpaymentsforenvironmentalservices(PES).Third-partycertificationofforestswillcontinuetospread,althoughobtainingapremiumtocoverimplementationcostsremainsachallenge.Systemsforprovidingappropriatepaymentstoforestownersasameansofsupportingforestconservationarereceivingconsiderableattention;theyhavelongexistedforrecreationalservicesandarenowbeingadoptedforwatershedprotection,biodiversityconservationandcarbonsequestration.Suchschemesareexpectedtoincreaseinnumber;stableinstitutionalandlegalframeworksareaprerequisitefortheirsuccess.
Ongoingdiscussionsaboutincludingoptionsforreducingemissionsfromdeforestationandforestdegradation(REDD)inglobalclimatechangenegotiationshaveraisedmanyhopes.However,providingincentivestodesistfromdeforestationinvolvescomplexpolicy,institutionalandethicalissuesthatmustbeconsidered.
Changing institutionsTheshiftingbalanceamongforestsectorinstitutions–publicagencies,theprivatesector,civil-societyorganizations,theinformalsectorandinternationalorganizations–willplayanimportantpartinsociety’sadaptationtosocial,economicandenvironmentalchange.Withtheemergenceofnewplayers,theinstitutionallandscapehasbecomemorecomplex.Ingeneral(althoughnotinallcountries),theplayingfieldisbecomingmorelevel,partlyasaresultofnewinformationandcommunicationtechnologies.Much-neededpluralismprovidesnewopportunitiesforsmallandmediumenterprisesandcommunityorganizations.Ifgovernmentforestryagenciesthathavehistoricallydominatedthescenefailtoadapttochange,theycouldfadeintoirrelevance.
Withtheincreasingpaceofglobalization,newplayerssuchastimberinvestmentmanagementorganizations(TIMOs),realestateinvestmenttrusts(REITs),sovereignwealthfundsandcarbon-tradinginstitutionscouldaltertheglobalinstitutionalmap.Institutionswillfacetremendouspressuretobalancefragmentationandtoconsolidateefforts.
developments in forest science and technologyVisualizingthefutureofforestscienceandtechnologyisdifficultgiventherapidpaceofchange.Innovationhassignificantlyimprovedthecapacityoftheforestsectortomeetthechangingdemandsofsocietyandwillcontinuetodoso.However,manydevelopingcountrieshavelittleornocrediblesciencecapacity,andthislackhinderstheirlong-termdevelopment.Eveninmanydevelopedcountries,forestscienceandtechnologycapacitieshaveeroded.
However,researchcontinuestobreaknewgroundinallareasofforestry,fromproduction,harvestingandprocessingtowoodenergyandtheprovisionofenvironmentalservices.Relativelynewfieldssuchasbiotechnology,nanotechnologyandinformationandcommunicationtechnologiescontributetothesedevelopments.Thevalueofindigenousknowledgeisincreasinglybeingrecognized.
Thegrowthofcommerciallydrivenprivate-sectorresearchandthedecliningcapacityofpublic-sectorresearchraiseanumberofissues.Vastpopulationsthatcannotaffordtopayforimprovedtechnologiesareoftenexcludedfromthebenefitsofprivate-sectorresearch.Thisaccentuatesdisparitiesinaccesstoknowledge,withconsequencesforincomeandlivingstandards.
Moreconcertedeffortsareneededtoaddressimbalancesanddeficienciesinscientificandtechnologicalcapacity.Challengesincludereducingbarrierstotheflowoftechnologiesamongandwithincountries,ensuringthatsocialandenvironmentalissuesaremainstreamed,andtranscendingtraditionalsectoralboundariestotakeadvantageofscientificandtechnologicaldevelopmentsoutsidetheforestsector.

xi
Postscript: challenges and opportunities in turbulent timesAsState of the World’s Forests 2009goestopress(late2008),theworldisexperiencingasteepeconomicdecline.ThecontractionofthehousingsectorandthesubprimemortgagecrisisintheUnitedStatesofAmericahaveseverelyaffectedfinancialmarkets,triggeringaneconomicslowdowninvolvingalmostallcountriesandtransformingpreviouslyupbeateconomicforecasts.
Whatimpactswillthesechangeshaveontheforestsector?Thecollapseofthehousingsectorhasreducedthedemandforawidearrayofwoodandwoodproducts,leadingtomillclosuresandunemployment.Newinvestmentsareslowingasaresult,affectingallwoodindustries.
Thedemandforenvironmentalserviceshasalsochangedasaresultofreducedabilityandwillingnesstopayforsuchservices.Carbonpriceshaveremainedhighlyvolatile.Futureclimatechangearrangementsmayfacechallengesascountriesgiveprioritytotacklingtheeconomiccrisis.
Potentialnegativeimpactsonforestresourcescouldincludereducedinvestmentinsustainableforestmanagementandariseinillegalloggingasthedecline
intheformaleconomicsectoropensopportunitiesforexpansionoftheinformalsector.Landdependence,whichhadbeeneasing,couldincrease,raisingtheriskofagriculturalexpansionintoforests,deforestationandreversalofpreviousforestgains.However,therecouldalsobepositiveimpacts–reducedwooddemandcouldlessenpressureonforests,whileconversionofforestforlarge-scalecultivationofcommercialcropssuchasoil-palm,soybeansandrubbercouldslowastheirpricesfall.
Itisimpossibletoknowwhentheglobaleconomywillbegintorecover.However,suchcrisesalsoofferopportunitiestochartnewpathsofdevelopment.Theforestsectorcouldbenefitfromthepursuitofa“greenpath”todevelopment–throughbuildingupofnaturalresourcecapital(e.g.throughafforestationandreforestationandincreasedinvestmentsinsustainableforestmanagement),generationofruralemploymentandactivepromotionofwoodingreenbuildingpracticesandrenewableenergy.Certainly,thischangeofpathwillrequirefundamentalinstitutionalchanges,butthecrisismaybringaboutgreaterwillingnesstoacceptandimplementlong-overduereforms.
summAry


regional outlook
Part
Changes in society, which have accelerated in recent decades with the rapid growth in information and communication technologies and globalization, are bringing about important changes in the forest sector at all levels. Demographic, economic, institutional and technological changes have altered the pattern of demand for forest products and services.
Considering the long-term nature of forestry, a better understanding of the potential directions of change is crucial to developing appropriate priorities and strategies for the future of the sector. In particular, the growing interaction of societies through globalization compels forestry professionals to acquire a broader perspective beyond national borders.
Part 1 has been developed largely based on ongoing and completed regional forest sector outlook studies. For each region, the drivers of change external to the forest sector are first examined in the areas of demographics, economy, policies and institutions, and science and technology. All demographic data are from World Urbanization Prospects: The 2007 Revision Population Database (UN, 2008a). All gross domestic product (GDP) and value-added figures are in 2006 constant United States dollars.
For each region, there is a section outlining an overall scenario of societal changes that can be expected up to 2030. Taking the predicted changes and previous trends into account, the future for the forest sector is then projected, tracing developments in:
• forest area, based – unless otherwise noted – on statistics from the Global Forest Resources Assessment 2005 (FAO, 2006a);
• forest management, addressing both natural and planted forests;
• wood products (production, consumption and trade), with projections based on econometric modelling, taking into particular account the changes in population, income and other parameters that influence demand;
• woodfuel, looking at both traditional woodfuel (fuelwood and charcoal) and modern biofuels, including the “wild card” of eventual commercial production of cellulosic biofuel;
• non-wood forest products (NWFPs), identifying broad patterns only, as the diversity of NWFPs in all regions makes it extremely difficult to provide a comprehensive outlook;
• environmental services of forests, including biodiversity conservation, climate change mitigation, protection against desertification and land degradation, watershed services and nature tourism. Protected areas are given as a rough indicator of conservation status; as recent reliable statistics do not exist by country for forest protected areas, figures are given for terrestrial protected areas (which include but are not limited to forests).
The aim has been to capture the main trends despite diversity within and among regions and countries which made the task a great challenge. An effort has also been made to provide a balanced perspective between short-lived changes, which usually capture most of the attention, and the less perceptible long-term changes, which are often neglected.
1
S. V
erve
r

stAte oF the World’s Forests 20092
Africa
t heAfricancontinent(Figure1),consistingof58countriesandareas(seeAnnex),containshighlydiverseecosystems.Thecontinentaccounts
for14percentoftheglobalpopulation.Theregion’s635millionhectaresofforestsaccountfor21.4percentofitslandarea.TheCongoBasinhoststhesecond-largestcontiguousblockoftropicalforest(Figure2).
drivers oF ChAngedemographicsAfrica’spopulationgrewfrom472millionin1980to943millionin2006andisexpectedtoriseto1.2billionby2020(Figure3).Althoughtheannualgrowthrateisdeclining(from2.5percentbetween1990and2000toaprojected2.1percentbetween2010and2020),theincreaseinabsolutenumbersimpliesfurtherpressureonitsresources.
Africaisurbanizingrapidly.By2020,about48percentofthetotalpopulationwillbeurban.However,withtheexceptionofmostofNorthernAfrica,Africawillremain
Africa
largelyruralinthenextdecadeandbeyond.Theruralpopulationisprojectedtoincreaseby94millionbetween2005and2020.
HIV/AIDSwillcontinuetoaffectthehumanandfinancialresourcesofanumberofcountries(Box1).
economyIn2006,Africaaccountedforabout2.3percentofglobalGDP.Since2000,theoveralleconomicsituationhasimproved.GDPgrowthrateshaverisenfrom2.3percentonaveragebetween1990and1999tomorethan5percentsince2000,reaching6.2percentin2007(IMF,2008).Highgrowthratesarelikelytopersistinthemediumterm(Figure4).However,despiteincreasedGDPgrowth,thepercapitaincomegrowthrateremainslowbecauseofpopulationgrowth(exceptinSouthAfrica).
Lowdomesticsavingsandinvestments,unevengrowthandskeweddistributionofincomeremainconcerns.Recentgrowthspurtsarepartlyaconsequenceofthehighpricesofoilandotherprimarycommodities.
Figure 2 Extent of forest resources
ForestOther wooded landOther land cover
Central AfricaEast AfricaNorthern AfricaSouthern AfricaWest Africa
Figure 1 Subregional breakdown used in this report
Note: See annex table 1 for list of countries and areas by subregion.

PArt 1 regional outlook 3
Agriculture’sshareingrossvalueaddedhasdeclined,fromabout20percentinthe1990sto15percentin2006.However,agricultureisvitalforlivelihoods;itaccountedfor70percentofruralemploymentin2005.Percapitaproductivityofagricultureisextremelylowincomparisonwithotherregions,anddecliningagriculturalincomehasenhanceddependenceonoff-farmemployment,includingcollectionoffuelwoodandNWFPsandproductionofcharcoal.
MuchofAfrica’seconomicgrowthsince2000hasbeendrivenbyexportsofprimarycommoditiestotheemergingAsianeconomies,andthisislikelytocontinue.Africa’sindustriesfacemajorchallenges,especiallyfromincreasingcompetitionindomesticandglobalmarkets.Participationinglobalmarketsisexpectedtoremainunevenbecauseoflimitationsinpolicyandinstitutionalframeworks,infrastructure,humanresourcedevelopment,theinvestmentclimateandcompetitiveness.Africanmarketsremainsmallandfragmented,althoughmechanismsforregionalandsubregionalintegrationsuchasthe
Figure 3 Population
Source: un, 2008a.
1 3001 2001 1001 000
900800700600500400300200100
0
Million
1980 1985 1990 1995 2000 2005 2010 2015 2020
Figure 4 Gross domestic product
SourceS: Based on un, 2008b; World Bank, 2007a.
2 000
1 800
1 600
1 400
1 200
1 000
800
600
400
200
0
uS$ billion
1980 1985 1990 1995 2000 2005 2010 2015
•Drastic decline in resources – human and financial –
leaving less for long-term investments
•Increased dependence on forest products, especially
those that are easy to collect
•Loss of traditional knowledge
•Shortage of skilled and unskilled labour –
undermining forestry by affecting all key sectors such
as wood industries, research, education, training,
extension and forest administration
•Increased costs to industry on account of
absenteeism and higher bills for treatment
•Reduced public-sector investment in forestry, as
most governments will have to devote more of their
budgets to health care and combating HIV/AIDS
Source: fao, 2003a.
BoX 1 impacts of hiV/aidS
total africa West africa northern africa
east africa Southern africa central africa
total africa northern africa Southern africa
West africa east africa central africa
stAte oF the World’s Forests 20094
EconomicCommunityofWestAfricanStates(ECOWAS)andtheSouthernAfricanDevelopmentCommunity(SADC)arebeginningtobearfruit.
Policies and institutionsCivilsociety’sdemandfortransparencyandgoodgovernanceisbringingaboutfundamentalchangesinAfrica.Decentralizationofauthorityandparticipatoryapproachestoresourcemanagementarefindingwideracceptance.However,conflictsunderminesocialandeconomicdevelopmentinanumberofcountries.
CommunityinvolvementinnaturalresourcemanagementhasalonghistoryinAfrica,andpolicyandlegalchangesinrecentyearshavehelpedtoacceleratedevolution.However,forestryfacessomeenduringinstitutionaldifficultiessuchas:
• poorintersectorallinkages,withhigh-prioritysectorssuchasagriculture,mining,industrialdevelopmentandenergyeffectivelyhavingagreaterimpactonforeststhanforestpolicy;
• inconsistenciesinlawsgoverningtheenvironmentandthosegoverninginvestments;
• poorgovernanceandcorruptioninsomecountries;• landtenureuncertainties,weaklegalframeworksand
otherhindrancestothedevelopmentofacompetitiveprivatesector;
• decliningcapacityofpublicforestryagencies,includingresearch,education,trainingandextension.
science and technologyWiththeexceptionofSouthAfricaandsomecountriesinNorthernAfrica,scienceandtechnologydevelopmentintheregionhasbeenrelativelyslow,largelybecauseof:
• lowinvestmentsinscienceeducationandinresearch;• thehighshareofeconomicactivitiesremainingin
theinformaldomain,whichcurbsinteresttoinvestininnovations;
• afailuretodevelopanduseAfrica’sstrongbaseoftraditionalknowledgetodealwithmodernproblems.
Furthermore,researchandsystematicenquirydonottendtobefullymainstreamedindevelopmentplanningandpolicy-making.
However,mobilecommunicationsandtheInternetareimprovingaccesstoinformation.
Theforestsectorreflectsthegeneralsituation.Substantialeffortsarerequiredtorevamptheinstitutionalframeworktostrengthenthescienceandtechnologybaseofforestry.Otherwise,majorbreakthroughsarelikelytobypasstheAfricanforestsectororatbestwillbenefitonlyasmallsegmentofthepopulation.
overAll sCenArioPoliticalandinstitutionaldevelopmentswillhavethegreatestinfluenceontheforestryoutlookandarethemostuncertain(FAO,2003a).Amajortransition–onethatwouldfavourbalancedandequitablenaturalresourcemanagement–woulddependon:improvedefficiencyandaccountabilityinthepublicsector;greaterinclusiveness,competitivenessandtransparencyinmarketinstitutions;andaninformalsector(i.e.arrangementsoutsidethepublicandmarketdomains)thatprovideslivelihoodopportunitiesforthepoor,especiallywherethesearelackingintheformalsector.Whileimprovementsarebeingmadeinthisdirection,substantialeffortswouldbeneededtoeffectarealturnaroundbefore2020.Inmostcases,acontinuationalongthecurrentdevelopmentpath–a“businessasusual”scenario–appearsmorelikely.
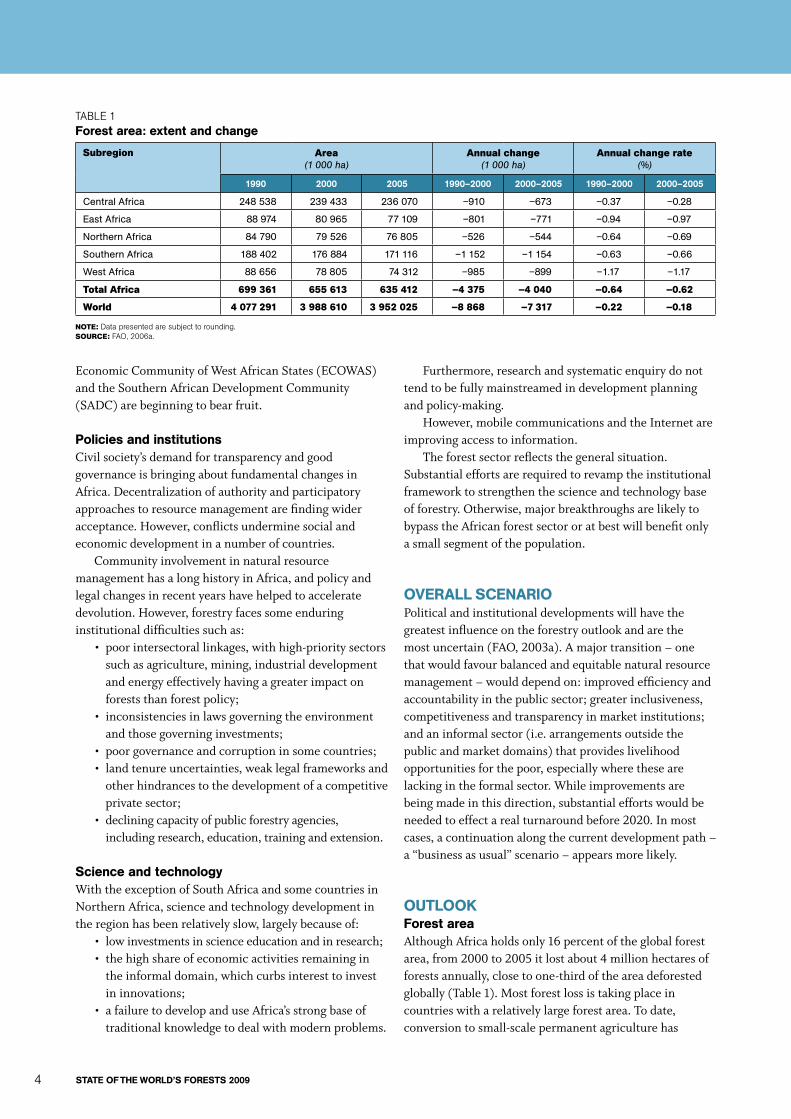
outlookForest areaAlthoughAfricaholdsonly16percentoftheglobalforestarea,from2000to2005itlostabout4millionhectaresofforestsannually,closetoone-thirdoftheareadeforestedglobally(Table1).Mostforestlossistakingplaceincountrieswitharelativelylargeforestarea.Todate,conversiontosmall-scalepermanentagriculturehas
taBle 1Forest area: extent and change
Subregion Area(1 000 ha)
Annual change(1 000 ha)
Annual change rate(%)
1990 2000 2005 1990–2000 2000–2005 1990–2000 2000–2005
Central Africa 248 538 239 433 236 070 –910 –673 –0.37 –0.28
East Africa 88 974 80 965 77 109 –801 –771 –0.94 –0.97
Northern Africa 84 790 79 526 76 805 –526 –544 –0.64 –0.69
Southern Africa 188 402 176 884 171 116 –1 152 –1 154 –0.63 –0.66
West Africa 88 656 78 805 74 312 –985 –899 –1.17 –1.17
total Africa 699 361 655 613 635 412 –4 375 –4 040 –0.64 –0.62
World 4 077 291 3 988 610 3 952 025 –8 868 –7 317 –0.22 –0.18
Note: data presented are subject to rounding.Source: fao, 2006a.

PArt 1 regional outlook 5
Africa
beenthemaincontributortoforestloss(Figure5),butinvestmentinlarge-scaleagriculturecouldbecomeamajordriverofdeforestationinthefuture.
Forestlossislikelytocontinueatcurrentrates.Thegrowingdemandfor,andrisingpriceof,foodandenergywillexacerbatethesituation,especiallyasincreasedinvestmentsininfrastructureopenupnewareas.Climatechangewillalsohaveanimpact.Increasingfrequencyofdroughts,decliningwatersuppliesandfloodsstraincopingmechanismsatthelocalandnationallevelsandundermineeffortstomanageforestssustainably.
Bysubregion,thefollowingpictureislikely:• AnimprovementintheeconomicsituationinNorthern
Africacouldhelptoreducethepressureonlandandreversepasttrendsofforestclearance,particularlyintheSudan.However,externalinvestmentsinlarge-scaleagricultureinresponsetohighfoodpricescouldhaveanegativeimpactonforests.
• InEastandSouthernAfrica,highpopulationdensitiesandhighlanddependencecoupledwithland-useconflictsandlimitedopportunitiesforeconomicdiversificationarelikelytoreduceforestareafurther.
• InCentralAfrica,lowpopulationdensities,largeexpansesoflandandimprovedaccessibilitymayfavourforestclearanceforcommercialandsubsistenceagriculture.Improvedmarketabilityofless-commercialspeciesmayleadtointensive
unsustainablelogging,especiallyinthecontextofweakpoliciesandinstitutions.
• InWestAfrica,rapidlygrowingurbandemandforwoodfuelandincreasingagriculturaldemandislikelytoresultincontinuedreductioninforestcover.
Forest managementNaturalforestscontinuetobethemainsourceofwoodsupplies.TheInternationalTropicalTimberOrganization(ITTO,2006)foundthatonlyabout6percentofthenaturaltropicalproductionforestsinthepermanentforestestateofitstenAfricanmembercountriesweresustainablymanaged.Reduced-impactloggingandharvestingcodesareyettofindwideapplication,andinvestmentinregenerationofloggedareasisminimal.
GlobalconcernaboutsourcingwoodfromsustainablymanagedareasisencouragingtheadoptionofcertificationinAfrica.However,theextentofcertificationremainslowbecauseofthehightransactioncosts(Box2).
Giventhelikelihoodofa“businessasusual”scenario,progressinimplementingsustainableforestmanagementisexpectedtobeslow,primarilybecauseof:
• thegenerallyunfavourableinvestmentclimate;• severeinstitutional,financialandtechnical
constraintshinderingforestryadministrations’abilitytomanageloggingconcessions,whichhaveoftenexpandedsofastthatgovernmentscannotenforcerulesandregulationsandfullyrecoverpotentialincome;
• illegalactivitiesandcorruption;• policiesandinstitutional,technicalandeconomic
hurdleslimitingwideradoptionofcommunity-basedforestmanagement,andatendencytotransferonlydegradedforeststolocalcommunities,whichlacktheinvestmentcapacitytorehabilitatethem.
Alloftheabovefavourunsustainableexploitation.Dependingonhowcommunitycapacityisbuiltup,someprogressinsustainableforestmanagementisexpectedinthesavannahwoodlands,especiallyinEastandSouthernAfrica,althoughitmaybehinderedbylowreturnsfromtheseforests.
Withanestimated14.8millionhectaresofplantedforests(FAO,2006b),Africaaccountsforonlyabout5percentofthe
Of the 306 million hectares of certified forests in the world
(June 2007), Africa accounts for about 3 million hectares
(about 1 percent). Most of Africa’s certified forests are
planted forests, and about half are in South Africa.
Source: itto, 2008.
BoX 2 forest certification in africa
Figure 5 Direct causes of forest area changes in tropical African countries, 1990–2000
direct conversion to small-scale permanent agriculture
direct conversion to large-scale permanent agriculturea
intensification of agriculture in shifting cultivation areas
expansion of shifting cultivation into undisturbed forests
gains in forest area and canopy cover
other
Source: fao, 2001.
4%
8%
59%
12%
8%
9%
a includes livestock and clearing for industrial tree plantations.
stAte oF the World’s Forests 20096
globaltotal.Ofthis,about3millionhectareswereplantedforprotectionandtherestforproductionofwoodandnon-woodforestproducts(e.g.gumarabic).MostofAfrica’swoodisproducedfromnaturalforests;investmentsinplantedforestshaveoccurredmainlyincountrieswithrelativelylowforestcover(Algeria,Morocco,Nigeria,SouthAfricaandtheSudan).AverageannualplantinginAfricafrom1990to2005wasestimatedatabout70000ha,lessthan2percentoftheglobalplantingrate.Inseveralcountries,plantedforestareahasdeclinedinrecentyears.
WiththeexceptionofSouthAfrica,mostplantedforestsareestablishedandmanagedbypublicforestryagencies.Expansionofforestplantingandintensivemanagementforproductionwilllargelydependonplantationprofitabilityasperceivedbytheprivatesector,takingintoaccounttheglobaldemandforwoodproducts.Realizationofthepotentialinsomeofthecountriesrequiressignificantimprovementsinthepolicyandinstitutionalframework,includinglandownership.
Growingdemandforwoodhasencouragedfarmplantinginmostcountries,andtreesoutsideforestshavebecomeanincreasinglyimportantsourceoftimberandfuelwood(Box3).Thistrendisexpectedtointensifyinthecomingyears.Thepotentialoffarmplantingtosupply
industrialroundwoodandtheconstraintsinobtaininglandforlarge-scaleplantedforestshaveencouragedindustriestoenterintopartnershipwithcommunities,forexampleinSouthAfrica.Improvedtenureandsupportivelegislationcouldconsiderablyboosttreeplantingonfarms,asisalreadyhappeninginmanycountries(e.g.Ghana,KenyaandUganda).
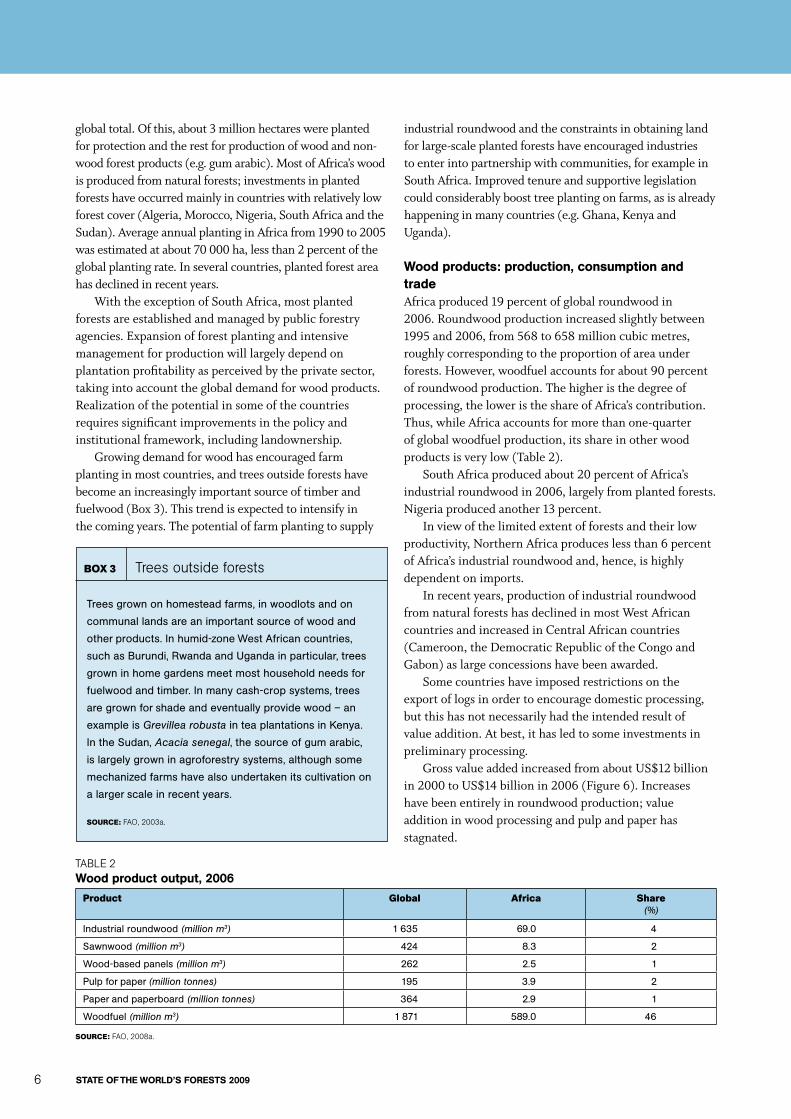
Wood products: production, consumption and tradeAfricaproduced19percentofglobalroundwoodin2006.Roundwoodproductionincreasedslightlybetween1995and2006,from568to658millioncubicmetres,roughlycorrespondingtotheproportionofareaunderforests.However,woodfuelaccountsforabout90percentofroundwoodproduction.Thehigheristhedegreeofprocessing,theloweristheshareofAfrica’scontribution.Thus,whileAfricaaccountsformorethanone-quarterofglobalwoodfuelproduction,itsshareinotherwoodproductsisverylow(Table2).
SouthAfricaproducedabout20percentofAfrica’sindustrialroundwoodin2006,largelyfromplantedforests.Nigeriaproducedanother13percent.
Inviewofthelimitedextentofforestsandtheirlowproductivity,NorthernAfricaproduceslessthan6percentofAfrica’sindustrialroundwoodand,hence,ishighlydependentonimports.
Inrecentyears,productionofindustrialroundwoodfromnaturalforestshasdeclinedinmostWestAfricancountriesandincreasedinCentralAfricancountries(Cameroon,theDemocraticRepublicoftheCongoandGabon)aslargeconcessionshavebeenawarded.
Somecountrieshaveimposedrestrictionsontheexportoflogsinordertoencouragedomesticprocessing,butthishasnotnecessarilyhadtheintendedresultofvalueaddition.Atbest,ithasledtosomeinvestmentsinpreliminaryprocessing.
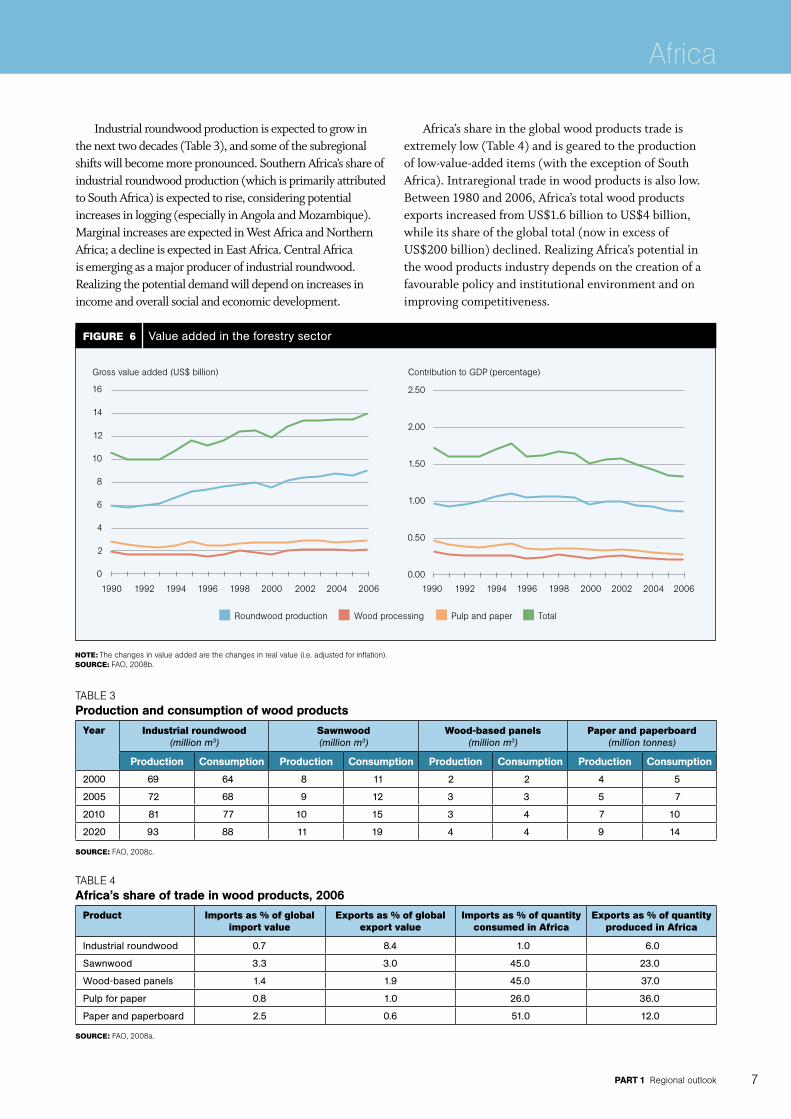
GrossvalueaddedincreasedfromaboutUS$12billionin2000toUS$14billionin2006(Figure6).Increaseshavebeenentirelyinroundwoodproduction;valueadditioninwoodprocessingandpulpandpaperhasstagnated.
Trees grown on homestead farms, in woodlots and on
communal lands are an important source of wood and
other products. In humid-zone West African countries,
such as Burundi, Rwanda and Uganda in particular, trees
grown in home gardens meet most household needs for
fuelwood and timber. In many cash-crop systems, trees
are grown for shade and eventually provide wood – an
example is Grevillea robusta in tea plantations in Kenya.
In the Sudan, Acacia senegal, the source of gum arabic,
is largely grown in agroforestry systems, although some
mechanized farms have also undertaken its cultivation on
a larger scale in recent years.
Source: fao, 2003a.
BoX 3 trees outside forests
taBle 2Wood product output, 2006
Product global Africa Share(%)
Industrial roundwood (million m3) 1 635 69.0 4
Sawnwood (million m3) 424 8.3 2
Wood-based panels (million m3) 262 2.5 1
Pulp for paper (million tonnes) 195 3.9 2
Paper and paperboard (million tonnes) 364 2.9 1
Woodfuel (million m3) 1 871 589.0 46
Source: fao, 2008a.
PArt 1 regional outlook 7
Africa
Industrialroundwoodproductionisexpectedtogrowinthenexttwodecades(Table3),andsomeofthesubregionalshiftswillbecomemorepronounced.SouthernAfrica’sshareofindustrialroundwoodproduction(whichisprimarilyattributedtoSouthAfrica)isexpectedtorise,consideringpotentialincreasesinlogging(especiallyinAngolaandMozambique).MarginalincreasesareexpectedinWestAfricaandNorthernAfrica;adeclineisexpectedinEastAfrica.CentralAfricaisemergingasamajorproducerofindustrialroundwood.Realizingthepotentialdemandwilldependonincreasesinincomeandoverallsocialandeconomicdevelopment.
Africa’sshareintheglobalwoodproductstradeisextremelylow(Table4)andisgearedtotheproductionoflow-value-addeditems(withtheexceptionofSouthAfrica).Intraregionaltradeinwoodproductsisalsolow.Between1980and2006,Africa’stotalwoodproductsexportsincreasedfromUS$1.6billiontoUS$4billion,whileitsshareoftheglobaltotal(nowinexcessofUS$200billion)declined.RealizingAfrica’spotentialinthewoodproductsindustrydependsonthecreationofafavourablepolicyandinstitutionalenvironmentandonimprovingcompetitiveness.
Figure 6 Value added in the forestry sector
gross value added (uS$ billion) contribution to gdP (percentage)
roundwood production Wood processing Pulp and paper total
1990 1992 1994 1996 1998 2000 2002 2004 2006
Note: the changes in value added are the changes in real value (i.e. adjusted for inflation). Source: fao, 2008b.
1990 1992 1994 1996 1998 2000 2002 2004 2006
16
14
12
10
8
6
4
2
0
2.50
2.00
1.50
1.00
0.50
0.00
taBle 3Production and consumption of wood products
Year industrial roundwood(million m3)
Sawnwood(million m3)
Wood-based panels(million m3)
Paper and paperboard(million tonnes)
Production Consumption Production Consumption Production Consumption Production Consumption
2000 69 64 8 11 2 2 4 5
2005 72 68 9 12 3 3 5 7
2010 81 77 10 15 3 4 7 10
2020 93 88 11 19 4 4 9 14
Source: fao, 2008c.
taBle 4Africa’s share of trade in wood products, 2006
Product imports as % of global import value
exports as % of global export value
imports as % of quantity consumed in Africa
exports as % of quantity produced in Africa
Industrial roundwood 0.7 8.4 1.0 6.0
Sawnwood 3.3 3.0 45.0 23.0
Wood-based panels 1.4 1.9 45.0 37.0
Pulp for paper 0.8 1.0 26.0 36.0
Paper and paperboard 2.5 0.6 51.0 12.0
Source: fao, 2008a.

stAte oF the World’s Forests 20098
WoodfuelTraditionalenergysources(mainlybiomass)dominatetheenergysector,especiallyinsub-SaharanAfrica,whereonly7.5percentoftheruralpopulationhasaccesstoelectricity(WorldEnergyCouncil,2005).Ashouseholdincomesandinvestmentinappropriatealternativesremainlow,woodislikelytoremainanimportantenergysourceinAfricainthecomingdecades(FAO,2008d).Forecastsmadein2001suggesteda34-percentincreaseinwoodfuelconsumptionfrom2000to2020(Figure7).However,theriseinfuelpricesinthepasttwoyearssuggeststhatthisincreaseislikelytobeevengreater.Theshareofwoodfuelinthetotalenergysupplyislikelytodecline,buttheabsolutenumberofpeopledependentonwoodenergyispredictedtogrow(FAO,2008d).
Althoughwoodfuelsupplyanddemandarebalancedattheaggregatelevel,thereareareasofacutedeficit,resultinginunsustainableremovals,particularlyaroundurbancentres.Mostcountrieshaveattemptedtoboostsupplythroughimprovedmanagementofforestsandwoodlandsandtheestablishmentofwoodfuelplantations,andtoreducedemandbypromotingmore-efficientcookingdevicesandalternativefuels.
Globalinterestinbiofuelsasaresultofrisingfossilfuelpriceshasincreasedinvestmentsinbiofueldevelopment,forexamplethroughtheplantingofJatrophaspecies.Itisuncertainwhethertheseinvestmentswillprovidealong-termsolutiontoAfrica’senergyproblems,andtherearegrowingconcernsaboutadverseimplicationsforfoodsecurity.
non-wood forest productsAfricanNWFPs(gumsandresins,honeyandbeeswax,dyingandtanningmaterials,bambooandrattan,bushmeat,fodderandaconsiderablenumberofmedicinal
plants)arelargelyusedforsubsistenceandtradedinformally.Thus,theirlivelihoodcontributionandlocalsignificanceexceedthatwhichmaybeapparentfromofficialstatistics(Shackleton,ShanleyandNdoye,2007).
Withincreasedopportunitiesforlocal,regionalandinternationaltrade,theNWFPsectorinAfricaisundergoingperceptiblechanges.AfricangovernmentsareincreasinglydevelopingpoliciesandlegislationaimedatformalizingNWFPvaluechains.Ofparticularsignificanceistheemergenceofmarketsfor“ethnicfoods”,medicinalplantsandnaturalororganicgoods,suchashoney,beeswaxandsheabutter(Box4).Severalproductsthataretradednationallyandinternationallystraddletheinformalandformalsectors.Forexample,collectionfromthewildmayremainintheinformalsector,whileprocessingandtradeareintheformalsector.
Inviewofthewiderangeofproductsandenduses,itisdifficulttomakeawidelyapplicableforecast,buttheoutlookislikelytoinclude:
• subsistenceconsumptionofmostproductswithlittleattentiontomanagementoftheresources;
• overexploitationanddepletionofsomewildresourcescollectedforcommercialproducts;
• furtherpressureonbushmeatresourcesasaresultofincreasedpopulation;
• domesticationandcommercialcultivationandprocessingofasmallnumberofproductsbyentrepreneursorlocalcommunities;
Cosmetics such as oils, creams and dyes represent one
of the fastest-emerging global markets for non-wood
forest products. Shea butter, derived from the fruit of the
shea tree (Butyrospermum parkii or Vitellaria paradoxa)
and commonly known as karité, is one of the most
popular ingredients in skin care today. The shea tree is
found only in Africa’s Sahel belt, and it is estimated that
3 million rural African women are involved in the export of
shea products, which were valued at US$100 million for
2007–2008. In Burkina Faso, karité is the second-largest
export item after cotton, and several projects are focusing
on developing the sector. For example, Burkina Faso’s
Project Karité organizes local women’s associations that
collect and process shea nuts and karité for international
markets. As the women run their own operations, activities
typically comply with “fair trade” conditions. In addition,
most of the small village enterprises supported by
TREE AID in Burkina Faso are based on karité.
SourceS: fao, 2007a; uSaid, 2008.
BoX 4 Shea-butter-based cosmetic products
Figure 7 Woodfuel consumption
Source: fao, 2003b.
900
800
700
600
500
400
300
200
100
0
Million m3
2000 2010 2020
northern africa Southern africa central africa
West africa east africa

PArt 1 regional outlook 9
Africa
• growingdemandfromnichemarketsforcertifiedandfair-tradeproducts(WelfordandLeBreton,2008).
environmental services of forestsUndera“businessasusual”scenario,forestbiodiversitylossislikelytocontinue.EffortstoreversethesituationshouldbuildonthesuccessesofcommunitymanagementinitiativessuchastheCommunalAreasManagementProgrammeforIndigenousResources(CAMPFIRE)inZimbabwe(FrostandBond,2008).Biodiversityconservationalsoneedstobeaddressedoutsideprotectedareasandintegratedintokeyeconomicactivities.
Protectedareascurrentlycoverabout320millionhectares(11percentoftheregion’slandarea),butAfrica’sinvestmentandstaffinginparkmanagementremainthelowestintheworld.Majorchallengestoprotectedareamanagementincludeincreasinghuman–wildlifeconflict(FAO,2008e)andresource-useconflicts,whichoftenworsenintheeventofdrought.InKenya,theUnitedRepublicofTanzaniaandZimbabwe,amongothers,localcommunitiesareinvolvedinmanagingprotectedareasortourismfacilitiesforashareoftheincome.LeasingofprotectedareasformanagementhasnotyettakenholdinAfrica.
ClimatechangewillhavesignificantimpactsonAfricaneconomiesandontheforestsector.TheCleanDevelopmentMechanism(CDM)oftheKyotoProtocolandrecentinitiativesforreducingemissionsfromdeforestationandforestdegradation(REDD)openupnewfundingopportunities.Hitherto,AfricahasnotbenefitedmuchfromtheCDMorvoluntarycarbonmarkets(Box5),suggestingthatvigorouseffortsareneededtoaddresstheinadequatetechnicalcapacityandpolicyandinstitutionalconstraintsiftheregionistobeabletotakeadvantageofREDD.
AcutewaterscarcityaffectsbothruralandurbanareasinseveralAfricancountries,anditisexpectedtoworsenasdemandincreases.Poorwatershedmanagementhasresultedinheavysiltationanddiminishedstoragecapacityinmanyreservoirs.Fragmentedresponsibilitiesandconflictingusesarethemainconstraintsinwatershedmanagement,especiallyfortheseveraltransboundarywatershedsintheregion.Themainchallengesaretoadoptintegratedlanduseandtodevelopinstitutionalarrangementslinkingupstreamlandusersanddownstreamwaterusers.
Interestinamarketapproachforprovisionofwatershedservicesisjustbeginningtogrow.Theregionhasonlytwoprogrammesofpaymentforenvironmentalservices(PES)involvingwatersheds,bothinSouthAfrica,andneitherisstrictlymarket-basedastheydependongeneraltaxrevenue.Severalotherinitiativesareinthe
planningstage.Themainchallengesforsuchschemesareusers’inabilitytopayforwatershedservices,hightransactioncostsandinstitutionaldeficiencies(Dillahaet al.,2007).
DesertificationandlanddegradationaffectmostAfricancountriesandareexpectedtoworsenwithclimatechange,grazingexpansionandincreasingpressuretocultivatemarginallands.Treesplantedinwindbreaksandshelterbeltsprotectagriculturallandandinfrastructure.Addressingdesertificationandlanddegradationrequiresanintegratedapproachtoagriculture,animalhusbandryandforestry–asadoptedinregionalandsubregionalprojectssuchastheGreenWallfortheSaharaInitiative(seeUNU,2007)andtheTerrAfricapartnership(TerrAfrica,2006).AlmostallcountriesintheregionaresignatoriestotheUnitedNationsConventiontoCombatDesertification(UNCCD)andhavedevelopednationalactionplans(oftenwithexternalsupport).However,economicandinstitutionalconstraintslimittheabilityofgovernments,theprivatesectorandcommunitiestoaddressthechallengessystematically.
Nature-basedtourismandemergingprivate-sector-ledandcommunity-basedecotourisminitiatives,primarilycentredonprotectedareas,makeasignificantcontributiontoAfricaneconomies.Therichwildlifeisamajorsourceofincomeandemployment.Africahasconsiderablepotentialtotakeadvantageofgrowthinglobaltourism.However,theoveralltrendofcontinueddeforestationandforestdegradationimpliesadiminishingsupplyofforest-derivedenvironmentalservices.WhetherincreasingawarenessoftheenvironmentalservicesprovidedbyAfricanforestswillinfluencetheirconservationdependsonthecostsinvolved.
•Global total registered Clean Development
Mechanism (CDM) projects to 30 April 2008: 1 068
•CDM projects in Africa: 25 (2.3 percent of the total),
most in South Africa (where institutional capacity is
relatively well developed)
•Approved afforestation/reforestation projects in
Africa: none (in the world: one [in China])
•Africa’s share in voluntary carbon markets: 2 percent
of the volume transacted in 2007, with the highest-
priced credits because of high transaction costs
•Africa’s share in voluntary carbon markets in land
use, land-use change and forestry in 2007: 5 percent
of the global total
Source: hamilton et al., 2008.
BoX 5 carbon markets in africa: an overview
stAte oF the World’s Forests 200910
summAryTheforestsituationinAfricapresentsenormouschallenges,reflectingthelargerconstraintsoflowincome,weakpoliciesandinadequatelydevelopedinstitutions.Successstoriesexistbutremainisolatedbecauseoffundamentaleconomicandinstitutionalweaknesses.Obstaclesinclude:
• highdependenceonlandandnaturalresourcesandscantinvestmentindevelopmentofhumanresources,skillsandinfrastructure;
• thelowlevelofvalueadditionintheeconomy,includingtheforestsector;
• thevastnessoftheinformalsector,stemmingfromtheweaknessesinthepublicsectorandmarketmechanisms.
Focusingontheuniqueproductsandservicesrequiredlocallyandgloballyandstrengtheninglocalinstitutionscanbeimportantwaysofaddressingforestresourcedepletion.Sucheffortsshouldbuildonsuccessfulexperiencewithlocallybasedsustainableresourcemanagementintegratingagriculture,animalhusbandryandforestry,andtakeadvantageoflocalknowledge.Thegrowingdemandforenvironmentalservices–especiallybiodiversityandcarbonsequestration–providesaparticularopportunityforAfrica.

PArt 1 regional outlook 11
Africa

stAte oF the World’s Forests 200912
Africa
Figure 9 Extent of forest resources
ForestOther wooded landOther land cover
East AsiaSouth AsiaSoutheast AsiaOceania
Figure 8 Subregional breakdown used in this report
Note: See annex table 1 for list of countries and areas by subregion.
Asia and the Pacific
t heAsiaandthePacificregion(Figure8),consistingof47countriesandareas,ishometomorethanhalfoftheworld’spopulationandhassomeof
themostdenselypopulatedcountriesintheworld.Ithas18.6percentoftheworld’sforestareainawidearrayofecosystemsincludingtropicalandtemperateforests,coastalmangroves,mountainsanddeserts(Figure9).Rapidsocio-economicchangesintheregionarehavingprofoundimpactsonallsectors,includingforestry.Whilewoodproductsdemandisincreasing,soisthedemandforenvironmentalservicesofforests.
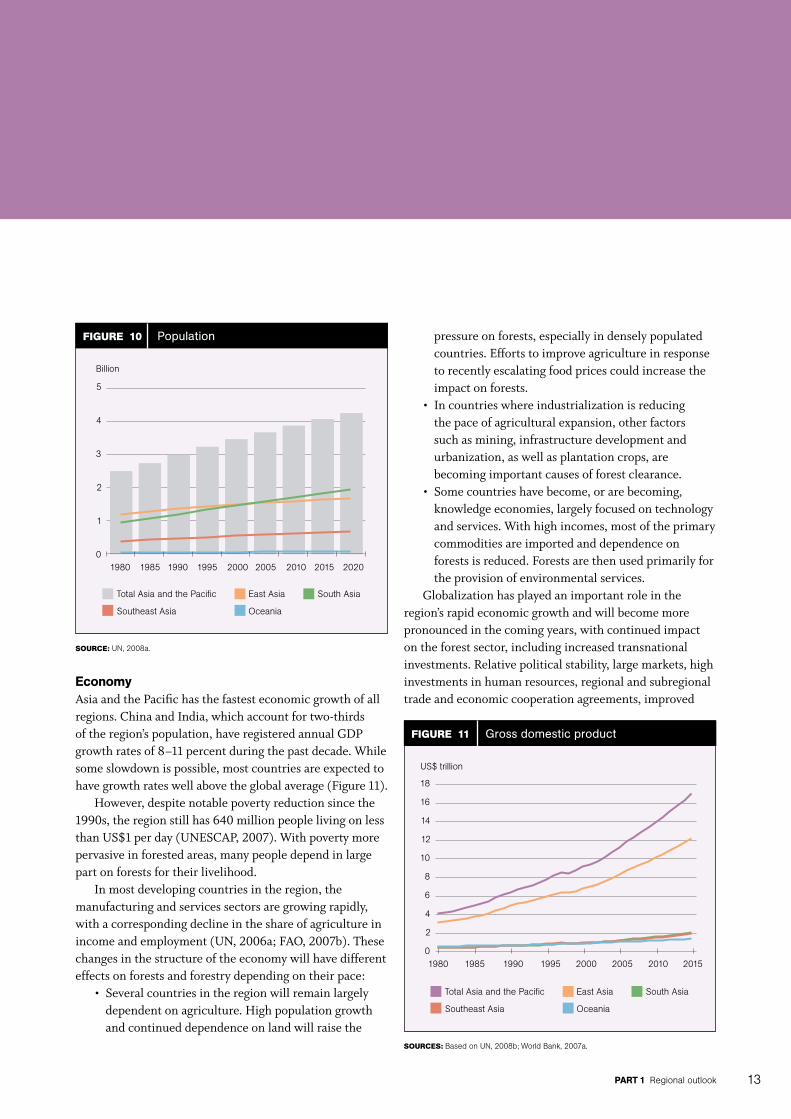
drivers oF ChAngedemographicsThepopulationofAsiaandthePacificisprojectedtoreach4.2billionby2020,anincreaseof600millionfrom2006(Figure10).TheannualpopulationgrowthrateinJapanisclosetozeroanddeclining,butinseveralcountries–particularlylow-incomecountries–thegrowthrateexceeds2percent.
Populationdensityintheregionvariesenormously,fromfewerthan2peoplepersquarekilometreinMongoliatomorethan1000peoplepersquarekilometreinBangladeshandtomorethan6300peoplepersquarekilometreincompletelyurbanSingapore.
TheurbanpopulationinAsiaandthePacificisexpectedtorisefrom38percentin2005to47percentin2020.ItisincreasingespeciallyrapidlyinChina–by2020,China’surbanpopulationisexpectedtohavegrownby230millionanditsruralpopulationtohavedecreasedby122millionrelativeto2005figures.SouthAsia,where65percentofthepopulationisrural,isexpectedtoremaintheleasturbanizedsubregion.
Anotherimportantdemographicchangeistheageingofthepopulation.InAustralia,Japan,Malaysia,NewZealandandThailand,morethan15percentofthepopulationisover65yearsold;inJapan,morethanone-quarterofthepopulationisover60yearsold.Thereductionintheproportionofworking-ageadultsinthesecountries,aswellasinChina(whereastrictpopulationpolicyisimplemented),willhaveimportantimplicationsforproductivityandthedemandforgoodsandservices.
PArt 1 regional outlook 13
Figure 10 Population
total asia and the Pacific east asia South asia
Southeast asia oceania
Source: un, 2008a.
5
4
3
2
1
0
Billion
1980 1985 1990 1995 2000 2005 2010 2015 2020
Figure 11 Gross domestic product
SourceS: Based on un, 2008b; World Bank, 2007a.
18
16
14
12
10
8
6
4
2
0
uS$ trillion
1980 1985 1990 1995 2000 2005 2010 2015
economyAsiaandthePacifichasthefastesteconomicgrowthofallregions.ChinaandIndia,whichaccountfortwo-thirdsoftheregion’spopulation,haveregisteredannualGDPgrowthratesof8–11percentduringthepastdecade.Whilesomeslowdownispossible,mostcountriesareexpectedtohavegrowthrateswellabovetheglobalaverage(Figure11).
However,despitenotablepovertyreductionsincethe1990s,theregionstillhas640millionpeoplelivingonlessthanUS$1perday(UNESCAP,2007).Withpovertymorepervasiveinforestedareas,manypeopledependinlargepartonforestsfortheirlivelihood.
Inmostdevelopingcountriesintheregion,themanufacturingandservicessectorsaregrowingrapidly,withacorrespondingdeclineintheshareofagricultureinincomeandemployment(UN,2006a;FAO,2007b).Thesechangesinthestructureoftheeconomywillhavedifferenteffectsonforestsandforestrydependingontheirpace:
• Severalcountriesintheregionwillremainlargelydependentonagriculture.Highpopulationgrowthandcontinueddependenceonlandwillraisethe
pressureonforests,especiallyindenselypopulatedcountries.Effortstoimproveagricultureinresponsetorecentlyescalatingfoodpricescouldincreasetheimpactonforests.
• Incountrieswhereindustrializationisreducingthepaceofagriculturalexpansion,otherfactorssuchasmining,infrastructuredevelopmentandurbanization,aswellasplantationcrops,arebecomingimportantcausesofforestclearance.
• Somecountrieshavebecome,orarebecoming,knowledgeeconomies,largelyfocusedontechnologyandservices.Withhighincomes,mostoftheprimarycommoditiesareimportedanddependenceonforestsisreduced.Forestsarethenusedprimarilyfortheprovisionofenvironmentalservices.
Globalizationhasplayedanimportantroleintheregion’srapideconomicgrowthandwillbecomemorepronouncedinthecomingyears,withcontinuedimpactontheforestsector,includingincreasedtransnationalinvestments.Relativepoliticalstability,largemarkets,highinvestmentsinhumanresources,regionalandsubregionaltradeandeconomiccooperationagreements,improved
total asia and the Pacific east asia South asia
Southeast asia oceania

stAte oF the World’s Forests 200914
transportationinfrastructureandrapiddevelopmentofinformationandcommunicationtechnologieshaveallpromotedglobalization.
Policies and institutionsImportantchangesunderwayinthepolicyandinstitutionalarenainAsiaandthePacificinclude:
• changesinpoliciesandlegislationenablinggreaterinvolvementofdiversestakeholdersinforestry,especiallythroughprivatizationandcommunityparticipation,includingtherestorationofrightstoindigenouscommunities(Box6);
• improvementintenureconditionsprovidingmoreincentiveforlandownerstogrowtrees;
• increasedcorporateinvestmentsinforestry,oftenthroughpartnerships;
• greaterinvolvementofcivil-societyorganizationsinpolicyformulation,forestmanagement,research,extensionandawarenessgeneration;
• weakeningoftheauthorityofpublicforestryagencies,largelybecauseoftheemergenceofotherplayers.
Governanceproblemsencumbertheforestsectorinsomecountries,oftenthosewiththemostforests.Combatingcorruptionandillegallogginghasbeenafocusofrecentnationalandinternationalefforts(Box7).Conflictsdisruptforestmanagementinseveralcountries,andthesecouldescalateaspressuresonnaturalresourcesincrease,especiallyifeffectiveinstitutionalarrangementsarenotinplacetoresolvethem.
science and technologyTheregionhasbeenattheforefrontofthedevelopmentandadoptionofgreenrevolutiontechnologies,whichhaveslowedorevenreversedthehorizontalexpansionof
agriculture.Technologicaladvanceshaveenhancedtheregion’scompetitivenessinthemanufacturingandservicessectors.Investmentsinbiotechnology,nanotechnology,informationandcommunicationsandalternativeenergytechnologieswillallhaveimportantimpactsonforestry.However,differencesintheadoptionoftechnologieswillpersistamongcountries,sectorsandsubsectors.
overAll sCenArioTheAsiaandthePacificregionisextremelydiverse.Countries,orevenareaswithincountries,arelikelytofollowoneofthreemaindevelopmentpaths.
Intherapidlyemergingindustrialeconomies,continuedindustrializationwillresultinanexpandedmiddleclass.Aconsequentincreaseinthedemandforfood,fuel,fibreandenvironmentalserviceswillexerttremendouspressureonthenatural-resource-richcountriesinandoutsidetheregion.Agriculturalexpansionwillslow;non-agriculturallandusessuchasminingandurbanexpansionmaycontinuetoplacepressureonforests.
Intheagrariansocieties,agriculturewillremainthemainstayoflivelihoodsandmayevenexpandinthecontextofhighpopulationgrowthrates.Increasingglobalandregionaldemandforfood,fuelandfibre,especiallyfromrapidlyindustrializingcountries,couldbeeitheranopportunityorachallengedependingonthestateofgovernanceandinstitutionaldevelopment.
Inthehigh-income,postindustrialsocieties,growthwillbebasedontechnologicallyadvancedmanufacturing
Of the estimated 210 million to 260 million indigenous
people in Asia and the Pacific, about 60 million are
forest-dependent. Many countries have policies and
laws to remedy their marginalization (e.g. Australia, India,
Malaysia, New Zealand, Papua New Guinea and the
Philippines). For example, the Scheduled Tribes and Other
Traditional Forest Dwellers (Recognition of Forest Rights)
Act enacted by India in 2006 recognizes the rights of
traditional forest-dwelling communities, including title over
land that they have been cultivating (up to a maximum of
4 ha per family) and the right to collect and use non-wood
forest products.
Source: asia forest network, 2008.
BoX 6 restoration of rights to indigenous communities
In Asia, multilateral arrangements on forest law
enforcement and governance (FLEG) target explicit
improvements in reducing corruption and illegal
activities in, and associated with, forests and forestry.
The East Asian FLEG process emerged from a series
of multistakeholder consultations in 2001. A ministerial
FLEG meeting held in Bali, Indonesia, in 2001 affirmed
commitments to eliminate illegal logging and associated
illegal trade and corruption. It also developed a
comprehensive list of actions – encompassing political,
legislative, judicial, institutional and administrative actions
as well as associated research, advocacy, information
disclosure and sharing of knowledge and expertise – to be
undertaken nationally and internationally. However, while
the FLEG process has helped to draw attention to forest
governance, it is difficult to ascertain its impacts on the
ground.
BoX 7 forest law enforcement and governance in asia
PArt 1 regional outlook 15
Asia and the Pacific
andtheprovisionofhigh-qualityservices.Populationswillberelativelystable(andinsomecasesdeclining)andtechnicallyskilled.Improvingthequalityoftheenvironmentwillbeamajorconcern,andhighincomewillprovidethenecessarymeanstodoso.
outlookForest areaAsiaandthePacifichad734millionhectaresofforestin2005,about3millionhectaresmorethanin2000(Table5).However,thisincreasewaslargelyaresultofthehighafforestationrateinChina,maskingsignificantlossofnaturalforestsinanumberofcountries;intheregionasawhole,3.7millionhectareswerelostannuallybetween2000and2005.
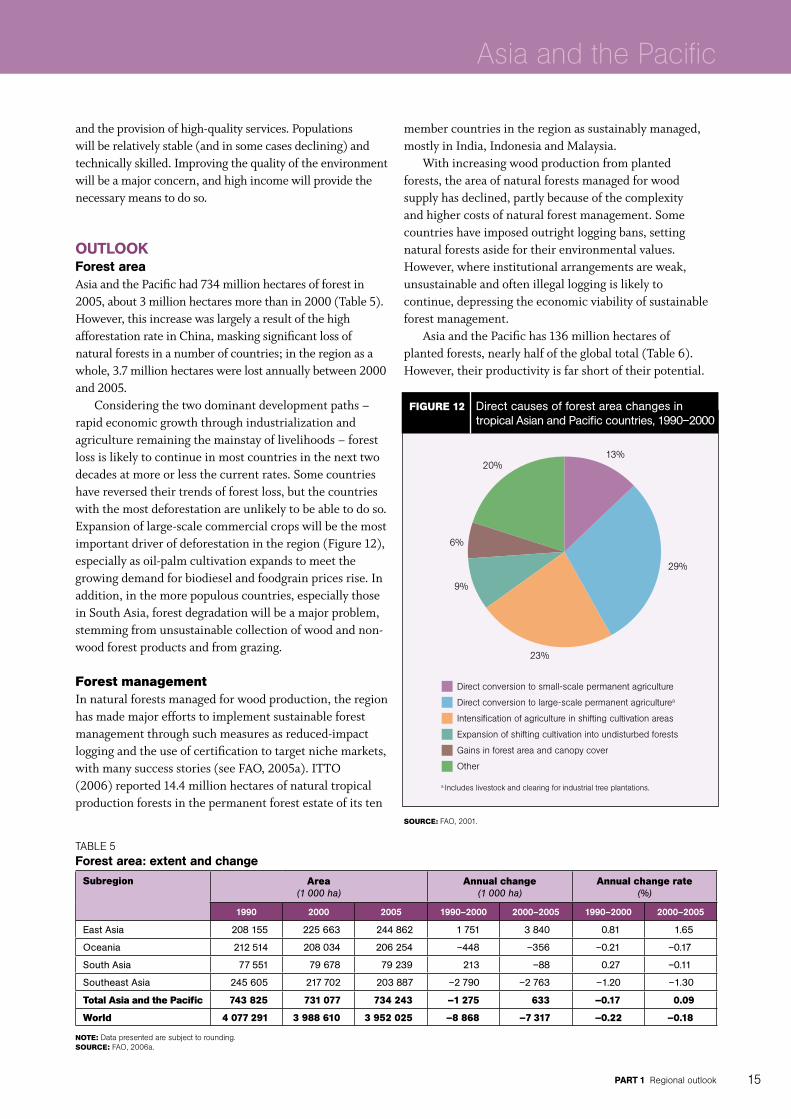
Consideringthetwodominantdevelopmentpaths–rapideconomicgrowththroughindustrializationandagricultureremainingthemainstayoflivelihoods–forestlossislikelytocontinueinmostcountriesinthenexttwodecadesatmoreorlessthecurrentrates.Somecountrieshavereversedtheirtrendsofforestloss,butthecountrieswiththemostdeforestationareunlikelytobeabletodoso.Expansionoflarge-scalecommercialcropswillbethemostimportantdriverofdeforestationintheregion(Figure12),especiallyasoil-palmcultivationexpandstomeetthegrowingdemandforbiodieselandfoodgrainpricesrise.Inaddition,inthemorepopulouscountries,especiallythoseinSouthAsia,forestdegradationwillbeamajorproblem,stemmingfromunsustainablecollectionofwoodandnon-woodforestproductsandfromgrazing.
Forest managementInnaturalforestsmanagedforwoodproduction,theregionhasmademajoreffortstoimplementsustainableforestmanagementthroughsuchmeasuresasreduced-impactloggingandtheuseofcertificationtotargetnichemarkets,withmanysuccessstories(seeFAO,2005a).ITTO(2006)reported14.4millionhectaresofnaturaltropicalproductionforestsinthepermanentforestestateofitsten
membercountriesintheregionassustainablymanaged,mostlyinIndia,IndonesiaandMalaysia.
Withincreasingwoodproductionfromplantedforests,theareaofnaturalforestsmanagedforwoodsupplyhasdeclined,partlybecauseofthecomplexityandhighercostsofnaturalforestmanagement.Somecountrieshaveimposedoutrightloggingbans,settingnaturalforestsasidefortheirenvironmentalvalues.However,whereinstitutionalarrangementsareweak,unsustainableandoftenillegalloggingislikelytocontinue,depressingtheeconomicviabilityofsustainableforestmanagement.
AsiaandthePacifichas136millionhectaresofplantedforests,nearlyhalfoftheglobaltotal(Table6).However,theirproductivityisfarshortoftheirpotential.
taBle 5Forest area: extent and change
Subregion Area(1 000 ha)
Annual change(1 000 ha)
Annual change rate(%)
1990 2000 2005 1990–2000 2000–2005 1990–2000 2000–2005
East Asia 208 155 225 663 244 862 1 751 3 840 0.81 1.65
Oceania 212 514 208 034 206 254 –448 –356 –0.21 –0.17
South Asia 77 551 79 678 79 239 213 –88 0.27 –0.11
Southeast Asia 245 605 217 702 203 887 –2 790 –2 763 –1.20 –1.30
total Asia and the Pacific 743 825 731 077 734 243 –1 275 633 –0.17 0.09
World 4 077 291 3 988 610 3 952 025 –8 868 –7 317 –0.22 –0.18
Note: data presented are subject to rounding.Source: fao, 2006a.
29%
Figure 12 Direct causes of forest area changes in tropical Asian and Pacific countries, 1990–2000
direct conversion to small-scale permanent agriculture
direct conversion to large-scale permanent agriculturea
intensification of agriculture in shifting cultivation areas
expansion of shifting cultivation into undisturbed forests
gains in forest area and canopy cover
other
Source: fao, 2001.
13%20%
23%
9%
6%
a includes livestock and clearing for industrial tree plantations.

stAte oF the World’s Forests 200916
MostoftheplantedforestsareinAustralia,China,India,Indonesia,NewZealand,thePhilippines,ThailandandVietNam.Investmentsinplantedforests,especiallybytheprivatesector,haveincreasedinthepasttwodecades.Asmoreofthenaturalforestsareexcludedfromproduction,plantedforestsarebecomingthemainstayofwoodproductionintheregion.Therehasalsobeensubstantialinvestmentinplantingforprotectivepurposes;almostone-thirdoftheplantedforestsintheregionhavebeenestablishedforenvironmentalprotection,mostlyinChinaandIndia(FAO, 2006b).
However,thescopeforexpansionofplantedforestsforproductionislimited,especiallywithcurrentwoodprices.Wateravailabilityisalreadyamajorconstraintandwillbemoreproblematicinthefuture.Thecostsofproductivelandaresteep,inflatedbyhighagriculturalpricesanddemandforbiofuelfeedstocks.Althoughmarginallandisextensivelyavailable,itrequireshighinvestments.Thus,futurewoodsupplywilldependonimprovingtheproductivityofexistingplantedforestsandonencouragingfarmforestryasanimportantsourceofwood,includingforlarge-scaleindustrialprocessing(Box8).
Wood products: production, consumption and tradeRegionally,largeincreasesinindustrialroundwoodconsumptionandproductionareprojectedto2020(Table7).China,Indiaandotheremergingeconomieswillaccountformuchofthegrowthinconsumption.Trendsinindustrialroundwoodimportsareincontrastingdirections.Netimportstotheadvancedindustrializedeconomies(especiallyJapan)have
declined,whilethosetotheemergingeconomies(ChinaandIndia)havegreatlyincreasedasaresultofsurgingdomesticdemandanddeclinesindomesticsupplycausedbyloggingbans.
Growthindemandforwoodproducts(Figure13)willlargelybeacontinuationofrecenttrendsandwillbesimilartotheglobaloutlook(seePart2),withsubstantialexpansionexpectedintheconsumptionofwood-basedpanelsandpaperandpaperboard,andmoremodestgrowthinsawnwoodconsumption.Sawnwoodandplywoodwillcontinuetoaccountformostoftheconsumptionofsolidwoodproducts,althoughsomesubstitutionof
taBle 6Planted forest area change
Year extent of planted forestsglobal total Annual change in
Asia and the PacificProductive Protective total
(million ha)
1990 67 36 103 209 –
2000 78 41 119 247 1.4
2005 90 46 136 271 2.8
Source: fao, 2006b.
taBle 7Production and consumption of wood products
Year industrial roundwood (million m3)
Sawnwood (million m3)
Wood-based panels (million m3)
Paper and paperboard (million tonnes)
Production Consumption Production Consumption Production Consumption Production Consumption
2005 273 316 71 84 81 79 121 128
2020 439 498 83 97 160 161 227 234
2030 500 563 97 113 231 236 324 329
Source: fao, 2008c.
Trees are an integral part of homestead farming systems
in many Asian countries, particularly Bangladesh,
Indonesia, the Philippines, Sri Lanka and certain parts of
India. Past investments in social or community forestry
have helped to make farms important sources of wood
supply. Several industries have established partnership
arrangements with farmers to source wood supplies from
farms. Farm forestry is expected to continue to expand as
a result of:
•improving security of land tenure;
•declining profitability of agriculture, which
encourages farmers to invest in forest crops (which
are less labour-intensive than agriculture);
•increasing demand for wood products and
consequent increases in their prices, making farm
forestry more profitable.
BoX 8 farm forestry

PArt 1 regional outlook 17
Asia and the Pacific
reconstitutedpanelsforsawnwoodandplywoodisexpected.Consumptionofpaperandpaperboardisexpectedtogrowmarkedly,andrecoveredpaperandwoodproducedinplantedforestsoffast-growingspecieswillprovidemostofthefibreusedintheirproduction.
Rapideconomicgrowthhasboostedtheregion’sshareintheglobaltradeinwoodproducts,especiallyinthepasttwodecades.Risingprosperitygenerallyimplieshigherdisposableincome,increasingthedemandforproductsandconsequentlyimports(Figure14).Chinaaccountsforalargepartofthegrowthintrade;itstotalwoodproductsimportsrosefromUS$5.4billionin1990toUS$20.6billionin2006.India’swoodproductsimportshavealsoincreasednotably,fromaboutUS$587millionin1990toUS$2.4billionin2006.China’srecoveredpaperimports(mainlyfromtheUnitedStatesofAmerica)grewfrom5milliontonnesin2000to16.7milliontonnesin2006.
Theregionisalsobecominganimportantexporterofwoodproducts,withanincreasingshareofhigh-valueproducts.MostremarkableistheemergenceofChinaastheleadingglobalexporteroffurniture,overtakingsomeofthetraditionalfurnitureproducersinEurope.Since2005,VietNamhasalsoemergedasamainexporterofwoodenfurniture.
Thetrendsindemandandtradehaveseveralinterestingimplicationsforthefutureofforestsintheregion:
• Theboomindemandcreatesopportunitiesforforestedcountries,butalsochallengesforsustainableforestmanagementandcontrolofillegallogging,
especiallyincountrieswithweakinstitutionsandpoorgovernance.
• Growthintrademayhaveimpactsonforestmanagementoutsidetheregion.
• Someofthedemandmaybemetthroughimprovementsinefficiency.
WoodfuelAlmostthree-quartersofthewoodproducedinAsiaandthePacificisburnedasfuel.InSouthandSoutheastAsia,woodfuel’sshareintotalwoodproductionis93and72percent,respectively.Incontrast,woodfuelaccountsforlessthan1percentofthewoodproducedinJapan.
Woodfuelconsumptionintheregiondeclinedbetween1980and2006fromabout894millionto794millioncubicmetres.SouthAsiawastheonlysubregionthatregisteredanincrease.
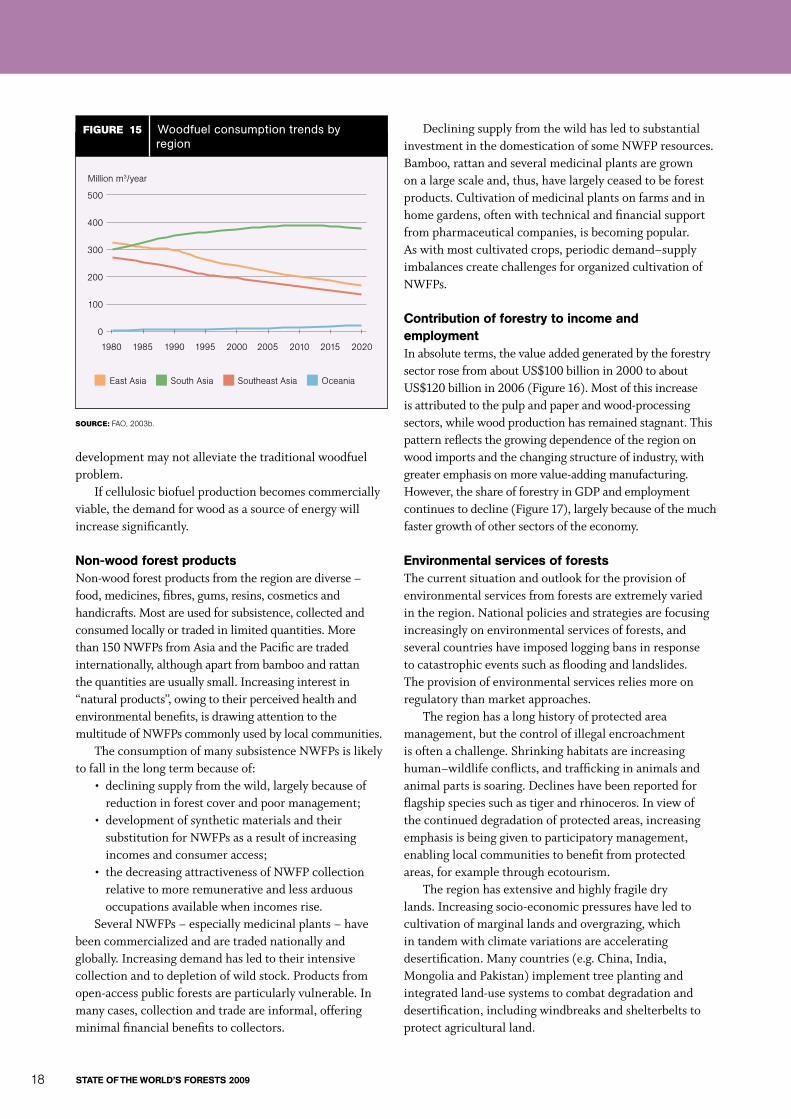
Asincomesandurbanizationincrease,woodfuelwillbesubstitutedwithelectricity,keroseneandgas.ThisisalreadyevidentinmostofAsiaandthePacific,althoughtherearesomedifferencesinthepredictedtrendsamongsubregions(Figure15).Forexample,SouthAsianwoodfuelconsumptionisexpectedtogrowandthenstarttodeclinefromaround2015.However,risingfossilfuelpricescouldleadtoadifferentscenario,andthepredictedfuelswitchingmaynottakeplace.Insomecases,therecouldbeashiftbacktowoodfuel,withconsequencesofincreasedcollectionandforestdegradation.
Recentoilpriceincreaseshavealreadyledtosubstantialpublicandprivateinvestmentsinbiofuelproduction.Oil-yieldingspeciessuchasJatropha curcasarebeingplantedondegradedlandforbiodieselproduction.Asbiodieselismainlyusedonlyintransportation,this
Figure 13 Raw material demand
Source: fao, 2008c.
2 000
1 800
1 600
1 400
1 200
1 000
800
600
400
200
0
Million m3 wood raw-material equivalent
1980 1985 1990 1995 2000 2005 2010 2015 2020 2025 2030
Paper and paperboard
net wood pulp exports (net exporters only)
Particleboard and fibreboard
Sawnwood and plywood
other industrial roundwood
Figure 14 Wood products imports
asia and the Pacific other regions
Source: fao, 2008a.
400
350
300
250
200
150
100
50
0
uS$ billion
1965 1970 1975 1980 1985 1990 1995 2000 2005
stAte oF the World’s Forests 200918
developmentmaynotalleviatethetraditionalwoodfuelproblem.
Ifcellulosicbiofuelproductionbecomescommerciallyviable,thedemandforwoodasasourceofenergywillincreasesignificantly.
non-wood forest productsNon-woodforestproductsfromtheregionarediverse–food,medicines,fibres,gums,resins,cosmeticsandhandicrafts.Mostareusedforsubsistence,collectedandconsumedlocallyortradedinlimitedquantities.Morethan150NWFPsfromAsiaandthePacificaretradedinternationally,althoughapartfrombambooandrattanthequantitiesareusuallysmall.Increasinginterestin“naturalproducts”,owingtotheirperceivedhealthandenvironmentalbenefits,isdrawingattentiontothemultitudeofNWFPscommonlyusedbylocalcommunities.
TheconsumptionofmanysubsistenceNWFPsislikelytofallinthelongterm becauseof:
• decliningsupplyfromthewild,largelybecauseofreductioninforestcoverandpoormanagement;
• developmentofsyntheticmaterialsandtheirsubstitutionforNWFPsasaresultofincreasingincomesandconsumeraccess;
• thedecreasingattractivenessofNWFPcollectionrelativetomoreremunerativeandlessarduousoccupationsavailablewhenincomesrise.
SeveralNWFPs–especiallymedicinalplants–havebeencommercializedandaretradednationallyandglobally.Increasingdemandhasledtotheirintensivecollectionandtodepletionofwildstock.Productsfromopen-accesspublicforestsareparticularlyvulnerable.Inmanycases,collectionandtradeareinformal,offeringminimalfinancialbenefitstocollectors.
DecliningsupplyfromthewildhasledtosubstantialinvestmentinthedomesticationofsomeNWFPresources.Bamboo,rattanandseveralmedicinalplantsaregrownonalargescaleand,thus,havelargelyceasedtobeforestproducts.Cultivationofmedicinalplantsonfarmsandinhomegardens,oftenwithtechnicalandfinancialsupportfrompharmaceuticalcompanies,isbecomingpopular.Aswithmostcultivatedcrops,periodicdemand–supplyimbalancescreatechallengesfororganizedcultivationofNWFPs.
Contribution of forestry to income and employmentInabsoluteterms,thevalueaddedgeneratedbytheforestrysectorrosefromaboutUS$100billionin2000toaboutUS$120billionin2006(Figure16).Mostofthisincreaseisattributedtothepulpandpaperandwood-processingsectors,whilewoodproductionhasremainedstagnant.Thispatternreflectsthegrowingdependenceoftheregiononwoodimportsandthechangingstructureofindustry,withgreateremphasisonmorevalue-addingmanufacturing.However,theshareofforestryinGDPandemploymentcontinuestodecline(Figure17),largelybecauseofthemuchfastergrowthofothersectorsoftheeconomy.
environmental services of forestsThecurrentsituationandoutlookfortheprovisionofenvironmentalservicesfromforestsareextremelyvariedintheregion.Nationalpoliciesandstrategiesarefocusingincreasinglyonenvironmentalservicesofforests,andseveralcountrieshaveimposedloggingbansinresponsetocatastrophiceventssuchasfloodingandlandslides.Theprovisionofenvironmentalservicesreliesmoreonregulatorythanmarketapproaches.
Theregionhasalonghistoryofprotectedareamanagement,butthecontrolofillegalencroachmentisoftenachallenge.Shrinkinghabitatsareincreasinghuman–wildlifeconflicts,andtraffickinginanimalsandanimalpartsissoaring.Declineshavebeenreportedforflagshipspeciessuchastigerandrhinoceros.Inviewofthecontinueddegradationofprotectedareas,increasingemphasisisbeinggiventoparticipatorymanagement,enablinglocalcommunitiestobenefitfromprotectedareas,forexamplethroughecotourism.
Theregionhasextensiveandhighlyfragiledrylands.Increasingsocio-economicpressureshaveledtocultivationofmarginallandsandovergrazing,whichintandemwithclimatevariationsareacceleratingdesertification.Manycountries(e.g.China,India,MongoliaandPakistan)implementtreeplantingandintegratedland-usesystemstocombatdegradationanddesertification,includingwindbreaksandshelterbeltstoprotectagriculturalland.
Figure 15 Woodfuel consumption trends by region
east asia South asia Southeast asia oceania
Source: fao, 2003b.
500
400
300
200
100
0
Million m3/year
1980 1985 1990 1995 2000 2005 2010 2015 2020

PArt 1 regional outlook 19
Asia and the Pacific
Reducingtheregion’shighrateofdeforestationandforestdegradationholdspotentialformitigatingclimatechange;muchhopeispinnedonthefutureofREDDinitiativesunderdiscussioninthecontextoftheUnitedNationsFrameworkConventiononClimateChange(UNFCCC).
Waterscarcityiscriticalinsomecountries(especiallyAustralia,China,India,MongoliaandPakistan),affectingkeysectorsincludingagricultureandindustry.Thecontinuedgrowthofmosteconomieswilldependonasustainedsupplyoffreshwater.Publicfunding
forwatershedmanagementhasreceivedconsiderableattention,butmarketapproachesarealsobeingadopted,althoughmostarestillinthepilotstageofimplementation(Dillahaet al.,2007).
Tourismingeneral,andecotourisminparticular,isoneofthefastest-growingsectorsinAsiaandthePacific,especiallyinviewoftherapidgrowthinincomes.Mostcountrieshavedevelopednationalpoliciesandstrategiestopromoteecotourismforitspotentialtorevitalizelocaleconomiesandprotectandmanagerurallandscapes,
Figure 16 Value added in the forestry sector
gross value added (uS$ billion) contribution to gdP (percentage)
roundwood production Wood processing Pulp and paper total
1990 1992 1994 1996 1998 2000 2002 2004 2006
Note: the changes in value added are the changes in real value (i.e. adjusted for inflation). Source: fao, 2008b.
1990 1992 1994 1996 1998 2000 2002 2004 2006
140
120
100
80
60
40
20
0
1.75
1.50
1.25
1.00
0.75
0.50
0.25
0.00
Figure 17 Employment in the formal forestry sector
number employed (million) contribution to employment (percentage)
roundwood production Wood processing Pulp and paper total
1990 1992 1994 1996 1998 2000 2002 2004 2006
Source: fao, 2008b.
1990 1992 1994 1996 1998 2000 2002 2004 2006
10
9
8
7
6
5
4
3
2
1
0
0.50
0.45
0.40
0.35
0.30
0.25
0.20
0.15
0.10
0.05
0.00

stAte oF the World’s Forests 200920
includingforests(Box9).Themainchallengesarisingfromthegrowingdemandforecotourismarepreventingenvironmentaldegradationandenhancingtheincomeaccruingtolocalcommunities,thusprovidingthemwithincentivestoprotectandmanagenaturalassets.
Provisionofmostofthenecessaryenvironmentalservicesdependsonarrestingdeforestationandforestdegradation.Consideringthethreebroaddevelopmentpaths,theoveralloutlookforenvironmentalservicesisasfollows:
• Inthepostindustrialsocieties–withwell-developedinstitutions,decliningpressureonlandandastrongwilltomaintainenvironmentalquality–environmentalprotectionhasalreadyreceived,andwillcontinuetoreceive,substantialattention.
• Thesituationintheemergingindustrialeconomieswillbemorevaried.Althoughagrowingenvironmentallyconscioussegmentofthepopulationwillspearheadenvironmentalprotectioninitiatives,continuedpressuresofindustrializationandtheneedsofmarginalizedpeoplewillstraintheenvironment,particularlyincountrieswithhighpopulationdensities.
• Inlow-incomeforest-richcountries–whichwillneedtocatertothedemandforwoodproducts,energyandindustrialrawmaterialfromtherapidlygrowingeconomies,andtothedemandforlandfromtheexpandingagriculturalpopulation–environmentalprotectionisunlikelytoreceivemuchattention.Thesesocietiesarelesslikelytobewillingorabletopayforimprovingormaintainingenvironmentalservices.
summAryConsideringthegreatdiversityoftheregion,avariedscenarioisexpectedtounfold.Whileforestareawillstabilizeandincreaseinmostofthedevelopedcountriesandsomeoftheemergingeconomies,mostofthelow-andmiddle-incomeforest-richcountrieswillwitnesscontinuingdeclineowingtoexpansionofagriculture(includingtheproductionofbiofuelfeedstock).Bothtraditionalwoodfuelandemergingbioenergyoptionswillposeenormousland-usechallenges.Therapidindustrializationoftheemergingeconomieswillcreategreatdemandforprimarycommodities,whichislikelytoresultinforestconversionintheremainingcountries.
Demandforwoodproductswillcontinuetoriseinlinewiththegrowthinpopulationandincome.Whiletheregionisattheforefrontofplantationforestry,itsdependenceonwoodfromotherregionswillcontinueintheforeseeablefuture.Overall,theregion–especiallysomeofthemostpopulouscountries–facesseverelandandwaterconstraintsthatmaylimitthescopeforself-sufficiencyinwoodproducts.
Thedemandforforestenvironmentalserviceswillincreaseasincomesrise.Conservationinvolvinglocalcommunitieswillreceivegreateremphasis.Itremainstobeseenhowthepost-2012climatechangearrangementsevolveandwhetherinitiativessuchasREDDwillactuallyprovidesufficientincentivestorefrainfromforestclearanceandotherunsustainableuses.
The tourism industry is an important source of revenue
for many countries in Asia and the Pacific, with revenues
expected to top US$4.6 trillion by 2010 and tourist
arrivals growing at around 6 percent annually. China,
the Lao People’s Democratic Republic and Viet Nam
are among the ten countries with the fastest-growing
tourism sectors in the world. Ecotourism is becoming
more popular as local and international travellers
demand nature-based experiences that conserve
the environment and generate revenue for local
communities. In some countries, such as China and
Indonesia, ecotourism is now an official conservation
strategy. The region has more than 20 national and
regional ecotourism associations.
SourceS: Pata, 2008; tieS, 2007; unWto, 2008.
BoX 9 ecotourism development in asia and the Pacific

PArt 1 regional outlook 21
Asia and the Pacific
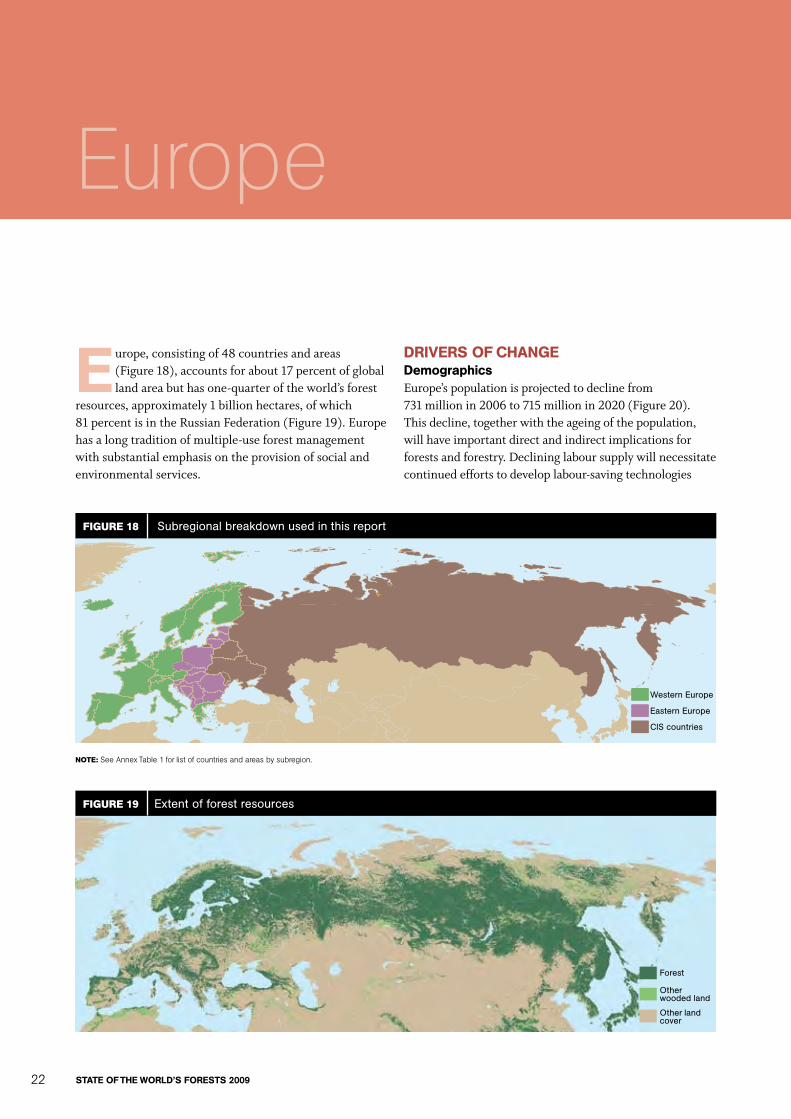
stAte oF the World’s Forests 200922
Africa
europe,consistingof48countriesandareas(Figure18),accountsforabout17percentofgloballandareabuthasone-quarteroftheworld’sforest
resources,approximately1billionhectares,ofwhich81percentisintheRussianFederation(Figure19).Europehasalongtraditionofmultiple-useforestmanagementwithsubstantialemphasisontheprovisionofsocialandenvironmentalservices.
drivers oF ChAngedemographicsEurope’spopulationisprojectedtodeclinefrom731millionin2006to715millionin2020(Figure20).Thisdecline,togetherwiththeageingofthepopulation,willhaveimportantdirectandindirectimplicationsforforestsandforestry.Declininglaboursupplywillnecessitatecontinuedeffortstodeveloplabour-savingtechnologies
Europe
Figure 19 Extent of forest resources
Forest
Other wooded land
Other land cover
Figure 18 Subregional breakdown used in this report
Western Europe
Eastern Europe
CIS countries
Note: See annex table 1 for list of countries and areas by subregion.
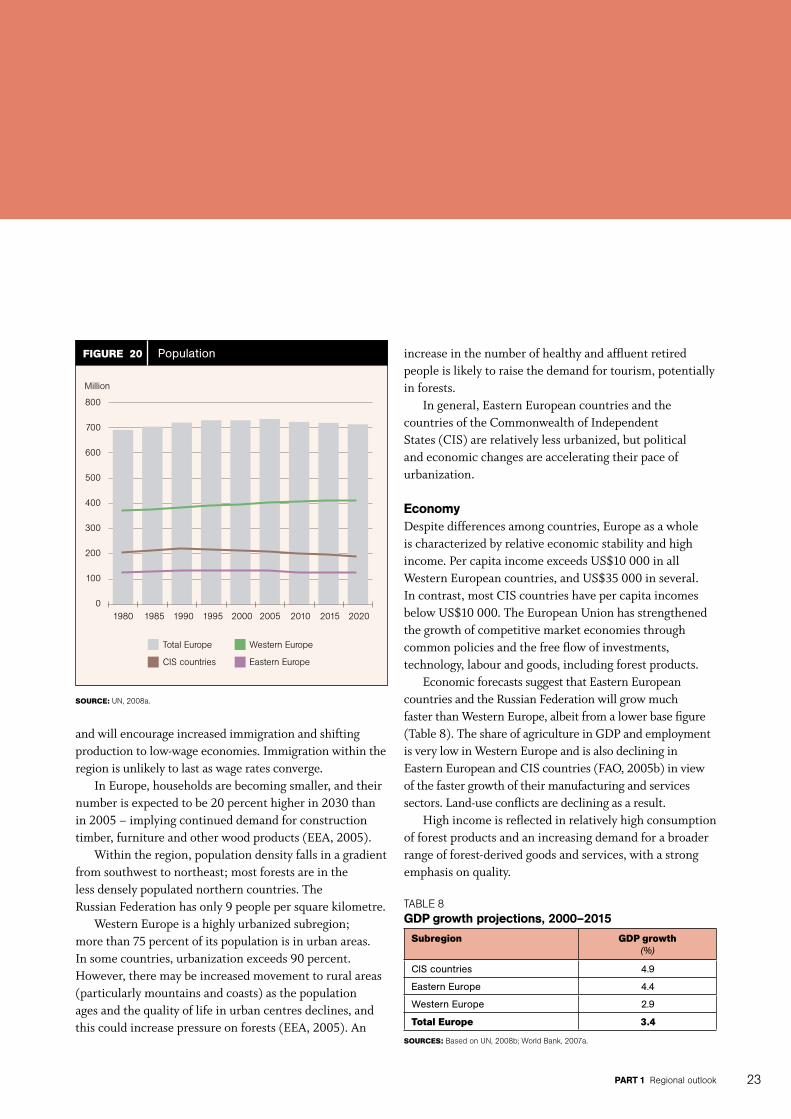
PArt 1 regional outlook 23
andwillencourageincreasedimmigrationandshiftingproductiontolow-wageeconomies.Immigrationwithintheregionisunlikelytolastaswageratesconverge.
InEurope,householdsarebecomingsmaller,andtheirnumberisexpectedtobe20percenthigherin2030thanin2005–implyingcontinueddemandforconstructiontimber,furnitureandotherwoodproducts(EEA,2005).
Withintheregion,populationdensityfallsinagradientfromsouthwesttonortheast;mostforestsareinthelessdenselypopulatednortherncountries.TheRussianFederationhasonly9peoplepersquarekilometre.
WesternEuropeisahighlyurbanizedsubregion;morethan75percentofitspopulationisinurbanareas.Insomecountries,urbanizationexceeds90percent.However,theremaybeincreasedmovementtoruralareas(particularlymountainsandcoasts)asthepopulationagesandthequalityoflifeinurbancentresdeclines,andthiscouldincreasepressureonforests(EEA,2005).An
increaseinthenumberofhealthyandaffluentretiredpeopleislikelytoraisethedemandfortourism,potentiallyinforests.
Ingeneral,EasternEuropeancountriesandthecountriesoftheCommonwealthofIndependentStates(CIS)arerelativelylessurbanized,butpoliticalandeconomicchangesareacceleratingtheirpaceofurbanization.
economyDespitedifferencesamongcountries,Europeasawholeischaracterizedbyrelativeeconomicstabilityandhighincome.PercapitaincomeexceedsUS$10000inallWesternEuropeancountries,andUS$35000inseveral.Incontrast,mostCIScountrieshavepercapitaincomesbelowUS$10000.TheEuropeanUnionhasstrengthenedthegrowthofcompetitivemarketeconomiesthroughcommonpoliciesandthefreeflowofinvestments,technology,labourandgoods,includingforestproducts.
EconomicforecastssuggestthatEasternEuropeancountriesandtheRussianFederationwillgrowmuchfasterthanWesternEurope,albeitfromalowerbasefigure(Table8).TheshareofagricultureinGDPandemploymentisverylowinWesternEuropeandisalsodeclininginEasternEuropeanandCIScountries(FAO,2005b)inviewofthefastergrowthoftheirmanufacturingandservicessectors.Land-useconflictsaredecliningasaresult.
Highincomeisreflectedinrelativelyhighconsumptionofforestproductsandanincreasingdemandforabroaderrangeofforest-derivedgoodsandservices,withastrongemphasisonquality.
Figure 20 Population
Source: un, 2008a.
800
700
600
500
400
300
200
100
0
Million
1980 1985 1990 1995 2000 2005 2010 2015 2020
taBle 8gdP growth projections, 2000–2015
Subregion gDP growth (%)
CIS countries 4.9
Eastern Europe 4.4
Western Europe 2.9
total europe 3.4
SourceS: Based on un, 2008b; World Bank, 2007a.
total europe Western europe
ciS countries eastern europe

stAte oF the World’s Forests 200924
Policies and institutionsEuropehasastrongoverallpoliticalandinstitutionalenvironmentandfavourableinvestmentclimate.Well-developedpoliticalsystemshavehelpedinestablishingequilibriumbetweenglobalizationandlocalization.Civil-societyorganizationsarewelldeveloped,andpublic,privateandcivil-societyorganizationsgenerallymeetonalevelplayingfield.Forestpoliciesarelargelydevelopedthroughconsultativeprocesses.
TheenlargementoftheEuropeanUnionandthegrowingroleoftheEuropeanParliamentindevelopingcommonstrategiesincriticalareashavefosteredpoliticalandinstitutionalstrengtheningformanycountriesintheregion.ThemainchallengefortheEuropeanUnionistobalancethedifferentaspirationsofitsmembercountrieswithinacommoneconomicandpoliticalframework.
ForestryisarelativelyminoreconomicactivityinmostEuropeancountries,hencetheimpactofpoliciesinothersectors(agriculture,energy,industry,environmentandtrade)ontheforestsector,orthecontributionthattheforestsectorcouldmaketotheothers,isnotalwaystakenintoconsideration.
RegionalinitiativessuchastheMinisterialConferenceontheProtectionofForestsinEurope(MCPFE)andtheEuropeanCommission’sEuropeanForestryStrategyprovideeffectivecoordinationinforestry.
science and technologyEuropeisadvancedinscienceandtechnologydevelopment,alargeshareofwhichisdirectlyfocusedonEurope’smostimportantsourceofincome:high-technologymanufacturing.MostWesternEuropeancountrieshavearesearchanddevelopment(R&D)outlayofmorethan2percentofGDP(EuropeanCommission,2007).AlthoughtheshareofagricultureandforestryintheR&Dbudgetislow,thesefieldsbenefitfromtechnologydevelopmentsinothersectors,especiallyintermsofimprovingindustrypracticesandenhancinglabourproductivity.Remotesensing,informationandcommunicationstechnologyandimprovedprocessingtechnologieshaveallbenefitedtheforestsector.Futuretechnologicalchangesintheforestsectorwillbedrivenby:
• growingconcernaboutclimatechange;• theneedtoimproveenergyefficiencyandreduce
capitalintensity;• thedesireformoresustainableforestmanagement
andmoreefficientuseofforestresources,includingrecycling,reuseandconversionintobioenegy;
• focusoncustomersatisfactionandhigh-qualitynichemarkets(Houllieret al.,2005).
TheEuropeanforestproductssectorwillneedtodevelopanewrangeofhigh-value-addedproductstomeettheincreasingdemandfor“greenmaterials”and
“greenenergy”,toconfrontincreasingcompetitionfromalternativematerialsandelectronicmedia,andtocompetewithcountriesthathavelowerraw-material,energyandlabourcosts(CEI-Bois,CEPFandCEPI,2005).
overAll sCenArioAlthoughtherearedifferencesamongthesubregions,Europegenerallypresentsafavourablesituationintermsofsocialandeconomicdevelopment.Diminishingdemographicpressures,moderateeconomicgrowth,well-developedpoliticalandinstitutionalarrangements,growingconcernforprotectionoftheenvironmentandespeciallyforclimatechange,andhighinvestmentsinscienceandtechnologyarefacilitatingthetransitiontoaknowledge-basedpostindustrial“green”economybuiltonthesustainableandequitableuseofresources.Thistransitionwilltakeplaceatdifferentspeedsinthevariouscountries.
Wherethereisstrongpoliticalcommitmenttoinvestingreentechnologiesandstrengthenknowledgeandskills,thetransitionwillberapid.However,incountrieswithlowerincomes,environmentandsustainabilityissueswillbealowpriorityandthetransitiontoapostindustrialsocietywillbeslower.Inmanycases,industrieswillmovetocountrieswhereproductioncostsarelow(andenvironmentalregulationsarelax).Investmentswillcontinuetofocusonimprovingcompetitivenessinthetraditionalsense,andunsustainableuseofforestscouldcontinue.
outlookForest areaEuropehasarelativelyhighproportionofitslandareaunderforest(secondonlytoLatinAmericaandtheCaribbean),whichhasconsistentlyincreasedinrecentyears(Table9).GrowingstockperhectareisslightlylowerthantheglobalaveragebutishighinsomeWesternEuropeancountries(e.g.AustriaandSwitzerland)andinEasternEurope,where,untilrecently,harvestinghasbeenmodestandsilviculturalpracticeshavefavouredhighstockaccumulation.
ThedistinctionbetweennaturalandplantedforestsislessclearforEuropethanforotherregionsbecausemuchoftheoriginalforestcoverwasremovedhundredsofyearsago.Muchoftheregion’sincreasingforestareareflectsnaturalexpansionofforestsintoformeragriculturallandandtheestablishmentofsemi-naturalplantedforestsusingnativespecies.
Continuedtransitiontoapostindustrialsocietyisexpectedtoreducepressureonforests,especiallyinWesternEurope.Decliningpopulation,lowland

PArt 1 regional outlook 25
Europe
dependence,highincome,concernforprotectionoftheenvironmentandawell-developedpolicyandinstitutionalframeworkallfavourfurtherexpansionofforestarea.AlmostallEuropeancountrieshavelawsthatmakeforestclearanceandconversiontootherlandusesextremelydifficult.Inaddition,fiscalsupportisprovidedforforestryundertheEuropeanAgriculturalFundforRuralDevelopment,encouragingsignificantexpansionintreeplanting.Thus,theforestareaislikelytoincreaseastheextentoflandunderagriculturedecreases.
ThemajorthreatstoforestresourcesinEuropeareenvironmental(fires,pestoutbreaksandstorms);someofthesecouldincreasewithclimatechange.Althoughthelong-termimpactsofclimatechangeonforestsareuncertain,manyrecentcatastrophiceventshavebeenattributedtoit.Considerableincreasesareprojectedintheextentandfrequencyoffires,forexampleintheIberianPeninsulaandintheRussianFederation(EEA,2007).
Forest managementForestmanagementisinfluencedbytheownershipstructure.InWesternEurope,70percentofforestsareprivatelyowned,oftenbyindividualsorfamilies.InEasternEurope,largepartsofstateforestswerereturnedtotheirformerownersinthe1990s,whichincreasedtheproportionofforestsunderprivateownership(UNECE,MCPFEandFAO,2007).Fragmentedownershipamongmanysmallholdersraisesthecomplexityandcostsofforestmanagement.Inmanycountries,theprivatesectorhasrespondedbyformingstrongprivateforestowners’associationsandcooperatives.InCIScountries,allforestisstateowned.
FellingsinEuropehavebeenlowerthanthegrowthinforestresourcesandhaveactuallydeclinedoverseveraldecades.Inthefuture,theratiooffellingstoincrementisexpectedtoincreaseasmorewoodisharvestedtosupplythewoodindustry,aswellasreflectingtheimpactoffast-growingdemandforwoodasasourceofrenewableenergy.
Inmostcountries,forestmanagementishighlyregulatedwithstrictenforcement.Stateforestorganizationsplayaleadingroleinforestmanagement
astheyhavesignificantfinancialandtechnicalresources.WesternEuropeancountriestendtoadoptintensivehigh-technologymanagementinvolvingimprovedplantingstock,investmentsinsoilimprovementsandmechanizedharvesting.InEasternEuropeandtheCISsubregion,wherelabourischeaper,lower-costmanagementtendstobeadoptedwithfewinputs,longrotationsandnaturalregeneration.Manyabsenteeownersandsmallholdersalsoadoptthisformofmanagement.
Athirdformofmanagementistraditionalmultipurposemanagement,whethercarriedoutbythestate(high-intensitymultipurposemanagement)orinsmall,family-ownedforestsandfarmforeststoprovidearangeofnon-woodbenefitstotheirownersorlocalpeople.Forestsmanagedinthiswayhavesufferedmostintermsofeconomicviabilitywithchangingmarketconditions,i.e.:
• increasedglobalcompetitionresultinginlowerproductpricesandreducedabilityofindustrytopayforwoodandfibre;
• lowerroundwoodpricesowingtotherapidincreaseinsupplyfollowingforestrestitutioninEasternEurope.
Balancingtheeconomicforcesofmarketsandthegrowingpublicdemandforenvironmentalandsocialservicesofforestswillremainthemajorchallenge.Highlabourcostsandthecomplexityofmanagingmanysmallfragmentedforestsmakeitdifficulttomeetthehighforestmanagementstandards,reducingtheeconomicviabilityofforestmanagementinmanycountries,especiallyinWesternEurope.Therecouldbeashifttowardsproductionofsmaller-sizedwoodgrownonshorterrotations.
However,recentincreasesindemandforwoodenergyandhigherpricescouldbringaboutamajorshiftfromawood-surplustoawood-deficitsituation.
Wood products: production, consumption and tradeEuropeproduceslargeamountsofawidevarietyofwoodproducts,isamajorparticipantininternationaltradeandhasrelativelyhighconsumption(Table10).Theregionaccountedforalmostone-thirdofglobalproductionin2006androughlyhalfofglobalwoodproductsexports.
taBle 9Forest area: extent and change
Subregion Area (1 000 ha)
Annual change (1 000 ha)
Annual change rate (%)
1990 2000 2005 1990–2000 2000–2005 1990–2000 2000–2005
CIS countries 825 919 826 953 826 588 103 –73 0.01 –0.01
Eastern Europe 41 583 42 290 43 042 71 150 0.17 0.35
Western Europe 121 818 128 848 131 763 703 583 0.56 0.45
total europe 989 320 998 091 1 001 394 877 661 0.09 0.07
World 4 077 291 3 988 610 3 952 025 –8 870 –7 320 –0.22 –0.18
Note: data presented are subject to rounding.Source: fao, 2006a.
stAte oF the World’s Forests 200926
WesternEuropehasamajorcompetitiveadvantageintheproductionofhighlyprocessedproductssuchasreconstitutedpanelsandhigh-qualitypaper.Itsenvironmentalconcernsarereflectedin,amongothers,itsstatusasamajorproducerandconsumerofcertifiedwoodproductsanditshighrateofuseofrecoveredfibre.Inaddition,governmentsandtheprivatesectorarepromotingwoodproductsand“greenbuilding”fortheirenvironmentalfriendliness.
TheRussianFederationaccountsformostoftheforestindustryintheCISsubregion.Withitsvastforestresources,lowlabourcostsandtechnicallyskilledworkforce,ithasimmensepotentialtoregainitsformerpositionasamajorglobalproducerofwoodproducts(Box10).
Priorto1990,EasternEuropeanandCIScountriesaccountedfornearlyhalfofEurope’ssawnwoodproduction.Politicalchangesinthe1990sledtoadrasticdeclineintheirproductionandconsumptionofsawnwood.Withthetransitiontoamarketeconomy,EasternEuropeshiftedtoproductionofmoreprocessedproductssuch
aswood-basedpanels.Sawnwoodproductionhasbeguntorecoversince2000,butdespitepredictedgrowthof1.7percentfrom2005to2020,itwillstillbelessin2020thanitwasin1990.Consumptionisexpectedtoremainrelativelyflat.
Productionandconsumptionofwood-basedpanelsareroughlyequalandareexpectedtogrowfasterthanthoseofsawnwood,2.4percentannuallyfrom2005to2020,becauseofdevelopmentsinreconstitutedpaneltechnologyandsubstitutionofpanelsforsawnwood.
Highgrowthratesinpaperandpaperboardproductionareexpectedtocontinue,butwithsignificantsubregionaldifferences(Figure21).Europe’scompetitiveadvantageinpaperproductionisbasedonclosehigh-demandmarkets,availabilityofalargequantityofrecoveredpaperand,inparticular,technologicalsophisticationforproductionofhigh-qualitypaper.ThesomewhatlessercompetitiveadvantageoftheCIScountriesisbasedonabundantavailabilityofpulpwood.HigherexporttariffsintheRussianFederation(Box10)arelikelytostimulateincreasedpulpwoodproductioninotherEuropean
taBle 10Production and consumption of wood products
Year industrial roundwood (million m3)
Sawnwood (million m3)
Wood-based panels (million m3)
Paper and paperboard (million tonnes)
Production Consumption Production Consumption Production Consumption Production Consumption
2000 483 473 130 121 61 59 100 90
2005 513 494 136 121 73 70 111 101
2010 578 543 147 131 82 79 128 115
2020 707 647 175 151 104 99 164 147
Source: fao, 2008c.
Roundwood production in the Russian Federation was
about 150 million cubic metres in 2005, amounting to one-
third of all production in Europe and 10 percent of global
production. However, this is still only about half the 1990
level. About one-third of the production was exported
in 2005, accounting for 40 percent of global trade. The
main importers of industrial roundwood from the Russian
Federation are China, Finland and Japan.
Recent policies to stimulate domestic forestry include:
•the Forest Code (2007), which encourages private-
sector participation in forestry (including through
flexible forest lease arrangements) and decentralization
of forest management;
•dramatically increased industrial roundwood export
tariffs by 2009 (with a temporary two-year exemption
for birch pulpwood) (see table).
However, the new policies do not address the scarcity of
capital in forestry – caused by the perception of the Russian
Federation as a high-risk country for investment and by the
concentration of investments in the high-performing oil and gas
sector. Thus, despite the advantages of abundant wood, low
domestic wood prices (stumpage) and cheap skilled labour, it
is unclear whether the policies will have the intended effect.
BoX 10 recent developments in the forest industry in the russian federation
Year russian industrial roundwood export tariffs
(€/m3) (us$/m3)
1996 4 5
2007 10 14
2008 15 23
2009 50 74
Source: a. Whiteman, unpublished, 2008.
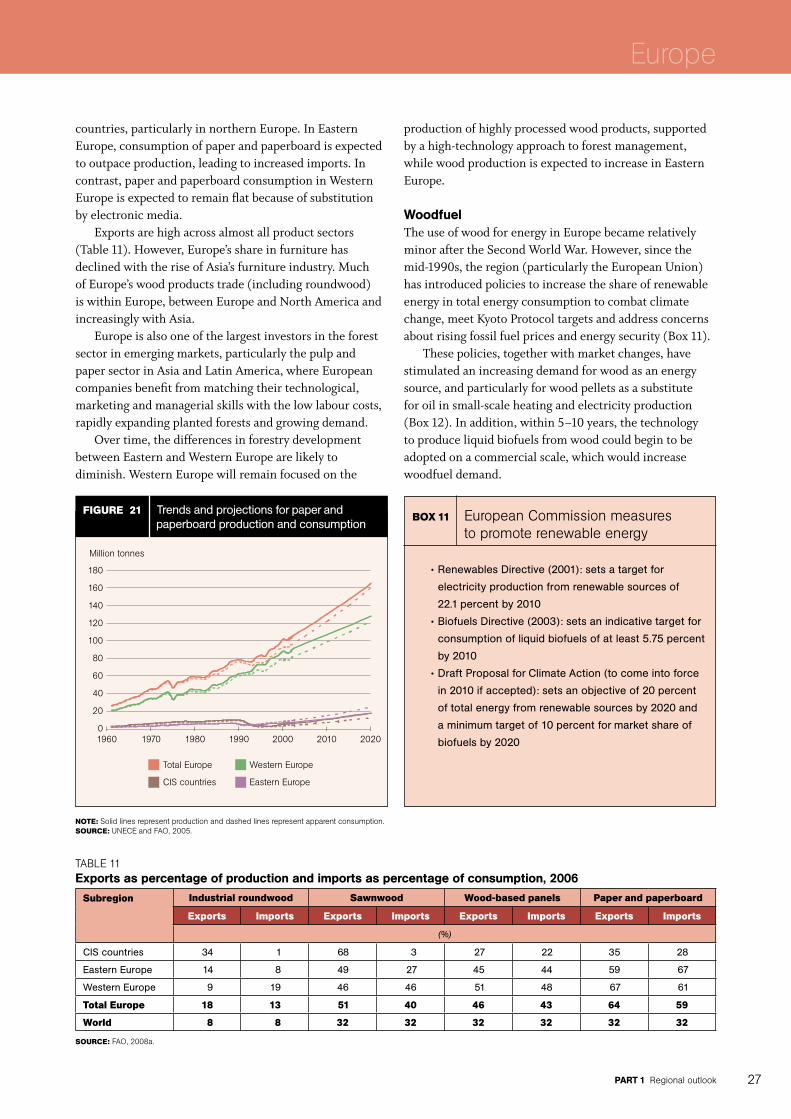
PArt 1 regional outlook 27
Europe
countries,particularlyinnorthernEurope.InEasternEurope,consumptionofpaperandpaperboardisexpectedtooutpaceproduction,leadingtoincreasedimports.Incontrast,paperandpaperboardconsumptioninWesternEuropeisexpectedtoremainflatbecauseofsubstitutionbyelectronicmedia.
Exportsarehighacrossalmostallproductsectors(Table11).However,Europe’sshareinfurniturehasdeclinedwiththeriseofAsia’sfurnitureindustry.MuchofEurope’swoodproductstrade(includingroundwood)iswithinEurope,betweenEuropeandNorthAmericaandincreasinglywithAsia.
Europeisalsooneofthelargestinvestorsintheforestsectorinemergingmarkets,particularlythepulpandpapersectorinAsiaandLatinAmerica,whereEuropeancompaniesbenefitfrommatchingtheirtechnological,marketingandmanagerialskillswiththelowlabourcosts,rapidlyexpandingplantedforestsandgrowingdemand.
Overtime,thedifferencesinforestrydevelopmentbetweenEasternandWesternEuropearelikelytodiminish.WesternEuropewillremainfocusedonthe
productionofhighlyprocessedwoodproducts,supportedbyahigh-technologyapproachtoforestmanagement,whilewoodproductionisexpectedtoincreaseinEasternEurope.
WoodfuelTheuseofwoodforenergyinEuropebecamerelativelyminoraftertheSecondWorldWar.However,sincethemid-1990s,theregion(particularlytheEuropeanUnion)hasintroducedpoliciestoincreasetheshareofrenewableenergyintotalenergyconsumptiontocombatclimatechange,meetKyotoProtocoltargetsandaddressconcernsaboutrisingfossilfuelpricesandenergysecurity(Box11).
Thesepolicies,togetherwithmarketchanges,havestimulatedanincreasingdemandforwoodasanenergysource,andparticularlyforwoodpelletsasasubstituteforoilinsmall-scaleheatingandelectricityproduction(Box12).Inaddition,within5–10years,thetechnologytoproduceliquidbiofuelsfromwoodcouldbegintobeadoptedonacommercialscale,whichwouldincreasewoodfueldemand.
Figure 21 Trends and projections for paper and paperboard production and consumption
Note: Solid lines represent production and dashed lines represent apparent consumption.Source: unece and fao, 2005.
180
160
140
120
100
80
60
40
20
0
Million tonnes
1960 1970 1980 1990 2000 2010 2020
•Renewables Directive (2001): sets a target for
electricity production from renewable sources of
22.1 percent by 2010
•Biofuels Directive (2003): sets an indicative target for
consumption of liquid biofuels of at least 5.75 percent
by 2010
•Draft Proposal for Climate Action (to come into force
in 2010 if accepted): sets an objective of 20 percent
of total energy from renewable sources by 2020 and
a minimum target of 10 percent for market share of
biofuels by 2020
BoX 11 european commission measures to promote renewable energy
taBle 11exports as percentage of production and imports as percentage of consumption, 2006
Subregion industrial roundwood Sawnwood Wood-based panels Paper and paperboard
exports imports exports imports exports imports exports imports
(%)
CIS countries 34 1 68 3 27 22 35 28
Eastern Europe 14 8 49 27 45 44 59 67
Western Europe 9 19 46 46 51 48 67 61
total europe 18 13 51 40 46 43 64 59
World 8 8 32 32 32 32 32 32
Source: fao, 2008a.
total europe Western europe
ciS countries eastern europe

stAte oF the World’s Forests 200928
TheEuropeanForestSectorOutlookStudy(EFSOS)projectedwoodfuelconsumptionto2020(UNECEandFAO,2005).However,newprojections(Figure22)areapproximatelythreetimeshigherforEasternEuropeandfivetimeshigherforWesternEuropethantheEFSOSfigures,whichwerebasedontraditionalwoodfuelusemostlybyhouseholdsinruralareas(andwereunderestimatedbecauseofthepaucityofreliablenationalstatistics).
Fellings,thinningsandprunings,recoveredwoodproducts,residuesfromharvestingandprocessingandbiomassfromoutsideforestsareallusedforenergyproduction.Woodusedforenergyneedstobefullytakenintoaccountinwoodbalanceestimates;Table12suggeststhatwhenthisisdone,demandoutweighssupply.
non-wood forest productsAlthoughnotamajoractivityinEurope,thecollectionofNWFPsisacommonformofrecreation.KeycommercialproductsincludeChristmastrees,gamemeat,cork,mushrooms(includingtruffles),honey,nutsandberries(Figure23).Mostofthesehavelimitedbutwell-established(andsometimeshighlyprofitable) markets.Tworecentdevelopmentsincludeadeclineintheviabilityofcorkproduction(becauseofsubstitutes)andincreasedinterestinfoodfromforestsaspartofthegrowingconsumerdemandfororganicproducts.
Aswithwood,Europeanproducersandforestmanagershavecontinuouslyadaptedtheirpracticestotakeadvantageofthechangingmarketconditions.Forexample,corkproducershaveimprovedmarketingandintroducedstricterqualitycontrols,standardsandcertificationtocompeteagainstsubstitutes.Producers
Since wood pellets emerged in the 1970s as an
alternative fuel source, their production and consumption
have increased steadily, and new developments in
manufacturing technologies have improved their quality.
The availability of raw material, competitive prices and
diversified energy policies favour the development of
the wood pellet industry in Europe. In 2006, the overall
production of almost 300 pellet plants in the European
Union reached nearly 4.5 million tonnes. Sweden is the
world leader in terms of wood pellet production. Sawdust-
based pellet production has considerable potential in
Brazil and the Russian Federation.
Consumption is also rising for both heating and
electricity production (see figure). Globally, wood pellet
markets display exponential growth, with new markets
opening up in many areas, including Canada and Eastern
Europe, and with potential in Asia and Latin America.
Future growth will depend on improved local logistics, a
reduction in the cost of pellet stoves and supportive policies.
BoX 12 emerging demand for wood pellets
Source: Peksa-Blanchard et al., 2007.
Wood pellet consumption, 2005, selected countries
austria
Belgium
canada
denmark
finland
france
germany
italy
netherlands
norway
Spain
Swedenunited States
of america
0.0 0.2 0.4 0.6 0.8 1.0 1.2 1.4 1.6 1.8
use in heating market electricity production
annual pellet consumption (million tonnes)
Figure 22 Trends and projections for woodfuel consumption, revised considering European Union draft renewable energy policy
Note: Solid lines are efSoS projections and dashed lines represent revised projections.SourceS: Becker et al., 2007; unece and fao, 2005.
700
600
500
400
300
200
100
0
Million m3
1960 1970 1980 1990 2000 2010 2020
total europe Western europe
ciS countries eastern europe

PArt 1 regional outlook 29
Europe
offorestfoodproductsinEasternEuropehavetakenadvantageoflowlabourcoststoservethenichemarketfororganicfoods.InWesternEurope,forestmanagersareearningincomefromNWFPs,forexamplethroughpermitsforrecreationalcollectionofmushroomsorsaleofChristmastrees.
Contribution of forestry to income and employmentAfterthedrasticdeclinethataccompaniedthepoliticalandeconomicchangesintheearly1990s,grossvalueaddedbytheforestsectorrecoveredsomewhattowardsthemiddleofthedecade,butithascontinuedtodiminishsince2000(Figure24).Mostofthedeclinehascomefromthepulpandpapersubsector.
Employmentintheforestsectorhasalsofalleninabsoluteandrelativeterms(Figure25).
environmental services of forestsHighlevelsofeducationandaccesstoinformationcontributetogreatconcernforprotectionoftheenvironmentinEurope,andhighincomescontributetowillingnesstopayforenvironmentalservices.Landuseishighlyregulatedandforestclearanceisvirtuallyprohibitedinmostoftheregion,particularlyinWesternEurope.
Combatingclimatechangeisthemostimportantenvironmentalconcern.Inadditiontohavinganexpandingroleinprovidingbiomassforrenewableenergy(seesectiononwoodfuelabove),Europe’sforestsarealsovaluedasacarbonsink.ForEuropeasawhole,landuse,land-usechangeandforestryreducenetemissionsbyalmost6percent,andforestsprobablyaccountforalmostallofthisreduction(Table13).ThecontributionisparticularlyhighinEasternEurope,whereincrementishighandemissionsfromothersectorsarelow.Europehasalsopioneeredmarketapproachesforemissiontrading.
ProtectedareasinEuropeexpandedfrom195millionhectaresin1990to234millionhectaresin2007(UN,2008c).Therearemultipleinitiativesforconservingbiodiversityintheregion(Box13),althoughmostmeasuresthatmaintainbiodiversityinforestsarenotspecificallyearmarkedassuch.Managementpracticesincreasinglyemphasizeprotectingbiodiversitythrough
taBle 12Components of wood supply and consumption, european union and european Free trade Associationa countries, 2005
Supply Million m³ % of total use Million m³ % of total
From forest Material
Industrial roundwood 397 51 Sawmill industry 217 26
Fuelwood 85 11 Panel industry 88 11
Bark 25 3 Pulp industry 155 19
Logging residues 23 3 Pellets, briquettes, etc. 7 1
Woody biomass outside the forest 20 3 Other physical utilization 14 2
co-products energy
Chips, particles and wood residues 118 15 Power and heat 49 6
Pulp production co-products 70 9 Industrial internal 65 8
Post-consumer recovered wood 29 4 Private households 92 11
Processed woodfuel industry 7 1 Undifferentiated energy use 135 16
total 775 100 total 822 100
a iceland, liechtenstein, norway and Switzerland.Note: data presented are subject to rounding.Source: adapted from Mantau et al., 2008.
Figure 23 Marketed non-wood forest products in Europe, percentage of total value
christmas trees
Mushrooms including truffles
fruits, berries and edible nuts
game
decorative foliage, ornamental plants
other plant products
Wild honey and beeswax
other animal products
resins, raw material for medicine, aromatic products, colourants, dyes
cork
Note: Based on available information.Source: unece, McPfe and fao, 2007.
5%
9%
20%
28%
1%
18%
7%
8%
1%3%

stAte oF the World’s Forests 200930
naturalregeneration,mixedforests,leavingdeadwoodinforestsandprotectingsmall“keyhabitats”inmanagedforests(UNECE,MCPFEandFAO,2007).Growingemphasison“closetonaturesilviculture”(UNECE,FAOandILO,2003)willhelptoconservebiodiversityinmostmanagedforests.
Integratedmanagementofuplandwatershedsandthelinkagesbetweenforestsandwaterarereceivingincreasingattentionintheregion.In2006,theUnitedNationsEconomicCommissionforEurope(UNECE)
ConventionontheProtectionandUseofTransboundaryWatercoursesandInternationalLakes(alsoknownastheWaterConvention)endorsedtheconceptofPES,includingtheconservationanddevelopmentofforestcover.In2007,MCPFEadoptedaresolutiononforestsandwaterthataddresses,amongothers,policycoordinationandeconomicvaluationofwater-relatedforestservices.FAO,UNECE,MCPFEandtheEuropeanCommissionhighlightedforest–waterlinkagesatEuropeanForestWeekinOctober2008(UNECEandFAO,2008).
Figure 25 Employment in the formal forestry sector
number employed (million) contribution to employment (percentage)
1990 1992 1994 1996 1998 2000 2002 2004 2006
Source: fao, 2008b.
1990 1992 1994 1996 1998 2000 2002 2004 2006
6
5
4
3
2
1
0
1.80
1.50
1.20
0.90
0.60
0.30
0.00
Figure 24 Value added in the forestry sector
gross value added (uS$ billion) contribution to gdP (percentage)
roundwood production Wood processing Pulp and paper total
1990 1992 1994 1996 1998 2000 2002 2004 2006
Note: the changes in value added are the changes in real value (i.e. adjusted for inflation). Source: fao, 2008b.
1990 1992 1994 1996 1998 2000 2002 2004 2006
180
160
140
120
100
80
60
40
20
0
1.80
1.60
1.40
1.20
1.00
0.80
0.60
0.40
0.20
0.00
roundwood production Wood processing Pulp and paper total
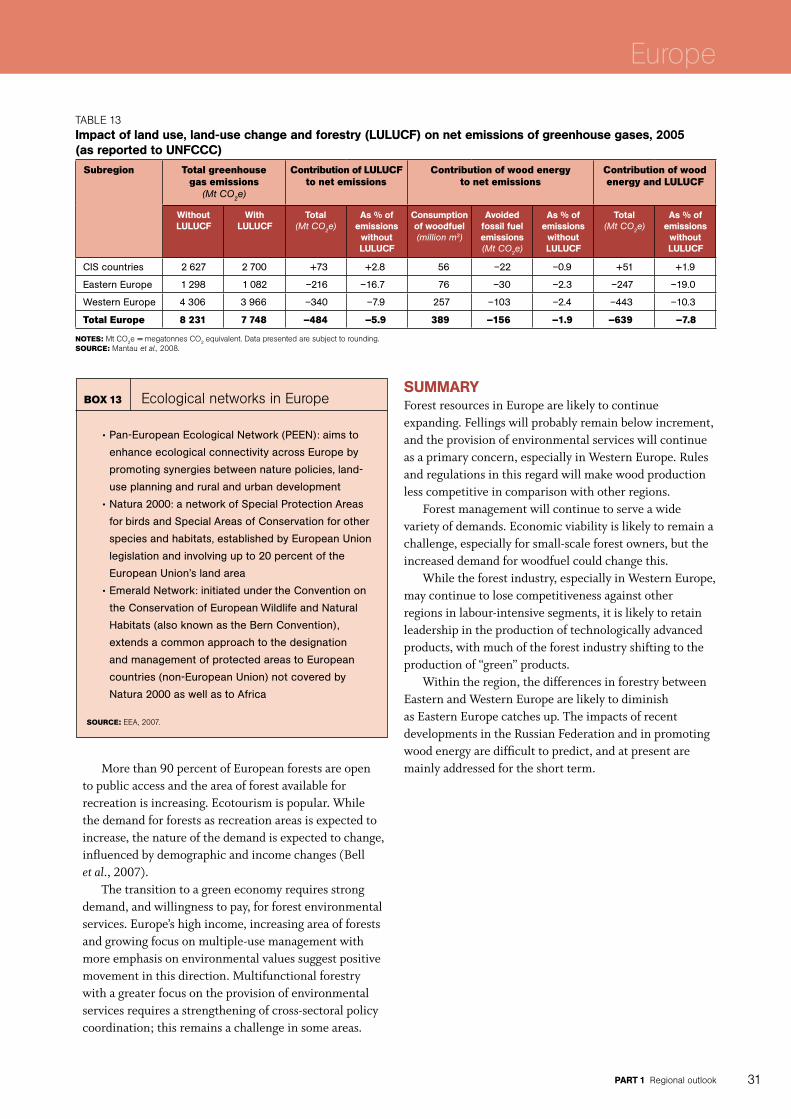
PArt 1 regional outlook 31
Europe
Morethan90percentofEuropeanforestsareopentopublicaccessandtheareaofforestavailableforrecreationisincreasing.Ecotourismispopular.Whilethedemandforforestsasrecreationareasisexpectedtoincrease,thenatureofthedemandisexpectedtochange,influencedbydemographicandincomechanges(Bellet al.,2007).
Thetransitiontoagreeneconomyrequiresstrongdemand,andwillingnesstopay,forforestenvironmentalservices.Europe’shighincome,increasingareaofforestsandgrowingfocusonmultiple-usemanagementwithmoreemphasisonenvironmentalvaluessuggestpositivemovementinthisdirection.Multifunctionalforestrywithagreaterfocusontheprovisionofenvironmentalservicesrequiresastrengtheningofcross-sectoralpolicycoordination;thisremainsachallengeinsomeareas.
summAryForestresourcesinEuropearelikelytocontinueexpanding.Fellingswillprobablyremainbelowincrement,andtheprovisionofenvironmentalserviceswillcontinueasaprimaryconcern,especiallyinWesternEurope.Rulesandregulationsinthisregardwillmakewoodproductionlesscompetitiveincomparisonwithotherregions.
Forestmanagementwillcontinuetoserveawidevarietyofdemands.Economicviabilityislikelytoremainachallenge,especiallyforsmall-scaleforestowners,buttheincreaseddemandforwoodfuelcouldchangethis.
Whiletheforestindustry,especiallyinWesternEurope,maycontinuetolosecompetitivenessagainstotherregionsinlabour-intensivesegments,itislikelytoretainleadershipintheproductionoftechnologicallyadvancedproducts,withmuchoftheforestindustryshiftingtotheproductionof“green”products.
Withintheregion,thedifferencesinforestrybetweenEasternandWesternEuropearelikelytodiminishasEasternEuropecatchesup.TheimpactsofrecentdevelopmentsintheRussianFederationandinpromotingwoodenergyaredifficulttopredict,andatpresentaremainlyaddressedfortheshortterm.
taBle 13impact of land use, land-use change and forestry (luluCF) on net emissions of greenhouse gases, 2005 (as reported to unFCCC)
Subregion total greenhouse gas emissions
(Mt CO2e)
contribution of LuLucF to net emissions
contribution of wood energy to net emissions
contribution of wood energy and LuLucF
Without luluCF
With luluCF
total (Mt CO2e)
As % of emissions
without luluCF
Consumption of woodfuel (million m3)
Avoided fossil fuel emissions (Mt CO2e)
As % of emissions
without luluCF
total (Mt CO2e)
As % of emissions
without luluCF
CIS countries 2 627 2 700 +73 +2.8 56 –22 –0.9 +51 +1.9
Eastern Europe 1 298 1 082 –216 –16.7 76 –30 –2.3 –247 –19.0
Western Europe 4 306 3 966 –340 –7.9 257 –103 –2.4 –443 –10.3
total europe 8 231 7 748 –484 –5.9 389 –156 –1.9 –639 –7.8
NoteS: Mt co2e = megatonnes co2 equivalent. data presented are subject to rounding.Source: Mantau et al., 2008.
•Pan-European Ecological Network (PEEN): aims to
enhance ecological connectivity across Europe by
promoting synergies between nature policies, land-
use planning and rural and urban development
•Natura 2000: a network of Special Protection Areas
for birds and Special Areas of Conservation for other
species and habitats, established by European Union
legislation and involving up to 20 percent of the
European Union’s land area
•Emerald Network: initiated under the Convention on
the Conservation of European Wildlife and Natural
Habitats (also known as the Bern Convention),
extends a common approach to the designation
and management of protected areas to European
countries (non-European Union) not covered by
Natura 2000 as well as to Africa
Source: eea, 2007.
BoX 13 ecological networks in europe
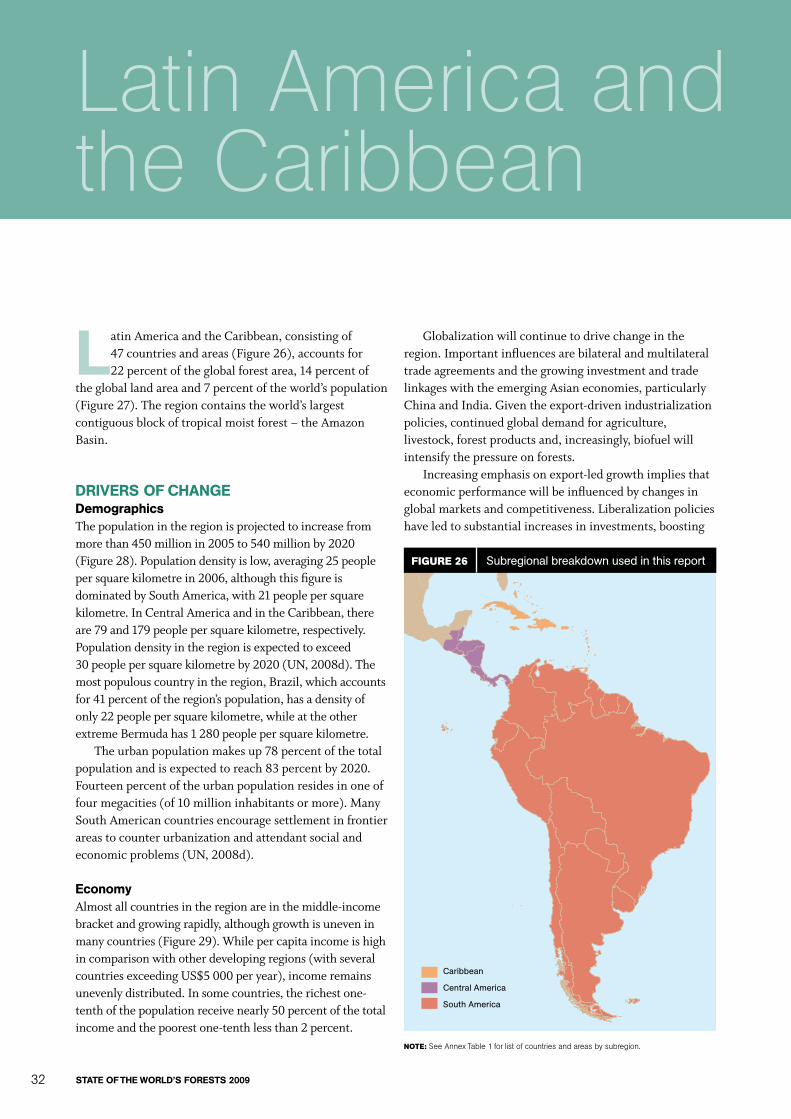
stAte oF the World’s Forests 200932
Africa
latinAmericaandtheCaribbean,consistingof47countriesandareas(Figure26),accountsfor22percentoftheglobalforestarea,14percentof
thegloballandareaand7percentoftheworld’spopulation(Figure27).Theregioncontainstheworld’slargestcontiguousblockoftropicalmoistforest–theAmazonBasin.
drivers oF ChAngedemographicsThepopulationintheregionisprojectedtoincreasefrommorethan450millionin2005to540millionby2020(Figure28).Populationdensityislow,averaging25peoplepersquarekilometrein2006,althoughthisfigureisdominatedbySouthAmerica,with21peoplepersquarekilometre.InCentralAmericaandintheCaribbean,thereare79and179peoplepersquarekilometre,respectively.Populationdensityintheregionisexpectedtoexceed30peoplepersquarekilometreby2020(UN,2008d).Themostpopulouscountryintheregion,Brazil,whichaccountsfor41percentoftheregion’spopulation,hasadensityofonly22peoplepersquarekilometre,whileattheotherextremeBermudahas1280 peoplepersquarekilometre.
Theurbanpopulationmakesup78percentofthetotalpopulationandisexpectedtoreach83percentby2020.Fourteenpercentoftheurbanpopulationresidesinoneoffourmegacities(of10millioninhabitantsormore).ManySouthAmericancountriesencouragesettlementinfrontierareastocounterurbanizationandattendantsocialandeconomicproblems(UN,2008d).
economyAlmostallcountriesintheregionareinthemiddle-incomebracketandgrowingrapidly,althoughgrowthisuneveninmanycountries(Figure29).Whilepercapitaincomeishighincomparisonwithotherdevelopingregions(withseveralcountriesexceedingUS$5000peryear),incomeremainsunevenlydistributed.Insomecountries,therichestone-tenthofthepopulationreceivenearly50percentofthetotalincomeandthepoorestone-tenthlessthan2percent.
Globalizationwillcontinuetodrivechangeintheregion.ImportantinfluencesarebilateralandmultilateraltradeagreementsandthegrowinginvestmentandtradelinkageswiththeemergingAsianeconomies,particularlyChinaandIndia.Giventheexport-drivenindustrializationpolicies,continuedglobaldemandforagriculture,livestock,forestproductsand,increasingly,biofuelwillintensifythepressureonforests.
Increasingemphasisonexport-ledgrowthimpliesthateconomicperformancewillbeinfluencedbychangesinglobalmarketsandcompetitiveness.Liberalizationpolicieshaveledtosubstantialincreasesininvestments,boosting
Latin America and the Caribbean
Figure 26 Subregional breakdown used in this report
Caribbean
Central America
South America
Note: See annex table 1 for list of countries and areas by subregion.

PArt 1 regional outlook 33
growthrates.Forecastssuggestthateconomicgrowthwillremainhigh(WorldBank,2007a;UN,2008b),butchangesinglobalmarketsandgrowingcompetitionfromemergingAsianeconomiescouldalterthetrend.
Withrapiddevelopmentofthemanufacturingandservicessectors,agriculture’sshareinGDP(only7percentin2005)andemploymenthasdecreasedinmostcountries.However,whiletheviabilityofsmall-scaleagriculturehasdeclinedwithimportliberalization,large-scaleexport-focusedcommercialagriculture,includinglivestock,hasexpandedimpressively(e.g.soybeans,biofuelcrops,meat,fruits,vegetablesandcutflowers)(WorldBank,2007b)
Figure 27 Extent of forest resources
Forest
Other wooded land
Other land cover
Figure 28 Population
total latin america and the caribbean rural urban
Source: un, 2008a.
600
550
500
450
400
350
300
250
200
150
100
50
0
Million
1980 1990 2000 2010 2020
Figure 29 Gross domestic product
total latin america and the caribbean caribbean
central america South america
SourceS: Based on un, 2008b; World Bank, 2007a.
5
4
3
2
1
0
uS$ trillion
1980 1985 1990 1995 2000 2005 2010 2015
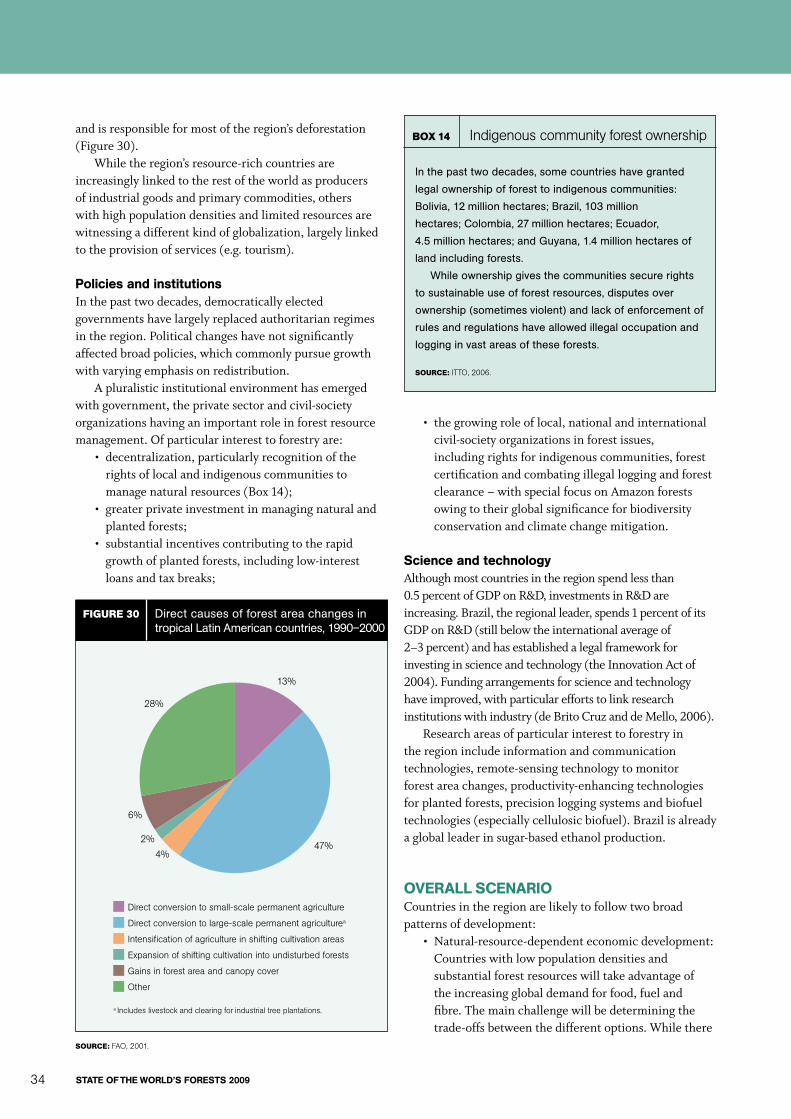
stAte oF the World’s Forests 200934
andisresponsibleformostoftheregion’sdeforestation(Figure30).
Whiletheregion’sresource-richcountriesareincreasinglylinkedtotherestoftheworldasproducersofindustrialgoodsandprimarycommodities,otherswithhighpopulationdensitiesandlimitedresourcesarewitnessingadifferentkindofglobalization,largelylinkedtotheprovisionofservices(e.g.tourism).
Policies and institutionsInthepasttwodecades,democraticallyelectedgovernmentshavelargelyreplacedauthoritarianregimesintheregion.Politicalchangeshavenotsignificantlyaffectedbroadpolicies,whichcommonlypursuegrowthwithvaryingemphasisonredistribution.
Apluralisticinstitutionalenvironmenthasemergedwithgovernment,theprivatesectorandcivil-societyorganizationshavinganimportantroleinforestresourcemanagement.Ofparticularinteresttoforestryare:
• decentralization,particularlyrecognitionoftherightsoflocalandindigenouscommunitiestomanagenaturalresources(Box14);
• greaterprivateinvestmentinmanagingnaturalandplantedforests;
• substantialincentivescontributingtotherapidgrowthofplantedforests,includinglow-interestloansandtaxbreaks;
• thegrowingroleoflocal,nationalandinternationalcivil-societyorganizationsinforestissues,includingrightsforindigenouscommunities,forestcertificationandcombatingillegalloggingandforestclearance–withspecialfocusonAmazonforestsowingtotheirglobalsignificanceforbiodiversityconservationandclimatechangemitigation.
science and technologyAlthoughmostcountriesintheregionspendlessthan0.5percentofGDPonR&D,investmentsinR&Dareincreasing.Brazil,theregionalleader,spends1percentofitsGDPonR&D(stillbelowtheinternationalaverageof2–3percent)andhasestablishedalegalframeworkforinvestinginscienceandtechnology(theInnovationActof2004).Fundingarrangementsforscienceandtechnologyhaveimproved,withparticulareffortstolinkresearchinstitutionswithindustry(deBritoCruzanddeMello,2006).
Researchareasofparticularinteresttoforestryintheregionincludeinformationandcommunicationtechnologies,remote-sensingtechnologytomonitorforestareachanges,productivity-enhancingtechnologiesforplantedforests,precisionloggingsystemsandbiofueltechnologies(especiallycellulosicbiofuel).Brazilisalreadyagloballeaderinsugar-basedethanolproduction.
overAll sCenArioCountriesintheregionarelikelytofollowtwobroadpatternsofdevelopment:
• Natural-resource-dependenteconomicdevelopment:Countrieswithlowpopulationdensitiesandsubstantialforestresourceswilltakeadvantageoftheincreasingglobaldemandforfood,fuelandfibre.Themainchallengewillbedeterminingthetrade-offsbetweenthedifferentoptions.Whilethere
Figure 30 Direct causes of forest area changes in tropical Latin American countries, 1990–2000
direct conversion to small-scale permanent agriculture
direct conversion to large-scale permanent agriculturea
intensification of agriculture in shifting cultivation areas
expansion of shifting cultivation into undisturbed forests
gains in forest area and canopy cover
other
Source: fao, 2001.
13%
47%
6%
2%
28%
4%
In the past two decades, some countries have granted
legal ownership of forest to indigenous communities:
Bolivia, 12 million hectares; Brazil, 103 million
hectares; Colombia, 27 million hectares; Ecuador,
4.5 million hectares; and Guyana, 1.4 million hectares of
land including forests.
While ownership gives the communities secure rights
to sustainable use of forest resources, disputes over
ownership (sometimes violent) and lack of enforcement of
rules and regulations have allowed illegal occupation and
logging in vast areas of these forests.
Source: itto, 2006.
BoX 14 indigenous community forest ownership
a includes livestock and clearing for industrial tree plantations.
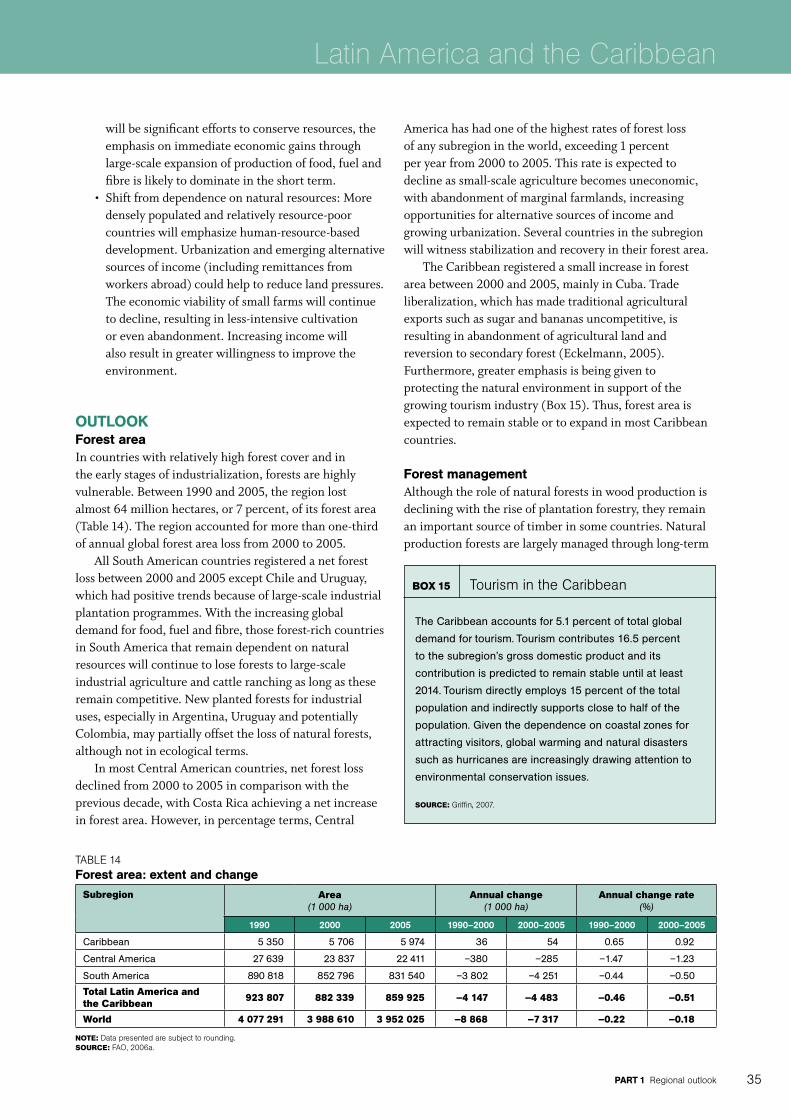
PArt 1 regional outlook 35
Latin America and the Caribbean
willbesignificanteffortstoconserveresources,theemphasisonimmediateeconomicgainsthroughlarge-scaleexpansionofproductionoffood,fuelandfibreislikelytodominateintheshortterm.
• Shiftfromdependenceonnaturalresources: Moredenselypopulatedandrelativelyresource-poorcountrieswillemphasizehuman-resource-baseddevelopment.Urbanizationandemergingalternativesourcesofincome(includingremittancesfromworkersabroad)couldhelptoreducelandpressures.Theeconomicviabilityofsmallfarmswillcontinuetodecline,resultinginless-intensivecultivationorevenabandonment.Increasingincomewillalsoresultingreaterwillingnesstoimprovetheenvironment.
outlookForest areaIncountrieswithrelativelyhighforestcoverandintheearlystagesofindustrialization,forestsarehighlyvulnerable.Between1990and2005,theregionlostalmost64millionhectares,or7percent,ofitsforestarea(Table14).Theregionaccountedformorethanone-thirdofannualglobalforestarealossfrom2000to2005.
AllSouthAmericancountriesregisteredanetforestlossbetween2000and2005exceptChileandUruguay,whichhadpositivetrendsbecauseoflarge-scaleindustrialplantationprogrammes.Withtheincreasingglobaldemandforfood,fuelandfibre,thoseforest-richcountriesinSouthAmericathatremaindependentonnaturalresourceswillcontinuetoloseforeststolarge-scaleindustrialagricultureandcattleranchingaslongastheseremaincompetitive.Newplantedforestsforindustrialuses,especiallyinArgentina,UruguayandpotentiallyColombia,maypartiallyoffsetthelossofnaturalforests,althoughnotinecologicalterms.
InmostCentralAmericancountries,netforestlossdeclinedfrom2000to2005incomparisonwiththepreviousdecade,withCostaRicaachievinganetincreaseinforestarea.However,inpercentageterms,Central
Americahashadoneofthehighestratesofforestlossofanysubregionintheworld,exceeding1percentperyearfrom2000to2005.Thisrateisexpectedtodeclineassmall-scaleagriculturebecomesuneconomic,withabandonmentofmarginalfarmlands,increasingopportunitiesforalternativesourcesofincomeandgrowingurbanization.Severalcountriesinthesubregionwillwitnessstabilizationandrecoveryintheirforestarea.
TheCaribbeanregisteredasmallincreaseinforestareabetween2000and2005,mainlyinCuba.Tradeliberalization,whichhasmadetraditionalagriculturalexportssuchassugarandbananasuncompetitive,isresultinginabandonmentofagriculturallandandreversiontosecondaryforest(Eckelmann,2005).Furthermore,greateremphasisisbeinggiventoprotectingthenaturalenvironmentinsupportofthegrowingtourismindustry(Box15).Thus,forestareaisexpectedtoremainstableortoexpandinmostCaribbeancountries.
Forest managementAlthoughtheroleofnaturalforestsinwoodproductionisdecliningwiththeriseofplantationforestry,theyremainanimportantsourceoftimberinsomecountries.Naturalproductionforestsarelargelymanagedthroughlong-term
taBle 14Forest area: extent and change
Subregion Area(1 000 ha)
Annual change(1 000 ha)
Annual change rate(%)
1990 2000 2005 1990–2000 2000–2005 1990–2000 2000–2005
Caribbean 5 350 5 706 5 974 36 54 0.65 0.92
Central America 27 639 23 837 22 411 –380 –285 –1.47 –1.23
South America 890 818 852 796 831 540 –3 802 –4 251 –0.44 –0.50
total Latin America and the caribbean 923 807 882 339 859 925 –4 147 –4 483 –0.46 –0.51
World 4 077 291 3 988 610 3 952 025 –8 868 –7 317 –0.22 –0.18
Note: data presented are subject to rounding.Source: fao, 2006a.
The Caribbean accounts for 5.1 percent of total global
demand for tourism. Tourism contributes 16.5 percent
to the subregion’s gross domestic product and its
contribution is predicted to remain stable until at least
2014. Tourism directly employs 15 percent of the total
population and indirectly supports close to half of the
population. Given the dependence on coastal zones for
attracting visitors, global warming and natural disasters
such as hurricanes are increasingly drawing attention to
environmental conservation issues.
Source: griffin, 2007.
BoX 15 tourism in the caribbean

stAte oF the World’s Forests 200936
privateconcessionsofupto200000hainBolivia,GuyanaandSuriname;medium-sizedconcessionsinGuatemala,PeruandtheBolivarianRepublicofVenezuela;andsmall-scaleconcessionsinColombia,Ecuador,HondurasandTrinidadandTobago(ITTO,2006).InBrazil,nearlyallproductionhasbeeninprivateforests,buttheLawontheManagementofPublicForestsforSustainableProductionapprovedin2005,andnowbeginningtobeputintopractice,opensupnationalforestsintheAmazonforloggingconcessions;theintentionistoencouragesustainablemanagementandhelptoavoidillegaloccupationandlogging(Box16).
Selectiveloggingistheprimaryfocusofmostconcessionmanagementintheregion,withlittleattentiontopostharvestsilvicultureandunregulatedharvestingleadingtodegradation.Obstaclestosustainablemanagementoftheregion’snaturalforestsforwoodproductioninclude:
• scarceadoptionofreduced-impactloggingbecauseofweakincentives;
• limitedareaofforestscertified(Box17)becauseofthehighcostsandabsenceofapricepremium,especiallywiththeavailabilityoflow-pricedillegallyprocuredtimber;
• ownershipdisputesfromoverlappinglandtenureandillegitimatetitlesencouragingillegalloggingandlandconversion,especiallyintheAmazon;
• diseconomiesofscaleforsmallcommunity-managedconcessions,especiallythoseremotefrommarkets;
• preponderanceoftheinformalsector(especiallyillegalloggingandwood-processingunits).
Consideringtheconflictingdemands,multiple-usemanagementofnaturalforestscontinuestobeacomplexchallenge.Thedifficultieswilldiscouragelong-termprivateinvestments,andmostloggingwillcontinuetobedonebyshort-terminvestors.
LatinAmericaandtheCaribbeanhasabout12.5millionhectaresofplantedforests.Thisisonly5percentoftheglobalplantedforestarea(FAO,2006b),buttheregionisemergingasaleaderinhigh-productivityplantationforestry.Argentina,Brazil,ChileandUruguayaccountforabout78percentoftheplantedforestsintheregion.Plantationdevelopment,drivenbytheprivatesector,issupportedbyfavourablegovernmentpoliciesandfinancialincentives.Theseincludepartialreimbursementofcosts,taxbreaksandlow-interestloansforsmallowners(Box18).ThesefactorshavemadeSouthAmericaadestinationforinvestmentsbybothregionalandglobalpulpandpaperproducersandrecentlybyNorthAmericaninvestors,includingtimberinvestmentmanagementorganizations(TIMOs).
Keyfeaturesofplantationforestryintheregioninclude:• investmentinproductivity-enhancingtechnologies,
especiallyclonalpropagation,achievingproductivityofmorethan50m3perhectareperyearinsomecases;
• useofintensivelymanagedshort-rotationspeciessuchasEucalyptusspp.,radiatapine(Pinus radiata),loblollypine(Pinus taeda)andsouthernyellowpine(Pinus elliottii);
• integrationofplantationmanagementwithwoodprocessing,especiallypulpandpaperandpanelproduction.
The Law on the Management of Public Forests for
Sustainable Production outlines the allocation of timber
concessions in Brazil’s federal forests. Salient features of
the law include:
•creation of the Brazilian Forest Service;
•establishment of the National Forest Development Fund;
•allocation of forest concessions through a
transparent and open bidding process;
•preference given to non-profit organizations,
communities and non-governmental organizations;
•allocation of 20 percent of concession revenues to
the Brazilian Forest Service and the Brazilian Institute
of Environment and Renewable Natural Resources.
The emphasis is on safeguarding environmental, social
and economic values. Bids are judged on price only
after demonstration that operations will cause the least
environmental impact, generate the largest direct social
benefits and add the most value to products and services
in the concession area.
Private logging concessions are expected to cover
13 million hectares within the next decade, eventually
expanding to about 50 million hectares.
SourceS: Schulze, grogan and Vidal, 2007; tomaselli and Sarre, 2005.
BoX 16 Brazilian forest concessions
In 2007, Latin America and the Caribbean had about
12 million hectares of certified forests, or about 4 percent of
all certified forests in the world. Although the certified area
represented only 1.2 percent of the region’s forests, this
was a significant increase from 0.4 percent in 2002. Almost
80 percent was certified by the Forest Stewardship Council,
and the rest under national systems: CERFLOR (Brazil) and
CERTFOR (Chile), which is affiliated with the Programme for
the Endorsement of Forest Certification. Brazil’s CERFLOR
has separate standards for natural and planted forests.
Source: itto, 2008.
BoX 17 forest certification
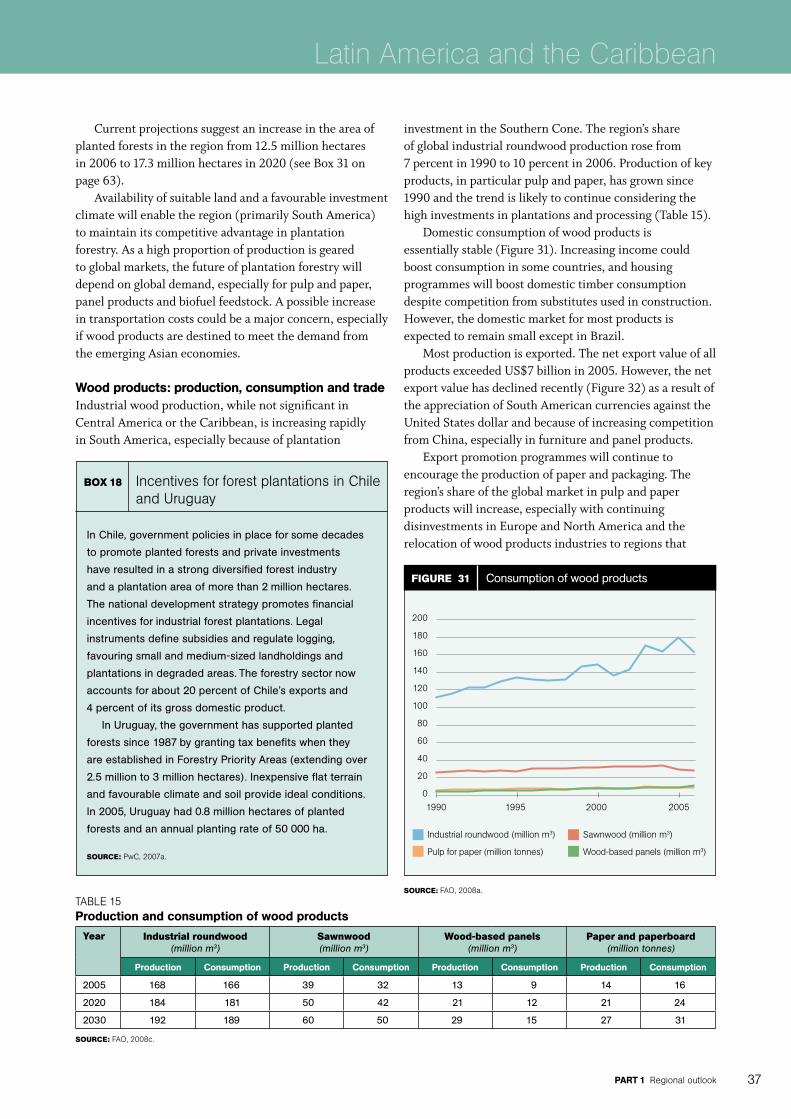
PArt 1 regional outlook 37
Latin America and the Caribbean
Currentprojectionssuggestanincreaseintheareaofplantedforestsintheregionfrom12.5millionhectaresin2006to17.3millionhectaresin2020(seeBox31onpage63).
Availabilityofsuitablelandandafavourableinvestmentclimatewillenabletheregion(primarilySouthAmerica)tomaintainitscompetitiveadvantageinplantationforestry.Asahighproportionofproductionisgearedtoglobalmarkets,thefutureofplantationforestrywilldependonglobaldemand,especiallyforpulpandpaper,panelproductsandbiofuelfeedstock.Apossibleincreaseintransportationcostscouldbeamajorconcern,especiallyifwoodproductsaredestinedtomeetthedemandfromtheemergingAsianeconomies.
Wood products: production, consumption and tradeIndustrialwoodproduction,whilenotsignificantinCentralAmericaortheCaribbean,isincreasingrapidlyinSouthAmerica,especiallybecauseofplantation
investmentintheSouthernCone.Theregion’sshareofglobalindustrialroundwoodproductionrosefrom7percentin1990to10percentin2006.Productionofkeyproducts,inparticularpulpandpaper,hasgrownsince1990andthetrendislikelytocontinueconsideringthehighinvestmentsinplantationsandprocessing(Table15).
Domesticconsumptionofwoodproductsisessentiallystable(Figure31).Increasingincomecouldboostconsumptioninsomecountries,andhousingprogrammeswillboostdomestictimberconsumptiondespitecompetitionfromsubstitutesusedinconstruction.However,thedomesticmarketformostproductsisexpectedtoremainsmallexceptinBrazil.
Mostproductionisexported.ThenetexportvalueofallproductsexceededUS$7billionin2005.However,thenetexportvaluehasdeclinedrecently(Figure32)asaresultoftheappreciationofSouthAmericancurrenciesagainsttheUnitedStatesdollarandbecauseofincreasingcompetitionfromChina,especiallyinfurnitureandpanelproducts.
Exportpromotionprogrammeswillcontinuetoencouragetheproductionofpaperandpackaging.Theregion’sshareoftheglobalmarketinpulpandpaperproductswillincrease,especiallywithcontinuingdisinvestmentsinEuropeandNorthAmericaandtherelocationofwoodproductsindustriestoregionsthat
In Chile, government policies in place for some decades
to promote planted forests and private investments
have resulted in a strong diversified forest industry
and a plantation area of more than 2 million hectares.
The national development strategy promotes financial
incentives for industrial forest plantations. Legal
instruments define subsidies and regulate logging,
favouring small and medium-sized landholdings and
plantations in degraded areas. The forestry sector now
accounts for about 20 percent of Chile’s exports and
4 percent of its gross domestic product.
In Uruguay, the government has supported planted
forests since 1987 by granting tax benefits when they
are established in Forestry Priority Areas (extending over
2.5 million to 3 million hectares). Inexpensive flat terrain
and favourable climate and soil provide ideal conditions.
In 2005, Uruguay had 0.8 million hectares of planted
forests and an annual planting rate of 50 000 ha.
Source: Pwc, 2007a.
BoX 18 incentives for forest plantations in chile and uruguay
taBle 15Production and consumption of wood products
Year industrial roundwood (million m3)
Sawnwood (million m3)
Wood-based panels (million m3)
Paper and paperboard (million tonnes)
Production Consumption Production Consumption Production Consumption Production Consumption
2005 168 166 39 32 13 9 14 16
2020 184 181 50 42 21 12 21 24
2030 192 189 60 50 29 15 27 31
Source: fao, 2008c.
Figure 31 Consumption of wood products
industrial roundwood (million m3) Sawnwood (million m3)
Pulp for paper (million tonnes) Wood-based panels (million m3)
Source: fao, 2008a.
200
180
160
140
120
100
80
60
40
20
01990 1995 2000 2005

stAte oF the World’s Forests 200938
havecompetitiveadvantages.SouthAmerica’sadvantagesincludeastableinvestmentclimate,lowpopulationdensity,favourableconditionsfortreegrowthandsignificanttechnicalcapacity.Consequently,SouthAmericahassomeofthelowestwoodfibrecostsintheworld(PwC,2007b).
WoodfuelHouseholdwoodfueluseisdeclininginSouthAmerica(mainlybecauseofurbanizationandincreaseduseoffossilfuelandbiofuels),steadyintheCaribbeanandrisinginCentralAmerica.Overall,woodfuelproductionintheregionhasbeengrowinggraduallyoverthepasttenyears.Thistrendisexpectedtocontinue(Figure33),mainlyowingtoindustrialcharcoaluseinBrazil(Box19).Futuredemandwillalsodependonthesupplyoffossilfuelsanddevelopmentsinrenewableenergytechnologies.
non-wood forest productsMostNWFPsintheregionareforlocalsubsistenceuse,althoughsomearesoldinnationalandinternationalmarketsasingredientsforhealthandbeautycareproductsandmedicines.Brazilnuts(Bertholletia excelsa)areanimportantsourceofincomeforindigenousgroupsinBolivia,BrazilandPeruandarealsothemostimportantcommercialNWFP;thesupplychainprovidesdirectemploymentfor15000people.Brazilnutsconstitute45percentofBolivia’sforest-relatedexports(morethanthatofallwoodproducts)andcontributemorethan
US$70millionperyeartothenationaleconomy(CIFOR,2008a).
ToreduceconflictsbetweenNWFP-dependentindigenouscommunitiesandloggersandranchersintheAmazon,BrazilhasestablishedextractivereservesexclusivelyforthecollectionofNWFPs.Thismodel,whichgrantslong-termrightsinpublicforeststogroupsengagedinsustainableactivities,isspreadingthroughtheregion.Initiativessupportedbycivil-societyorganizationsandgovernmentshaveimprovedNWFPcollection,valueadditionandmarketing,withthesupportofcertificationandfairtradeorganizations.
Aseconomiesgrowandurbanizeandmorelucrativeincome-earningopportunitiesbecomeavailable,dependenceonNWFPsforsubsistenceisexpectedtodecline.Processingandmarketingofproductsthatarealreadywellknownwillimprove.Localvaluechainswilllargelybereplacedbynationalandglobalchains,oftenassistedthroughfairtradeinitiativesandorganiclabelling.
Figure 32 Net imports and exports
SourceS: fao, 2008a; un, 2008e.
8 000
7 000
6 000
5 000
4 000
3 000
2 000
1 000
0
–1 000
–2 000
–3 000
constant uS$ million (2006)
1990 1992 1994 1996 1998 2000 2002 2004 2006
n
et export n
et import
total forest products Primary wood products
Secondary wood products Primary paper products
non-wood forest products roundwood
Secondary paper products
Figure 33 Woodfuel consumption
Source: fao, 2003b.
300
250
200
150
100
50
0
Million m3
1980 1990 2000 2010 2020
Aside from spearheading the most extensive global
programme to introduce biofuels (ethanol) into its
energy matrix, Brazil also consumes large quantities of
charcoal in its iron and steel industry – an estimated
8.3 million tonnes in 2006. Iron and steel companies and
others involved in supplying charcoal to the industry own
about 1.2 million hectares of forest plantations, which
produced almost 10 million tonnes of charcoal in 2005.
Source: un, 2008f.
BoX 19 charcoal for iron and steel
total latin america and the caribbean caribbean
central america South america
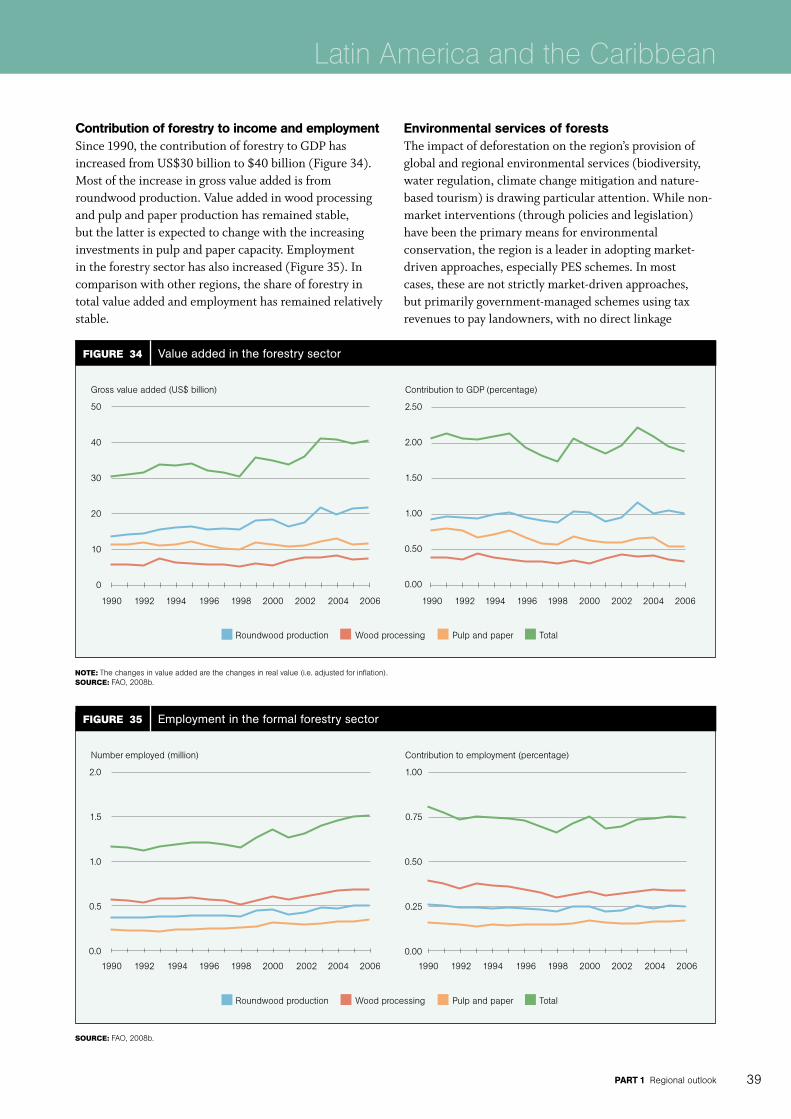
PArt 1 regional outlook 39
Latin America and the Caribbean
Contribution of forestry to income and employmentSince1990,thecontributionofforestrytoGDPhasincreasedfromUS$30billionto$40billion(Figure34).Mostoftheincreaseingrossvalueaddedisfromroundwoodproduction.Valueaddedinwoodprocessingandpulpandpaperproductionhasremainedstable,butthelatterisexpectedtochangewiththeincreasinginvestmentsinpulpandpapercapacity.Employmentintheforestrysectorhasalsoincreased(Figure35).Incomparisonwithotherregions,theshareofforestryintotalvalueaddedandemploymenthasremainedrelativelystable.
environmental services of forestsTheimpactofdeforestationontheregion’sprovisionofglobalandregionalenvironmentalservices(biodiversity,waterregulation,climatechangemitigationandnature-basedtourism)isdrawingparticularattention.Whilenon-marketinterventions(throughpoliciesandlegislation)havebeentheprimarymeansforenvironmentalconservation,theregionisaleaderinadoptingmarket-drivenapproaches,especiallyPESschemes.Inmostcases,thesearenotstrictlymarket-drivenapproaches,butprimarilygovernment-managedschemesusingtaxrevenuestopaylandowners,withnodirectlinkage
Figure 34 Value added in the forestry sector
gross value added (uS$ billion) contribution to gdP (percentage)
roundwood production Wood processing Pulp and paper total
1990 1992 1994 1996 1998 2000 2002 2004 2006
Note: the changes in value added are the changes in real value (i.e. adjusted for inflation). Source: fao, 2008b.
1990 1992 1994 1996 1998 2000 2002 2004 2006
50
40
30
20
10
0
2.50
2.00
1.50
1.00
0.50
0.00
Figure 35 Employment in the formal forestry sector
number employed (million) contribution to employment (percentage)
roundwood production Wood processing Pulp and paper total
1990 1992 1994 1996 1998 2000 2002 2004 2006
Source: fao, 2008b.
1990 1992 1994 1996 1998 2000 2002 2004 2006
2.0
1.5
1.0
0.5
0.0
1.00
0.75
0.50
0.25
0.00

stAte oF the World’s Forests 200940
betweenprovidersandbuyersofenvironmentalservices(Kaimowitz,2007).
Brazil,Colombia,EcuadorandPerurankamongtheworld’stenmostbiodiversecountries,whiletheeasternslopeoftheAndesisthemostbiologicallydiverseareaintheworld.Tencountrieseachhavemorethan1000differenttreespecies.However,theregionalsoleadstheworldinthenumberoftreespeciesconsideredendangeredorvulnerabletoextinction(FAO,2006a).FortypercentoftheplantlifeintheCaribbeanisfoundnowhereelse(USAID,2006).
Establishmentofprotectedareashasbeencoretoenvironmentalconservationintheregion.Between1990and2007,theextentofprotectedareasincreasedfrom213millionto451millionhectares(24percentoftheworld’sprotectedareas)(UN,2008c).However,manygovernmentshavelimitedhumanandfinancialcapacitytoenforceconservationmeasures.Conservationoftencomesintoconflictwithmining,oilextraction,agricultureandlogging,particularlywherepropertyrightsareill-defined.
Theoutlookformaintainingandimprovingwatershedservicesalsodependsonland-usechanges.Itlooksbleakconsideringthehighrateofdeforestation.WaterscarcityisparticularlyacuteintheAndesandinsomeoftheCaribbeanislands.Theregionhasbeenapioneerinimplementingpaymentforwatershedservices.Inmostcases,theschemesaremanagedbyintermediaryorganizations,oftengovernmentagenciesresponsibleformanagingirrigationanddomesticwatersupplyfacilities,whichchannelfundsfromwateruserstolandowners.Thereispotentialtoimproveandscaleupsomeoftheinitiatives.However,wideradoptionwilldependonovercomingsomeobstacles.Theseincludeill-definedpropertyrights;farmers’fearsthattheirresourceswillbeexpropriated;distrustofprivatizationofwatersupply;andinadequateinformationonthetechnicallinkagebetweenupstreamlanduseanddownstreambenefits(Dillahaet al.,2007).
Withitshighdeforestationrate,theregionhasgreatpotentialforreducinggreenhousegasemissionsthroughslowingdeforestationanddegradation.
Ecotourismisanimportantincomegeneratorinseveralcountries,especiallyintheCaribbean.Thehighlydiverseecosystemsmaketheregiononeofthemostpopularecotourismdestinations.Forexample,CostaRicahastakenadvantageofitsnaturalattractionsandmadeecotourismthebackboneofitseconomy.EcuadorearnsmorethanUS$100millionperyearfromnature-basedtourismintheGalapagosIslands.Easieraccessandhigherincomescouldresultincontinuedgrowthofecotourismintheregion–althoughconcernaboutcarbonfootprintsandfurtherecosystemdegradationmaybegintodeterecotourists.Concernisgrowingaboutthreatstobiodiversityfromincreasednumbersofvisitors.Managingtourismsustainablyandenhancingitsbenefitstothepoorwillremainthemajorchallenges.
PESsystems,includingthoseproposedundertheREDDinitiative,willsurelygainmomentum.However,itremainstobeseenwhethertheycanbringaboutsignificantchangesinthebehaviourofthoseresponsibleforforestclearance.PESappearstobeparticularlyeffectivewheretheopportunitycostoflanduseislow.
summAryTheoutlookforforestsandforestryinLatinAmericaandtheCaribbeanwillbeinfluencedbythepaceofdiversificationoftheeconomiesandchangesinlanddependence(FAO,2006c).
InmostCentralAmericanandCaribbeancountries,populationdensitiesarehigh;asurbanizationincreases,thereisasignificantshiftawayfromagricultureandrelatedactivities,especiallyassmallholderagriculturebecomeslessremunerative.Tourismandremittancesfrommigrantworkersarebecomingimportantsourcesofincome.Agriculture-relatedforestclearanceisdecliningandsomeclearedareaswillreverttoforest,asisalreadyevident.
AlthoughpopulationdensityislowinSouthAmerica,highfoodandfuelpriceswillfavourcontinuedforestclearanceforincreasedproductionoflivestockandagriculturalcropsforfood,feedandbiofueltomeetglobaldemand–especiallyasSouthAmericaneconomiesincreaselinkageswithemergingAsianeconomies.
Plantedforestswillspread,promotedbyprivateinvestmentsandcontinuingglobaldemandforwoodproducts,especiallyfromtheemergingAsianeconomies.However,theacceleratedplantationratewillnotoffsetcontinuingdeforestation.
Inshort,thepaceofdeforestationinSouthAmericaisunlikelytodeclineinthenearfuture.Heavilyforestedcountriesthataretakingadvantageoftheexpandingglobaldemandforprimaryproductsandarepursuingapathofrapideconomicdevelopmentwillfinditextremelydifficulttoslowtherateofforestconversion.Provisionofglobalpublicgoods–forexamplecarboncredits–mayhelptosomeextent.However,aneffectivemechanismforprovidingadequateincentivestorefrainfromforestclearancehasyettobedeveloped.

PArt 1 regional outlook 41
Latin America and the Caribbean
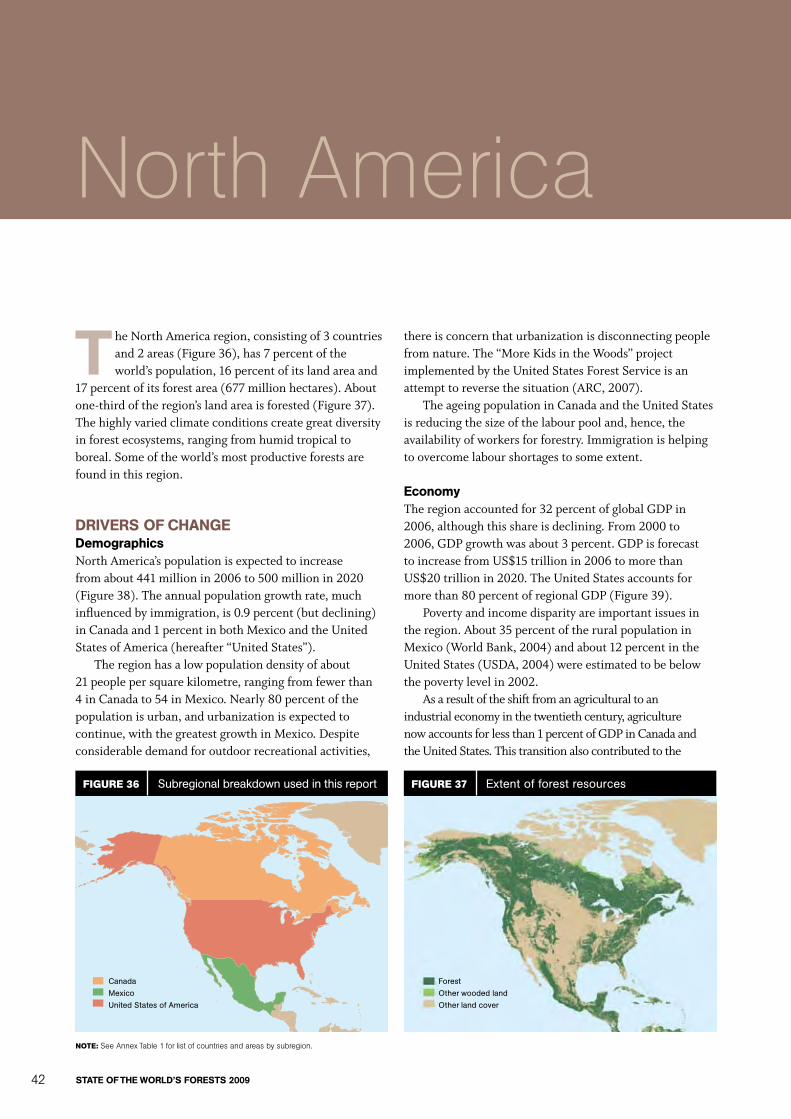
stAte oF the World’s Forests 200942
t heNorthAmericaregion,consistingof3countriesand2areas(Figure36),has7percentoftheworld’spopulation,16percentofitslandareaand
17percentofitsforestarea(677millionhectares).Aboutone-thirdoftheregion’slandareaisforested(Figure37).Thehighlyvariedclimateconditionscreategreatdiversityinforestecosystems,rangingfromhumidtropicaltoboreal.Someoftheworld’smostproductiveforestsarefoundinthisregion.
drivers oF ChAngedemographicsNorthAmerica’spopulationisexpectedtoincreasefromabout441millionin2006to500millionin2020(Figure38).Theannualpopulationgrowthrate,muchinfluencedbyimmigration,is0.9percent(butdeclining)inCanadaand1percentinbothMexicoandtheUnitedStatesofAmerica(hereafter“UnitedStates”).
Theregionhasalowpopulationdensityofabout21peoplepersquarekilometre,rangingfromfewerthan4inCanadato54inMexico.Nearly80percentofthepopulationisurban,andurbanizationisexpectedtocontinue,withthegreatestgrowthinMexico.Despiteconsiderabledemandforoutdoorrecreationalactivities,
thereisconcernthaturbanizationisdisconnectingpeoplefromnature.The“MoreKidsintheWoods”projectimplementedbytheUnitedStatesForestServiceisanattempttoreversethesituation(ARC,2007).
TheageingpopulationinCanadaandtheUnitedStatesisreducingthesizeofthelabourpooland,hence,theavailabilityofworkersforforestry.Immigrationishelpingtoovercomelabourshortagestosomeextent.
economyTheregionaccountedfor32percentofglobalGDPin2006,althoughthisshareisdeclining.From2000to2006,GDPgrowthwasabout3percent.GDPisforecasttoincreasefromUS$15trillionin2006tomorethanUS$20trillionin2020.TheUnitedStatesaccountsformorethan80percentofregionalGDP(Figure39).
Povertyandincomedisparityareimportantissuesintheregion.About35percentoftheruralpopulationinMexico(WorldBank,2004)andabout12percentintheUnitedStates(USDA,2004)wereestimatedtobebelowthepovertylevelin2002.
Asaresultoftheshiftfromanagriculturaltoanindustrialeconomyinthetwentiethcentury,agriculturenowaccountsforlessthan1percentofGDPinCanadaandtheUnitedStates.Thistransitionalsocontributedtothe
North America
Figure 37 Extent of forest resourcesFigure 36 Subregional breakdown used in this report
Note: See annex table 1 for list of countries and areas by subregion.
Canada
Mexico
United States of America
Forest
Other wooded land
Other land cover
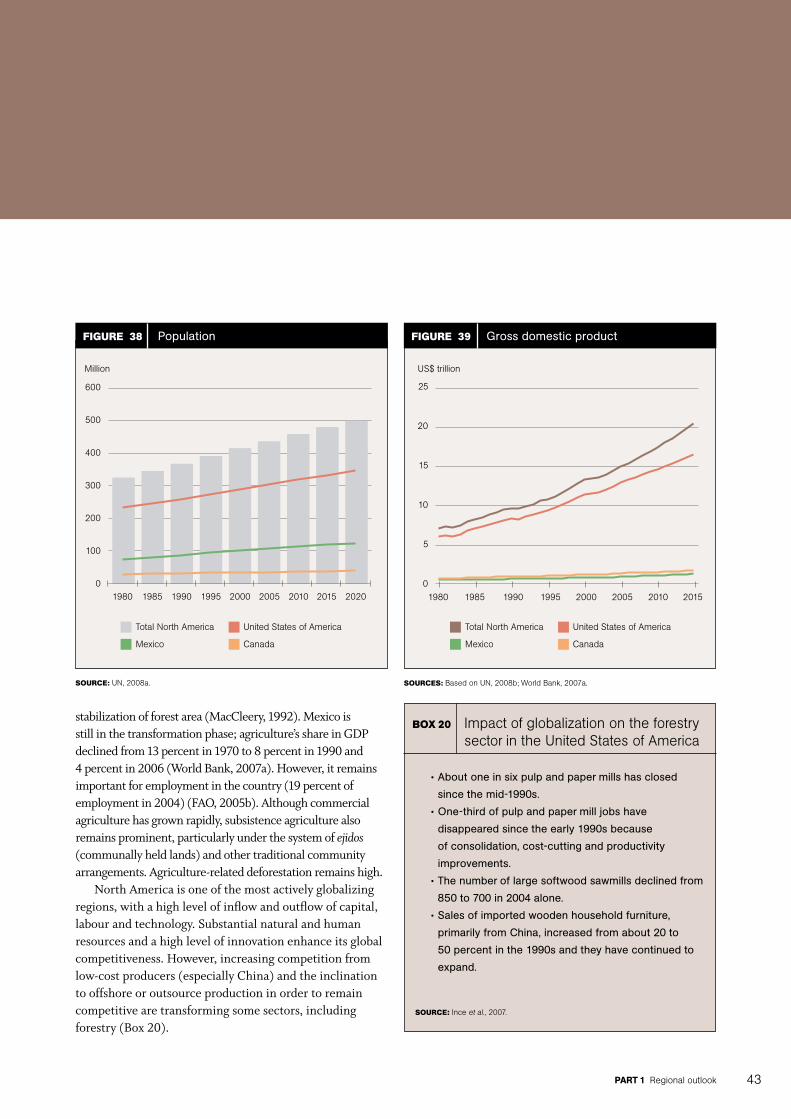
PArt 1 regional outlook 43
stabilizationofforestarea(MacCleery,1992).Mexicoisstillinthetransformationphase;agriculture’sshareinGDPdeclinedfrom13percentin1970to8percentin1990and4percentin2006(WorldBank,2007a).However,itremainsimportantforemploymentinthecountry(19percentofemploymentin2004)(FAO,2005b).Althoughcommercialagriculturehasgrownrapidly,subsistenceagriculturealsoremainsprominent,particularlyunderthesystemofejidos(communallyheldlands)andothertraditionalcommunityarrangements.Agriculture-relateddeforestationremainshigh.
NorthAmericaisoneofthemostactivelyglobalizingregions,withahighlevelofinflowandoutflowofcapital,labourandtechnology.Substantialnaturalandhumanresourcesandahighlevelofinnovationenhanceitsglobalcompetitiveness.However,increasingcompetitionfromlow-costproducers(especiallyChina)andtheinclinationtooffshoreoroutsourceproductioninordertoremaincompetitivearetransformingsomesectors,includingforestry(Box20).
Figure 38 Population
Source: un, 2008a.
600
500
400
300
200
100
0
Million
1980 1985 1990 1995 2000 2005 2010 2015 2020
total north america united States of america
Mexico canada
Figure 39 Gross domestic product
SourceS: Based on un, 2008b; World Bank, 2007a.
25
20
15
10
5
0
uS$ trillion
1980 1985 1990 1995 2000 2005 2010 2015
•About one in six pulp and paper mills has closed
since the mid-1990s.
•One-third of pulp and paper mill jobs have
disappeared since the early 1990s because
of consolidation, cost-cutting and productivity
improvements.
•The number of large softwood sawmills declined from
850 to 700 in 2004 alone.
•Sales of imported wooden household furniture,
primarily from China, increased from about 20 to
50 percent in the 1990s and they have continued to
expand.
Source: ince et al., 2007.
BoX 20 impact of globalization on the forestry sector in the united States of america
total north america united States of america
Mexico canada

stAte oF the World’s Forests 200944
Mexico’sexport-focusedindustrializationisbeingchallengedbycompetitionfromrapidlyindustrializingAsianeconomiesinbothdomesticandglobalmarkets–andparticularlyinUnitedStatesmarkets,whichabsorbmorethan80percentofallMexicanexports.
Since2006,theUnitedStateshasbeenexperiencinganeconomicslowdown,whichisalsoaffectingtheCanadianandMexicaneconomiesbecauseoftheinterdependenceofthecountriesintheregion.Arelatedslumpintheconstructionsectorhasinfluencedthedemandforwoodproducts(discussedbelow).ImportliberalizationundertheNorthAmericanFreeTradeAgeement(NAFTA)hashadmixedimpacts;whileexportshaveincreased,wagesandlivingconditionshavedeclined.Expansionoflarge-scalecommercialagricultureanddisplacementofsmallfarmershaveacceleratedpoverty-relateddeforestation(Audleyet al.,2004).
Policies and institutionsPublicinstitutionsarewelldevelopedandhavecontinuouslyadaptedtothelargereconomicandsocialchanges(MacCleery,2008).Stakeholderconsultationhelpstoincorporatediverseperceptionsinpublicdecision-making.
Theprivatesectorhasapivotalroleinalleconomicactivities,althoughthisisarecenttrendforMexicoandseveralkeynationalizedindustriesremain.Largecorporationshavebeenleadersininnovation.Industryisbecomingmoreconsolidatedthroughmergersandacquisitions.
Community-basedorganizationshaveanimportantroleinnaturalresourcemanagementandhavehelpedindigenouscommunities,especiallyinCanada,tocementtheirrightstoholdlandandtomanagenaturalresources
(Box21).Mexicohasalonghistoryofcommunitymanagementofnaturalresourcesundertheejidos. Policiespromotingprivatizationandchangesintheruraleconomy(particularlyinagricultureandmigration)areenablingtheejidostobenefitfromopportunitiesforprocessingandtradingwoodandotherforestproducts.
Civil-societyorganizations,especiallyinCanadaandtheUnitedStates,contributetoshapingpoliciesandstrategiesintheforestsectorandencouragesocialandenvironmentalresponsibilityinthecorporatesector.Civilaction,togetherwithindustryconsolidationandtechnologicalchanges,hastransformedtheforestsector,especiallyinthewesternUnitedStates.Legalactioninitiatedbycivil-societyorganizationscausedaradicalreductionintimbersupplyfromnationalforestsinthe1990s.SuchorganizationsarealsogrowinginimportanceinMexico.
science and technologyWell-establishedinstitutionsforscienceandtechnologyandsubstantialpublicandprivateinvestmentsinresearchhaveenhancedcompetitivenessinallsectors,includingforestry.InMexico,investment-linkedtechnologytransferhashelpedadvanceforestry(aswellasagriculture),althoughmanyindustriesinMexico,especiallythesmallerones,stilluseoldequipmentandtechnology.
Theforestindustryhascontinuouslyimprovedprocessingtechnologies,enhancingproductivityinordertowithstandglobalcompetition.Especiallyduringeconomicdownturns,theindustrytendstocloseplantsthatarelesseconomicallyviableandinvestinnewplantswithimprovedtechnologies.
Highfossilfuelpricesandconcernsaboutenergysecurityandclimatechangearestimulatinginvestmentsinnewenergytechnologies.Thepulpandpaperindustryisdiversifyingintobiorefining,producingastreamofproducts,includingbiofuels,electricityandchemicals(seeBox48onpage93).Substantialresearchonproducingcellulosicfuelsisunderway,focusingespeciallyonefficientandcost-effectivetechnologiesforbreakingdowncellulose.
WhiletheUnitedStateshaslongbeenaleaderinscienceandtechnology,itisconcernedaboutthepossibilityoflosingthispositionasotherregions(particularlyAsiaandEurope)accelerateinvestmentsinthisarea(TaskForceontheFutureofAmericanInnovation,2005).Forexample,thenumberofresearchscientistsemployedbytheUnitedStatesForestServicehasdeclinedbyabout75percentinthepast30years,withprogressivelymoreresearchbeingfundedbytheprivatesector(USForestService,personalcommunication,2008).
•More than three-quarters of Canada’s indigenous
communities reside in forested areas.
•The forest products industry employs more than
17 000 indigenous people directly and indirectly,
although many are still in lower-skilled, part-time and
seasonal positions.
•The forest industry does business with more than
1 400 firms run by indigenous people.
•About 1 000 forestry operations are owned by
indigenous people.
Source: natural resources canada, 2007a.
BoX 21 indigenous people and canada’s forests

PArt 1 regional outlook 45
North America
overAll sCenArioNorthAmericahasagenerallyfavourabledemographic,political,institutionalandtechnologicalenvironment.However,thecurrenteconomicslowdownintheUnitedStatesandthelargerglobaleconomicchanges(especiallytheemergenceofAsianeconomies)posesomeuncertaintyforthefutureoutlook.Ifthedownturncontinues,reduceddemand,lowinvestmentsanddecliningincomeswouldleadtoreducedconsumerspending,lossofprofitabilityandreducedpublicfundinginmostsectors,includingforestry.Increasingcompetitionandthetendencyoftheprivatesectortooutsourceoroffshoreproductioncouldspurprotectionistmeasures,slowingglobaltradegrowth.
Ontheotherhand,economicrecoveryintheUnitedStates(andbyassociationtherestoftheregion)wouldboostdemandforallproductsandinvestmentsininnovation,acceleratingthetransitiontoaknowledge-basedeconomy.Thisscenariowouldprovideopportunitiesforcontinuedrapidindustrialgrowth,modernizationandpovertyreductioninMexico.
outlookForest areaForestcoverintheregionisstable.NorthAmericaaccountedforanestimated2percentofannualglobaldeforestationfrom2000to2005,althoughtherateoflosshasbeendecreasing.MostofthelosswasinMexico,attributedmainlytoagriculturalexpansionandunsustainablelogging,whiletheUnitedStatesreportedasmallnetgaininforestareafortheperiod(Table16).
IntheUnitedStates,forestareastabilizedintheearlytwentiethcentury(MacCleery,1992).Anetlossofabout2millionhectaresofforestisprojectedbetween1997and2020;thisestimateincludesconversionofforestlandtootheruses,includingurbanandsuburbandevelopment,aswellasafforestationandnaturalreversionofabandonedcropandpasturelandtoforest(USForestService,2008).
ChangeinforestareaisnotstatisticallysignificantinCanada.Ateventhehighestestimates,itwouldtake
40yearsforCanadatolose1percentofitsforestarea(CanadianCouncilofForestMinisters,2006).
However,climatechangemayintensifythreatstoforesthealth.TheintensityandfrequencyofforestfireshaveincreasedinbothCanadaandtheUnitedStates,exacerbatedbyprolongeddrought(attributedtoclimatechange)andsuccessfulfirecontrolprogrammesthathaveinadvertentlyincreasedtheamountofcombustiblematerial.Climatechangeissimilarlyexacerbatingpestinfestations;inthewestofCanadaandtheUnitedStates,themountainpinebeetleiscausingparticularlyseriousdamageandtreeloss(Box22).
ThesituationinMexicoismoreuncertainanddependsonthepaceoftransitionfromanagrariantoanindustrialsocietyandtheimpactitmayhaveonpovertyandlanddependence.Higherincomescouldimprovesociety’sabilitytoinvestinconservationandforestmanagement(ComisiónNacionalForestal,Mexico,2008).Inrecentyears,thegovernmenthasincreasedsubstantiallytheallocationto
taBle 16Forest area: extent and change
country/region Area (1 000 ha)
Annual change (1 000 ha)
Annual change rate(%)
1990 2000 2005 1990–2000 2000–2005 1990–2000 2000–2005
Canadaa 310 134 310 134 310 134 0 0 0 0
Mexico 69 016 65 540 64 238 –348 –260 –0.52 –0.40
United States of America 298 648 302 294 303 089 365 159 0.12 0.05
total North Americab 677 801 677 971 677 464 17 –101 0 –0.01
World 4 077 291 3 988 610 3 952 025 –8 868 –7 317 –0.22 –0.18
a Because data from previous inventories cannot be compared meaningfully, figures from the most recent inventory are given for all three reporting years (fao, 2006a).b regional total includes greenland and Saint Pierre and Miquelon.Note: date presented are subject to rounding.Source: fao, 2006a.
Spreading through western Canada, the mountain
pine beetle (Dendroctonus ponderosae) has infested
13 million hectares of pine forests (mostly lodgepole pine,
Pinus contorta) and is expected to kill up to 80 percent of all
pine stands in the Province of British Columbia. More than
530 million cubic metres of timber had been lost in British
Columbia by 2007 and it is predicted that 1 billion cubic
metres will be lost by 2018. The loss of trees is releasing
more carbon than that from forest fires in spite of efforts to
salvage the timber (which continues to store carbon).
The beetle is native to North America, but its range
has spread northward and to higher elevations with
milder winters. Temperatures below –40 ºC on several
consecutive nights will kill the larvae, but such cold spells
have become rare.
SourceS: Brown, 2008; natural resources canada, 2007b.
BoX 22 Mountain pine beetle infestation in British columbia, canada
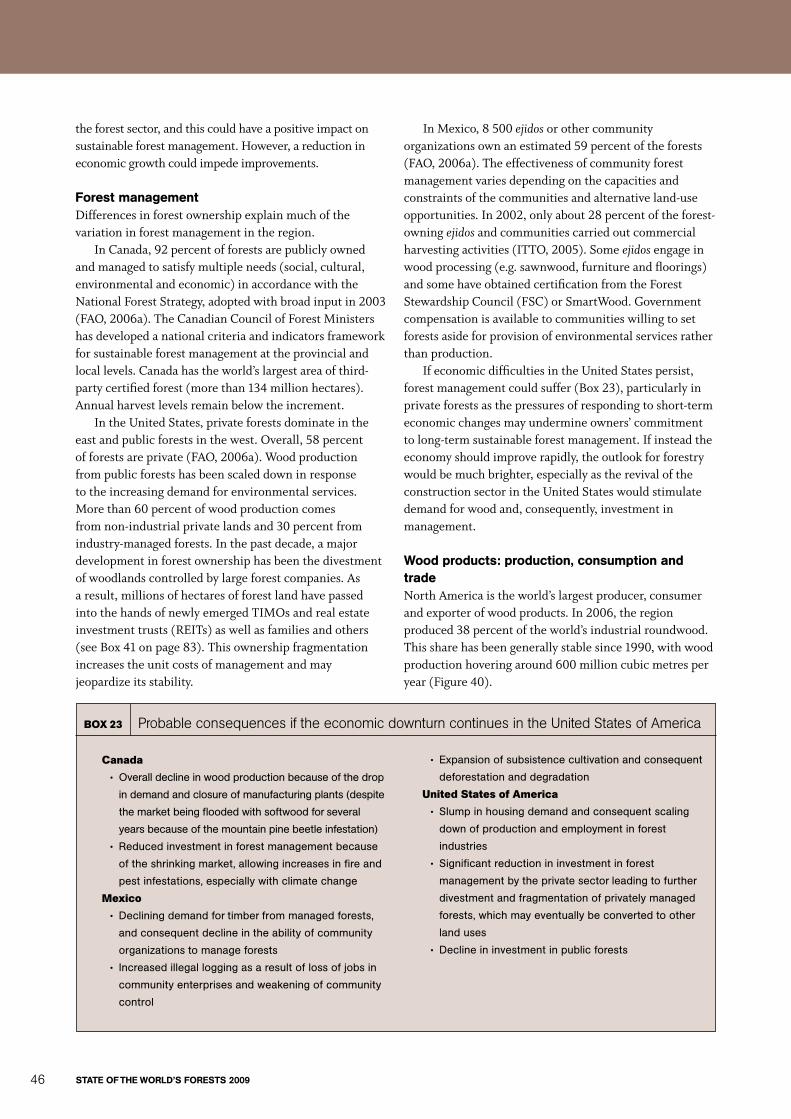
stAte oF the World’s Forests 200946
theforestsector,andthiscouldhaveapositiveimpactonsustainableforestmanagement.However,areductionineconomicgrowthcouldimpedeimprovements.
Forest managementDifferencesinforestownershipexplainmuchofthevariationinforestmanagementintheregion.
InCanada,92percentofforestsarepubliclyownedandmanagedtosatisfymultipleneeds(social,cultural,environmentalandeconomic)inaccordancewiththeNationalForestStrategy,adoptedwithbroadinputin2003(FAO,2006a).TheCanadianCouncilofForestMinistershasdevelopedanationalcriteriaandindicatorsframeworkforsustainableforestmanagementattheprovincialandlocallevels.Canadahastheworld’slargestareaofthird-partycertifiedforest(morethan134millionhectares).Annualharvestlevelsremainbelowtheincrement.
IntheUnitedStates,privateforestsdominateintheeastandpublicforestsinthewest.Overall,58percentofforestsareprivate(FAO,2006a).Woodproductionfrompublicforestshasbeenscaleddowninresponsetotheincreasingdemandforenvironmentalservices.Morethan60percentofwoodproductioncomesfromnon-industrialprivatelandsand30percentfromindustry-managedforests.Inthepastdecade,amajordevelopmentinforestownershiphasbeenthedivestmentofwoodlandscontrolledbylargeforestcompanies.Asaresult,millionsofhectaresofforestlandhavepassedintothehandsofnewlyemergedTIMOsandrealestateinvestmenttrusts(REITs)aswellasfamiliesandothers(seeBox41onpage83).Thisownershipfragmentationincreasestheunitcostsofmanagementandmayjeopardizeitsstability.
InMexico,8500ejidosorothercommunityorganizationsownanestimated59percentoftheforests(FAO,2006a).Theeffectivenessofcommunityforestmanagementvariesdependingonthecapacitiesandconstraintsofthecommunitiesandalternativeland-useopportunities.In2002,onlyabout28percentoftheforest-owningejidosandcommunitiescarriedoutcommercialharvestingactivities(ITTO,2005).Someejidosengageinwoodprocessing(e.g.sawnwood,furnitureandfloorings)andsomehaveobtainedcertificationfromtheForestStewardshipCouncil(FSC)orSmartWood.Governmentcompensationisavailabletocommunitieswillingtosetforestsasideforprovisionofenvironmentalservicesratherthanproduction.
IfeconomicdifficultiesintheUnitedStatespersist,forestmanagementcouldsuffer(Box23),particularlyinprivateforestsasthepressuresofrespondingtoshort-termeconomicchangesmayundermineowners’commitmenttolong-termsustainableforestmanagement.Ifinsteadtheeconomyshouldimproverapidly,theoutlookforforestrywouldbemuchbrighter,especiallyastherevivaloftheconstructionsectorintheUnitedStateswouldstimulatedemandforwoodand,consequently,investmentinmanagement.
Wood products: production, consumption and tradeNorthAmericaistheworld’slargestproducer, consumerandexporterofwoodproducts.In2006,theregionproduced38percentoftheworld’sindustrialroundwood.Thissharehasbeengenerallystablesince1990,withwoodproductionhoveringaround600millioncubicmetresperyear(Figure40).
canada
• Overall decline in wood production because of the drop
in demand and closure of manufacturing plants (despite
the market being flooded with softwood for several
years because of the mountain pine beetle infestation)
• Reduced investment in forest management because
of the shrinking market, allowing increases in fire and
pest infestations, especially with climate change
Mexico
• Declining demand for timber from managed forests,
and consequent decline in the ability of community
organizations to manage forests
• Increased illegal logging as a result of loss of jobs in
community enterprises and weakening of community
control
• Expansion of subsistence cultivation and consequent
deforestation and degradation
united States of America
• Slump in housing demand and consequent scaling
down of production and employment in forest
industries
• Significant reduction in investment in forest
management by the private sector leading to further
divestment and fragmentation of privately managed
forests, which may eventually be converted to other
land uses
• Decline in investment in public forests
BoX 23 Probable consequences if the economic downturn continues in the united States of america
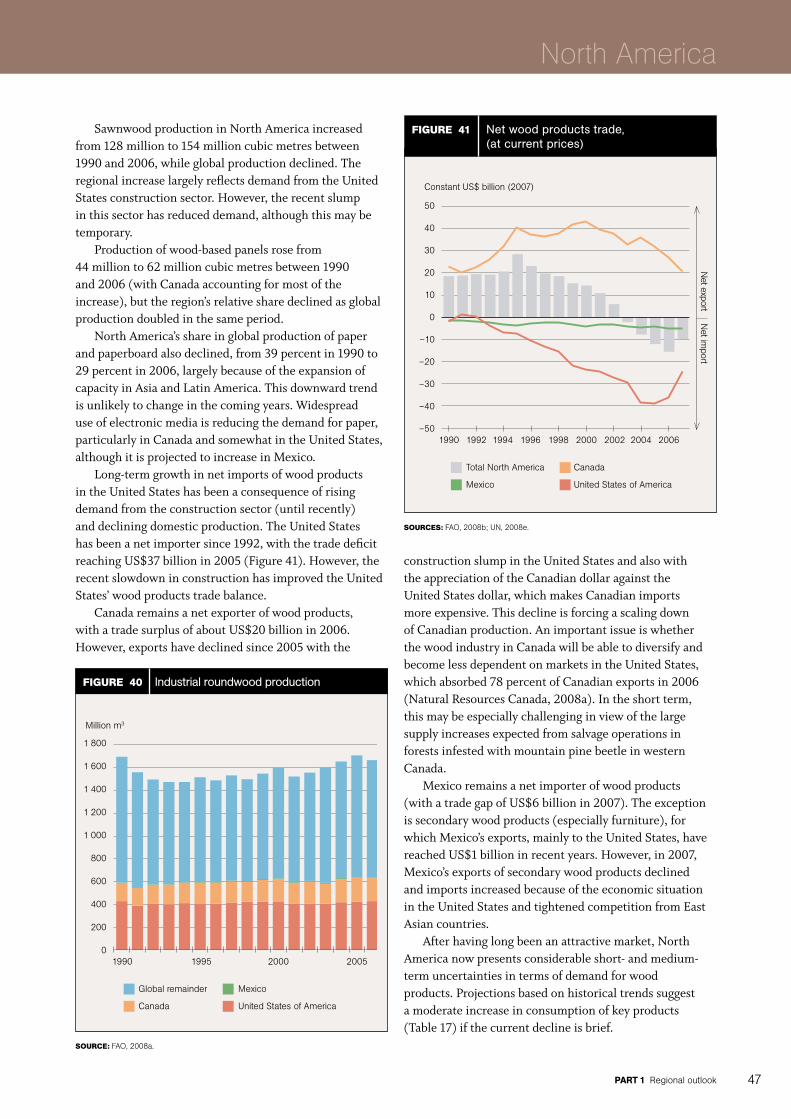
PArt 1 regional outlook 47
North America
SawnwoodproductioninNorthAmericaincreasedfrom128millionto154millioncubicmetresbetween1990and2006,whileglobalproductiondeclined.TheregionalincreaselargelyreflectsdemandfromtheUnitedStatesconstructionsector.However,therecentslumpinthissectorhasreduceddemand,althoughthismaybetemporary.
Productionofwood-basedpanelsrosefrom44millionto62millioncubicmetresbetween1990and2006(withCanadaaccountingformostoftheincrease),buttheregion’srelativesharedeclinedasglobalproductiondoubledinthesameperiod.
NorthAmerica’sshareinglobalproductionofpaperandpaperboardalsodeclined,from39percentin1990to29percentin2006,largelybecauseoftheexpansionofcapacityinAsiaandLatinAmerica.Thisdownwardtrendisunlikelytochangeinthecomingyears.Widespreaduseofelectronicmediaisreducingthedemandforpaper,particularlyinCanadaandsomewhatintheUnitedStates,althoughitisprojectedtoincreaseinMexico.
Long-termgrowthinnetimportsofwoodproductsintheUnitedStateshasbeenaconsequenceofrisingdemandfromtheconstructionsector(untilrecently)anddecliningdomesticproduction.TheUnitedStateshasbeenanetimportersince1992,withthetradedeficitreachingUS$37billionin2005(Figure41).However,therecentslowdowninconstructionhasimprovedtheUnitedStates’woodproductstradebalance.
Canadaremainsanetexporterofwoodproducts,withatradesurplusofaboutUS$20billionin2006.However,exportshavedeclinedsince2005withthe
constructionslumpintheUnitedStatesandalsowiththeappreciationoftheCanadiandollaragainsttheUnitedStatesdollar,whichmakesCanadianimportsmoreexpensive.ThisdeclineisforcingascalingdownofCanadianproduction.AnimportantissueiswhetherthewoodindustryinCanadawillbeabletodiversifyandbecomelessdependentonmarketsintheUnitedStates,whichabsorbed78percentofCanadianexportsin2006(NaturalResourcesCanada,2008a).Intheshortterm,thismaybeespeciallychallenginginviewofthelargesupplyincreasesexpectedfromsalvageoperationsinforestsinfestedwithmountainpinebeetleinwesternCanada.
Mexicoremainsanetimporterofwoodproducts(withatradegapofUS$6billionin2007).Theexceptionissecondarywoodproducts(especiallyfurniture),forwhichMexico’sexports,mainlytotheUnitedStates,havereachedUS$1billioninrecentyears.However,in2007,Mexico’sexportsofsecondarywoodproductsdeclinedandimportsincreasedbecauseoftheeconomicsituationintheUnitedStatesandtightenedcompetitionfromEastAsiancountries.
Afterhavinglongbeenanattractivemarket,NorthAmericanowpresentsconsiderableshort-andmedium-termuncertaintiesintermsofdemandforwoodproducts.Projectionsbasedonhistoricaltrendssuggestamoderateincreaseinconsumptionofkeyproducts(Table17)ifthecurrentdeclineisbrief.
Figure 40 Industrial roundwood production
Source: fao, 2008a.
1 800
1 600
1 400
1 200
1 000
800
600
400
200
0
Million m3
1990 1995 2000 2005
Figure 41 Net wood products trade, (at current prices)
SourceS: fao, 2008b; un, 2008e.
50
40
30
20
10
0
–10
–20
–30
–40
–50
constant uS$ billion (2007)
1990 1992 1994 1996 1998 2000 2002 2004 2006
net export n
et import
total north america canada
Mexico united States of america
global remainder Mexico
canada united States of america

stAte oF the World’s Forests 200948
WoodfuelIn2005,woodfuelcontributedabout3percentoftotalenergyconsumptionintheUnitedStates,about4.5percentinCanadaandabout5percentinMexico(IEA,2007).WoodfueldemandinMexicohasbeendecliningbecauseofurbanizationandimprovedaccesstootherenergysources(includingfossilfuels),buthouseholddependenceonwoodfuelremainshighinsomeruralareas;thevolumeofwoodextractedforfuelmaybeuptofourtimesthatofindustrialtimberproduction.Mostwoodfuelisharvestedwithoutamanagementscheme.
InCanadaandtheUnitedStates,thewoodproductsindustryleadsintheuseofenergyfrombiomass,producingitsownheatandelectricityusingcogenerationtechnology.ThepulpandpaperindustryinCanadaderives57percentofitsenergyfromforestbiomass.
Policyinitiativesrespondingtoescalatingenergycostsandclimatechangeareexpectedtoenhancetheuseofwoodenergy(Box24).Thedemandforwoodpelletsforuseinheatinghasincreasedsignificantlyinrecentyears.TheUnitedStatesconsumedthelargestamountofwoodpelletsforthispurposein2006,around1.4milliontonnes(seeBox12onpage28).In2006,CanadaandtheUnitedStatesproducedabout1.5millionand1milliontonnesofwoodpellets,respectively,rankingsecondandthirdbehindSweden.Eventualcommercial-scalecellulosicbiofuelproductioncouldhaveimportantimpactsontheforestsector.
non-wood forest products RuralcommunitiesinMexicodependonNWFPsforsubsistenceandincome,althoughtheiruseisdecliningrapidlybecauseofurbanization,changesinemploymentandavailabilityofcheaperalternatives.NWFPharvestinginCanadaandtheUnitedStatestypicallytakesplaceaspartofforestrecreationandculturaltraditions,anditisincreasing.ProductionofthefeweconomicallyimportantNWFPswithlong-establishedmarkets–notablymaplesyrupandChristmastrees–ishighlycommercialized.Bothmarketshavebeenstablesince1994andareexpectedtoremainso.Canadaaccountsfor85percentoftheworld’smaplesyrupproductionandtheUnitedStates
producestherest.Canadaproduced3.2millionChristmastreesin2005(NaturalResourcesCanada,2008a).
Marketsforherbalproducts,includingforestmedicinalplants,areexpandingassocietybecomesincreasinglyhealthconscious.Largepharmaceuticalcompaniesareinvestingintheproductionandmarketingofherbalplantproducts,whichhavebecomeamultibillion-dollarindustryintheUnitedStates(Alexander,WeigandandBlatner,2002).
Contribution of forestry to income and employmentOverall,thegrossvalueaddedbytheregion’sforestrysectorhasincreasedfromaboutUS$130billionin1990toUS$148billionin2006(Figure42).Mostoftheincreaseisattributedtowoodprocessing,whilepulpandpaperproductionhasmarginallydeclined.However,grossvalue
taBle 17Production and consumption of wood products
Year industrial roundwood (million m3)
Sawnwood (million m3)
Wood-based panels (million m3)
Paper and paperboard (million tonnes)
Production Consumption Production Consumption Production Consumption Production Consumption
1990 591 570 128 117 44 43 91 87
2005 625 620 156 158 59 70 109 106
2020 728 728 191 188 88 96 141 138
2030 806 808 219 211 110 115 169 165
canada
• Clean Air Agenda (2006): sets federal emission
targets, allocates resources for the ecoENERGY
for Renewable Power programme and promotes
blended transportation fuel
• Regulatory Framework for Air Emissions: uses
carbon credits to encourage renewable power
production through cogeneration
Mexico
• Law for the Promotion and Development of
Bioenergy (2008): aims to promote biomass energy
without compromising food security
united States of America
• Energy Independence and Security Act (2007):
sets targets for biofuel use (including wood-derived
biofuels) to 2022 and sets a national fuel economy
standard of 15 km per litre by 2020
• Biofuels Initiative (2006): aims to make cellulosic
ethanol cost-competitive by 2012 and to replace
30 percent of current petrol consumption with
biofuels by 2030
BoX 24 examples of policy initiatives to promote bioenergy

PArt 1 regional outlook 49
North America
addedasaproportionofGDPhasdroppedfromabout1.4percenttolessthan1percent.
Thenumberofpeopleemployedbythesectordeclinedbyabout140000between1990and2006(Figure43),reflectingtechnologicalchangesandimprovedproductivity.Forestryemploymentaccountedforabout0.8percentoftotalemploymentin2006.
Asmoreforestsaretakenoutofproduction,bothgrossvalueaddedandemploymentintheforestrysectorareexpectedtodecline.
environmental services of forestsAsincomeincreases,societytendstoassigngreaterimportancetoenvironmentalconservation.EspeciallyinCanadaandtheUnitedStates,ahostofinstitutions–public,private,communityandcivilsociety–areinvolvedinissuesofclimatechangemitigation,biodiversityconservationandmaintainingwatersupplies.Thesecountrieshavearobustpoliticalandregulatoryframeworkforenvironmentalprotection.Complexpoliticalprocesseshavebeendevelopedtobalancetrade-offsbetweencompetingobjectivesandinterests.
Figure 43 Employment in the formal forestry sector
number employed (million) contribution to employment (percentage)
roundwood production Wood processing Pulp and paper total
1990 1992 1994 1996 1998 2000 2002 2004 2006
Source: fao, 2008b.
1990 1992 1994 1996 1998 2000 2002 2004 2006
2.5
2.0
1.5
1.0
0.5
0.0
1.25
1.00
0.75
0.50
0.25
0.00
Figure 42 Value added in the forestry sector
gross value added (uS$ billion) contribution to gdP (percentage)
roundwood production Wood processing Pulp and paper total
1990 1992 1994 1996 1998 2000 2002 2004 2006
Note: the changes in value added are the changes in real value (i.e. adjusted for inflation). Source: fao, 2008b.
1990 1992 1994 1996 1998 2000 2002 2004 2006
160
140
120
100
80
60
40
20
0
1.60
1.40
1.20
1.00
0.80
0.60
0.40
0.20
0.00
stAte oF the World’s Forests 200950
Mexicoisoneofthefivemostbiologicallydiversecountriesintheworld,butcontinueddependenceonlandandconsequentforestclearancearechallengestobiodiversityprotectioninthecountry(ConservationInternational,2005).
NorthAmericahad360millionhectaresofprotectedareasin2006,ofwhichmorethan70percentwasintheUnitedStates(UN,2008c).Aseriesoflegislativeandregulatoryactionsprotectwildernessesandexcludelargetractsofpubliclandfromloggingorland-usechanges;anexampleintheUnitedStatesistheRoadlessAreasConservationRuleof2001,whichestablishesprohibitionsonroadconstructionandtimberharvestingininventoriedroadlessareasonNationalForestSystemlands.Arrangementsforprotectinguniqueecosystemsincludeconservationeasements–agreementsbetweenlandownersandgovernmentagenciesorlandprotectionorganizations(“landtrusts”)restrictingdevelopmentofcertainlands.
Theroleofforestsincarbonsequestrationisrecognizedandaddressedthroughmarketandnon-marketinitiativesinvolvingafforestationandreforestation.IntheUnitedStates,severalstateshaveinitiatedmandatoryemissionreductionprogrammesinvolvingoffsets.InOregon,forexample,newpowerplantscanmeetemissionstandardsthroughoffsetspurchasedfromtheOregonClimateTrust,underwhichtherewerethreeforestry-relatedprojectsin2008,accountingfor21percentofoffsets(GorteandRamseur,2008).Voluntarymarkets(e.g.theChicagoClimateExchange)andreportingandregistryprogrammes(e.g.theCaliforniaClimateActionRegistry)haveexpandedrapidlyandrecognizeforestryprojects.Inearly2008,threeregionalpartnerships–RegionalGreenhouseGasInitiative,WesternClimateInitiativeandMidwesternGreenhouseGasReductionAccord–involved23statesoftheUnitedStatesand4provincesofCanadaindevelopingemissioncapsandoffsetprojects,includingsomeinforestry.Theseactivitiessuggestcontinuedgrowthof
carbonmarketsandpossiblyanincreasingroleofforestryprovideditisseenasaneconomicallyviableoption.
Forests’roleinwaterprovisionisimportant.Mexicohasrecentlyinitiatedasystemforpaymentforwaterservices(Box25).SimilarinitiativesexistinCanadaandtheUnitedStates.
InCanadaandtheUnitedStates,outdoorrecreationisamajoruseofforestsandwoodlandsandhasbecomeanimportantsourceofincomeinmanyforestedareas.IntheUnitedStates,oneinfiveleisuretravellersvisitednationalforestsin2006(ARC,2006).
summAryUncertaintyinNorthAmericanforestryisaconsequenceofthecurrenteconomicdownturnintheUnitedStatesand,inparticular,theconsequentdecliningconstructionsectordemand.Ifthisispartofacycleleadingtoeventualrecovery,thereshouldbefewmajorsurprisesinthenext10–15years.However,thesectorwillneedtoaddressseveralchallenges:
• climatechange,theincreasingfrequencyandseverityofforestfiresanddamagebyinvasivepestspecies;
• challengestosustainableforestryposedbythecombinationofincreasedglobaldemandforfoodandbiofuelsanddecliningprofitabilityoftraditionalwoodindustries;
• lossofcompetitivenesstoemergingproducersofwoodproducts,especiallyBrazil,ChileandChina,requiringcontinuedinnovationinordertoexpandexportsandcapturegrowingmarketsinAsia.
InMexico,therateofdeforestationwillcontinuetodeclineasurbanizationcontinuesandasincreasinginvestmentsinreforestationandimprovedmanagementpracticesresultinmoresustainableforestmanagement.
Whiletheeconomicviabilityoftheforestindustrymayfluctuateandevendecline,theprovisionofenvironmentalservicesinNorthAmericawillcontinuetogaininimportance,drivenbypublicinterest.Manyconservationinitiativeswillbespearheadedbycivil-societyorganizations,whichareabletomobilizesubstantialpublicsupport.Woodwillbeincreasinglydemandedasasourceofenergy,especiallyifcellulosicbiofuelproductionbecomescommerciallyviable.
Mexico suffers both high deforestation rates and severe
water scarcity. In 2003, the Government of Mexico
launched a programme to compensate landowners for
maintaining forests for watershed protection and aquifer
recharge in areas where commercial forestry is not
competitive. Funds are collected annually from water
users. Between 2003 and 2006, US$110 million was
allocated to landowners (both private and community)
under agreements covering about 500 000 ha.
Source: Muñoz-Piña et al., 2006.
BoX 25 Payment for hydrological services in Mexico

PArt 1 regional outlook 51
North America

stAte oF the World’s Forests 200952
W esternandCentralAsia,consistingof25countriesandareas(Figure44),istheleastforestedregionintheworld,withonly
4percentforestcover(1.1percentoftheglobalforestarea)(Figure45).Afewcountriesaccountformostoftheforestarea;19countrieshavelessthan10percentforestcover.About75percentoftheregionisarid,withlowbiomassproductivity.VegetationrangesfromdesertscrubinCentralAsiaandtheArabianPeninsulatopocketsofmangroveforestsonthePersianGulfcoastandalpinemeadowsinCentralAsia.Inviewofthelowforestcover,treesoutsideforests,especiallyonfarmsandinotherwoodedland,haveimportantproductiveandprotectivefunctions.
drivers oF ChAngedemographicsWesternandCentralAsia’spopulationisexpectedtoincreasefrom371millionin2006to479millionin2020(Figure46).Populationintheregionisprojectedtogrowatanannualrateof2percentbetween2005and2020.
WhileArmenia,Azerbaijan,GeorgiaandKazakhstanhavelowtonegativegrowthrates,severalcountries–forexampleAfghanistan,Qatar,theSyrianArabRepublic,theUnitedArabEmiratesandYemen–havegrowthratesexceeding2.5percent.Ahighproportionofthepopulationislessthan14yearsold,implyingconsiderablegrowthintheworking-agepopulationinthenexttwodecadesandaconsequentneedformorejobs,housingandamenities.Intensifyingthisneedisthehighrateofurbanization;inWesternAsia,forexample,78percentofthepopulationisforecasttobeurbanby2020.Urbanizationisalsoincreasingthedemandforgreenspaces,bringingaboutimportantchangesinforestpolicies(AmirandRechtman,2006).
economyEconomicgrowthintheregionhasbeenrobustinthepastdecade(IMF,2008),largelybecauseoftherisingpriceoffossilfuels.Continuedglobaldemandwillkeepenergypriceshigh,sustainingahighrateofincomegrowthinthenextdecadeandbeyond(Figure47).Withtheexceptionofasmallnumberofnon-fossil-fuel-producingcountries,per
Western and Central Asia
Figure 45 Extent of forest resources
Forest
Other wooded land
Other land cover
Figure 44 Subregional breakdown used in this report
Western Asia
Central Asia
Note: See annex table 1 for list of countries and areas by subregion.
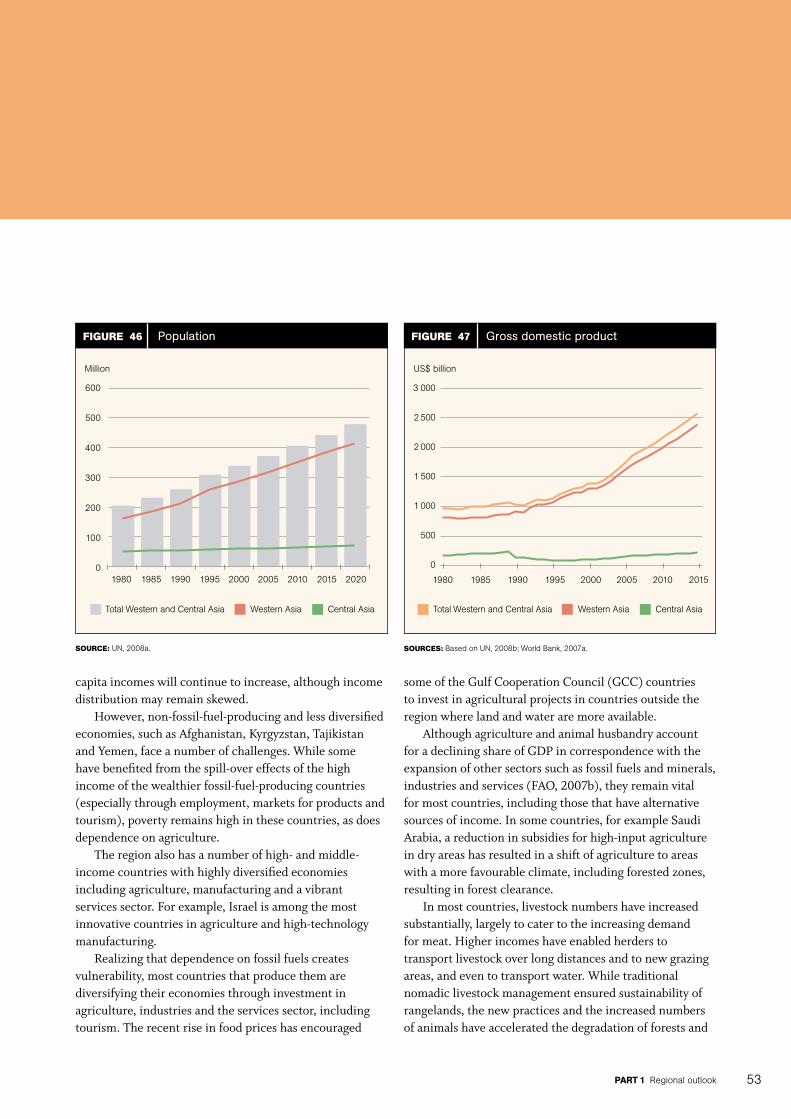
PArt 1 regional outlook 53
capitaincomeswillcontinuetoincrease,althoughincomedistributionmayremainskewed.
However,non-fossil-fuel-producingandlessdiversifiedeconomies,suchasAfghanistan,Kyrgyzstan,TajikistanandYemen,faceanumberofchallenges.Whilesomehavebenefitedfromthespill-overeffectsofthehighincomeofthewealthierfossil-fuel-producingcountries(especiallythroughemployment,marketsforproductsandtourism),povertyremainshighinthesecountries,asdoesdependenceonagriculture.
Theregionalsohasanumberofhigh-andmiddle-incomecountrieswithhighlydiversifiedeconomiesincludingagriculture,manufacturingandavibrantservicessector.Forexample,Israelisamongthemostinnovativecountriesinagricultureandhigh-technologymanufacturing.
Realizingthatdependenceonfossilfuelscreatesvulnerability,mostcountriesthatproducethemarediversifyingtheireconomiesthroughinvestmentinagriculture,industriesandtheservicessector,includingtourism.Therecentriseinfoodpriceshasencouraged
someoftheGulfCooperationCouncil(GCC)countriestoinvestinagriculturalprojectsincountriesoutsidetheregionwherelandandwateraremoreavailable.
AlthoughagricultureandanimalhusbandryaccountforadecliningshareofGDPincorrespondencewiththeexpansionofothersectorssuchasfossilfuelsandminerals,industriesandservices(FAO,2007b),theyremainvitalformostcountries,includingthosethathavealternativesourcesofincome.Insomecountries,forexampleSaudiArabia,areductioninsubsidiesforhigh-inputagricultureindryareashasresultedinashiftofagriculturetoareaswithamorefavourableclimate,includingforestedzones,resultinginforestclearance.
Inmostcountries,livestocknumbershaveincreasedsubstantially,largelytocatertotheincreasingdemandformeat.Higherincomeshaveenabledherderstotransportlivestockoverlongdistancesandtonewgrazingareas,andeventotransportwater.Whiletraditionalnomadiclivestockmanagementensuredsustainabilityofrangelands,thenewpracticesandtheincreasednumbersofanimalshaveacceleratedthedegradationofforestsand
Figure 46 Population
Source: un, 2008a.
600
500
400
300
200
100
0
Million
1980 1985 1990 1995 2000 2005 2010 2015 2020
Figure 47 Gross domestic product
SourceS: Based on un, 2008b; World Bank, 2007a.
3 000
2 500
2 000
1 500
1 000
500
0
uS$ billion
1980 1985 1990 1995 2000 2005 2010 2015
total Western and central asia Western asia central asia total Western and central asia Western asia central asia

stAte oF the World’s Forests 200954
rangelands(FAO,2008f).Insomeofthefossil-fuel-richcountries,formerherdersandfarmerswhohavemovedtourbanareasemploymigrantworkerstotakeovertheirformeroccupation;hence,thepressureonforestsandrangelandscontinues.
Policies and institutionsPoliciesandinstitutionsinandbeyondtheforestsectorarechangingatdifferentpacesdependingonthelargerpoliticalframeworkinthecountries.Forexample,thecollapseoftheSovietUnionbroughtmajortransformationsinCentralAsiathathavehaddirectandindirectimpactsontheforestsector.Institutionalcapacitieshavedeclined,andforestpolicies,legislationandinstitutionshavenotyetbeenadaptedtoaddressnewchallengesinadecentralizedframework.Insomeareas,conflict-relatedinstabilityisundermininginstitutionalcapacity.
Historically,localcommunityinstitutionshadakeyroleinresourcemanagement,buttheadventofgovernmentcontrolunderminedtraditionalmanagementsystems,oftenresultinginunregulatedresourceuse(GovernmentofOman,2005).Whilesomecountrieshaveattemptedtobroadenparticipation(Box26),participatoryapproacheshavenotyettakenrootinmostcountries.However,wheredemocraticprocessesarewellestablished(e.g.Cyprus),forestpoliciesandinstitutionsarerespondingtosociety’schangingneeds,forexample,bymovingthefocusofforestmanagementfromwoodproductiontotheprovisionofenvironmentalservicesandbyencouragingparticipatoryapproaches.
Private-sectorinvolvementinforestmanagementislimited,largelybecausemostlandispubliclyowned,andmoreimportantlybecauseproductivityandcommercialviabilityarepoor.However,inmostcountries,theprivatesectorisdominantinforestindustriesandtradeinforestproducts.
science and technologyFrom1997to2002,averageR&Dexpenditureintheregionremainedbelow0.5percentoftotalGDP(FAO,2007c),significantlylowerthantheworldaverageevenfordevelopingcountries.However,thenumberofInternetusersisrising,indicatingthataccesstoinformationisincreasing.MostcountriesinCentralAsiabenefitedfromthelargescienceandtechnologyinfrastructurebaseoftheSovietUnion,andthescientificcapacityofthesecountrieshasdeclinedsinceitscollapse.Limitedresources,atop-downapproachtoR&Dandthelossofcompetentscientiststhroughemigrationhaveaffectedthescientificandtechnologicalcapabilitiesofmostcountriesintheregion,withtheexceptionofafewsuchastheIslamicRepublicofIranandTurkey.Overall,forestryhaslowpriorityintheregionandthesectorreceivesminimalinvestment.Theareasreceivingmostattentionareforestconservationandenvironmentalservices.
overAll sCenArioThreebroadpatternsofdevelopmentcanbeidentifiedintheregion,withdifferingimplicationsforforestsandforestry.
Anumberofnon-fossil-fuel-producing,low-incomecountrieswillcontinuetodependonagricultureandanimalhusbandryasamainsourceoflivelihood(withremittancesfromcitizensemployedinfossil-fuel-producingcountriesalsobecominganimportantsourceofincome).Theoutlookforforestsandwoodlandswilldependondiversificationoftheeconomy–whichwilldependinturnonpoliticalstability,institutionaldevelopmentandinvestmentinhumanresources.Tourismofferspotentialfordiversification.
Countriesthatdependonfossilfuelsfortheirgrowthandprosperityalsoneedtodiversify.Severalrealizethelong-termvulnerabilityofdependenceonfossilfuelsandareinvestinginmanufacturingandbuildinguphumanresources.Manyofthesecountrieshaveneglectedsectorsotherthanenergy,includingagricultureandforestry;thus,despitehighnationalincome,forestrymayfaceseverefinancialconstraintsandforestryinstitutionsmaybeweak.Improvinginstitutionalframeworksislikelytoremainamajorchallenge.
Somecountries(bothfossil-fuel-producingandnon-fossil-fuel-producing)havemadesubstantialprogressindiversifyingtheireconomiesanddrawingadvantagefromglobalizationthroughinvestmentsinmanufacturing,trade,commerceandtourism.Severalareemergingasimportantregionalandglobalfinancialcentres.Inthesecountries,increasingattentionisbeingpaidtoenvironmentalissues,includingurbangreening.
Turkey has about 5 000 agricultural village cooperatives
with a total of more than 680 000 members. About
3 200 of these cooperatives are in forest villages. Forest
laws have granted special rights and privileges to forest
village cooperatives since the 1970s, including priority in
undertaking forest harvesting operations and eligibility to
take a share of the wood they harvest at reduced rates.
More than 2 100 village cooperatives carried out forestry
operations in 2000, harvesting about 60 percent of the
country’s total wood production.
Source: fao, 2008f.
BoX 26 Village cooperatives in turkey
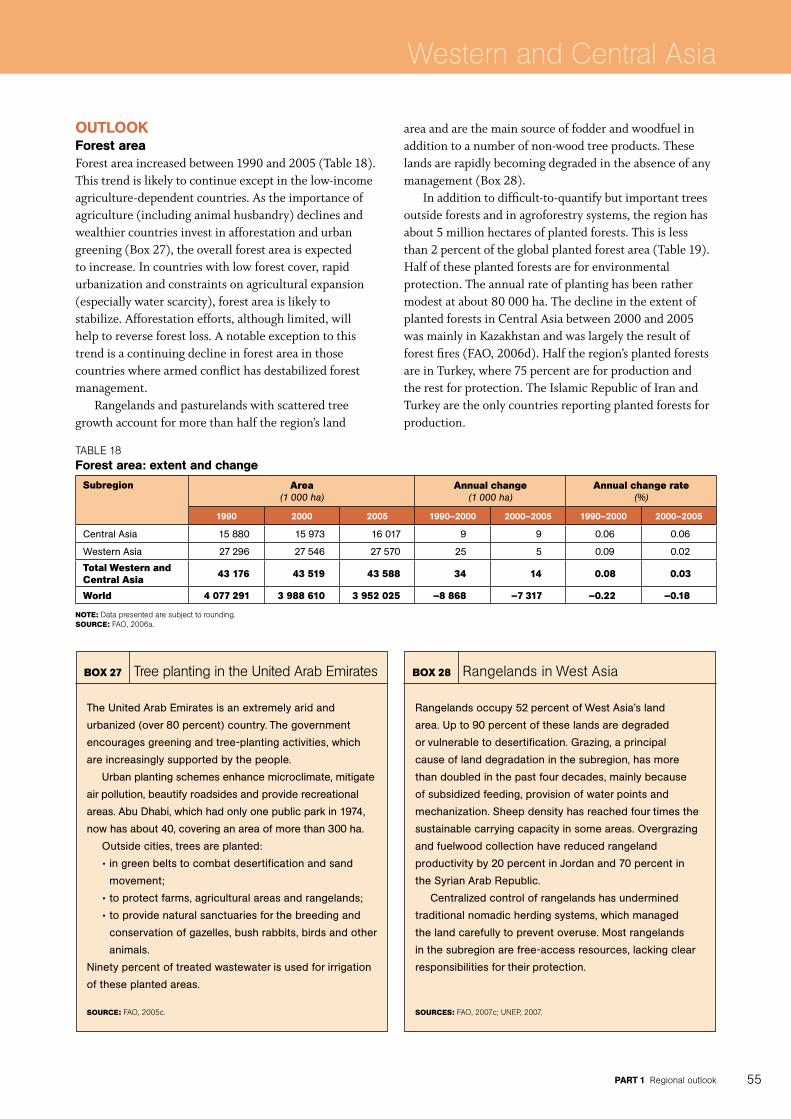
PArt 1 regional outlook 55
Western and Central Asia
outlookForest areaForestareaincreasedbetween1990and2005(Table18).Thistrendislikelytocontinueexceptinthelow-incomeagriculture-dependentcountries.Astheimportanceofagriculture(includinganimalhusbandry)declinesandwealthiercountriesinvestinafforestationandurbangreening(Box27),theoverallforestareaisexpectedtoincrease.Incountrieswithlowforestcover,rapidurbanizationandconstraintsonagriculturalexpansion(especiallywaterscarcity),forestareaislikelytostabilize.Afforestationefforts,althoughlimited,willhelptoreverseforestloss.Anotableexceptiontothistrendisacontinuingdeclineinforestareainthosecountrieswherearmedconflicthasdestabilizedforestmanagement.
Rangelandsandpasturelandswithscatteredtreegrowthaccountformorethanhalftheregion’sland
areaandarethemainsourceoffodderandwoodfuelinadditiontoanumberofnon-woodtreeproducts.Theselandsarerapidlybecomingdegradedintheabsenceofanymanagement(Box28).
Inadditiontodifficult-to-quantifybutimportanttreesoutsideforestsandinagroforestrysystems,theregionhasabout5millionhectaresofplantedforests.Thisislessthan2percentoftheglobalplantedforestarea(Table19).Halfoftheseplantedforestsareforenvironmentalprotection.Theannualrateofplantinghasbeenrathermodestatabout80000ha.ThedeclineintheextentofplantedforestsinCentralAsiabetween2000and2005wasmainlyinKazakhstanandwaslargelytheresultofforestfires(FAO,2006d).Halftheregion’splantedforestsareinTurkey,where75percentareforproductionandtherestforprotection.TheIslamicRepublicofIranandTurkeyaretheonlycountriesreportingplantedforestsforproduction.
taBle 18Forest area: extent and change
Subregion Area (1 000 ha)
Annual change (1 000 ha)
Annual change rate (%)
1990 2000 2005 1990–2000 2000–2005 1990–2000 2000–2005
Central Asia 15 880 15 973 16 017 9 9 0.06 0.06
Western Asia 27 296 27 546 27 570 25 5 0.09 0.02
total Western and central Asia 43 176 43 519 43 588 34 14 0.08 0.03
World 4 077 291 3 988 610 3 952 025 –8 868 –7 317 –0.22 –0.18
Note: data presented are subject to rounding.Source: fao, 2006a.
The United Arab Emirates is an extremely arid and
urbanized (over 80 percent) country. The government
encourages greening and tree-planting activities, which
are increasingly supported by the people.
Urban planting schemes enhance microclimate, mitigate
air pollution, beautify roadsides and provide recreational
areas. Abu Dhabi, which had only one public park in 1974,
now has about 40, covering an area of more than 300 ha.
Outside cities, trees are planted:
•in green belts to combat desertification and sand
movement;
•to protect farms, agricultural areas and rangelands;
•to provide natural sanctuaries for the breeding and
conservation of gazelles, bush rabbits, birds and other
animals.
Ninety percent of treated wastewater is used for irrigation
of these planted areas.
Source: fao, 2005c.
BoX 27 tree planting in the united arab emirates
Rangelands occupy 52 percent of West Asia’s land
area. Up to 90 percent of these lands are degraded
or vulnerable to desertification. Grazing, a principal
cause of land degradation in the subregion, has more
than doubled in the past four decades, mainly because
of subsidized feeding, provision of water points and
mechanization. Sheep density has reached four times the
sustainable carrying capacity in some areas. Overgrazing
and fuelwood collection have reduced rangeland
productivity by 20 percent in Jordan and 70 percent in
the Syrian Arab Republic.
Centralized control of rangelands has undermined
traditional nomadic herding systems, which managed
the land carefully to prevent overuse. Most rangelands
in the subregion are free-access resources, lacking clear
responsibilities for their protection.
SourceS: fao, 2007c; uneP, 2007.
BoX 28 rangelands in West asia

stAte oF the World’s Forests 200956
Forest managementExceptinCyprus,LebanonandYemen,mostoftheforestsintheregionarepubliclyowned.However,politicalandhistoricaldifferencesamongthecountrieshaveresultedinconsiderabledifferencesinhowtheyhavebeenmanagedandused.
IntheSovietperiod,mostoftheforestsandwoodlandsinCentralAsiaweresetasideforenvironmentalprotectionwithatotalbanonlogging–apolicyencouragedbythelowforestcoverandlimitedscopeforcommercialuseofforests.Strictenforcementofrulesandregulationsbythewell-organizedstateforestryadministrationenabledcomprehensiveforestprotection.However,afterindependence,areductioninwoodandfuelsuppliesfromtheRussianFederationincreasedthepressureonforestsandthebanonloggingbecameineffective.Whilemostoftheforestsofficiallyremainprotectedareas,institutionalweaknessesandtherisingdemandforwoodhaveresultedinincreasesinillegallogging.Greaterinvestmentwillbeneededifproblemssuchasforestfiresaretobepreventedfromworsening.
InWesternAsiatoo,mostforestshavebeensetasideasprotectedareas.Anumberofcountriesthatpreviouslydependedonforestsforwoodproductionhavereducedharvestinginordertoenhanceenvironmentalbenefits.
Theregion’sadverseclimateandsoilconditionsandlowproductivitymakeforestplantationactivitiesexpensive,implyinglimitedprivate-sectorinvolvementand,thus,ahighrelianceonpublicfunding.Thechangingneedsofsocietyhaveinfluencedthemanagementofplantedforests;someoriginallyestablishedforwoodproductionarenowmanagedforamenityvalues(Box29).
Inmostcountriesintheregion,treesgrownonfarmsinvariousagroforestrysystemsareasourceofincomeand,moreimportantly,fulfilprotectivefunctionsaswindbreaksandshelterbelts.Establishmentofwindbreaksisanintegralpartoffarmingpracticesinmostcountries.Date-palmcultivationinseveralWesternAsiancountrieshasturneddesertsintooases.IntheUnitedArabEmirates,extensivedateplantationshaveimprovedthelandscapewhilegeneratingsubstantialincome(FAO,2008f).Fruittreesarealsoasourceofwood.
Thehighcostsofimprovingpolicyandinstitutionalarrangementsandtechnicalcapacitiesmaycontinuetolimittheabilityofmanycountriesintheregiontoimplementsustainableforestmanagement.Furthermore,muchoftheregion’sforestislocatedinconflictzones.Conflict-relatedinstabilityisamajorfactorunderminingsustainableforestmanagement,especiallywhereforestsstraddlenationalborders(FAO,2008g).
Wood products: production, consumption and tradeBecauseoftheunfavourablegrowingconditionsandemphasisonprotection,productionofwoodproductsislow,andtheregiondependssubstantiallyonimportstomeetdemand.ImportsofwoodproductsincreasedfromaboutUS$5.6billionin1995toUS$13.5billionin2006andaccountedformorethanhalfofconsumption.Afghanistan,Georgia,theIslamicRepublicofIran,KazakhstanandTurkeyaccountformostoftheregion’swoodproduction.
Consumptionofwoodproductsisforecasttoincreaseacrosstheregionwithgrowthinpopulation,urbanizationandincome.Annualgrowthintheconsumptionofsawnwood,wood-basedpanels,andpaperandpaperboardisprojectedtobe2.5,4.5and4.0percent,respectively,inthenext15years(Table20).GrowthisexpectedtobefastestintheCentralAsiancountriesastheyrecoverfromthepost-1990economicslump.Theregionwillremainamajorwoodproductimportingregionbecauseofitslimitednaturalresourcesandgrowingdemand.
TheIslamicRepublicofIranandTurkey,withlargedomesticmarkets,inexpensivelabourandastableinvestmentclimate,haveinvestedinforestindustrydevelopment(furniture,paperboardandmedium-densityfibreboard),largelybasedonimportedrawmaterials.WiththedecliningprofitabilityofthewoodindustryinEurope,theseindustriescouldexpandfurther.SaudiArabiaand
taBle 19Planted forests
Subregion 1990 2000 2005
(1 000 ha)
Central Asia 1 274 1 323 1 193
Western Asia 3 022 3 623 3 895
total Western and central Asia 4 295 4 946 5 089
World 209 443 246 556 271 346
Note: data presented are subject to rounding.Source: fao, 2006b.
In Cyprus, 94 village plantations on about 1 580 ha
were established during the Second World War to
supply woodfuel to local communities. By the time the
plantations were mature, incomes had increased and
commercial fuels had become available and affordable,
so the demand for woodfuel had declined considerably.
However, the demand for recreation areas had grown.
Hence, these plantations were transformed into recreation
areas, enhanced by the planting of ornamental trees.
Source: government of cyprus, 2005.
BoX 29 changing objectives of forest plantation management in cyprus
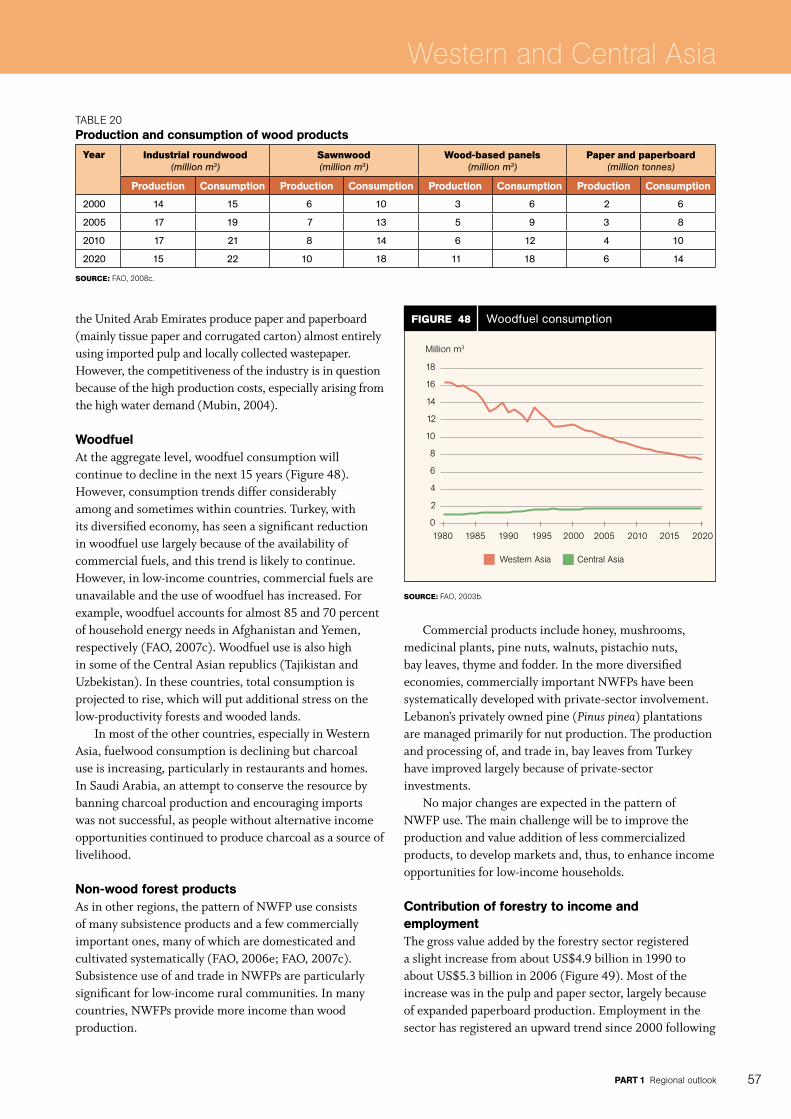
PArt 1 regional outlook 57
Western and Central Asia
theUnitedArabEmiratesproducepaperandpaperboard(mainlytissuepaperandcorrugatedcarton)almostentirelyusingimportedpulpandlocallycollectedwastepaper.However,thecompetitivenessoftheindustryisinquestionbecauseofthehighproductioncosts,especiallyarisingfromthehighwaterdemand(Mubin,2004).
WoodfuelAttheaggregatelevel,woodfuelconsumptionwillcontinuetodeclineinthenext15years(Figure48).However,consumptiontrendsdifferconsiderablyamongandsometimeswithincountries.Turkey,withitsdiversifiedeconomy,hasseenasignificantreductioninwoodfueluselargelybecauseoftheavailabilityofcommercialfuels,andthistrendislikelytocontinue.However,inlow-incomecountries,commercialfuelsareunavailableandtheuseofwoodfuelhasincreased.Forexample,woodfuelaccountsforalmost85and70percentofhouseholdenergyneedsinAfghanistanandYemen,respectively(FAO,2007c).WoodfueluseisalsohighinsomeoftheCentralAsianrepublics(TajikistanandUzbekistan).Inthesecountries,totalconsumptionisprojectedtorise,whichwillputadditionalstressonthelow-productivityforestsandwoodedlands.
Inmostoftheothercountries,especiallyinWesternAsia,fuelwoodconsumptionisdecliningbutcharcoaluseisincreasing,particularlyinrestaurantsandhomes.InSaudiArabia,anattempttoconservetheresourcebybanningcharcoalproductionandencouragingimportswasnotsuccessful,aspeoplewithoutalternativeincomeopportunitiescontinuedtoproducecharcoalasasourceoflivelihood.
non-wood forest productsAsinotherregions,thepatternofNWFPuseconsistsofmanysubsistenceproductsandafewcommerciallyimportantones,manyofwhicharedomesticatedandcultivatedsystematically(FAO,2006e;FAO,2007c).SubsistenceuseofandtradeinNWFPsareparticularlysignificantforlow-incomeruralcommunities.Inmanycountries,NWFPsprovidemoreincomethanwoodproduction.
Commercialproductsincludehoney,mushrooms,medicinalplants,pinenuts,walnuts,pistachionuts,bayleaves,thymeandfodder.Inthemorediversifiedeconomies,commerciallyimportantNWFPshavebeensystematicallydevelopedwithprivate-sectorinvolvement.Lebanon’sprivatelyownedpine(Pinus pinea)plantationsaremanagedprimarilyfornutproduction.Theproductionandprocessingof,andtradein,bayleavesfromTurkeyhaveimprovedlargelybecauseofprivate-sectorinvestments.
NomajorchangesareexpectedinthepatternofNWFPuse.Themainchallengewillbetoimprovetheproductionandvalueadditionoflesscommercializedproducts,todevelopmarketsand,thus,toenhanceincomeopportunitiesforlow-incomehouseholds.
Contribution of forestry to income and employmentThegrossvalueaddedbytheforestrysectorregisteredaslightincreasefromaboutUS$4.9billionin1990toaboutUS$5.3billionin2006(Figure49).Mostoftheincreasewasinthepulpandpapersector,largelybecauseofexpandedpaperboardproduction.Employmentinthesectorhasregisteredanupwardtrendsince2000following
taBle 20Production and consumption of wood products
Year industrial roundwood(million m3)
Sawnwood(million m3)
Wood-based panels(million m3)
Paper and paperboard(million tonnes)
Production Consumption Production Consumption Production Consumption Production Consumption
2000 14 15 6 10 3 6 2 6
2005 17 19 7 13 5 9 3 8
2010 17 21 8 14 6 12 4 10
2020 15 22 10 18 11 18 6 14
Source: fao, 2008c.
Figure 48 Woodfuel consumption
Source: fao, 2003b.
18
16
14
12
10
8
6
4
2
0
Million m3
1980 1985 1990 1995 2000 2005 2010 2015 2020
Western asia central asia
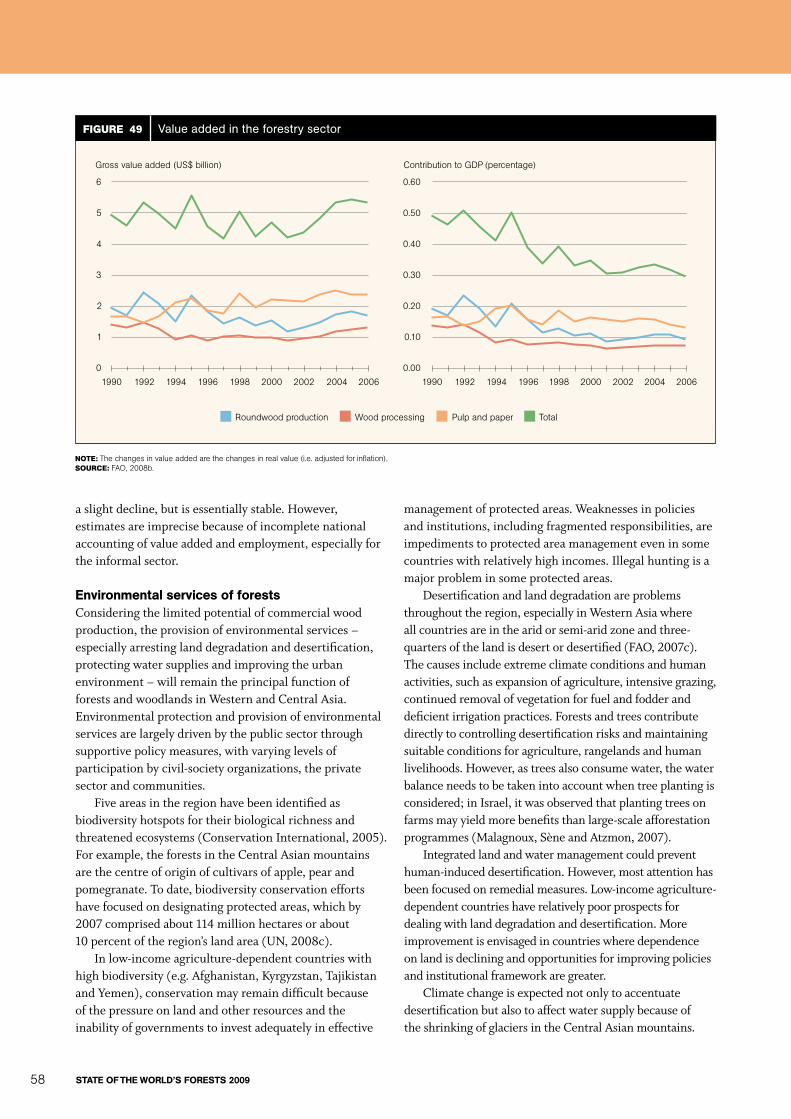
stAte oF the World’s Forests 200958
aslightdecline,butisessentiallystable.However,estimatesareimprecisebecauseofincompletenationalaccountingofvalueaddedandemployment,especiallyfortheinformalsector.
environmental services of forestsConsideringthelimitedpotentialofcommercialwoodproduction,theprovisionofenvironmentalservices–especiallyarrestinglanddegradationanddesertification,protectingwatersuppliesandimprovingtheurbanenvironment–willremaintheprincipalfunctionofforestsandwoodlandsinWesternandCentralAsia.Environmentalprotectionandprovisionofenvironmentalservicesarelargelydrivenbythepublicsectorthroughsupportivepolicymeasures,withvaryinglevelsofparticipationbycivil-societyorganizations,theprivatesectorandcommunities.
Fiveareasintheregionhavebeenidentifiedasbiodiversityhotspotsfortheirbiologicalrichnessandthreatenedecosystems(ConservationInternational,2005).Forexample,theforestsintheCentralAsianmountainsarethecentreoforiginofcultivarsofapple,pearandpomegranate.Todate,biodiversityconservationeffortshavefocusedondesignatingprotectedareas,whichby2007comprisedabout114millionhectaresorabout10percentoftheregion’slandarea(UN,2008c).
Inlow-incomeagriculture-dependentcountrieswithhighbiodiversity(e.g.Afghanistan,Kyrgyzstan,TajikistanandYemen),conservationmayremaindifficultbecauseofthepressureonlandandotherresourcesandtheinabilityofgovernmentstoinvestadequatelyineffective
managementofprotectedareas.Weaknessesinpoliciesandinstitutions,includingfragmentedresponsibilities,areimpedimentstoprotectedareamanagementeveninsomecountrieswithrelativelyhighincomes.Illegalhuntingisamajorprobleminsomeprotectedareas.
Desertificationandlanddegradationareproblemsthroughouttheregion,especiallyinWesternAsiawhereallcountriesareinthearidorsemi-aridzoneandthree-quartersofthelandisdesertordesertified(FAO,2007c).Thecausesincludeextremeclimateconditionsandhumanactivities,suchasexpansionofagriculture,intensivegrazing,continuedremovalofvegetationforfuelandfodderanddeficientirrigationpractices.Forestsandtreescontributedirectlytocontrollingdesertificationrisksandmaintainingsuitableconditionsforagriculture,rangelandsandhumanlivelihoods.However,astreesalsoconsumewater,thewaterbalanceneedstobetakenintoaccountwhentreeplantingisconsidered;inIsrael,itwasobservedthatplantingtreesonfarmsmayyieldmorebenefitsthanlarge-scaleafforestationprogrammes(Malagnoux,SèneandAtzmon,2007).
Integratedlandandwatermanagementcouldpreventhuman-induceddesertification.However,mostattentionhasbeenfocusedonremedialmeasures.Low-incomeagriculture-dependentcountrieshaverelativelypoorprospectsfordealingwithlanddegradationanddesertification.Moreimprovementisenvisagedincountrieswheredependenceonlandisdecliningandopportunitiesforimprovingpoliciesandinstitutionalframeworkaregreater.
ClimatechangeisexpectednotonlytoaccentuatedesertificationbutalsotoaffectwatersupplybecauseoftheshrinkingofglaciersintheCentralAsianmountains.
Figure 49 Value added in the forestry sector
gross value added (uS$ billion) contribution to gdP (percentage)
roundwood production Wood processing Pulp and paper total
1990 1992 1994 1996 1998 2000 2002 2004 2006
Note: the changes in value added are the changes in real value (i.e. adjusted for inflation). Source: fao, 2008b.
1990 1992 1994 1996 1998 2000 2002 2004 2006
6
5
4
3
2
1
0
0.60
0.50
0.40
0.30
0.20
0.10
0.00
PArt 1 regional outlook 59
Western and Central Asia
Waterisprobablythemostcriticalnaturalresourceintheregion.Watersheddegradationisathreattowatersupplyfordrinking,irrigationandpowergeneration.Forestsandtreeshaveanimportantroleinwatershedimprovement.Thetransboundarynatureofmostofthemajorwatershedsintheregioncomplicatestheinstitutionalarrangementsforwatershedmanagement,includingsharingcostsandbenefits.Watersharingamongthecountriesisapoliticallysensitiveissueandaprimarycauseofconflictsintheregion.
Unspoiltlandscape,includingmountainsanddeserts,isattractinganincreasingnumberofdomesticandinternationaltouriststotheregion,creatingopportunitiesaswellaschallenges.Increasinginvestmentininfrastructure–forexample,constructionoftheNewSilkRoad–isopeningupthehithertoless-visitedCentralAsiancountries.Whilemanyofthediversifiedeconomieshavebeenabletotakeadvantageofecotourism(Box30),severalothers,especiallyinCentralAsia,havebeenunabletotapthepotentialbecauseoflimitedinfrastructureandsecurityissues.Mostlow-incomecountrieslacktheinstitutionalarrangementstoensurethatincomefromecotourismaccruestothepoor.
Themainchallengeofnature-basedtourismistomanageitsustainably.Increasedtourism(includingdomestictourism)toasmallnumberofprimelocations(e.g.theAzirregionofSaudiArabia)challengesexistinginstitutionalcapacitytodoso.Openingtheregionto
naturetourismisalsopavingthewayforillegaltrophyhunting,especiallywherelawenforcementcapacityispoor(FAO,2005d).
MostWesternandCentralAsiancountriesinvestsubstantiallyincreatinggreenspacestoimprovethequalityoflifeoftheburgeoningurbanpopulation(FAO,2005c).InmostCentralAsiancountries,thesignificantattentiongiventourbanforestryduringtheSovietperioddeclinedfollowingindependence,butitispickingupagain,especiallyinthefossil-fuel-richcountries.AsillustratedinBox27,severalGCCcountrieshaveembarkedonambitiousgreeningprogrammesinconjunctionwiththeexpansionofurbancentres.
Urbangreenspacesintheregionwillundoubtedlyincreaseinvaryingmeasuredependingonthefinancialandinstitutionalcapacityofthecountriesandtheextenttowhichurbanizationisplanned.Unplannedurbanization(especiallywhereruralpopulationsarecompelledtomovetourbancentresbecauseofconflict)tendstoresultindestructionofurbangreenspaces.
summAryTheoutlookforforestsandforestryinWesternandCentralAsiaismixed.Incomegrowthandurbanizationsuggestastableorimprovingforestsituationinsomecountries,butthiswilleludeanumberoflow-incomeagriculture-dependentcountries.Forestdegradationmayalsopersistinsomecountriesthatarerelativelywelloffbuthaveweakinstitutions.
Adversegrowingconditionsinmostoftheregion’scountrieslimittheprospectsforcommercialwoodproduction.Rapidlyincreasingincomeandhighpopulationgrowthratessuggestthattheregionwillcontinuetodependonimportstomeetthedemandformostwoodproducts.Provisionofenvironmentalserviceswillremainthemainjustificationforforestry,especiallyarrestinglanddegradationanddesertification,protectingwatershedsandimprovingtheurbanenvironment.Institutionbuilding,particularlyatthelocallevel,isneededtofacilitateanintegratedapproachtoresourcemanagement.
In the Murgab District in the Eastern Pamir mountains of
Tajikistan, where living conditions deteriorated after the
collapse of the Soviet Union, the Murgab Ecotourism
Association is promoting sustainable ecotourism with a
focus on conservation of natural and cultural resources
and local income generation. The Murgab Ecotourism
Association was established in 2003 by the Agency for
Technical Cooperation and Development with assistance
from the United Nations Educational, Scientific and Cultural
Organization (UNESCO). Since 2005, it has been a legally
registered national association. The number of tourists
using its services (which include organization of rafting and
camelback tours and accommodation in yurts and local
homesteads) grew from 25 in 2003 to 601 in 2005. Profits
for local tourism operators increased tenfold. Future plans
include the establishment of a nationwide ecotourism
network, expanded support to the handicraft production
chain, collaboration with large-scale commercial tourism
providers and the government, and regional links with
northern Afghanistan and southern Kyrgyzstan.
Source: acted, 2006.
BoX 30 ecotourism development in tajikistan

FAO
/FO
/C. J
ekke
l
adapting for the future
Part
Demand for goods and services, and consequently the income that owners derive from managing forests, is a primary determinant of investment in forest management. The first chapter in Part 2 looks at long-term changes in demand for wood and selected wood products, from 1965 to 2005 and projecting to 2020 and 2030. The second chapter focuses on the demand for environmental services provided by forests and on the market and non-market mechanisms that have been evolving to help forests meet that demand.
Institutions are at the centre-stage of sustainable resource management and will play an important part in society’s adaptation to social, economic and
environmental change. The third chapter provides an overview of how the various institutions in the forest sector – public agencies, the private sector, civil-society organizations, the informal sector and international organizations – are responding to the emerging developments outlined in Part 1.
Science and technology have a vital role in enabling society to meet its future needs for products and services. The final chapter of State of the World’s Forests 2009 provides an overview of science and technology developments in forestry that will help the forest sector address the challenges ahead, including recognition of the role of traditional knowledge.
2
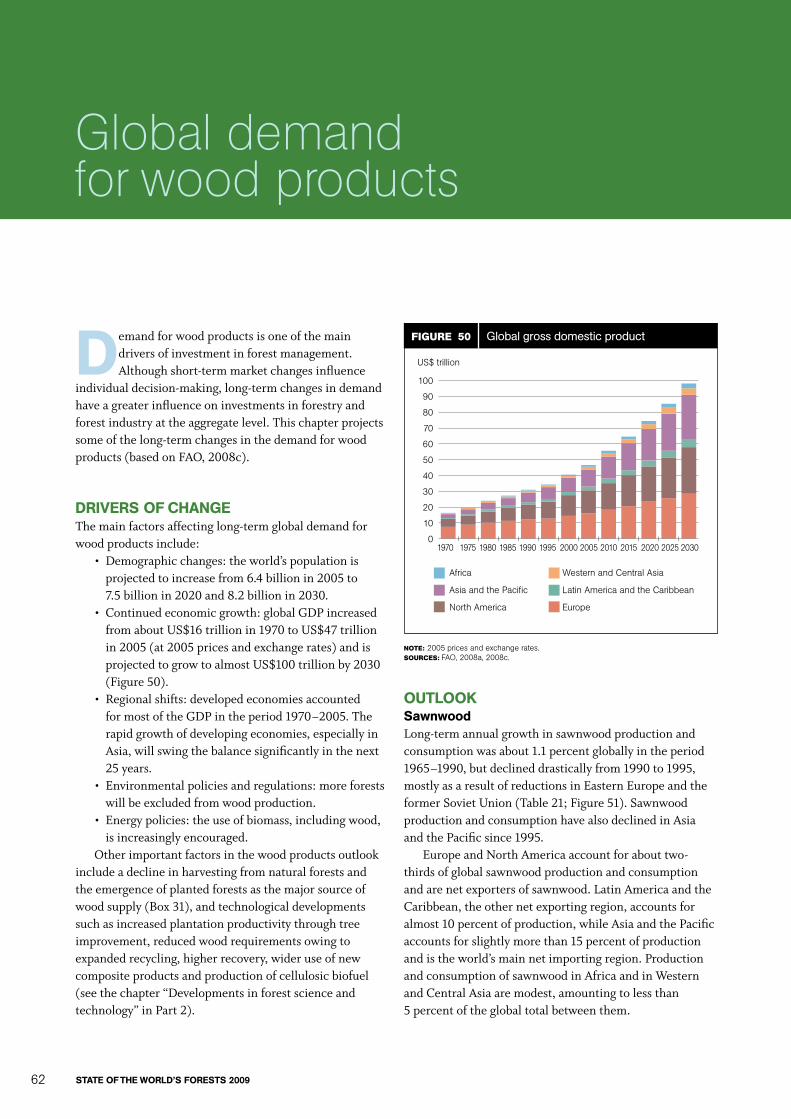
stAte oF the World’s Forests 200962
demandforwoodproductsisoneofthemaindriversofinvestmentinforestmanagement.Althoughshort-termmarketchangesinfluence
individualdecision-making,long-termchangesindemandhaveagreaterinfluenceoninvestmentsinforestryandforestindustryattheaggregatelevel.Thischapterprojectssomeofthelong-termchangesinthedemandforwoodproducts(basedonFAO,2008c).
drivers oF ChAngeThemainfactorsaffectinglong-termglobaldemandforwoodproductsinclude:
• Demographicchanges:theworld’spopulationisprojectedtoincreasefrom6.4billionin2005to7.5billionin2020and8.2billionin2030.
• Continuedeconomicgrowth:globalGDPincreasedfromaboutUS$16trillionin1970toUS$47trillionin2005(at2005pricesandexchangerates)andisprojectedtogrowtoalmostUS$100trillionby2030(Figure50).
• Regionalshifts:developedeconomiesaccountedformostoftheGDPintheperiod1970–2005.Therapidgrowthofdevelopingeconomies,especiallyinAsia,willswingthebalancesignificantlyinthenext25years.
• Environmentalpoliciesandregulations:moreforestswillbeexcludedfromwoodproduction.
• Energypolicies:theuseofbiomass,includingwood,isincreasinglyencouraged.
Otherimportantfactorsinthewoodproductsoutlookincludeadeclineinharvestingfromnaturalforestsandtheemergenceofplantedforestsasthemajorsourceofwoodsupply(Box31),andtechnologicaldevelopmentssuchasincreasedplantationproductivitythroughtreeimprovement,reducedwoodrequirementsowingtoexpandedrecycling,higherrecovery,wideruseofnewcompositeproductsandproductionofcellulosicbiofuel(seethechapter“Developmentsinforestscienceandtechnology”inPart2).
outlooksawnwoodLong-termannualgrowthinsawnwoodproductionandconsumptionwasabout1.1percentgloballyintheperiod1965–1990,butdeclineddrasticallyfrom1990to1995,mostlyasaresultofreductionsinEasternEuropeandtheformerSovietUnion(Table21;Figure51).SawnwoodproductionandconsumptionhavealsodeclinedinAsiaandthePacificsince1995.
EuropeandNorthAmericaaccountforabouttwo-thirdsofglobalsawnwoodproductionandconsumptionandarenetexportersofsawnwood.LatinAmericaandtheCaribbean,theothernetexportingregion,accountsforalmost10percentofproduction,whileAsiaandthePacificaccountsforslightlymorethan15percentofproductionandistheworld’smainnetimportingregion.ProductionandconsumptionofsawnwoodinAfricaandinWesternandCentralAsiaaremodest,amountingtolessthan5percentoftheglobaltotalbetweenthem.
Global demand for wood products
Figure 50 Global gross domestic product
100
90
80
70
60
50
40
30
20
10
01970 1975 1980 1985 1990 1995 2000 2005 2010 2015 2020 2025 2030
uS$ trillion
Note: 2005 prices and exchange rates. SourceS: fao, 2008a, 2008c.
africa Western and central asia
asia and the Pacific latin america and the caribbean
north america europe
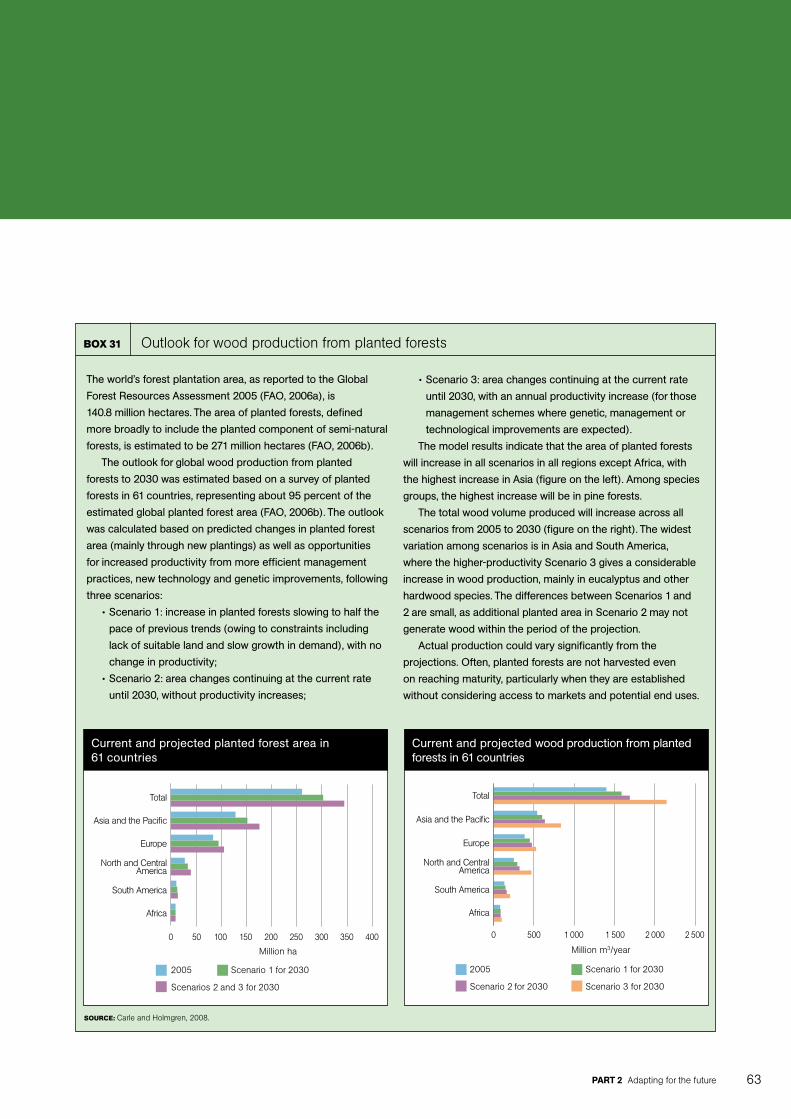
PArt 2 adapting for the future 63
The world’s forest plantation area, as reported to the Global
Forest Resources Assessment 2005 (FAO, 2006a), is
140.8 million hectares. The area of planted forests, defined
more broadly to include the planted component of semi-natural
forests, is estimated to be 271 million hectares (FAO, 2006b).
The outlook for global wood production from planted
forests to 2030 was estimated based on a survey of planted
forests in 61 countries, representing about 95 percent of the
estimated global planted forest area (FAO, 2006b). The outlook
was calculated based on predicted changes in planted forest
area (mainly through new plantings) as well as opportunities
for increased productivity from more efficient management
practices, new technology and genetic improvements, following
three scenarios:
•Scenario 1: increase in planted forests slowing to half the
pace of previous trends (owing to constraints including
lack of suitable land and slow growth in demand), with no
change in productivity;
•Scenario 2: area changes continuing at the current rate
until 2030, without productivity increases;
•Scenario 3: area changes continuing at the current rate
until 2030, with an annual productivity increase (for those
management schemes where genetic, management or
technological improvements are expected).
The model results indicate that the area of planted forests
will increase in all scenarios in all regions except Africa, with
the highest increase in Asia (figure on the left). Among species
groups, the highest increase will be in pine forests.
The total wood volume produced will increase across all
scenarios from 2005 to 2030 (figure on the right). The widest
variation among scenarios is in Asia and South America,
where the higher-productivity Scenario 3 gives a considerable
increase in wood production, mainly in eucalyptus and other
hardwood species. The differences between Scenarios 1 and
2 are small, as additional planted area in Scenario 2 may not
generate wood within the period of the projection.
Actual production could vary significantly from the
projections. Often, planted forests are not harvested even
on reaching maturity, particularly when they are established
without considering access to markets and potential end uses.
BoX 31 outlook for wood production from planted forests
Current and projected planted forest area in 61 countries
total
asia and the Pacific
europe
north and central america
South america
africa
0 50 100 150 200 250 300 350 400
Million ha
2005 Scenario 1 for 2030
Scenarios 2 and 3 for 2030
Current and projected wood production from planted forests in 61 countries
total
asia and the Pacific
europe
north and central america
South america
africa
0 500 1 000 1 500 2 000 2 500
Million m3/year
2005 Scenario 1 for 2030
Scenario 2 for 2030 Scenario 3 for 2030
Source: carle and holmgren, 2008.
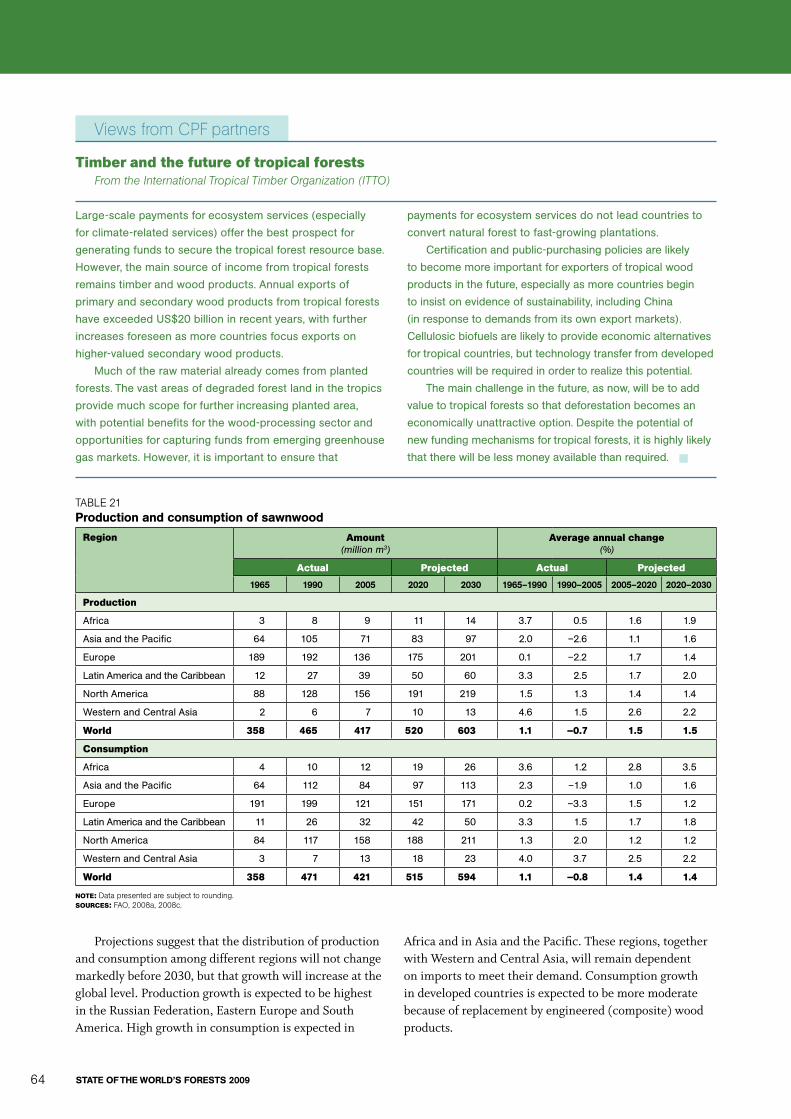
stAte oF the World’s Forests 200964
Projectionssuggestthatthedistributionofproductionandconsumptionamongdifferentregionswillnotchangemarkedlybefore2030,butthatgrowthwillincreaseatthegloballevel.ProductiongrowthisexpectedtobehighestintheRussianFederation,EasternEuropeandSouthAmerica.Highgrowthinconsumptionisexpectedin
AfricaandinAsiaandthePacific.Theseregions,togetherwithWesternandCentralAsia,willremaindependentonimportstomeettheirdemand.Consumptiongrowthindevelopedcountriesisexpectedtobemoremoderatebecauseofreplacementbyengineered(composite)woodproducts.
Large-scale payments for ecosystem services (especially
for climate-related services) offer the best prospect for
generating funds to secure the tropical forest resource base.
However, the main source of income from tropical forests
remains timber and wood products. Annual exports of
primary and secondary wood products from tropical forests
have exceeded US$20 billion in recent years, with further
increases foreseen as more countries focus exports on
higher-valued secondary wood products.
Much of the raw material already comes from planted
forests. The vast areas of degraded forest land in the tropics
provide much scope for further increasing planted area,
with potential benefits for the wood-processing sector and
opportunities for capturing funds from emerging greenhouse
gas markets. However, it is important to ensure that
payments for ecosystem services do not lead countries to
convert natural forest to fast-growing plantations.
Certification and public-purchasing policies are likely
to become more important for exporters of tropical wood
products in the future, especially as more countries begin
to insist on evidence of sustainability, including China
(in response to demands from its own export markets).
Cellulosic biofuels are likely to provide economic alternatives
for tropical countries, but technology transfer from developed
countries will be required in order to realize this potential.
The main challenge in the future, as now, will be to add
value to tropical forests so that deforestation becomes an
economically unattractive option. Despite the potential of
new funding mechanisms for tropical forests, it is highly likely
that there will be less money available than required. n
timber and the future of tropical forestsFrom the International Tropical Timber Organization (ITTO)
Views from CPF partners
taBle 21Production and consumption of sawnwood
region Amount(million m3)
Average annual change(%)
Actual Projected Actual Projected
1965 1990 2005 2020 2030 1965–1990 1990–2005 2005–2020 2020–2030
Production
Africa 3 8 9 11 14 3.7 0.5 1.6 1.9
Asia and the Pacific 64 105 71 83 97 2.0 –2.6 1.1 1.6
Europe 189 192 136 175 201 0.1 –2.2 1.7 1.4
Latin America and the Caribbean 12 27 39 50 60 3.3 2.5 1.7 2.0
North America 88 128 156 191 219 1.5 1.3 1.4 1.4
Western and Central Asia 2 6 7 10 13 4.6 1.5 2.6 2.2
World 358 465 417 520 603 1.1 –0.7 1.5 1.5
consumption
Africa 4 10 12 19 26 3.6 1.2 2.8 3.5
Asia and the Pacific 64 112 84 97 113 2.3 –1.9 1.0 1.6
Europe 191 199 121 151 171 0.2 –3.3 1.5 1.2
Latin America and the Caribbean 11 26 32 42 50 3.3 1.5 1.7 1.8
North America 84 117 158 188 211 1.3 2.0 1.2 1.2
Western and Central Asia 3 7 13 18 23 4.0 3.7 2.5 2.2
World 358 471 421 515 594 1.1 –0.8 1.4 1.4
Note: data presented are subject to rounding.SourceS: fao, 2008a, 2008c.
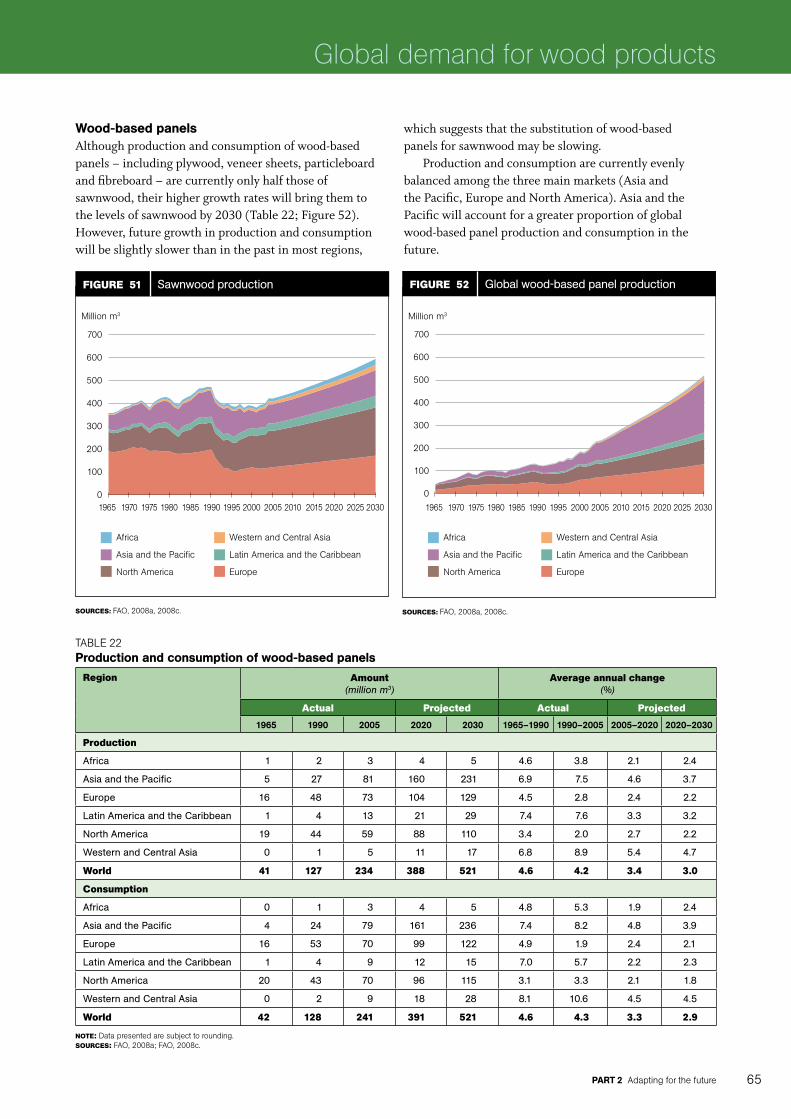
PArt 2 adapting for the future 65
Global demand for wood products
Wood-based panelsAlthoughproductionandconsumptionofwood-basedpanels–includingplywood,veneersheets,particleboardandfibreboard–arecurrentlyonlyhalfthoseofsawnwood,theirhighergrowthrateswillbringthemtothelevelsofsawnwoodby2030(Table22;Figure52).However,futuregrowthinproductionandconsumptionwillbeslightlyslowerthaninthepastinmostregions,
whichsuggeststhatthesubstitutionofwood-basedpanelsforsawnwoodmaybeslowing.
Productionandconsumptionarecurrentlyevenlybalancedamongthethreemainmarkets(AsiaandthePacific,EuropeandNorthAmerica).AsiaandthePacificwillaccountforagreaterproportionofglobalwood-basedpanelproductionandconsumptioninthefuture.
Figure 51 Sawnwood production
700
600
500
400
300
200
100
0
Million m3
SourceS: fao, 2008a, 2008c.
1965 1970 1975 1980 1985 1990 1995 2000 2005 2010 2015 2020 2025 2030
taBle 22Production and consumption of wood-based panels
region Amount(million m3)
Average annual change(%)
Actual Projected Actual Projected
1965 1990 2005 2020 2030 1965–1990 1990–2005 2005–2020 2020–2030
Production
Africa 1 2 3 4 5 4.6 3.8 2.1 2.4
Asia and the Pacific 5 27 81 160 231 6.9 7.5 4.6 3.7
Europe 16 48 73 104 129 4.5 2.8 2.4 2.2
Latin America and the Caribbean 1 4 13 21 29 7.4 7.6 3.3 3.2
North America 19 44 59 88 110 3.4 2.0 2.7 2.2
Western and Central Asia 0 1 5 11 17 6.8 8.9 5.4 4.7
World 41 127 234 388 521 4.6 4.2 3.4 3.0
consumption
Africa 0 1 3 4 5 4.8 5.3 1.9 2.4
Asia and the Pacific 4 24 79 161 236 7.4 8.2 4.8 3.9
Europe 16 53 70 99 122 4.9 1.9 2.4 2.1
Latin America and the Caribbean 1 4 9 12 15 7.0 5.7 2.2 2.3
North America 20 43 70 96 115 3.1 3.3 2.1 1.8
Western and Central Asia 0 2 9 18 28 8.1 10.6 4.5 4.5
World 42 128 241 391 521 4.6 4.3 3.3 2.9
Note: data presented are subject to rounding.SourceS: fao, 2008a; fao, 2008c.
Figure 52 Global wood-based panel production
700
600
500
400
300
200
100
0
Million m3
SourceS: fao, 2008a, 2008c.
1965 1970 1975 1980 1985 1990 1995 2000 2005 2010 2015 2020 2025 2030
africa Western and central asia
asia and the Pacific latin america and the caribbean
north america europe
africa Western and central asia
asia and the Pacific latin america and the caribbean
north america europe

stAte oF the World’s Forests 200966
Withinthecategoryofwood-basedpanels,thereisanincreasingshiftfromplywood(whichaccountedformostofthewood-basedpanelproductionandconsumptioninthe1960s)toparticleboardandfibreboard.Thisshift,whichhasimportantimplicationsforwoodraw-materialrequirements,beganinEurope(whereparticleboardandfibreboardaccountedfor90percentofthepanelmarketin2005)andhascontinuedinNorthAmerica(70percent).IthasonlyrecentlystartedtooccurinAsiaandthePacific,whereplywoodstillaccountsformorethanhalfofproductionandconsumption,withtwomainproducers(IndonesiaandMalaysia)andtwomainconsumers(ChinaandJapan).
AsiaandthePacific,EuropeandLatinAmericaandtheCaribbeanarenetexportingregions,whiletheothersarenetimporters.Europeexportsmainlyparticleboardandfibreboard,whiletheothertworegionsexportplywood.Thesetrendsareexpectedtocontinue,withinternationaltradeaccountingforabout26–27percentofglobalproductionandconsumption.
Paper and paperboardAswithpanelproducts,globalproductionofpaperandpaperboardisalsoexpandingrapidly(althoughlesssothaninrecentdecades),withanannualgrowthrateof3.7percentbetween1965and1990and2.8percentbetween1990and2005.Growthratesforconsumptionhavebeenaboutthesameasthoseforproduction(Table23;Figure53).
Historically,NorthAmericadominatedglobalproductionandconsumption,butbecauseofrapidgrowthinAsiaandthePacificandEurope,allthreemajormarketsnowaccountforasimilarshare.TherapidgrowthinAsiaandthePacificisaconsequenceofthehighrateofeconomicgrowthinrecentdecades,firstinJapanandafewotherindustrializingeconomiesandmorerecentlyinChinaandIndia.
taBle 23Production and consumption of paper and paperboard
region Amount(million tonnes)
Average annual change(%)
Actual Projected Actual Projected
1965 1990 2005 2020 2030 1965–1990 1990–2005 2005–2020 2020–2030
Production
Africa 1 3 5 9 13 6.4 4.3 3.9 3.7
Asia and the Pacific 13 58 121 227 324 6.3 5.0 4.3 3.6
Europe 33 76 111 164 201 3.4 2.6 2.6 2.1
Latin America and the Caribbean 2 8 14 21 27 5.7 3.6 2.9 2.7
North America 48 91 109 141 169 2.6 1.2 1.8 1.8
Western and Central Asia 0 1 3 6 9 9.2 5.9 4.2 3.5
World 96 238 363 568 743 3.7 2.8 3.0 2.7
consumption
Africa 1 4 7 14 21 5.1 4.2 4.6 4.4
Asia and the Pacific 13 63 128 234 329 6.3 4.9 4.1 3.5
Europe 32 73 101 147 180 3.3 2.2 2.6 2.0
Latin America and the Caribbean 3 9 16 24 31 4.7 3.9 2.9 2.6
North America 46 87 106 138 165 2.6 1.3 1.8 1.8
Western and Central Asia 0 3 8 14 20 7.5 7.5 4.0 3.4
World 96 237 365 571 747 3.7 2.9 3.0 2.7
Note: data presented are subject to rounding.SourceS: fao, 2008a, 2008c.
Figure 53 Global paper and paperboard production
800
700
600
500
400
300
200
100
0
Million tonnes
SourceS: fao, 2008a, 2008c.
1965 1970 1975 1980 1985 1990 1995 2000 2005 2010 2015 2020 2025 2030
africa Western and central asia
asia and the Pacific latin america and the caribbean
north america europe

PArt 2 adapting for the future 67
Global demand for wood products
InEurope,productiongrowthhasbeendrivenpartlybytheexpansionofexports;Europeisthelargestexporterofpaperproducts.Onthesupplyside,Europeanproductionhasalsobenefitedfromhighgrowthinwastepaperrecovery.
Thedifferencesinpastandfuturegrowthalsoreflectthestructureofthepaperandpaperboardmarketsandindustryinthethreemainregions:
• Currently,globalnewsprintproductionisdividedroughlyequallyamongAsiaandthePacific,EuropeandNorthAmerica,butgrowthisslowingbecauseoftherapidspreadofelectronicmedia.
• AsiaandthePacificandEuropeproducefarmoreprintingandwritingpaperthanNorthAmerica.
• ProductionofotherpaperandpaperboardishighestinAsiaandthePacific.
Paperandpaperboardisoneofthemostglobalizedcommoditygroups,withahighshareofproductionexportedandahighshareofconsumptionimported.Internationaltradeexpandedsignificantlyinthe1990s,especiallyinEurope,andtheglobalizationofpaperandpaperboardmarketswillcontinueinthefuture.
industrial roundwoodIndustrialroundwooddemandisderivedfromgrowthindemandforendproducts–sawnwood,wood-basedpanelsandpaperandpaperboard.Woodrequirementsfortheseproductsvarydependingonthetechnology
employedandthepotentialtousewoodandfibrewaste.Growthinsawnwoodproductionrequiresmoreindustrialroundwood,whereasashifttoreconstitutedpanelproduction(particleboardandfibreboard)increasesthepotentialtousewoodresiduesandfibrewaste,reducingindustrialroundwoodrequirements.Recyclingpolicieshaveledtoincreaseduseofrecoveredpaperandreducedpulpwooddemand.
Increaseduseofwoodresiduesandrecycledmaterialswillreducetheshareofindustrialroundwoodintotalwoodandfibreusefromalmost70percentin2005toabout50percentin2030.
Thetotalderiveddemandinwoodraw-materialequivalent(WRME)ishigherthantheconsumptionofindustrialroundwood.In2005,globalderiveddemandamountedtoabout2.5billioncubicmetresWRME,ofwhich1.7billioncubicmetreswasindustrialroundwood.Approximately0.5billioncubicmetresWRMEcamefromrecoveredpaperandtheremainderfromwood-processingresidues,recoveredwoodproductsandothersources.
Globalproductionofindustrialroundwoodisexpectedtoincreasebyslightlymorethan40percentupto2030(Table24;Figure54).Thisisconsiderablylessthantheprojectedriseintotalwoodandfibredemand(whichisexpectedtoalmostdouble)becausethehighestratesofproductiongrowthareexpectedinthepaperandpaperboardsectorandahigherproportionofpaperconsumptionwillberecycledinthefuture.
taBle 24Production and consumption of industrial roundwood
region Amount (million m3)
Average annual change (%)
Actual Projected Actual Projected
1965 1990 2005 2020 2030 1965–1990 1990–2005 2005–2020 2020–2030
Production
Africa 31 55 72 93 114 2.4 1.8 1.8 2.0
Asia and the Pacific 155 282 273 439 500 2.4 –0.2 3.2 1.3
Europe 505 640 513 707 834 0.9 –1.5 2.2 1.7
Latin America and the Caribbean 34 114 168 184 192 5.0 2.6 0.6 0.4
North America 394 591 625 728 806 1.6 0.4 1.0 1.0
Western and Central Asia 10 9 17 15 11 –0.6 4.5 –0.8 –3.0
World 1 128 1 690 1 668 2 166 2 457 1.6 –0.1 1.8 1.3
consumption
Africa 25 51 68 88 109 2.9 1.9 1.8 2.1
Asia and the Pacific 162 315 316 498 563 2.7 0.0 3.1 1.2
Europe 519 650 494 647 749 0.9 –1.8 1.8 1.5
Latin America and the Caribbean 33 111 166 181 189 4.9 2.7 0.6 0.4
North America 389 570 620 728 808 1.5 0.6 1.1 1.0
Western and Central Asia 10 10 19 22 19 –0.2 4.4 1.1 –1.3
World 1 138 1 707 1 682 2 165 2 436 1.6 –0.1 1.7 1.2
Note: data presented are subject to rounding.SourceS: fao, 2008a; 2008c.

stAte oF the World’s Forests 200968
Mostofthegrowthwilloccurinthethreemainregionalmarkets.ThegreatestproductionexpansionwillbeinEurope(morethan300millioncubicmetres),mostlybecauseofincreasesintheRussianFederation.ProductioninAsiaandthePacificandNorthAmericawillalsoexpand,largelybecauseofincreasedproductionfromplantedforests.
AsiaandthePacificwillhaveahighdeficitbetweenproductionandconsumption,increasingfromabout43millioncubicmetresin2005to63millioncubicmetresin2030.Thus,theregionwilldependonpotentialsurpluscountries,especiallytheRussianFederationandpossiblysomecountriesinLatinAmericaandtheCaribbean.
Inthe1990s,Europe,whichhadbeenanetimporterofindustrialroundwood,becameanetexporter,largelybecauseofexportsfromtheRussianFederation.TheoppositetrendwasobservedinAsiaandthePacific.Thissituationislikelytocontinueinthefuture,althoughitcouldbeinfluencedbyrecentchangesintheRussianFederation’sforestpolicies(seeBox10onpage26).
Wood energyRoundwoodusedinenergyproductioniscomparableinquantitywithindustrialroundwood.Energyproductionusingwoodincludestraditionalheatingandcookingwithfuelwoodandcharcoal,heatandpowerproductionintheforestindustry(usuallyusingprocessingwastessuchasblackliquorfrompulpproduction)forownuseorsaletoothers,andheatandpowergenerationinspecificallydesignedpowerfacilities.
Statisticsonenergyproductionfromwoodaredifficulttoobtainbecauseofthisdiversityofusesandthehigh
shareofinformalproduction.Furthermore,thetwomainagenciesthatcollectthesestatistics–FAOandtheInternationalEnergyAgency(IEA)–presentdifferentfiguresbecauseofdifferentdefinitionsandprimarydatasources.IEApresentsbiomassenergyproductionfiguresthatincludeothertypesofbiomassbesideswood(i.e.agriculturalresiduesanddung).Itsstatisticsalsoincludeheatandpowergenerationintheforestindustryandbycommercialenergyproducers,whicharenotfullycapturedinFAOstatistics.
Trendsandprojectionsforbiomassenergyproductionestimatedfromacombinationofthesetwodatasourcesrevealanincreaseinglobalproductionfromabout530milliontonnesoilequivalent(MTOE)in1970toabout720MTOEin2005,projectedtoreach1075MTOEin2030(Table25;Figure55).
Interpolationsuggeststhatwoodusedforbioenergyproductionincreasedfromabout2billioncubicmetresin1970to2.6billioncubicmetresin2005.Thissuggeststhatupto3.8billioncubicmetresofwoodcouldberequiredby2030.However,someofthefuturedemandmaybesatisfiedbybiomassproducedfromagriculturalresiduesandenergycrops(includingshort-rotationcoppiceandgrasses).
Until2005,globalbiomassenergyproductionincreasedrelativelyslowly,atlessthan1percentperyear.Mostoftheincreaseinproductionoccurredindevelopingcountries,wherewoodcontinuestobeamajorsourceofenergy.TheexceptionisAsiaandthePacific,wheregrowthhasdeclinedconsiderablybecauseofswitchingtootherpreferredtypesofenergyasaresultofincreasingincome.
TheprojectionsreflectafuturemarkedincreaseintheuseofbiomassforenergyproductioninEuropeand,toalesserextent,NorthAmericaasrenewableenergypoliciesandtargetstakeeffect.Europe’spercapitabiomassenergyuseisprojectedtotripleby2020inresponsetorenewableenergytargets,althoughsomeproductionwillalsocomefromenergycropsandagriculturalresidues.Mostdevelopedcountrieshavesetrenewableenergytargetsfor2020;hence,rapidgrowthinproductionisexpecteduntilthattime,followedbyaslowerrateofgrowth.
Furthermore,futurelarge-scalecommercialproductionofcellulosicbiofuelcouldincreasethedemandforwooddrastically,beyondthatshownintheprojections.
Theprojectionsforbiomassenergyproductionindevelopingcountriesalsohaveinterestingfeatures:
• InAfrica,thegrowthinbiomassenergyproductionwillcontinue,butwillslowsignificantly.Withtheregion’srelativelysmallprocessingsectorandfewrenewableenergytargets,mostofitsbioenergyproductionwillcontinuetobefromtraditionalwoodfuel(fuelwoodandcharcoal).Followingthetrendinotherregions(e.g.AsiaandthePacific),this
Figure 54 Global production of industrial roundwood
2 500
2 000
1 500
1 000
500
0
Million m3
SourceS: fao, 2008a, 2008c.
1965 1970 1975 1980 1985 1990 1995 2000 2005 2010 2015 2020 2025 2030
africa Western and central asia
asia and the Pacific latin america and the caribbean
north america europe

PArt 2 adapting for the future 69
Global demand for wood products
growthisexpectedtodeclineasincomesriseandmorepeopleswitchtoothertypesofenergy.
• InAsiaandthePacific,traditionalwoodfuelproductionisexpectedtodecline,butthiswillbeoutweighedbyincreasedproductionofbioenergyintheforestindustryand,inafewcases(e.g.China),commercialbioenergyproductioninresponsetorenewableenergytargets.
• InLatinAmericaandtheCaribbean,biomassenergyproductionisprojectedtoincreaseinalldimensions,withariseintraditionalwoodfuelproductioninthepoorercountriesoftheregionandincreasedbioenergyproductionbytheforestindustryandothersinthemoreadvancedeconomies.
summAryTheproductionandconsumptionofwoodproductsandwoodenergyareexpectedtoincrease,largelyfollowinghistoricaltrends.OneshiftwillbethehighergrowthintheproductionandconsumptionofwoodproductsinAsiaandthePacific,mainlystemmingfromtherapidgrowthindemandfromemergingeconomiessuchasChinaandIndia.Themostdramaticchangewillbetherapidincreaseintheuseofwoodasasourceofenergy,particularlyinEuropeasaresultofpoliciespromotinggreateruseofrenewableenergy.
TheAsiaandthePacificregionisbecomingthemajorproducerandconsumerofwood-basedpanelsandpaperandpaperboard(althoughpercapitaconsumptionwillremainhigherinEuropeandNorthAmerica).Theregion’sindustrialroundwoodproductionwillbefarshortofconsumption,increasingdependenceonimportsunlesssubstantialeffortsaremadetoboostwoodproduction.However,itwillbedifficulttoexpandwoodproductioninAsiaandthePacificgiventhehighpopulationdensityandcompetinglanduses.
Changesintheuseofwoodforenergyandparticularlythepotentialforlarge-scalecommercialproductionof
cellulosicbiofuelwillhaveunprecedentedimpactsontheforestsector.Increasingtransportcostscouldalsoinfluencetheseprojections.Mostofthegrowthinglobalforestproductsvaluechainshasbeenfoundedonthedrasticdeclineintransportcostsinthepasttwodecades.Thesefactorsandothers,includingchangesinexchangerates,willinfluencethecompetitivenessoftheforestsectorandaffecttheproductionandconsumptionofmostforestproducts.
Furthermore,theindustrialroundwoodthatisusedisincreasinglylikelytocomefromplantedforests,asgrowthinproductionfromplantedforestsisexpectedtokeepupwithdemandgrowthforindustrialroundwood.Thispresentsinterestingopportunitiesandchallengesformanagementoftheremainingforestestate.
taBle 25Production of bioenergy
region Amount(MTOE)1
Average annual change(%)
Actual Projected Actual Projected
1970 1990 2005 2020 2030 1970–1990 1990–2005 2005–2020 2020–2030
Africa 87 131 177 219 240 2.1 2.0 1.4 0.9
Asia and the Pacific 259 279 278 302 300 0.4 0.0 0.6 –0.1
Europe 60 70 89 272 291 0.7 1.6 7.7 0.7
Latin America and the Caribbean 70 88 105 123 133 1.1 1.2 1.1 0.8
North America 45 64 65 86 101 1.8 0.1 2.0 1.6
Western and Central Asia 11 7 6 8 10 –2.7 –1.0 2.4 1.9
World 532 638 719 1 010 1 075 0.9 0.8 2.3 0.6
1 Mtoe = million tonnes oil equivalent.Note: data presented are subject to rounding.SourceS: fao, 2008a, 2008c.
Figure 55 Global production of energy from biomass
1 200
1 000
800
600
400
200
0
Million tonnes oil equivalent
NoteS: 1 tonne of oil equivalent is equal to approximately 4 m3 of wood. figures include the use of black liquor, agricultural residues and dung in addition to wood. SourceS: fao, 2008a, 2008c.
1970 1975 1980 1985 1990 1995 2000 2005 2010 2015 2020 2025 2030
africa Western and central asia
asia and the Pacific latin america and the caribbean
north america europe
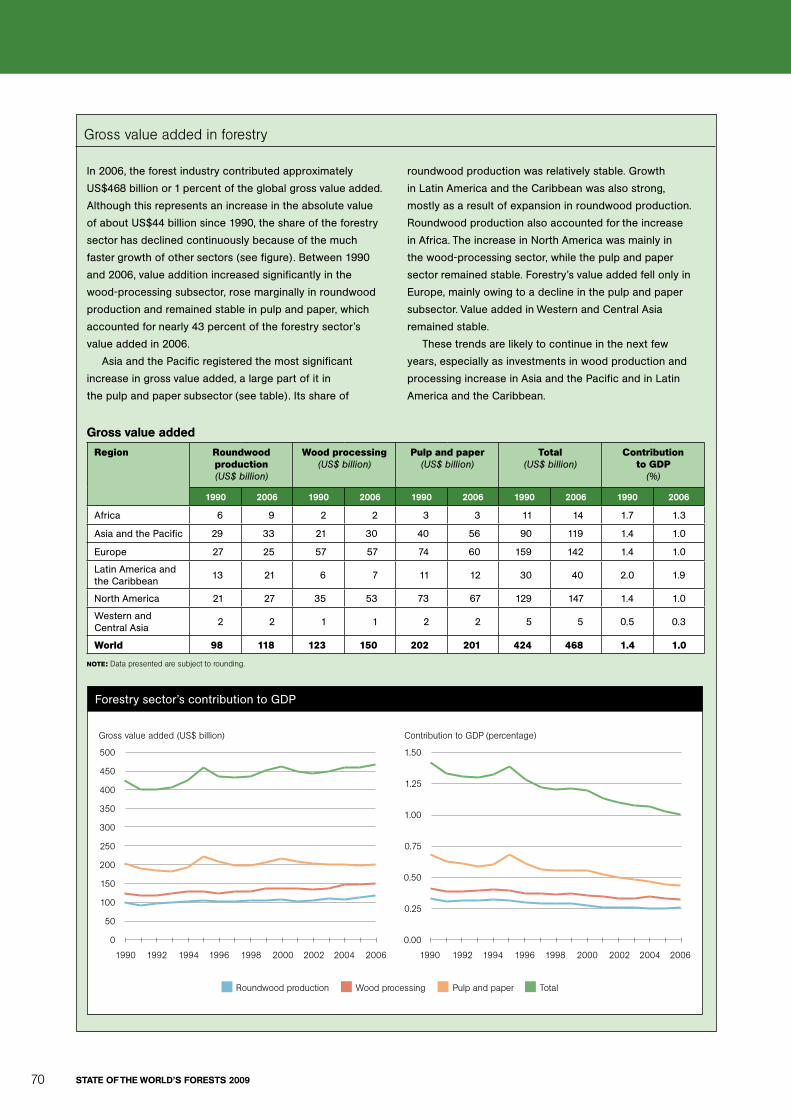
stAte oF the World’s Forests 200970
In 2006, the forest industry contributed approximately
US$468 billion or 1 percent of the global gross value added.
Although this represents an increase in the absolute value
of about US$44 billion since 1990, the share of the forestry
sector has declined continuously because of the much
faster growth of other sectors (see figure). Between 1990
and 2006, value addition increased significantly in the
wood-processing subsector, rose marginally in roundwood
production and remained stable in pulp and paper, which
accounted for nearly 43 percent of the forestry sector’s
value added in 2006.
Asia and the Pacific registered the most significant
increase in gross value added, a large part of it in
the pulp and paper subsector (see table). Its share of
roundwood production was relatively stable. Growth
in Latin America and the Caribbean was also strong,
mostly as a result of expansion in roundwood production.
Roundwood production also accounted for the increase
in Africa. The increase in North America was mainly in
the wood-processing sector, while the pulp and paper
sector remained stable. Forestry’s value added fell only in
Europe, mainly owing to a decline in the pulp and paper
subsector. Value added in Western and Central Asia
remained stable.
These trends are likely to continue in the next few
years, especially as investments in wood production and
processing increase in Asia and the Pacific and in Latin
America and the Caribbean.
gross value added in forestry
gross value added
region roundwood production(US$ billion)
Wood processing(US$ billion)
Pulp and paper(US$ billion)
total(US$ billion)
contribution to gDP
(%)
1990 2006 1990 2006 1990 2006 1990 2006 1990 2006
Africa 6 9 2 2 3 3 11 14 1.7 1.3
Asia and the Pacific 29 33 21 30 40 56 90 119 1.4 1.0
Europe 27 25 57 57 74 60 159 142 1.4 1.0
Latin America and the Caribbean
13 21 6 7 11 12 30 40 2.0 1.9
North America 21 27 35 53 73 67 129 147 1.4 1.0
Western and Central Asia
2 2 1 1 2 2 5 5 0.5 0.3
World 98 118 123 150 202 201 424 468 1.4 1.0
Note: data presented are subject to rounding.
Forestry sector’s contribution to GDP
gross value added (uS$ billion) contribution to gdP (percentage)
roundwood production Wood processing Pulp and paper total
1990 1992 1994 1996 1998 2000 2002 2004 2006 1990 1992 1994 1996 1998 2000 2002 2004 2006
500
450
400
350
300
250
200
150
100
50
0
1.50
1.25
1.00
0.75
0.50
0.25
0.00

PArt 2 adapting for the future 71
Global demand for wood products

stAte oF the World’s Forests 200972
Asthedemandforfood,fibreandfuelhasincreased,sohasthedemandforcleanairandwater,unspoiltlandscapesandotherenvironmentalservices
providedbyforests.Whereforestsareconvertedtootherlanduses,theservicestheysupplyarediminished.Maintainingsuchservicesposeschallenges,especiallywheretrade-offsbetweentheproductionofgoodsandtheprovisionofservicesmustbeaddressed.
Publiclyownedforestshavebeenamajorsourceofenvironmentalservices,providedmainlythroughregulatory,non-marketapproachessuchasprotectedareas.Withnon-stateactorsplayinganincreasingroleinresourcemanagement,aneedforincentivesfortheprovisionofenvironmentalserviceshasbecomeevident.Thischapterdiscussestheoutlookandchallengesintheprovisionofenvironmentalservicesfromforests.
regulAtory APProAChesProtected areasEstablishmentofprotectedareashasbeenanimportantandwidelyadoptedregulatoryapproachtoprotectingtheenvironment.Amainobjectiveistorestrictorprohibitactivitiesthatunderminethesupplyofenvironmentalservices.Protectedareasaregroupedintodifferentcategoriesdependingonthedegreeofprotectionafforded.
Theextentofterrestrialprotectedareas(includingbutnotonlyforestprotectedareas)hasregisteredsignificantgrowthinthepastthreedecades,althoughitseemstohavebeenlevellingoffsince2000(Figure56).Thetotalextentofprotectedareasisabout1.9billionhectares,orabout14.5percentofgloballandarea.Thisrepresentsanincreaseof35percentsince1990(UN,2008c).Theareaprotectedvariesconsiderablyamongtheregions.Theoutlookforprotectedareamanagementdependsonboththescopeforincreasingtheextentofprotectedareasandtheeffectivenessoftheirmanagement.
About13.5percentoftheworld’sforestsareinsomecategoryofprotectedarea(Schmittet al.,2008).Withtheexceptionofsomeofthelargeforestedregionswherepopulationdensitiesarelow–theAmazonBasin,the
CongoBasinandtheborealforestsofCanadaandtheRussianFederation–thescopeforfurtherexpansionofprotectedareasisprobablylimited.
Effectivemanagementofprotectedareasposesenormouschallenges.Muchdependsonthewillingnessandabilityofsocietytomeetthedirectandindirectcostsoftheirmanagement.
Indenselypopulatedcountries,protectedareasarevulnerabletodegradationcausedbyillegallogging,woodfuelcollection,grazingandpoaching.Theineffectivenessofexcludingpeoplehasledtoashiftinmanagementapproach,favouringpeople’sparticipationinprotectedareamanagement,includingincome-sharingarrangementswithlocalcommunities.Thesuccessofsuchapproachesdependsonestablishingappropriatetrade-offsbetweenconflictingobjectives.Thisrequiresarobustinstitutionalframeworkandgoodmediationskillstonegotiatealastingcompromise.
Protectedareasareoftenthelastfrontierforlarge-scaledevelopments,especiallyinvolvingmining,oildrilling,infrastructureandlarge-scaleagriculture.Low-income
Meeting the demand for environmental services of forests
Figure 56 Growth in terrestrial protected areas
500
400
300
200
100
01990 1992 1994 1996 1998 2000 2002 2004 2006
Million hectares
Source: un, 2008c.
africa asia and the Pacific
europe latin america and the caribbean
north america Western and central asia

PArt 2 adapting for the future 73
countriesdependentonlandandothernaturalresourcesfortheirdevelopmentoftenfinditextremelydifficulttoresistsuchoptions.
sustainable forest managementAslessthanone-seventhoftheworld’sforestsaresetasideasprotectedareas,mostforestenvironmentalservicesareprovidedinconjunctionwiththeproductionofwoodandotherproducts.Productioncanbecompatiblewithprovisionofenvironmentalservices,butonlyuptoacertainlevel.Thus,considerableattentionhasbeendevotedtodevelopingwoodproductionsystemsthatminimizeenvironmentaldamageandsupportcontinuedprovisionofservices.Implementationofsustainableforestmanagement–whichaddressestheeconomic,socialandenvironmentalfunctionsofforests–isanimportantapproachtoensuringabalancebetweentheobjectivesofproductionandconservation.Maintainingcriticalecosystemfunctionsisakeypillarofsustainableforestmanagement.“Close-to-naturesilviculture”andthe“ecosystemapproach”areessentiallyvariantsofsustainableforestmanagement,givinggreateremphasistoenvironmentalservices.
Whiletheconceptofsustainableforestmanagementisacceptedastheframeworkformanagingforestsinmostcountries,itsimplementationdiffersconsiderablyamongthem.Barrierstoitsadoptionarerelativelyfewwhereinstitutionsarewelldevelopedandsocietyisabletomeetthehighercosts,asisthecaseinmanydevelopedcountries.However,inlow-incomesituations,sustainableforestmanagementfacesfarmoreconstraints,reflectinglimitedabilityandwillingnesstopayfortheadditionalcostsinvolvedinadheringtothesocialandenvironmentalcriteria.Consequently,inthetropics,theproportionofforeststhataresustainablymanagedremainsverylow(ITTO,2006).
green public procurementPublicprocurementpoliciesthataimtoensurethatwoodproductspurchasedhavebeenproducedlegallyhavethepotentialtopromotesustainableforestmanagementandenvironmentalprotection.Forexample,Japan,NewZealandandseveralcountriesinEuropehave
operationaltimberprocurementpolicies,andmanyregionalandlocalgovernmentshaveestablishedrestrictiverulesfortheirprocurementcontracts(UNECEandFAO,2006a).Anincreasingnumberofpublic-andprivate-sectorplayersarealsoadoptinggreenbuildingandprocurementpolicies(Metafore,2007)(Box32).
mArket meChAnisms: the demAnd sideCertification for green productsAmajorconditionfortheadoptionofsustainableforestmanagementisademandforproductsthatareproducedsustainablyandconsumerwillingnesstopayforthehighercostsentailed.Certificationrepresentsashiftfrom
“Green building” is construction that conserves raw
materials and energy and reduces environmental impacts.
It includes consideration of future water use and energy
demands, ecological site selection and the procurement
of sustainably produced materials. In the United States of
America, many public agencies and schools have adopted
green building standards. Leadership in Energy and
Environmental Design is a green building rating system
developed in 1994 by the United States Green Building
Council (a member of the World Green Building Council,
which has members in more than ten countries). It is a
national third-party certification programme for the design,
construction and operation of high-performance green
buildings. Green building legislation, policies and incentives
are in place in 55 cities, 11 counties and 22 states.
While green building provides healthier work
environments at both the environmental and human
levels, the high costs involved are frequently a
disincentive. However, the initial costs are often mitigated
over time by gains in overall efficiency.
Source: uSgBc, 2008.
BoX 32 green building in the united States of america

stAte oF the World’s Forests 200974
regulatoryapproachestomarketincentivestopromotesustainableforestmanagement.Bypromotingthepositiveattributesofforestproductsfromsustainablymanagedforests,certificationfocusesonthedemandsideofenvironmentalconservation.
In2008,morethan300millionhectares,oralmost8percentoftheworld’sforests,werecertifiedbyindependentthirdparties,asignificantincreasesincethird-partycertificationwasintroducedin1993(Figure57).ThetwomajorcertificationsystemsarethoseoftheForestStewardshipCouncil(FSC)andtheProgrammefortheEndorsementofForestCertificationSchemes(PEFC).Inaddition,manycountrieshavenationalcertificationsystems,oftenaffiliatedwithPEFC(UNECEandFAO,2006b;ITTO,2008).
In2006,certifiedforestssuppliedabout24percentoftheglobalindustrialroundwoodmarket (UNECEandFAO,2006b).FSC(2008)estimatesannualsalesofFSC-labelledproductsatUS$20billion.PEFCestimatesthat45percentoftheworld’sroundwoodproductionwillcomefromcertifiedforestsby2017(Clark,2007).Inadditiontowood,otherproductsareincreasinglybeingcertified,includingwoodfuelandNWFPs(UNECEandFAO,2007).
Bothmajorcertificationsystemsnowallownon-certifiedwoodtobesoldtogetherwithcertifiedwoodundera“mixedsources”label,provideditmeetscertainbasicrequirementsofacceptableforestmanagement(WorldResourcesInstitute,2007).
Thefollowingarekeyissuesandtrendsincertification:• Althoughcertificationstartedwiththeobjectiveof
encouragingsustainableforestmanagementinthetropics,only10percentofthecertifiedforestareain2008wasinthetropics.TherestwasinEuropeandNorthAmerica,reflectingeconomicandinstitutional
advantagesinadoptingcertificationindevelopedcountries.
• Certificationprovidesaccesstomarketswhereconsumersprefergreenproducts,butnopricepremiumtocoverthecostsofcertification.Formanyproducers,accesstothegreenmarketisinsufficientincentiveforseekingcertification,especiallywhenthereisdemandforcomparableuncertifiedproductsproducedatalowercost.
• Majorexpansionincertificationwilldependontheresponseofconsumersinrapidlygrowingmarkets(especiallyChinaandIndia).Whilethedesireformarketaccessmayencouragethegrowthofcertification,themainconstraintscouldbeonthesupplyside,especiallytheinvestmentsrequiredtoreachtheminimumthresholdlevelofmanagementallowingcertification.
mArket meChAnisms: the suPPly sideEncouragingthesupplyofenvironmentalservicesthroughappropriatepaymentstoforestownershasreceivedconsiderableattentionasameansofsupportingforestconservation.Whilesuchpaymentshavelongexistedforrecreationalservices(forexample,throughentryfeestorecreationalsites),theyarebeingadoptedforotherservicessuchaswatershedprotection,biodiversityconservationandcarbonsequestration(Box33).Theideaistoplaceenvironmentalservicesonaparwithothermarketedproducts,correctingthebiasagainsttheirsupply.
Paymentsforenvironmentalservices(PES)havebeendevelopedmainlyforwatershedservices,carbonsequestrationandtosomeextentbiodiversityconservation.Thegrowthofecotourismhasalsofacilitatedthedevelopmentofmarketsforscenic andnaturevalues,especiallythroughaccessfeesandpermits.
Watershed protectionWatershedprotectionisoneofthemostimportantenvironmentalservicesinvolvingforestsandhasreceivedconsiderableattentionforpaymentschemes.Theseschemesinvolvepaymentstoupstreamlandusersforimprovingwaterqualityandquantitythroughappropriateland-usepractices.Sucharrangementstendtobemosteffectiveinsmallwatersheds,whereserviceprovidersandbeneficiariesareabletointeractandtheinformationflowisrelativelysmooth.Atlargerscales,morecomplexarrangementsbecomenecessary.Inmostcases,thepaymentsarefromutilitycompaniestolandusers.
Aswaterisindispensableandtangible,usersaregenerallywillingtopayforimprovingthequality,quantityandregularityofitssupply.Moreover,itiseasygeographicallytoidentifytheprovidersandbeneficiariesoftheservice.
Figure 57 FSC- and PEFC-certified forest area, 2008
total
Western and central asia
africa
asia and the Pacific
latin america and the caribbean
north america
europe
0 50 100 150 200 250
Million hectares
SourceS: fSc, 2008; Pefc, 2008.
fSc Pefc

PArt 2 adapting for the future 75
Meeting the demand for environmental services of forests
The UNCCD promotes synergies offered by forests among
multilateral environmental agreements. Sustainable forest
management, sustainable land management and climate
change adaptation strategies are interrelated; solutions for
forest degradation and deforestation overlap with those for
land degradation. The Global Mechanism uses national policy
processes for coordination and reconciliation, with the aim
of increasing investments and financial flows in forests and
agriculture. It supports efforts to increase resource allocations
in national budgets, to take full advantage of innovative
financial mechanisms and to obtain “vertical funds” focused
on specific themes.
From a financing perspective, the potential for increased
financial flows to address land degradation and degraded forests
in the future climate regime is interesting but demands careful
preparation. A responsible pro-poor policy framework would
provide equitable compensation to smallholder farmers that
offer environmental services to the country and climate change
resilience to the world. Subsistence farmers in fragile ecosystems
could become key players in the international market.
Although forests in arid and semi-arid lands have
comparatively low carbon values, they are being degraded at
relatively high rates in some regions and, therefore, are targets
of national and international schemes. In addition, low-carbon-
density forest lands may act as buffer areas between agricultural
lands and more dense forests. Their protection is particularly
important in preventing encroachment, conversion, further land
degradation and eventual desertification. n
Forests and synergies among multilateral environmental agreementsFrom the Global Mechanism of the United Nations Convention to Combat Desertification (UNCCD)
Views from CPF partners
Climate change poses a major challenge to forests. Its
impacts on the supportive and regulating processes of
forests and on how people use forest resources are difficult
to predict. The best response to the uncertainty climate
change presents is to maintain or increase the functioning
and resilience of all forests as a matter of urgency. This
challenge provides opportunities for forest stakeholders at
the national and international levels to increase cooperation.
UNEP promotes an ecosystem approach that considers
lessons learned from the past and seeks preparedness for
challenges such as climate change. The services that forests
provide need to be part of development strategies and
incorporated into financial decision-making. Climate regulation
is just one of the services for which a monetary value
urgently needs to be established. Others include hydrological
regulation, protection from natural hazards, nutrient cycling,
energy, waste treatment and freshwater provisioning.
As population growth persists and the decline of forest
ecosystem services continues, UNEP will promote equitable
distribution of ecosystem services across socio-economic
groups as an important measure for increasing human well-
being and for mitigating conflicts and disasters. n
Valuing ecosystem servicesFrom the United Nations Environment Programme (UNEP)
Views from CPF partners
•An operational PES scheme can take years to develop.
The crucial step is finding willing buyers.
•Most voluntary, private-driven PES schemes have been
small, have high transaction costs and deliver modest
rural incomes and modest conservation gains.
•Government-driven PES schemes have tended to be
larger and deployed faster, and they have resulted in
improved forest practices in some instances.
•Regulation-driven PES with private buyers (e.g. markets
for carbon credits) have generated high expectations
that have yet to be fully realized.
•PES schemes require supportive legal and institutional
frameworks, clear property rights and assistance to
small farmers and rural communities.
•National governments remain the most important
source of funding for PES programmes, with the
international community acting as a catalyst.
•Ecosystem service payments may be insufficient to
provide incentives for forest conservation where there
are high opportunity costs for land.
BoX 33 Key lessons on developing payment for environmental services schemes
Source: fao, 2007d.

stAte oF the World’s Forests 200976
Nevertheless,developingasystemofpaymentsforwatershedservicesentailsanumberofchallenges,suchas:
• lackofclarityaboutthehydrologicalprocessesinvolvedand,inparticular,theimpactofdifferentlandusesonthequantity,qualityandregularityofwaterflow;
• publicoppositionrelatedtoprivatization,perceptionsthataccesstowaterisafundamentalrightandconcernsaboutthepotentialforincreasedinequities(i.e.thatpaymentsystemsmightimpedepoorpeople’saccesstowater);
• hightransactioncostsforthedevelopmentofPES,especiallyforlargewatershedswithmanyprovidersandusersofwatershedservices.
Consequently,marketmechanismsfortheprovisionofwatershedservicesarestillintheearlystagesofdevelopment.Mostoftheexistingarrangementsareeitherbetweensmallgroupsofusersandprovidersthatcaninteractefficiently,orestablishedbylargeelectricityorwaterutilitiesthatcanlevythenecessarychargesandchannelthefundstothoseundertakingwatershedconservation.
Carbon markets and forestryPaymentforcarbonsequestrationtomitigateclimatechangeisoneofthefastest-growingenvironmentalmarkets.UndertheKyotoProtocol,threeflexiblemechanismswerecreated:theCleanDevelopmentMechanism(CDM),jointimplementationandemissiontrading.UndertheCDM,AnnexI(industrialized)countriesmayoffsetacertainpartoftheiremissionsthroughinvestmentincarbon
sequestrationorsubstitutionprojectsinnon-AnnexI(developing)countriesandthusacquiretradablecertifiedemissionreductions.Underjointimplementation, AnnexIcountries mayjointlyexecutecarbonsequestrationorsubstitutionprojects.Emissiontradingpermitsthemarketingofcertifiedemissionreductions.
Carbonmarketscomprisethecompliancemarket(whichfollowsstringentrulesundertheKyotoProtocol)andthevoluntarymarket.In2007,thetotalcarbonmarket(includingallvoluntaryandcompliancemarkets)amountedtoUS$64billion,morethandoublethe2006total(Hamiltonet al.,2008).Thevoluntarycarbonmarket,whereasizeableshareofcarboncreditscomesfromforestactivities,alsodoubledintermsofemissionstraded(65milliontonnesofcarbondioxideequivalentin2007),andtripledintermsofvalue(US$331million)(Box34).
Whiletheappealofafforestationandreforestationasaclimatechangemitigationstrategyisconsiderable,forest-basedcarbonoffsetprojectsfaceseveralchallenges,includingsettingbaselines,permanence,leakageandmonitoringconstraints.Theproblemsareparticularlysevereincountrieswithhighdeforestationrates,whichusuallyalsohavemajorpolicyandinstitutionalconstraints.TheseissueshavehinderedamoreprominentroleforforestsinclimatechangemitigationundertheCDM(onereforestationprojectoutof1133registeredprojectsasofAugust2008).
FollowingthethirteenthsessionoftheConferenceofthePartiestoUNFCCCinBali,Indonesia,in2007,manyhighhopesweregeneratedontheinclusionofREDDinthepost-Kyotoclimatechangemitigationefforts.Theeconomic
Reduction in emissions from deforestation and forest
degradation is generally recognized as a relatively low-
cost greenhouse gas mitigation option. About 65 percent
of the total mitigation potential of forest-related activities
is located in the tropics, and about 50 percent of the total
could be achieved by reducing emissions from deforestation
(IPCC, 2007) – which would also provide other benefits and
complement the aims and objectives of other multilateral
environmental agreements while addressing some of the
needs of local and indigenous communities.
At the Climate Change Conference in Bali, Indonesia, in
December 2007, countries adopted a decision on reducing
emissions from deforestation in developing countries.
Governments are encouraged to seek to overcome the
barriers to implementation (lack of effective institutional
frameworks, adequate and sustained financing, access
to necessary technology and/or appropriate policies and
positive incentives) through capacity building, provision
of technical assistance, demonstration activities and
mobilization of resources.
Several governments have already announced their
willingness to support such activities, to provide funds and
to address outstanding methodological issues (related
to assessment of changes in forest cover and associated
forest carbon stocks and greenhouse gas emissions,
reference emission levels, estimation of emissions from
forest degradation, implications of national and subnational
approaches, etc.). Several organizations have also launched
initiatives to assist developing countries in these efforts.
Opportunities for collaboration should be explored to ensure
that efforts are complementary and to maximize the benefits
for all countries involved. n
reducing emissions from deforestation and forest degradationFrom the United Nations Framework Convention on Climate Change (UNFCCC)
Views from CPF partners

PArt 2 adapting for the future 77
Meeting the demand for environmental services of forests
andscientificrationaleforREDDhasbeenwellarticulatedinthattheforestsector(mainlydeforestation)accountsformorethan17percentofgreenhousegasemissionsandthataddressingdeforestationanddegradationwouldbeamorecost-effectivemitigationoptionthanbringingaboutchangesinenergyuse.However,providingincentivestodesistfromdeforestationinvolvescomplexpolicy,institutionalandethicalissues(Martin,2008).
Biodiversity conservationBiodiversityconservationhaslargelybeeninthepublicdomain,primarilythroughestablishmentandmanagementofprotectedareas.However,aspublicfundingbecomesinsufficienttosupportbiodiversityconservation,many
The year 2010 will be celebrated the world over as the
International Year of Biodiversity. This occasion should be
used as a starting point for a more sustainable relationship
with our forests.
Forests are home to two-thirds of all terrestrial
species. If we are to achieve the 2010 target to reduce
the loss of biodiversity significantly, all governments
and relevant organizations must redouble their efforts
to halt deforestation and to manage forests sustainably.
For example, market failures that stand in the way of
appreciating the real value of forests need to be addressed.
Biodiversity and the numerous ecosystem services that
forests provide must be properly accounted for, and they
must be marketed. Forest governance must be improved
and the management of forests must become a matter
of societal choice. In addition, information about the
importance and value of forests must reach key decision-
makers. The CBD programme of work on forest biodiversity
(which was reviewed by the ninth meeting of the
Conference of the Parties in Bonn, Germany, in May 2008)
addresses all of these issues.
In a context of rising demand for wood products,
planted forests will meet a greater part of timber needs in
the future. Hence, it is important to ensure that planted
forests increasingly fulfil biodiversity objectives, for example
by forming ecological corridors between protected areas.
New methods and technologies will make it possible to
establish planted forests exclusively on degraded lands,
without damage to primary forests. Primary forests will
serve mostly as reservoirs for biodiversity and as storage
space for carbon. n
Primary forests, planted forests and biodiversity objectivesFrom the Convention on Biological Diversity (CBD)
Views from CPF partners
Voluntary carbon markets, or the exchange of offsets by
entities not subject to greenhouse gas emission caps, have two
components:
•the structured and monitored cap-and-trade system of the
Chicago Climate Exchange (CCX);
•the more disaggregated over-the-counter (OTC) system,
which is not driven by an emissions cap and does not
typically trade on a formal exchange.
In 2007, 42.1 million tonnes of carbon dioxide
equivalent (CO2e) were transacted on the OTC market and
22.9 million tonnes on the CCX, representing a tripling of
transactions for the OTC market and more than a doubling for
the CCX since 2006.
Within the larger OTC voluntary market, forestry projects
(which include afforestation and reforestation of both planted and
natural forests and avoiding deforestation efforts) accounted for
18 percent of transactions in 2007, down from 36 percent in 2006.
Projects for avoiding deforestation increased from 3 percent of
the volume in 2006 to 5 percent in 2007. Forestry projects and
particularly those involving afforestation or reforestation remained
among the highest-priced project types in 2006 and 2007, with
weighted average prices of US$6.8–8.2 per tonne of CO2e.
BoX 34 forests and voluntary carbon markets
SourceS: gorte and ramseur, 2008; hamilton et al., 2008.
countrieshavemadeeffortstoidentifyalternativewaystofinanceit,includingthroughsystemsofpaymentfortheservicesprovided.Suchsystemsarecompatiblewithobjectivesofincreasedcommunityparticipationinbiodiversityconservation.Examplesincludeprivateprotectedareas,whichdependonvisitorfeesasthemainsourceofincome.
Paymentsystemsforconservationarediverse(Jenkins,ScherrandInbar,2004),including:
• outrightpurchaseofhigh-valuehabitat;• paymentforaccesstopotentiallycommercialspecies
orhabitat;• paymentinsupportofmanagementthatconserves
biodiversity;

stAte oF the World’s Forests 200978
• tradabledevelopmentrights;• supportforenterprisesthatadheretoconservation
principlesintheirbusinesspractices.Eachoftheserequiresaspecificpolicyand
institutionalframework.Themarketforbiodiversityconservationisstill
nascent.Mostofthepurchasesofhigh-valuehabitats(oftenunderdebt-for-natureswaps)arebyinternationalagenciesincludingnon-governmentalorganizations(NGOs)andfoundations.Conservationeasements,underwhichprivatelandownerssurrendercertaindevelopmentrightstoprovideenvironmentalbenefitsinperpetuityinreturnforcompensation(includingtaxexemptions),arewidelyadoptedintheUnitedStatesofAmerica(TNC,2004).
other compensation arrangementsSomecountries,whenunabletoavoidthedevelopmentofforestsorotherhabitats,compensateforthelossbysupportingconservationinotherlocations.Sucharrangementsinvolvetransferpaymentsthatarenotnecessarilylinkedtothequantityorqualityoftheservicedeliveredandarenottruemarketsfortheprovisionofenvironmentalservicesintheconventionalsense.AtypicalexampleiswetlandmitigationbankingintheUnitedStatesofAmerica,inwhichunavoidableimpactsonaquaticresourcesarecompensatedbyestablishing,enhancingorconservinganotheraquaticresourcearea(USEPA,2008).
AnotherexampleisthecompensatoryafforestationprogrammeinIndiaunderwhichanydiversionofpublicforestsfornon-forestrypurposesiscompensatedthroughafforestationindegradedornon-forestland.Fundsreceivedascompensationareusedtoimproveforestmanagement,includingafforestation,assistednaturalregeneration,managementandprotectionofforests,andwatershedmanagement.Agovernmentauthorityhasbeencreatedspecificallytoadministerthisprogramme(SMEToolkitIndia,2008).
soCio-eConomiC AsPeCtsSupportforprovisionofenvironmentalservicesandtheappropriatenessofregulatoryandothermeasuresneedtobeconsideredinthelargersocio-economiccontext.Countriesandsocietieswithhigherincomestendtobemorewillingtopayforenvironmentalservices.Low-incomecountriesmayhavedifficultygivingprioritytoprovisionofenvironmentalservices,especiallywhentheyfacemoreeconomicallyattractivedevelopmentoptions(Box35).
ThisraisesthequestionofthepotentialroleofPESinpovertyalleviation(FAO,2007e).Therearesome
indicationsthatthepoormaynotbenefitparticularlyfromecosystemmarkets(FAO,2004).Theconcernistoensurethatthepaymentsfortheenvironmentalservicesactuallygotothefarmerswhoprovidetheservicesbyadoptingappropriatelanduse.However,theirabilitytoprovidetheservicesdependslargelyonrightstoandownershipoftheland,aswellasotherpolicyandinstitutionalfactorsthatdeterminethetransactioncosts.Consequently,itisoftenthelargelandownersthatareabletotakeadvantageofPESarrangements.
Anadditionalconcernisthat,giventhesocialandeconomicinequitiesthatexistinmostcountries,whenmarketsdevelopandprofitscanbemadebysellingecosystemservices,theaccessofpoorpeopletotheseservicesmaybereduced.
Achiefimpedimenttotheprovisionofenvironmentalservicesthroughexistingapproachesisthehightransactioncost.Environmentalmarketsaremoresophisticatedandcomplexthancommoditymarkets,requiringsubstantialinformationontechnicalaspectsofprovisionofservicesandwell-developedinstitutionalandlegalarrangements.Thisagainsuggeststheenormouseffortrequiredtodevelopeffectivemeasurestoprovideenvironmentalservicesinmostdevelopingcountries.
conversion of biodiversity-rich delta to sugar-cane
plantations
Kenya has recently embarked on a large-scale sugar
plantation, converting about 2 000 km2 of the pristine Tana
River Delta, which provides habitat for a large number of
species and a source of livelihood to local communities.
The objections of conservationists and local communities
have led to judiciary intervention, delaying project
implementation.
closure of sugar-cane plantations for wetland
restoration
The United States Sugar Corporation, the largest
producer of cane sugar in the United States of America,
has agreed to close down about 750 km2 of sugar-cane
plantations to help in the restoration of the Everglades
wetlands. The State of Florida will pay the company
an estimated US$1.75 billion in order to purchase
the land.
SourceS: Environment News Service, 2008a, 2008b.
BoX 35 Willingness and ability to pay for conservation
PArt 2 adapting for the future 79
Meeting the demand for environmental services of forests
outlookTheoutlookfortheprovisionofenvironmentalservicesismixed.Growthinincomecoupledwithgreaterawarenesswillusuallystrengthendemandforenvironmentalservicesaswellastheabilityofasocietytomeetthecostsofenvironmentalprotection.However,increasedincomeoftenreducesenvironmentalservicesasmoregoodsandservicesareproduced.Inparticular,countrieswithrapidlygrowingeconomiesoftengothroughaperiodwhenforestresourcesareexploitedorconvertedtootheruses,resultinginadeclineinenvironmentalservices.
Thereisnosinglesolutionappropriatetoallcontexts.Bothmarketandnon-marketapproacheshavetheirstrengthsandlimitations.Itisoftenassumedthateconomicgrowthisaprerequisiteforimprovingtheenvironment,buttherealityismorecomplex.Manyfactors,includinginstitutionsandlegalframeworks,willhaveanimpactontheabilityofacountrytomanageitsforestsinsuchawayastoprovidestableorincreasingenvironmentalservices.

stAte oF the World’s Forests 200980
institutionsarekeytosustainableresourcemanagementandsocietaladaptationtosocial,economicandenvironmentalchanges.Asinothersectors,theoverall
trendinforestryistowardsapluralisticinstitutionalenvironment,attributabletotwodivergenttrends:globalizationandlocalization.Increasedcross-bordermovementofcapital,labour,technologyandgoodsresultingfromglobalizationhasnecessitatedadaptationbyexistinginstitutionsandtheestablishmentofnewones.Atthesametime,localcommunitieshavebecomemoreinvolvedinresourcemanagementthroughdecentralizationanddevolutionofresponsibilities.Whilethereareconsiderabledifferencesacrosscountriesandregions,thischaptersummarizeshowinstitutionsintheforestsectorarerespondingtotheemergingdevelopmentsoutlinedinPart1.
institutionAl ChAnge in Forestry: An overvieWBeforethe1990s,theforestsectorwasdominatedbygovernmentforestryagencies,severallargeenterprises,amultitudeofsmallandmediumenterprises(manyoperatingoutsidetheformalsystem)andafewinternationalorganizationslargelyfocusedonprovidingtechnicalsupporttopublicforestryagencies.Today,theforestsectorischaracterizedbyagreaternumberofinstitutionsaddressingawiderarrayofissues(Box36).
Theprivatesectorandcivil-societyorganizationshaveexperiencedsignificantgrowthsincethe1990s,particularlyasaresultof:
• thepoliticalandeconomicchangesfollowingthecollapseoftheSovietUnion,especiallytheshiftfromcentralizedplanningtomarket-orientedeconomicpoliciesandglobalization;
• growthinenvironmentalawarenessandconcernsandtheproliferationofrelatedinitiativesfollowingtheUnitedNationsConferenceonEnvironmentandDevelopment(UNCED)in1992;
• changesinfundingforforestry,i.e.increasesinforeigndirectinvestmentsandprivate-foundation
support(Box37)alongsidedecreasesinofficialdevelopmentassistance.
Developmentsininformationandcommunicationtechnologieshavefurthercatalysedinstitutionalchanges,challenginghierarchicalstructuresandcallingforinstitutionstorespondtothedemandsofamoreinformedpublic(seeBox45onpage88).
Changing institutions
Public forestry agencies and enterprises
•National policy formulation, legislation and planning,
including national forest programmes
•Management of forests and forest industries and all
related activities, including trade in forest products
•Regulatory and enforcement functions – providing
a level playing field to other institutions involved in
forest and tree resources management
Private sector
•Management of forests and other resources, including
planted forests
•Production and processing of, and trade in, wood and
non-wood products
civil-society organizations
•Environmental and social advocacy in policy and
market development and awareness generation
informal sector
•Production and processing of, and trade in, wood and
non-wood products
international and regional organizations and
initiatives
•Intergovernmental forest policy, environment- and
trade-related processes and conventions
•Financing, development and technical assistance,
including technology transfer
•Regional collaboration arrangements
•Science and technology development and networking
BoX 36 types of institutions dealing with forest issues
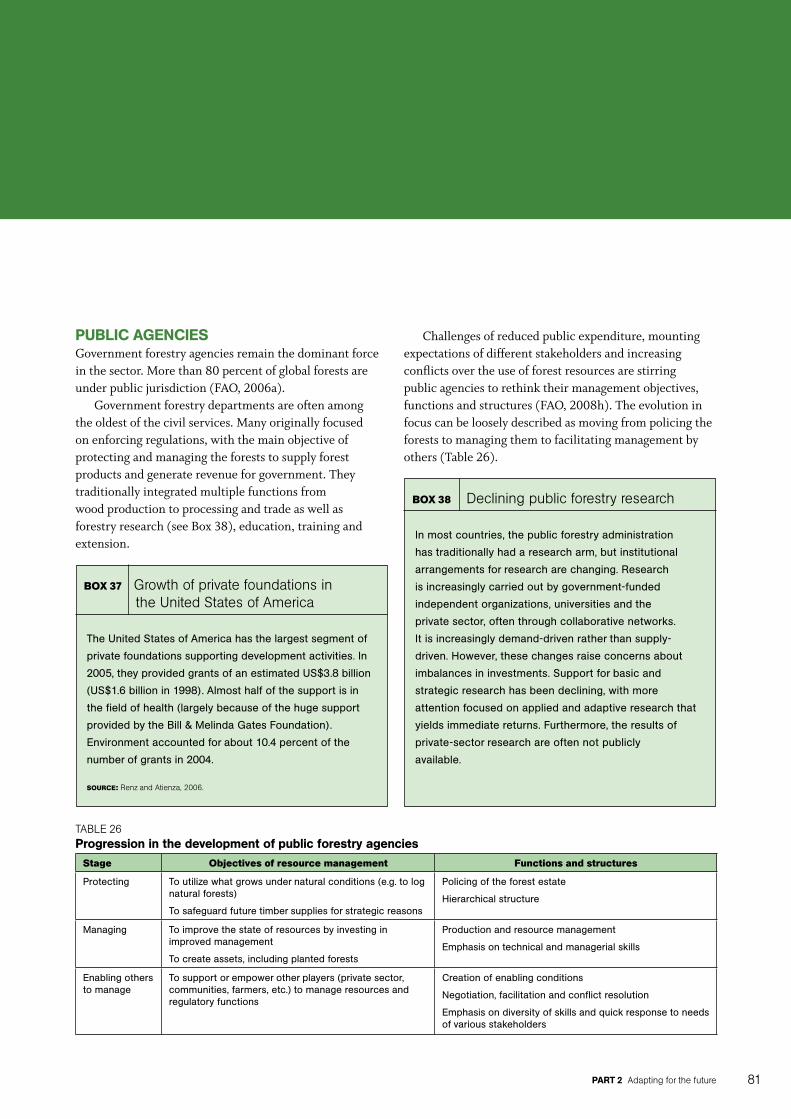
PArt 2 adapting for the future 81
Challengesofreducedpublicexpenditure,mountingexpectationsofdifferentstakeholdersandincreasingconflictsovertheuseofforestresourcesarestirringpublicagenciestorethinktheirmanagementobjectives,functionsandstructures(FAO,2008h).Theevolutioninfocuscanbelooselydescribedasmovingfrompolicingtheforeststomanagingthemtofacilitatingmanagementbyothers(Table26).
The United States of America has the largest segment of
private foundations supporting development activities. In
2005, they provided grants of an estimated US$3.8 billion
(US$1.6 billion in 1998). Almost half of the support is in
the field of health (largely because of the huge support
provided by the Bill & Melinda Gates Foundation).
Environment accounted for about 10.4 percent of the
number of grants in 2004.
Source: renz and atienza, 2006.
BoX 37 growth of private foundations in the united States of america
In most countries, the public forestry administration
has traditionally had a research arm, but institutional
arrangements for research are changing. Research
is increasingly carried out by government-funded
independent organizations, universities and the
private sector, often through collaborative networks.
It is increasingly demand-driven rather than supply-
driven. However, these changes raise concerns about
imbalances in investments. Support for basic and
strategic research has been declining, with more
attention focused on applied and adaptive research that
yields immediate returns. Furthermore, the results of
private-sector research are often not publicly
available.
BoX 38 declining public forestry research
PuBliC AgenCiesGovernmentforestryagenciesremainthedominantforceinthesector.Morethan80percentofglobalforestsareunderpublicjurisdiction(FAO,2006a).
Governmentforestrydepartmentsareoftenamongtheoldestofthecivilservices.Manyoriginallyfocusedonenforcingregulations,withthemainobjectiveofprotectingandmanagingtheforeststosupplyforestproductsandgeneraterevenueforgovernment.Theytraditionallyintegratedmultiplefunctionsfromwoodproductiontoprocessingandtradeaswellasforestryresearch(seeBox38),education,trainingandextension.
taBle 26Progression in the development of public forestry agencies
Stage objectives of resource management Functions and structures
Protecting To utilize what grows under natural conditions (e.g. to log natural forests)
To safeguard future timber supplies for strategic reasons
Policing of the forest estate
Hierarchical structure
Managing To improve the state of resources by investing in improved management
To create assets, including planted forests
Production and resource management
Emphasis on technical and managerial skills
Enabling others to manage
To support or empower other players (private sector, communities, farmers, etc.) to manage resources and regulatory functions
Creation of enabling conditions
Negotiation, facilitation and conflict resolution
Emphasis on diversity of skills and quick response to needs of various stakeholders
stAte oF the World’s Forests 200982
Insomecases,reformhasbeensuperficial;forexample,limitedtochangesinministerialresponsibility(inparticularshiftingbetweenagricultureandenvironmentministries)ortostructuralbutnotfunctionalchange.Manypublicagenciesareunabletodevelopthehumanresourcesneededinordertomanageforestresourcesinanincreasinglycomplexenvironment(Nair,2004;Temu,2004),andmanylacksufficientcapacityforlong-termstrategicplanningoropensharingofinformation,withatendencytobereactivetoshort-termpressuresandconcerns(oftenmirroringthelargerpublicadministration).
Strategiesusedinmoresuccessfultransitionstoanenablingrolehaveincluded:
• separatingpolicyandregulatoryfunctionsfrommanagementfunctions;
• entrustingwoodproductionandprocessingtoanindependentcommercialgovernmententityorprivatizingallcommercialactivities,usuallyaspartofalargerpolicyofeconomicliberalization,oftentriggeredbygovernmentbudgetarycrises(asinthecaseofNewZealand[O’Loughlin,2008]);
• decentralizinganddevolvingmanagementresponsibilitytothelocallevel(Box39),usuallyaspartofalargerprogrammeofpoliticalandadministrativedecentralization–withwidelydifferentresults.
PrivAte seCtorPrivateenterprisesrangefromindividualandhouseholdmicroenterprisesandsmallfarms,oftenoperatingonaminimalbudget,tolargetransnationalcorporations,whoseannualturnoverinsomecasesexceedstheGDPofasmallcountry.
Corporate sectorThecorporatesectoraccountsforalargesegmentofloggingconcessions,plantedforestsandwoodindustries.Profitabilityremainsitsprimaryobjective.Corporationsoperateinanextremelycompetitiveenvironmentwithconstantpressurestocutcostsandimprovemarketshare.Thefollowingaresomeofthesector’smajorchallengesandopportunities:
• RapidgrowthofemergingeconomiesinAsiaisresultinginaregionalshiftinthedemandforwoodproducts(seethechapter“Globalwoodproductsdemand”inPart2).Investmentsinnewcapacityaretakingplaceincountrieswheredemandandprofitabilityareperceivedtobehighandthecostsofproduction–especiallyoffibre,energyandlabour–arelow.Inparticular,thepulpandpaperindustryhasseenaspateofmergersandacquisitionsandtheclosureofless-competitivemills.
• Pressureforindustrytoadheretotenetsofcorporatesocialresponsibilityisexpectedtomountassocietybecomesmoreconcernedaboutenvironmentalandsocialissues(Box40).“Green”valueswillinfluenceprocurementofgoodsandservicesalongthewholesupplychain.Consumerpreferenceisshiftinginfavourofcertifiedproducts,butthisisnotalwaysreflectedinhigherprices.
• Climatechangeconcernsareexpectedtoprovidenewopportunitiesforwoodproducts(whichstorecarbonandrequirerelativelylittleenergytoproduce)andindustrialwoodenergy.Majorrelatedchallengesincludeincreasingtransportcostsowingtotherapidexpansionofglobalvaluechainsandincreasingdemandforwood.
Strategiesforadaptationtotheabovechallengesinclude:• Focusoncorebusinessanddivestmentofnon-core
activities:Thetraditionalmodeloflargeintegratedindustrialunitsisgivingwaytohighlynetworkedglobalsupplychains,linkingfirmsandaffiliatesacrosscountries,includingsubcontractorsandhomeworkersoperatingoutsidetheformalsystem.Componentsofproductionmayberelocatedabroadforimprovedprofitability.Woodproductionmaybeoutsourcedtofarmersthroughpartnershiparrangements.Forestproductcompaniesincreasinglyrecognizethattyinguplargestocksofcapitalinforestownershipaffectstheirshort-runcashflow
external to the forest sector
• Significant transfer of power and responsibilities
to democratically elected and accountable lower
levels of government
• Fair and clear enforced property rights and an
appropriate regulatory framework
• Respect of the law by governments, the private
sector and civil society
• Effective linkages between government, the private
sector and civil-society institutions
internal to the forest sector
• Effective and balanced distribution of
responsibilities and authority among different levels
of government
• Adequate resources and institutional effectiveness
at each level of government
• Sufficient participation of civil society and the
private sector at all levels
Source: contreras-hermosilla, gregersen and White, 2008.
BoX 39 elements of successful decentralized forest governance

PArt 2 adapting for the future 83
Changing institutions
andstockmarketvalues.Divestmenthasledtotheemergenceofnewplayers(Boxes41and42).
• InvestmentinR&D:ThecorporatesectorleadsinvestmentinR&D,focusingonappliedandadaptiveresearchandonthedevelopmentofnewproductsandprocessestoestablishcompetitiveadvantageandtomeetconsumers’environmentaldemands.Thesectoroftentakesadvantageofresultsfrompublicresearch.Plantedforestsmanagedbythecorporatesectorareamongthemostproductive.
other private and community-based enterprisesGlobalizationprovidesnewopportunitiesforsmallandmediumenterprises,buttheywillneedtoadaptcontinuouslytosurviveintensifyingcompetition.Issuesaffectingthelong-termperformanceofthisvibrantinstitutionalsegmentinclude:
• Ownership,legalframeworkandlevelplayingfield:Ownershipandsecurityoftenurearenecessaryforthedevelopmentofanyenterprise.Policiesandlegislationvaryintheextenttowhichtheyprovidelandrightstolocalcommunities.Inmanycountries,rulesandregulationsarecraftedtotheneedsoflargeenterprises,leavingsmallandmediumenterprisesandcommunityinstitutionsatadisadvantage.
• Constraintsoneconomicviability:Localcommunitiesoftenhaveaccesstoonlythemostdegradedandleastproductiveland,whichcannotprovidebenefitscommensuratewiththeinvestmentsrequired.Theyoftenlackaccesstoinputs(includingcredit)andmarkets.Manysmallenterprisesfocusonproductionoflow-value-addedproducts,whichseldomhelptoenhanceincome.Localmarketsfaceincreasingcompetitionfromglobalsuppliers.Theinadequacyofentrepreneurialskillstodealwithchangingopportunitiesandchallengesremainsthemostcriticalconstraint.
The overarching focus on profitability in the private sector
often results in high social and environmental costs. As
society’s awareness of these costs increases, pressures
mount on the private sector to abide by environmental and
social regulations. Industry may also find it advantageous
to project a green image, especially among environment-
conscious consumers. Industry organizations have
developed a number of criteria relating to corporate social
responsibility, and green auditing is becoming mandatory. In
Rome in 2006, chief executive officers from 61 companies
belonging to the International Council of Forest and Paper
Associations signed a commitment to global sustainability.
The World Business Council for Sustainable Development
has prepared guidelines on sustainable procurement of
wood and paper products that address environmental
and social aspects (WBCSD and WRI, 2007). Increasing
environmental awareness and easy access to information
will help to ensure that industry no longer neglects its
responsibilities through superficial “greenwashing”.
BoX 40 corporate social responsibility
Most investments in planted forests have traditionally been
made by government, smallholder or industrial forest owners.
However, management arrangements such as timber
investment management organizations (TIMOs) and real
estate investment trusts (REITs) have created a significant shift
in forest ownership from industries to institutional investors,
primarily in North America but also in Australia, Finland,
New Zealand, South Africa and Sweden. Investment by
institutions in planted and managed native forests increased
worldwide from less than US$1 billion in 1985 to more than
US$30 billion in 2007. The number of TIMOs grew from
two or three in the 1980s to more than 25 in 2007. About
20 million hectares of private forest land are under TIMO
control. In the United States of America, forest landownership
by integrated forest companies (those involved in both
production and processing) declined from 19.5 million hectares
in 1994 to 4 million hectares in 2007 (Neilson, 2007).
Some observers are concerned that the increase in
forest ownership by wholly profit-seeking institutional
investors could undermine long-term investments in
forest management and research and also accelerate
commercial development of private forest lands. However,
the growth of TIMOs appears to be slackening because of
the limited area available for sale.
SourceS: fao, 2007f; Sample, 2007.
BoX 41 institutional investors: tiMos and reits
Since 2001, foreign exchange reserves have grown rapidly,
far beyond the established benchmarks of adequacy.
The sovereign wealth fund (SWF) is a vehicle established
by some governments to channel these reserves into
investments. In the first quarter of 2008, the total assets
held by 51 SWFs were estimated at US$3.5 trillion, and
these assets are projected to grow to about US$5 trillion by
2010 and US$12 trillion by 2015. SWFs invest in many asset
classes including real estate, plantations and government
bonds. Four SWFs have already invested in timber lands.
SourceS: fao, 2007f; Friday Offcuts, 2008.
BoX 42 Sovereign wealth funds: an emerging player in forestry investment
stAte oF the World’s Forests 200984
• Governanceanddistributionofbenefits:Insomelocalcommunityenterprises,powerimbalancesleadtoinequitabledistributionofbenefits,undermininglong-termsustainability.Thisproblemisparticularlyseverewheredemocratictransparentsystemsofmanagementandaccountabilityarelackingandlocalvestedinterestsdominate.
Factorsthathavehelpedsmallandmediumenterprisescopesuccessfullywiththechallengesinclude:
• improvedaccesstoinformationandopportunitiescreatedbytheInternet,e-tradingandothertools;
• upscalingofbusinessactivitiesthroughassociationsandfederationsandimprovementofaccesstomarkets,inputsandservices;
• increasedeffortstodeveloptechnologiesappropriatetotheneedsofsmallandmediumenterprises;
• rapidlyrisingtransportcosts,makinglocalvaluechainsmorecompetitive.
Strongerinstitutionalarrangementsarecriticaltothescalingupofoperationsandimprovedbargainingpower.Moreover,theyenablecommunitiestotakeadvantageofnewtechnologies,whicharevitaltomakingcommunity-basedresourcemanagementeconomicallyviable.
Civil-soCiety orgAnizAtionsInrecentdecades,civil-societyorganizationshavebecomemajorplayersinforest-relatedissuesinmostcountries,oftenchallengingestablishedpositionsandincreasingtransparency.Theyhaveemergedasoneofthemainforcesreshapingthefutureofforestryatalllevels–local,nationalandglobal.
Indigenouspeoples’groupshaverisenfromlocallevelstobecomeeffectiveactorsandadvocatesatthegloballevelthroughcoalitionspresentingaunifiedfrontanddeliveringconsistentmessagesininternationalmeetingsandprocesses.Theirorganizedeffortshaveledtoprogressinrecognizingandrestoringtherightsofindigenouspeoplestoforestland.Theadoptionin2007oftheUnitedNationsDeclarationontheRightsofIndigenousPeoples,althoughnon-binding,wasamilestone.
Communityforestryandcommunityconservationorganizationsinclude:federations(Box43);networksoflocalcommunityorganizations,advocacyandnetworkingorganizations,suchastheForestPeoplesProgramme;andcoalitions,suchasFriendsoftheEarthInternational,theWorldRainforestMovementandtheGlobalForestCoalition.Reflectingthegrowthofcommunityforestryaroundtheworld,thesegroupsstresstheconnectionbetweenforestsandlivelihoods.
InternationalenvironmentalNGOs,suchastheWorldWideFundForNature,ConservationInternational,TheNatureConservancy,theWildlifeConservationSocietyandtheInternationalUnionforConservationofNature
(IUCN)(anumbrellagroupofwhichalltheothersaremembers),arethemostwell-fundedandperhapsthemosteffectivecivil-societyactorsinforestry.Althoughdifferinginperspectivesandapproach,thesegroupsfocusattentiononconservingbiologicaldiversity,extendingprotectedareas,drivingforestcertificationandimprovingforestgovernancetoreduceillegalloggingandtradeinendangeredspecies.
Arelatedgroupconsistsofcivil-societyorganizationsthatpromotemarket-basedapproachestoconservationandsustainableforestmanagement,suchascertification,fairtrade,organicandsustainableagriculture,ecotourismandgreeninvestments.Someoftheseorganizations,includingFSCandPEFC,havebroughtaboutchangesinthebehaviourofproducersandconsumersofforestproducts.
AnumberofinternationalenvironmentalNGOs,forexampletheInternationalInstituteforEnvironmentandDevelopment(IIED)andtheWorldResourcesInstitute(WRI),functionas“thinktanks”,enhancingknowledgeinkeyareas.
Inaddition,complexwebsofnational,regionalandglobalnetworks,manystillrelativelyinformal,linkfarmers,forest-dependentcommunities,smalltradersandlocalactivists.Thesealliancesarenolongerstrictlythedomainoflargeinternationalconservationorganizationsandmajordevelopmentgroups.
Overall,civil-societyorganizationsformastrongcounterforceagainstpowerfulplayerssuchasgovernmentsandthecorporatesector.Theireffectivenessstemslargelyfrom:
• closecontactwithgrassrootsandunderstandingoflocalissues;
• multidisciplinaryapproachestoresourcemanagementissues;
The Federation of Community Forest Users Nepal
(FECOFUN), a forest-user advocacy organization founded
in 1995, provides national representation of local people’s
rights in resource management. Comprising rural farmers –
men and women, old and young – from almost all of
Nepal’s 75 districts, FECOFUN exemplifies the evolution
and maturation of a community-based group into an
important rural institution. Indeed, it is Nepal’s largest civil-
society organization.
FECOFUN and community forestry in Nepal owe their
success to recognition of rural people’s dependence
on forests and to institutional incentives structured in
accordance with rural realities.
Source: fecofun, 2006.
BoX 43 a federation of forest communities in nepal
PArt 2 adapting for the future 85
Changing institutions
• effectivecommunicationwithstakeholdersandfundingsources;
• skilfuluseofnetworksandassociationsanddevelopmentofstronglinkageswithotherplayers;
• theirdetailedresearchonkeyissuesanditsuseinsupportoflocalaction.
Increasingawarenessandconcernaboutsocialandenvironmentalissuesimplyanincreasingroleforcivil-societyorganizationsinforestry.
Theshifttowardsinstitutionalandeconomiccomplexityshouldmirrormoreeffectivelytheecologicalandculturaldiversityofforestsandpeoples.Suchcomplexityisneededinordertohelpforestsfulfiltheirintegratingroleinadispersed,diversifiedanddistributiveforesteconomy.Civil-societyactorsinjectmuch-neededdisorderintointentionallyneatpowerequations(J.Campbell,personalcommunication,2008).
inFormAl seCtorThedividinglinebetweentheformalandinformalsectorsissometimesblurred,especiallyasmanysmallandmediumenterprisesoperateoutsidetheformalrealm.Playersoutsidetheformalsectorrangefromtraditionallocalforestmanagementarrangementsthathavebeenpushedintotheinformalrealmbyrestrictivegovernmentregulationstoillegalloggingnetworksthatexploitweakinstitutionalarrangementsinmanycountries.
Althoughitisdifficulttodefinetheextentofitsreach,theinformalsectorcontinuestobesignificantworldwide.TheInternationalLabourOrganizationestimatesthatforeveryjobintheformalsectorinforestrythereisanotherone(ortwo)intheinformalsector(ILO,2001).MostoftheseareinproductionorcollectionofwoodfuelandNWFPs.Unpaidsubsistencework,primarilyinwoodfuelharvesting,isestimatedtoemployabout14millionworkers(full-timeequivalents),ofwhom90percentareindevelopingcountries.Informalsectoremploymentisoftendominatedbywomen.
Manysmallforestenterprisesoperateinformally,largelybecauseofill-definedpropertyrightsandanunfavourablebusinessenvironmentwithhighbarrierstoentryandconcomitanttransactioncosts.Theinformalsectordominatesincountrieswhereregulationsarecumbersomeandinflexible(WorldBank,2006).Increasingpressurebytheformalsectortoreducecostsisencouragingthegrowthoftheinformalsector.Workisoftenoutsourcedtofirmsoutsidetheformalsectorthatcutproductioncostsbyfailingtoabidebysocialandenvironmentalnorms.
Thekeyissueiswhethergovernmentswillmakesignificanteffortstocreateafavourablebusinessenvironmentbyremovingbarriersrestricting
entrepreneurship.Improvedaccesstocredit,marketsandtechnologycouldpotentiallymovesomeplayersfromtheinformaltotheformalsector.
Alsokeyareconcertedeffortstoaddressillegallogging,whichcurrentlyincludeintergovernmentalforestlawenforcementandgovernanceprocesses,trackingandverificationsystemsandanti-money-launderingmeasures.
internAtionAl orgAnizAtionsAlthoughlessquicktoadaptthanprivate-sectororcivil-societyorganizations,internationalforest-relatedorganizationshaveevolvedinthepasttwodecades.Before1990,theUnitedNations(UN)andotherintergovernmentalorganizations,internationalresearchandfinancingorganizationsandbilateraldonoragenciesprovidedmainlytechnicalsupport,primarilyfocusedonproductionofwoodproducts.Thepriorityareasweresilvicultureandforestmanagement,forestindustries,research,education,trainingandextension.
SincetheUNCEDin1992,undertheoverarchingobjectiveofsustainableforestmanagement,internationalorganizationshavebroadenedtheiragendatoaddressawiderarrayofsocial,economicandenvironmentalissues.Newtypesofinternationalinstitutionshaveemerged(UNforestpolicyprocesses,environmentalconventionsandagreementsandregionalintergovernmentalprocesses)andinitiativesandpartnershipshavemultiplied.Programmesplacemoreemphasisonsupporttopoliciesandinstitutions,withincreasedfocusongovernance,povertyalleviationandmorerecentlyonintegratingforestryintheframeworkoftheMillenniumDevelopmentGoals.Withgrowingconcernaboutclimatechange,thepursuitofmitigationandadaptationmeasuresisanemergingpriority.
Theproliferationofinstitutionsandinitiativeshasnecessitatedsubstantialeffortstominimizefragmentationandavoidduplication.Duplicationisahazardbecauseconstituentscommonlyaskorganizationstotakeupthelatest“hot”issue–andorganizationsneedtoworkwherethereisfunding,whichagaintendstobeavailableforthesehotissues.Fragmentationattheinternationallevelaccentuatesproblemsatthecountrylevel,especiallywheredevelopmenteffortsarecompartmentalizedindifferentsectors.Thecapacitytocoordinateisinshortsupplyincountrieswhereproblemsaremostacute.
Effortstoaddressfragmentationandduplicationincludethe“OneUN”approach(UN,2006b),whichaimstocoordinatethedisparateactivitiesofthevariousUNagenciesatthecountrylevel,andtheCollaborativePartnershiponForests(CPF)–anexampleofcoordinatedsupportfortheinternationalforestpolicyprocess(Box44).

stAte oF the World’s Forests 200986
Theacceleratingpaceofglobalizationandtheemergenceofahostoftransboundaryeconomic,socialandenvironmentalissuesneedtobeaddressedbyeffectiveinternationalinstitutionalarrangements.Someofthelikelychangesinthenextfewyearsmaybe:
• consolidationofinstitutions,inresponsetoresourceconstraintsandpressuretoseeconcreteresultsontheground;
• ashiftfromprocessestotangibleoutputsandresults,asdemandedbyamoreinformedsociety;
• increasingemphasisonregional,subregionalandothergroupinitiativestoenablecountrieswithsimilarviewsandperceptionstoaddresssharedproblems,andincreasedattentiontoforestryissuesbyregionalandsubregionaleconomicblocks.
outlookWiththeemergenceofnewplayers,theinstitutionallandscapeintheforestsectorhasbecomemorecomplexandthebalanceamongplayersisshifting.Ingeneral(althoughnotinallcountries),theplayingfieldismorelevel,partlyasaresultofnewinformationandcommunicationtechnologies.Themuch-neededpluralismprovidesnewopportunitiesforsmallandmediumenterprisesandcommunityorganizations.Civil-societyinstitutions,usuallyfocusingonsocialandenvironmentalissues,andprivate-sectorinstitutions,usuallyemphasizingeconomicaspects,aregaininginstrengthandnumber;fundingandinvestmentsincreasinglyfavourthemoverthepublicsectorandinternationalinstitutions.Ifthegovernmentforestryagenciesthathistoricallydominatedthescenefailtoadapttothesechanges,theycouldfadeintoirrelevance.Withtheincreasingpaceofglobalization,newplayerssuchasTIMOs,REITs,sovereignwealthfundsandcarbontradinginstitutionscouldaltertheglobalinstitutionalmap.Institutionswillfacetremendouspressuretobalancefragmentationandtoconsolidateefforts.
The Non-Legally Binding Instrument on All Types of Forests
(NLBI) adopted by the UN General Assembly in December
2007 embodies a global consensus on sustainable forest
management and outlines future priorities in the form of
four Global Objectives on Forests:
• reverse the loss of forest cover worldwide through
sustainable forest management;
• enhance forest-based economic, social and
environmental benefits, including by improving the
livelihoods of forest-dependent people;
• increase significantly the area of protected forests
and other areas of sustainably managed forest
worldwide;
• reverse the decline in official development assistance
for sustainable forest management.
With the NLBI and its new multiyear programme of
work, UNFF is poised to deliberate on some of the most
pressing issues related to forests in the coming years.
In 2009, UNFF will discuss the contribution of forests to
addressing challenges of climate change as well as the
role of forests in protecting biodiversity and reducing
desertification. In this regard, issues such as governance
and sound participatory decision-making will be crucial
to ensuring that the benefits of forests are secured and
that long-term planning takes precedence over short-term
gains. n
the Non-Legally Binding instrument and future priorities for forestsFrom the United Nations Forum on Forests (UNFF)
Views from CPF partners
The Collaborative Partnership on Forests (CPF),
a voluntary arrangement among 14 international
organizations and secretariats with substantial
programmes on forests, aims to enhance coordination
of support to the international forest dialogue and to
country-level implementation of sustainable forest
management. Initiatives on streamlining forest-related
reporting and harmonizing definitions have aided
global, regional and national forest processes. Recent
initiatives include a joint strategic response to the global
climate change agenda and consolidation of scientific
knowledge in support of international policy processes.
BoX 44 collaborative Partnership on forests

PArt 2 adapting for the future 87
Changing institutions
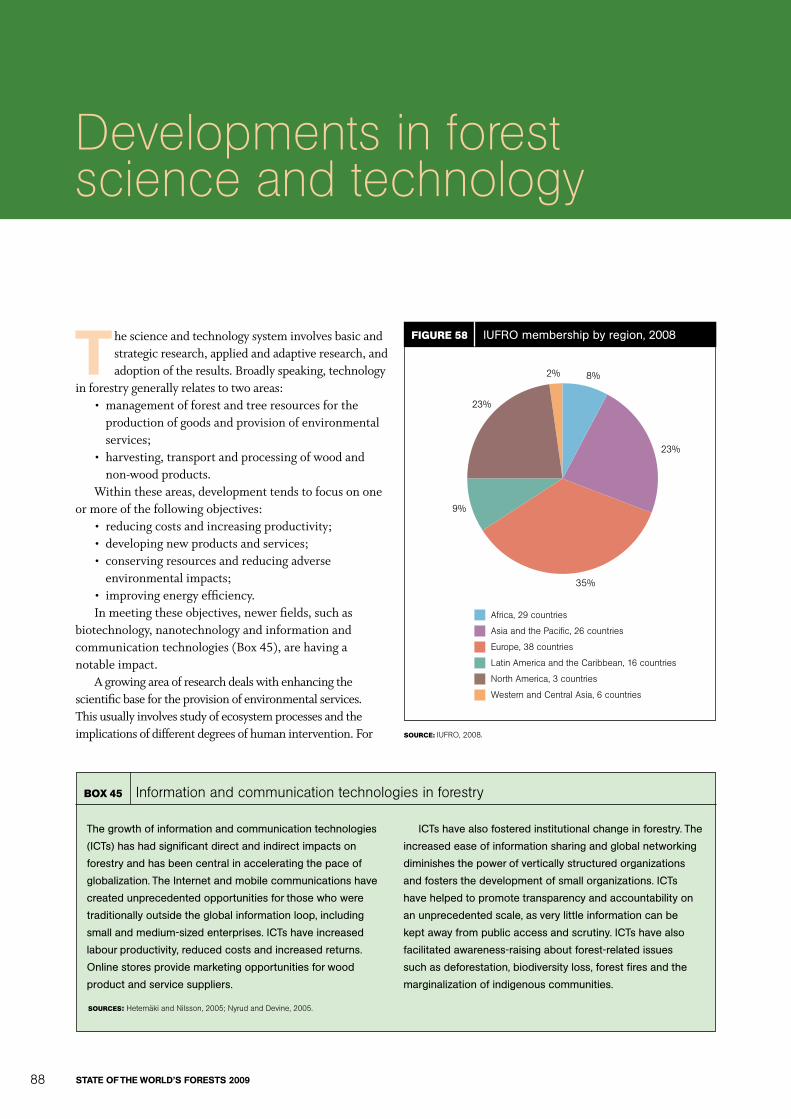
stAte oF the World’s Forests 200988
t hescienceandtechnologysysteminvolvesbasicandstrategicresearch,appliedandadaptiveresearch,andadoptionoftheresults.Broadlyspeaking,technology
inforestrygenerallyrelatestotwoareas:• managementofforestandtreeresourcesforthe
productionofgoodsandprovisionofenvironmentalservices;
• harvesting,transportandprocessingofwoodandnon-woodproducts.
Withintheseareas,developmenttendstofocusononeormoreofthefollowingobjectives:
• reducingcostsandincreasingproductivity;• developingnewproductsandservices;• conservingresourcesandreducingadverse
environmentalimpacts;• improvingenergyefficiency.Inmeetingtheseobjectives,newerfields,suchas
biotechnology,nanotechnologyandinformationandcommunicationtechnologies(Box45),arehavinganotableimpact.
Agrowingareaofresearchdealswithenhancingthescientificbasefortheprovisionofenvironmentalservices.Thisusuallyinvolvesstudyofecosystemprocessesandtheimplicationsofdifferentdegreesofhumanintervention.For
Developments in forest science and technology
Figure 58 IUFRO membership by region, 2008
Source: iufro, 2008.
africa, 29 countries
asia and the Pacific, 26 countries
europe, 38 countries
latin america and the caribbean, 16 countries
north america, 3 countries
Western and central asia, 6 countries
8%
23%
23%
2%
9%
35%
The growth of information and communication technologies
(ICTs) has had significant direct and indirect impacts on
forestry and has been central in accelerating the pace of
globalization. The Internet and mobile communications have
created unprecedented opportunities for those who were
traditionally outside the global information loop, including
small and medium-sized enterprises. ICTs have increased
labour productivity, reduced costs and increased returns.
Online stores provide marketing opportunities for wood
product and service suppliers.
ICTs have also fostered institutional change in forestry. The
increased ease of information sharing and global networking
diminishes the power of vertically structured organizations
and fosters the development of small organizations. ICTs
have helped to promote transparency and accountability on
an unprecedented scale, as very little information can be
kept away from public access and scrutiny. ICTs have also
facilitated awareness-raising about forest-related issues
such as deforestation, biodiversity loss, forest fires and the
marginalization of indigenous communities.
BoX 45 information and communication technologies in forestry
SourceS: hetemäki and nilsson, 2005; nyrud and devine, 2005.

PArt 2 adapting for the future 89
example,climatechangemitigationandadaptationwillrequiresubstantialeffortstounderstandcarbonfluxesunderdifferentlandusesandhowecosystemsandspeciesrespondtochanges.
Scienceandtechnologycapacitydifferssignificantlybetweendevelopedanddevelopingcountries,mostlyreflectingdifferingabilitiestoinvestineducation,trainingandinfrastructure.Althoughasimplification,thegeographicaldistributionofthemembersoftheInternationalUnionofForestResearchOrganizations(IUFRO)reflectsthedifferencesinresearchcapacityamongregions(Figure58).
Translatingscientificknowledgeintotechnologiesandthenapplyingtheseremainmajorchallenges,partlybecauseoffragmentedinstitutionalarrangements.Adoptionoftechnologiesiscontext-specific.Often,achoicemustbemadeamongawidearrayoftechnologiesavailableforthesametask.
Historically,public-sectorforestryagenciesledthedevelopmentofforestscienceandtechnology.Today,there
aremanymoreplayers;ingeneral,thepublicsector’srolehasdiminished(Table27)anditscapacitieshavedeclinedsharplyinmanycountries.
sCienCe And teChnology in seleCted AreAsForest managementFormostofthetwentiethcentury,naturalforestswerethemainsourceofwoodandotherproducts,andforestresearchfocusedonmanagingthemsustainably.Varioussilviculturalsystemsweredeveloped(e.g.selectionandshelterwoodsystems),takingintoaccountthedensityofimportantspecies,theirgrowthrates,lightandmoisturerequirements,theirabilitytoregeneratenaturallyandcompetitionbetweenmarketableandnon-marketablespecies.Low-intensityharvestingwasadoptedtoavoidunderminingforestenvironmentalservices.Vulnerableareaswereexcludedfromlogging.
IUFRO is the central global network for forest researchers. It
has three strategic goals:
• strengthen research for the benefit of forests and people;
• expand strategic partnerships and cooperation;
• strengthen communication and links within the scientific
community and with students as well as with policy-
makers and society at large.
To provide independent scientific expertise and
information to its potential users, IUFRO periodically identifies
emerging key issues and assesses its activities.
The forest research challenges of the future identified by
IUFRO involve:
• the increased global demand for wood and non-wood
goods and services;
• bioenergy;
• impacts of climate change;
• competition for land and how to reverse deforestation;
• the role of genetically modified trees and plantation
forestry;
• invasions of alien pests and pathogens;
• biodiversity conservation;
• social and behavioural processes;
• the impact of global economic developments on local
economies and livelihoods.
Society is placing greater pressure on scientists to
explain their research publicly and to demonstrate its positive
impacts. Moreover, the users of scientific information,
including policy-makers and practitioners, increasingly want
to be involved in the development of research agendas.
Networking can help both the scientific community and
its actual and potential beneficiaries to enhance research
uptake and impact. n
research challenges of the futureFrom the International Union of Forest Research Organizations (IUFRO)
Views from CPF partners
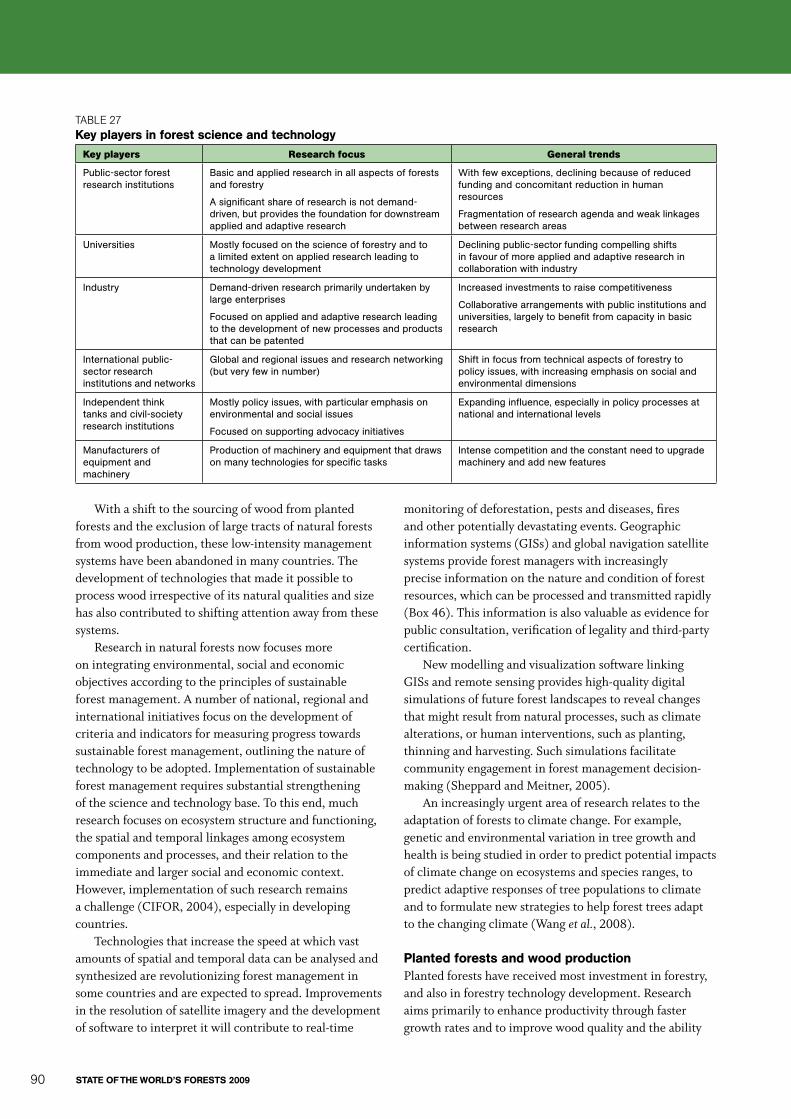
stAte oF the World’s Forests 200990
Withashifttothesourcingofwoodfromplantedforestsandtheexclusionoflargetractsofnaturalforestsfromwoodproduction,theselow-intensitymanagementsystemshavebeenabandonedinmanycountries.Thedevelopmentoftechnologiesthatmadeitpossibletoprocesswoodirrespectiveofitsnaturalqualitiesandsizehasalsocontributedtoshiftingattentionawayfromthesesystems.
Researchinnaturalforestsnowfocusesmoreonintegratingenvironmental,socialandeconomicobjectivesaccordingtotheprinciplesofsustainableforestmanagement.Anumberofnational,regionalandinternationalinitiativesfocusonthedevelopmentofcriteriaandindicatorsformeasuringprogresstowardssustainableforestmanagement,outliningthenatureoftechnologytobeadopted.Implementationofsustainableforestmanagementrequiressubstantialstrengtheningofthescienceandtechnologybase.Tothisend,muchresearchfocusesonecosystemstructureandfunctioning,thespatialandtemporallinkagesamongecosystemcomponentsandprocesses,andtheirrelationtotheimmediateandlargersocialandeconomiccontext.However,implementationofsuchresearchremainsachallenge(CIFOR,2004),especiallyindevelopingcountries.
Technologiesthatincreasethespeedatwhichvastamountsofspatialandtemporaldatacanbeanalysedandsynthesizedarerevolutionizingforestmanagementinsomecountriesandareexpectedtospread.Improvementsintheresolutionofsatelliteimageryandthedevelopmentofsoftwaretointerpretitwillcontributetoreal-time
monitoringofdeforestation,pestsanddiseases,firesandotherpotentiallydevastatingevents.Geographicinformationsystems(GISs)andglobalnavigationsatellitesystemsprovideforestmanagerswithincreasinglypreciseinformationonthenatureandconditionofforestresources,whichcanbeprocessedandtransmittedrapidly(Box46).Thisinformationisalsovaluableasevidenceforpublicconsultation,verificationoflegalityandthird-partycertification.
NewmodellingandvisualizationsoftwarelinkingGISsandremotesensingprovideshigh-qualitydigitalsimulationsoffutureforestlandscapestorevealchangesthatmightresultfromnaturalprocesses,suchasclimatealterations,orhumaninterventions,suchasplanting,thinningandharvesting.Suchsimulationsfacilitatecommunityengagementinforestmanagementdecision-making(SheppardandMeitner,2005).
Anincreasinglyurgentareaofresearchrelatestotheadaptationofforeststoclimatechange.Forexample,geneticandenvironmentalvariationintreegrowthandhealthisbeingstudiedinordertopredictpotentialimpactsofclimatechangeonecosystemsandspeciesranges,topredictadaptiveresponsesoftreepopulationstoclimateandtoformulatenewstrategiestohelpforesttreesadapttothechangingclimate(Wanget al.,2008).
Planted forests and wood productionPlantedforestshavereceivedmostinvestmentinforestry,andalsoinforestrytechnologydevelopment.Researchaimsprimarilytoenhanceproductivitythroughfastergrowthratesandtoimprovewoodqualityandtheability
taBle 27key players in forest science and technology
Key players research focus general trends
Public-sector forest research institutions
Basic and applied research in all aspects of forests and forestry
A significant share of research is not demand-driven, but provides the foundation for downstream applied and adaptive research
With few exceptions, declining because of reduced funding and concomitant reduction in human resources
Fragmentation of research agenda and weak linkages between research areas
Universities Mostly focused on the science of forestry and to a limited extent on applied research leading to technology development
Declining public-sector funding compelling shifts in favour of more applied and adaptive research in collaboration with industry
Industry Demand-driven research primarily undertaken by large enterprises
Focused on applied and adaptive research leading to the development of new processes and products that can be patented
Increased investments to raise competitiveness
Collaborative arrangements with public institutions and universities, largely to benefit from capacity in basic research
International public-sector research institutions and networks
Global and regional issues and research networking (but very few in number)
Shift in focus from technical aspects of forestry to policy issues, with increasing emphasis on social and environmental dimensions
Independent think tanks and civil-society research institutions
Mostly policy issues, with particular emphasis on environmental and social issues
Focused on supporting advocacy initiatives
Expanding influence, especially in policy processes at national and international levels
Manufacturers of equipment and machinery
Production of machinery and equipment that draws on many technologies for specific tasks
Intense competition and the constant need to upgrade machinery and add new features
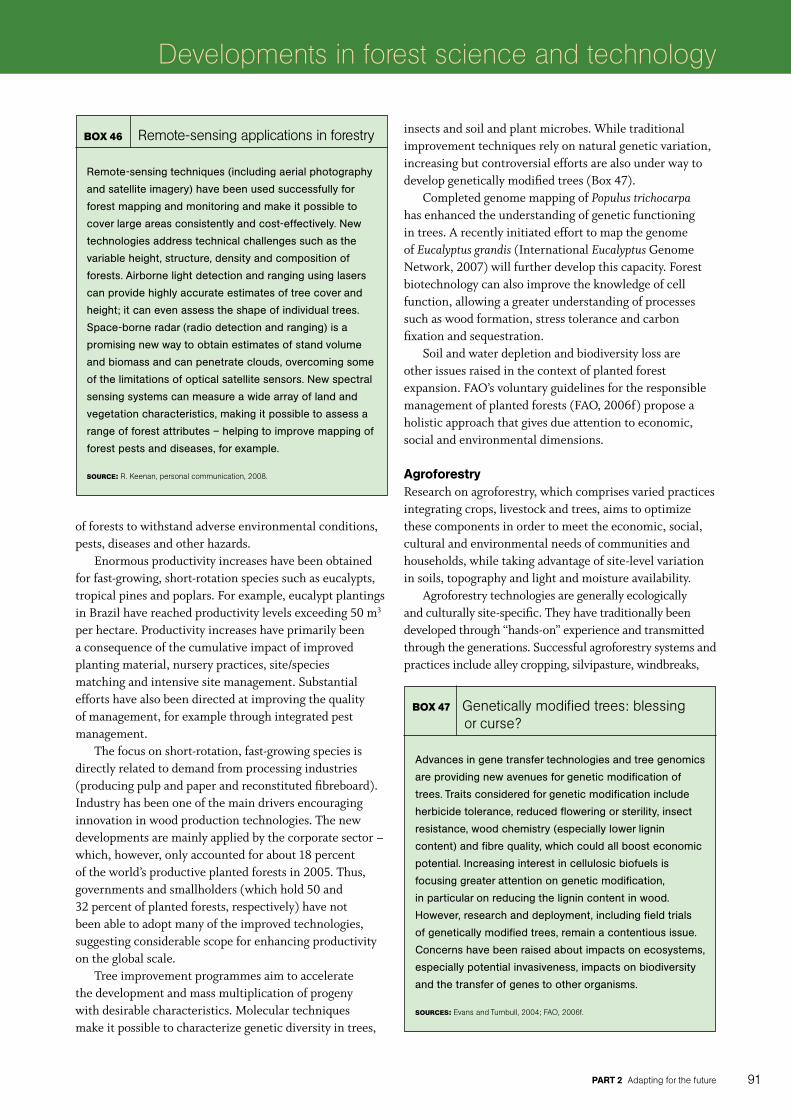
PArt 2 adapting for the future 91
Developments in forest science and technology
offoreststowithstandadverseenvironmentalconditions,pests,diseasesandotherhazards.
Enormousproductivityincreaseshavebeenobtainedforfast-growing,short-rotationspeciessuchaseucalypts,tropicalpinesandpoplars.Forexample,eucalyptplantingsinBrazilhavereachedproductivitylevelsexceeding50m3perhectare.Productivityincreaseshaveprimarilybeenaconsequenceofthecumulativeimpactofimprovedplantingmaterial,nurserypractices,site/speciesmatchingandintensivesitemanagement.Substantialeffortshavealsobeendirectedatimprovingthequalityofmanagement,forexamplethroughintegratedpestmanagement.
Thefocusonshort-rotation,fast-growingspeciesisdirectlyrelatedtodemandfromprocessingindustries(producingpulpandpaperandreconstitutedfibreboard).Industryhasbeenoneofthemaindriversencouraginginnovationinwoodproductiontechnologies.Thenewdevelopmentsaremainlyappliedbythecorporatesector–which,however,onlyaccountedforabout18percentoftheworld’sproductiveplantedforestsin2005.Thus,governmentsandsmallholders(whichhold50and32percentofplantedforests,respectively)havenotbeenabletoadoptmanyoftheimprovedtechnologies,suggestingconsiderablescopeforenhancingproductivityontheglobalscale.
Treeimprovementprogrammesaimtoacceleratethedevelopmentandmassmultiplicationofprogenywithdesirablecharacteristics.Moleculartechniquesmakeitpossibletocharacterizegeneticdiversityintrees,
insectsandsoilandplantmicrobes.Whiletraditionalimprovementtechniquesrelyonnaturalgeneticvariation,increasingbutcontroversialeffortsarealsounderwaytodevelopgeneticallymodifiedtrees(Box47).
CompletedgenomemappingofPopulus trichocarpahasenhancedtheunderstandingofgeneticfunctioningintrees.ArecentlyinitiatedefforttomapthegenomeofEucalyptus grandis(InternationalEucalyptusGenomeNetwork,2007)willfurtherdevelopthiscapacity.Forestbiotechnologycanalsoimprovetheknowledgeofcellfunction,allowingagreaterunderstandingofprocessessuchaswoodformation,stresstoleranceandcarbonfixationandsequestration.
Soilandwaterdepletionandbiodiversitylossareotherissuesraisedinthecontextofplantedforestexpansion.FAO’svoluntaryguidelinesfortheresponsiblemanagementofplantedforests(FAO,2006f)proposeaholisticapproachthatgivesdueattentiontoeconomic,socialandenvironmentaldimensions.
AgroforestryResearchonagroforestry,whichcomprisesvariedpracticesintegratingcrops,livestockandtrees,aimstooptimizethesecomponentsinordertomeettheeconomic,social,culturalandenvironmentalneedsofcommunitiesandhouseholds,whiletakingadvantageofsite-levelvariationinsoils,topographyandlightandmoistureavailability.
Agroforestrytechnologiesaregenerallyecologicallyandculturallysite-specific.Theyhavetraditionallybeendevelopedthrough“hands-on”experienceandtransmittedthroughthegenerations.Successfulagroforestrysystemsandpracticesincludealleycropping,silvipasture,windbreaks,
Remote-sensing techniques (including aerial photography
and satellite imagery) have been used successfully for
forest mapping and monitoring and make it possible to
cover large areas consistently and cost-effectively. New
technologies address technical challenges such as the
variable height, structure, density and composition of
forests. Airborne light detection and ranging using lasers
can provide highly accurate estimates of tree cover and
height; it can even assess the shape of individual trees.
Space-borne radar (radio detection and ranging) is a
promising new way to obtain estimates of stand volume
and biomass and can penetrate clouds, overcoming some
of the limitations of optical satellite sensors. New spectral
sensing systems can measure a wide array of land and
vegetation characteristics, making it possible to assess a
range of forest attributes – helping to improve mapping of
forest pests and diseases, for example.
Source: r. Keenan, personal communication, 2008.
BoX 46 remote-sensing applications in forestry
Advances in gene transfer technologies and tree genomics
are providing new avenues for genetic modification of
trees. Traits considered for genetic modification include
herbicide tolerance, reduced flowering or sterility, insect
resistance, wood chemistry (especially lower lignin
content) and fibre quality, which could all boost economic
potential. Increasing interest in cellulosic biofuels is
focusing greater attention on genetic modification,
in particular on reducing the lignin content in wood.
However, research and deployment, including field trials
of genetically modified trees, remain a contentious issue.
Concerns have been raised about impacts on ecosystems,
especially potential invasiveness, impacts on biodiversity
and the transfer of genes to other organisms.
SourceS: evans and turnbull, 2004; fao, 2006f.
BoX 47 genetically modified trees: blessing or curse?

stAte oF the World’s Forests 200992
hedgerowintercropping,parklands,homegardensandrelaycropping.Somehavebeeninexistenceforcenturies,evolvinginresponsetoneedsandconstraintsbothonandoffthefarm.Formalagroforestryresearchappliesthetoolsandtechniquesofmodernsciencetohelpimprovethetraditionalpracticesandenabletheirwiderapplication.Itgenerallytakesaholisticperspectiveinthateconomicandotherbenefitsareassessedwithconsiderationgiventothelinksamongthedifferentcomponents.
Agroforestryiscurrentlyrespondingtonewmarketopportunities.Plantingoftreesonfarmstosupplywoodtoforestindustrieshasincreasedsignificantlyinmanycountries.Accordingly,newresearchissueshaveemerged,includingforexampleinteractionsbetweentreecropsandfoodcropsandlong-termsustainabilityofproductionwithafocusonmaintainingandimprovingproductivityofland.
harvesting and processing of wood productsImprovingeconomicefficiencyandminimizingenvironmentaldamagehavebeentheprimaryobjectivesofharvestinginnovations.Shortagesandincreasingcostsoflabourhaveencouragedsignificantmechanizationofloggingandtransport.Sophisticatedharvesting,conversionandtransportationtechnologieshavebeendeployedinanumberofcountries,especiallyinindustrialforestplantations.
Reduced-impactloggingwasdevelopedinresponsetoconcernsaboutthelong-termsustainabilityofwoodproductionfromnaturalforests.Itinvolvesmeasurestominimizedamagetotheremainingvegetation,enablingrapidrecoveryafterlogging.FAOhasdevelopedglobalandregionalcodesforsustainableforestharvestingandsupportscountriesindevelopingnationalcodesandguidelines.Whiletheimportanceofreduced-impactloggingisunderstoodanditslong-termcommercialfeasibilityhasbeendemonstrated,itsadoptiondependsontheobjectivesoftheresourceownersorloggingconcessionairesandtheirwillingnessandabilitytocomplywithmarketandnon-marketsignals.
Newtechniqueshavebeendevelopedtoidentifythesourceoflogsusingtags,paintsandchemicalcompoundsthatcanbereadbydetectiondevices.New-generationradio-frequencyidentificationtagsandbarcodescaneasilytrackthemovementoflogsfromforeststomarkets,helpingtodistinguishlegallyfromillegallysourcedwood.
Technologicaldevelopmentsinwoodprocessinglargelyfocuson:
• economiccompetitiveness,withanemphasisonreducingcosts,improvingqualityanddevelopingnewproducts;
• energyefficiencyandproductionofenergyduringwoodprocessing;
• compliancewithenvironmentalstandards,forexamplebyreducingeffluentsandreusingwater
through“closed-loopprocessing”inthepulpandpaperindustry(NaturalResourcesCanada,2008b).
Manytechnologicaldevelopmentsinwoodprocessinghavebeenconsumerdriven,asprocessingisneartheendoftheforestproductsvaluechain,closetoconsumersand,thus,compelledtorespondtochangingdemands.Intensecompetitionhasalsoencouragedinnovation.
Traditionalwoodusewaslargelybasedonphysicalproperties,especiallystrength,durability,workingqualityandappearance.Wood-processingtechnologieshaveimprovedmechanicalandchemicalproperties,expandingusesandmakingitpossibletoemployspeciesthatwereonceconsideredlessuseful–forexample,touserubberwood(Hevea brasiliensis)forfurnitureandmedium-densityfibreboard.Biotechnologyinthewoodproductssectorhasthepotentialtoimprovewoodpreservationproperties.
NewsawmillingtechnologiesincludelaserandX-rayscannerscombinedwithhigh-powercomputing,whichmakeitpossibletoscanandstoreinformationonlogdiameter,lengthandshapeandtoproduceoptimalsawingpatternsforeachlogtomaximizesawnwoodrecovery(Boweet al.,2002).Pictureanalysistodeterminesurfaceproperties(e.g.knotsandcolour)hasimprovedthesortingandgradingofsawnwood.Newmethodshavebeenintroducedtocontrolthedryingprocessandtomeasurephysicalstrength,revealingpossibledefects(Baudinet al.,2005).
Othertechnologicaldevelopmentsinwoodprocessinginclude:
• improvedrateofrecoveryandtheuseofsmall-dimensiontimber,largelythroughimprovementsinsawmillingtechnologiesandproductionofslicedveneerandreconstitutedpanels;
• recycling,forexampleuseofrecoveredpaper;• theuseofmicro-organismstobleachpulpandtreat
effluentsinthepaperindustry,reducingcostsandenvironmentalimpacts;
• totaluseofwoodthroughbiorefineriesproducingarangeofbiomaterialsandenergy(Box48).
Nanotechnology,definedasthemanipulationofmaterialsmeasuringlessthan100nanometres(with1nanometreequallingone-billionthofametre),isexpectedtorevolutionizeallaspectsofproductionandprocessing,fromproductionofrawmaterialstocompositeandpaperproducts,permittingmajoradvancesinenergyandmaterialefficiency(Roughley,2005;Reitzer,2007).Mostleadingwood-product-producingcountriesareworkingonnanotechnologyapplications.Potentialuses(Beecher,2007)include:
• lighter-weightstrongerproductsdevelopedfromnanofibres;
• coatingstoimprovesurfacequalities;• productionthatuseslessmaterialandlessenergy;

PArt 2 adapting for the future 93
Developments in forest science and technology
• “intelligent”productswithnanosensorsformeasuringforces,loads,moisturelevels,temperatures,etc.
non-wood forest productsNWFPsarediverseandmanydifferenttechnologiesareusedintheirproductionandprocessing.AlthoughmostNWFPsaresubsistenceproducts,collectedfromthewildandconsumedlocallywithminimalprocessing,somehavebeendomesticatedandarecultivatedandprocessedusingsophisticatedtechnologiestomeetthedemandfromglobalmarkets.Scienceandtechnologydevelopmentfortheseproductshasfocusedlargelyonmoreorganizedsystemsofproduction,whilesubsistenceproductionhasreliedalmostentirelyonindigenousknowledge.
Natural-resourcedegradationcoupledwithincreasingdemandhasbeenthemaindriveroforganizedcultivationofmanyNWFP-yieldingspecies–muchaswoodproductionhasshiftedfromnaturaltoplantedforests.Researchondomesticationandcultivationhasalsobeenencouragedbythecomplexityanduncertaintyofmanagingproductioninthewild.Formanyproducts,suchasnaturalrubber,rattan,bambooandsomemedicinalandaromaticplants,organizedproductionandchemicalsubstitutionofnaturalcomponentshavevirtuallyreplacedcollectionfromthewild,exceptforproductsintendedfornichemarketspayingahighpremium.
Scientificresearchhasfocusedon:• understandingthecomposition,propertiesand
potentialusesofdifferentproducts;• low-costtechnologiesfortheextractionandisolation
ofmarketablecomponentsandfortheadditionofdesirablecharacteristics,e.g.tofacilitatestorageandtransportation;
• improvingprocessingtechnologiesanddevelopingnewproducts,e.g.newplant-basedpharmaceuticalsandhealthandbeautyproducts(theareaswheremosttechnologicaladvancesaretakingplace).
Technologicaldevelopments,forexampleinbiotechnology,presentnewopportunitiesandchallengesformanyNWFPs.Whilenewusesandmarketshaveemerged,sohavesubstituteproductsthatundermineexistingmarkets.Petrochemicalsandnewtechnologiesforprocessingglassandmetalshavesignificantlychangedthemarketsforanumberofplant-basedproducts.NWFPswithlimitedendusesareparticularlyvulnerabletosuchdevelopments.Incontrast,bamboohasbeendevelopedfordiverseendusesandhasbecomeawidelydistributedmaterialandanimportantsourceofincome(FAO,2007g).
Wood for energyWoodfuelis(andislikelytoremain)themainsourceofdomesticenergyforcookingandheatinginmostdevelopingcountries.Althoughincreasingincomeandavailabilityofmoreconvenientfossilfuelshavereducedwoodenergyuse,thissituationseemstobechangingasaresultofhighfuelprices,perceivedrisksoffossilfueldependenceandgrowingconcernaboutgreenhousegasemissionsfromtheuseoffossilfuels(FAO,2008d).
Traditionalwoodenergysystemsrelyonlow-costtechnologiesaffordabletolow-incomeconsumers.Thetechnologiesusedvaryincostandinproductionandconversionefficiency.Forexample,charcoalisproducedusingarangeofkilntypes,fromtraditionalmudtometal.Modernwoodenergyproductionusingcofiring(combustionofbiomasstogetherwithotherfuelsuchascoal)orwoodpelletsinvolvesconsiderablyhigherinvestments,butisalsomuchmoreenergy-efficient.
Substantialinvestmentsarebeingmadetodevelopandcommercializetechnologiesforproducingbiofuelfromcellulose.Howcellulosicbiofuelwilldevelopdependsonitscost-competitivenesswithfossilfuelsandotheralternatives.Ifhighenergypricespersist,cellulosicbiofuelproductionisexpectedtobecomeamajorsourceofcommercialenergy.Theimpactontheforestsectorremainsuncertain,especiallyconsideringthatotherhigh-productivityfeedstockscouldbeusedratherthanwood(e.g.switchgrass,Panicum virgatum).
Provision of environmental servicesScientificknowledgeisessentialfortimelyandappropriatedecision-makingtoensuretheprovisionofenvironmentalservicesbyforests.Asthisknowledgeisfrequentlyincomplete,enhancingitneedstobeapriorityareaforresearch.Examplesinclude:thelimitedinformationontheeconomicconsequencesofchangesinecosystemservices;thelackofquantitativemodelslinkingecosystemchange
Initiatives in Europe and North America are transforming
pulp and paper units into biorefineries – integrated
industries that produce ethanol, starch, organic acids,
polymers, oleochemicals, bioplastics and several food
and feed ingredients from wood-processing residues. The
biomass components are converted using a combination
of technologies including novel enzymes, biocatalysts
and micro-organisms. Biorefineries could become a
cornerstone of a “green economy”, sharply reducing
dependence on fossil fuels. Some products, such as
bioplastics and thermoset resins, would be easily recycled
and degraded at the end of the product life.
SourceS: uS doe, 2006; van ree and annevelink, 2007.
BoX 48 Biorefineries and production of new-generation biomaterials

stAte oF the World’s Forests 200994
toenvironmentalservices;andthepoorunderstandingofecosystemstructureanddynamicsthatdeterminethresholdsandirreversiblechanges.
Breakthroughswillbenecessaryinordertoaddressthedrasticdegradationofdrylandecosystems,whichwillbeaggravatedbydecreasedrainfallexpectedasaconsequenceofclimatechange.Manyaffectedcountriesdonothavethecapacitytoundertakethescientificprogrammesrequired,andinternationalsupportwillbenecessary.
Naturalandplantedforestsoffersignificantgreenhousegasmitigationpotential.However,therearelargegapsinknowledgeoftheroleoftreesandforestecosystemsinclimatechangeprocessesandtheeffectofchangesinforestcoveronforestcarbonstocksandgreenhousegasemissions.
ResearchontheprotectiveroleofcoastalforestshasintensifiedsincetheDecember2004tsunamiinSoutheastAsiabutisstillnotconclusive.Inmorethan20studiescarriedoutinthetwoyearsfollowingthetsunami,someresearchersfoundthatcoastalforestsreduceadverseimpactssignificantly,whileothersdiscoveredthatforestscanalsobealiabilitybyaddingtothedebristhatcandamagehumansettlements(FAO,2007h).
Foresthydrologyresearchaddressesareassuchastherelationshipbetweenlanduseandwateryield,anareawheremythsandmisconceptionsoftendominatedecision-making.
Becauseofthecomplexityandbreadthofissuesinvolvedinnon-marketedenvironmentalservices,itisdifficultforscientiststoinfluencedirectdriversofchange–policy-
makersanddevelopmentactors–intheirdecisionsandpractices(andtogaintheirsupportforresearchactivitiestoobtainnewrelevantknowledge).However,theIntergovernmentalPanelonClimateChange(IPCC)hasshownthatconcerted,holisticscientificeffortsatthegloballevelcaneffectivelyraiseawarenessandimproveunderstandingofimportantcomplexissues,identifykeyareaswhereuncertaintiesneedtobereducedandsupporttheresearchactivitiesneededtomakethishappen.
indigenous knoWledgeTheadvancesinmodernscienceandtechnologyoutlinedabovehavehadsignificantimpactsontheforestsector.However,forvastpopulationsthesetechnologiesremaininaccessible.Manycontinuetodependonindigenousortraditionalknowledgeinmanagingforestsandothernaturalresources(ParrottaandAgnoletti,2007).Traditionalknowledgeisdefinedas“acumulativebodyofknowledge,practiceandbelief,handeddownthroughgenerationsbyculturaltransmissionandevolvingbyadaptiveprocesses,abouttherelationshipsoflivingbeings(includinghumans)withoneanotherandwiththeirforestenvironment”(UNFF,2004).Suchknowledge,developedlongbeforetheadventofformalforestscience,isthemainstayofmanyforestrypractices(AsiaForestNetwork,2008).
Indigenousknowledgeisofgrowinginteresttoforestscienceasitisincreasinglyrecognizedthatindigenousresource-managementsystemscanhelptoimprovethe
CIFOR has a vision of a world in which forests remain
high on the world’s political agenda and people recognize
the real value of forests for maintaining livelihoods and
ecosystems services. In this vision, decision-making that
affects forests is based on solid science and reflects the
perspectives of developing countries and forest-dependent
people.
Stakeholders surveyed for input to CIFOR’s new strategy
for 2008–2018 cited climate change as the most significant
forest-related environment and development challenge
today, followed by forest governance, deforestation and
the impact of fast-growing economies on forests (CIFOR,
2008b). Thus, CIFOR’s research agenda focuses on six
domains:
• enhancing the role of forests in climate mitigation
(with a focus on reducing emissions from
deforestation and forest degradation);
• enhancing the role of forests in adaptation to climate
change;
• improving livelihoods through smallholder and
community forestry;
• managing trade-offs between conservation and
development at landscape scale;
• managing the impacts of globalized trade and
investment on forests and forest communities;
• sustainable management of tropical production
forests.
An additional cross-cutting theme addresses the gap
between changing societal demands from the forest sector
and current institutional arrangements and capacities.
In analysing issues and communicating results, CIFOR
will include the perspectives of less powerful stakeholders
such as women, forest-dependent communities and
developing countries. n
ciFor’s new strategy: a focus on climate changeFrom the Center for International Forestry Research (CIFOR)
Views from CPF partners
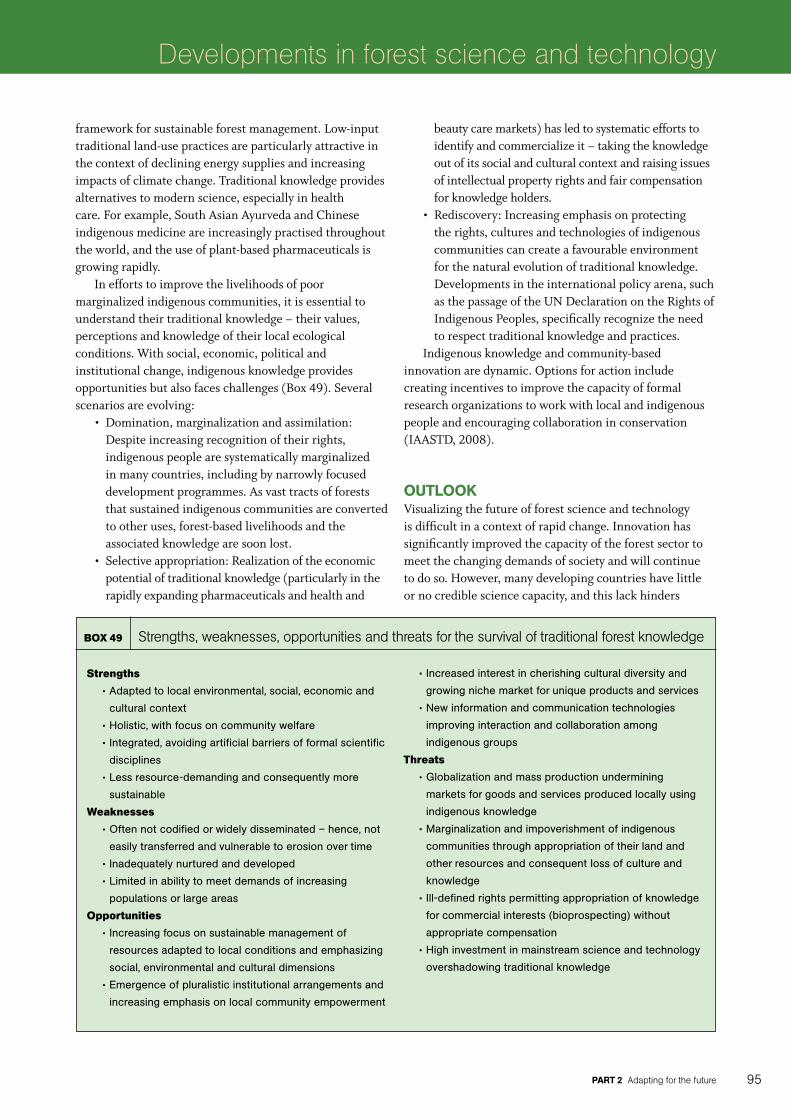
PArt 2 adapting for the future 95
Developments in forest science and technology
frameworkforsustainableforestmanagement.Low-inputtraditionalland-usepracticesareparticularlyattractiveinthecontextofdecliningenergysuppliesandincreasingimpactsofclimatechange.Traditionalknowledgeprovidesalternativestomodernscience,especiallyinhealthcare.Forexample,SouthAsianAyurvedaandChineseindigenousmedicineareincreasinglypractisedthroughouttheworld,andtheuseofplant-basedpharmaceuticalsisgrowingrapidly.
Ineffortstoimprovethelivelihoodsofpoormarginalizedindigenouscommunities,itisessentialtounderstandtheirtraditionalknowledge–theirvalues,perceptionsandknowledgeoftheirlocalecologicalconditions.Withsocial,economic,politicalandinstitutionalchange,indigenousknowledgeprovidesopportunitiesbutalsofaceschallenges(Box49).Severalscenariosareevolving:
• Domination,marginalizationandassimilation:Despiteincreasingrecognitionoftheirrights,indigenouspeoplearesystematicallymarginalizedinmanycountries,includingbynarrowlyfocuseddevelopmentprogrammes.Asvasttractsofforeststhatsustainedindigenouscommunitiesareconvertedtootheruses,forest-basedlivelihoodsandtheassociatedknowledgearesoonlost.
• Selectiveappropriation:Realizationoftheeconomicpotentialoftraditionalknowledge(particularlyintherapidlyexpandingpharmaceuticalsandhealthand
beautycaremarkets)hasledtosystematiceffortstoidentifyandcommercializeit–takingtheknowledgeoutofitssocialandculturalcontextandraisingissuesofintellectualpropertyrightsandfaircompensationforknowledgeholders.
• Rediscovery:Increasingemphasisonprotectingtherights,culturesandtechnologiesofindigenouscommunitiescancreateafavourableenvironmentforthenaturalevolutionoftraditionalknowledge.Developmentsintheinternationalpolicyarena,suchasthepassageoftheUNDeclarationontheRightsofIndigenousPeoples,specificallyrecognizetheneedtorespecttraditionalknowledgeandpractices.
Indigenousknowledgeandcommunity-basedinnovationaredynamic.Optionsforactionincludecreatingincentivestoimprovethecapacityofformalresearchorganizationstoworkwithlocalandindigenouspeopleandencouragingcollaborationinconservation(IAASTD,2008).
outlookVisualizingthefutureofforestscienceandtechnologyisdifficultinacontextofrapidchange.Innovationhassignificantlyimprovedthecapacityoftheforestsectortomeetthechangingdemandsofsocietyandwillcontinuetodoso.However,manydevelopingcountrieshavelittleornocrediblesciencecapacity,andthislackhinders
Strengths
•Adapted to local environmental, social, economic and
cultural context
•Holistic, with focus on community welfare
•Integrated, avoiding artificial barriers of formal scientific
disciplines
•Less resource-demanding and consequently more
sustainable
Weaknesses
•Often not codified or widely disseminated – hence, not
easily transferred and vulnerable to erosion over time
•Inadequately nurtured and developed
•Limited in ability to meet demands of increasing
populations or large areas
opportunities
•Increasing focus on sustainable management of
resources adapted to local conditions and emphasizing
social, environmental and cultural dimensions
•Emergence of pluralistic institutional arrangements and
increasing emphasis on local community empowerment
•Increased interest in cherishing cultural diversity and
growing niche market for unique products and services
•New information and communication technologies
improving interaction and collaboration among
indigenous groups
threats
•Globalization and mass production undermining
markets for goods and services produced locally using
indigenous knowledge
•Marginalization and impoverishment of indigenous
communities through appropriation of their land and
other resources and consequent loss of culture and
knowledge
•Ill-defined rights permitting appropriation of knowledge
for commercial interests (bioprospecting) without
appropriate compensation
•High investment in mainstream science and technology
overshadowing traditional knowledge
BoX 49 Strengths, weaknesses, opportunities and threats for the survival of traditional forest knowledge
stAte oF the World’s Forests 200996
theirlong-termdevelopmentalpotential.Eveninmanydevelopedcountries,forestscienceandtechnologycapacityhaseroded.
Thegrowthofcommerciallydrivenprivate-sectorresearchandthedecliningcapacityofpublic-sectorresearchraiseanumberofissues.Mostprivate-sectoreffortsaredrivenbytheobjectiveofmaintainingcompetitiveness.Asaresult,itisoftenrestrictedinaccess,itmayneglectenvironmentalandsocialdimensionsanditdoesnottendtonurturemoreopen-endedupstreambasicresearch.Vastpopulationsthatcannotaffordtopayforimprovedtechnologiesareexcludedfromthebenefits.Thisaccentuatesdisparitiesinaccesstoknowledge,withconsequencesforincomeandlivingstandards.
Moreconcertedeffortsareneededtoaddresstheimbalancesanddeficienciesinscientificandtechnologicalcapacity.Challengestogovernmentsinclude:
• reducingbarrierstotheflowoftechnologiesamongandwithincountries;
• ensuringthatsocialandenvironmentalissuesaremainstreamed;
• transcendingtraditionalsectoralboundariestotakeadvantageofscienceandtechnologydevelopmentsoutsidetheforestsector;
• settingaclearpolicyframeworkindicatingtheobjectives,prioritiesandstrategiesfordevelopingforestscienceandtechnology.
Finally,whilethischapterhasaddressedbiophysicalaspectsofforestscience,thestudyofhumanbehaviour,includingeconomicsandsociology,isequallyimportant.Countriesneedtoaddressbothareasinabalancedway.Indeed,inadequateattentiontothesocial-sciencedimensionmaybeoneofthereasonsfortheweaklinksbetweenscienceandpolicyinmanycountries.

PArt 2 adapting for the future 97
Developments in forest science and technology

stAte oF the World’s Forests 200998
Postscript – challenges and opportunities in turbulent times
AsState of the World’s Forests 2009goestopress(late2008),theworldisexperiencingasteepeconomicdecline.Thecontractionofthehousingsectorand
thesubprimemortgagecrisisintheUnitedStatesofAmericahaveseverelyaffectedfinancialmarkets,triggeringaglobaleconomicslowdownandrecessioninseveralcountries.Confidenceinfinancialinstitutionshaserodedsignificantly.Stockmarketdeclineshavereducedassetvaluesbyhundredsofbillionsofdollars.Deleveragingbybanksseekingtosecuretheircapitalbasehasresultedinacreditsqueezethathasaffectedalleconomicactivities.Adownwardspiralhasensued,withdecreasesinproduction,employment,incomesandconsumerdemandcausingfurthercurtailmentofproductionandfurthereconomicdecline.
Thisdownturnhasaffectedalmostallcountriesandtransformedpreviouslyupbeateconomicforecasts(IMF,2008;UN,2009).Globalunemploymentisexpectedtoincreaseby20millionin2008and2009,potentiallyreversingrecentsuccessinpovertyreduction(ILO,2008a).Wagesareexpectedtodeclinesignificantly(ILO,2008b).Economicslowdowninmostdevelopedeconomieshasalreadyhadconsequencesforemerginganddevelopingeconomies,especiallythosedependentonexportsandforeigndirectinvestment.Officialdevelopmentassistanceandremittancesbymigrantworkersareexpectedtodropsubstantially(Cali,MassaandteVelde,2008).
Asanintegralpartofthelargereconomy,theforestsectorwillbeaffectedbytheoveralleconomicslump.Theseverityofimpactswillvaryacrossthesectordependingonlinkageswithsectorsdirectlyaffectedbythecrisis.
deClining demAnd For Wood ProduCts And sCAling doWn oF ProduCtionThecollapseofthehousingsector,whichhasbeenattheepicentreofthecurrentcrisis,isamajorblowtowoodindustries.TheannualrateofnewhousingstartsintheUnitedStatesofAmericadeclinedfromabout2.1millioninearly2006tolessthan0.8millioninOctober2008(seefigureonright).Severalothercountries,especiallyinWesternEurope,havewitnessedsimilardeclinesin
thehousingsector,althoughnotofthesamemagnitude.Thehousingdeclinehasledtodecreasesinwooddemand(UNECEandFAO,2008;WWPA,2008).WoodfibredemandinNorthAmericaaloneisexpectedtofallbymorethan20milliontonnesin2009(RISI,2008).Consequently,scalingdownofproductioniswidespreadinalmostallcountriesandallforestindustries,fromloggingtosawmillingtoproductionofwoodpanels,pulp,paperandfurniture.CountriesthatarehighlydependentonUnitedStatesmarkets,forexampleBrazilandCanada,havealreadybeenseverelyaffected.
Decliningdemandforforestproductsandthecreditcrunchtogetherarehavingaseverenegativeimpactonnewinvestments,affectingallwoodindustries.Asexistingfacilitiesremainunderusedorclosedown,investmentsinnewcapacitiesarebeingdeferredordropped.
reduCed Willingness to PAy For environmentAl serviCesTheeconomiccrisiscouldaffectthedemandforenvironmentalservices,especiallyassocietybecomeslessabletopay.Nationalandinternationalpoliciescoupledwithanascentmarketmechanismformthefoundationforthegrowthindemandandsupplyofenvironmentalservices.
United States housing starts
2.5
2.0
1.5
1.0
0.5
01990 1992 1994 1996 1998 2000 2002 2004 2006 2008
Million units
Source: nahB, 2008.

99
Prolongedeconomicstagnationcouldhaveanegativeimpactonanumberofenvironmentalservicesunlessthebuildingupofa“greeneconomy”isseenasawayoutofthecrisis.
Despiteaninitialappearanceofstability,carbonmarketshavealsobeenhitbythefinancialcrisisasithasledtothecollapseofsomeofthemajorinvestmentbanksinvolvedincarbontrading.Carbonpriceshaveplummetedinlinewiththepricesofoilandothercommodities.OntheEuropeanClimateExchange,carbonpricesdroppedfromabout€29pertonneinearlyJuly2008toabout€15pertonneinmid-November2008.Aneconomicslowdownimpliesadeclineinemissionsfromindustriesandpowerutilities,reducingthedemandforemissionallowances.Unlessthepriceofcarbonincreasessignificantlyandremainsstable,themarketapproachtocombatingclimatechangecouldbecomeineffective.Itsviabilitywilllargelydependoneconomicrecoveryandstrongpoliticalcommitmenttoconcludethepost-Kyotoclimatechangeagreement.
Amoregeneralconcernisthatsomegovernmentsmaydilutepreviouslyambitiousgreengoalsordeferkeypolicydecisionsrelatedtofutureclimatechangemitigationandadaptationastheyfocusonreversingtheeconomicdownturn(Egenhofer,2008;Rice-Oxley,2008).Forexample,commitmenttoEuropeanlegislationonclimatechange,especiallyonauctioningemissionallowances,ismeetingobstacles,althoughsomecountries(e.g.theUnitedKingdom)havemovedaheadwithpartialauctioning.Initiativessuchasthoseforreducingemissionsfromdeforestationandforestdegradation(REDD)thataredependentoninternationalfinancialtransferscouldfacesimilarproblems.
Theunprecedentedinvestmentboominbiofuelproductionofthepastfewyearsisalsofading.Theslowdowncouldparticularlyaffectinvestmentinthemoreefficientsecond-andthird-generationtechnologies,includinglignocellulosicbiofuelproduction.
Travelandtourism,includingecotourism,isanothersectoralreadyaffectedbytheeconomicslump.Sincemid-2008,theexpansionofinternationaltourismhasdecelerated,initiallybecauseofhighfuelpricesandsubsequentlybecauseofslowedeconomicgrowthandconsequentlowerconsumer
expenditureontravelandtourism(WTO,2008).AnalreadyvisibledeclineininternationaltouristarrivalsinKenya,SouthAfricaandtheUnitedRepublicofTanzania,forexample,heraldscomingdifficultiesforwildlifetourism.
imPACts on Forests And Forest mAnAgement: BAd neWs And good Reducedwooddemandcouldhavepositiveeffectsonforestresources,buttheeconomiccrisiscouldalsoreduceinvestmentinsustainableforestmanagementandfavourillegallogging.Contractionofformaleconomicsectorsoftenopensopportunitiesforexpansionoftheinformalsector,includingillegallogging.Forexample,anumberofcountriesinSoutheastAsiawitnessedanincreaseinillegalloggingfollowingthe1997/98economiccrisis(Pagiola,2004).Decliningdemandforhigh-pricedwoodfromlegaloperations,reducedinstitutionalcapacitytoprotectforestsasaresultoflowerbudgetsandincreasingunemploymentintheformalsectorcouldincreaseillegallogging.
Asoutlinedintheprecedingchapters,rapideconomicgrowthandreducedlanddependencehavehelpedtoslowforestclearanceandevenreversedeforestationinmanycountriesinthepastdecade.Inseveralcountries,remittancesfrommigrantworkershavehelpedtodiminishthepressureonland.Acontinuingeconomiccrisiscouldreversethedeclineindependenceonagriculture,especiallyasindustrialandservicessectorsdeclineandremittancesdrop.Increasingunemploymentinthelattersectorscouldresultinthereturnofworkerstoruralareaswithattendantimpactsonlanduse,includingexpansionofcultivationontoforestland.
Althoughsmallholdercultivationmayexpand,large-scalecultivationofcommercialcrops,whichhasbeenakeydriverofdeforestationinthetropics,coulddeclinesubstantiallywiththecreditsqueezeandthereductionindemandcausedbytheeconomicslowdown.Pricesofpalmoil,rubberandsoybeanshavedroppeddramaticallyinthesecondhalfof2008(seefigureonnextpage).Whilethisisbadnewsfortheproducersofthesecommodities,itcouldbegoodnewsforforests.Forexample,thepriceofsoybeanshasadirectcorrelationwithforestclearanceintheAmazonbasin(Nepstadet al.,2008).
PostsCriPt

stAte oF the World’s Forests 2009100
WeAthering the eConomiC stormGovernmentsandcentralbankshaveactedrapidlytocounterthecrisisinacoordinatedmanner.However,nobodycanbecertainwhenthedeclinewillbottomorhowlongitwilltakeformarketsandconsumerconfidencetoturnaroundagain.Arecoverywithinacoupleofyearsisahighlyoptimisticscenario.Manyeconomistsvisualizefurtherdeclinebeforeaprolongedperiodofslowrecovery.Wooddemandisunlikelytoreachthepeakof2005–2006againintheforeseeablefuture.
Almostallcountriesarecurrentlyimplementingmonetaryandfiscalpoliciestoboostcreditavailability,growthandconsumerdemand.Theforestsectorcouldseizetheopportunitytoplayapartinthesefiscalstimulusmeasures–throughthebuildingupofnaturalresourcecapital(e.g.throughafforestationandreforestationandincreasedinvestmentinsustainableforestmanagement),generationofruralemploymentandactivepromotionofwoodingreenbuildingpracticesandrenewableenergy.
Economiccyclesalsoalwayspresentopportunitiesforindustryrestructuring.Large-scaleenterprisesfrequentlyrationalizeproductioncapacitybyclosingdownoldandinefficientunitsandfocusingonthemoreproductivepartofthebusiness.Largeenterprisesoftenfacethegreatestproblemsinaneconomicdownturn;smallandmedium-sizedenterprisesmayevenfindthatthecrisisoffersthemsomeopportunities.
Theforestsector’sabilitytotakeadvantageofthewindowsofopportunityprovidedbythecurrenteconomiccrisiswilllargelydependoninstitutionalreinvention(seethechapter“Changinginstitutions”beginningonpage80).Difficultasthisis,thecrisismaystimulateacceptanceandimplementationoflong-overduereforms.
reFerenCesCali, M., Massa, I. & te Velde, D.W. 2008.The global financial crisis: financial flows to developing countries set to fall by one quarter.London,OverseasDevelopmentInstitute.
Egenhofer, C.2008.Climate change policy after the financial crisis: the latest excuse for a new round of state aid?CEPScommentary(availableatwww.ceps.eu).
FAO.2008.Internationalcommodityprices(availableatwww.fao.org/es/esc/prices).
ILO. 2008a.ILO says global financial crisis to increase unemployment by 20 million.PressreleaseILO/08/45,16October.Geneva,Switzerland,InternationalLabourOrganization(alsoavailableatwww.ilo.org/global/About_the_ILO/Media_and_public_information/lang--en/index.htm).
ILO. 2008b.Global wage report 2008/2009.Geneva,Switzerland.
IMF. 2008.Global economic outlook.Washington,DC,InternationalMonetaryFund.
Index Mundi.2008.Commoditypriceindices:rubbermonthlyprice(availableatwww.indexmundi.com/commodities/?commodity=rubber).
NAHB.2008.Housingstarts.NationalAssociationofHomeBuilders(availableatwww.nahb.org/generic.aspx?genericContentID=45409).
Nepstad, D.C., Stickler, C.M., Soares-Filho, B. & Merry, F. 2008.InteractionsamongAmazonlanduse,forestsandclimate:prospectsforanear-termtippingpoint.Philosophical Transactions of the Royal Society,363:1737–1746.
Pagiola, S. 2004.Deforestation and land use changes induced by the East Asian economic crisis.EASESDiscussionPaperSeries.Washington,DC,WorldBank(alsoavailableatideas.repec.org/p/wpa/wuwpot/0405006.html).
Rice-Oxley, M. 2008.Financialcrisisthreatensclimate-changemomentum.Christian Science Monitor,13November(availableatfeatures.csmonitor.com/environment).
RISI. 2008.RISI’s International Woodfiber Report predicts North American woodfiber demand to fall more than 20 million tons by year-end.Pressrelease,23October.ResourceInformationSystemsInc.(availableatwww.risiinfo.com/pages/abo//news/2008/2008-10-23.jsp).
UN.2009.World Economic Situation and Prospects 2009 – Global Outlook 2009.Pre-release.NewYork,USA,UnitedNations(alsoavailableatwww.un.org/esa/policy/wess/wesp.html).
UNECE & FAO. 2008.Forest Products Annual Market Review 2007–2008.Geneva,Switzerland,UnitedNationsPublications.
WTO. 2008.Slowdown in tourism growth reflects current uncertainties.Pressrelease,10November.WorldTourismOrganization(availableatwww.unwto.org/media).
WWPA. 2008. U.S. financial crisis will delay recovery of housing, lumber markets until 2010.WesternWoodProductsAssociation(availableatwww2.wwpa.org/Portals/9/docs/r-2008-09%20forecast.doc).
Index of market price of palm oil, rubber and soybeans
350
300
250
200
150
100
50 January January January January January 2005 2006 2007 2008 2009
index
Note: January 2005 = 100.SourceS: fao, 2008; index Mundi, 2008.
Palm oil rubber Soybeans

cou
rtesy
eco
Port
(ww
w.e
copo
rt.or
g)
: P
. oud
hia
annex
In all tables, the regional breakdown reflects geographical rather than economic or political groupings.– = not available0 = either a true zero or an insignificant value (less than half a unit)
In Table 1, “land area” refers to the total area of a country, excluding areas under inland water bodies. The world total corresponds to the sum of the reporting units; about 35 million hectares of land in Antarctica, some Arctic and Antarctic islands
and some other minor islands are not included. Per capita gross domestic product (GDP) is expressed at purchasing power parity (PPP).
In Tables 2 and 3, data for Serbia and Montenegro are reported together as only combined data are available.
In Table 3, “biomass” refers to above-ground and below-ground biomass. Totals and subtotals refer only to those countries that have reported data on growing stock, biomass and carbon stock.
In Table 6, employment is reported for the formal forestry sector only.
Notes on the annex tables
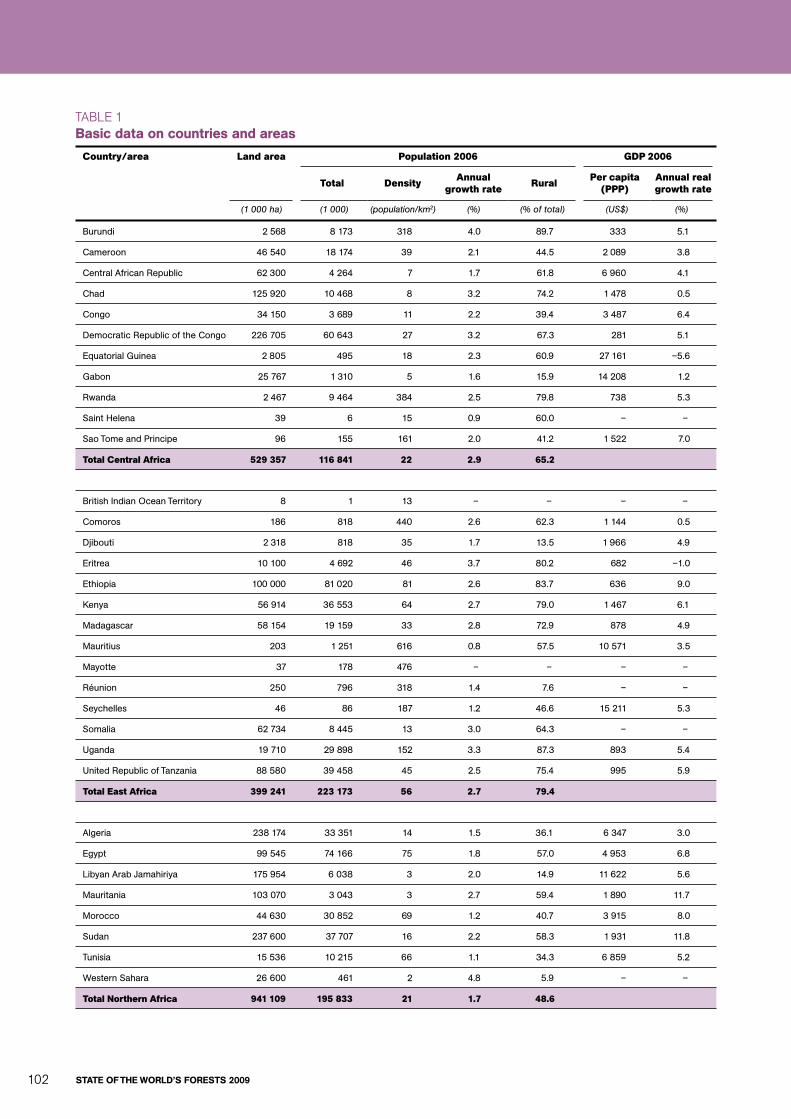
stAte oF the World’s Forests 2009102
country/area Land area Population 2006 gDP 2006
total Density Annual growth rate rural Per capita
(PPP)Annual real growth rate
(1 000 ha) (1 000) (population/km2) (%) (% of total) (US$) (%)
Burundi 2 568 8 173 318 4.0 89.7 333 5.1
Cameroon 46 540 18 174 39 2.1 44.5 2 089 3.8
Central African Republic 62 300 4 264 7 1.7 61.8 6 960 4.1
Chad 125 920 10 468 8 3.2 74.2 1 478 0.5
Congo 34 150 3 689 11 2.2 39.4 3 487 6.4
Democratic Republic of the Congo 226 705 60 643 27 3.2 67.3 281 5.1
Equatorial Guinea 2 805 495 18 2.3 60.9 27 161 –5.6
Gabon 25 767 1 310 5 1.6 15.9 14 208 1.2
Rwanda 2 467 9 464 384 2.5 79.8 738 5.3
Saint Helena 39 6 15 0.9 60.0 – –
Sao Tome and Principe 96 155 161 2.0 41.2 1 522 7.0
total central Africa 529 357 116 841 22 2.9 65.2
British Indian Ocean Territory 8 1 13 – – – –
Comoros 186 818 440 2.6 62.3 1 144 0.5
Djibouti 2 318 818 35 1.7 13.5 1 966 4.9
Eritrea 10 100 4 692 46 3.7 80.2 682 –1.0
Ethiopia 100 000 81 020 81 2.6 83.7 636 9.0
Kenya 56 914 36 553 64 2.7 79.0 1 467 6.1
Madagascar 58 154 19 159 33 2.8 72.9 878 4.9
Mauritius 203 1 251 616 0.8 57.5 10 571 3.5
Mayotte 37 178 476 – – – –
Réunion 250 796 318 1.4 7.6 – –
Seychelles 46 86 187 1.2 46.6 15 211 5.3
Somalia 62 734 8 445 13 3.0 64.3 – –
Uganda 19 710 29 898 152 3.3 87.3 893 5.4
United Republic of Tanzania 88 580 39 458 45 2.5 75.4 995 5.9
total east Africa 399 241 223 173 56 2.7 79.4
Algeria 238 174 33 351 14 1.5 36.1 6 347 3.0
Egypt 99 545 74 166 75 1.8 57.0 4 953 6.8
Libyan Arab Jamahiriya 175 954 6 038 3 2.0 14.9 11 622 5.6
Mauritania 103 070 3 043 3 2.7 59.4 1 890 11.7
Morocco 44 630 30 852 69 1.2 40.7 3 915 8.0
Sudan 237 600 37 707 16 2.2 58.3 1 931 11.8
Tunisia 15 536 10 215 66 1.1 34.3 6 859 5.2
Western Sahara 26 600 461 2 4.8 5.9 – –
total Northern Africa 941 109 195 833 21 1.7 48.6
taBle 1 Basic data on countries and areas
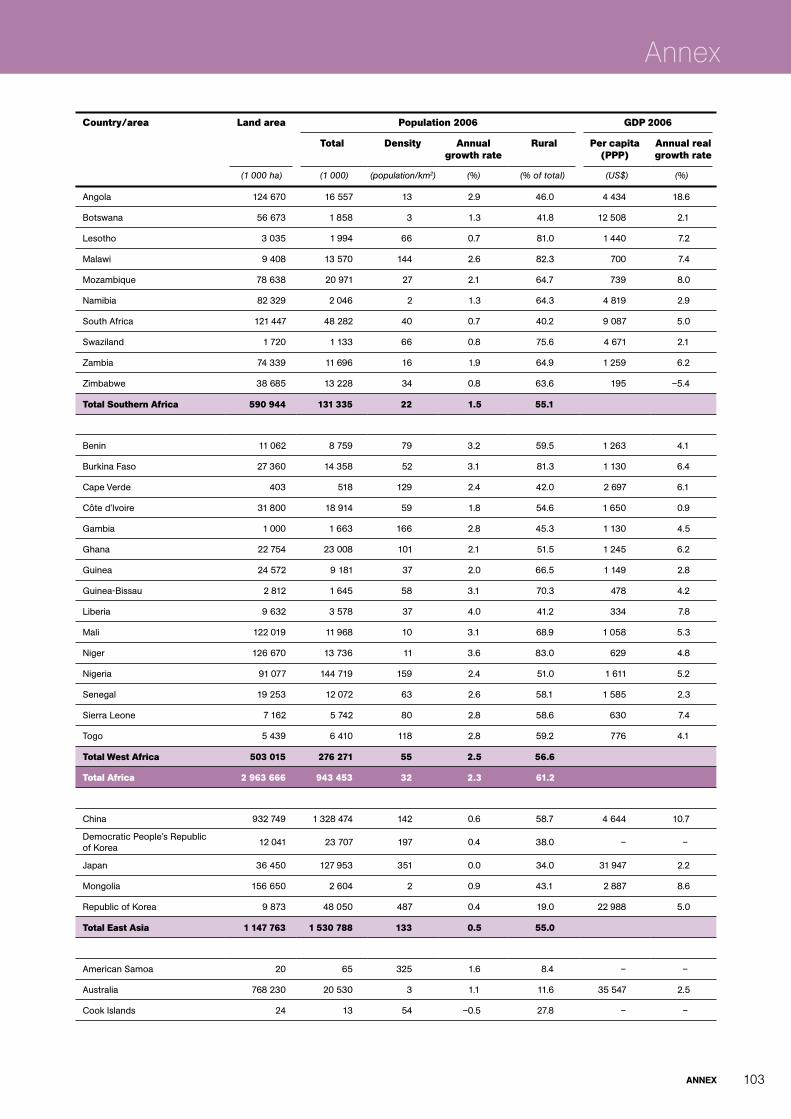
Annex 103
Annex
Angola 124 670 16 557 13 2.9 46.0 4 434 18.6
Botswana 56 673 1 858 3 1.3 41.8 12 508 2.1
Lesotho 3 035 1 994 66 0.7 81.0 1 440 7.2
Malawi 9 408 13 570 144 2.6 82.3 700 7.4
Mozambique 78 638 20 971 27 2.1 64.7 739 8.0
Namibia 82 329 2 046 2 1.3 64.3 4 819 2.9
South Africa 121 447 48 282 40 0.7 40.2 9 087 5.0
Swaziland 1 720 1 133 66 0.8 75.6 4 671 2.1
Zambia 74 339 11 696 16 1.9 64.9 1 259 6.2
Zimbabwe 38 685 13 228 34 0.8 63.6 195 –5.4
total Southern Africa 590 944 131 335 22 1.5 55.1
Benin 11 062 8 759 79 3.2 59.5 1 263 4.1
Burkina Faso 27 360 14 358 52 3.1 81.3 1 130 6.4
Cape Verde 403 518 129 2.4 42.0 2 697 6.1
Côte d’Ivoire 31 800 18 914 59 1.8 54.6 1 650 0.9
Gambia 1 000 1 663 166 2.8 45.3 1 130 4.5
Ghana 22 754 23 008 101 2.1 51.5 1 245 6.2
Guinea 24 572 9 181 37 2.0 66.5 1 149 2.8
Guinea-Bissau 2 812 1 645 58 3.1 70.3 478 4.2
Liberia 9 632 3 578 37 4.0 41.2 334 7.8
Mali 122 019 11 968 10 3.1 68.9 1 058 5.3
Niger 126 670 13 736 11 3.6 83.0 629 4.8
Nigeria 91 077 144 719 159 2.4 51.0 1 611 5.2
Senegal 19 253 12 072 63 2.6 58.1 1 585 2.3
Sierra Leone 7 162 5 742 80 2.8 58.6 630 7.4
Togo 5 439 6 410 118 2.8 59.2 776 4.1
total West Africa 503 015 276 271 55 2.5 56.6
total Africa 2 963 666 943 453 32 2.3 61.2
China 932 749 1 328 474 142 0.6 58.7 4 644 10.7
Democratic People’s Republic of Korea
12 041 23 707 197 0.4 38.0 – –
Japan 36 450 127 953 351 0.0 34.0 31 947 2.2
Mongolia 156 650 2 604 2 0.9 43.1 2 887 8.6
Republic of Korea 9 873 48 050 487 0.4 19.0 22 988 5.0
total east Asia 1 147 763 1 530 788 133 0.5 55.0
American Samoa 20 65 325 1.6 8.4 – –
Australia 768 230 20 530 3 1.1 11.6 35 547 2.5
Cook Islands 24 13 54 –0.5 27.8 – –
country/area Land area Population 2006 gDP 2006
total Density Annual growth rate
rural Per capita (PPP)
Annual real growth rate
(1 000 ha) (1 000) (population/km2) (%) (% of total) (US$) (%)

stAte oF the World’s Forests 2009104
Fiji 1 827 833 46 0.6 48.7 4 548 3.6
French Polynesia 366 259 71 1.6 48.3 – –
Guam 54 171 317 1.8 5.9 – –
Kiribati 81 93 115 1.1 51.8 3 688 5.8
Marshall Islands 18 57 317 1.8 33.1 6 429 3.0
Micronesia (Federated States of) 70 110 157 0.6 77.6 5 565 –0.7
Nauru 2 10 500 1.6 – – –
New Caledonia 1 828 237 13 1.3 35.9 – –
New Zealand 26 771 4 139 15 1.0 13.7 25 517 1.9
Niue 26 1 4 –0.1 – – –
Northern Mariana Islands 46 82 178 2.5 5.3 – –
Palau 46 20 43 0.5 30.3 14 209 5.7
Papua New Guinea 45 286 6 201 14 2.2 86.5 1 817 2.6
Pitcairn Islands 5 0 1 – – – –
Samoa 283 185 65 1.1 77.4 5 148 2.3
Solomon Islands 2 799 484 17 2.5 82.7 1 839 6.1
Tokelau 1 1 139 0.7 – – –
Tonga 72 99 138 0.3 75.7 5 405 1.4
Tuvalu 3 10 333 0.4 40.0 – –
Vanuatu 1 219 220 18 2.3 76.1 3 768 7.2
Wallis and Futuna Islands 14 15 107 1.2 – – –
total oceania 849 091 33 835 4 1.3 29.3
Bangladesh 13 017 155 990 1 198 1.8 74.5 1 155 6.6
Bhutan 4 700 648 14 1.7 88.6 4 010 8.5
India 297 319 1 151 751 387 1.5 71.0 2 469 9.2
Maldives 30 300 1 000 1.7 69.9 5 008 23.5
Nepal 14 300 27 641 193 2.0 83.7 999 2.8
Pakistan 77 088 160 943 209 1.8 64.7 2 361 6.9
Sri Lanka 6 463 19 207 297 0.5 84.9 3 747 7.4
total South Asia 412 917 1 516 480 367 1.6 71.1
Brunei Darussalam 527 381 72 2.1 26.1 49 898 5.1
Cambodia 17 652 14 196 80 1.7 79.7 1 619 10.8
Indonesia 181 157 228 864 126 1.2 50.8 3 454 5.5
Lao People’s Democratic Republic 23 080 5 759 25 1.7 79.0 1 980 7.6
Malaysia 32 855 26 113 79 1.8 31.8 12 536 5.9
Myanmar 65 755 48 379 74 0.9 68.7 979 4.1
Philippines 29 817 86 263 289 2.0 36.6 3 153 5.4
taBle 1 (cont.)
Basic data on countries and areas
country/area Land area Population 2006 gDP 2006
total Density Annual growth rate
rural Per capita (PPP)
Annual real growth rate
(1 000 ha) (1 000) (population/km2) (%) (% of total) (US$) (%)

Annex 105
Annex
Singapore 69 4 381 6 358 1.2 0.0 44 708 7.9
Thailand 51 089 63 443 124 0.7 67.4 7 599 5.0
Timor-Leste 1 487 1 113 75 4.3 73.1 2 141 –1.6
Viet Nam 31 007 86 205 278 1.4 73.1 2 363 8.2
total Southeast Asia 434 495 565 097 130 1.3 55.2
total Asia and the Pacific 2 844 265 3 646 200 128 1.1 61.5
Belarus 20 748 9 742 47 –0.5 27.3 9 732 9.9
Republic of Moldova 3 287 3 832 117 –1.1 53.0 2 377 4.0
Russian Federation 1 638 139 143 221 9 –0.5 27.1 13 116 6.7
Ukraine 57 938 46 557 80 –0.8 32.0 6 212 7.1
total ciS countries 1 720 112 203 352 12 –0.6 28.7
Albania 2 740 3 172 116 0.6 53.9 5 886 5.0
Bosnia and Herzegovina 5 120 3 926 77 0.3 53.7 6 488 6.0
Bulgaria 10 864 7 692 71 –0.7 29.7 10 274 6.1
Croatia 5 592 4 556 81 0.1 43.2 14 309 4.8
Czech Republic 7 726 10 188 132 0.0 26.5 22 118 6.1
Estonia 4 239 1 339 32 –0.4 30.9 18 969 11.4
Hungary 8 961 10 058 112 –0.3 33.3 18 277 3.9
Latvia 6 229 2 289 37 –0.5 32.1 15 350 11.9
Lithuania 6 268 3 408 54 –0.5 33.4 15 738 7.7
Montenegro 1 380 608 44 –0.3 – 9 034 16.2
Poland 30 633 38 140 125 –0.1 37.8 14 836 6.1
Romania 22 998 21 531 94 –0.4 46.1 10 431 7.7
Serbia 8 820 9 875 112 0.1 – 9 434 5.7
Slovakia 4 810 5 388 112 0.0 43.7 17 730 8.3
Slovenia 2 014 2 000 99 0.1 48.8 24 356 5.2
The former Yugoslav Republic of Macedonia
2 543 2 036 80 0.1 30.4 7 850 3.0
total eastern europe 130 937 126 206 96 –0.2 39.4
Andorra 47 74 157 1.4 9.7 – –
Austria 8 245 8 327 101 0.4 33.9 36 049 3.1
Belgium 3 023 10 430 345 0.3 2.8 33 543 3.2
Channel Islands 19 148 779 0.4 69.4 – –
Denmark 4 243 5 430 128 0.3 14.3 35 692 3.2
Faeroe Islands 140 48 34 0.6 61.0 – –
Finland 30 459 5 261 17 0.3 38.8 33 022 5.5
France 55 010 61 329 111 0.6 23.1 31 992 2.0
Germany 34 877 82 640 237 0.0 24.7 32 322 2.8
country/area Land area Population 2006 gDP 2006
total Density Annual growth rate
rural Per capita (PPP)
Annual real growth rate
(1 000 ha) (1 000) (population/km2) (%) (% of total) (US$) (%)

stAte oF the World’s Forests 2009106
Gibraltar 1 29 2 900 0.1 0.0 – –
Greece 12 890 11 122 86 0.2 40.9 27 333 4.3
Holy See – 1 – –0.1 0.0 – –
Iceland 10 025 298 3 1.0 7.1 36 923 2.6
Ireland 6 889 4 221 61 1.9 39.2 40 268 5.7
Isle of Man 57 78 137 –0.2 48.1 – –
Italy 29 411 58 778 200 0.2 32.2 29 053 1.9
Liechtenstein 16 34 213 0.9 85.4 – –
Luxembourg 259 461 178 1.1 17.3 75 611 6.2
Malta 32 404 1 263 0.5 4.5 21 720 3.4
Monaco 2 32 1 600 1.1 0.0 – –
Netherlands 3 388 16 378 483 0.3 19.3 36 560 2.9
Norway 30 428 4 668 15 0.6 22.5 50 078 2.9
Portugal 9 150 10 578 116 0.5 41.8 20 784 1.3
San Marino 6 30 500 0.8 2.5 – –
Spain 49 919 43 886 88 1.1 23.2 28 649 3.9
Sweden 41 033 9 078 22 0.4 15.7 34 193 4.2
Switzerland 4 000 7 454 186 0.4 24.4 37 194 3.2
United Kingdom 24 193 60 512 250 0.1 10.2 33 087 2.8
total Western europe 357 762 401 729 112 0.4 23.4
total europe 2 208 811 731 287 33 0.0 27.7
Anguilla 9 12 133 1.5 – – –
Antigua and Barbuda 44 84 191 1.2 60.4 16 578 11.5
Aruba 18 103 572 1.0 53.3 – –
Bahamas 1 001 327 33 1.2 9.4 23 927 3.4
Barbados 43 292 679 0.3 46.7 18 145 3.9
Bermuda 5 64 1 280 0.3 0.0 – –
British Virgin Islands 15 22 147 1.2 36.4 – –
Cayman Islands 26 46 177 2.2 0.0 – –
Cuba 10 982 11 266 103 0.1 24.6 – –
Dominica 75 67 89 0.8 26.8 9 236 4.0
Dominican Republic 4 838 9 614 199 1.5 32.5 5 866 10.7
Grenada 34 105 309 1.0 69.3 9 415 0.7
Guadeloupe 169 441 261 0.7 0.2 – –
Haiti 2 756 9 445 343 1.6 60.5 1 224 2.3
Jamaica 1 083 2 698 249 0.6 46.6 7 567 2.5
Martinique 106 397 375 0.5 3.8 – –
Montserrat 10 5 50 3.5 – – –
taBle 1 (cont.)
Basic data on countries and areas
country/area Land area Population 2006 gDP 2006
total Density Annual growth rate
rural Per capita (PPP)
Annual real growth rate
(1 000 ha) (1 000) (population/km2) (%) (% of total) (US$) (%)

Annex 107
Annex
Netherlands Antilles 80 188 235 1.1 29.3 – –
Puerto Rico 887 3 968 447 0.6 2.2 – –
Saint Kitts and Nevis 26 49 188 1.1 67.8 14 886 5.8
Saint Lucia 61 163 267 1.2 72.3 9 992 4.5
Saint Vincent and the Grenadines 39 119 305 0.5 53.7 8 916 6.9
Trinidad and Tobago 513 1 328 259 0.4 87.5 17 717 12.0
Turks and Caicos Islands 43 25 58 4.2 53.8 – –
United States Virgin Islands 35 111 317 0.0 5.6 – –
total caribbean 22 898 40 939 179 0.9 36.1
Belize 2 281 281 12 2.2 51.5 7 846 5.6
Costa Rica 5 106 4 398 86 1.6 37.8 9 564 8.2
El Salvador 2 072 6 762 326 1.4 39.9 5 765 4.2
Guatemala 10 843 13 028 120 2.5 52.3 5 175 4.5
Honduras 11 189 6 968 62 2.0 53.0 3 543 6.0
Nicaragua 12 140 5 532 46 1.3 40.6 2 789 3.7
Panama 7 443 3 287 44 1.7 28.4 9 255 8.1
total central America 51 074 40 256 79 1.9 45.2
Argentina 273 669 39 134 14 1.0 9.7 11 985 8.5
Bolivia 108 438 9 353 9 1.9 35.3 3 937 4.6
Brazil 845 942 189 322 22 1.3 15.3 8 949 3.7
Chile 74 880 16 465 22 1.0 12.1 13 030 4.0
Colombia 110 950 45 558 41 1.4 27.0 6 378 6.8
Ecuador 27 684 13 201 48 1.1 36.7 7 145 3.9
Falkland Islands 1 217 2 0 0.4 – – –
French Guiana 8 815 197 2 2.6 24.6 – –
Guyana 19 685 739 4 0.1 71.7 3 547 4.8
Paraguay 39 730 6 015 15 1.9 40.9 4 034 4.3
Peru 128 000 27 588 22 1.2 27.2 7 092 7.7
South Georgia and the South Sandwich Islands
409 0 0 – – – –
Suriname 15 600 455 3 0.7 25.8 7 984 5.8
Uruguay 17 502 3 331 19 0.2 7.9 10 203 7.0
Venezuela (Bolivarian Republic of) 88 205 27 191 31 1.7 6.3 11 060 10.3
total South America 1 760 726 378 551 21 1.3 17.9
total Latin America and the caribbean 1 834 698 459 746 25 1.3 21.9
Canada 909 351 32 576 4 0.9 19.8 36 713 2.8
Greenland 41 045 57 0 0.3 16.8 – –
Mexico 194 395 105 342 54 1.0 23.7 12 177 4.8
country/area Land area Population 2006 gDP 2006
total Density Annual growth rate
rural Per capita (PPP)
Annual real growth rate
(1 000 ha) (1 000) (population/km2) (%) (% of total) (US$) (%)

stAte oF the World’s Forests 2009108
Saint Pierre and Miquelon 23 6 26 0.8 16.7 – –
United States of America 916 192 302 841 33 1.0 18.9 43 968 2.9
total North America 2 061 006 440 822 21 1.0 20.1
Armenia 2 820 3 009 107 –0.3 36.0 4 879 13.3
Azerbaijan 8 266 8 406 102 0.6 48.4 6 280 30.6
Georgia 6 949 4 432 64 –0.9 47.7 4 010 9.4
Kazakhstan 269 970 15 314 6 0.7 42.4 9 832 10.7
Kyrgyzstan 19 180 5 258 27 1.1 64.0 1 813 2.7
Tajikistan 13 996 6 639 47 1.4 75.4 1 610 7.0
Turkmenistan 46 993 4 899 10 1.4 53.4 4 570 11.1
Uzbekistan 42 540 26 980 63 1.5 63.3 2 192 7.3
total central Asia 410 714 74 937 18 1.0 55.8
Afghanistan 65 209 26 087 40 4.1 76.7 917 5.3
Bahrain 71 738 1 039 1.9 3.3 33 451 6.5
Cyprus 924 845 91 1.1 30.5 25 882 4.0
Iran (Islamic Republic of) 162 855 70 270 43 1.2 32.6 9 906 4.6
Iraq 43 737 28 505 65 1.8 33.2 – –
Israel 2 164 6 809 315 1.7 8.4 24 097 5.1
Jordan 8 824 5 728 65 3.3 17.4 4 628 5.7
Kuwait 1 782 2 778 156 0.7 1.7 43 551 6.3
Lebanon 1 023 4 055 396 1.1 13.3 9 741 0.0
Occupied Palestinian Territory 602 3 889 646 3.4 28.3 3 605 1.4
Oman 30 950 2 546 8 1.6 28.5 22 152 6.8
Qatar 1 100 821 75 3.1 4.5 70 772 10.3
Saudi Arabia 214 969 24 174 11 2.4 18.8 22 296 4.3
Syrian Arab Republic 18 378 19 407 106 2.7 49.2 4 225 5.1
Turkey 76 963 73 921 96 1.3 32.2 8 417 6.1
United Arab Emirates 8 360 4 248 51 3.5 23.3 35 882 9.4
Yemen 52 797 21 732 41 3.0 72.3 2 264 3.3
total Western Asia 690 708 296 553 43 2.0 37.5
total Western and central Asia 1 101 422 371 490 34 1.8 41.2
totAL WorLD 13 013 868 6 592 998 51 1.2 51.0
taBle 1 (cont.)
Basic data on countries and areas
country/area Land area Population 2006 gDP 2006
total Density Annual growth rate
rural Per capita (PPP)
Annual real growth rate
(1 000 ha) (1 000) (population/km2) (%) (% of total) (US$) (%)
SourceS: faoStat (resourceStat and PopStat), World Bank (World development indicators) and iMf (World economic outlook database), last accessed 28 august 2008.

Annex 109
Annex
taBle 2 Forest area and area change
country/area extent of forest, 2005 Annual change rate
Forest area
% of land area
Area per 1 000 people 1990–2000 2000–2005
(1 000 ha) (%) (ha) (1 000 ha) (%) (1 000 ha) (%)
Burundi 152 5.9 19 –9 –3.7 –9 –5.2
Cameroon 21 245 45.6 1 169 –220 –0.9 –220 –1.0
Central African Republic 22 755 36.5 5 337 –30 –0.1 –30 –0.1
Chad 11 921 9.5 1 139 –79 –0.6 –79 –0.7
Congo 22 471 65.8 6 091 –17 –0.1 –17 –0.1
Democratic Republic of the Congo 133 610 58.9 2 203 –532 –0.4 –319 –0.2
Equatorial Guinea 1 632 58.2 3 297 –15 –0.8 –15 –0.9
Gabon 21 775 84.5 16 622 –10 0.0 –10 0.0
Rwanda 480 19.5 51 3 0.8 27 6.9
Saint Helena 2 6.5 333 0 0.0 0 0.0
Sao Tome and Principe 27 28.4 177 0 0.0 0 0.0
total central Africa 236 070 44.6 2 020 –910 –0.37 –673 –0.28
British Indian Ocean Territory 3 32.5 2 600 0 0.0 0 0.0
Comoros 5 2.9 7 0 –4.0 –1 –7.4
Djibouti 6 0.2 7 0 0.0 0 0.0
Eritrea 1 554 15.4 331 –5 –0.3 –4 –0.3
Ethiopia 13 000 11.9 160 –141 –1.0 –141 –1.1
Kenya 3 522 6.2 96 –13 –0.3 –12 –0.3
Madagascar 12 838 22.1 670 –67 –0.5 –37 –0.3
Mauritius 37 18.2 30 0 –0.3 0 –0.5
Mayotte 5 14.7 31 0 –0.4 0 –0.4
Réunion 84 33.6 106 0 –0.1 –1 –0.7
Seychelles 40 88.9 465 0 0.0 0 0.0
Somalia 7 131 11.4 844 –77 –1.0 –77 –1.0
Uganda 3 627 18.4 121 –87 –1.9 –86 –2.2
United Republic of Tanzania 35 257 39.9 894 –412 –1.0 –412 –1.1
total east Africa 77 109 18.9 346 –801 –0.94 –771 –0.97
Algeria 2 277 1.0 68 35 1.8 27 1.2
Egypt 67 0.1 1 2 3.0 2 2.6
Libyan Arab Jamahiriya 217 0.1 36 0 0.0 0 0.0
Mauritania 267 0.3 88 –10 –2.7 –10 –3.4
Morocco 4 364 9.8 141 4 0.1 7 0.2
Sudan 67 546 28.4 1 791 –589 –0.8 –589 –0.8
Tunisia 1 056 6.8 103 32 4.1 19 1.9
Western Sahara 1 011 3.8 2 193 0 0.0 0 0.0
total Northern Africa 76 805 8.2 392 –526 –0.64 –544 –0.69
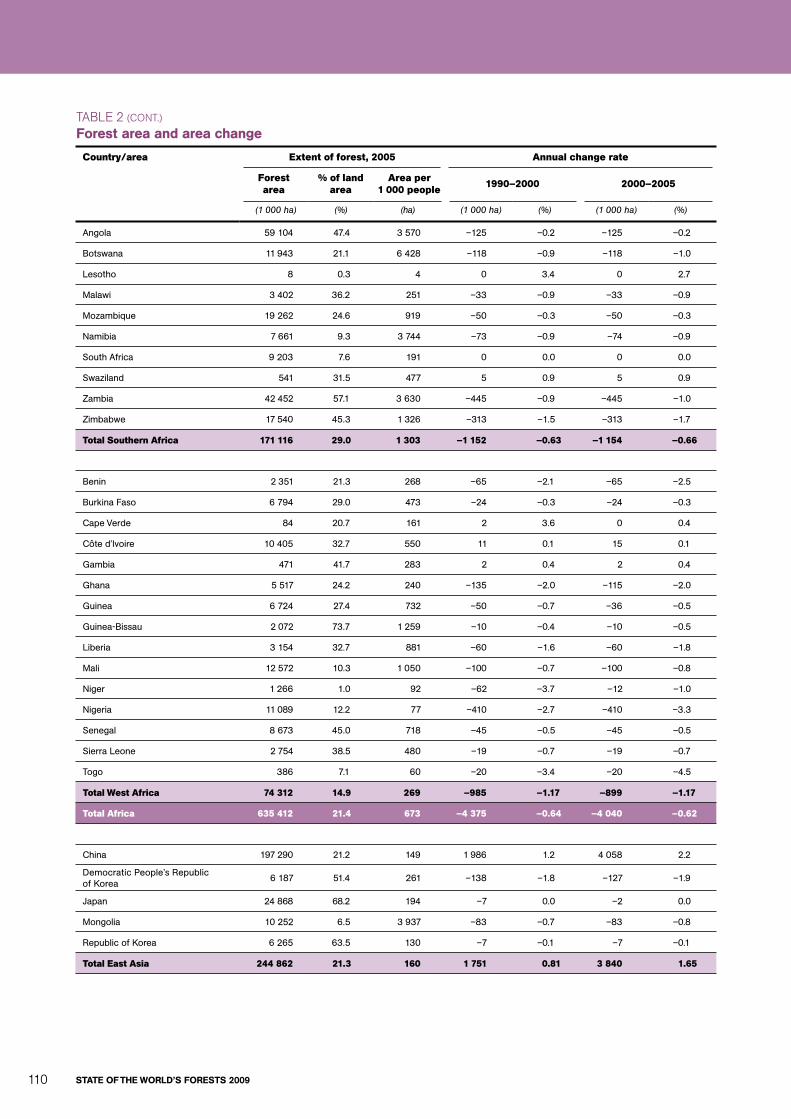
stAte oF the World’s Forests 2009110
taBle 2 (cont.)
Forest area and area change
country/area extent of forest, 2005 Annual change rate
Forest area
% of land area
Area per 1 000 people 1990–2000 2000–2005
(1 000 ha) (%) (ha) (1 000 ha) (%) (1 000 ha) (%)
Angola 59 104 47.4 3 570 –125 –0.2 –125 –0.2
Botswana 11 943 21.1 6 428 –118 –0.9 –118 –1.0
Lesotho 8 0.3 4 0 3.4 0 2.7
Malawi 3 402 36.2 251 –33 –0.9 –33 –0.9
Mozambique 19 262 24.6 919 –50 –0.3 –50 –0.3
Namibia 7 661 9.3 3 744 –73 –0.9 –74 –0.9
South Africa 9 203 7.6 191 0 0.0 0 0.0
Swaziland 541 31.5 477 5 0.9 5 0.9
Zambia 42 452 57.1 3 630 –445 –0.9 –445 –1.0
Zimbabwe 17 540 45.3 1 326 –313 –1.5 –313 –1.7
total Southern Africa 171 116 29.0 1 303 –1 152 –0.63 –1 154 –0.66
Benin 2 351 21.3 268 –65 –2.1 –65 –2.5
Burkina Faso 6 794 29.0 473 –24 –0.3 –24 –0.3
Cape Verde 84 20.7 161 2 3.6 0 0.4
Côte d’Ivoire 10 405 32.7 550 11 0.1 15 0.1
Gambia 471 41.7 283 2 0.4 2 0.4
Ghana 5 517 24.2 240 –135 –2.0 –115 –2.0
Guinea 6 724 27.4 732 –50 –0.7 –36 –0.5
Guinea-Bissau 2 072 73.7 1 259 –10 –0.4 –10 –0.5
Liberia 3 154 32.7 881 –60 –1.6 –60 –1.8
Mali 12 572 10.3 1 050 –100 –0.7 –100 –0.8
Niger 1 266 1.0 92 –62 –3.7 –12 –1.0
Nigeria 11 089 12.2 77 –410 –2.7 –410 –3.3
Senegal 8 673 45.0 718 –45 –0.5 –45 –0.5
Sierra Leone 2 754 38.5 480 –19 –0.7 –19 –0.7
Togo 386 7.1 60 –20 –3.4 –20 –4.5
total West Africa 74 312 14.9 269 –985 –1.17 –899 –1.17
total Africa 635 412 21.4 673 –4 375 –0.64 –4 040 –0.62
China 197 290 21.2 149 1 986 1.2 4 058 2.2
Democratic People’s Republic of Korea
6 187 51.4 261 –138 –1.8 –127 –1.9
Japan 24 868 68.2 194 –7 0.0 –2 0.0
Mongolia 10 252 6.5 3 937 –83 –0.7 –83 –0.8
Republic of Korea 6 265 63.5 130 –7 –0.1 –7 –0.1
total east Asia 244 862 21.3 160 1 751 0.81 3 840 1.65
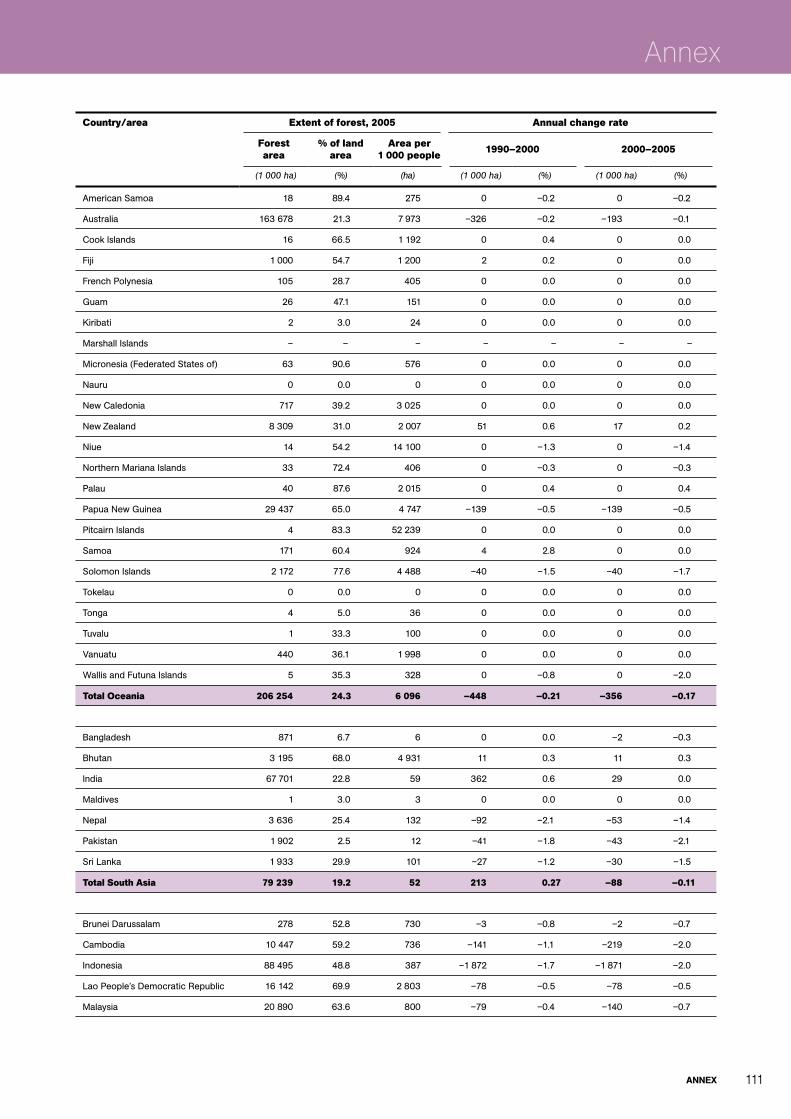
Annex 111
Annex
country/area extent of forest, 2005 Annual change rate
Forest area
% of land area
Area per 1 000 people 1990–2000 2000–2005
(1 000 ha) (%) (ha) (1 000 ha) (%) (1 000 ha) (%)
American Samoa 18 89.4 275 0 –0.2 0 –0.2
Australia 163 678 21.3 7 973 –326 –0.2 –193 –0.1
Cook Islands 16 66.5 1 192 0 0.4 0 0.0
Fiji 1 000 54.7 1 200 2 0.2 0 0.0
French Polynesia 105 28.7 405 0 0.0 0 0.0
Guam 26 47.1 151 0 0.0 0 0.0
Kiribati 2 3.0 24 0 0.0 0 0.0
Marshall Islands – – – – – – –
Micronesia (Federated States of) 63 90.6 576 0 0.0 0 0.0
Nauru 0 0.0 0 0 0.0 0 0.0
New Caledonia 717 39.2 3 025 0 0.0 0 0.0
New Zealand 8 309 31.0 2 007 51 0.6 17 0.2
Niue 14 54.2 14 100 0 –1.3 0 –1.4
Northern Mariana Islands 33 72.4 406 0 –0.3 0 –0.3
Palau 40 87.6 2 015 0 0.4 0 0.4
Papua New Guinea 29 437 65.0 4 747 –139 –0.5 –139 –0.5
Pitcairn Islands 4 83.3 52 239 0 0.0 0 0.0
Samoa 171 60.4 924 4 2.8 0 0.0
Solomon Islands 2 172 77.6 4 488 –40 –1.5 –40 –1.7
Tokelau 0 0.0 0 0 0.0 0 0.0
Tonga 4 5.0 36 0 0.0 0 0.0
Tuvalu 1 33.3 100 0 0.0 0 0.0
Vanuatu 440 36.1 1 998 0 0.0 0 0.0
Wallis and Futuna Islands 5 35.3 328 0 –0.8 0 –2.0
total oceania 206 254 24.3 6 096 –448 –0.21 –356 –0.17
Bangladesh 871 6.7 6 0 0.0 –2 –0.3
Bhutan 3 195 68.0 4 931 11 0.3 11 0.3
India 67 701 22.8 59 362 0.6 29 0.0
Maldives 1 3.0 3 0 0.0 0 0.0
Nepal 3 636 25.4 132 –92 –2.1 –53 –1.4
Pakistan 1 902 2.5 12 –41 –1.8 –43 –2.1
Sri Lanka 1 933 29.9 101 –27 –1.2 –30 –1.5
total South Asia 79 239 19.2 52 213 0.27 –88 –0.11
Brunei Darussalam 278 52.8 730 –3 –0.8 –2 –0.7
Cambodia 10 447 59.2 736 –141 –1.1 –219 –2.0
Indonesia 88 495 48.8 387 –1 872 –1.7 –1 871 –2.0
Lao People’s Democratic Republic 16 142 69.9 2 803 –78 –0.5 –78 –0.5
Malaysia 20 890 63.6 800 –79 –0.4 –140 –0.7
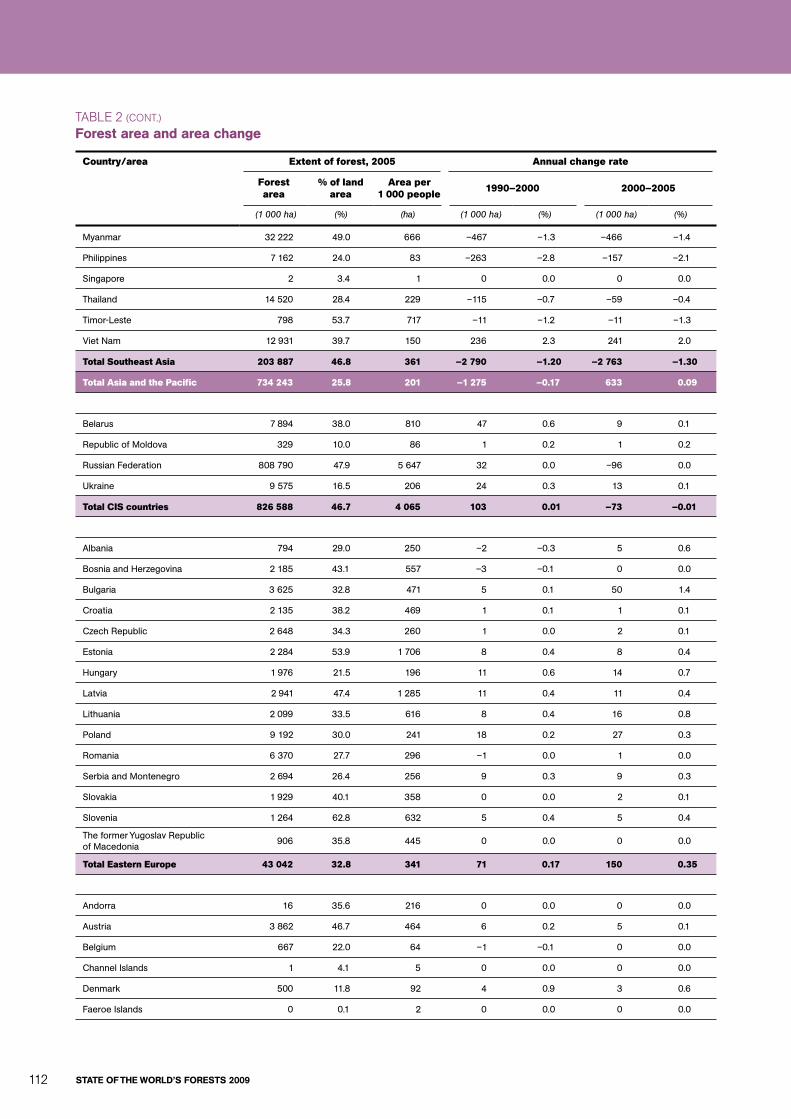
stAte oF the World’s Forests 2009112
taBle 2 (cont.)
Forest area and area change
country/area extent of forest, 2005 Annual change rate
Forest area
% of land area
Area per 1 000 people 1990–2000 2000–2005
(1 000 ha) (%) (ha) (1 000 ha) (%) (1 000 ha) (%)
Myanmar 32 222 49.0 666 –467 –1.3 –466 –1.4
Philippines 7 162 24.0 83 –263 –2.8 –157 –2.1
Singapore 2 3.4 1 0 0.0 0 0.0
Thailand 14 520 28.4 229 –115 –0.7 –59 –0.4
Timor-Leste 798 53.7 717 –11 –1.2 –11 –1.3
Viet Nam 12 931 39.7 150 236 2.3 241 2.0
total Southeast Asia 203 887 46.8 361 –2 790 –1.20 –2 763 –1.30
total Asia and the Pacific 734 243 25.8 201 –1 275 –0.17 633 0.09
Belarus 7 894 38.0 810 47 0.6 9 0.1
Republic of Moldova 329 10.0 86 1 0.2 1 0.2
Russian Federation 808 790 47.9 5 647 32 0.0 –96 0.0
Ukraine 9 575 16.5 206 24 0.3 13 0.1
total ciS countries 826 588 46.7 4 065 103 0.01 –73 –0.01
Albania 794 29.0 250 –2 –0.3 5 0.6
Bosnia and Herzegovina 2 185 43.1 557 –3 –0.1 0 0.0
Bulgaria 3 625 32.8 471 5 0.1 50 1.4
Croatia 2 135 38.2 469 1 0.1 1 0.1
Czech Republic 2 648 34.3 260 1 0.0 2 0.1
Estonia 2 284 53.9 1 706 8 0.4 8 0.4
Hungary 1 976 21.5 196 11 0.6 14 0.7
Latvia 2 941 47.4 1 285 11 0.4 11 0.4
Lithuania 2 099 33.5 616 8 0.4 16 0.8
Poland 9 192 30.0 241 18 0.2 27 0.3
Romania 6 370 27.7 296 –1 0.0 1 0.0
Serbia and Montenegro 2 694 26.4 256 9 0.3 9 0.3
Slovakia 1 929 40.1 358 0 0.0 2 0.1
Slovenia 1 264 62.8 632 5 0.4 5 0.4
The former Yugoslav Republic of Macedonia
906 35.8 445 0 0.0 0 0.0
total eastern europe 43 042 32.8 341 71 0.17 150 0.35
Andorra 16 35.6 216 0 0.0 0 0.0
Austria 3 862 46.7 464 6 0.2 5 0.1
Belgium 667 22.0 64 –1 –0.1 0 0.0
Channel Islands 1 4.1 5 0 0.0 0 0.0
Denmark 500 11.8 92 4 0.9 3 0.6
Faeroe Islands 0 0.1 2 0 0.0 0 0.0

Annex 113
Annex
country/area extent of forest, 2005 Annual change rate
Forest area
% of land area
Area per 1 000 people 1990–2000 2000–2005
(1 000 ha) (%) (ha) (1 000 ha) (%) (1 000 ha) (%)
Finland 22 500 73.9 4 277 28 0.1 5 0.0
France 15 554 28.3 254 81 0.5 41 0.3
Germany 11 076 31.7 134 34 0.3 0 0.0
Gibraltar 0 0.0 0 0 0.0 0 0.0
Greece 3 752 29.1 337 30 0.9 30 0.8
Holy See 0 0.0 0 0 0.0 0 0.0
Iceland 46 0.0 154 1 4.3 2 3.9
Ireland 669 9.7 158 17 3.3 12 1.9
Isle of Man 3 6.1 44 0 0.0 0 0.0
Italy 9 979 33.9 170 106 1.2 106 1.1
Liechtenstein 7 43.1 203 0 0.6 0 0.0
Luxembourg 87 33.5 188 0 0.1 0 0.0
Malta 0 1.1 1 0 0.0 0 0.0
Monaco 0 0.0 0 0 0.0 0 0.0
Netherlands 365 10.8 22 2 0.4 1 0.3
Norway 9 387 30.7 2 011 17 0.2 17 0.2
Portugal 3 783 41.3 358 48 1.5 40 1.1
San Marino 0 1.6 3 0 0.0 0 0.0
Spain 17 915 35.9 408 296 2.0 296 1.7
Sweden 27 528 66.9 3 032 11 0.0 11 0.0
Switzerland 1 221 30.9 164 4 0.4 4 0.4
United Kingdom 2 845 11.8 47 18 0.7 10 0.4
total Western europe 131 763 36.8 328 703 0.56 583 0.45
total europe 1 001 394 44.3 1 369 877 0.09 661 0.07
Anguilla 6 71.4 458 0 0.0 0 0.0
Antigua and Barbuda 9 21.4 112 0 0.0 0 0.0
Aruba 0 2.2 4 0 0.0 0 0.0
Bahamas 515 51.5 1 575 0 0.0 0 0.0
Barbados 2 4.0 6 0 0.0 0 0.0
Bermuda 1 20.0 16 0 0.0 0 0.0
British Virgin Islands 4 24.4 166 0 –0.1 0 –0.1
Cayman Islands 12 48.4 270 0 0.0 0 0.0
Cuba 2 713 24.7 241 38 1.7 56 2.2
Dominica 46 61.3 686 0 –0.5 0 –0.6
Dominican Republic 1 376 28.4 143 0 0.0 0 0.0
Grenada 4 12.2 39 0 0.0 0 0.0
Guadeloupe 80 47.2 181 0 –0.3 0 –0.3
Haiti 105 3.8 11 –1 –0.6 –1 –0.7
Jamaica 339 31.3 126 0 –0.1 0 –0.1
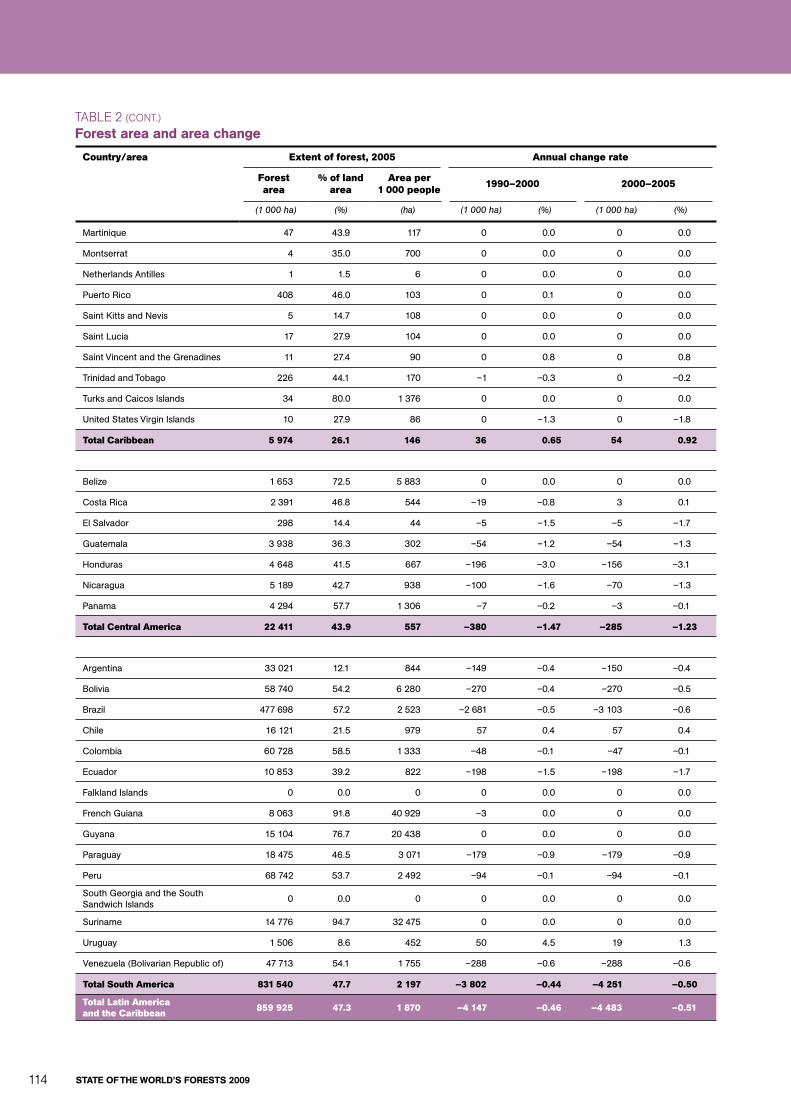
stAte oF the World’s Forests 2009114
taBle 2 (cont.)
Forest area and area change
country/area extent of forest, 2005 Annual change rate
Forest area
% of land area
Area per 1 000 people 1990–2000 2000–2005
(1 000 ha) (%) (ha) (1 000 ha) (%) (1 000 ha) (%)
Martinique 47 43.9 117 0 0.0 0 0.0
Montserrat 4 35.0 700 0 0.0 0 0.0
Netherlands Antilles 1 1.5 6 0 0.0 0 0.0
Puerto Rico 408 46.0 103 0 0.1 0 0.0
Saint Kitts and Nevis 5 14.7 108 0 0.0 0 0.0
Saint Lucia 17 27.9 104 0 0.0 0 0.0
Saint Vincent and the Grenadines 11 27.4 90 0 0.8 0 0.8
Trinidad and Tobago 226 44.1 170 –1 –0.3 0 –0.2
Turks and Caicos Islands 34 80.0 1 376 0 0.0 0 0.0
United States Virgin Islands 10 27.9 86 0 –1.3 0 –1.8
total caribbean 5 974 26.1 146 36 0.65 54 0.92
Belize 1 653 72.5 5 883 0 0.0 0 0.0
Costa Rica 2 391 46.8 544 –19 –0.8 3 0.1
El Salvador 298 14.4 44 –5 –1.5 –5 –1.7
Guatemala 3 938 36.3 302 –54 –1.2 –54 –1.3
Honduras 4 648 41.5 667 –196 –3.0 –156 –3.1
Nicaragua 5 189 42.7 938 –100 –1.6 –70 –1.3
Panama 4 294 57.7 1 306 –7 –0.2 –3 –0.1
total central America 22 411 43.9 557 –380 –1.47 –285 –1.23
Argentina 33 021 12.1 844 –149 –0.4 –150 –0.4
Bolivia 58 740 54.2 6 280 –270 –0.4 –270 –0.5
Brazil 477 698 57.2 2 523 –2 681 –0.5 –3 103 –0.6
Chile 16 121 21.5 979 57 0.4 57 0.4
Colombia 60 728 58.5 1 333 –48 –0.1 –47 –0.1
Ecuador 10 853 39.2 822 –198 –1.5 –198 –1.7
Falkland Islands 0 0.0 0 0 0.0 0 0.0
French Guiana 8 063 91.8 40 929 –3 0.0 0 0.0
Guyana 15 104 76.7 20 438 0 0.0 0 0.0
Paraguay 18 475 46.5 3 071 –179 –0.9 –179 –0.9
Peru 68 742 53.7 2 492 –94 –0.1 –94 –0.1
South Georgia and the South Sandwich Islands
0 0.0 0 0 0.0 0 0.0
Suriname 14 776 94.7 32 475 0 0.0 0 0.0
Uruguay 1 506 8.6 452 50 4.5 19 1.3
Venezuela (Bolivarian Republic of) 47 713 54.1 1 755 –288 –0.6 –288 –0.6
total South America 831 540 47.7 2 197 –3 802 –0.44 –4 251 –0.50
total Latin America and the caribbean 859 925 47.3 1 870 –4 147 –0.46 –4 483 –0.51
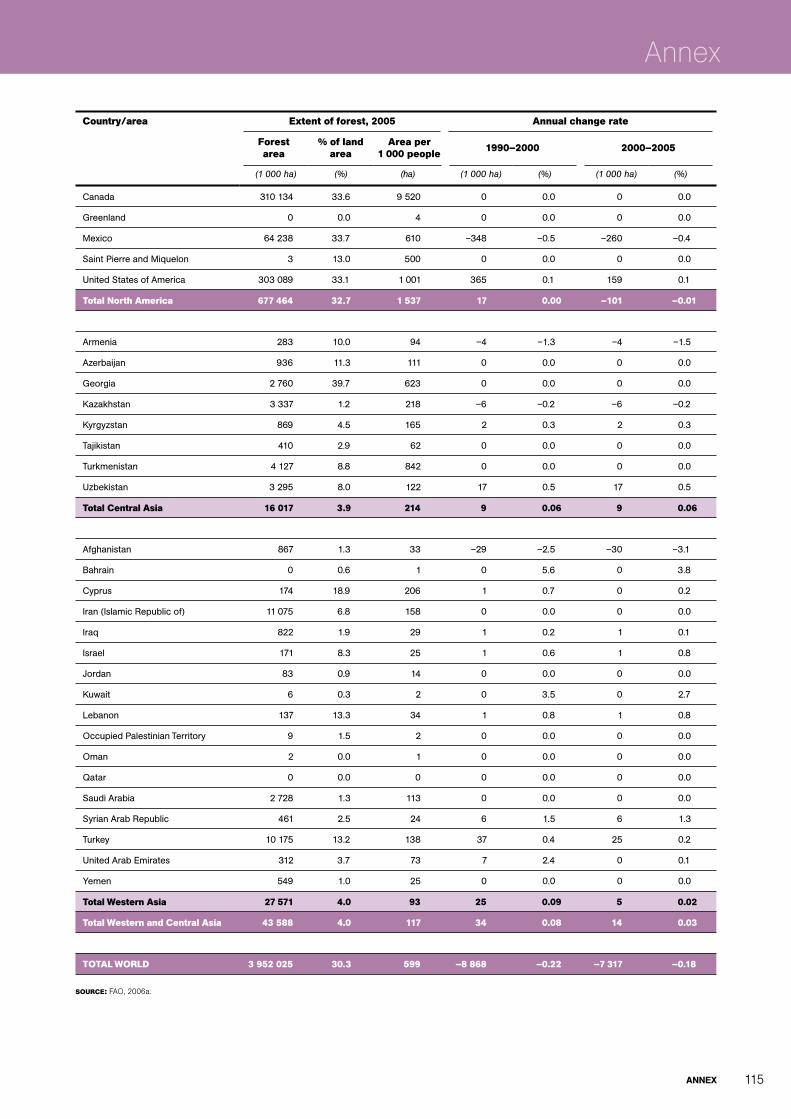
Annex 115
Annex
Source: fao, 2006a.
country/area extent of forest, 2005 Annual change rate
Forest area
% of land area
Area per 1 000 people 1990–2000 2000–2005
(1 000 ha) (%) (ha) (1 000 ha) (%) (1 000 ha) (%)
Canada 310 134 33.6 9 520 0 0.0 0 0.0
Greenland 0 0.0 4 0 0.0 0 0.0
Mexico 64 238 33.7 610 –348 –0.5 –260 –0.4
Saint Pierre and Miquelon 3 13.0 500 0 0.0 0 0.0
United States of America 303 089 33.1 1 001 365 0.1 159 0.1
total North America 677 464 32.7 1 537 17 0.00 –101 –0.01
Armenia 283 10.0 94 –4 –1.3 –4 –1.5
Azerbaijan 936 11.3 111 0 0.0 0 0.0
Georgia 2 760 39.7 623 0 0.0 0 0.0
Kazakhstan 3 337 1.2 218 –6 –0.2 –6 –0.2
Kyrgyzstan 869 4.5 165 2 0.3 2 0.3
Tajikistan 410 2.9 62 0 0.0 0 0.0
Turkmenistan 4 127 8.8 842 0 0.0 0 0.0
Uzbekistan 3 295 8.0 122 17 0.5 17 0.5
total central Asia 16 017 3.9 214 9 0.06 9 0.06
Afghanistan 867 1.3 33 –29 –2.5 –30 –3.1
Bahrain 0 0.6 1 0 5.6 0 3.8
Cyprus 174 18.9 206 1 0.7 0 0.2
Iran (Islamic Republic of) 11 075 6.8 158 0 0.0 0 0.0
Iraq 822 1.9 29 1 0.2 1 0.1
Israel 171 8.3 25 1 0.6 1 0.8
Jordan 83 0.9 14 0 0.0 0 0.0
Kuwait 6 0.3 2 0 3.5 0 2.7
Lebanon 137 13.3 34 1 0.8 1 0.8
Occupied Palestinian Territory 9 1.5 2 0 0.0 0 0.0
Oman 2 0.0 1 0 0.0 0 0.0
Qatar 0 0.0 0 0 0.0 0 0.0
Saudi Arabia 2 728 1.3 113 0 0.0 0 0.0
Syrian Arab Republic 461 2.5 24 6 1.5 6 1.3
Turkey 10 175 13.2 138 37 0.4 25 0.2
United Arab Emirates 312 3.7 73 7 2.4 0 0.1
Yemen 549 1.0 25 0 0.0 0 0.0
total Western Asia 27 571 4.0 93 25 0.09 5 0.02
total Western and central Asia 43 588 4.0 117 34 0.08 14 0.03
totAL WorLD 3 952 025 30.3 599 –8 868 –0.22 –7 317 –0.18

stAte oF the World’s Forests 2009116
taBle 3 Forest growing stock, biomass and carbon
country/area growing stock Biomass carbon in biomass
Per hectare total commercial Per hectare total Per hectare total
(m3/ha) (million m³) (%) (tonnes/ha) (million tonnes) (tonnes/ha) (million tonnes)
Burundi – – – – – – –
Cameroon 62 1 313 10 179 3 804 90 1 902
Central African Republic 167 3 801 – 246 5 604 123 2 801
Chad 18 218 38 40 471 20 236
Congo 203 4 551 30 461 10 361 231 5 181
Democratic Republic of the Congo 231 30 833 – 347 46 346 173 23 173
Equatorial Guinea 66 107 – 142 231 70 115
Gabon 223 4 845 – 335 7 285 167 3 643
Rwanda 183 88 95 183 88 92 44
Saint Helena – – – – – – –
Sao Tome and Principe 164 5 100 336 9 168 5
total central Africa 194 45 760 315 74 199 157 37 100
British Indian Ocean Territory – – – – – – –
Comoros 247 1 27 284 2 141 1
Djibouti 32 0 – 156 1 78 0
Eritrea – – – – – – –
Ethiopia 22 285 25 39 503 19 252
Kenya 80 281 11 190 669 95 335
Madagascar 171 2 201 28 488 6 259 244 3 130
Mauritius 82 3 68 212 8 106 4
Mayotte – – – – – – –
Réunion – – – – – – –
Seychelles 75 3 12 175 7 93 4
Somalia 22 157 0 108 773 54 387
Uganda 43 156 15 76 276 38 138
United Republic of Tanzania 36 1 264 73 128 4 509 64 2 254
total east Africa 58 4 351 172 13 007 86 6 504
Algeria 76 174 22 100 227 50 114
Egypt 120 8 – 212 14 106 7
Libyan Arab Jamahiriya 36 8 – 59 13 30 6
Mauritania 20 5 – 50 13 25 7
Morocco 44 191 100 110 480 55 240
Sudan 14 939 – 45 3 061 23 1 531
Tunisia 26 27 2 19 20 9 10
Western Sahara 38 38 – 50 50 25 25
total Northern Africa 18 1 390 51 3 879 25 1 940

Annex 117
Annex
country/area growing stock Biomass carbon in biomass
Per hectare total commercial Per hectare total Per hectare total
(m3/ha) (million m³) (%) (tonnes/ha) (million tonnes) (tonnes/ha) (million tonnes)
Angola 39 2 291 1 163 9 659 82 4 829
Botswana 16 197 – 24 283 12 142
Lesotho – – – – – – –
Malawi 110 373 – 95 322 47 161
Mozambique 26 496 14 63 1 213 31 606
Namibia 24 184 – 60 462 30 231
South Africa 69 635 38 179 1 648 90 824
Swaziland 35 19 – 87 47 43 23
Zambia 31 1 307 7 54 2 312 27 1 156
Zimbabwe 34 600 4 61 1 069 31 535
total Southern Africa 36 6 102 99 17 014 50 8 507
Benin – – – – – – –
Burkina Faso 35 238 5 88 596 44 298
Cape Verde 144 12 80 189 16 95 8
Côte d’Ivoire 258 2 683 20 386 4 014 179 1 864
Gambia 37 18 – 141 66 70 33
Ghana 58 321 53 180 993 90 496
Guinea 77 520 – 189 1 272 95 636
Guinea-Bissau 24 50 20 59 122 29 61
Liberia 158 498 41 287 906 144 453
Mali 15 191 – 39 484 19 242
Niger 10 13 8 20 25 10 13
Nigeria 125 1 386 11 253 2 803 126 1 402
Senegal 37 324 63 85 741 43 371
Sierra Leone – – – – – – –
Togo – – – – – – –
total West Africa 91 6 254 175 12 038 85 5 876
total Africa 102 63 858 191 120 137 95 59 927
China 67 13 255 92 62 12 191 31 6 096
Democratic People’s Republic of Korea
64 395 – 75 464 38 232
Japan 171 4 249 – 152 3 785 76 1 892
Mongolia 131 1 342 46 112 1 148 56 574
Republic of Korea 80 502 54 82 515 41 258
total east Asia 81 19 743 74 18 103 37 9 052
American Samoa 104 2 – 219 4 110 2
Australia – – – 113 18 510 51 8 339
Cook Islands – – – – – – –
Fiji – – – – – – –

stAte oF the World’s Forests 2009118
taBle 3 (cont.)
Forest growing stock, biomass and carbon
country/area growing stock Biomass carbon in biomass
Per hectare total commercial Per hectare total Per hectare total
(m3/ha) (million m³) (%) (tonnes/ha) (million tonnes) (tonnes/ha) (million tonnes)
French Polynesia – – – – – – –
Guam – – – – – – –
Kiribati – – – – – – –
Marshall Islands – – – – – – –
Micronesia (Federated States of) – – – – – – –
Nauru – – – – – – –
New Caledonia 55 40 58 204 147 102 73
New Zealand – – – – – – –
Niue – – – – – – –
Northern Mariana Islands – – – – – – –
Palau – – – – – – –
Papua New Guinea 35 1 035 51 – – – –
Pitcairn Islands – – – – – – –
Samoa – – – – – – –
Solomon Islands – – – – – – –
Tokelau – – – – – – –
Tonga – – – – – – –
Tuvalu – – – – – – –
Vanuatu – – – – – – –
Wallis and Futuna Islands – – – – – – –
total oceania 36 1 077 113 18 661 51 8 414
Bangladesh 34 30 75 72 63 36 31
Bhutan 194 621 40 216 690 108 345
India 69 4 698 40 76 5 178 35 2 343
Maldives – – – – – – –
Nepal 178 647 40 267 969 133 485
Pakistan 97 185 43 271 516 136 259
Sri Lanka 22 42 40 41 79 21 40
total South Asia 79 6 223 95 7 495 44 3 503
Brunei Darussalam 219 61 40 283 79 141 39
Cambodia 96 998 40 242 2 532 121 1 266
Indonesia 59 5 216 – 133 11 793 67 5 897
Lao People’s Democratic Republic 59 957 74 184 2 974 92 1 487
Malaysia 251 5 242 – 336 7 020 168 3 510
Myanmar 85 2 740 18 197 6 335 98 3 168
Philippines 174 1 248 4 271 1 942 136 971
Singapore – – – – – – –
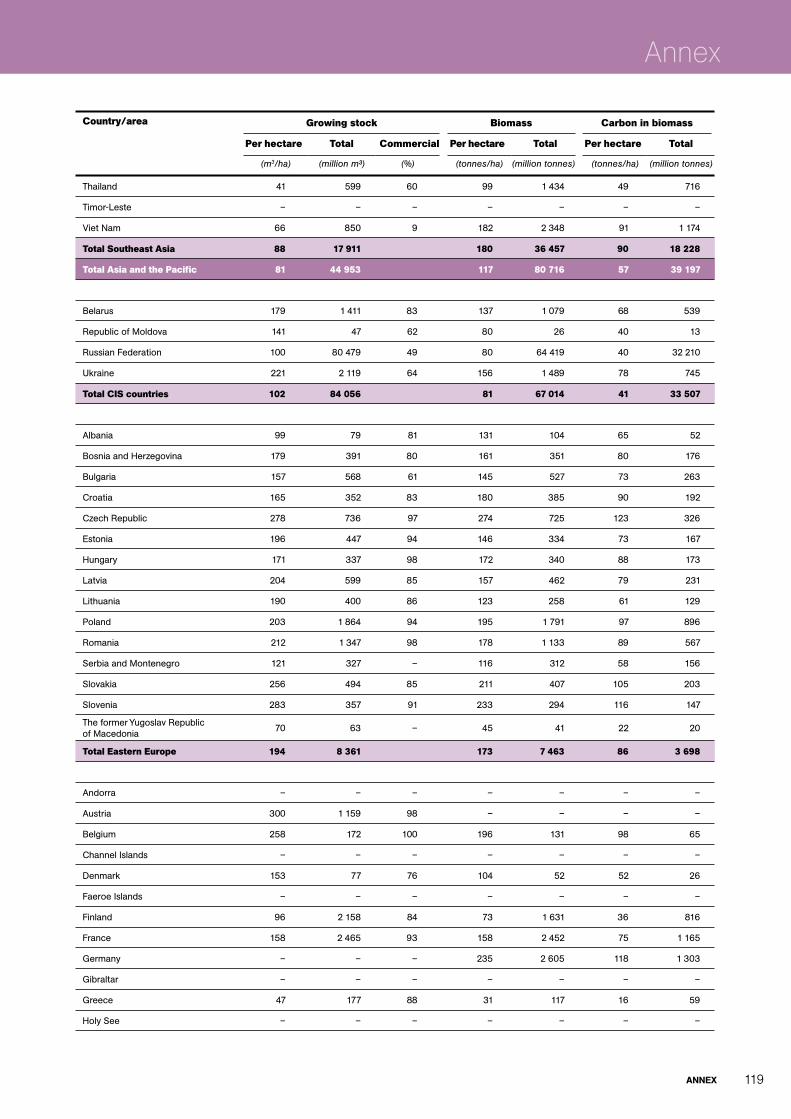
Annex 119
Annex
country/area growing stock Biomass carbon in biomass
Per hectare total commercial Per hectare total Per hectare total
(m3/ha) (million m³) (%) (tonnes/ha) (million tonnes) (tonnes/ha) (million tonnes)
Thailand 41 599 60 99 1 434 49 716
Timor-Leste – – – – – – –
Viet Nam 66 850 9 182 2 348 91 1 174
total Southeast Asia 88 17 911 180 36 457 90 18 228
total Asia and the Pacific 81 44 953 117 80 716 57 39 197
Belarus 179 1 411 83 137 1 079 68 539
Republic of Moldova 141 47 62 80 26 40 13
Russian Federation 100 80 479 49 80 64 419 40 32 210
Ukraine 221 2 119 64 156 1 489 78 745
total ciS countries 102 84 056 81 67 014 41 33 507
Albania 99 79 81 131 104 65 52
Bosnia and Herzegovina 179 391 80 161 351 80 176
Bulgaria 157 568 61 145 527 73 263
Croatia 165 352 83 180 385 90 192
Czech Republic 278 736 97 274 725 123 326
Estonia 196 447 94 146 334 73 167
Hungary 171 337 98 172 340 88 173
Latvia 204 599 85 157 462 79 231
Lithuania 190 400 86 123 258 61 129
Poland 203 1 864 94 195 1 791 97 896
Romania 212 1 347 98 178 1 133 89 567
Serbia and Montenegro 121 327 – 116 312 58 156
Slovakia 256 494 85 211 407 105 203
Slovenia 283 357 91 233 294 116 147
The former Yugoslav Republic of Macedonia
70 63 – 45 41 22 20
total eastern europe 194 8 361 173 7 463 86 3 698
Andorra – – – – – – –
Austria 300 1 159 98 – – – –
Belgium 258 172 100 196 131 98 65
Channel Islands – – – – – – –
Denmark 153 77 76 104 52 52 26
Faeroe Islands – – – – – – –
Finland 96 2 158 84 73 1 631 36 816
France 158 2 465 93 158 2 452 75 1 165
Germany – – – 235 2 605 118 1 303
Gibraltar – – – – – – –
Greece 47 177 88 31 117 16 59
Holy See – – – – – – –
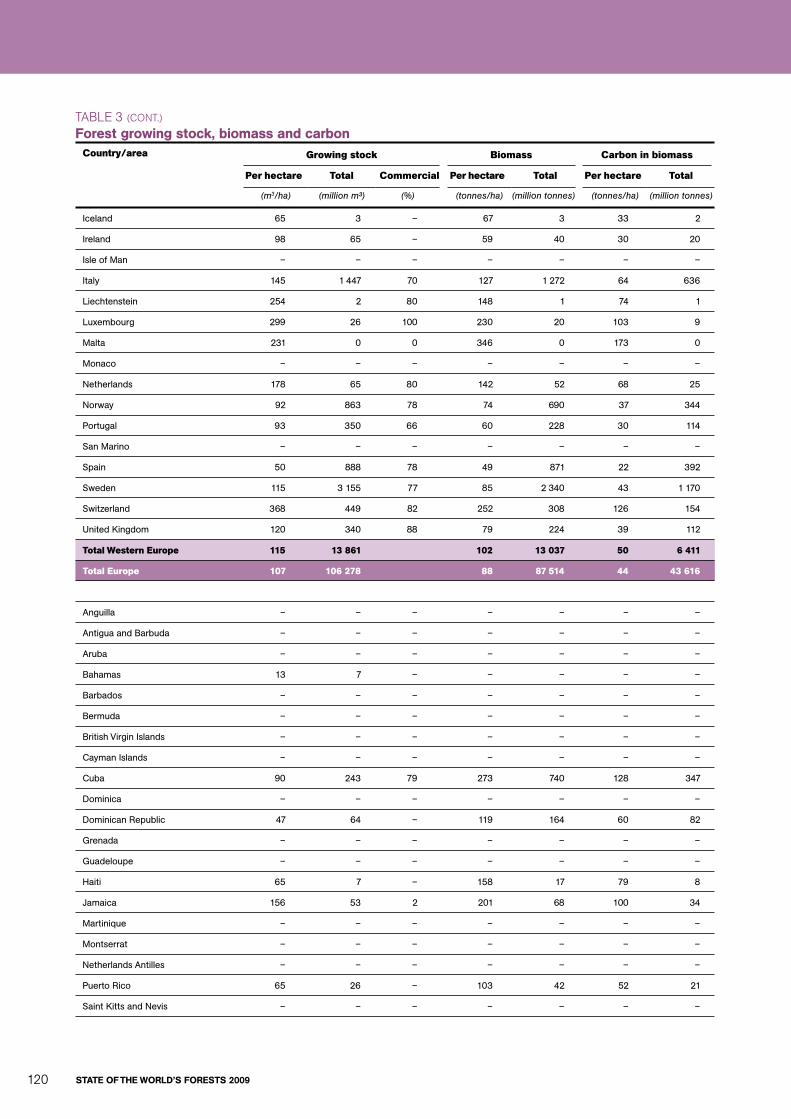
stAte oF the World’s Forests 2009120
taBle 3 (cont.) Forest growing stock, biomass and carbon
country/area growing stock Biomass carbon in biomass
Per hectare total commercial Per hectare total Per hectare total
(m3/ha) (million m³) (%) (tonnes/ha) (million tonnes) (tonnes/ha) (million tonnes)
Iceland 65 3 – 67 3 33 2
Ireland 98 65 – 59 40 30 20
Isle of Man – – – – – – –
Italy 145 1 447 70 127 1 272 64 636
Liechtenstein 254 2 80 148 1 74 1
Luxembourg 299 26 100 230 20 103 9
Malta 231 0 0 346 0 173 0
Monaco – – – – – – –
Netherlands 178 65 80 142 52 68 25
Norway 92 863 78 74 690 37 344
Portugal 93 350 66 60 228 30 114
San Marino – – – – – – –
Spain 50 888 78 49 871 22 392
Sweden 115 3 155 77 85 2 340 43 1 170
Switzerland 368 449 82 252 308 126 154
United Kingdom 120 340 88 79 224 39 112
total Western europe 115 13 861 102 13 037 50 6 411
total europe 107 106 278 88 87 514 44 43 616
Anguilla – – – – – – –
Antigua and Barbuda – – – – – – –
Aruba – – – – – – –
Bahamas 13 7 – – – – –
Barbados – – – – – – –
Bermuda – – – – – – –
British Virgin Islands – – – – – – –
Cayman Islands – – – – – – –
Cuba 90 243 79 273 740 128 347
Dominica – – – – – – –
Dominican Republic 47 64 – 119 164 60 82
Grenada – – – – – – –
Guadeloupe – – – – – – –
Haiti 65 7 – 158 17 79 8
Jamaica 156 53 2 201 68 100 34
Martinique – – – – – – –
Montserrat – – – – – – –
Netherlands Antilles – – – – – – –
Puerto Rico 65 26 – 103 42 52 21
Saint Kitts and Nevis – – – – – – –

Annex 121
Annex
country/area growing stock Biomass carbon in biomass
Per hectare total commercial Per hectare total Per hectare total
(m3/ha) (million m³) (%) (tonnes/ha) (million tonnes) (tonnes/ha) (million tonnes)
Saint Lucia – – – – – – –
Saint Vincent and the Grenadines – – – – – – –
Trinidad and Tobago 88 20 55 209 47 104 24
Turks and Caicos Islands – – – – – – –
United States Virgin Islands 15 0 – 57 1 28 0
total caribbean 74 420 208 1 078 100 516
Belize 96 159 – 72 118 36 59
Costa Rica 104 249 66 161 385 81 193
El Salvador – – – – – – –
Guatemala 163 642 15 253 996 126 498
Honduras 116 540 – – – – –
Nicaragua 114 591 25 276 1 432 138 716
Panama 160 686 1 288 1 238 144 620
total central America 130 2 867 239 4 169 119 2 086
Argentina 55 1 826 67 146 4 817 73 2 411
Bolivia 74 4 360 16 180 10 568 90 5 296
Brazil 170 81 239 18 212 101 236 103 49 335
Chile 117 1 882 64 241 3 892 121 1 946
Colombia – – – 266 16 125 133 8 062
Ecuador – – – – – – –
Falkland Islands – – – – – – –
French Guiana 350 2 822 0 – – – –
Guyana – – – 228 3 443 114 1 722
Paraguay – – – – – – –
Peru – – – – – – –
South Georgia and the South Sandwich Islands
– – – – – – –
Suriname 150 2 216 – 770 11 383 385 5 692
Uruguay 79 118 6 – – – –
Venezuela (Bolivarian Republic of) – – – – – – –
total South America 155 94 464 224 151 464 110 74 464
total Latin America and the caribbean 153 97 751 224 156 711 110 77 066
Canada 106 32 983 100 – – – –
Greenland – – – – – – –
Mexico – – – – – – –
Saint Pierre and Miquelon – – – – – – –
United States of America 116 35 118 79 125 37 929 63 18 964
total North America 111 68 101 125 37 929 63 18 964
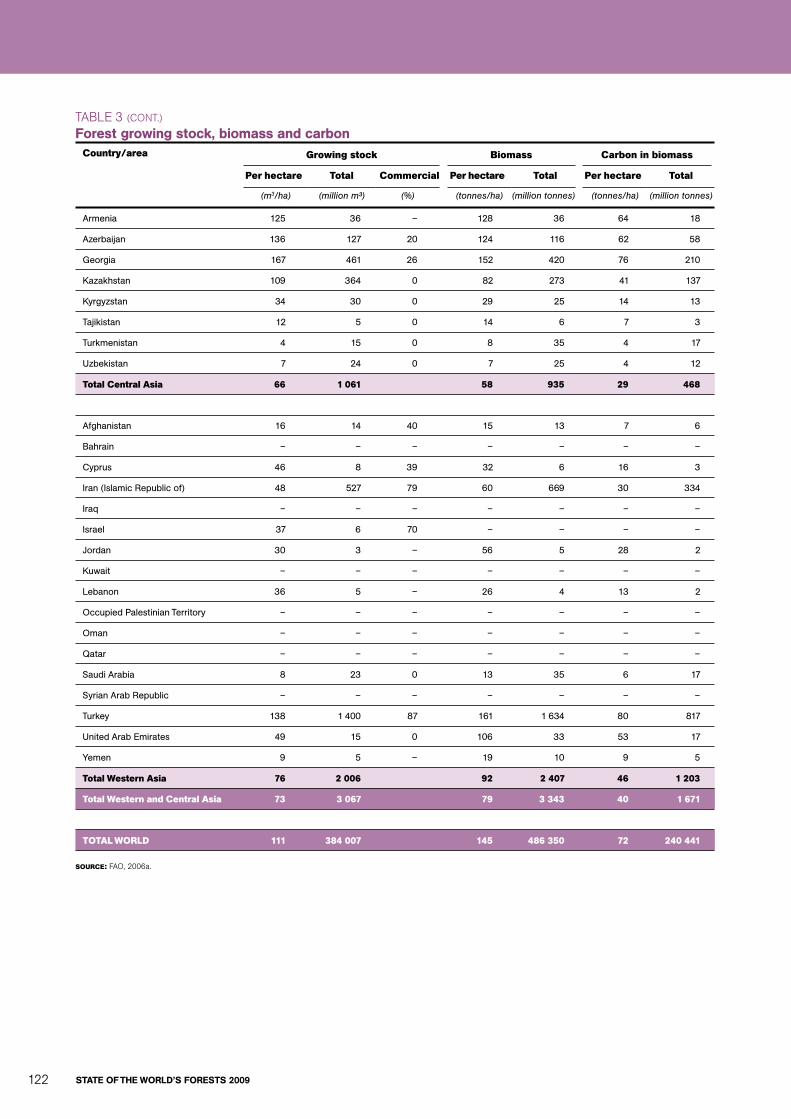
stAte oF the World’s Forests 2009122
taBle 3 (cont.)
Forest growing stock, biomass and carboncountry/area growing stock Biomass carbon in biomass
Per hectare total commercial Per hectare total Per hectare total
(m3/ha) (million m³) (%) (tonnes/ha) (million tonnes) (tonnes/ha) (million tonnes)
Armenia 125 36 – 128 36 64 18
Azerbaijan 136 127 20 124 116 62 58
Georgia 167 461 26 152 420 76 210
Kazakhstan 109 364 0 82 273 41 137
Kyrgyzstan 34 30 0 29 25 14 13
Tajikistan 12 5 0 14 6 7 3
Turkmenistan 4 15 0 8 35 4 17
Uzbekistan 7 24 0 7 25 4 12
total central Asia 66 1 061 58 935 29 468
Afghanistan 16 14 40 15 13 7 6
Bahrain – – – – – – –
Cyprus 46 8 39 32 6 16 3
Iran (Islamic Republic of) 48 527 79 60 669 30 334
Iraq – – – – – – –
Israel 37 6 70 – – – –
Jordan 30 3 – 56 5 28 2
Kuwait – – – – – – –
Lebanon 36 5 – 26 4 13 2
Occupied Palestinian Territory – – – – – – –
Oman – – – – – – –
Qatar – – – – – – –
Saudi Arabia 8 23 0 13 35 6 17
Syrian Arab Republic – – – – – – –
Turkey 138 1 400 87 161 1 634 80 817
United Arab Emirates 49 15 0 106 33 53 17
Yemen 9 5 – 19 10 9 5
total Western Asia 76 2 006 92 2 407 46 1 203
total Western and central Asia 73 3 067 79 3 343 40 1 671
totAL WorLD 111 384 007 145 486 350 72 240 441
Source: fao, 2006a.
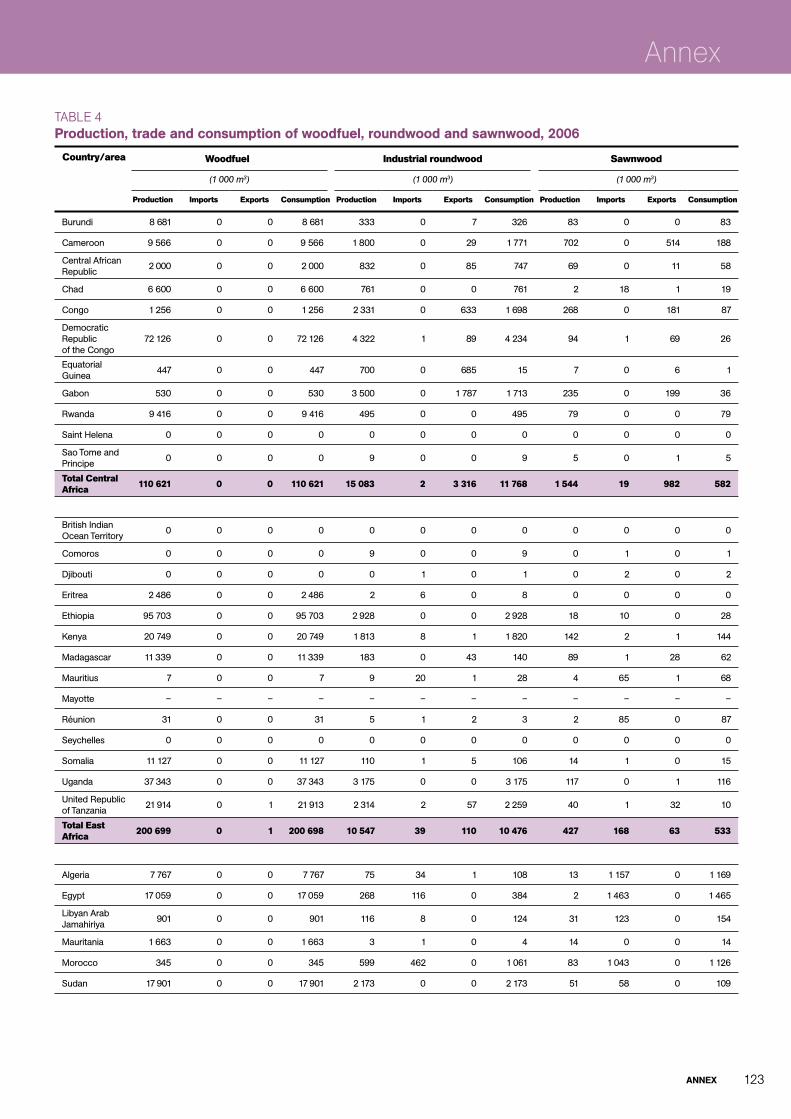
Annex 123
Annex
country/area Woodfuel industrial roundwood Sawnwood
(1 000 m3) (1 000 m3) (1 000 m3)
Production imports exports consumption Production imports exports consumption Production imports exports consumption
Burundi 8 681 0 0 8 681 333 0 7 326 83 0 0 83
Cameroon 9 566 0 0 9 566 1 800 0 29 1 771 702 0 514 188
Central African Republic
2 000 0 0 2 000 832 0 85 747 69 0 11 58
Chad 6 600 0 0 6 600 761 0 0 761 2 18 1 19
Congo 1 256 0 0 1 256 2 331 0 633 1 698 268 0 181 87
Democratic Republic of the Congo
72 126 0 0 72 126 4 322 1 89 4 234 94 1 69 26
Equatorial Guinea
447 0 0 447 700 0 685 15 7 0 6 1
Gabon 530 0 0 530 3 500 0 1 787 1 713 235 0 199 36
Rwanda 9 416 0 0 9 416 495 0 0 495 79 0 0 79
Saint Helena 0 0 0 0 0 0 0 0 0 0 0 0
Sao Tome and Principe
0 0 0 0 9 0 0 9 5 0 1 5
total central Africa 110 621 0 0 110 621 15 083 2 3 316 11 768 1 544 19 982 582
British Indian Ocean Territory
0 0 0 0 0 0 0 0 0 0 0 0
Comoros 0 0 0 0 9 0 0 9 0 1 0 1
Djibouti 0 0 0 0 0 1 0 1 0 2 0 2
Eritrea 2 486 0 0 2 486 2 6 0 8 0 0 0 0
Ethiopia 95 703 0 0 95 703 2 928 0 0 2 928 18 10 0 28
Kenya 20 749 0 0 20 749 1 813 8 1 1 820 142 2 1 144
Madagascar 11 339 0 0 11 339 183 0 43 140 89 1 28 62
Mauritius 7 0 0 7 9 20 1 28 4 65 1 68
Mayotte – – – – – – – – – – – –
Réunion 31 0 0 31 5 1 2 3 2 85 0 87
Seychelles 0 0 0 0 0 0 0 0 0 0 0 0
Somalia 11 127 0 0 11 127 110 1 5 106 14 1 0 15
Uganda 37 343 0 0 37 343 3 175 0 0 3 175 117 0 1 116
United Republic of Tanzania
21 914 0 1 21 913 2 314 2 57 2 259 40 1 32 10
total east Africa 200 699 0 1 200 698 10 547 39 110 10 476 427 168 63 533
Algeria 7 767 0 0 7 767 75 34 1 108 13 1 157 0 1 169
Egypt 17 059 0 0 17 059 268 116 0 384 2 1 463 0 1 465
Libyan Arab Jamahiriya
901 0 0 901 116 8 0 124 31 123 0 154
Mauritania 1 663 0 0 1 663 3 1 0 4 14 0 0 14
Morocco 345 0 0 345 599 462 0 1 061 83 1 043 0 1 126
Sudan 17 901 0 0 17 901 2 173 0 0 2 173 51 58 0 109
taBle 4 Production, trade and consumption of woodfuel, roundwood and sawnwood, 2006
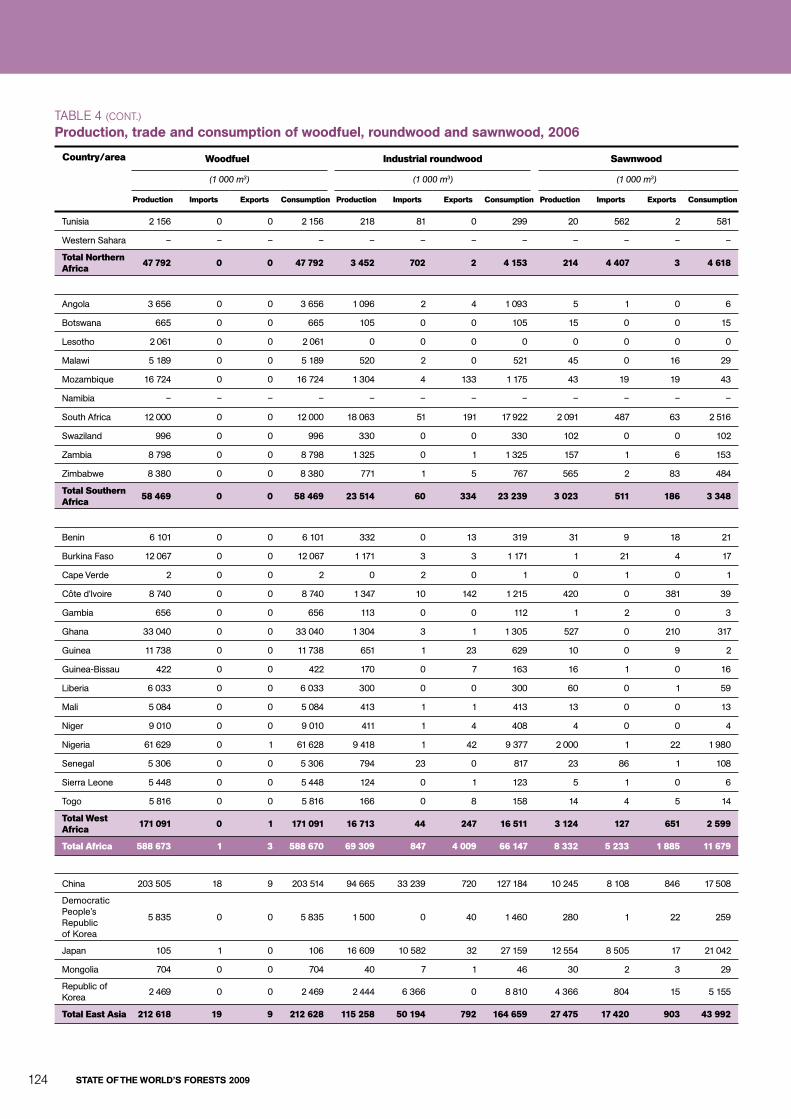
stAte oF the World’s Forests 2009124
country/area Woodfuel industrial roundwood Sawnwood
(1 000 m3) (1 000 m3) (1 000 m3)
Production imports exports consumption Production imports exports consumption Production imports exports consumption
Tunisia 2 156 0 0 2 156 218 81 0 299 20 562 2 581
Western Sahara – – – – – – – – – – – –
total Northern Africa 47 792 0 0 47 792 3 452 702 2 4 153 214 4 407 3 4 618
Angola 3 656 0 0 3 656 1 096 2 4 1 093 5 1 0 6
Botswana 665 0 0 665 105 0 0 105 15 0 0 15
Lesotho 2 061 0 0 2 061 0 0 0 0 0 0 0 0
Malawi 5 189 0 0 5 189 520 2 0 521 45 0 16 29
Mozambique 16 724 0 0 16 724 1 304 4 133 1 175 43 19 19 43
Namibia – – – – – – – – – – – –
South Africa 12 000 0 0 12 000 18 063 51 191 17 922 2 091 487 63 2 516
Swaziland 996 0 0 996 330 0 0 330 102 0 0 102
Zambia 8 798 0 0 8 798 1 325 0 1 1 325 157 1 6 153
Zimbabwe 8 380 0 0 8 380 771 1 5 767 565 2 83 484
total Southern Africa 58 469 0 0 58 469 23 514 60 334 23 239 3 023 511 186 3 348
Benin 6 101 0 0 6 101 332 0 13 319 31 9 18 21
Burkina Faso 12 067 0 0 12 067 1 171 3 3 1 171 1 21 4 17
Cape Verde 2 0 0 2 0 2 0 1 0 1 0 1
Côte d’Ivoire 8 740 0 0 8 740 1 347 10 142 1 215 420 0 381 39
Gambia 656 0 0 656 113 0 0 112 1 2 0 3
Ghana 33 040 0 0 33 040 1 304 3 1 1 305 527 0 210 317
Guinea 11 738 0 0 11 738 651 1 23 629 10 0 9 2
Guinea-Bissau 422 0 0 422 170 0 7 163 16 1 0 16
Liberia 6 033 0 0 6 033 300 0 0 300 60 0 1 59
Mali 5 084 0 0 5 084 413 1 1 413 13 0 0 13
Niger 9 010 0 0 9 010 411 1 4 408 4 0 0 4
Nigeria 61 629 0 1 61 628 9 418 1 42 9 377 2 000 1 22 1 980
Senegal 5 306 0 0 5 306 794 23 0 817 23 86 1 108
Sierra Leone 5 448 0 0 5 448 124 0 1 123 5 1 0 6
Togo 5 816 0 0 5 816 166 0 8 158 14 4 5 14
total West Africa 171 091 0 1 171 091 16 713 44 247 16 511 3 124 127 651 2 599
total Africa 588 673 1 3 588 670 69 309 847 4 009 66 147 8 332 5 233 1 885 11 679
China 203 505 18 9 203 514 94 665 33 239 720 127 184 10 245 8 108 846 17 508
Democratic People’s Republic of Korea
5 835 0 0 5 835 1 500 0 40 1 460 280 1 22 259
Japan 105 1 0 106 16 609 10 582 32 27 159 12 554 8 505 17 21 042
Mongolia 704 0 0 704 40 7 1 46 30 2 3 29
Republic of Korea
2 469 0 0 2 469 2 444 6 366 0 8 810 4 366 804 15 5 155
total east Asia 212 618 19 9 212 628 115 258 50 194 792 164 659 27 475 17 420 903 43 992
taBle 4 (cont.)
Production, trade and consumption of woodfuel, roundwood and sawnwood, 2006

Annex 125
Annex
country/area Woodfuel industrial roundwood Sawnwood
(1 000 m3) (1 000 m3) (1 000 m3)
Production imports exports consumption Production imports exports consumption Production imports exports consumption
American Samoa
– – – – 0 0 0 0 0 1 0 1
Australia 6 969 0 0 6 969 26 904 2 1 065 25 841 4 784 570 344 5 010
Cook Islands 0 0 0 0 5 0 1 4 0 3 0 3
Fiji 37 0 0 37 472 2 6 468 125 2 20 107
French Polynesia
– – – – 0 4 0 4 0 40 0 40
Guam – – – – – – – – – – – –
Kiribati 0 0 0 0 0 0 0 0 0 2 0 2
Marshall Islands – – – – – – – – 0 6 0 6
Micronesia (Federated States of)
0 0 0 0 0 0 0 0 0 7 0 7
Nauru 0 0 0 0 0 0 0 0 0 0 0 0
New Caledonia 0 0 0 0 5 4 1 8 3 20 1 22
New Zealand – 0 0 – 19 254 3 5 571 13 687 4 269 50 1 960 2 359
Niue – – – – 0 0 0 0 0 0 0 0
Northern Mariana Islands
– – – – – – – – 0 0 0 0
Palau – – – – 0 1 0 1 0 3 0 3
Papua New Guinea
5 533 0 0 5 533 2 908 0 2 638 270 60 0 51 9
Pitcairn Islands – – – – – – – – 0 0 0 0
Samoa 70 0 0 70 61 6 1 66 21 22 0 43
Solomon Islands
138 0 0 138 1 130 0 1 011 119 12 0 11 1
Tokelau – – – – – – – – 0 0 0 0
Tonga 0 2 0 2 2 1 2 1 2 14 0 16
Tuvalu – – – – 0 0 0 0 0 1 0 1
Vanuatu 91 0 1 90 28 2 0 30 28 2 2 28
Wallis and Futuna Islands
– – – – 0 0 0 1 0
total oceania 12 838 2 1 12 839 50 769 25 10 294 40 500 9 304 745 2 390 7 660
Bangladesh 27 584 0 0 27 584 282 329 1 611 388 2 0 390
Bhutan 4 546 0 0 4 546 133 0 3 130 31 0 0 31
India 306 252 79 0 306 332 23 192 4 043 3 27 231 14 789 173 19 14 943
Maldives 0 0 0 0 0 0 0 0 0 0 0 0
Nepal 12 654 0 0 12 654 1 260 1 2 1 259 630 2 0 631
Pakistan 26 124 0 0 26 124 2 870 259 0 3 129 1 313 120 0 1 433
Sri Lanka 5 584 0 0 5 584 694 1 3 693 61 30 0 90
total South Asia 382 745 80 0 382 825 28 431 4 634 12 33 053 17 212 326 19 17 519
Brunei Darussalam
12 0 0 12 112 0 0 112 51 0 1 50
Cambodia 9 221 0 0 9 221 113 1 0 114 74 0 63 11
Indonesia 70 719 0 1 70 718 28 099 120 685 27 534 3 853 311 1 853 2 311
Lao People’s Democratic Republic
5 944 0 0 5 944 194 0 63 131 140 0 131 9
Malaysia 3 013 12 0 3 024 22 506 138 4 909 17 735 5 129 1 004 2 608 3 525
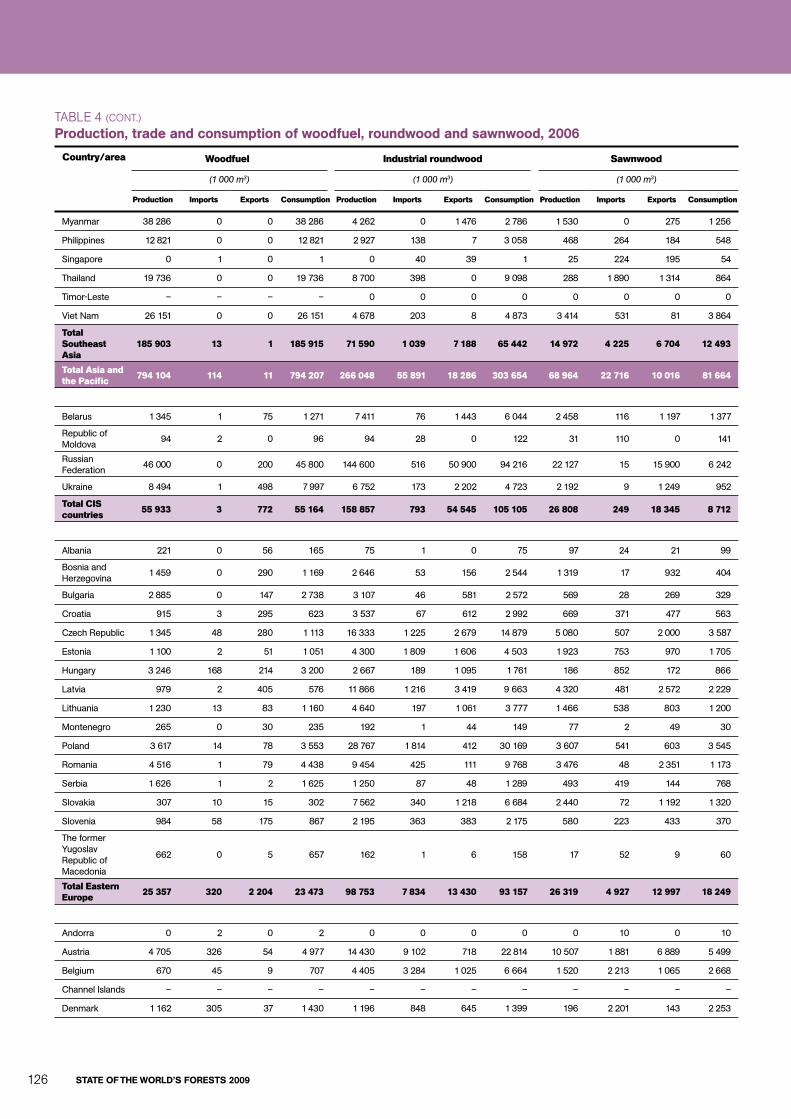
stAte oF the World’s Forests 2009126
country/area Woodfuel industrial roundwood Sawnwood
(1 000 m3) (1 000 m3) (1 000 m3)
Production imports exports consumption Production imports exports consumption Production imports exports consumption
Myanmar 38 286 0 0 38 286 4 262 0 1 476 2 786 1 530 0 275 1 256
Philippines 12 821 0 0 12 821 2 927 138 7 3 058 468 264 184 548
Singapore 0 1 0 1 0 40 39 1 25 224 195 54
Thailand 19 736 0 0 19 736 8 700 398 0 9 098 288 1 890 1 314 864
Timor-Leste – – – – 0 0 0 0 0 0 0 0
Viet Nam 26 151 0 0 26 151 4 678 203 8 4 873 3 414 531 81 3 864
total Southeast Asia
185 903 13 1 185 915 71 590 1 039 7 188 65 442 14 972 4 225 6 704 12 493
total Asia and the Pacific 794 104 114 11 794 207 266 048 55 891 18 286 303 654 68 964 22 716 10 016 81 664
Belarus 1 345 1 75 1 271 7 411 76 1 443 6 044 2 458 116 1 197 1 377
Republic of Moldova
94 2 0 96 94 28 0 122 31 110 0 141
Russian Federation
46 000 0 200 45 800 144 600 516 50 900 94 216 22 127 15 15 900 6 242
Ukraine 8 494 1 498 7 997 6 752 173 2 202 4 723 2 192 9 1 249 952
total ciS countries 55 933 3 772 55 164 158 857 793 54 545 105 105 26 808 249 18 345 8 712
Albania 221 0 56 165 75 1 0 75 97 24 21 99
Bosnia and Herzegovina
1 459 0 290 1 169 2 646 53 156 2 544 1 319 17 932 404
Bulgaria 2 885 0 147 2 738 3 107 46 581 2 572 569 28 269 329
Croatia 915 3 295 623 3 537 67 612 2 992 669 371 477 563
Czech Republic 1 345 48 280 1 113 16 333 1 225 2 679 14 879 5 080 507 2 000 3 587
Estonia 1 100 2 51 1 051 4 300 1 809 1 606 4 503 1 923 753 970 1 705
Hungary 3 246 168 214 3 200 2 667 189 1 095 1 761 186 852 172 866
Latvia 979 2 405 576 11 866 1 216 3 419 9 663 4 320 481 2 572 2 229
Lithuania 1 230 13 83 1 160 4 640 197 1 061 3 777 1 466 538 803 1 200
Montenegro 265 0 30 235 192 1 44 149 77 2 49 30
Poland 3 617 14 78 3 553 28 767 1 814 412 30 169 3 607 541 603 3 545
Romania 4 516 1 79 4 438 9 454 425 111 9 768 3 476 48 2 351 1 173
Serbia 1 626 1 2 1 625 1 250 87 48 1 289 493 419 144 768
Slovakia 307 10 15 302 7 562 340 1 218 6 684 2 440 72 1 192 1 320
Slovenia 984 58 175 867 2 195 363 383 2 175 580 223 433 370
The former Yugoslav Republic of Macedonia
662 0 5 657 162 1 6 158 17 52 9 60
total eastern europe 25 357 320 2 204 23 473 98 753 7 834 13 430 93 157 26 319 4 927 12 997 18 249
Andorra 0 2 0 2 0 0 0 0 0 10 0 10
Austria 4 705 326 54 4 977 14 430 9 102 718 22 814 10 507 1 881 6 889 5 499
Belgium 670 45 9 707 4 405 3 284 1 025 6 664 1 520 2 213 1 065 2 668
Channel Islands – – – – – – – – – – – –
Denmark 1 162 305 37 1 430 1 196 848 645 1 399 196 2 201 143 2 253
taBle 4 (cont.)
Production, trade and consumption of woodfuel, roundwood and sawnwood, 2006

Annex 127
Annex
country/area Woodfuel industrial roundwood Sawnwood
(1 000 m3) (1 000 m3) (1 000 m3)
Production imports exports consumption Production imports exports consumption Production imports exports consumption
Faeroe Islands 0 0 0 0 0 1 0 1 0 4 0 4
Finland 5 290 174 9 5 455 45 521 14 655 709 59 468 12 227 578 7 728 5 077
France 33 198 44 560 32 682 28 592 2 601 3 695 27 498 9 992 3 922 1 493 12 421
Germany 8 290 547 79 8 759 54 000 3 669 7 557 50 113 24 420 5 307 8 789 20 938
Gibraltar 0 0 0 0 0 0 0 0 0 1 0 1
Greece 1 004 69 7 1 066 519 190 4 705 191 948 12 1 127
Holy See – – – – – – – – – – – –
Iceland 0 0 0 0 0 1 0 1 0 95 0 95
Ireland 16 1 1 16 2 655 208 308 2 555 1 094 995 393 1 697
Isle of Man – – – – – – – – – – – –
Italy 5 606 1 099 2 6 703 3 013 4 486 15 7 484 1 748 7 862 169 9 441
Liechtenstein 4 0 0 4 18 0 0 18 – – – –
Luxembourg – 20 35 – 255 351 224 383 133 57 38 152
Malta 0 0 0 0 0 0 0 0 0 19 0 19
Monaco – – – – – – – – – – – –
Netherlands 290 2 30 261 817 390 570 636 265 3 399 555 3 109
Norway 1 177 175 5 1 347 7 417 2 334 740 9 011 2 389 1 035 474 2 950
Portugal 600 2 8 594 10 205 335 1 422 9 118 1 010 258 462 806
San Marino – – – – – – – – – – – –
Spain 1 607 42 188 1 461 14 109 3 841 224 17 726 3 806 3 373 117 7 062
Sweden 5 900 230 42 6 088 58 700 6 664 3 004 62 360 18 300 384 13 217 5 467
Switzerland 1 417 8 37 1 388 4 285 346 1 727 2 904 1 668 409 252 1 825
United Kingdom 317 4 145 176 8 100 415 644 7 871 2 902 7 963 415 10 449
total Western europe 71 255 3 095 1 247 73 118 258 235 53 722 23 229 288 729 92 369 42 912 42 211 93 070
total europe 152 544 3 418 4 223 151 755 515 845 62 349 91 204 486 991 145 496 48 088 73 554 120 030
Anguilla – – – – – – – – – – – –
Antigua and Barbuda
– – – – 0 0 0 0 0 11 0 11
Aruba 0 0 0 0 0 1 0 1 0 16 0 16
Bahamas 0 1 0 1 17 63 0 80 1 108 2 107
Barbados 0 3 0 3 6 5 0 11 0 24 0 24
Bermuda – – – – – – – – – – – –
British Virgin Islands
0 0 0 0 0 0 0 0 0 4 0 4
Cayman Islands 0 0 0 0 0 2 0 2 0 14 0 14
Cuba 1 584 0 0 1 584 761 0 0 761 243 8 0 251
Dominica 0 0 0 0 0 1 0 1 66 4 2 67
Dominican Republic
878 0 0 878 14 17 0 30 12 310 0 322
Grenada 0 0 0 0 0 0 0 0 0 10 0 10
Guadeloupe 32 0 0 32 0 5 0 5 1 46 0 47
Haiti 2 008 0 0 2 008 239 1 0 240 14 19 0 33
Jamaica 559 0 0 560 278 3 0 281 66 38 0 104
Martinique 25 0 0 25 2 3 0 5 1 29 0 30
Montserrat 0 0 0 0 0 0 0 0 0 4 0 4
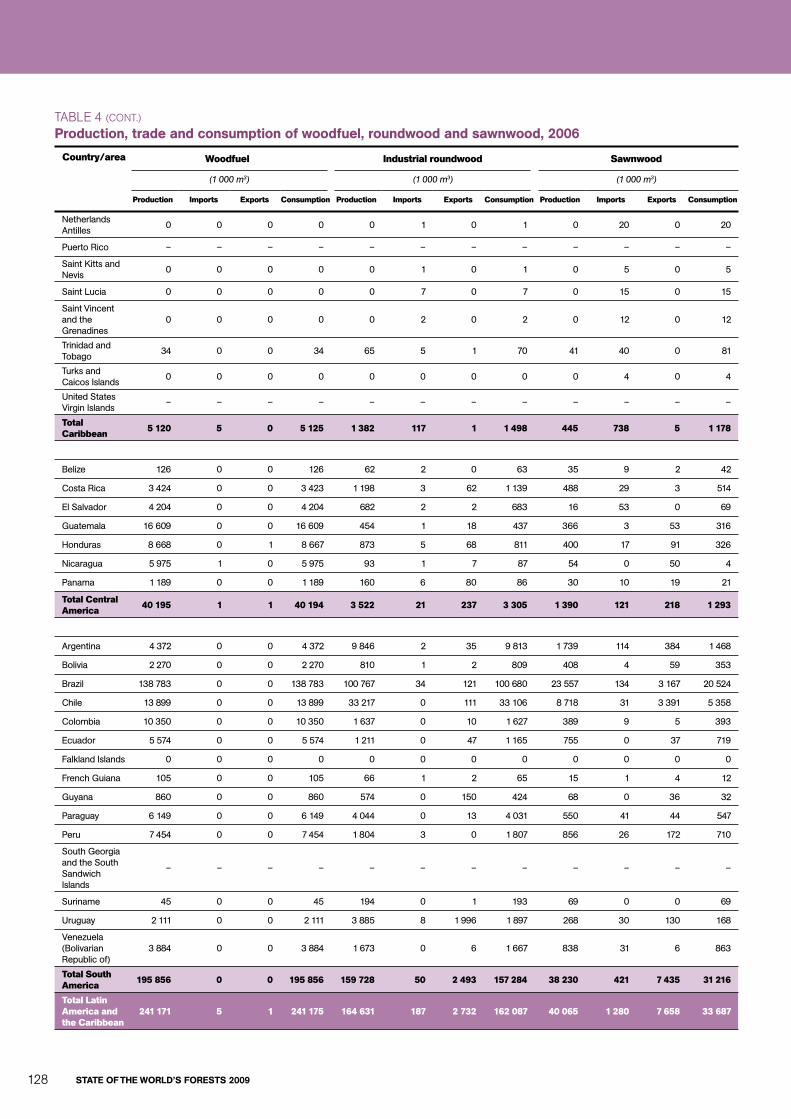
stAte oF the World’s Forests 2009128
country/area Woodfuel industrial roundwood Sawnwood
(1 000 m3) (1 000 m3) (1 000 m3)
Production imports exports consumption Production imports exports consumption Production imports exports consumption
Netherlands Antilles
0 0 0 0 0 1 0 1 0 20 0 20
Puerto Rico – – – – – – – – – – – –
Saint Kitts and Nevis
0 0 0 0 0 1 0 1 0 5 0 5
Saint Lucia 0 0 0 0 0 7 0 7 0 15 0 15
Saint Vincent and the Grenadines
0 0 0 0 0 2 0 2 0 12 0 12
Trinidad and Tobago
34 0 0 34 65 5 1 70 41 40 0 81
Turks and Caicos Islands
0 0 0 0 0 0 0 0 0 4 0 4
United States Virgin Islands
– – – – – – – – – – – –
total caribbean 5 120 5 0 5 125 1 382 117 1 1 498 445 738 5 1 178
Belize 126 0 0 126 62 2 0 63 35 9 2 42
Costa Rica 3 424 0 0 3 423 1 198 3 62 1 139 488 29 3 514
El Salvador 4 204 0 0 4 204 682 2 2 683 16 53 0 69
Guatemala 16 609 0 0 16 609 454 1 18 437 366 3 53 316
Honduras 8 668 0 1 8 667 873 5 68 811 400 17 91 326
Nicaragua 5 975 1 0 5 975 93 1 7 87 54 0 50 4
Panama 1 189 0 0 1 189 160 6 80 86 30 10 19 21
total central America 40 195 1 1 40 194 3 522 21 237 3 305 1 390 121 218 1 293
Argentina 4 372 0 0 4 372 9 846 2 35 9 813 1 739 114 384 1 468
Bolivia 2 270 0 0 2 270 810 1 2 809 408 4 59 353
Brazil 138 783 0 0 138 783 100 767 34 121 100 680 23 557 134 3 167 20 524
Chile 13 899 0 0 13 899 33 217 0 111 33 106 8 718 31 3 391 5 358
Colombia 10 350 0 0 10 350 1 637 0 10 1 627 389 9 5 393
Ecuador 5 574 0 0 5 574 1 211 0 47 1 165 755 0 37 719
Falkland Islands 0 0 0 0 0 0 0 0 0 0 0 0
French Guiana 105 0 0 105 66 1 2 65 15 1 4 12
Guyana 860 0 0 860 574 0 150 424 68 0 36 32
Paraguay 6 149 0 0 6 149 4 044 0 13 4 031 550 41 44 547
Peru 7 454 0 0 7 454 1 804 3 0 1 807 856 26 172 710
South Georgia and the South Sandwich Islands
– – – – – – – – – – – –
Suriname 45 0 0 45 194 0 1 193 69 0 0 69
Uruguay 2 111 0 0 2 111 3 885 8 1 996 1 897 268 30 130 168
Venezuela (Bolivarian Republic of)
3 884 0 0 3 884 1 673 0 6 1 667 838 31 6 863
total South America 195 856 0 0 195 856 159 728 50 2 493 157 284 38 230 421 7 435 31 216
total Latin America and the caribbean
241 171 5 1 241 175 164 631 187 2 732 162 087 40 065 1 280 7 658 33 687
taBle 4 (cont.)
Production, trade and consumption of woodfuel, roundwood and sawnwood, 2006
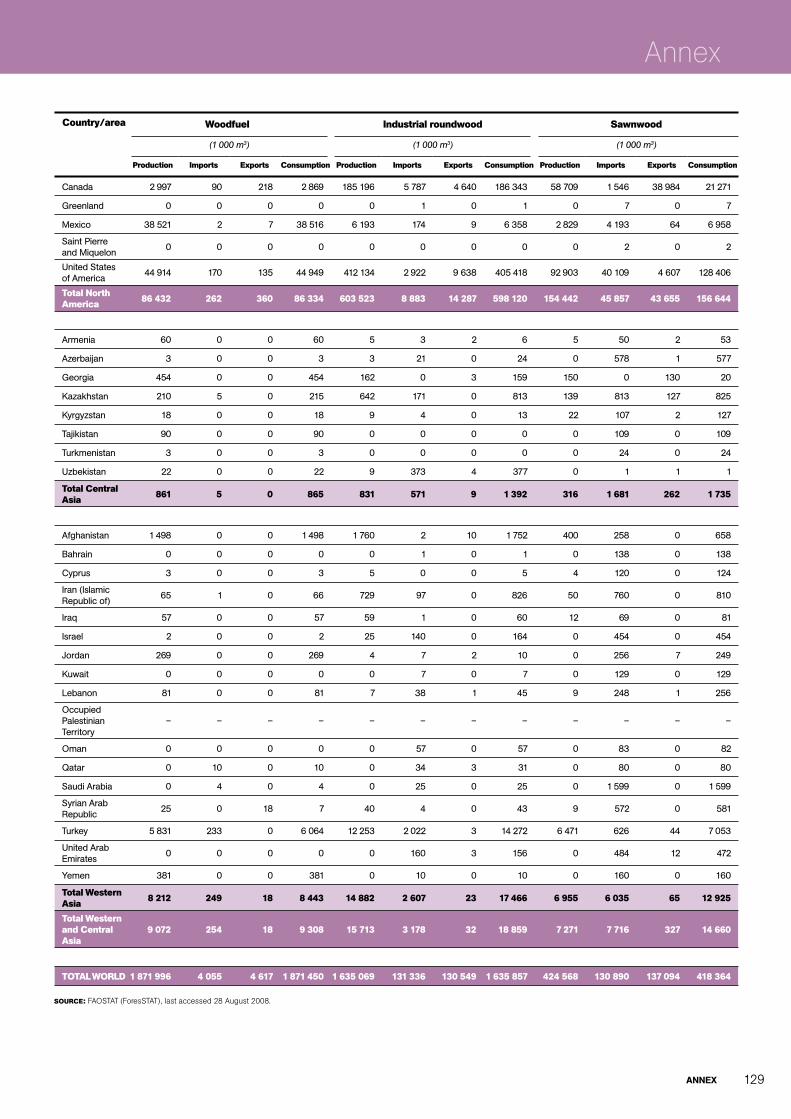
Annex 129
Annex
country/area Woodfuel industrial roundwood Sawnwood
(1 000 m3) (1 000 m3) (1 000 m3)
Production imports exports consumption Production imports exports consumption Production imports exports consumption
Canada 2 997 90 218 2 869 185 196 5 787 4 640 186 343 58 709 1 546 38 984 21 271
Greenland 0 0 0 0 0 1 0 1 0 7 0 7
Mexico 38 521 2 7 38 516 6 193 174 9 6 358 2 829 4 193 64 6 958
Saint Pierre and Miquelon
0 0 0 0 0 0 0 0 0 2 0 2
United States of America
44 914 170 135 44 949 412 134 2 922 9 638 405 418 92 903 40 109 4 607 128 406
total North America 86 432 262 360 86 334 603 523 8 883 14 287 598 120 154 442 45 857 43 655 156 644
Armenia 60 0 0 60 5 3 2 6 5 50 2 53
Azerbaijan 3 0 0 3 3 21 0 24 0 578 1 577
Georgia 454 0 0 454 162 0 3 159 150 0 130 20
Kazakhstan 210 5 0 215 642 171 0 813 139 813 127 825
Kyrgyzstan 18 0 0 18 9 4 0 13 22 107 2 127
Tajikistan 90 0 0 90 0 0 0 0 0 109 0 109
Turkmenistan 3 0 0 3 0 0 0 0 0 24 0 24
Uzbekistan 22 0 0 22 9 373 4 377 0 1 1 1
total central Asia 861 5 0 865 831 571 9 1 392 316 1 681 262 1 735
Afghanistan 1 498 0 0 1 498 1 760 2 10 1 752 400 258 0 658
Bahrain 0 0 0 0 0 1 0 1 0 138 0 138
Cyprus 3 0 0 3 5 0 0 5 4 120 0 124
Iran (Islamic Republic of)
65 1 0 66 729 97 0 826 50 760 0 810
Iraq 57 0 0 57 59 1 0 60 12 69 0 81
Israel 2 0 0 2 25 140 0 164 0 454 0 454
Jordan 269 0 0 269 4 7 2 10 0 256 7 249
Kuwait 0 0 0 0 0 7 0 7 0 129 0 129
Lebanon 81 0 0 81 7 38 1 45 9 248 1 256
Occupied Palestinian Territory
– – – – – – – – – – – –
Oman 0 0 0 0 0 57 0 57 0 83 0 82
Qatar 0 10 0 10 0 34 3 31 0 80 0 80
Saudi Arabia 0 4 0 4 0 25 0 25 0 1 599 0 1 599
Syrian Arab Republic
25 0 18 7 40 4 0 43 9 572 0 581
Turkey 5 831 233 0 6 064 12 253 2 022 3 14 272 6 471 626 44 7 053
United Arab Emirates
0 0 0 0 0 160 3 156 0 484 12 472
Yemen 381 0 0 381 0 10 0 10 0 160 0 160
total Western Asia 8 212 249 18 8 443 14 882 2 607 23 17 466 6 955 6 035 65 12 925
total Western and central Asia
9 072 254 18 9 308 15 713 3 178 32 18 859 7 271 7 716 327 14 660
totAL WorLD 1 871 996 4 055 4 617 1 871 450 1 635 069 131 336 130 549 1 635 857 424 568 130 890 137 094 418 364
Source: faoStat (foresStat), last accessed 28 august 2008.
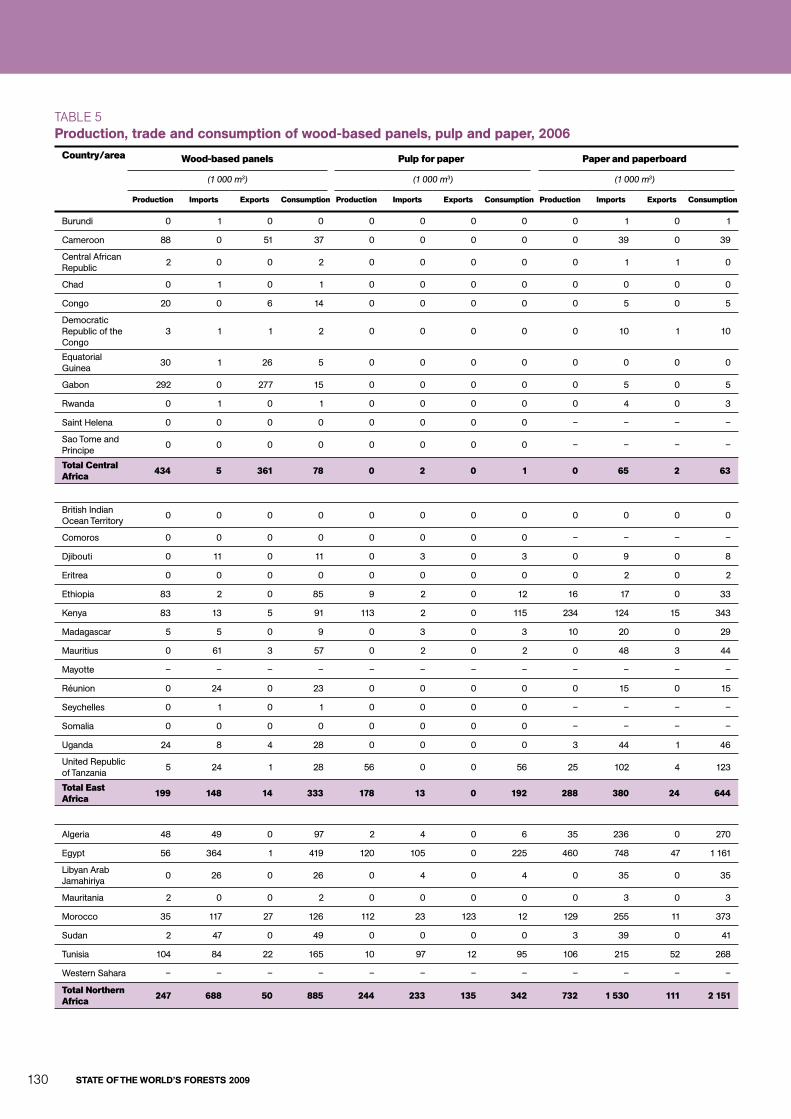
stAte oF the World’s Forests 2009130
taBle 5Production, trade and consumption of wood-based panels, pulp and paper, 2006
country/area Wood-based panels Pulp for paper Paper and paperboard
(1 000 m3) (1 000 m3) (1 000 m3)
Production imports exports consumption Production imports exports consumption Production imports exports consumption
Burundi 0 1 0 0 0 0 0 0 0 1 0 1
Cameroon 88 0 51 37 0 0 0 0 0 39 0 39
Central African Republic
2 0 0 2 0 0 0 0 0 1 1 0
Chad 0 1 0 1 0 0 0 0 0 0 0 0
Congo 20 0 6 14 0 0 0 0 0 5 0 5
Democratic Republic of the Congo
3 1 1 2 0 0 0 0 0 10 1 10
Equatorial Guinea
30 1 26 5 0 0 0 0 0 0 0 0
Gabon 292 0 277 15 0 0 0 0 0 5 0 5
Rwanda 0 1 0 1 0 0 0 0 0 4 0 3
Saint Helena 0 0 0 0 0 0 0 0 – – – –
Sao Tome and Principe
0 0 0 0 0 0 0 0 – – – –
total central Africa 434 5 361 78 0 2 0 1 0 65 2 63
British Indian Ocean Territory
0 0 0 0 0 0 0 0 0 0 0 0
Comoros 0 0 0 0 0 0 0 0 – – – –
Djibouti 0 11 0 11 0 3 0 3 0 9 0 8
Eritrea 0 0 0 0 0 0 0 0 0 2 0 2
Ethiopia 83 2 0 85 9 2 0 12 16 17 0 33
Kenya 83 13 5 91 113 2 0 115 234 124 15 343
Madagascar 5 5 0 9 0 3 0 3 10 20 0 29
Mauritius 0 61 3 57 0 2 0 2 0 48 3 44
Mayotte – – – – – – – – – – – –
Réunion 0 24 0 23 0 0 0 0 0 15 0 15
Seychelles 0 1 0 1 0 0 0 0 – – – –
Somalia 0 0 0 0 0 0 0 0 – – – –
Uganda 24 8 4 28 0 0 0 0 3 44 1 46
United Republic of Tanzania
5 24 1 28 56 0 0 56 25 102 4 123
total east Africa 199 148 14 333 178 13 0 192 288 380 24 644
Algeria 48 49 0 97 2 4 0 6 35 236 0 270
Egypt 56 364 1 419 120 105 0 225 460 748 47 1 161
Libyan Arab Jamahiriya
0 26 0 26 0 4 0 4 0 35 0 35
Mauritania 2 0 0 2 0 0 0 0 0 3 0 3
Morocco 35 117 27 126 112 23 123 12 129 255 11 373
Sudan 2 47 0 49 0 0 0 0 3 39 0 41
Tunisia 104 84 22 165 10 97 12 95 106 215 52 268
Western Sahara – – – – – – – – – – – –
total Northern Africa 247 688 50 885 244 233 135 342 732 1 530 111 2 151

Annex 131
Annex
country/area Wood-based panels Pulp for paper Paper and paperboard
(1 000 m3) (1 000 m3) (1 000 m3)
Production imports exports consumption Production imports exports consumption Production imports exports consumption
Angola 11 4 0 15 15 0 0 15 0 12 0 11
Botswana 0 0 0 0 0 0 0 0 0 10 0 10
Lesotho 0 0 0 0 0 0 0 0 – – – –
Malawi 18 3 6 15 0 0 0 0 0 19 0 19
Mozambique 3 5 2 7 0 0 1 0 0 12 0 12
Namibia – – – – – – – – – – – –
South Africa 726 355 75 1 007 2 915 515 972 2 457 1 793 59 210 1 642
Swaziland 8 0 0 8 167 0 167 0 – – – –
Zambia 18 4 4 18 0 0 0 0 4 27 0 31
Zimbabwe 80 15 19 76 49 10 0 59 115 45 13 146
total Southern Africa 864 386 105 1 146 3 146 525 1 140 2 531 1 912 183 224 1 871
Benin 0 2 0 2 0 0 0 0 0 6 0 6
Burkina Faso 0 2 0 2 0 0 0 0 0 11 0 11
Cape Verde 0 1 0 0 0 0 0 0 0 2 0 2
Côte d’Ivoire 301 0 232 69 0 0 0 0 0 71 2 69
Gambia 0 2 1 1 0 0 0 0 – – – –
Ghana 335 1 175 161 0 0 0 0 0 65 0 65
Guinea 42 2 3 41 0 0 0 0 0 3 0 3
Guinea-Bissau 0 0 0 0 0 0 0 0 0 0 0 0
Liberia 0 5 0 4 0 0 0 0 0 2 0 2
Mali 0 0 0 0 0 0 0 0 0 5 0 5
Niger 0 0 0 0 0 8 0 8 0 1 0 1
Nigeria 95 42 0 136 23 17 0 40 19 297 2 315
Senegal 0 11 0 11 0 0 0 0 0 31 2 29
Sierra Leone 0 3 1 3 0 0 0 0 0 1 1 0
Togo 0 1 0 1 0 0 0 0 0 5 0 5
total West Africa 773 73 413 433 23 26 0 49 19 500 8 511
total Africa 2 517 1 300 943 2 874 3 591 801 1 276 3 116 2 951 2 658 369 5 240
China 63 842 4 941 9 774 59 010 18 976 8 178 114 27 040 57 983 8 636 5 683 60 936
Democratic People’s Republic of Korea
0 9 0 9 106 45 0 151 80 25 2 102
Japan 5 514 5 646 33 11 127 10 847 2 211 210 12 848 29 473 1 959 1 456 29 976
Mongolia 2 4 1 5 0 0 0 0 0 5 0 5
Republic of Korea
3 760 2 962 47 6 675 516 2 422 0 2 938 11 040 768 3 165 8 643
total east Asia 73 118 13 562 9 855 76 826 30 445 12 856 324 42 977 98 576 11 392 10 306 99 663
American Samoa
0 0 0 0 0 0 0 0 0 0 0 0
Australia 1 989 394 422 1 961 1 153 344 10 1 487 3 221 1 551 808 3 964
Cook Islands 0 2 0 2 0 0 0 0 0 0 0 0
Fiji 16 16 3 29 0 0 0 0 0 26 1 25
French Polynesia
0 10 0 9 0 0 0 0 0 7 0 7

stAte oF the World’s Forests 2009132
taBle 5 (cont.)
Production, trade and consumption of wood-based panels, pulp and paper, 2006country/area Wood-based panels Pulp for paper Paper and paperboard
(1 000 m3) (1 000 m3) (1 000 m3)
Production imports exports consumption Production imports exports consumption Production imports exports consumption
Guam – – – – – – – – – – – –
Kiribati 0 0 0 0 0 0 0 0 0 0 0 0
Marshall Islands 0 3 0 3 0 0 0 0 0 0 0 0
Micronesia (Federated States of)
0 1 0 1 0 0 0 0 0 0 0 0
Nauru 0 0 0 0 0 0 0 0 0 0 0 0
New Caledonia 0 9 3 6 0 0 0 0 0 9 7 1
New Zealand 2 223 46 1 043 1 226 1 562 5 699 868 944 470 593 821
Niue 0 0 0 0 0 0 0 0 0 0 0 0
Northern Mariana Islands
0 0 0 0 0 0 0 0 0 0 0 0
Palau 0 1 0 1 0 0 0 0 0 0 0 0
Papua New Guinea
88 1 68 21 0 0 0 0 0 16 0 16
Pitcairn Islands 0 0 0 0 0 0 0 0 0 0 0 0
Samoa 0 2 0 2 0 0 0 0 0 1 0 1
Solomon Islands
0 0 0 0 0 0 0 0 – – – –
Tokelau 0 0 0 0 0 0 0 0 0 0 0 0
Tonga 0 2 0 2 0 0 0 0 0 0 0 0
Tuvalu 0 0 0 0 0 0 0 0 0 0 0 0
Vanuatu 0 1 0 1 0 1 0 1 0 0 0 0
Wallis and Futuna Islands
0 1 0 1 0 0 0 0 0 0 0 0
total oceania 4 316 489 1 539 3 266 2 715 350 709 2 356 4 165 2 081 1 410 4 836
Bangladesh 9 25 0 34 65 30 0 95 58 245 0 303
Bhutan 32 0 23 9 0 0 0 0 0 1 1 0
India 2 554 277 72 2 758 4 048 507 5 4 550 4 183 1 427 309 5 301
Maldives 0 4 0 4 0 0 0 0 0 1 0 1
Nepal 30 2 0 32 15 4 2 17 13 7 1 19
Pakistan 481 275 0 756 372 94 0 466 1 010 303 0 1 313
Sri Lanka 22 60 25 56 21 2 0 23 25 146 1 170
total South Asia 3 127 642 121 3 648 4 521 637 7 5 152 5 289 2 130 312 7 106
Brunei Darussalam
0 6 0 6 0 0 0 0 0 4 1 3
Cambodia 7 4 5 5 0 0 0 0 0 28 0 28
Indonesia 5 376 244 3 600 2 020 5 587 681 2 761 3 507 7 223 327 3 510 4 040
Lao People’s Democratic Republic
24 1 5 20 0 0 0 0 0 3 0 3
Malaysia 7 767 370 7 208 929 124 272 14 382 941 2 469 243 3 167
Myanmar 113 4 53 64 40 1 0 41 45 39 0 84
Philippines 418 272 59 631 212 77 23 266 1 097 618 145 1 571
Singapore 355 314 147 522 0 90 86 4 87 699 163 623
Thailand 3 000 247 2 758 488 1 146 375 179 1 343 3 796 656 1 088 3 363
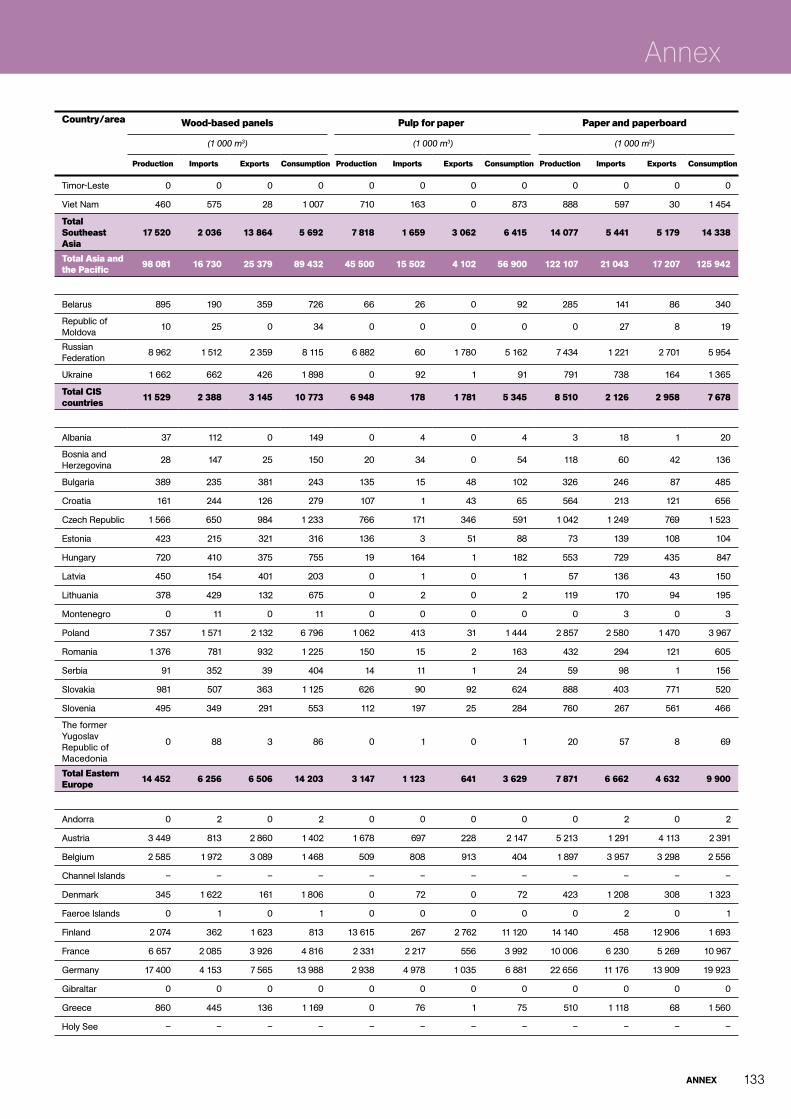
Annex 133
Annex
country/area Wood-based panels Pulp for paper Paper and paperboard
(1 000 m3) (1 000 m3) (1 000 m3)
Production imports exports consumption Production imports exports consumption Production imports exports consumption
Timor-Leste 0 0 0 0 0 0 0 0 0 0 0 0
Viet Nam 460 575 28 1 007 710 163 0 873 888 597 30 1 454
total Southeast Asia
17 520 2 036 13 864 5 692 7 818 1 659 3 062 6 415 14 077 5 441 5 179 14 338
total Asia and the Pacific 98 081 16 730 25 379 89 432 45 500 15 502 4 102 56 900 122 107 21 043 17 207 125 942
Belarus 895 190 359 726 66 26 0 92 285 141 86 340
Republic of Moldova
10 25 0 34 0 0 0 0 0 27 8 19
Russian Federation
8 962 1 512 2 359 8 115 6 882 60 1 780 5 162 7 434 1 221 2 701 5 954
Ukraine 1 662 662 426 1 898 0 92 1 91 791 738 164 1 365
total ciS countries 11 529 2 388 3 145 10 773 6 948 178 1 781 5 345 8 510 2 126 2 958 7 678
Albania 37 112 0 149 0 4 0 4 3 18 1 20
Bosnia and Herzegovina
28 147 25 150 20 34 0 54 118 60 42 136
Bulgaria 389 235 381 243 135 15 48 102 326 246 87 485
Croatia 161 244 126 279 107 1 43 65 564 213 121 656
Czech Republic 1 566 650 984 1 233 766 171 346 591 1 042 1 249 769 1 523
Estonia 423 215 321 316 136 3 51 88 73 139 108 104
Hungary 720 410 375 755 19 164 1 182 553 729 435 847
Latvia 450 154 401 203 0 1 0 1 57 136 43 150
Lithuania 378 429 132 675 0 2 0 2 119 170 94 195
Montenegro 0 11 0 11 0 0 0 0 0 3 0 3
Poland 7 357 1 571 2 132 6 796 1 062 413 31 1 444 2 857 2 580 1 470 3 967
Romania 1 376 781 932 1 225 150 15 2 163 432 294 121 605
Serbia 91 352 39 404 14 11 1 24 59 98 1 156
Slovakia 981 507 363 1 125 626 90 92 624 888 403 771 520
Slovenia 495 349 291 553 112 197 25 284 760 267 561 466
The former Yugoslav Republic of Macedonia
0 88 3 86 0 1 0 1 20 57 8 69
total eastern europe 14 452 6 256 6 506 14 203 3 147 1 123 641 3 629 7 871 6 662 4 632 9 900
Andorra 0 2 0 2 0 0 0 0 0 2 0 2
Austria 3 449 813 2 860 1 402 1 678 697 228 2 147 5 213 1 291 4 113 2 391
Belgium 2 585 1 972 3 089 1 468 509 808 913 404 1 897 3 957 3 298 2 556
Channel Islands – – – – – – – – – – – –
Denmark 345 1 622 161 1 806 0 72 0 72 423 1 208 308 1 323
Faeroe Islands 0 1 0 1 0 0 0 0 0 2 0 1
Finland 2 074 362 1 623 813 13 615 267 2 762 11 120 14 140 458 12 906 1 693
France 6 657 2 085 3 926 4 816 2 331 2 217 556 3 992 10 006 6 230 5 269 10 967
Germany 17 400 4 153 7 565 13 988 2 938 4 978 1 035 6 881 22 656 11 176 13 909 19 923
Gibraltar 0 0 0 0 0 0 0 0 0 0 0 0
Greece 860 445 136 1 169 0 76 1 75 510 1 118 68 1 560
Holy See – – – – – – – – – – – –
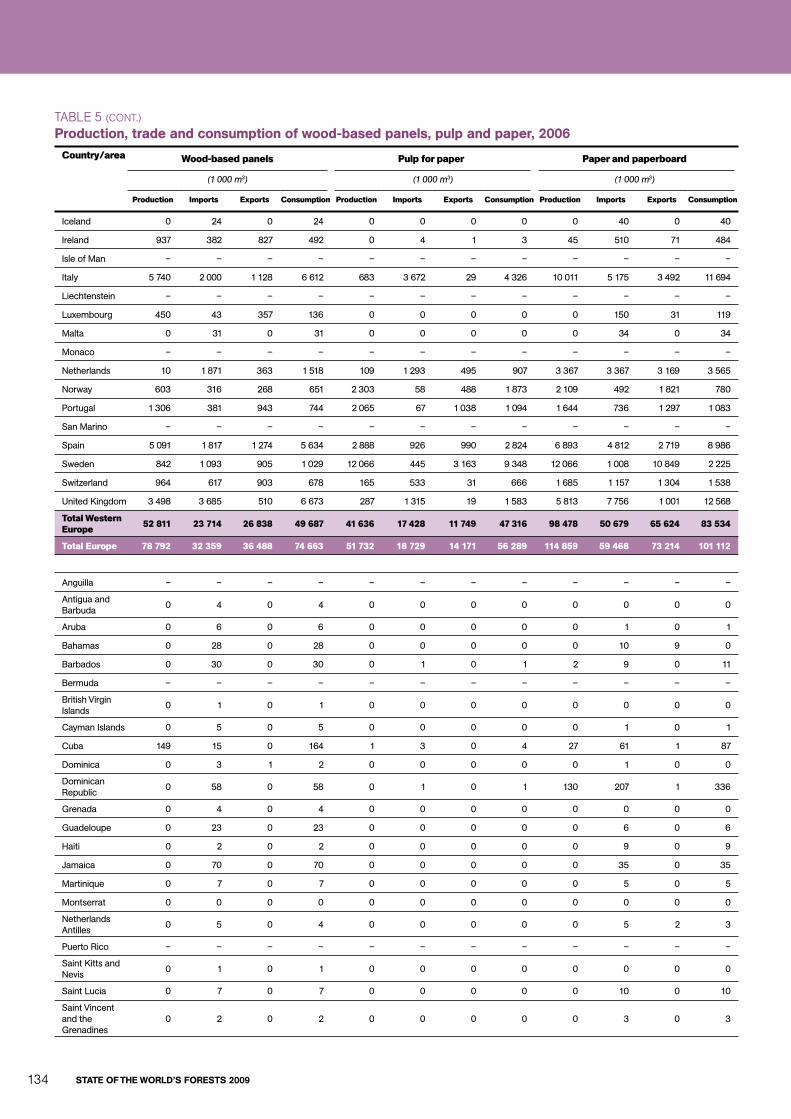
stAte oF the World’s Forests 2009134
taBle 5 (cont.)
Production, trade and consumption of wood-based panels, pulp and paper, 2006country/area Wood-based panels Pulp for paper Paper and paperboard
(1 000 m3) (1 000 m3) (1 000 m3)
Production imports exports consumption Production imports exports consumption Production imports exports consumption
Iceland 0 24 0 24 0 0 0 0 0 40 0 40
Ireland 937 382 827 492 0 4 1 3 45 510 71 484
Isle of Man – – – – – – – – – – – –
Italy 5 740 2 000 1 128 6 612 683 3 672 29 4 326 10 011 5 175 3 492 11 694
Liechtenstein – – – – – – – – – – – –
Luxembourg 450 43 357 136 0 0 0 0 0 150 31 119
Malta 0 31 0 31 0 0 0 0 0 34 0 34
Monaco – – – – – – – – – – – –
Netherlands 10 1 871 363 1 518 109 1 293 495 907 3 367 3 367 3 169 3 565
Norway 603 316 268 651 2 303 58 488 1 873 2 109 492 1 821 780
Portugal 1 306 381 943 744 2 065 67 1 038 1 094 1 644 736 1 297 1 083
San Marino – – – – – – – – – – – –
Spain 5 091 1 817 1 274 5 634 2 888 926 990 2 824 6 893 4 812 2 719 8 986
Sweden 842 1 093 905 1 029 12 066 445 3 163 9 348 12 066 1 008 10 849 2 225
Switzerland 964 617 903 678 165 533 31 666 1 685 1 157 1 304 1 538
United Kingdom 3 498 3 685 510 6 673 287 1 315 19 1 583 5 813 7 756 1 001 12 568
total Western europe 52 811 23 714 26 838 49 687 41 636 17 428 11 749 47 316 98 478 50 679 65 624 83 534
total europe 78 792 32 359 36 488 74 663 51 732 18 729 14 171 56 289 114 859 59 468 73 214 101 112
Anguilla – – – – – – – – – – – –
Antigua and Barbuda
0 4 0 4 0 0 0 0 0 0 0 0
Aruba 0 6 0 6 0 0 0 0 0 1 0 1
Bahamas 0 28 0 28 0 0 0 0 0 10 9 0
Barbados 0 30 0 30 0 1 0 1 2 9 0 11
Bermuda – – – – – – – – – – – –
British Virgin Islands
0 1 0 1 0 0 0 0 0 0 0 0
Cayman Islands 0 5 0 5 0 0 0 0 0 1 0 1
Cuba 149 15 0 164 1 3 0 4 27 61 1 87
Dominica 0 3 1 2 0 0 0 0 0 1 0 0
Dominican Republic
0 58 0 58 0 1 0 1 130 207 1 336
Grenada 0 4 0 4 0 0 0 0 0 0 0 0
Guadeloupe 0 23 0 23 0 0 0 0 0 6 0 6
Haiti 0 2 0 2 0 0 0 0 0 9 0 9
Jamaica 0 70 0 70 0 0 0 0 0 35 0 35
Martinique 0 7 0 7 0 0 0 0 0 5 0 5
Montserrat 0 0 0 0 0 0 0 0 0 0 0 0
Netherlands Antilles
0 5 0 4 0 0 0 0 0 5 2 3
Puerto Rico – – – – – – – – – – – –
Saint Kitts and Nevis
0 1 0 1 0 0 0 0 0 0 0 0
Saint Lucia 0 7 0 7 0 0 0 0 0 10 0 10
Saint Vincent and the Grenadines
0 2 0 2 0 0 0 0 0 3 0 3
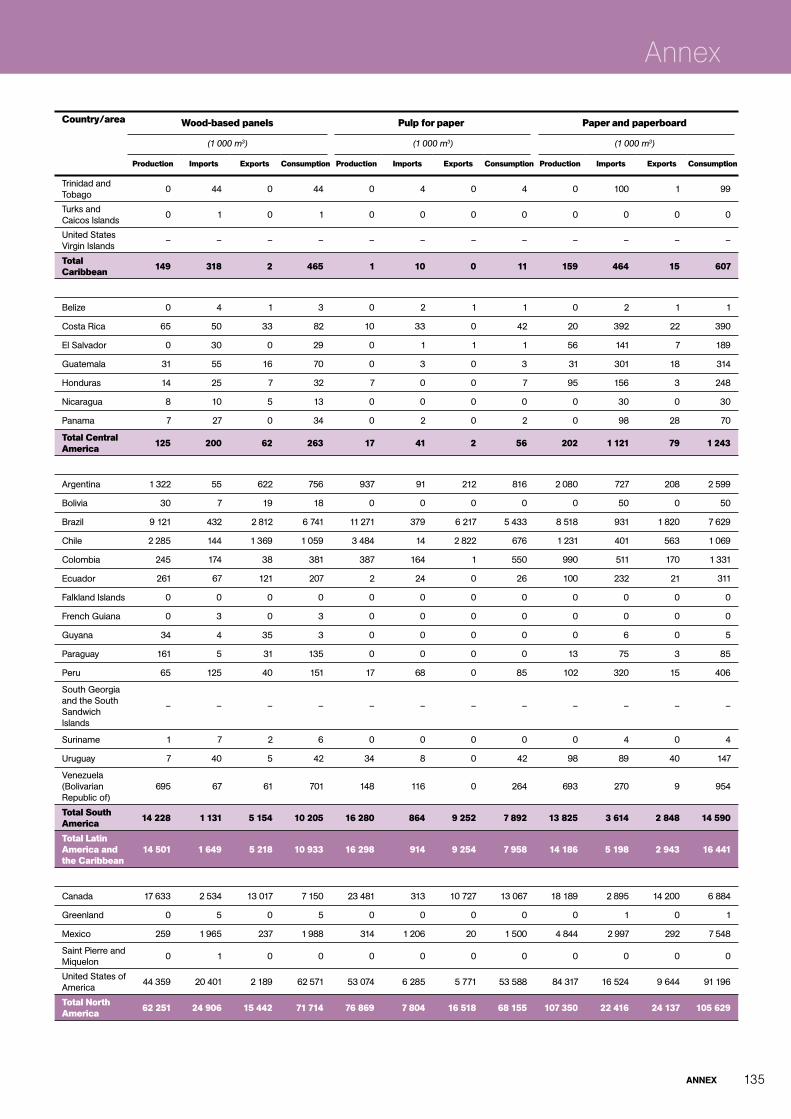
Annex 135
Annex
country/area Wood-based panels Pulp for paper Paper and paperboard
(1 000 m3) (1 000 m3) (1 000 m3)
Production imports exports consumption Production imports exports consumption Production imports exports consumption
Trinidad and Tobago
0 44 0 44 0 4 0 4 0 100 1 99
Turks and Caicos Islands
0 1 0 1 0 0 0 0 0 0 0 0
United States Virgin Islands
– – – – – – – – – – – –
total caribbean 149 318 2 465 1 10 0 11 159 464 15 607
Belize 0 4 1 3 0 2 1 1 0 2 1 1
Costa Rica 65 50 33 82 10 33 0 42 20 392 22 390
El Salvador 0 30 0 29 0 1 1 1 56 141 7 189
Guatemala 31 55 16 70 0 3 0 3 31 301 18 314
Honduras 14 25 7 32 7 0 0 7 95 156 3 248
Nicaragua 8 10 5 13 0 0 0 0 0 30 0 30
Panama 7 27 0 34 0 2 0 2 0 98 28 70
total central America 125 200 62 263 17 41 2 56 202 1 121 79 1 243
Argentina 1 322 55 622 756 937 91 212 816 2 080 727 208 2 599
Bolivia 30 7 19 18 0 0 0 0 0 50 0 50
Brazil 9 121 432 2 812 6 741 11 271 379 6 217 5 433 8 518 931 1 820 7 629
Chile 2 285 144 1 369 1 059 3 484 14 2 822 676 1 231 401 563 1 069
Colombia 245 174 38 381 387 164 1 550 990 511 170 1 331
Ecuador 261 67 121 207 2 24 0 26 100 232 21 311
Falkland Islands 0 0 0 0 0 0 0 0 0 0 0 0
French Guiana 0 3 0 3 0 0 0 0 0 0 0 0
Guyana 34 4 35 3 0 0 0 0 0 6 0 5
Paraguay 161 5 31 135 0 0 0 0 13 75 3 85
Peru 65 125 40 151 17 68 0 85 102 320 15 406
South Georgia and the South Sandwich Islands
– – – – – – – – – – – –
Suriname 1 7 2 6 0 0 0 0 0 4 0 4
Uruguay 7 40 5 42 34 8 0 42 98 89 40 147
Venezuela (Bolivarian Republic of)
695 67 61 701 148 116 0 264 693 270 9 954
total South America 14 228 1 131 5 154 10 205 16 280 864 9 252 7 892 13 825 3 614 2 848 14 590
total Latin America and the caribbean
14 501 1 649 5 218 10 933 16 298 914 9 254 7 958 14 186 5 198 2 943 16 441
Canada 17 633 2 534 13 017 7 150 23 481 313 10 727 13 067 18 189 2 895 14 200 6 884
Greenland 0 5 0 5 0 0 0 0 0 1 0 1
Mexico 259 1 965 237 1 988 314 1 206 20 1 500 4 844 2 997 292 7 548
Saint Pierre and Miquelon
0 1 0 0 0 0 0 0 0 0 0 0
United States of America
44 359 20 401 2 189 62 571 53 074 6 285 5 771 53 588 84 317 16 524 9 644 91 196
total North America 62 251 24 906 15 442 71 714 76 869 7 804 16 518 68 155 107 350 22 416 24 137 105 629

stAte oF the World’s Forests 2009136
taBle 5 (cont.)
Production, trade and consumption of wood-based panels, pulp and paper, 2006country/area Wood-based panels Pulp for paper Paper and paperboard
(1 000 m3) (1 000 m3) (1 000 m3)
Production imports exports consumption Production imports exports consumption Production imports exports consumption
Armenia 1 64 0 65 0 0 0 0 4 12 0 17
Azerbaijan 0 230 1 229 0 0 0 0 3 35 3 35
Georgia 10 5 0 15 0 0 0 0 0 6 0 6
Kazakhstan 10 503 1 512 0 1 0 1 81 143 16 209
Kyrgyzstan 0 34 0 34 0 0 0 0 2 17 0 19
Tajikistan 0 0 0 0 0 0 0 0 0 0 0 0
Turkmenistan 0 3 1 2 0 0 0 0 0 1 0 1
Uzbekistan 0 257 3 254 0 3 3 0 11 61 5 67
total central Asia 21 1 097 7 1 111 0 4 3 1 102 275 24 353
Afghanistan 1 12 0 13 0 0 0 0 0 1 0 1
Bahrain 0 55 1 54 0 12 0 12 15 26 18 23
Cyprus 3 129 0 132 0 2 0 2 0 104 0 104
Iran (Islamic Republic of)
677 350 7 1 020 507 75 0 582 411 571 4 977
Iraq 5 99 0 104 11 0 0 11 33 13 0 46
Israel 181 289 13 456 15 139 17 137 275 553 20 808
Jordan 0 169 19 149 8 76 0 84 54 154 32 176
Kuwait 0 154 0 154 0 9 0 9 56 126 27 155
Lebanon 46 304 2 348 0 35 0 35 103 170 13 260
Occupied Palestinian Territory
– – – – – – – – – – – –
Oman 0 136 0 135 0 1 0 1 0 66 4 62
Qatar 0 125 0 125 0 5 0 5 0 26 15 11
Saudi Arabia 0 267 0 267 0 64 0 64 279 774 26 1 027
Syrian Arab Republic
27 353 1 379 0 50 0 50 75 196 2 269
Turkey 4 989 896 561 5 324 138 475 2 611 1 643 2 068 175 3 536
United Arab Emirates
0 418 26 392 0 18 0 18 81 480 52 509
Yemen 0 133 0 133 0 0 0 0 0 82 0 82
total Western Asia 5 929 3 888 630 9 187 679 961 19 1 622 3 025 5 410 389 8 046
total Western and central Asia
5 950 4 985 637 10 298 679 965 22 1 622 3 127 5 685 413 8 399
totAL WorLD 262 092 81 929 84 107 259 914 194 668 44 715 45 343 194 040 364 579 116 468 118 283 362 764
Source: faoStat (foresStat), last accessed 28 august 2008.

Annex 137
Annex
taBle 6Forestry sector’s contribution to employment and gross domestic product, 2006
country/area employment gross value added
roundwood production
Wood processing
Pulp and paper
total for the forestry sector
roundwood production
Wood processing
Pulp and paper
total for the forestry sector
(1 000) (1 000) (1 000) (1 000)(% of total
labour force)(US$ million) (US$ million) (US$ million) (US$ million)
(% contribution to GDP)
Burundi 0 2 0 2 0.0 10 5 0 15 1.8
Cameroon 12 8 1 20 0.3 236 74 13 324 1.9
Central African Republic
2 2 0 4 0.2 133 10 1 144 11.1
Chad 1 0 – 1 0.0 122 0 – 122 1.9
Congo 4 3 0 7 0.5 45 27 – 72 1.1
Democratic Republic of the Congo
6 0 – 6 0.0 185 2 – 186 2.3
Equatorial Guinea
1 0 – 1 0.5 86 2 – 87 0.9
Gabon 8 4 0 12 1.9 171 118 0 290 3.0
Rwanda 1 1 – 1 0.0 30 1 – 31 1.3
Saint Helena – – – – – – – – – –
Sao Tome and Principe
– – – – – – – – – –
total central Africa 35 19 1 55 0.1 1 017 239 15 1 271 2.0
British Indian Ocean Territory
– – – – – – – – – –
Comoros – – – – – 18 – – 18 4.4
Djibouti – – – – – 0 – – 0 0.1
Eritrea 0 0 0 0 0.0 0 0 0 1 0.1
Ethiopia 1 2 2 5 0.0 630 4 9 643 5.2
Kenya 1 10 8 19 0.1 242 20 106 368 1.7
Madagascar 2 41 1 44 0.4 148 8 0 157 3.1
Mauritius 1 1 1 2 0.4 7 4 12 23 0.4
Mayotte – – – – – – – – – –
Réunion 0 0 0 0 0.1 2 8 8 18 0.1
Seychelles – – – – – 0 – – 0 0.1
Somalia 0 1 – 1 0.0 15 1 – 15 0.6
Uganda 2 1 1 4 0.0 354 16 9 379 4.0
United Republic of Tanzania
3 6 6 15 0.1 205 1 22 228 1.9
total east Africa 11 61 19 90 0.1 1 623 62 166 1 851 2.1
Algeria 0 11 2 13 0.1 37 118 66 220 0.2
Egypt 1 3 18 21 0.1 131 7 157 296 0.3
Libyan Arab Jamahiriya
0 1 0 2 0.1 57 4 2 62 0.1
Mauritania 0 0 0 0 0.0 1 0 – 1 0.1
Morocco 13 8 5 26 0.2 343 80 126 549 0.9
Sudan 1 2 1 4 0.0 57 15 36 107 0.3
Tunisia 4 9 4 16 0.4 106 147 149 402 1.4
Western Sahara – – – – – – – – – –
total Northern Africa 19 34 30 83 0.1 731 372 535 1 638 0.4
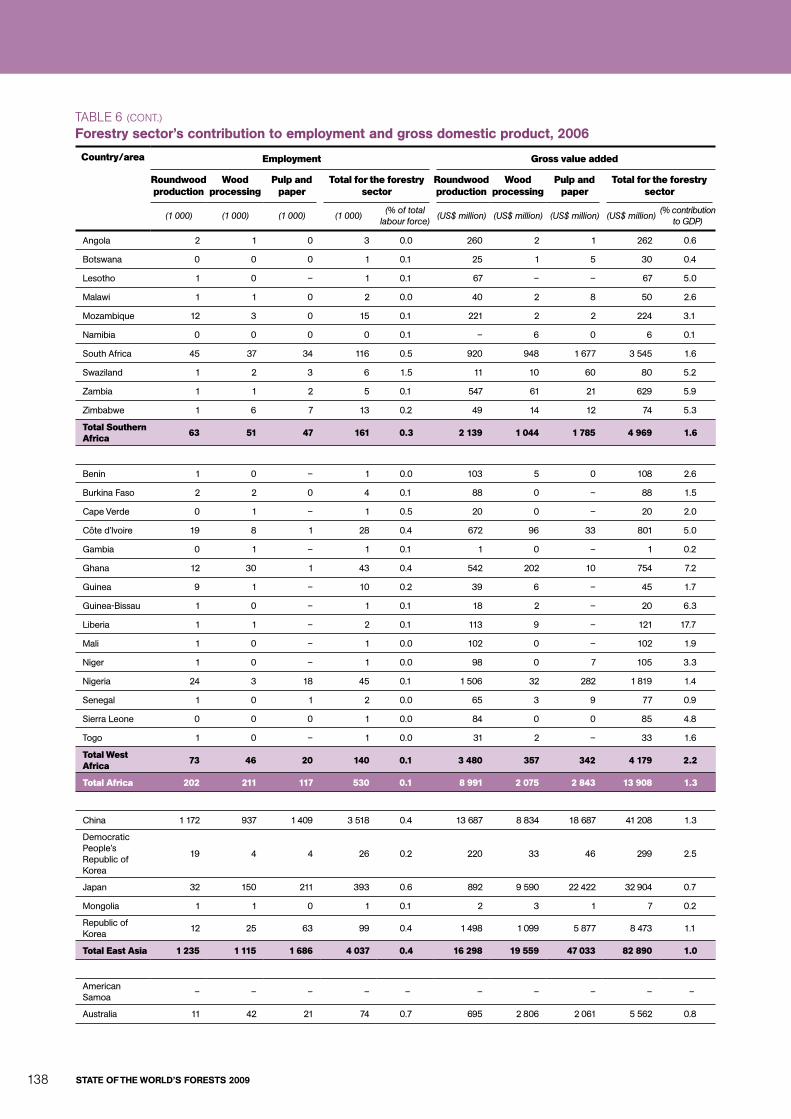
stAte oF the World’s Forests 2009138
country/area employment gross value added
roundwood production
Wood processing
Pulp and paper
total for the forestry sector
roundwood production
Wood processing
Pulp and paper
total for the forestry sector
(1 000) (1 000) (1 000) (1 000)(% of total
labour force)(US$ million) (US$ million) (US$ million) (US$ million)
(% contribution to GDP)
Angola 2 1 0 3 0.0 260 2 1 262 0.6
Botswana 0 0 0 1 0.1 25 1 5 30 0.4
Lesotho 1 0 – 1 0.1 67 – – 67 5.0
Malawi 1 1 0 2 0.0 40 2 8 50 2.6
Mozambique 12 3 0 15 0.1 221 2 2 224 3.1
Namibia 0 0 0 0 0.1 – 6 0 6 0.1
South Africa 45 37 34 116 0.5 920 948 1 677 3 545 1.6
Swaziland 1 2 3 6 1.5 11 10 60 80 5.2
Zambia 1 1 2 5 0.1 547 61 21 629 5.9
Zimbabwe 1 6 7 13 0.2 49 14 12 74 5.3
total Southern Africa 63 51 47 161 0.3 2 139 1 044 1 785 4 969 1.6
Benin 1 0 – 1 0.0 103 5 0 108 2.6
Burkina Faso 2 2 0 4 0.1 88 0 – 88 1.5
Cape Verde 0 1 – 1 0.5 20 0 – 20 2.0
Côte d’Ivoire 19 8 1 28 0.4 672 96 33 801 5.0
Gambia 0 1 – 1 0.1 1 0 – 1 0.2
Ghana 12 30 1 43 0.4 542 202 10 754 7.2
Guinea 9 1 – 10 0.2 39 6 – 45 1.7
Guinea-Bissau 1 0 – 1 0.1 18 2 – 20 6.3
Liberia 1 1 – 2 0.1 113 9 – 121 17.7
Mali 1 0 – 1 0.0 102 0 – 102 1.9
Niger 1 0 – 1 0.0 98 0 7 105 3.3
Nigeria 24 3 18 45 0.1 1 506 32 282 1 819 1.4
Senegal 1 0 1 2 0.0 65 3 9 77 0.9
Sierra Leone 0 0 0 1 0.0 84 0 0 85 4.8
Togo 1 0 – 1 0.0 31 2 – 33 1.6
total West Africa 73 46 20 140 0.1 3 480 357 342 4 179 2.2
total Africa 202 211 117 530 0.1 8 991 2 075 2 843 13 908 1.3
China 1 172 937 1 409 3 518 0.4 13 687 8 834 18 687 41 208 1.3
Democratic People’s Republic of Korea
19 4 4 26 0.2 220 33 46 299 2.5
Japan 32 150 211 393 0.6 892 9 590 22 422 32 904 0.7
Mongolia 1 1 0 1 0.1 2 3 1 7 0.2
Republic of Korea
12 25 63 99 0.4 1 498 1 099 5 877 8 473 1.1
total east Asia 1 235 1 115 1 686 4 037 0.4 16 298 19 559 47 033 82 890 1.0
American Samoa
– – – – – – – – – –
Australia 11 42 21 74 0.7 695 2 806 2 061 5 562 0.8
taBle 6 (cont.)
Forestry sector’s contribution to employment and gross domestic product, 2006
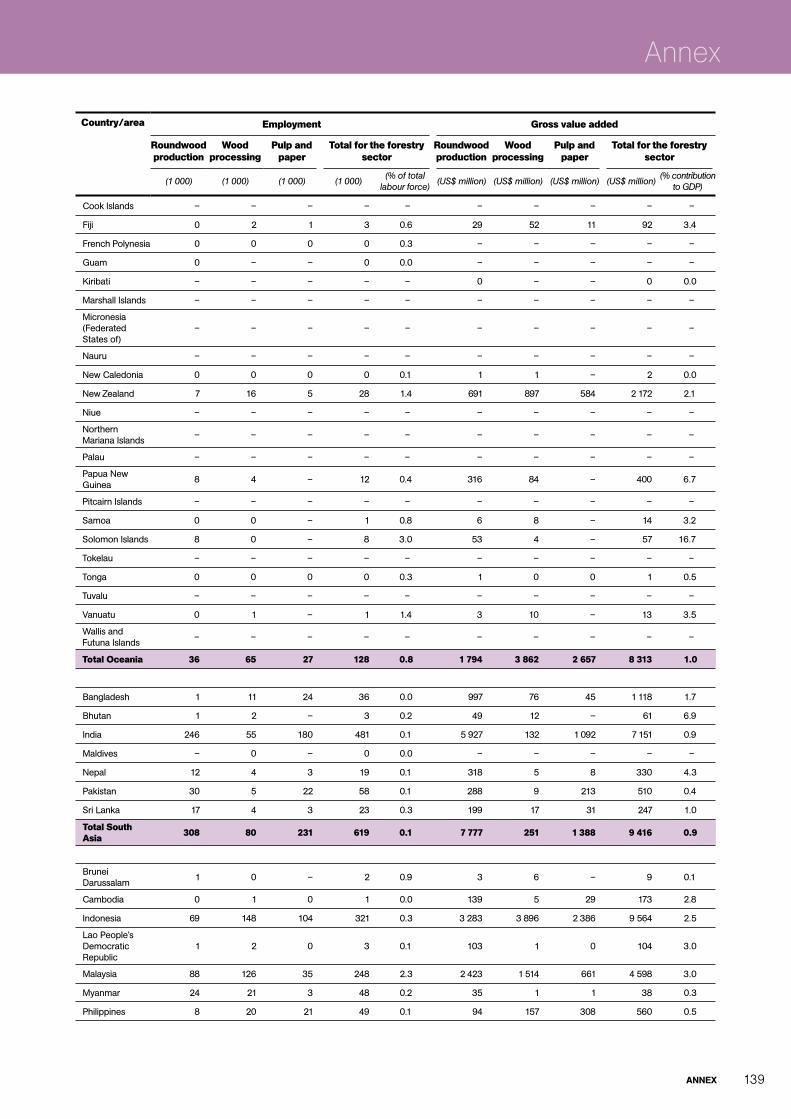
Annex 139
Annex
country/area employment gross value added
roundwood production
Wood processing
Pulp and paper
total for the forestry sector
roundwood production
Wood processing
Pulp and paper
total for the forestry sector
(1 000) (1 000) (1 000) (1 000)(% of total
labour force)(US$ million) (US$ million) (US$ million) (US$ million)
(% contribution to GDP)
Cook Islands – – – – – – – – – –
Fiji 0 2 1 3 0.6 29 52 11 92 3.4
French Polynesia 0 0 0 0 0.3 – – – – –
Guam 0 – – 0 0.0 – – – – –
Kiribati – – – – – 0 – – 0 0.0
Marshall Islands – – – – – – – – – –
Micronesia (Federated States of)
– – – – – – – – – –
Nauru – – – – – – – – – –
New Caledonia 0 0 0 0 0.1 1 1 – 2 0.0
New Zealand 7 16 5 28 1.4 691 897 584 2 172 2.1
Niue – – – – – – – – – –
Northern Mariana Islands
– – – – – – – – – –
Palau – – – – – – – – – –
Papua New Guinea
8 4 – 12 0.4 316 84 – 400 6.7
Pitcairn Islands – – – – – – – – – –
Samoa 0 0 – 1 0.8 6 8 – 14 3.2
Solomon Islands 8 0 – 8 3.0 53 4 – 57 16.7
Tokelau – – – – – – – – – –
Tonga 0 0 0 0 0.3 1 0 0 1 0.5
Tuvalu – – – – – – – – – –
Vanuatu 0 1 – 1 1.4 3 10 – 13 3.5
Wallis and Futuna Islands
– – – – – – – – – –
total oceania 36 65 27 128 0.8 1 794 3 862 2 657 8 313 1.0
Bangladesh 1 11 24 36 0.0 997 76 45 1 118 1.7
Bhutan 1 2 – 3 0.2 49 12 – 61 6.9
India 246 55 180 481 0.1 5 927 132 1 092 7 151 0.9
Maldives – 0 – 0 0.0 – – – – –
Nepal 12 4 3 19 0.1 318 5 8 330 4.3
Pakistan 30 5 22 58 0.1 288 9 213 510 0.4
Sri Lanka 17 4 3 23 0.3 199 17 31 247 1.0
total South Asia 308 80 231 619 0.1 7 777 251 1 388 9 416 0.9
Brunei Darussalam
1 0 – 2 0.9 3 6 – 9 0.1
Cambodia 0 1 0 1 0.0 139 5 29 173 2.8
Indonesia 69 148 104 321 0.3 3 283 3 896 2 386 9 564 2.5
Lao People’s Democratic Republic
1 2 0 3 0.1 103 1 0 104 3.0
Malaysia 88 126 35 248 2.3 2 423 1 514 661 4 598 3.0
Myanmar 24 21 3 48 0.2 35 1 1 38 0.3
Philippines 8 20 21 49 0.1 94 157 308 560 0.5

stAte oF the World’s Forests 2009140
country/area employment gross value added
roundwood production
Wood processing
Pulp and paper
total for the forestry sector
roundwood production
Wood processing
Pulp and paper
total for the forestry sector
(1 000) (1 000) (1 000) (1 000)(% of total
labour force)(US$ million) (US$ million) (US$ million) (US$ million)
(% contribution to GDP)
Singapore 0 2 4 6 0.3 – 38 181 218 0.2
Thailand 8 62 67 137 0.4 149 333 1 211 1 693 0.8
Timor-Leste – – – – – 1 – – 1 0.4
Viet Nam 22 120 70 212 0.5 674 370 328 1 372 2.4
total Southeast Asia 221 502 304 1 027 0.4 6 904 6 322 5 105 18 331 1.7
total Asia and the Pacific 1 800 1 763 2 248 5 811 0.3 32 774 29 994 56 183 118 951 1.0
Belarus 33 46 23 103 1.9 180 399 97 677 2.1
Republic of Moldova
4 1 2 6 0.3 7 10 5 21 0.7
Russian Federation
383 336 131 849 1.1 1 029 3 381 2 417 6 828 0.8
Ukraine 152 60 23 235 0.9 427 350 326 1 103 1.2
total ciS countries 572 443 178 1 193 1.1 1 643 4 141 2 845 8 628 0.9
Albania 2 1 0 2 0.1 6 4 3 13 0.2
Bosnia and Herzegovina
7 5 2 14 0.7 129 85 17 232 2.5
Bulgaria 15 23 11 49 1.2 59 97 77 232 0.9
Croatia 9 12 5 26 1.2 115 186 161 462 1.3
Czech Republic 35 83 20 138 2.5 832 1 225 596 2 654 2.1
Estonia 7 19 2 28 3.6 148 345 43 536 3.7
Hungary 8 37 16 61 1.4 142 319 330 790 0.8
Latvia 29 34 1 65 5.0 232 353 26 610 3.4
Lithuania 9 25 2 35 1.8 121 449 70 641 2.4
Montenegro 1 2 0 3 1.1 14 10 0 25 1.3
Poland 49 138 42 229 1.1 965 2 003 1 386 4 353 1.5
Romania 57 77 17 151 1.4 435 1 116 318 1 869 1.7
Serbia 6 11 9 26 0.7 81 39 72 191 0.6
Slovakia 12 34 7 54 1.8 221 470 266 957 1.9
Slovenia 6 11 5 22 2.3 125 263 181 569 1.8
The former Yugoslav Republic of Macedonia
4 3 1 8 0.8 18 3 3 24 0.4
total eastern europe 257 515 141 912 1.4 3 643 6 966 3 548 14 158 1.6
Andorra – 0 0 0 1.0 – – – – –
Austria 7 36 17 61 1.5 1 494 2 661 2 013 6 168 2.1
Belgium 2 14 14 31 0.7 191 1 114 1 424 2 729 0.8
Channel Islands – – – – – – – – – –
Denmark 4 15 7 25 0.9 201 1 002 602 1 805 0.8
Faeroe Islands – – – – – – – – – –
Finland 23 32 35 90 3.6 3 329 1 918 5 082 10 329 5.7
taBle 6 (cont.)
Forestry sector’s contribution to employment and gross domestic product, 2006

Annex 141
Annex
country/area employment gross value added
roundwood production
Wood processing
Pulp and paper
total for the forestry sector
roundwood production
Wood processing
Pulp and paper
total for the forestry sector
(1 000) (1 000) (1 000) (1 000)(% of total
labour force)(US$ million) (US$ million) (US$ million) (US$ million)
(% contribution to GDP)
France 31 87 74 191 0.7 5 107 4 147 5 653 14 907 0.7
Germany 44 165 134 342 0.8 2 259 9 315 12 324 23 898 0.9
Gibraltar – – – – – – – – – –
Greece 5 25 8 37 0.8 116 428 328 872 0.3
Holy See – – – – – – – – – –
Iceland 0 1 0 1 0.6 1 33 7 40 0.3
Ireland 2 9 3 15 0.9 132 524 278 934 0.5
Isle of Man – – – – – – – – – –
Italy 41 171 66 278 1.1 940 6 778 5 547 13 265 0.8
Liechtenstein 0 1 0 1 3.6 1 – – 1 0.0
Luxembourg 0 1 0 1 0.5 12 64 38 115 0.3
Malta – 0 0 0 0.2 0 3 5 8 0.2
Monaco – 0 – 0 0.2 – – – – –
Netherlands 2 17 22 41 0.6 65 1 341 1 873 3 279 0.6
Norway 5 15 7 26 1.1 274 1 245 716 2 234 0.8
Portugal 12 57 12 81 1.6 809 1 022 923 2 755 1.7
San Marino – 0 0 0 1.5 – – – – –
Spain 23 100 51 174 1.0 1 252 3 770 4 252 9 273 0.8
Sweden 22 38 36 95 2.0 3 108 2 706 6 939 12 753 3.8
Switzerland 5 35 12 52 1.3 311 2 537 1 316 4 164 1.1
United Kingdom 11 86 69 166 0.6 246 4 839 4 633 9 719 0.4
total Western europe 239 904 567 1 709 0.9 19 848 45 447 53 955 119 249 0.9
total europe 1 067 1 861 886 3 815 1.1 25 134 56 554 60 348 142 036 1.0
Anguilla – – – – – 0 – – 0 0.0
Antigua and Barbuda
– – – – – – – – – –
Aruba – 0 – 0 0.1 – – – – –
Bahamas 0 0 0 0 0.1 0 0 3 3 0.0
Barbados 0 0 1 2 1.2 0 8 40 49 1.8
Bermuda – 0 0 0 0.1 0 – – 0 0.0
British Virgin Islands
– – – – – 0 – – 0 0.0
Cayman Islands – – – – – – – – – –
Cuba 10 24 1 36 0.6 17 94 2 113 0.2
Dominica – – – – – 1 – – 1 0.5
Dominican Republic
0 0 1 1 0.0 7 – 9 17 0.1
Grenada 0 0 0 0 0.1 1 – – 1 0.2
Guadeloupe – – – – – 0 0 – 0 0.0
Haiti 1 0 0 1 0.0 5 0 – 6 0.1
Jamaica 1 1 1 3 0.2 6 2 52 60 0.6
Martinique 0 – – 0 0.0 0 0 – 0 0.0
Montserrat – – – – – – – – – –
Netherlands Antilles
– – 0 0 0.2 – – – – –
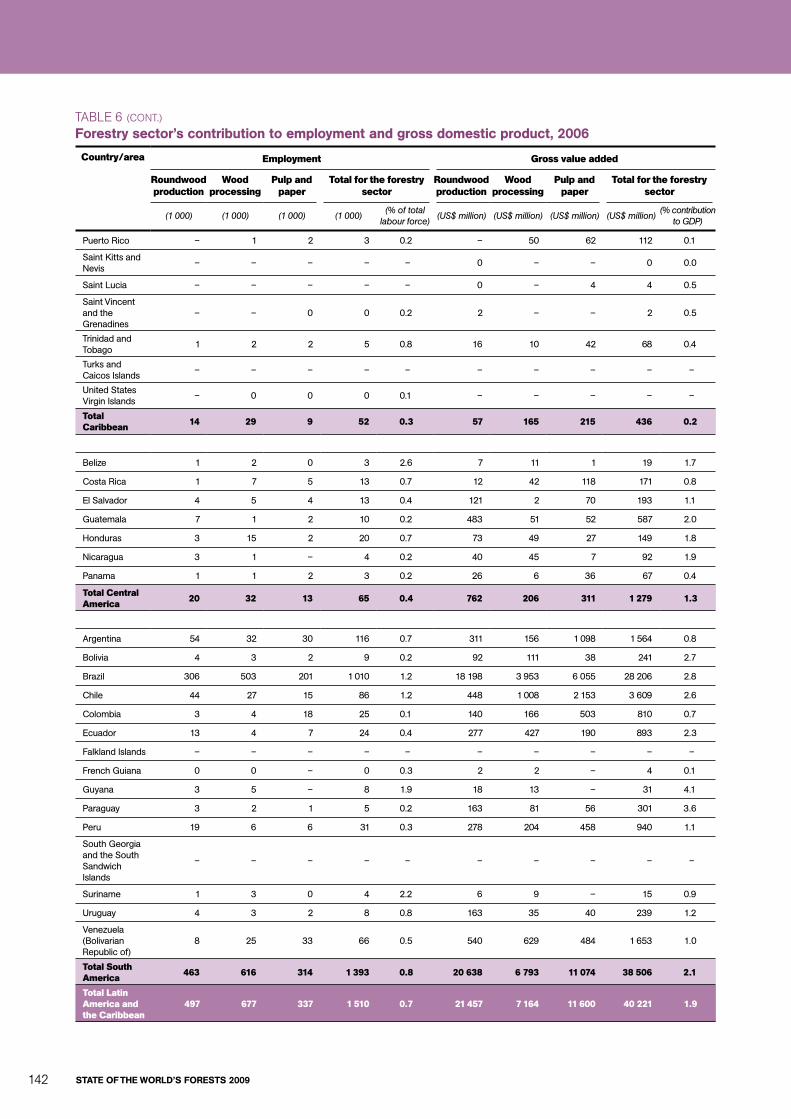
stAte oF the World’s Forests 2009142
country/area employment gross value added
roundwood production
Wood processing
Pulp and paper
total for the forestry sector
roundwood production
Wood processing
Pulp and paper
total for the forestry sector
(1 000) (1 000) (1 000) (1 000)(% of total
labour force)(US$ million) (US$ million) (US$ million) (US$ million)
(% contribution to GDP)
Puerto Rico – 1 2 3 0.2 – 50 62 112 0.1
Saint Kitts and Nevis
– – – – – 0 – – 0 0.0
Saint Lucia – – – – – 0 – 4 4 0.5
Saint Vincent and the Grenadines
– – 0 0 0.2 2 – – 2 0.5
Trinidad and Tobago
1 2 2 5 0.8 16 10 42 68 0.4
Turks and Caicos Islands
– – – – – – – – – –
United States Virgin Islands
– 0 0 0 0.1 – – – – –
total caribbean 14 29 9 52 0.3 57 165 215 436 0.2
Belize 1 2 0 3 2.6 7 11 1 19 1.7
Costa Rica 1 7 5 13 0.7 12 42 118 171 0.8
El Salvador 4 5 4 13 0.4 121 2 70 193 1.1
Guatemala 7 1 2 10 0.2 483 51 52 587 2.0
Honduras 3 15 2 20 0.7 73 49 27 149 1.8
Nicaragua 3 1 – 4 0.2 40 45 7 92 1.9
Panama 1 1 2 3 0.2 26 6 36 67 0.4
total central America 20 32 13 65 0.4 762 206 311 1 279 1.3
Argentina 54 32 30 116 0.7 311 156 1 098 1 564 0.8
Bolivia 4 3 2 9 0.2 92 111 38 241 2.7
Brazil 306 503 201 1 010 1.2 18 198 3 953 6 055 28 206 2.8
Chile 44 27 15 86 1.2 448 1 008 2 153 3 609 2.6
Colombia 3 4 18 25 0.1 140 166 503 810 0.7
Ecuador 13 4 7 24 0.4 277 427 190 893 2.3
Falkland Islands – – – – – – – – – –
French Guiana 0 0 – 0 0.3 2 2 – 4 0.1
Guyana 3 5 – 8 1.9 18 13 – 31 4.1
Paraguay 3 2 1 5 0.2 163 81 56 301 3.6
Peru 19 6 6 31 0.3 278 204 458 940 1.1
South Georgia and the South Sandwich Islands
– – – – – – – – – –
Suriname 1 3 0 4 2.2 6 9 – 15 0.9
Uruguay 4 3 2 8 0.8 163 35 40 239 1.2
Venezuela (Bolivarian Republic of)
8 25 33 66 0.5 540 629 484 1 653 1.0
total South America 463 616 314 1 393 0.8 20 638 6 793 11 074 38 506 2.1
total Latin America and the caribbean
497 677 337 1 510 0.7 21 457 7 164 11 600 40 221 1.9
taBle 6 (cont.)
Forestry sector’s contribution to employment and gross domestic product, 2006

Annex 143
Annex
country/area employment gross value added
roundwood production
Wood processing
Pulp and paper
total for the forestry sector
roundwood production
Wood processing
Pulp and paper
total for the forestry sector
(1 000) (1 000) (1 000) (1 000)(% of total
labour force)(US$ million) (US$ million) (US$ million) (US$ million)
(% contribution to GDP)
Canada 63 128 84 275 1.6 7 229 13 488 11 284 32 000 2.7
Greenland – – – – – – – – – –
Mexico 84 85 125 293 0.6 1 720 1 855 3 477 7 052 0.9
Saint Pierre and Miquelon
0 – – 0 0.0 – – – – –
United States of America
85 565 459 1 109 0.7 18 528 37 400 52 500 108 428 0.8
total North America 232 778 667 1 677 0.8 27 477 52 743 67 261 147 480 1.0
Armenia 2 1 0 3 0.2 4 1 2 7 0.1
Azerbaijan 2 2 0 4 0.1 2 3 1 6 0.0
Georgia 6 3 0 9 0.3 11 4 1 16 0.2
Kazakhstan 10 1 3 14 0.2 29 13 17 59 0.1
Kyrgyzstan 3 1 1 5 0.2 2 1 1 4 0.2
Tajikistan 2 0 0 3 0.1 0 0 0 1 0.0
Turkmenistan 2 0 – 2 0.1 0 0 – 0 0.0
Uzbekistan 6 1 0 7 0.1 2 9 2 14 0.1
total central Asia 34 8 5 47 0.1 51 32 24 107 0.1
Afghanistan – – – – – 4 2 – 5 0.1
Bahrain – 0 0 0 0.1 – 1 6 6 0.0
Cyprus 1 2 1 3 0.8 3 91 30 123 0.8
Iran (Islamic Republic of)
7 8 22 36 0.1 270 86 355 711 0.3
Iraq – 0 6 6 0.1 – 12 26 39 0.1
Israel 1 5 8 14 0.5 – 121 312 433 0.3
Jordan 0 4 4 8 0.3 – 16 70 86 0.7
Kuwait – 1 1 2 0.2 – 26 56 82 0.1
Lebanon – 3 6 10 0.7 1 63 189 253 1.1
Occupied Palestinian Territory
– 1 0 2 0.7 – 12 9 21 0.6
Oman – 1 1 2 0.2 – 20 15 35 0.1
Qatar – 5 0 5 1.5 – 73 16 89 0.2
Saudi Arabia 1 21 13 35 0.4 – – 279 279 0.1
Syrian Arab Republic
1 16 2 19 0.3 4 87 31 122 0.4
Turkey 33 89 45 167 0.5 1 342 609 834 2 786 0.7
United Arab Emirates
– 1 4 5 0.4 – – 81 81 0.0
Yemen – 3 2 5 0.1 – 31 22 54 0.3
total Western Asia 44 160 115 318 0.3 1 624 1 250 2 331 5 205 0.3
total Western and central Asia
78 168 120 365 0.2 1 675 1 282 2 355 5 312 0.3
totAL WorLD 3 876 5 459 4 374 13 709 0.4 117 508 149 811 200 589 467 908 1.0
Source: fao 2008b.

stAte oF the World’s Forests 2009144
Annex 145 e.g
. Val
lery
, uS
da
for
est S
ervi
ce/4
1780
32/w
ww
.fore
stry
imag
es.o
rg
references
stAte oF the World’s Forests 2009146
ACTED. 2006. Eco-tourism in Tajikistan: key challenges and opportunities.Paris,AgencyforTechnicalCooperationandDevelopment(availableatwww.untj.org/principals/minutes/TourismACTED.ppt).
Alexander, S.J., Weigand, J. & Blatner, K.A.2002.Nontimberforestproductcommerce.InE.T.Jones,R.J.McLain&J.Weigand,eds.Non timber forest products in the United States.Lawrence,USA,UniversityofKansasPress.
Amir, S. & Rechtman, O.2006.The development of forest policy in Israel in the 20th century: implications for the future. Haifa,Israel,CenterforUrbanandRegionalStudies,Technion–IsraelInstituteofTechnology.
ARC. 2006.RecFacts general statistics.Washington,DC,AmericanRecreationCoalition(availableatwww.funoutdoors.com/research).
ARC.2007. Forest service chief Gail Kimbell seeks to close gap between kids and nature.Newsrelease.Washington,DC(availableatwww.funoutdoors.com/node/view/1933).
Asia Forest Network. 2008. Where is the future for cultures and forests?Indigenous peoples and forest management in 2020.ThematicstudyfortheAsia-PacificForestrySectorOutlookStudy.Bangkok,FAORegionalOfficeforAsiaandthePacific.(inpress)
Audley, J.J., Papademetriou, D.G, Polaski, S. & Vaughan, S. 2004.NAFTA’s promise and reality: lessons from Mexico for the hemisphere.Washington,DC,CarnegieEndowmentforInternationalPeace(availableatwww.carnegieendowment.org/files/nafta1.pdf).
Baudin, A., Eliasson, L., Gustafsson, A., Hagström, L., Helstad, K., Nyrud, A.Q., Sande, J.B., Haartveit, E.Y. & Ziethén, R. 2005.ICTandthewoodindustry.InL.Hetemäki&S.Nilsson,eds.Information technology and the forest sector,pp.129–149.Vienna,InternationalUnionofForestResearchOrganizations(IUFRO).
Becker, G., Coleman, E., Hetsch, S., Kazemi, Y. & Prins, K. 2007.Mobilizing wood resources: can Europe’s forests satisfy the increasing demand for raw material and energy under sustainable forest management.Backgroundpaper,UNECE/FAOWorkshoponMobilizingWoodResources.11–12January2007.Geneva,Switzerland,UnitedNationsEconomicCommissionforEurope(UNECE).
Beecher, J.F. 2007.Wood,treesandnanotechnology.Nature Nanotechnology,2(8):466–467(availableatwww.nature.com/naturenanotechnology).
Bell, S., Tyrväinen, L., Sievänen, T., Pröbstl, U. & Simpson, M.2007.Outdoorrecreationandnaturetourism:aEuropeanperspective.Living Reviews in Landscape Research,1(2)(availableatlandscaperesearch.livingreviews.org/Articles/lrlr-2007-2/).
Bowe, S.A., Smith, R.L., Kline, D.E. & Araman, P.A. 2002.Asegmentalanalysisofcurrentandfuturescanningandoptimizingtechnologyinthehardwoodsawmillindustry.Forest Products Journal,52(3):68–76.
Brown, S. 2008. Beetletreekillreleasesmorecarbonthanfires.Nature News,23April(availableatwww.nature.com/news/2008/080423/full/news.2008.771.html).
Canadian Council of Forest Ministers. 2006. Criteria and indicators of sustainable forest management in Canada: national status 2005.Ottawa,NaturalResourcesCanada.
Carle, J.B. & Holmgren, P.2008.Woodfromplantedforests–aglobaloutlook2005–2030.Forest Products Journal.(inpress)
CEI-Bois, CEPF & CEPI. 2005.Innovative and sustainable use of forest resources: Vision 2030.AtechnologyplatforminitiativebytheEuropeanforest-basedsector.Brussels,EuropeanConfederationofWoodworkingIndustries,ConfederationofEuropeanForestOwners&ConfederationofEuropeanPaperIndustries.
CIFOR.2004.Operationalising the ecosystem approach – re-inventing research.ForestLivelihoodsBriefsNo.2.Bogor,Indonesia,CenterforInternationalForestryResearch(availableatwww.cifor.cgiar.org/publications/pdf_files/livebrief/livebrief0402e.pdf).
CIFOR.2008a.Best Brazil nut practice in Bolivia.Bogor,Indonesia(availableatwww.cifor.cgiar.org/Publications/Corporate/NewsOnline/NewsOnline43/brazil_nut.htm).
CIFOR.2008b.CIFOR’s strategy, 2008–2018: Making a difference for forests and people.Bogor,Indonesia(availableatwww.cifor.cgiar.org/publications/pdf_files/Books/CIFORStrategy0801.pdf).
Clark, M. 2007. PEFC presentation.ThirdInternationalWorkshoponConformityAssessment,RiodeJaneiro,Brazil,10–11December2007(availableatwww.inmetro.gov.br/noticias/eventos/avaliacaoConformidade/Palestras/michael_clark.pdf).
Comisión Nacional Forestal, Mexico. 2008.NorthAmericaForestOutlookStudy:Mexicocountryreport.(unpublishedSOFO2009contribution)
Conservation International. 2005.Biodiversity hotspots.Arlington,USA(availableatwww.biodiversityhotspots.org/xp/Hotspots/hotspots_by_region/).

reFerenCes 147
References
Contreras-Hermosilla, A., Gregersen, H.M. & White, A. 2008.Forest governance in countries with federal systems of government: lessons for decentralization.GovernanceBriefNo.39.Bogor,Indonesia,CIFOR.
de Brito Cruz, C.H. & de Mello, L.2006.Boosting innovation performance in Brazil.EconomicsDepartmentWorkingPaperNo.532.ECO/WKP(2006)60.Paris,OrganisationforEconomicCo-operationandDevelopment(OECD).
Dillaha, T., Ferraro P., Huang M., Southgate D., Upadhyaya, S. & Wunder, S. 2007.Payments for watershed services: regional syntheses. USAIDPESBriefNo.7.Washington,DC,UnitedStatesAgencyforInternationalDevelopment(USAID)(availableatwww.cifor.cgiar.org/pes/_ref/publications/index.htm).
Eckelmann, C.M.2005.An overview of silvicultural practices in the Caribbean – historic development, current practices and emerging issues.Bridgetown,FAOSubregionalOfficefortheCaribbean.(unpublished)
EEA. 2005.European environment outlook.Copenhagen,EuropeanEnvironmentAgency.
EEA. 2007.Europe’s environment: the fourth assessment.Copenhagen.
Environment News Service.2008a.SugarforbiofueltodisplaceKenya’sTanaDeltawildlife. 26June(availableatwww.ens-newswire.com/ens/jun2008/2008-06-26-03.asp).
Environment News Service.2008b.FloridatobuyoutsugarlandforEvergladesrestoration.25June(availableatwww.ens-newswire.com/ens/jun2008/2008-06-25-01.asp).
European Commission.2007.Key figures 2007: towards a European research area – science, technology and innovation.Brussels(availableatcordis.europa.eu/documents/documentlibrary/97946551EN6.pdf).
Evans, J. & Turnbull, J.2004.Plantation forestry in the tropics. 3rdedition.Oxford,UK,OxfordUniversityPress.
FAO.2001.Global Forest Resources Assessment 2000. Main report. FAOForestryPaperNo.140.Rome(alsoavailableatwww.fao.org/docrep/004/y1997e/y1997e00.htm).
FAO. 2003a. Forestry Outlook Study for Africa: regional report – opportunities and challenges towards 2020.FAOForestryPaperNo.141.Rome(alsoavailableatwww.fao.org/docrep/005/y4521e/y4521e00.htm).
FAO. 2003b.Past trends and future prospects for the utilisation of wood for energy,byJ.Broadhead,J.Bahdon&A.Whiteman.Global ForestProductsOutlookStudyWorkingPaperGFPOS/WP/05.Rome.
FAO.2004.Will buying tropical forest carbon benefit the poor? Evidence from Costa Rica,byS. Kerr,L.Lipper,A.S.P.Pfaff,R.Cavatassi,B.Davis,J.Hendy&A.Sanchez. ESAWorkingPaperNo.04-20.Rome(alsoavailableatftp://ftp.fao.org/docrep/fao/007/ae402e/ae402e00.pdf).
FAO. 2005a.In search of excellence: exemplary forest management in Asia and the Pacific,byP.B.Durst,C.Brown,H.D.Tacio&M.Ishikawa,eds.RAPPublication2005/2.Bangkok,FAORegionalOfficeforAsiaandthePacific(alsoavailableatwww.fao.org/docrep/007/ae542e/ae542e00.htm).
FAO. 2005b.State of the World’s Forests 2005.Rome(alsoavailableatwww.fao.org/docrep/007/y5574e/y5574e00.htm).
FAO. 2005c.Urban and peri-urban forestry and greening in West and Central Asia: experience, constraints and prospects, byU. Akerlund.FOWECAThematicStudyReport.Rome(availableatftp://ftp.fao.org/docrep/fao/009/ah238e/ah238e00.pdf).
FAO.2005d.Wildlife issues and development prospects in West and Central Asia,byR.Czudek.WildlifeManagementWorkingPaperNo.9.Rome(alsoavailableatwww.fao.org/docrep/010/ai548e/ai548e00.htm).
FAO. 2006a. Global Forest Resources Assessment 2005 – progress towards sustainable forest management. FAOForestryPaperNo.147. Rome(alsoavailableatwww.fao.org/docrep/008/a0400e/a0400e00.htm).
FAO. 2006b. Global planted forests thematic study: results and analysis,byA.DelLungo,J.Ball&J.Carle.PlantedForestsandTreesWorkingPaperNo.38.Rome(alsoavailableatwww.fao.org/forestry/site/10368/en).
FAO.2006c.Tendencias y perspectivas del sector forestal en América Latina y el Caribe.FAOForestryPaperNo.145.Rome(alsoavailableatwww.fao.org/docrep/009/a0470s/a0470s00.htm).
FAO. 2006d.Global Forest Resources Assessment 2005 – report on fires in the Central Asian region and adjacent countries,byJ.G.Goldammer.FireManagementWorkingPaperFM/16.Rome(alsoavailableatwww.fao.org/docrep/009/j7572e/j7572e00.htm).
FAO.2006e.Non wood forest products in Central Asia and Caucasus. FOWECAThematicStudy.Rome(alsoavailableatwww.fao.org/docrep/010/ag268e/ag268e00.htm).
FAO.2006f.Responsible management of planted forests: voluntary guidelines.PlantedForestsandTreesWorkingPaperNo.37.Rome(alsoavailableatwww.fao.org/docrep/009/j9256e/j9256e00.htm).
stAte oF the World’s Forests 2009148
FAO.2007a.FemaleentrepreneursintheNWFPworld:sheabuttersaleschangeAfricanwomen’splight. Non-Wood News,15:18(availableatwww.fao.org/docrep/010/a1189e/a1189e00.htm).
FAO.2007b.FAO Statistical Yearbook 2005–2006.Rome.
FAO. 2007c.People, forests and trees in West and Central Asia: outlook for 2020.FAOForestryPaperNo.152.Rome(alsoavailableatwww.fao.org/docrep/009/a0981e/a0981e00.htm).
FAO. 2007d.The Global Environmental Facility and payments for ecosystem services: a review of current initiatives and recommendations for future PES support by GEF and FAO programs,byP.Gutman&S.Davidson.PESALPapersSeriesNo.1.Rome(alsoavailableatwww.fao.org/es/esa/PESAL/attachments/PESAL1_Gutman.pdf).
FAO.2007e.The State of Food and Agriculture 2007: paying farmers for environmental services.Rome(alsoavailableatwww.fao.org/docrep/010/a1200e/a1200e00.htm).
FAO. 2007f.Corporate private sector dimensions in planted forest investments,byD.A.Neilson.PlantedForestsandTreesWorkingPaperFP/40E(availableatwww.fao.org/forestry/site/10368/en/).
FAO. 2007g.World bamboo resources: a thematic study prepared in the framework of the Global Forest Resources Assessment 2005,byM.Lobovikov,S.Paudel,M.Piazza,H.RenandJ.Wu.Non-WoodForestProductsNo.18.Rome(alsoavailableatwww.fao.org/docrep/010/a1243e/a1243e00.htm).
FAO.2007h.The role of coastal forests in the mitigation of tsunami impacts,byK.Forbes&J.Broadhead.RAPPublication2007/1.Bangkok,FAORegionalOfficeforAsiaandthePacific.
FAO.2008a.ForesSTATstatisticaldatabase(availableatfaostat.fao.org).
FAO.2008b. Contribution of the forestry sector to national economies, 1990–2006,byA.Lebedys.Rome.(inpress)
FAO.2008c.Global forest product projections,byR.Jonsson&A.Whiteman.Rome.(inpress)
FAO. 2008d. Forests and energy.Key issues. FAOForestryPaperNo.154.Rome(alsoavailableatwww.fao.org/docrep/010/i0139e/i0139e00.htm).
FAO.2008e.Human wildlife conflict in Africa – causes, consequences and management strategies.FAOForestryPaper.Rome.(inpress)
FAO. 2008f.The status and trends of forests and forestry in West Asia,byQ.Ma.SubregionalreportoftheForestryOutlookStudyforWestandCentralAsia.ForestryPolicyandInstitutionsWorkingPaper20.Rome(alsoavailableatwww.fao.org/docrep/010/k1652e/k1652e00.htm).
FAO. 2008g.Forests and forestry in Central Asia and the Caucasus,byM.Uemoto.ForestPolicyandInstitutionsWorkingPaper.Rome.(inpress)
FAO.2008h.Re-inventing forestry agencies – experiences of institutional restructuring in Asia and the Pacific,byP.Durst,C.Brown,J.Broadhead,R.Suzuki,R.Leslie&A.Inoguchi,eds.RAPPublication2008/05.Bangkok,FAORegionalOfficeforAsiaandthePacific.
FECOFUN.2006.About us.Kathmandu,FederationofCommunityForestUsersNepal(availableatwww.fecofun.org/about.php).
Friday Offcuts. 2008.SovereignwealthFundsstartinvestingintimberlands.18April(availableatwww.fridayoffcuts.com/dsp_newsletter.cfm?id=266).
Frost, P. & Bond, I.2008.TheCAMPFIREprogrammeinZimbabwe:paymentsforwildlifeservices.Ecological Economics,65(4):776–787.
FSC.2008.Global FSC certificates: type and distribution.Presentation(availableatwww.fsc.org/ppt_graphs.html).
Gorte, R.W. & Ramseur, J.L.2008.Forest carbon markets: potentials and drawbacks,CRSReportforCongress,RL34560.Washington,DC,CongressionalResearchService.
Government of Cyprus. 2005.FOWECAcountryoutlookpaperforCyprus.Nicosia,ForestryDepartment.
Government of Oman.2005.FOWECAcountryoutlookpaper.Salalah,Oman,GeneralDirectorateofAnimalWealth,MinistryofAgricultureandFisheries.
Griffin, C.2007.An engaged and engaging tourism safety and security policy dialogue.PresentedattheAssociationofCaribbeanStates(ASC)RegionalPolicyDialogueonTouristSafetyandSecurity,St.Ann’s,TrinidadandTobago,7July(availableatwww.acs-aec.org/Tourism/TSS/english.htm).
Hamilton, K., Sjardin, M., Marcello, T. & Xu, G.2008.Forging a frontier: state of the voluntary carbon markets 2008. Washington,DC,andLondon,EcosystemMarketPlaceandNewCarbonFinance.
Hetemäki, L. & Nilsson, S. 2005.Information technology and the forest sector.IUFROWorldSeriesVol.18.Vienna,IUFRO.
Houllier, F., Novotny, J., Päivinen, R., Rosén, K., Scarascia-Mugnozza, G. & von Teuffel, K. 2005.Future forest research strategy for a knowledge-based forest cluster: an asset for sustainable Europe.AvisionpaperofEuropeannationalforestresearchinstitutes.EFIDiscussionPaper11.Joensuu,Finland,EuropeanForestResearchInstitute.

reFerenCes 149
References
IAASTD.2008.Executive summary of thesynthesis report.InternationalAssessmentofAgriculturalKnowledge,ScienceandTechnologyforDevelopment(availableatwww.agassessment.org/index.cfm?Page=IAASTD%20Reports&ItemID=2713).
IEA. 2007.World Energy Outlook 2007.Paris,InternationalEnergyAgency.
ILO. 2001. Globalization and sustainability: the forest and wood industries on the move.Geneva,Switzerland,InternationalLabourOrganization.
IMF. 2008.World Economic Outlook April 2008.WorldEconomicandFinancialSurveys.Washington,DC,InternationalMonetaryFund.
Ince, P., Schuler, A., Spelter, H. & Luppold, W. 2007.Globalization and structural change in the US forestry sector: an evolving context for sustainable forest management.GeneralTechnicalReportFPL-GTR-170.Washington,DC,USDAForestService.
International EucalyptusGenome Network (EUCAGEN). 2007.Eucalyptus tapped as the next tree genome to be sequenced, characterized & harnessed for bioenergy, carbon sequestration, and other industrial applications.Pressrelease(availableatwww.ieugc.up.ac.za).
IPCC. 2007.Climate change 2007: synthesis report. Contribution of Working Groups I, II and III to the Fourth Assessment Report of the Intergovernmental Panel on Climate Change.Geneva,Switzerland,IntergovernmentalPanelonClimateChange(alsoavailableatwww.ipcc.ch/ipccreports/ar4-syr.htm).
ITTO. 2005.Achieving the ITTO Objective 2000 and sustainable forest management in Mexico: executive summary.ReportsubmittedtotheInternationalTropicalTimberCouncilbytheDiagnosticMission,ITTCXXXIX/5,thirty-ninthSession.Yokohama,Japan.
ITTO. 2006.Status of tropical forest management 2005.ITTOTechnicalSeriesNo.24.Yokohama,Japan.
ITTO. 2008.Developing forest certification: towards increasing comparability and acceptance of forest certification systems worldwide.ITTOTechnicalSeriesNo.29.Yokohama,Japan.
IUFRO. 2008.ListofIUFRO’smemberorganizations.Vienna,InternationalUnionofForestResearchOrganizations(availableatwww.iufro.org/membership/members/).
Jenkins, M., Scherr, S.J. & Inbar, M. 2004. Marketsforbiodiversityservices:potentialrolesandchallenges. Environment,46(4):32–42.
Kaimowitz, D.2007.The prospects for reduced emissions from deforestation and degradation (REDD) in Mesoamerica.NewYork,USA,FordFoundation.
MacCleery, D. 1992.American forests: a history of resiliency and recovery.FS-540.Durham,USA,USDA–ForestService.
MacCleery, D. 2008.Re-inventingtheUnitedStatesForestService:evolutionfromcustodialmanagement,toproductionforestry,toecosystemmanagement. In:Re-inventing forestry agencies: experiences of institutional restructuring in Asia and the Pacific,editedbyP.Durst,C.Brown,J.Broadhead,R.Suzuki,R.Leslie&A.Inoguchi.RAPPublication2008/05.Bangkok,FAORegionalOfficeforAsiaandthePacific.
Malagnoux, M., Sène, E.H. & Atzmon, N. 2007.Forests,treesandwaterinaridlands:adelicatebalance.Unasylva,229:24–29.
Mantau, U., Steierer, F., Hetsch, S. & Prins, C. 2008. Wood resources availability and demands – Part I: National and regional wood resource balances 2005.BackgroundpapertotheUNECE/FAOWorkshoponWoodBalances.Geneva,Switzerland,UNECE.
Martin, R.M.2008.Deforestation,land-usechangeandREDD.Unasylva,230:3–11.
Metafore.2007.Green building programs(availableatwww.metafore.org/index.php?p=Green_Building_Programs&s=176).
Mubin, S.F. 2004.Outlook of the paper industry in the GCC(availableatwww.highbeam.com/doc/1P3-777403821.html).
Muñoz-Piña, C., Guevara, A., Torres, J.M. & Braña, J. 2006. Paying for the hydrological services of Mexico’s forests. Bogor,Indonesia,CIFOR.
Nair, C.T.S. 2004.Whatdoesthefutureholdforforestryeducation?Unasylva,216:3–9.
Natural Resources Canada.2007a.The state of Canada’s forests.Annual report 2007.Ottawa(alsoavailableatforetscanada.rncan.gc.ca/rpt).
Natural Resources Canada.2007b.Responding to the mountain pine beetle infestation(availableatcanadaforests.nrcan.gc.ca/articletopic/138).
Natural Resources Canada.2008a.NorthAmericanForestOutlookStudy:Canadacountryreport.Ottawa.(unpublishedSOFO2009contribution)
Natural Resources Canada.2008b. Leading by innovation: forest science and technology, part 3(availableatcanadaforests.nrcan.gc.ca/articletopic/83?format=print).
Neilson, D. 2007.Prospectsforchangeininternationalinvestmentpatternsinforestry.PaperpresentedattheInternationalConferenceontheFutureofForestsinAsiaandthePacific:Outlookfor2020,ChiangMai,Thailand,16–18October2007.

stAte oF the World’s Forests 2009150
Nyrud, A.Q. & Devine, Å.2005.E-Commerce.InL.Hetemäki&S.Nilsson,eds.Information technology and the forest sector,pp.49–64.Vienna,IUFRO.
O’Loughlin, C. 2008.Institutionalrestructuring,reformsandotherchangeswithintheNewZealandforestrysectorsince1986. In:Re-inventing forestry agencies: Experiences of institutional restructuring in Asia and the Pacific,editedbyP.Durst,C.Brown,J.Broadhead,R.Suzuki,R.Leslie&A.Inoguchi.RAPPublication2008/05.Bangkok,FAORegionalOfficeforAsiaandthePacific.
Parrotta, J.A. & Agnoletti, M. 2007. Traditionalforestknowledge:challengesandopportunities. Forest Ecology and Management,249:1–4.
PATA.2008.Asia Pacific tourism revenues set to soar to US 4.6 trillion by 2010.PacificAsiaTravelAssociation(availableatwww.forimmediaterelease.net/pm/1244.html).
PEFC.2008.Statistical figures on certification(availableatregister.pefc.cz/statistics.asp).
Peksa-Blanchard, M., Dolzan, P., Grassi, A., Heinimo, J., Junginger, M., Ranta, T. & Walter, A. 2007. Global wood pellets markets and industry: policy drivers, market status and raw material potential.IEABioenergyTask40(availableatwww.bioenergytrade.org).
PwC. 2007a.Risks and rewards: forest, paper & packaging in South America.NewYork,USA,PricewaterhouseCoopers(alsoavailableatwww.pwc.com).
PwC. 2007b.South America becomes a global player in the forest, paper and packaging sector.NewYork,USA(availableatwww.pwc.com).
Reitzer, R. 2007.Technology roadmap: applications of nanotechnology in the paper industry(availableatwww.jyu.fi/science/muut_yksikot/nsc/en/pdf/nanopap).
Renz, L. & Atienza, J. 2006.International grantmaking update: a snapshot of US foundation trends.NewYork,USA,FoundationCenter(alsoavailableatfoundationcenter.org/gainknowledge/research/pdf/intl_update_2006.pdf).
Roughley, D.J. 2005.Nanotechnology: implications for the wood products industry.Finalreport.NorthVancouver,Canada,ForintekCanadaCorporation.
Sample, V.A. 2007.Introductiontothe2007PinchotDistinguishedLecture(Theriseandfallofthetimberinvestmentmanagementorganizations:ownershipchangesinUSforestlands,byC.S.Binkley)(availableatwww.pinchot.org/files/Binkley.DistinguishedLecture.2007.pdf).
Schmitt, C.B., Belokurov, A., Besançon, C., Boisrobert, L., Burgess, N.D., Campbell, A., Coad, L., Fish, L., Gliddon, D., Humphries, K., Kapos, V., Loucks, C., Lysenko, I., Miles, L., Mills, C., Minnemeyer, S., Pistorius, T., Ravilious, C., Steininger, M. & Winkel, G. 2008.Global ecological forest classification and forest protected area gap analysis – analyses and recommendations in view of the 10% target for forest protection under the Convention on Biological Diversity (CBD).Freiburg,Germany,FreiburgUniversityPress.
Schulze, M., Grogan, J. & Vidal, E.2007.TechnicalchallengestosustainableforestmanagementinconcessionsonpubliclandsintheBrazilianAmazon.Journal of Sustainable Forestry,26(1):61–76.
Shackleton, S.E., Shanley, P. & Ndoye, O.2007.Invisiblebutviable:recognisinglocalmarketsfornon-timberforestproducts.International Forestry Review,9(3):697–712.
Sheppard, S.R.J. & Meitner, M.J. 2005.Usingmulti-criteriaanalysisandvisualizationforsustainableforestmanagementplanningwithstakeholdergroups.Forest Ecology and Management,207:171–187.
SME Toolkit India.2008.Environment Law Notification No: S.O. 525(E) (23-Apr-04) CAMPA – Constitution (availableatindia.smetoolkit.org/india).
Task Force on the Future of American Innovation.2005.The knowledge economy: is the United States losing its competitive edge? Washington,DC.
Temu, A.2004.AfricasouthoftheSahara.InTrendsinforestryeducationinSoutheastAsiaandAfrica,1993to2002:preliminaryresultsoftwosurveys.Unasylva,216:17–21.
TerrAfrica. 2006.BackgroundinformationonTerrAfrica.Brochure(availableat www.terrafrica.org/default.asp?pid=7665368).
TIES.2007.Resources: ecotourism in Asia Pacific.Washington,DC,TheInternationalEcotourismSociety.
TNC.2004. Final report: conservation easement working group.Arlington,USA,TheNatureConservancy.
Tomaselli, I. & Sarre, A. 2005.Brazilgetsnewforestlaw.ITTO Tropical Forest Update,15(4):7.
UN. 2006a.World economic and social survey 2006: diverging growth and development.NewYork,USA,UnitedNations.
UN. 2006b. Delivering as one.ReportoftheSecretary-General’sHigh-LevelPanel.NewYork,USA.
UN.2008a.WorldUrbanizationProspects:The2007RevisionPopulationDatabase(availableatesa.un.org/unup).

reFerenCes 151
References
UN.2008b.Commondatabase(availableatunstats.un.org/unsd/cdb/cdb_help/cdb_quick_start.asp).
UN. 2008c.MillenniumDevelopmentGoalsIndicatorsdatabaseseries:terrestrialareasprotected(availableatmdgs.un.org/unsd/mdg/SeriesDetail.aspx?srid=783&crid).
UN.2008d.World Urbanization Prospects: The 2007 Revision – Highlights.NewYork,USA(alsoavailableatwww.un.org/esa/population/publications/wup2007/2007WUP_Highlights_web.pdf).
UN.2008e.Commoditytradestatisticsdatabase(availableatcomtrade.un.org).
UN. 2008f.Energystatisticsdatabase:charcoaldata(availableatunstats.un.org/unsd/energy/edbase.htm).
UNECE & FAO. 2005.European Forest Sector Outlook Study1960–2000–2020: main report.Geneva,Switzerland.
UNECE & FAO. 2006a. Proceedings, UNECE/FAO policy forum: public procurement policies on wood and paper products and their impacts on sustainable forest management and timber markets.Geneva, Switzerland, 5 October.Rome(alsoavailableatwww.fao.org/docrep/009/a0914e/a0914e00.htm).
UNECE & FAO.2006b.Forest Products Annual Market Review, 2005–2006.GenevaTimberandForestStudyPaper21.NewYork,USA,andGeneva,Switzerland,UnitedNationsPublications(alsoavailableatwww.unece.org/trade/timber/tc-publ.htm).
UNECE & FAO.2007. Forest Products Annual Market Review, 2006–2007.GenevaTimberandForestStudyPaper22.NewYork,USA,andGeneva,Switzerland,UnitedNationsPublications(alsoavailableatwww.unece.org/trade/timber/tc-publ.htm).
UNECE & FAO.2008.Forests and water. Note by the secretariat.66thsessionoftheTimberCommitteeand34thsessionoftheEuropeanForestryCommission,Rome,21–24October2008.Geneva,Switzerland.
UNECE, FAO & ILO. 2003.Report on the seminar on close to nature forestry.DocumentTIM/EFC/WP.1/SEM.57/2003/3.Geneva,Switzerland,UNECE.
UNECE, MCPFE & FAO. 2007. State of Europe’s forests 2007 – The MCPFE report on sustainable forest management in Europe.Warsaw,MinisterialConferenceontheProtectionofForestsinEurope(MCPFE)LiaisonUnit.
UNEP.2007.Global environment outlook (GEO 4).Nairobi,UnitedNationsEnvironmentProgramme(alsoavailableatwww.unep.org/geo/).
UNESCAP.2007. Millennium Development Goals: progress in Asia and the Pacific 2007.Bangkok,UNEconomicandSocialCommissionforAsiaandthePacific.
UNFF. 2004.Traditional forest-related knowledge. Report of the Secretary-General.E/CN.18/2004/7.UnitedNationsForumonForests(availableatwww.un.org/esa/forests/documents-unff.html#4).
UNU. 2007.Overcoming one of the greatest environmental challenges of our times: re-thinking policies to cope with desertification.PolicybriefbasedontheJointInternationalConference“DesertificationandInternationalPolicyImperatives”,Algiers,17–19December2006. Tokyo,UnitedNationsUniversity.
UNWTO.2008.Asia Pacific Newsletter,11(1).Madrid,UNWorldTourismOrganization(alsoavailableatwww.unwto.org/asia/news/en/newsle.php?op=2&subop=2).
US DoE. 2006.Forest products industry technology roadmap,preparedbyAgenda2020TechnologyAlliance.Washington,DC,UnitedStatesDepartmentofEnergy(alsoavailableatwww.agenda2020.org).
US EPA.2008.Mitigation banking factsheet.Washington,DC,UnitedStatesEnvironmentalProtectionAgency(alsoavailableatwww.epa.gov/OWOW/wetlands/facts/fact16.html).
US Forest Service. 2008.NorthAmericanForestOutlookStudy:UScountryreport.(unpublishedSOFO2009contribution)
USAID.2006.Biodiversity in Latin America and the Caribbean.Washington,DC,UnitedStatesAgencyforInternationalDevelopment(alsoavailableatwww.usaid.gov/locations/latin_america_caribbean/issues/biodiversity_issue.html).
USAID. 2008.The shea value chain: a uniquely African industry(availableatwww.watradehub.com/index.php?option=com_content&task=view&id=507&Itemid=117).
USDA. 2004.Rural poverty at a glance.RuralPovertyResearchReportNo.10.Washington,DC,UnitedStatesDepartmentofAgriculture.
USGBC.2008.What is LEED?Washington,DC,UnitedStatesGreenBuildingCouncil(alsoavailableatwww.usgbc.org/DisplayPage.aspx?CMSPageID=222).
van Ree, R. & Annevelink, B.2007.Status report biorefinery 2007.Wageningen,theNetherlands,AgrotechnologyandFoodSciencesGroup(alsoavailableatwww.biorefinery.nl/publications).
Wang, T., Hamann, A., Aitken, S., O’Neill, G., Yanchuk, A. & Spittlehouse, D.2008.Useofgeneticvariationinforesttreestoadapttochangingclimate.Presentedattheconference“Adaptationofforestsandforestmanagementtochangingclimatewithemphasisonforesthealth:areviewofscience,policies,andpractices”,Umeå,Sweden,25–28August.
stAte oF the World’s Forests 2009152
WBCSD & WRI.2007.Sustainable procurement of wood and paper-based products.Geneva,Switzerland&Washington,DC,WorldBusinessCouncilforSustainableDevelopment&WorldResourcesInstitute.
Welford, L. & Le Breton, G. 2008. Bridgingthegap:PhytoTradeAfrica’sexperienceofthecertificationofnaturalproducts. Forests, Trees and Livelihoods,18:69–79.
World Bank. 2004.Poverty in Mexico: an assessment of conditions, trends and government strategy,ReportNo.28612-ME.Washington,DC.
World Bank. 2006. Doing business in 2007: how to reform. Washington,DC.
World Bank.2007a.World Development Indicators. Washington,DC.
World Bank.2007b.WDR/Latin America and the Caribbean: developed country subsidies, an obstacle for agricultural development. Agribusiness and biofuels are transforming the sector.SeriesNo.2008/080/DEC(availableatweb.worldbank.org).
World Energy Council. 2005.Regional energy integration in Africa. London(alsoavailableatwww.worldenergy.org/documents/integrationii.pdf).
World Resources Institute.2007.EarthTrends:January 2007 monthly update: forest certification and the path to sustainable forest management(availableatearthtrends.wri.org/updates/node/156).

Cover photos:
Front, left: FAO/FO-6120/M.C. Yang
Front, centre: R. Faidutti
Front, right: FAO/FO-6664/M. Kashio
Copies of FAo publications can be requested from:
SALES & MARKETING GROUP
Communication Division
Food and Agriculture Organization of the United Nations
Viale delle Terme di Caracalla - 00153 Rome, Italy
E-mail: [email protected]
Fax: (+39) 06 57053360
Web site: www.fao.org
Back, left: FAO/FO-5043/B. héois
Back, centre: UK Forestry Commission/1057657/J. McFarlane
Back, right: FAO/FO-6003/B. Vivattana
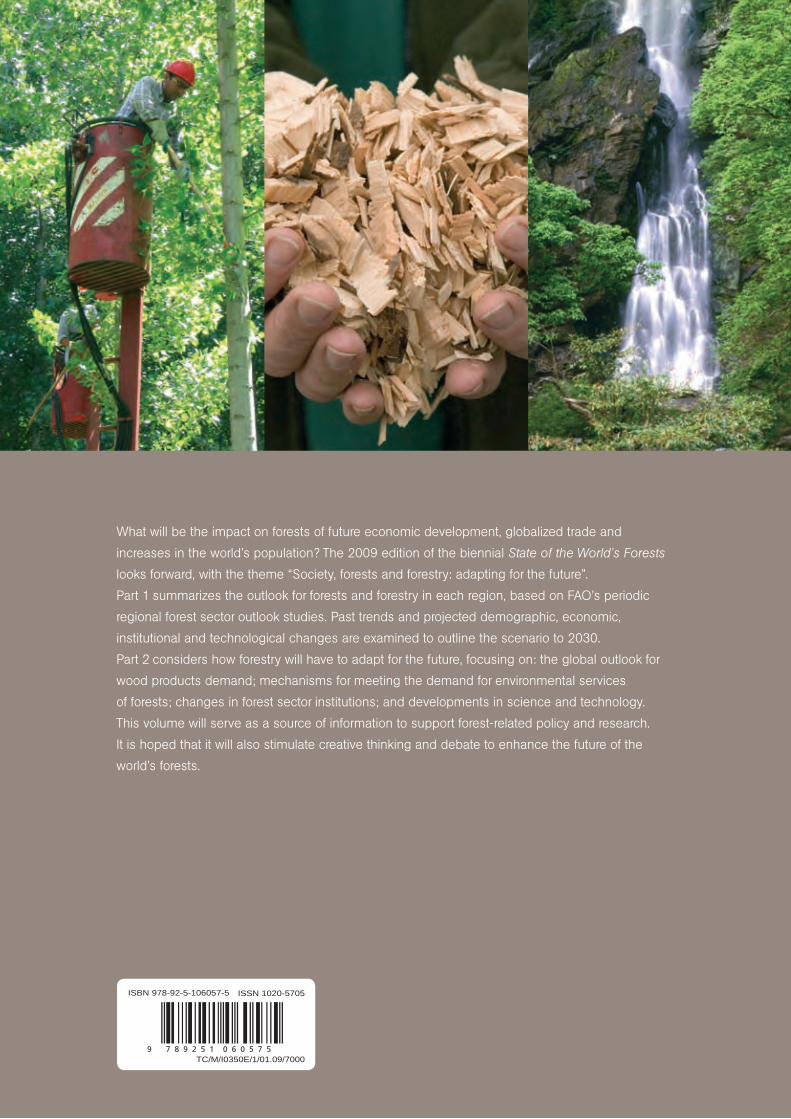
What will be the impact on forests of future economic development, globalized trade and
increases in the world’s population? The 2009 edition of the biennial State of the World’s Forests
looks forward, with the theme “Society, forests and forestry: adapting for the future”.
Part 1 summarizes the outlook for forests and forestry in each region, based on FAO’s periodic
regional forest sector outlook studies. Past trends and projected demographic, economic,
institutional and technological changes are examined to outline the scenario to 2030.
Part 2 considers how forestry will have to adapt for the future, focusing on: the global outlook for
wood products demand; mechanisms for meeting the demand for environmental services
of forests; changes in forest sector institutions; and developments in science and technology.
This volume will serve as a source of information to support forest-related policy and research.
It is hoped that it will also stimulate creative thinking and debate to enhance the future of the
world’s forests. 2009
STATe OF The
World’s Forests
STATe O
F The
Wo
rld
’s Fo
re
sts
2009
Iss
N 1020-5705
FAoTC/M/I0350E/1/01.09/7000
ISBN 978-92-5-106057-5 ISSN 1020-5705
9 7 8 9 2 5 1 0 6 0 5 7 5