alexey zakharov, sirkka-liisa jämsä-jounela
DESCRIPTION
Optimization of the Pulp Mill Economical Efficiency; study on the behavior effect of the economically significant variables. Alexey Zakharov, Sirkka-Liisa Jämsä-Jounela. Content The Pulp Mill benchmark problem (developed by F. Doyle) Idea of the optimization Approximation methods - PowerPoint PPT PresentationTRANSCRIPT

Optimization of the Pulp Mill Economical Efficiency; study on the behavior effect of the economically significant variables
Alexey Zakharov, Sirkka-Liisa Jämsä-Jounela
Content
The Pulp Mill benchmark problem (developed by F. Doyle)
Idea of the optimization Approximation methods Comparison of the results Conclusion
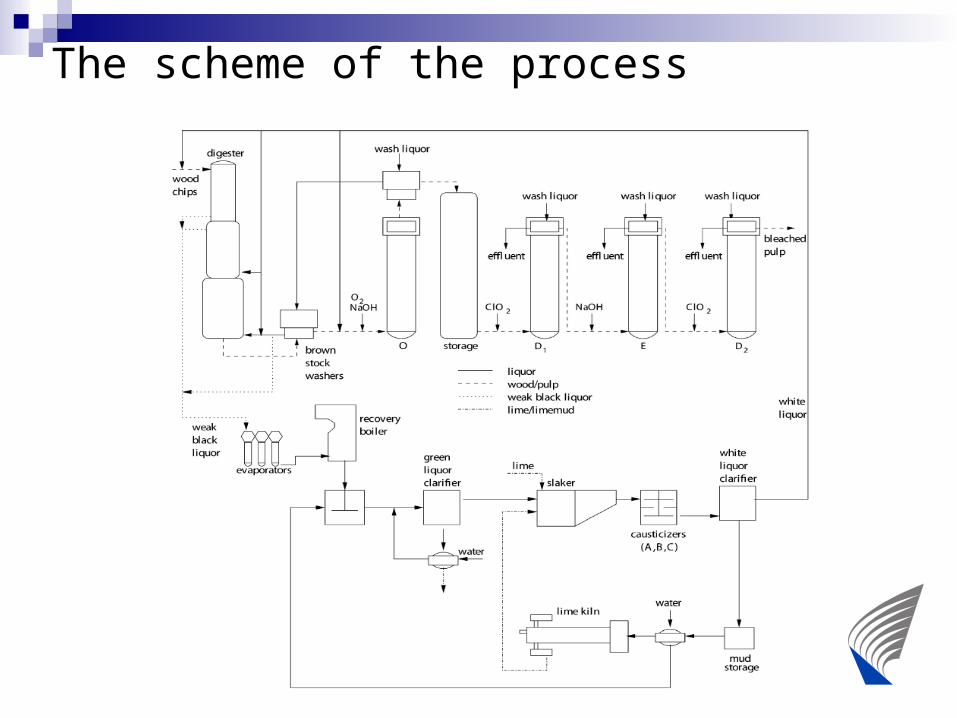
The scheme of the process
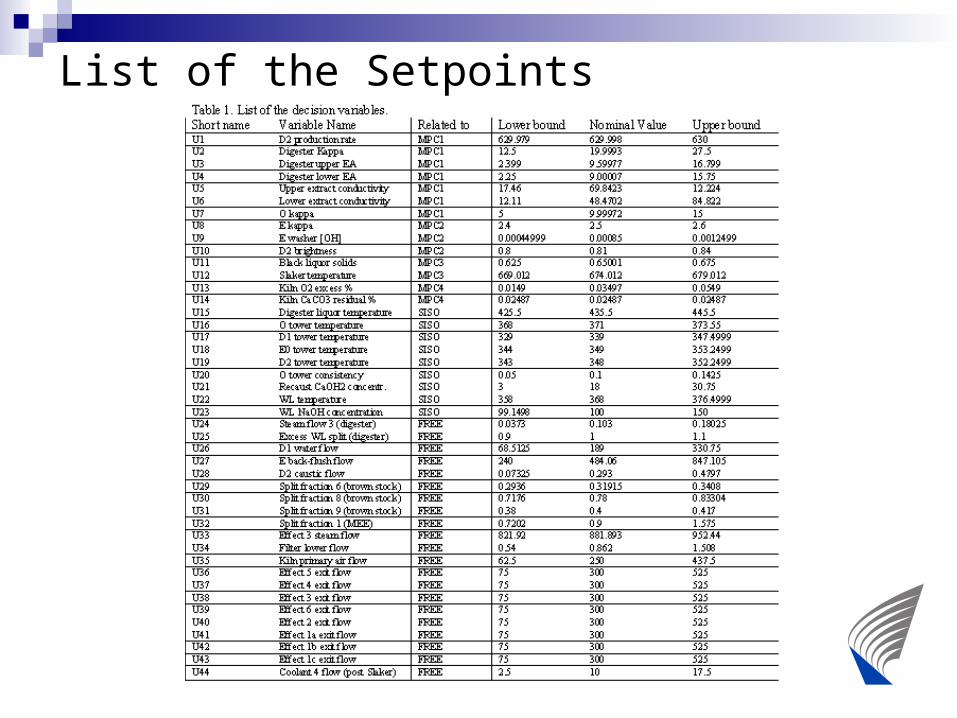
List of the Setpoints
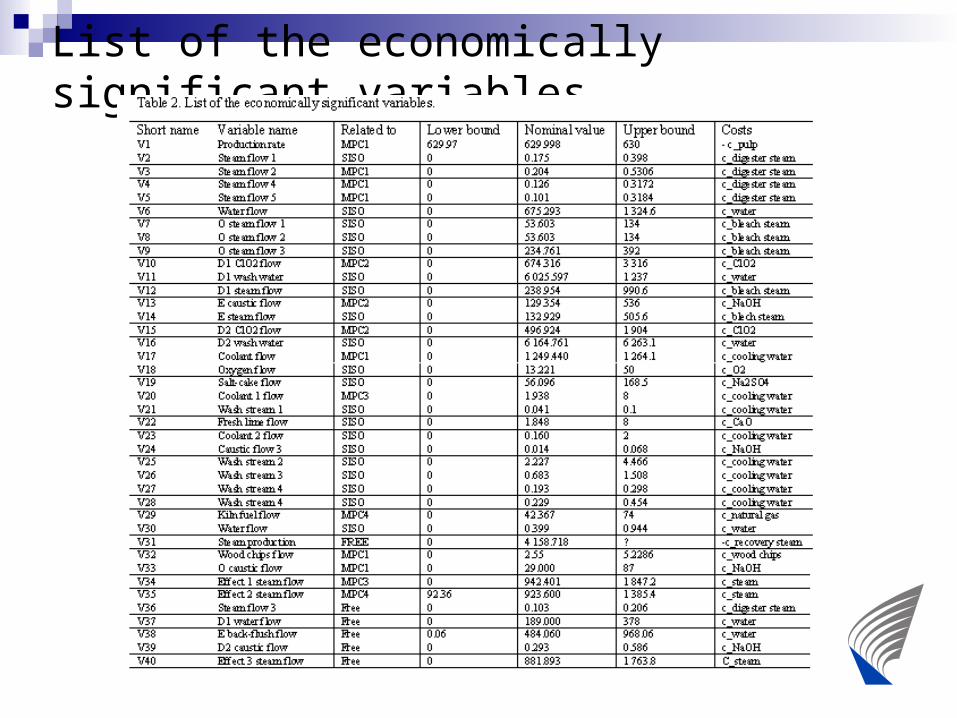
List of the economically significant variables
Scheme of the control strategy
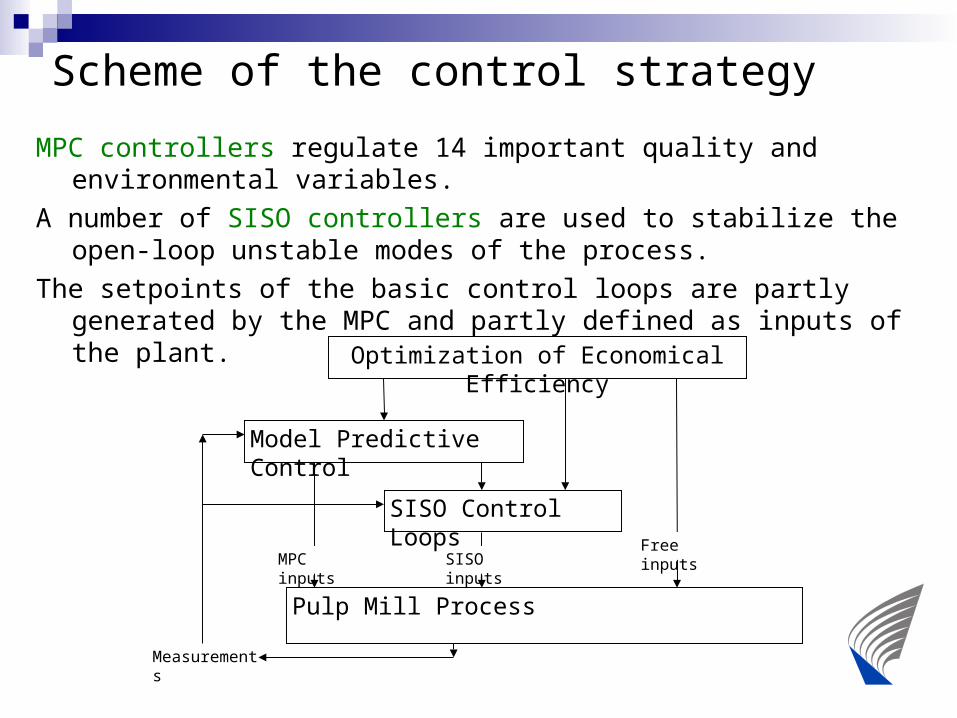
MPC controllers regulate 14 important quality and environmental variables.
A number of SISO controllers are used to stabilize the open-loop unstable modes of the process.
The setpoints of the basic control loops are partly generated by the MPC and partly defined as inputs of the plant.
Optimization of Economical Efficiency
Model Predictive Control
SISO Control Loops
Pulp Mill Process
MPC inputs SISO inputsFree inputs
Measurements
Content
The Pulp Mill benchmark problem (developed by F. Doyle)
Idea of the optimization Approximation methods Comparison of the results Conclusion
Introduction
A row of papers exists concentrated on the optimization of a single unit operations or a single factor optimization (such as ClO2 minimization).
New approach, proposed by F. Doyle: the whole plant economical efficiency optimization (with respect to production and quality, minimization of energy, chemical consumption)
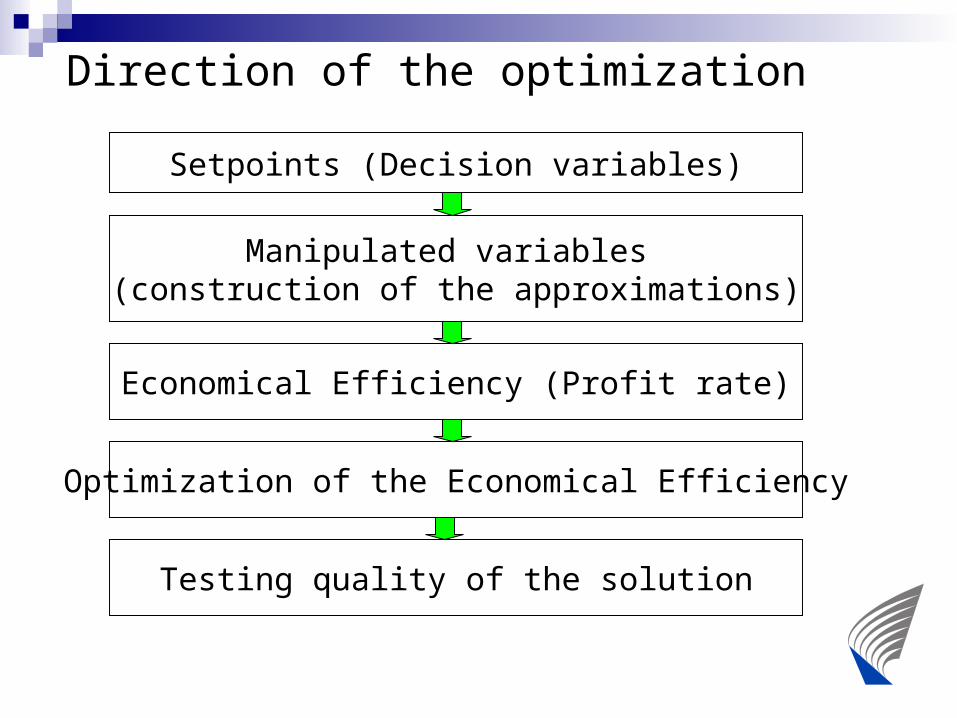
Direction of the optimization
Setpoints (Decision variables)
Manipulated variables (construction of the approximations)
Economical Efficiency (Profit rate)
Optimization of the Economical Efficiency
Testing quality of the solution
The linear approximations
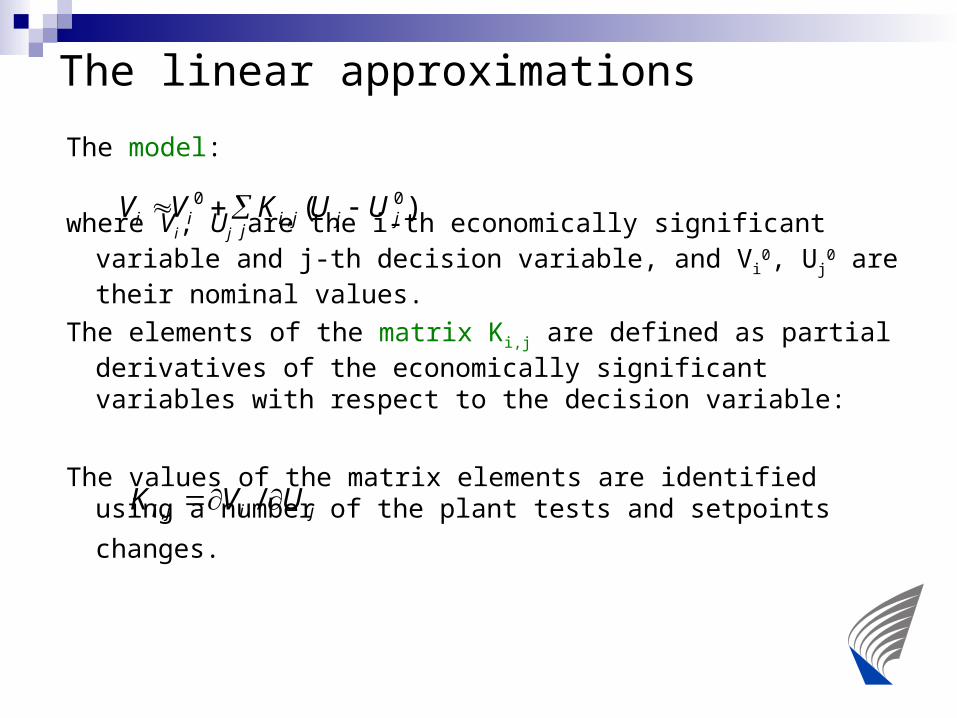
The model:
where Vi, Uj are the i-th economically significant variable and j-th decision variable, and Vi
0, Uj0 are their nominal values.
The elements of the matrix Ki,j are defined as partial derivatives of the economically significant variables with respect to the decision variable:
The values of the matrix elements are identified using a
number of the plant tests and setpoints changes.
)( 0,
0jjji
jii UUKVV
jiji UVK /,
The problem formulation
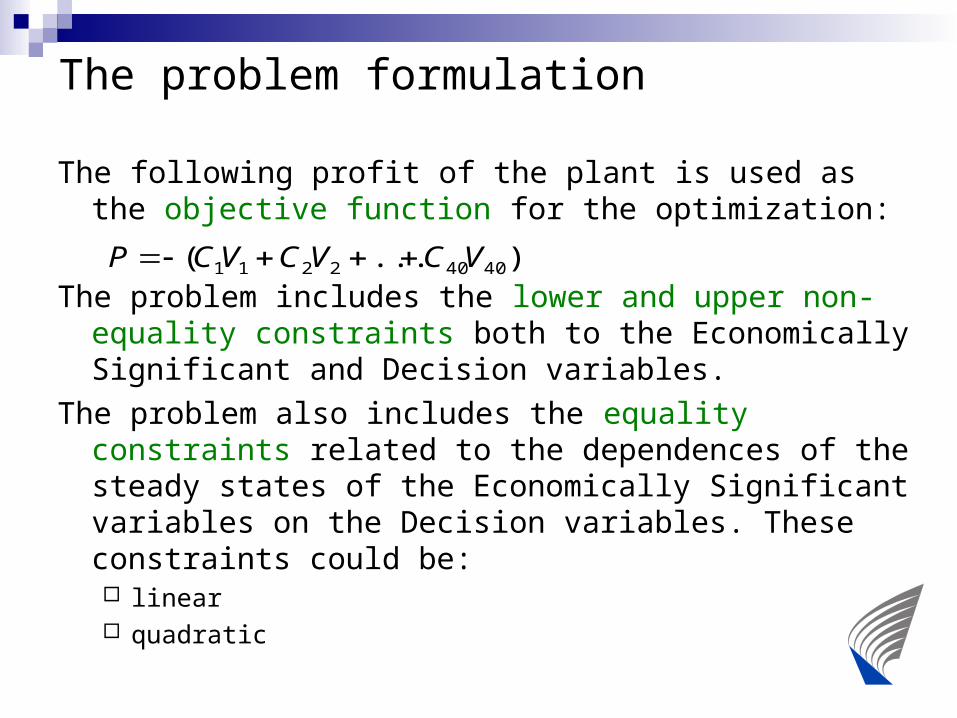
The following profit of the plant is used as the objective function for the optimization:
The problem includes the lower and upper non-equality constraints both to the Economically Significant and Decision variables.
The problem also includes the equality constraints related to the dependences of the steady states of the Economically Significant variables on the Decision variables. These constraints could be: linear quadratic
)...( 40402211 VCVCVCP
Content
The Pulp Mill benchmark problem (developed by F. Doyle)
Idea of the optimization Approximation methods Comparison of the results Conclusion
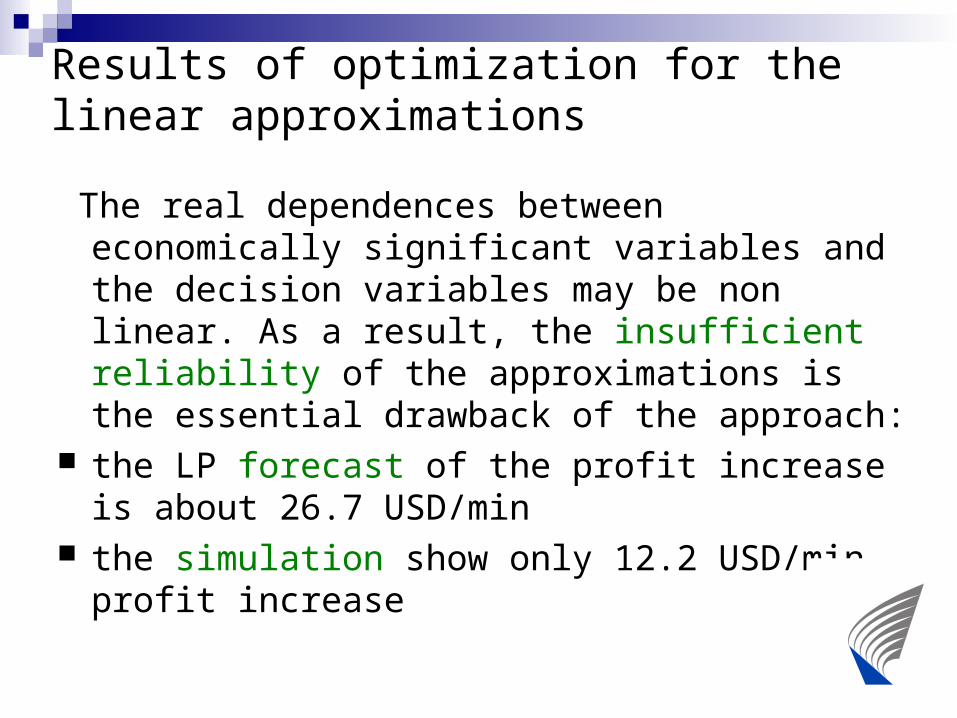
Results of optimization for the linear approximations
The real dependences between economically significant variables and the decision variables may be non linear. As a result, the insufficient reliability of the approximations is the essential drawback of the approach:
the LP forecast of the profit increase is about 26.7 USD/min
the simulation show only 12.2 USD/min profit increase
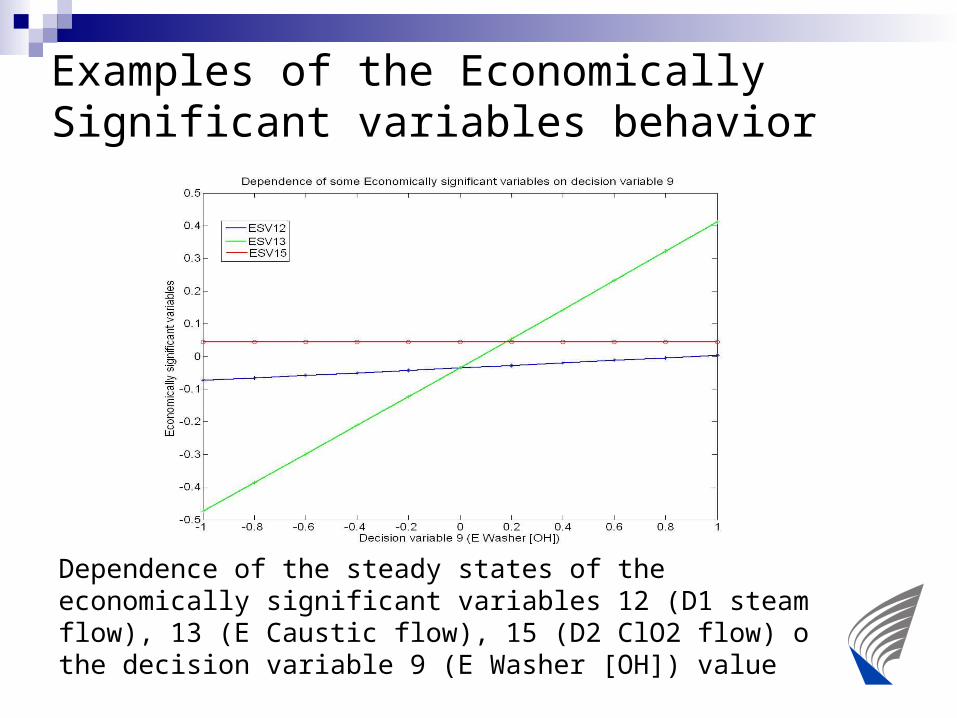
Examples of the Economically Significant variables behavior
Dependence of the steady states of the economically significant variables 12 (D1 steam flow), 13 (E Caustic flow), 15 (D2 ClO2 flow) on the decision variable 9 (E Washer [OH]) value
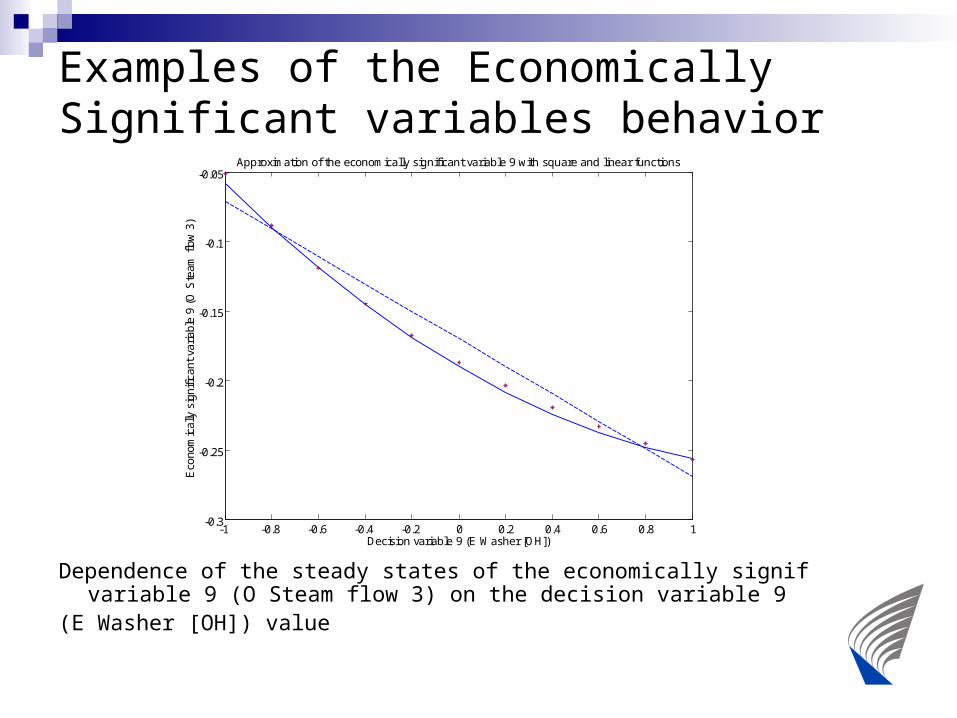
Examples of the Economically Significant variables behavior
Dependence of the steady states of the economically significant variable 9 (O Steam flow 3) on the decision variable 9
(E Washer [OH]) value
-1 -0.8 -0.6 -0.4 -0.2 0 0.2 0.4 0.6 0.8 1-0.3
-0.25
-0.2
-0.15
-0.1
-0.05
Decision variable 9 (E Washer [OH])
Eco
nom
ical
ly s
igni
fican
t va
riabl
e 9
(O S
team
flo
w 3
)
Approximation of the economically significant variable 9 with square and linear functions
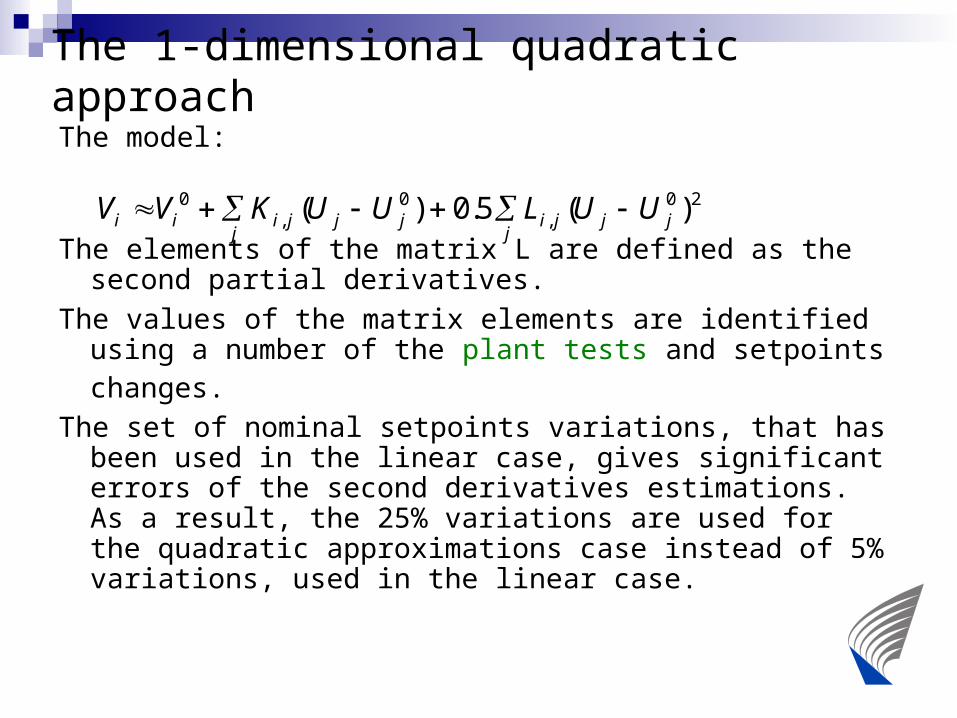
The 1-dimensional quadratic approach
The model:
The elements of the matrix L are defined as the second partial derivatives.
The values of the matrix elements are identified using a number of the plant tests and setpoints changes.
The set of nominal setpoints variations, that has been used in the linear case, gives significant errors of the second derivatives estimations. As a result, the 25% variations are used for the quadratic approximations case instead of 5% variations, used in the linear case.
20,
0,
0 )(5.0)( jjjij
jjjij
ii UULUUKVV
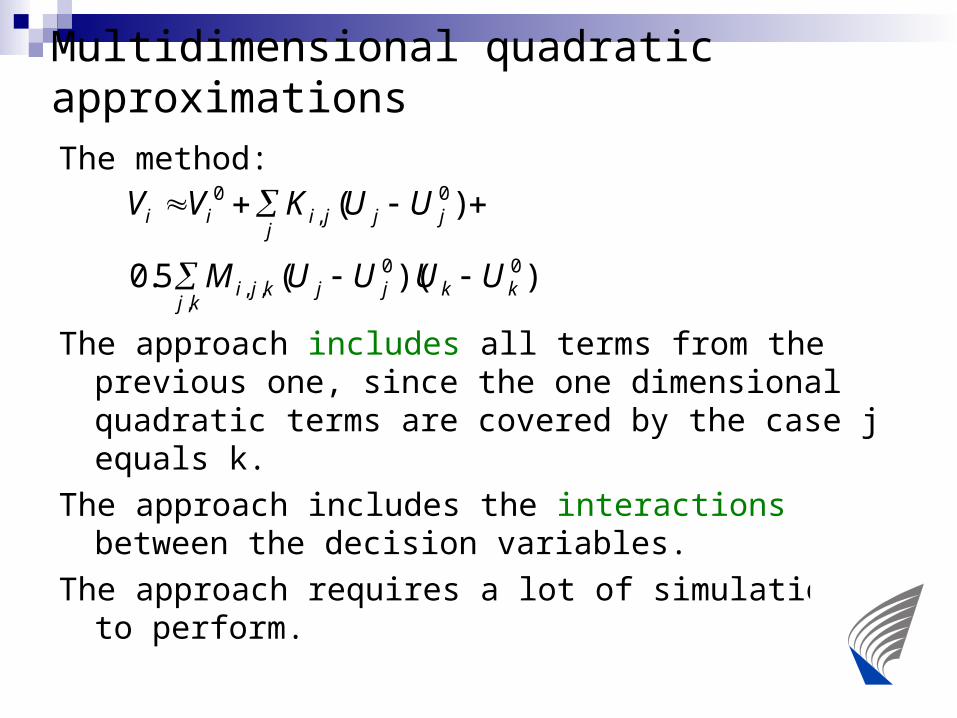
Multidimensional quadratic approximations
The method:
The approach includes all terms from the previous one, since the one dimensional quadratic terms are covered by the case j equals k.
The approach includes the interactions between the decision variables.
The approach requires a lot of simulations to perform.
))((5.0
)(
00,,
,
0,
0
kkjjkjikj
jjjij
ii
UUUUM
UUKVV

Content
The Pulp Mill benchmark problem (developed by F. Doyle)
Idea of the optimization Approximation methods Comparison of the results Conclusion
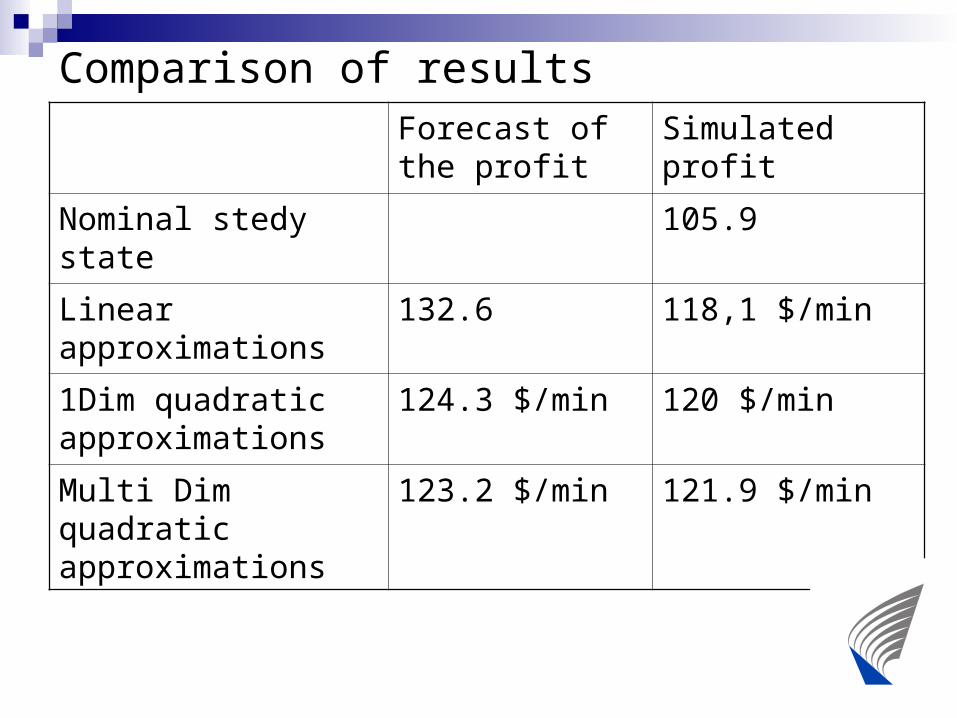
Comparison of resultsForecast of the profit
Simulated profit
Nominal stedy state 105.9
Linear approximations 132.6 118,1 $/min
1Dim quadratic approximations
124.3 $/min 120 $/min
Multi Dim quadratic approximations
123.2 $/min 121.9 $/min
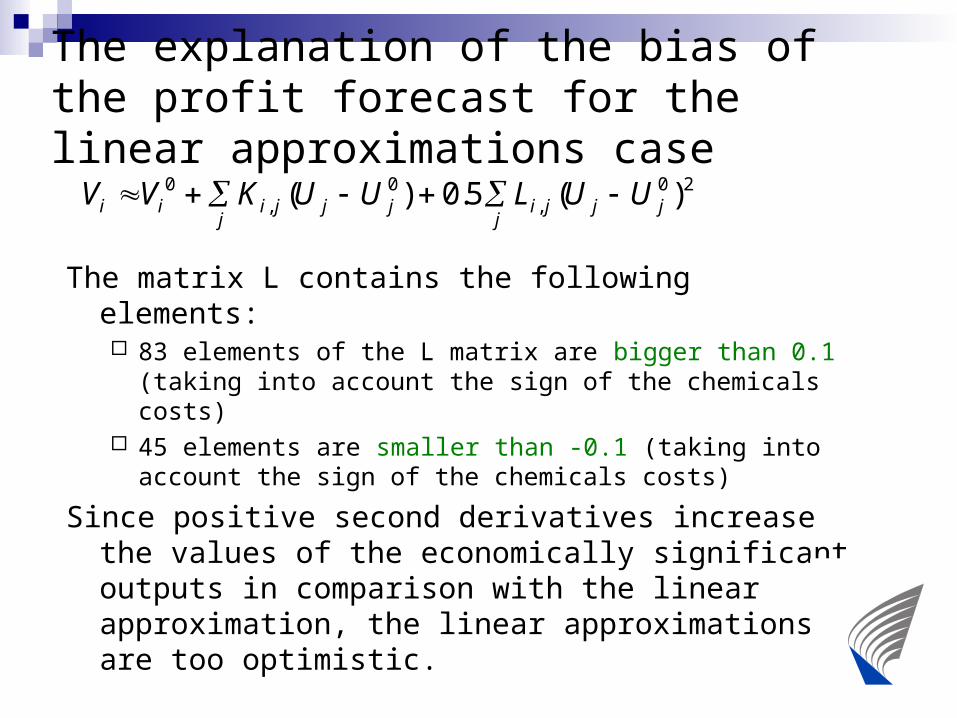
The explanation of the bias of the profit forecast for the linear approximations case
The matrix L contains the following elements: 83 elements of the L matrix are bigger than 0.1 (taking into
account the sign of the chemicals costs) 45 elements are smaller than -0.1 (taking into account the
sign of the chemicals costs)
Since positive second derivatives increase the values of the economically significant outputs in comparison with the linear approximation, the linear approximations are too optimistic.
20,
0,
0 )(5.0)( jjjij
jjjij
ii UULUUKVV
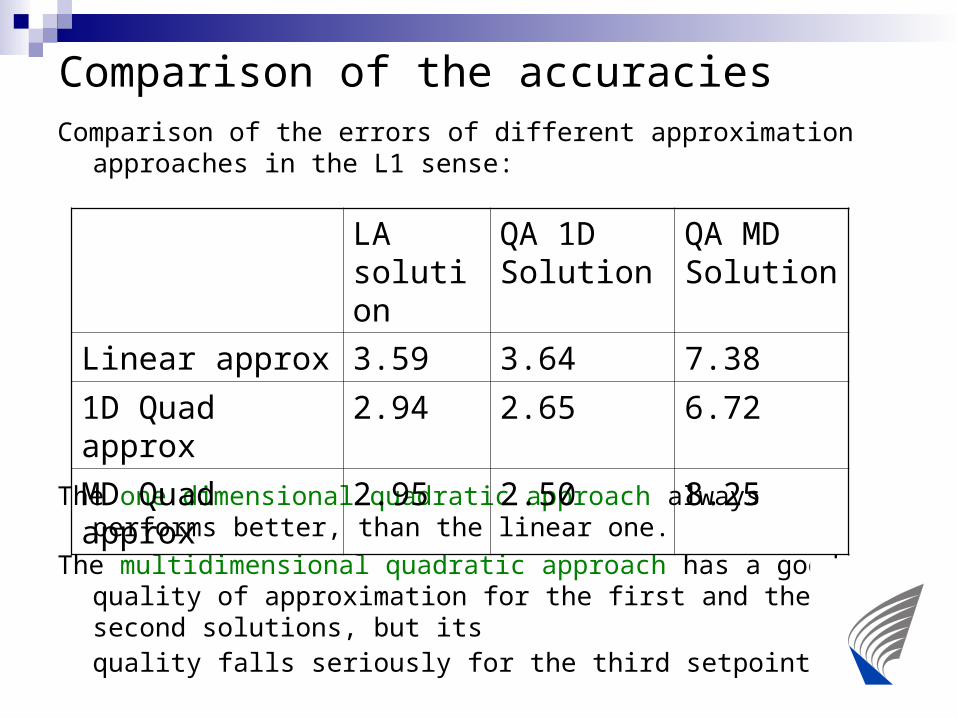
Comparison of the accuraciesComparison of the errors of different approximation approaches in
the L1 sense:
The one dimensional quadratic approach always performs better, than the linear one.
The multidimensional quadratic approach has a good quality of approximation for the first and the second solutions, but its quality falls seriously for the third setpoint.
LA solution
QA 1D Solution
QA MD Solution
Linear approx 3.59 3.64 7.38
1D Quad approx 2.94 2.65 6.72
MD Quad approx 2.95 2.50 8.25
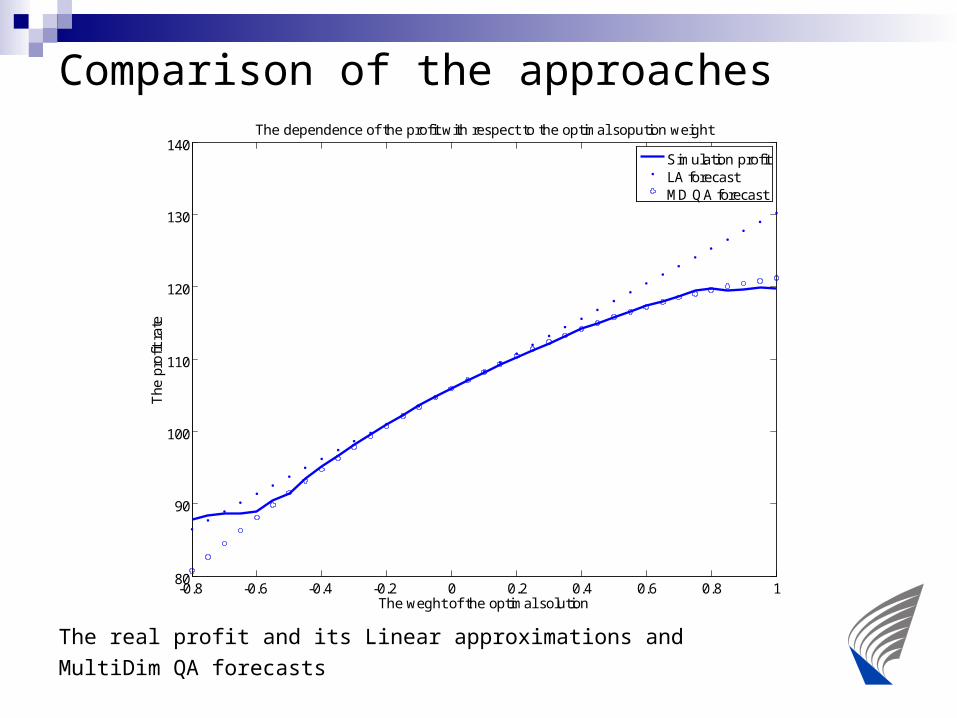
Comparison of the approaches
The real profit and its Linear approximations and
MultiDim QA forecasts
-0.8 -0.6 -0.4 -0.2 0 0.2 0.4 0.6 0.8 180
90
100
110
120
130
140
The weght of the optimal solution
The
pro
fit r
ate
The dependence of the profit with respect to the optimal sopution weight
Simulation profitLA forecastMD QA forecast
Conclusion
The quadratic approximations were constructed (the most important thing that requires the most efforts and computational time)
The optimization of the economical efficiency was performed. The profit has been improved at about 4% (compared Linear approximations).
The quality of the approximations is decided to be sufficiently high (the error of the profit forecast based on approximations is not significant).