alexander forbes
TRANSCRIPT
Manager WatchtM Survey OF retIreMent FunD InveStMent ManagerS
December 2011
FInancIaL ServIceS
asset consultants

An Authorised Financial Services Provider
tbsp
///
bey
ond
the
line
3380
7
Sip on a coconut whilst strolling down Copacabana Beach.
Attend the opening ceremony of the Olympics.
Order a beer in German at the Oktoberfest.
Watch Celtic take on Rangers in Glasgow.
Get a haircut in Harlem.
Swim in Lake Titicaca.
Ride an elephant.
Surf in Hawaii.
Stay in an ice hotel.
Snorkel in the Seychelles.
Touch the Great Wall of China.
Travel to the end of the world.
Flirt with an air hostess on Japan Airlines.
Have a mojito in Hemingway’s Bar, Havana.
Drive through the South of France on a Vespa.
Live without regret.
InDex
SectIOn 1
General Information 1
Regulation 28 8
An objective look at Surveys 11
SectIOn 2
Balanced Manager Watch™ Survey 15
Balanced Manager Watch™ Survey Risk Analysis 23
Balanced Manager Watch™ Survey Asset Allocation 31
Balanced Manager Watch™ Survey Internal Composite Dispersions 32
SectIOn 3
S.A. Equity Manager Watch™ Survey 35
S.A. Equity Manager Watch™ Survey Internal Composite Dispersions 43
S.A. Bond Manager Watch™ Survey 45
S.A. Bond Manager Watch™ Survey Internal Composite Dispersions 49
S.A. Money Market Manager Watch™ Survey 51
S.A. Money Market Manager Watch™ Survey Internal Composite Dispersions 53
Absolute Return Manager Watch™ Survey 54
Absolute Return Manager Watch™ Survey Internal Composite Dispersions 57
Targeted Development Investments Manager Watch™ Survey 59
S.A. Fund-of-Hedge Funds Survey 61
S.A. Property Manager Watch™ Survey 62
Multi-Manager Watch™ (Specialist) Survey 63
Multi-Manager Watch™ (Balanced) Survey 65
SA Medical-Aid Manager Watch™ Survey 68
SectIOn 4
Fees (Indicative Ranges) 70
SectIOn 5
Glossary 72
Directory of South African Asset Managers 75
2004 Alexander Forbes.indd 1 2011/12/14 4:11 PM
1
Introduction
The Manager Watch™ Survey of Retirement Fund Investment Managers is an annual survey that showcases the performance of institutional fund managers in South Africa and has been published since 1994.
The Structure of the Retirement Fund Survey
This edition includes thirteen surveys with 45 managers and over 320 funds, covering 4 balanced surveys, 8 specialist surveys, and the multi-manager survey.
The criteria for participation in any of the surveys remains unchanged from 2010 where a fund size of R200 million as well as a 12-month track record, is prerequisite. The R200 million criteria is applicable to all funds in most survey categories except where it is specifically indicated that this criteria is excluded.
Managers are encouraged to submit new entrants into the surveys promptly as we are cognisant of not allowing back-fill bias to skew our historic databases.
All participants are, from time to time, expected to sign a document pertaining to participation rules for the Alexander Forbes Manager Watch™ surveys.
The following surveys are included:
• SAManagerWatch™&GlobalManagerWatch™ –BalancedMandates
• SAEquityManagerWatch™
• SABondManagerWatch™
• SAMoneyMarketManagerWatch™
• AbsoluteReturnManagerWatch™
• TargetedDevelopmentInvestmentSurvey
• FundofHedgeFundSurvey
• MultiManagerWatch™
• MedicalAidManagerWatch™
• S.A.PropertyManagerWatch™Survey
Each survey shows performance returns over different time periods as well as risk-adjusted performance over a three-year period in figures and an easy to use graphical format.
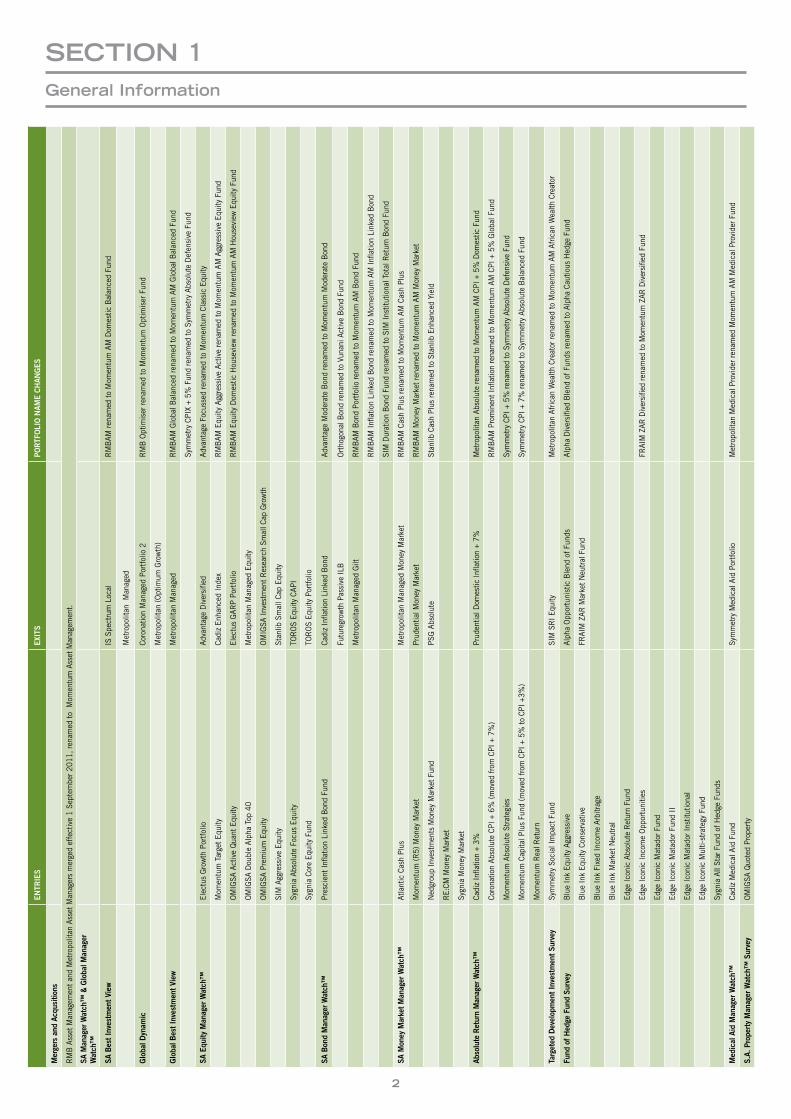
The table overleaf reflects funds that entered or exited the Surveys over the past year, as well as any name changes.
SectIOn 1general Information
2
SectIOn 1general Information
ENTR
IES
EXITS
PORTF
OLION
AME
CHAN
GES
Merge
rsand
Acq
usition
s
RM
B A
sset
Man
agem
ent a
nd M
etro
polit
an A
sset
Man
ager
s m
erge
d ef
fect
ive
1 Se
ptem
ber 2
011,
rena
med
to M
omen
tum
Ass
et M
anag
emen
t.
SAM
anag
erW
atch
™&
Globa
lMan
ager
Watch
™
SAB
estI
nves
tmen
tView
IS S
pect
rum
Loc
alR
MB
AM re
nam
ed to
Mom
entu
m A
M D
omes
tic B
alan
ced
Fund
Met
ropo
litan
Man
aged
Globa
lDyn
amic
Coro
natio
n M
anag
ed P
ortf
olio
2R
MB
Opt
imis
er re
nam
ed to
Mom
entu
m O
ptim
iser
Fun
d
Met
ropo
litan
(Opt
imum
Gro
wth
)
Globa
lBes
tInv
estm
entV
iew
Met
ropo
litan
Man
aged
RM
BAM
Glo
bal B
alan
ced
rena
med
to M
omen
tum
AM
Glo
bal B
alan
ced
Fund
Sym
met
ry C
PIX
+ 5%
Fun
d re
nam
ed to
Sym
met
ry A
bsol
ute
Def
ensi
ve F
und
SAE
quity
Man
agerW
atch
™El
ectu
s G
row
th P
ortf
olio
Adva
ntag
e D
iver
sifie
dAd
vant
age
Focu
ssed
rena
med
to M
omen
tum
Cla
ssic
Equ
ity
Mom
entu
m T
arge
t Equ
ityCa
diz
Enha
nced
Inde
xR
MB
AM E
quity
Agg
ress
ive
Activ
e re
nam
ed to
Mom
entu
m A
M A
ggre
ssiv
e Eq
uity
Fun
d
OM
IGSA
Act
ive
Qua
nt E
quity
Elec
tus
GAR
P Po
rtfo
lioR
MB
AM E
quity
Dom
estic
Hou
sevi
ew re
nam
ed to
Mom
entu
m A
M H
ouse
view
Equ
ity F
und
OM
IGSA
Dou
ble
Alph
a To
p 40
Met
ropo
litan
Man
aged
Equ
ity
OM
IGSA
Pre
miu
m E
quity
OM
IGSA
Inve
stm
ent R
esea
rch
Smal
l Cap
Gro
wth
SIM
Agg
ress
ive
Equi
tySt
anlib
Sm
all C
ap E
quity
Sygn
ia A
bsol
ute
Focu
s Eq
uity
TOR
OS
Equi
ty C
API
Sygn
ia C
ore
Equi
ty F
und
TOR
OS
Equi
ty P
ortf
olio
SAB
ondMan
agerW
atch
™Pr
esci
ent I
nflat
ion
Link
ed B
ond
Fund
Cadi
z In
flatio
n Li
nked
Bon
dAd
vant
age
Mod
erat
e B
ond
rena
med
to M
omen
tum
Mod
erat
e B
ond
Futu
regr
owth
Pas
sive
ILB
Ort
hogo
nal B
ond
rena
med
to V
unan
i Act
ive
Bon
d Fu
nd
Met
ropo
litan
Man
aged
Gilt
RM
BAM
Bon
d Po
rtfo
lio re
nam
ed to
Mom
entu
m A
M B
ond
Fund
RM
BAM
Infla
tion
Link
ed B
ond
rena
med
to M
omen
tum
AM
Infla
tion
Link
ed B
ond
SIM
Dur
atio
n B
ond
Fund
rena
med
to S
IM In
stitu
tiona
l Tot
al R
etur
n B
ond
Fund
SAM
oney
Marke
tMan
agerW
atch
™At
lant
ic C
ash
Plus
Met
ropo
litan
Man
aged
Mon
ey M
arke
tR
MB
AM C
ash
Plus
rena
med
to M
omen
tum
AM
Cas
h Pl
us
Mom
entu
m (R
5) M
oney
Mar
ket
Prud
entia
l Mon
ey M
arke
tR
MB
AM M
oney
Mar
ket r
enam
ed to
Mom
entu
m A
M M
oney
Mar
ket
Ned
grou
p In
vest
men
ts M
oney
Mar
ket F
und
PSG
Abs
olut
eSt
anlib
Cas
h Pl
us re
nam
ed to
Sta
nlib
Enh
ance
d Yi
eld
RE:
CM M
oney
Mar
ket
Sygn
ia M
oney
Mar
ket
Abso
luteR
eturnMan
agerW
atch
™Ca
diz
Infla
tion
+ 3%
Prud
entia
l Dom
estic
Infla
tion
+ 7%
Met
ropo
litan
Abs
olut
e re
nam
ed to
Mom
entu
m A
M C
PI +
5%
Dom
estic
Fun
d
Coro
natio
n Ab
solu
te C
PI +
6%
(mov
ed fr
om C
PI +
7%
)R
MB
AM P
rom
inen
t Infl
atio
n re
nam
ed to
Mom
entu
m A
M C
PI +
5%
Glo
bal F
und
Mom
entu
m A
bsol
ute
Stra
tegi
esSy
mm
etry
CPI
+ 5
% re
nam
ed to
Sym
met
ry A
bsol
ute
Def
ensi
ve F
und
Mom
entu
m C
apita
l Plu
s Fu
nd (m
oved
from
CPI
+ 5
% to
CPI
+3%
)Sy
mm
etry
CPI
+ 7
% re
nam
ed to
Sym
met
ry A
bsol
ute
Bal
ance
d Fu
nd
Mom
entu
m R
eal R
etur
n
Targeted
Dev
elop
men
tInv
estm
entS
urve
ySy
mm
etry
Soc
ial I
mpa
ct F
und
SIM
SR
I Equ
ityM
etro
polit
an A
fric
an W
ealth
Cre
ator
rena
med
to M
omen
tum
AM
Afr
ican
Wea
lth C
reat
or
Fund
ofH
edge
Fun
dSu
rvey
Blu
e In
k Eq
uity
Agg
ress
ive
Alph
a O
ppor
tuni
stic
Ble
nd o
f Fun
dsAl
pha
Div
ersi
fied
Ble
nd o
f Fun
ds re
nam
ed to
Alp
ha C
autio
us H
edge
Fun
d
Blu
e In
k Eq
uity
Con
serv
ativ
eFR
AIM
ZAR
Mar
ket N
eutr
al F
und
Blu
e In
k Fi
xed
Inco
me
Arbi
trag
e
Blu
e In
k M
arke
t Neu
tral
Edge
Icon
ic A
bsol
ute
Ret
urn
Fund
Edge
Icon
ic In
com
e O
ppor
tuni
ties
FRAI
M Z
AR D
iver
sifie
d re
nam
ed to
Mom
entu
m Z
AR D
iver
sifie
d Fu
nd
Edge
Icon
ic M
atad
or F
und
Edge
Icon
ic M
atad
or F
und
II
Edge
Icon
ic M
atad
or In
stitu
tiona
l
Edge
Icon
ic M
ulti-
stra
tegy
Fun
d
Sygn
ia A
ll St
ar F
und
of H
edge
Fun
ds
Med
icalA
idM
anag
erW
atch
™Ca
diz
Med
ical
Aid
Fun
dSy
mm
etry
Med
ical
Aid
Por
tfol
ioM
etro
polit
an M
edic
al P
rovi
der r
enam
ed M
omen
tum
AM
Med
ical
Pro
vide
r Fun
d
S.A.
Prope
rtyMan
agerW
atch
™S
urve
yO
MIG
SA Q
uote
d Pr
oper
ty
3
SectIOn 1general Information
We also give indicative fee ranges for the different mandates based on fee scales that asset managers submit. It is important to note that actual negotiated fees could be lower than published fees.
A glossary of commonly used investment terms is included.
EnhancementstotheRetirementFundSurvey
With the need for more qualitative information becoming evident, we have provided a new section on company details. This provides general company information as well as more details on key investment personnel and mandates.
The inclusion of composite dispersion figures across all mandates and over longer periods also provides insights into managers’ composite construction.
ProposedSurveyDevelopmentsin2012
2012 will see a “new look” range of Surveys. The inclusion of additional, mandate relevant information will enable readers to
use surveys with more insight and allow for meaningful, albeit high level, differentiators between manager performances.
Certain surveys will also see changes to the underlying categories in order to allow for more comparable risk measures to be included. Where this is not possible, rankings of risk numbers will not be included.
The Africa Survey and Shariah Survey will be launched early in 2012, while some of the existing surveys will be “mainstreamed” into the traditional asset class surveys.
Furthermore, our asset allocation surveys will be Regulation 28 cognisant in that the asset classes defined in Regulation 28 will be applied in both our requests for information to managers and in the subsequent survey produced.
Finally, a revised set of rules will be made available to all participants for comment.
RegulatoryChangesin2011and2012
Regulation28 of the Pension Funds Act was amended and became effective 1 July 2011.
The new regulation includes a preamble which introduces concepts such as:
• TheFiduciarydutyofTrusteestoactinthebestinterestof the fund;
• Responsiblemanagementoffundassets;
• Thedeploymentofcapitaltoearnadequateriskadjustedreturns;
• Theappropriatenessofassetsthataredeemedsuitabletothefund’s specific member profile, liquidity needs and liabilities;
• Theconsiderationoffactorsthatmayaffectsustainablelong term performance, including environmental, social and governance (ESG) character factors;
• Thepromotionoftheinterestsofthefundinastableandtransparent environment.
Further details regarding the changes to Regulation 28 are summarised in a consultant note on page 8 of the Survey.
In February 2012, it was announced that DividendWithholdingTax(DWT) would come into effect from 1 April 2012, replacing Secondary Tax on Companies.
DWT is a 15% tax levied on investors receiving dividends declared and paid by South African resident companies or foreign companies, listed on the JSE. It is the responsibility of the companies paying the dividends to withhold the tax and pay it to the South African Revenue Service (SARS) on behalf of the ultimate recipients.
The primary change is that DWT is a tax levied on investors while STC (at 10%) is a tax levied on the company declaring the dividend – thus the legal liability shifts to the investor. However, DWT will be paid on the investors behalf so the investor will, in most instances, not be aware of the change.
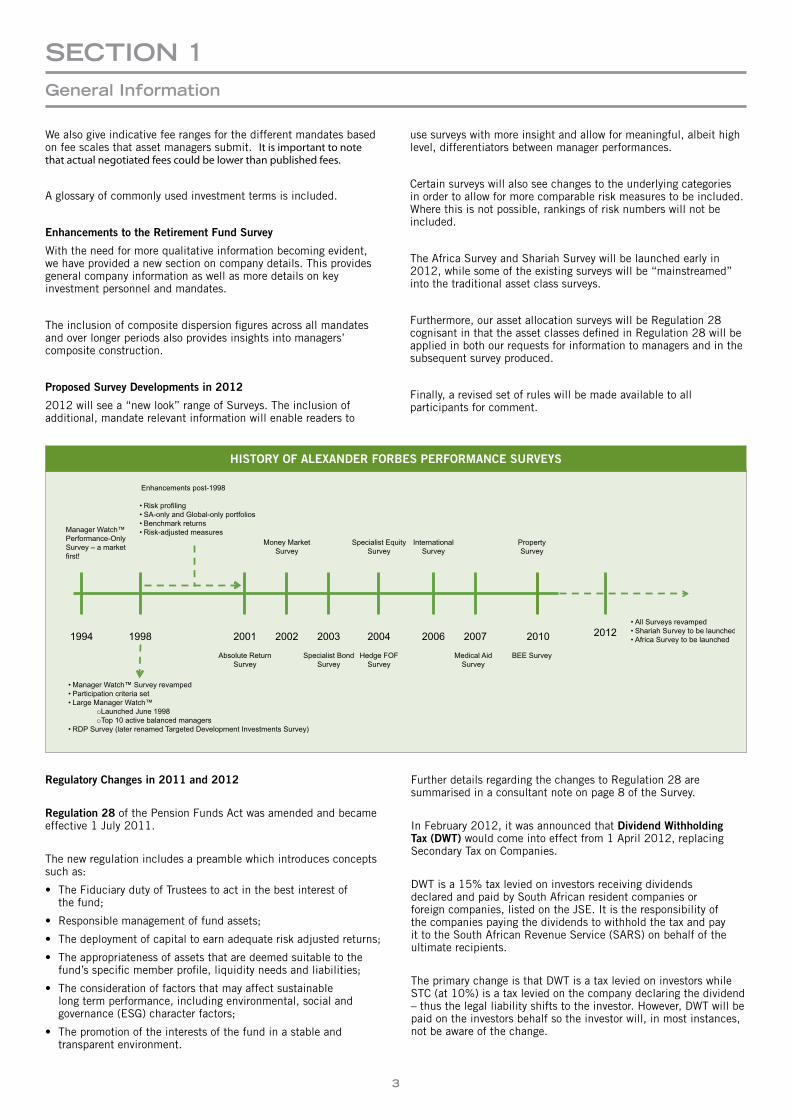
HISTORYOFALEXANDERFORBESPERFORMANCESURVEYS
4
TOP20ASSETMANAGERS-RANKEDBYTOTALASSETSUNDERMANAGEMENTASAT30JUNE2011
SectIOn 1general Information
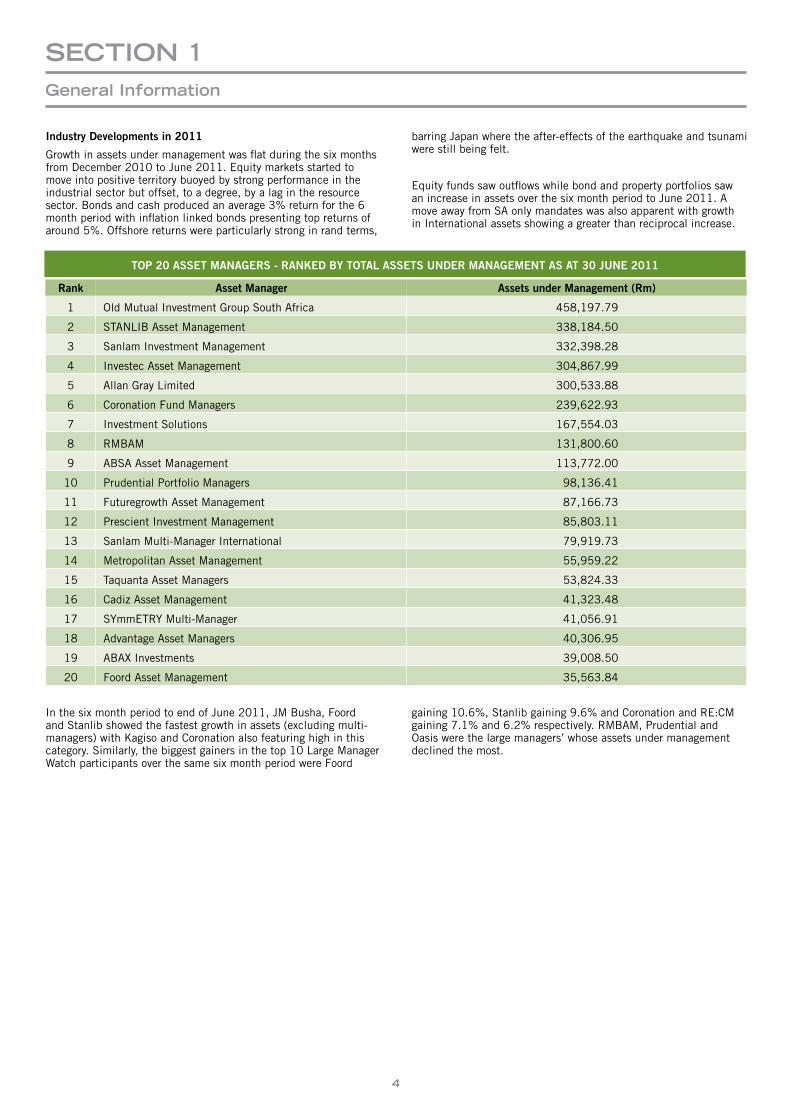
IndustryDevelopmentsin2011
Growth in assets under management was flat during the six months from December 2010 to June 2011. Equity markets started to move into positive territory buoyed by strong performance in the industrial sector but offset, to a degree, by a lag in the resource sector. Bonds and cash produced an average 3% return for the 6 month period with inflation linked bonds presenting top returns of around 5%. Offshore returns were particularly strong in rand terms,
barring Japan where the after-effects of the earthquake and tsunami were still being felt.
Equity funds saw outflows while bond and property portfolios saw an increase in assets over the six month period to June 2011. A move away from SA only mandates was also apparent with growth in International assets showing a greater than reciprocal increase.
In the six month period to end of June 2011, JM Busha, Foord and Stanlib showed the fastest growth in assets (excluding multi-managers) with Kagiso and Coronation also featuring high in this category. Similarly, the biggest gainers in the top 10 Large Manager Watch participants over the same six month period were Foord
gaining 10.6%, Stanlib gaining 9.6% and Coronation and RE:CM gaining 7.1% and 6.2% respectively. RMBAM, Prudential and Oasis were the large managers’ whose assets under management declined the most.
Rank AssetManager AssetsunderManagement(Rm)
1 Old Mutual Investment Group South Africa 458,197.79
2 STANLIB Asset Management 338,184.50
3 Sanlam Investment Management 332,398.28
4 Investec Asset Management 304,867.99
5 Allan Gray Limited 300,533.88
6 Coronation Fund Managers 239,622.93
7 Investment Solutions 167,554.03
8 RMBAM 131,800.60
9 ABSA Asset Management 113,772.00
10 Prudential Portfolio Managers 98,136.41
11 Futuregrowth Asset Management 87,166.73
12 Prescient Investment Management 85,803.11
13 Sanlam Multi-Manager International 79,919.73
14 Metropolitan Asset Management 55,959.22
15 Taquanta Asset Managers 53,824.33
16 Cadiz Asset Management 41,323.48
17 SYmmETRY Multi-Manager 41,056.91
18 Advantage Asset Managers 40,306.95
19 ABAX Investments 39,008.50
20 Foord Asset Management 35,563.84
5
SectIOn 1general Information
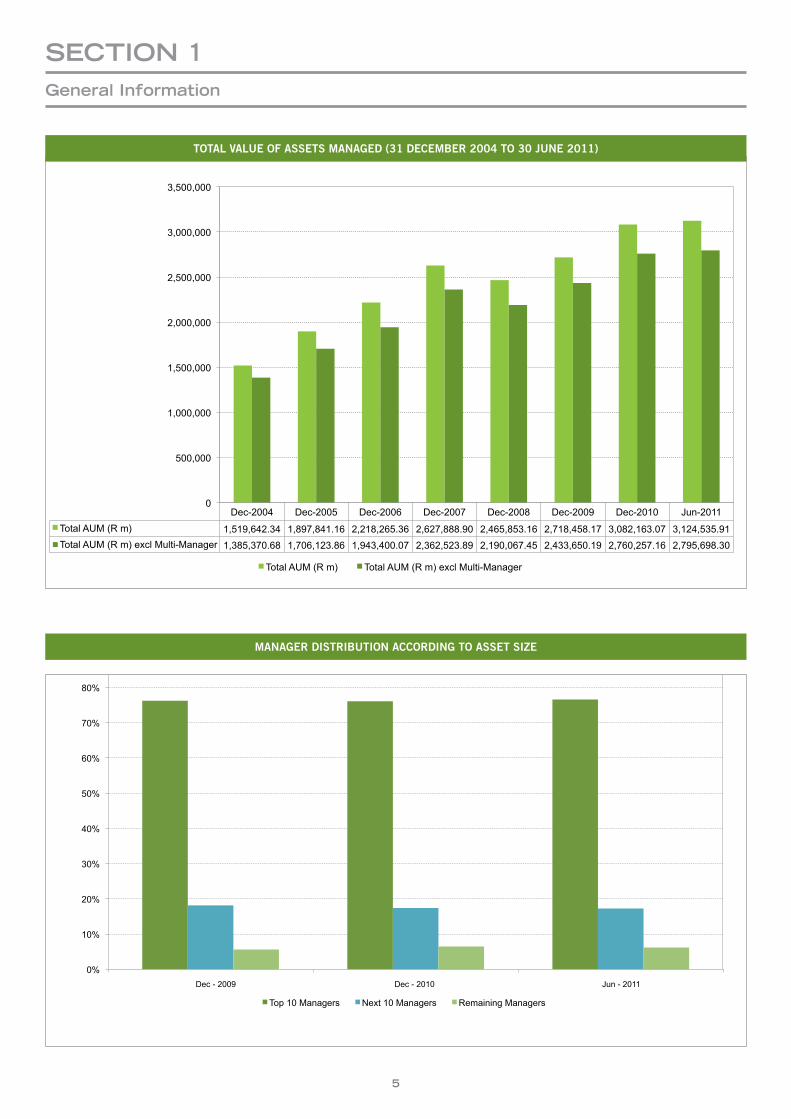
Dec-2004 Dec-2005 Dec-2006 Dec-2007 Dec-2008 Dec-2009 Dec-2010 Jun-2011 Total AUM (R m) 1,519,642.34 1,897,841.16 2,218,265.36 2,627,888.90 2,465,853.16 2,718,458.17 3,082,163.07 3,124,535.91 Total AUM (R m) excl Multi-Manager 1,385,370.68 1,706,123.86 1,943,400.07 2,362,523.89 2,190,067.45 2,433,650.19 2,760,257.16 2,795,698.30
0
500,000
1,000,000
1,500,000
2,000,000
2,500,000
3,000,000
3,500,000
Total AUM (R m) Total AUM (R m) excl Multi-Manager
0%
10%
20%
30%
40%
50%
60%
70%
80%
90%
Top 10 Managers Next 10 Managers Remaining Managers
Dec - 2009 Dec - 2010 Jun - 2011
TOTALVALUEOFASSETSMANAGED(31DECEMBER2004TO30JUNE2011)
MANAGERDISTRIBUTIONACCORDINGTOASSETSIZE
6
SectIOn 1general Information
Market distribution has remained fairly constant over the last three years after having seen an increased growth in niche players since 2008.
Conclusion
It is important to remember that the surveys only provide a platform for asset managers to display returns in a simple and credible way. Whilst trying to keep these surveys simple and easy to read it is imperative to include a number of useful indicators for greater understanding of risk and performance. We trust that the changes we will be making to the surveys in 2012 will further assist in our endeavours to educate survey users.
Manager evaluation should never be done in isolation but rather with a clear understanding of the weaknesses that any data sources inherently bring to the table. Ideally, analyses need to be done
through different market environments using a number of different sources and advice, before a fair assessment of strengths and weaknesses can be made. Lastly, past performance is no indication of future performance - Caveat Emptor!
AlexanderForbesAssetConsultants
January 2012
Historical data that makes up the different surveys is available on subscription.
The International survey, Namibian survey, BEE survey and Guaranteed Fund survey can be found on our website: www.afac.co.za or can be requested from us directly at [email protected]
7
SectIOn 1general Information
All rights in the FTSE/JSE Africa Index Series vest in the JSE Limited (JSE) and in FTSE International Limited (FTSE) jointly. FTSE™ is a trade mark of the London Stock Exchange Limited (LSE) and The Financial Times Limited (FT) jointly and issued by FTSE under licence. JSE is a trade mark of the JSE. The FTSE/JSE Africa Index Series is calculated by FTSE International Limited (FTSE) in conjunction with the JSE Limited (JSE) in accordance with standard criteria.
ManagerWatchTMisaregisteredtrademarkofAlexanderForbesFinancialServices(Pty)Ltd,anapprovedfinancialservicesprovider.FAISFSPRegistrationNumber1177
Disclaimer
In preparing this survey, we have taken, on trust, the data supplied by the participants. The data has been checked for reasonability where
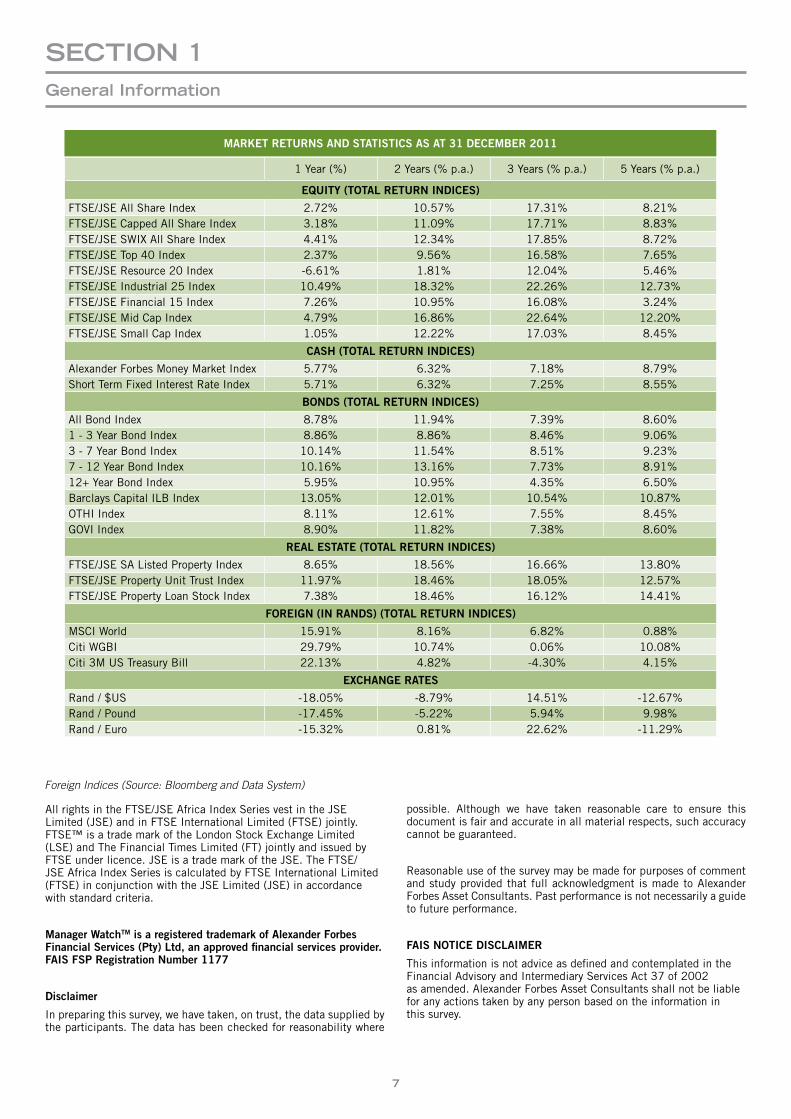
Foreign Indices (Source: Bloomberg and Data System)
1 Year (%) 2 Years (% p.a.) 3 Years (% p.a.) 5 Years (% p.a.)
EQUITY(TOTALRETURNINDICES)
FTSE/JSE All Share Index 2.72% 10.57% 17.31% 8.21%FTSE/JSE Capped All Share Index 3.18% 11.09% 17.71% 8.83%FTSE/JSE SWIX All Share Index 4.41% 12.34% 17.85% 8.72%FTSE/JSE Top 40 Index 2.37% 9.56% 16.58% 7.65%FTSE/JSE Resource 20 Index -6.61% 1.81% 12.04% 5.46%FTSE/JSE Industrial 25 Index 10.49% 18.32% 22.26% 12.73%FTSE/JSE Financial 15 Index 7.26% 10.95% 16.08% 3.24%FTSE/JSE Mid Cap Index 4.79% 16.86% 22.64% 12.20%FTSE/JSE Small Cap Index 1.05% 12.22% 17.03% 8.45%
CASH(TOTALRETURNINDICES)
Alexander Forbes Money Market Index 5.77% 6.32% 7.18% 8.79%Short Term Fixed Interest Rate Index 5.71% 6.32% 7.25% 8.55%
BONDS(TOTALRETURNINDICES)
All Bond Index 8.78% 11.94% 7.39% 8.60%1 - 3 Year Bond Index 8.86% 8.86% 8.46% 9.06%3 - 7 Year Bond Index 10.14% 11.54% 8.51% 9.23%7 - 12 Year Bond Index 10.16% 13.16% 7.73% 8.91%12+ Year Bond Index 5.95% 10.95% 4.35% 6.50%Barclays Capital ILB Index 13.05% 12.01% 10.54% 10.87%OTHI Index 8.11% 12.61% 7.55% 8.45%GOVI Index 8.90% 11.82% 7.38% 8.60%
REALESTATE(TOTALRETURNINDICES)
FTSE/JSE SA Listed Property Index 8.65% 18.56% 16.66% 13.80%FTSE/JSE Property Unit Trust Index 11.97% 18.46% 18.05% 12.57%FTSE/JSE Property Loan Stock Index 7.38% 18.46% 16.12% 14.41%
FOREIGN(INRANDS)(TOTALRETURNINDICES)
MSCI World 15.91% 8.16% 6.82% 0.88%Citi WGBI 29.79% 10.74% 0.06% 10.08%Citi 3M US Treasury Bill 22.13% 4.82% -4.30% 4.15%
EXCHANGERATES
Rand / $US -18.05% -8.79% 14.51% -12.67%Rand / Pound -17.45% -5.22% 5.94% 9.98%Rand / Euro -15.32% 0.81% 22.62% -11.29%
MARKETRETURNSANDSTATISTICSASAT31DECEMBER2011
possible. Although we have taken reasonable care to ensure this document is fair and accurate in all material respects, such accuracy cannot be guaranteed.
Reasonable use of the survey may be made for purposes of comment and study provided that full acknowledgment is made to Alexander Forbes Asset Consultants. Past performance is not necessarily a guide to future performance.
FAISNOTICEDISCLAIMER
This information is not advice as defined and contemplated in the Financial Advisory and Intermediary Services Act 37 of 2002 as amended. Alexander Forbes Asset Consultants shall not be liable for any actions taken by any person based on the information in this survey.
8
SectIOn 1regulation 28 amended
Introduction
Regulation 28 of the Pension Funds Act has been amended and became effective 1 July 2011. It comes after a fairly long and consultative process that began before the first draft was published in February 2010, with a second draft being published in December 2010. In June 2011, two additional notices were released, dealing with transitional arrangements and reporting of breaches.
This note provides a summary of the regulation and the two recent notices. For those wanting a deeper understanding of the comments received from industry, and the responses from National Treasury (NT) and the Financial Services Board (FSB), please read the comments matrix. All the documents are available from www.treasury.gov.za or www.fsb.co.za.
Preamble
The new regulation includes a preamble which introduces concepts such as:
• Fiduciarydutytoactinthebestinterestofthefund;
• Responsiblemanagementoffundassets;
• Deploymentofcapitaltoearnadequateriskadjustedreturns;
• Assetsthataresuitabletothefund’sspecificmemberprofile,liquidity needs and liabilities;
• Appropriateconsiderationoffactorsthatmayaffectsustainablelong term performance, including environmental, social and governance (ESG) character factors;
• Promotetheinterestsofthefundinastableandtransparentenvironment.
Definitions
The definitions section of the new regulation has been expanded (relative to the current regulation) to include many new definitions, including:
• Collectiveinvestmentscheme;
• Creditratings;
• Derivativeinstruments;
• Exchange;
• Fundsofhedgefundsandfundsofprivateequityfunds;
• Hedgefundsandprivateequityfunds;
• Investmentpolicystatement;
• IslamicdebtinstrumentsandIslamicliquiditymanagementfinancial instruments.
Principles
The new regulation also introduces principles for the first time, although the regulation remains predominantly rules based. These principles include:
• Compliancewiththeinvestmentlimits.
• Therequirementforaninvestmentpolicystatementwhichmustbe reviewed at least annually.
• Thefollowingadditionalprinciples:
• Promotetheeducationoftrustees;
• Monitorcompliancewiththeregulationbyitsadvisorsandservice providers;
• Considertheneedtopromotebroad-basedblackeconomicempowerment;
• Ensurethatthefund’sassetsareappropriateforitsliabilities;
• Performreasonableduediligencebeforeinvestinginanasset, taking into account the risks associated with the asset (including credit, market, liquidity, operational, and currency and country for foreign assets);
• Althoughcreditratingsmaybeused,theyshouldnotbereliedupon in isolation;
• Understandthechangingriskprofileofassetsovertimeandtake into account a comprehensive risk analysis;
• Considerfactorswhichmayaffectthesustainablelongtermperformance of the asset (including ESG factors).
• Evenwhenappointingthirdpartiestoperformanyofthefunctions above, the fund retains the responsibility for compliance with such principles.
9
SectIOn 1regulation 28 amended
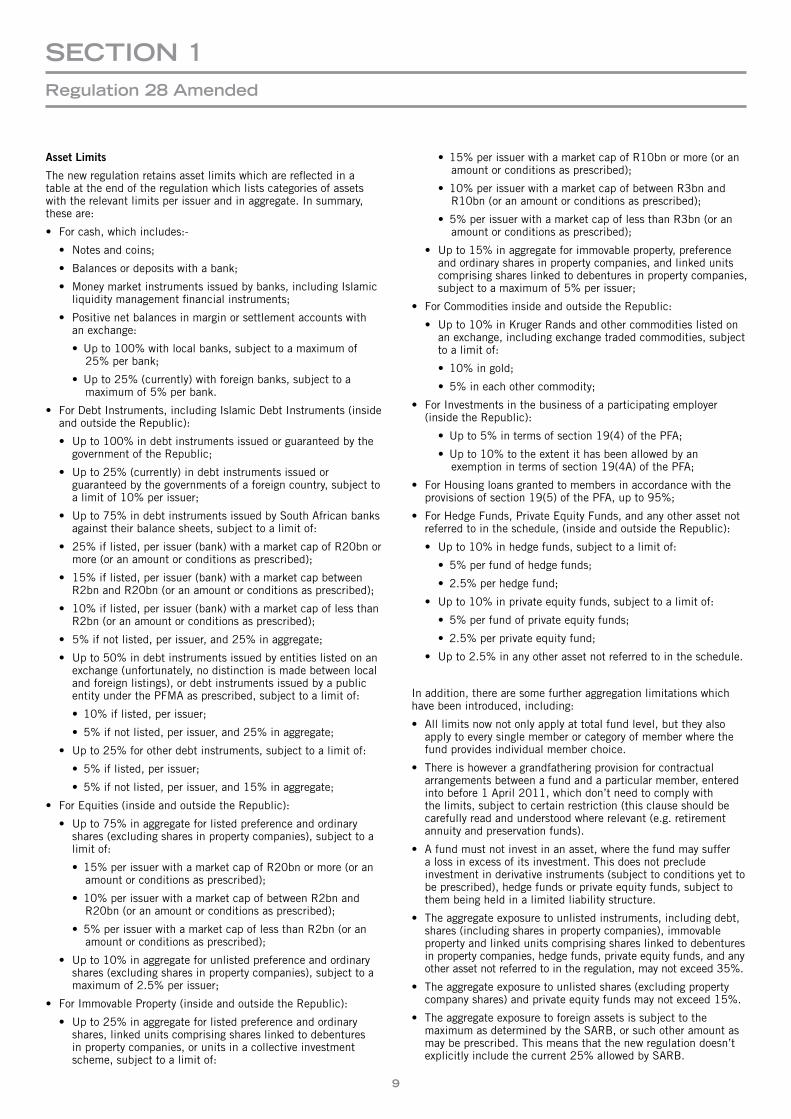
AssetLimits
The new regulation retains asset limits which are reflected in a table at the end of the regulation which lists categories of assets with the relevant limits per issuer and in aggregate. In summary, these are:
• Forcash,whichincludes:-
• Notesandcoins;
• Balancesordepositswithabank;
• Moneymarketinstrumentsissuedbybanks,includingIslamicliquidity management financial instruments;
• Positivenetbalancesinmarginorsettlementaccountswithan exchange:
• Up to 100% with local banks, subject to a maximum of 25% per bank;
• Up to 25% (currently) with foreign banks, subject to a maximum of 5% per bank.
• ForDebtInstruments,includingIslamicDebtInstruments(insideand outside the Republic):
• Upto100%indebtinstrumentsissuedorguaranteedbythegovernment of the Republic;
• Upto25%(currently)indebtinstrumentsissuedorguaranteed by the governments of a foreign country, subject to a limit of 10% per issuer;
• Upto75%indebtinstrumentsissuedbySouthAfricanbanksagainst their balance sheets, subject to a limit of:
• 25%iflisted,perissuer(bank)withamarketcapofR20bnormore (or an amount or conditions as prescribed);
• 15%iflisted,perissuer(bank)withamarketcapbetweenR2bn and R20bn (or an amount or conditions as prescribed);
• 10%iflisted,perissuer(bank)withamarketcapoflessthanR2bn (or an amount or conditions as prescribed);
• 5%ifnotlisted,perissuer,and25%inaggregate;
• Upto50%indebtinstrumentsissuedbyentitieslistedonanexchange (unfortunately, no distinction is made between local and foreign listings), or debt instruments issued by a public entity under the PFMA as prescribed, subject to a limit of:
• 10% if listed, per issuer;
• 5% if not listed, per issuer, and 25% in aggregate;
• Upto25%forotherdebtinstruments,subjecttoalimitof:
• 5% if listed, per issuer;
• 5% if not listed, per issuer, and 15% in aggregate;
• ForEquities(insideandoutsidetheRepublic):
• Upto75%inaggregateforlistedpreferenceandordinaryshares (excluding shares in property companies), subject to a limit of:
• 15% per issuer with a market cap of R20bn or more (or an amount or conditions as prescribed);
• 10% per issuer with a market cap of between R2bn and R20bn (or an amount or conditions as prescribed);
• 5% per issuer with a market cap of less than R2bn (or an amount or conditions as prescribed);
• Upto10%inaggregateforunlistedpreferenceandordinaryshares (excluding shares in property companies), subject to a maximum of 2.5% per issuer;
• ForImmovableProperty(insideandoutsidetheRepublic):
• Upto25%inaggregateforlistedpreferenceandordinaryshares, linked units comprising shares linked to debentures in property companies, or units in a collective investment scheme, subject to a limit of:
• 15% per issuer with a market cap of R10bn or more (or an amount or conditions as prescribed);
• 10% per issuer with a market cap of between R3bn and R10bn (or an amount or conditions as prescribed);
• 5% per issuer with a market cap of less than R3bn (or an amount or conditions as prescribed);
• Upto15%inaggregateforimmovableproperty,preferenceand ordinary shares in property companies, and linked units comprising shares linked to debentures in property companies, subject to a maximum of 5% per issuer;
• ForCommoditiesinsideandoutsidetheRepublic:
• Upto10%inKrugerRandsandothercommoditieslistedonan exchange, including exchange traded commodities, subject to a limit of:
• 10% in gold;
• 5% in each other commodity;
• ForInvestmentsinthebusinessofaparticipatingemployer(inside the Republic):
• Up to 5% in terms of section 19(4) of the PFA;
• Up to 10% to the extent it has been allowed by an exemption in terms of section 19(4A) of the PFA;
• ForHousingloansgrantedtomembersinaccordancewiththeprovisions of section 19(5) of the PFA, up to 95%;
• ForHedgeFunds,PrivateEquityFunds,andanyotherassetnotreferred to in the schedule, (inside and outside the Republic):
• Upto10%inhedgefunds,subjecttoalimitof:
• 5% per fund of hedge funds;
• 2.5% per hedge fund;
• Upto10%inprivateequityfunds,subjecttoalimitof:
• 5% per fund of private equity funds;
• 2.5% per private equity fund;
• Upto2.5%inanyotherassetnotreferredtointheschedule.
In addition, there are some further aggregation limitations which have been introduced, including:
• Alllimitsnownotonlyapplyattotalfundlevel,buttheyalsoapply to every single member or category of member where the fund provides individual member choice.
• Thereishoweveragrandfatheringprovisionforcontractualarrangements between a fund and a particular member, entered into before 1 April 2011, which don’t need to comply with the limits, subject to certain restriction (this clause should be carefully read and understood where relevant (e.g. retirement annuity and preservation funds).
• Afundmustnotinvestinanasset,wherethefundmaysuffera loss in excess of its investment. This does not preclude investment in derivative instruments (subject to conditions yet to be prescribed), hedge funds or private equity funds, subject to them being held in a limited liability structure.
• Theaggregateexposuretounlistedinstruments,includingdebt,shares (including shares in property companies), immovable property and linked units comprising shares linked to debentures in property companies, hedge funds, private equity funds, and any other asset not referred to in the regulation, may not exceed 35%.
• Theaggregateexposuretounlistedshares(excludingpropertycompany shares) and private equity funds may not exceed 15%.
• Theaggregateexposuretoforeignassetsissubjecttothemaximum as determined by the SARB, or such other amount as may be prescribed. This means that the new regulation doesn’t explicitly include the current 25% allowed by SARB.
10
SectIOn 1regulation 28 amended
Notwithstanding the above, the limits may be exceeded due to a change in the market value of the assets, provided that:
• ThefundinformstheRegistrarofthebreachandthereasonstherefore;
• Thefunddoesnotmakeanyfurtherinvestmentsintotheassetsthat are in breach;
• Thefundmustreversethebreachwithin12monthsorsuchother period as determined by the Registrar.
While Regulation 28 requires any breach to be reported without delay, Notice 2 released on 10 June 2011, provides an exemption to this requirement subject to quarterly notification instead, beginning from the first quarter of 2012.
Look-through
The new regulation also includes specific reference to “look-through” for the first time. In particular:
• Afundmustnotuseanyassettocircumventanyoftheassetlimits;
• Afundmustreportassetsinthecategoriestowhichtheybelong,irrespective of how they are held;
• Notwithstandingthepointsabove,wherethevalueoftheassetis less than 5%, then just the categories of the underlying assets must be disclosed;
• Notwithstandingthepointsabove,directorindirectexposuretohedge funds or private equity funds, must be disclosed as such i.e. no further look-though needed;
• Notwithstandingthepointsabove,foreignassetsshouldalwaysbe accounted for as such.
Borrowing
The new regulation states that a fund must not borrow, unless it:
• isforbridgingpurposestomaintainsufficientliquiditytomeetits operational requirements; and
• doesnotexceed50%ofthegrossincomeofthefundforthepreceding year; and
• mustberepaidwithin12months;and
• mustnotbesubjecttoanyearlysettlementpenalty.
Where a fund does borrow, it may cede a proportionate share of its assets as collateral.
SecuritiesLending
A fund may engage in securities lending subject to conditions as prescribed (no final document available as yet).
DerivativeInstruments
A fund may invest in derivative instruments subject to conditions as prescribed, even though investing in derivative instruments may seem to contradict the requirement that funds may not invest where they could suffer a loss greater than the amount invested (no final document available yet).
ReportingandExclusions
The Registrar may prescribe the format and content in respect of disclosures of compliance. In applying the limits, a fund may exclude the following assets:
• participatoryinterestsinacollectiveinvestmentschemewherea certificate is issued confirming compliance with the limits, and the auditor of the scheme confirms the accuracy of the certificate;
• alinkedpolicyasdefinedintheLong-termInsuranceActwherea certificate is issued confirming compliance with the limits, and the auditor of the insurer confirms the accuracy of the certificate;
• along-termpolicy(otherthanalinkedpolicy)asdefinedintheLong-term Insurance Act, that guarantees or partially guarantees policy benefits, where a certificate is issued (by the statutory actuary of the insurer) confirming compliance with the limits, and the auditor of the insurer confirms the accuracy of the certificate;
• AnassetthatisissuedbyanentitythatisregulatedbytheFSB where a certificate is issued by the auditor of the issuer, confirming compliance with the limits.
Exemptions
The Registrar may on written application by a fund or in general, exempt a fund from the provisions of the regulation, subject to conditions that the Registrar may impose. In the explanatory memo, NT encourages funds to make use of the exemption where they believe that any of the limits constrain the fund from acting in its best interests. NT and the FSB will monitor applications for exemptions to understand whether any of the limits should be changed.
EffectiveDate
The last statement in the new regulation confirms that the regulation came into effect on 1 July 2011, provided that transitional arrangements could be prescribed. Notice No 1 released on 10 June 2011, determined the transitional period for the implementation of Regulation 28 to be from 1 July 2011 to 31 December 2011.
Conclusion
We were excited about the final release of the amended Regulation 28 and subsequent notices, and did substantial work with retirement funds, their trustees and other service providers, in ensuring compliance by 1 January 2012, or assisting with the necessary applications for a further extension or an exemption. We urgently await further guidance notices from the regulator, and expect the release of a notice on the use of derivatives to be released before the end of June 2011.

11
Regulators across the world are concerned with one question when it comes to investment performance surveys, which is: “Are investors/trustees/consultants using manager performance surveys correctly and for the right reasons?” This question was the main theme when the Myners Commission undertook a review of the whole pension fund industry in 2000. Further, at Alexander Forbes, we are concerned about: “Do we really understand exactly how to extract value from them?” In this article we will look at what the concerns behind surveys are and also how best to interpret the numbers presented meaningfully.
Before going further, here are some harsh realities behind that concern:
• Complexityofpensionfundinvesting: Pension fund investing is a complex undertaking. The subtleties behind this complexity are often beyond the experience and skill set of most trustees. For this reason, surveys appear to provide an easy way for trustees to skirt around the complexity in their quest to determine whether their investments are “measuring up”. Surveys appear to provide investors with the most readily available answers.
• Noisinessofperformancenumbers: The problem is that performance figures are particularly “noisy” – that means that the numbers by themselves mask a multitude of factors that are influencing their outcome and yet may have nothing to do with manager excellence or skill.
• Useasatooltochangemanagers: Still, there is a heavy reliance on surveys as a basis for hiring or firing managers. This can lead to particularly high rates of manager “churn”, as managers are often fired and hired for performance that may not be clearly understood. Evidence is emerging worldwide that suggest that both trustees and their consultants appear to be particularly adept at firing their managers just before their performance begins to turn up (typically after three years of underperformance) and replacing them with managers whose successful strategies may have run their course for the near term (again typically after three years of outperformance)1.
• Costofchangingmanagers: The cost of this reflexive decision-making is not trivial. Studies in Australia, where the turnover in managers on a portfolio is very similar to the South African experience, estimate as much as 1% to 5% in value erosion can be attributed to this churn2. Changing managers on a strategy brings us only one certainty – there will be a cost to performance. What we can never be certain of is whether the change will bring enough added value to both cover that cost and then add the additional value initially sought.
Our challenge, as the guardian of one of the mostly respected and widely read surveys in South Africa, is to ensure that we provide our readers with enough information for them to determine whether performance comparisons genuinely reflect a like-with-like situation and, more importantly, whether we have enough information to determine whether there may be explanations for differential manager return that has nothing to do with manager skill.
This commitment means that the surveys must be constantly reassessed and revamped as new instruments, new strategies and new insights as to what drives performance emerge. As such, there will be any number of subtle changes that will be introduced into the survey over the course of the year. We will highlight these changes in our introductory letter as and when they occur.
Criticalcaveatstoreadersofalloursurveys
Each survey in the Manager WatchTM Series of Surveys presents its own challenges and we will try and highlight these challenges in the introduction to each survey. That said, there are still some basic issues that apply to all surveys and these we highlight below:
• Timeframeanddiversification: The greatest limitation of surveys is that they only look at how one manager’s performance compares to another’s over the specified time frame. In fact, most pension funds employ more than one asset manager to provide risk diversification both in terms of manager strategy (no one strategy can typically perform well at all times) and manager stability (manager turnover).
SectIOn 1an objective look at Surveys
1 See studies by Watson, Wyatt, Heisler, Kneittel, Neuman and Stewart, 2009; and Goyal and Wahal, 2008. 2 Ron Bird and Jack Gray 2010.
12
SectIOn 1an objective look at Surveys
to decipher (particularly when managers are ranked against a specific factor) is that performances are reported in discreet rolling windows of time (1 year, 3 year, 5 year etc.). The problem here is that those performance numbers are as much a function of the latest month’s performance data as it is the dropping off of the first month’s performance data as the rolling window moves on to the next month. As such, rankings in performance can shift wildly due to something that may have happened 1, 3 or 5 years earlier and may in no way be a reflection of the current management capabilities. Unfortunately this phenomenon cannot be detected unless an analyst is working with the full performance data history.
Whattimeframeismeaningful?
Perhaps the most contentious issue in performance surveys is what time periods are meaningful? The increasing focus on capturing up-to-the-minute changes in performance may create the impression that more information is better, but by including these ever-shortening time frames, often the exact opposite happens. We have already indicated the value destruction that goes hand-in-hand with short-termism. But equally important is the fact that different strategies demand different time-frames for their performance potential to manifest themselves. Finally, the choice of benchmark will also have implications on the required time frame for a meaningful assessment. For example, portfolios that declare an inflation-related benchmark need a significantly longer assessment time period than market-linked benchmarks such as the All Share or the All Bond Indices. This is because inflation only varies slowly over time and this movement is not directly linked to the assets the manager holds, whereas market indices are directly linked.
So how short can we go and still make meaningful assessments? To begin with, we are hesitant to integrate any risk parameter into the performance consideration without at least three years of performance data. But a good rule of thumb is that the more ambitious the strategy is about outperforming a given target, the longer one would require to assess the magnitude of skill present. For example, a fund targeting CPI+ 3% could be assessed over a 3 year time period, but a fund trying to achieve CPI+6% could probably only be properly assessed over 8 years.
The easy answer would be to simply not include short term performance numbers in a deliberate effort to curtail the kind of short-termism that plagues our industry. But the reality is that short term numbers can provide insights as to whether something completely unexpected has transpired in a strategy. Clearly that would demand further interrogation as this may simply flag a reporting error. Short term numbers, should only be considered when one has the means to properly interrogate these types of outcomes.
We will now look at examples of surveys and how to best analyse the survey in the new framework that it will be presented in:
S.A.ManagerWatchBestInvestmentViewSurvey(AppliesalsotoLargeManagerWatch)
In many ways the Best Investment View Survey should provide the ultimate showcase of every asset management house in South Africa (the exception being the specialist asset class managers). That said, these portfolio performance outcomes are perhaps some of the most difficult to properly interpret and compare. This is because just about every factor that is listed above which are “drivers of performance differentials” comes into play in a balanced mandate.
Over a long enough time frame (more than 8 years for example), these differentiating factors should start to diminish in importance.
Managers who have similar strategies will tend to perform similarly. If we are trying to introduce diversification into our choice then it stands to reason that the underlying manager performance should be expected to be different. But our inclination to be drawn to selecting managers from the top quartile for our blend can often lead to investors “doubling-up” on a specific investment strategy.
As such, manager surveys are of limited value in identifying how managers should be selected for diversification.
• Analysisofablendofmanagers: What trustees really should be assessing is whether their diversified blend of managers is doing what their fund requires. Unfortunately, the only place where this sort of assessment takes place in an open forum is in the multimanager survey. What is pointedly absent from any performance analysis is how the multiple manager portfolios that trustees and consultants themselves structure perform against similarly mandated blends. This is the true like-with-like comparison for pension funds. That said, the current convention is to report on the individual managers within each strategy survey.
• Whatarethefactorsthatcanresultindifferentialperformanceoutcomeswithoutreferencetomanagerskill?
• Differencesinthemandatedstrategicassetallocations(inclusive of the cash requirements for liquidity).
• Differencesinhowriskmanagementisdefinedforthemandate i.e. is it preservation of capital, or control of the deviation to the benchmark (tracking error), or control of absolute volatility? Differences in risk constraints inclusive of credit risk and tracking errors etc.
• Thetimeframerequiredforaspecificstrategytoreflectitsperformance potential.
• Theunderlyingbenchmarksorperformancetargetsspecifiedin the mandate.
• Changesintheunderlyingmanageroverthetermoftheperformance data – even when the mandate remains the same.
• Multiplemanagerfundsversussinglemanagerprovideno viable point of comparison. Because of the completely different risk profile implicit in the multiple manager strategy, the outcomes are simply not comparable.
• Performancesthatarereflectedgrossofallfeesversusperformances that are reported net of fees.
In all our surveys, we have gone to great lengths to try to address all of these factors in grouping like-mandated funds with like funds but the reality is that it is impossible to make these delineations in all funds at all times.
As such, what we have tried to do is to provide the reader with enough additional information such that when differential performance emerges, there is enough detail to provide insights as to why this may have occurred – again – without reference to whether the manager was skilful or not.
This all means that one set of numbers alone can simply not provide meaningful insights. Performance numbers need to be assessed within the context of the risk, asset allocation, size, duration of strategy.....etc, etc, etc!
• Notatruereflectionofmanagementability: Perhaps the other factor that makes performance surveys particularly difficult
13
SectIOn 1an objective look at Surveys
Care has been taken to separate comparisons of multiple balanced fund multi-manager solutions from those solutions that manage to fixed asset allocation ranges. In spite of the fact that one cannot make meaningful performance comparisons between the two distinctly different solutions, investors still like to make the comparison. Effectively this is no different from comparing the performance of a boxer with one hand tied to his side (the strategic asset allocation mandates preclude the manager from going outside of the pre-defined asset allocation range), to a boxer with free use of both limbs. Just because one solution may be performing better than another over a given time frame does not mean one solution reflects more skill than the other. Success must be assessed in how well a solution has done against what it was mandated to do. Full stop.
The real problem with providing a meaningful multi-manager survey is that the very act of creating a strategy that deliberately diversifies manager risk means that outperformance of a given benchmark will always be muted. (Note that the same holds true for any strategy that employs multiple managers, whether constructed and managed by a multi-manager or constructed and managed by a consultant or board of trustees). This means that there will often only be marginal performance differences between multi-managers and these differences will again have little reference to “skill”. An important rule of thumb when assessing performance differentials is that the smaller the differentials in any given population, the higher the probability that those differentials were due to random outcomes and not skill. Similarly, the larger the spread in outcomes in a population, the greater the probability that skill might explain some of those differences, assuming we are comparing like-with-like.
But what investors fail to appreciate is that while benchmark outperformance of multiple fund solutions are highly unlikely to be extreme, they typically can generate significantly higher returns than single manager solutions on a risk-adjusted basis. In other words, the diversification effect means that for every unit of risk taken, there is a higher level of return on average.
That said, one still needs to ensure that the multi-manager portfolios being compared have comparable underlying asset class benchmarks. Solutions that employed the All-Share Index versus solutions that employ the SWIX index for the equity components could see as much as 100 bps performance differentials per annum – and again the difference is not attributable to skill.
Even where risk-targeted multi-manager portfolios have been grouped into asset allocation bands, though, the illusion that you are now comparing like-with-like is just that: an illusion. Underlying strategic asset allocation benchmarks that result in only slight differences in the portfolios’ equity holdings can still translate into performance differences that have nothing to do with underlying manager skill.
Identifying the root of performance discrepancies has an easy starting point. Just see if the benchmark performances are the same – the closer the benchmark performances, the greater the assurance that you are comparing like-with-like.
Conclusion
Performance surveys should only be used as indicative tools. The real work begins when you drill down to all the factors that could be influencing those outcomes without reference to skill. Readers will notice that we have scaled back significantly on the rankings that used to be ascribed to everything from asset size of the fund to volatility of performance (was a high ranking on volatility a good or bad thing?) As we revamp our surveys over the coming year, we welcome your inputs and suggestions. We believe we are moving in the right direction – but it will take time, and subtle adjustments in the way we all operate in this industry.
But anyone making performance comparisons without referring to our new information pages may well be drawn to premature conclusions. These new information pages have been added to provide insights into the nature of a portfolio’s structure and strategy.
To begin with, we have tried to be more comprehensive in defining risk. Risk is not just seen as performance volatility but also meaningful to assess is downside risk or risk of capital loss. Similarly we have eliminated the notion of active (above benchmark) returns simply because there is such a wide range of benchmarks that assessing the magnitude of outperformance against one benchmark may not be comparable to the level of outperformance against another. Finally we have tried to remove concepts such as risk/return ratios as again, the underlying benchmarks for making these assessments are not of consistent quality across the manager mandates.
Just the simple reality that some managers benchmark their performances against inflation-plus targets while others prefer benchmarks that reflect a strategic asset allocation (to a fixed range of asset classes), and still others look to a peer group benchmark creates a highly problematic basis for comparison.
Time frame presents the biggest problem. Effectively the three groups should not be compared over anything shorter than 5 years, simply because that time-frame provides enough time for a given strategy to play out its performance potential, and that time-frame allows us to compare inflation-beating performance fairly.
Even with portfolios that employ market-linked indices to measure their asset class performances, a mere 2.5% difference in the equity benchmark component can translate into a significant differential in performances between funds – again without any reference to skill. The same holds for funds that benchmark the equity component of their BIV portfolio against the JSE All Share versus the JSE Share-weighted Index (SWIX). Over the past 12 years, those performance differentials amounted to more than 1% per annum – again, with no reference whether the manager was skilful.
Comparing portfolios with different attitudes towards risk management could well require time frames of 8 years or better but this is certainly no comfort for clients looking for instant answers.
Finally many of these Best Investment View portfolios have been managed since the inception of the given asset management house. But what investors don’t always appreciate is there may be significant changes in who the manager of the fund might have been over that time and how much turnover has occurred at this level. This consideration is key – even when the essential mandate of the fund may not have changed at all over that time.
The differentiating factor may well be the manager’s style or biases. William Sharpe once famously declared that manager style and bias could account for as much as 85% of performance differentials within an asset class. And yet our BIV survey makes no accommodation for defining those differences at such a granular level.
Multi-ManagerWatchTM Survey
Multi-manager performance comparisons suffer from the same factors impacting meaningful comparisons as other multi-asset strategies – it’s just that we have the illusion that we have a greater potential to compare like with like because of the way the survey has been subdivided.
15
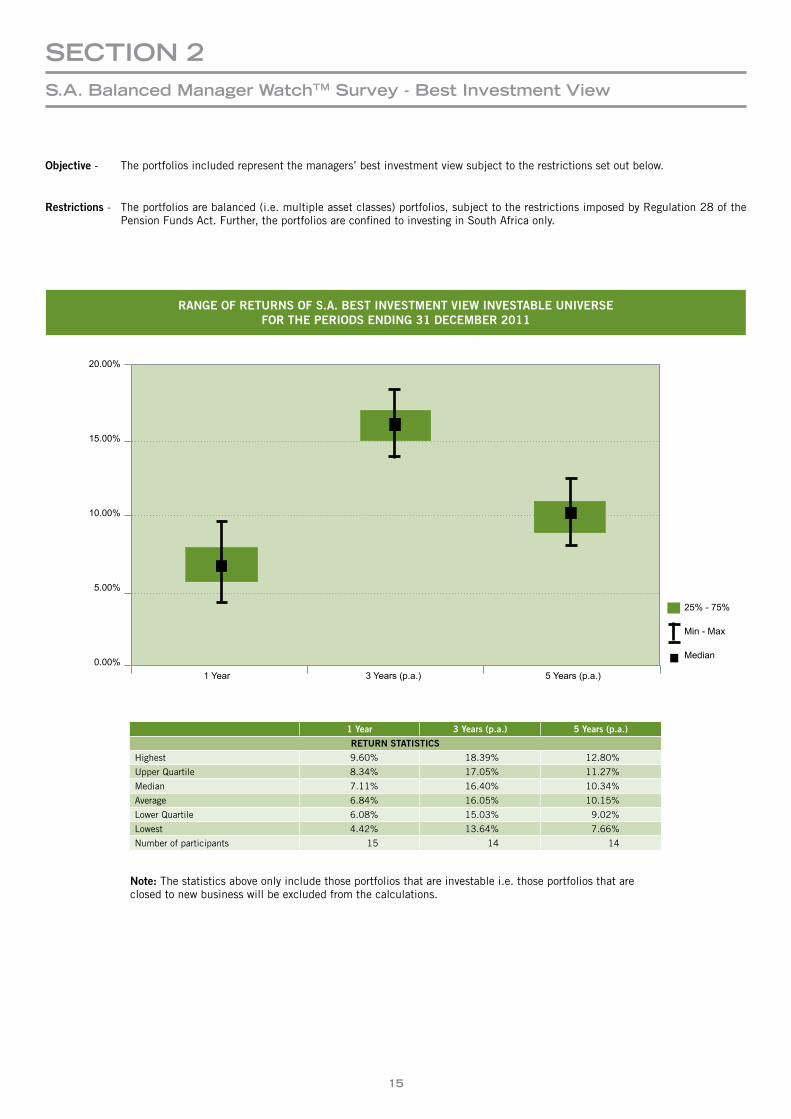
Objective - The portfolios included represent the managers’ best investment view subject to the restrictions set out below.
Restrictions - The portfolios are balanced (i.e. multiple asset classes) portfolios, subject to the restrictions imposed by Regulation 28 of the Pension Funds Act. Further, the portfolios are confined to investing in South Africa only.
Note: The statistics above only include those portfolios that are investable i.e. those portfolios that are closed to new business will be excluded from the calculations.
1Year 3Years(p.a.) 5Years(p.a.)
RETURNSTATISTICS
Highest 9.60% 18.39% 12.80%
Upper Quartile 8.34% 17.05% 11.27%
Median 7.11% 16.40% 10.34%
Average 6.84% 16.05% 10.15%
Lower Quartile 6.08% 15.03% 9.02%
Lowest 4.42% 13.64% 7.66%
Number of participants 15 14 14
20.00%
15.00%
10.00%
5.00%
0.00%1 Year 3 Years (p.a.) 5 Years (p.a.)
25% - 75%
Min - Max
Median
SectIOn 2S.a. Balanced Manager WatchtM Survey - Best Investment view
RANGEOFRETURNSOFS.A.BESTINVESTMENTVIEWINVESTABLEUNIVERSEFORTHEPERIODSENDING31DECEMBER2011
16
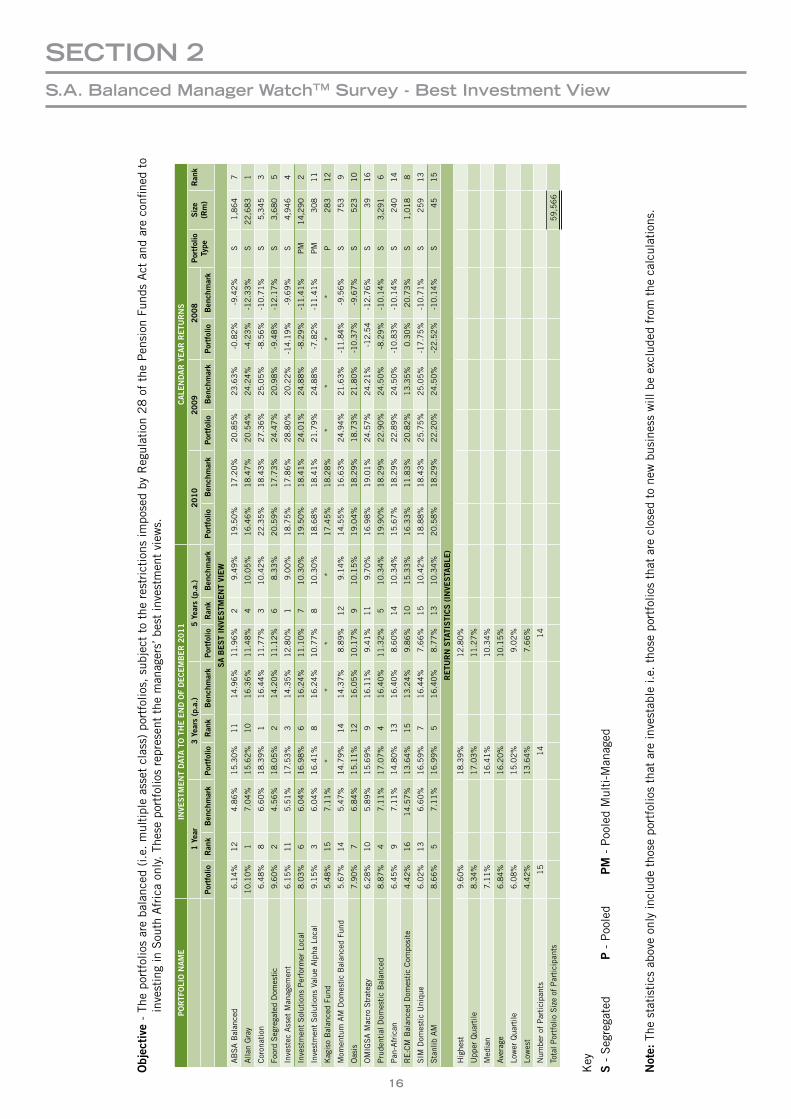
Objec
tive
- T
he p
ortf
olio
s ar
e ba
lanc
ed (
i.e.
mul
tipl
e as
set
clas
s) p
ortf
olio
s, s
ubje
ct t
o th
e re
stri
ctio
ns im
pose
d by
Reg
ulat
ion
28
of
the
Pen
sion
Fun
ds A
ct a
nd a
re c
onfin
ed t
o inv
esti
ng in
Sou
th A
fric
a on
ly. Th
ese
port
folio
s re
pres
ent
the
man
ager
s’ b
est
inve
stm
ent
view
s.
PORTF
OLI
ON
AME
INVE
STM
ENTDAT
ATOTHEE
NDO
FDECEMBER2
011
CALE
NDARYEARR
ETU
RNS
1Yea
r3Yea
rs(p.a.)
5Yea
rs(p.a.)
2010
2009
2008
Portfolio
Ty
peS
ize
(Rm)
Ran
k
Portfolio
Ran
kBen
chmark
Portfolio
Ran
kBen
chmark
Portfolio
Ran
kBen
chmark
Portfolio
Ben
chmark
Portfolio
Ben
chmark
Portfolio
Ben
chmark
SAB
ESTIN
VESTM
ENTVI
EW
AB
SA
Bal
ance
d 6
.14
%1
2
4.8
6%
15
.30
%1
11
4.9
6%
11
.96
%2
9.4
9%
19
.50
%1
7.2
0%
20
.85
%2
3.6
3%
-0.8
2%
-9.4
2%
S1
,86
47
Alla
n G
ray
10
.10
%1
7.0
4%
15
.62
%1
01
6.3
6%
11
.48
%4
10
.05
%1
6.4
6%
18
.47
%2
0.5
4%
24
.24
%-4
.23
%-1
2.3
3%
S2
2,6
83
1
Cor
onat
ion
6.4
8%
86
.60
%1
8.3
9%
11
6.4
4%
11
.77
%3
10
.42
%2
2.3
5%
18
.43
%2
7.3
6%
25
.05
%-8
.56
%-1
0.7
1%
S5
,34
53
Foor
d S
egre
gate
d D
omes
tic
9.6
0%
24
.56
%1
8.0
5%
21
4.2
0%
11
.12
%6
8.3
3%
20
.59
%1
7.7
3%
24
.47
%2
0.9
8%
-9.4
8%
-12
.17
%S
3,6
80
5
Inve
stec
Ass
et M
anag
emen
t6
.15
%1
15
.51
%1
7.5
3%
31
4.3
5%
12
.80
%1
9.0
0%
18
.75
%1
7.8
6%
28
.80
%2
0.2
2%
-14
.19
%-9
.69
%S
4,9
46
4
Inve
stm
ent
Sol
utio
ns P
erfo
rmer
Loc
al8
.03
%6
6
.04
%1
6.9
8%
61
6.2
4%
11
.10
%7
10
.30
%1
9.5
0%
18
.41
%2
4.0
1%
24
.88
%-8
.29
%-1
1.4
1%
PM
14
,29
02
Inve
stm
ent
Sol
utio
ns V
alue
Alp
ha L
ocal
9.1
5%
36
.04
%1
6.4
1%
81
6.2
4%
10
.77
%8
10
.30
%1
8.6
8%
18
.41
%2
1.7
9%
24
.88
%-7
.82
%-1
1.4
1%
PM
30
81
1
Kag
iso
Bal
ance
d Fu
nd5
.48
%1
57
.11
%*
**
*1
7.4
5%
18
.28
%*
**
*P
28
31
2
Mom
entu
m A
M D
omes
tic
Bal
ance
d Fu
nd5
.67
%1
45
.47
%1
4.7
9%
14
14
.37
%8
.89
%1
29
.14
%1
4.5
5%
16
.63
%2
4.9
4%
21
.63
%-1
1.84
%-9
.56
%S
75
39
Oas
is7
.90
%7
6.8
4%
15
.11
%1
21
6.0
5%
10
.17
%9
10
.15
%1
9.0
4%
18
.29
%1
8.7
3%
21
.80
%-1
0.37
%-9
.67
%S
52
31
0
OM
IGS
A M
acro
Str
ateg
y6
.28
%1
05
.89
%1
5.6
9%
91
6.1
1%
9.4
1%
11
9.7
0%
16
.98
%1
9.0
1%
24
.57
%2
4.2
1%
-12
.54
-12
.76
%S
39
16
Pru
dent
ial D
omes
tic
Bal
ance
d8
.87
%4
7
.11
%1
7.0
7%
41
6.4
0%
11
.32
%5
10
.34
%1
9.9
0%
18
.29
%2
2.9
0%
24
.50
%-8
.29
%-1
0.1
4%
S3
,29
16
Pan
-Afr
ican
6
.45
%9
7.1
1%
14
.80
%1
31
6.4
0%
8.6
0%
14
10
.34
%1
5.6
7%
18
.29
%2
2.8
9%
24
.50
%-1
0.8
3%
-10
.14
%S
24
01
4
RE
:CM
Bal
ance
d D
omes
tic
Com
posi
te4
.42
%1
61
4.5
7%
13
.64
%1
51
3.2
4%
9.8
6%
10
15
.33
%1
6.3
3%
11
.83
%2
0.8
2%
13
.35
%0
.30
%2
0.7
3%
S1
,01
88
SIM
Dom
esti
c U
niqu
e6
.02
%1
36
.60
%1
6.5
9%
71
6.4
4%
7.6
6%
15
10
.42
%1
8.8
8%
18
.43
%2
5.7
5%
25
.05
%-1
7.7
5%
-10
.71
%S
25
91
3
Sta
nlib
AM
8.6
6%
57
.11
%1
6.9
9%
51
6.4
0%
8.7
7%
13
10
.34
%2
0.5
8%
18
.29
%2
2.2
0%
24
.50
%-2
2.5
2%
-10
.14
%S
45
15
RETU
RNS
TATI
STI
CS(IN
VESTA
BLE
)
Hig
hest
9.6
0%
18
.39
%1
2.8
0%
Upp
er Q
uart
ile8
.34
%1
7.0
3%
11
.27
%
Med
ian
7.1
1%
16
.41
%1
0.3
4%
Ave
rage
6.8
4%
16
.20
%1
0.1
5%
Low
er Q
uart
ile6
.08
%1
5.0
2%
9.0
2%
Low
est
4.4
2%
13
.64
%7
.66
%
Num
ber
of P
arti
cipa
nts
15
14
14
Tota
l Por
tfol
io S
ize
of P
arti
cipa
nts
59
,56
6
Key
S -
Seg
rega
ted
P -
Poo
led
PM
- P
oole
d M
ulti
-Man
aged
Note:
The
sta
tist
ics
abov
e on
ly in
clud
e th
ose
port
folio
s th
at a
re in
vest
able
i.e.
tho
se p
ortf
olio
s th
at a
re c
lose
d to
new
bus
ines
s w
ill b
e ex
clud
ed f
rom
the
cal
cula
tion
s.
SectIOn 2S.a. Balanced Manager WatchtM Survey - Best Investment view
17
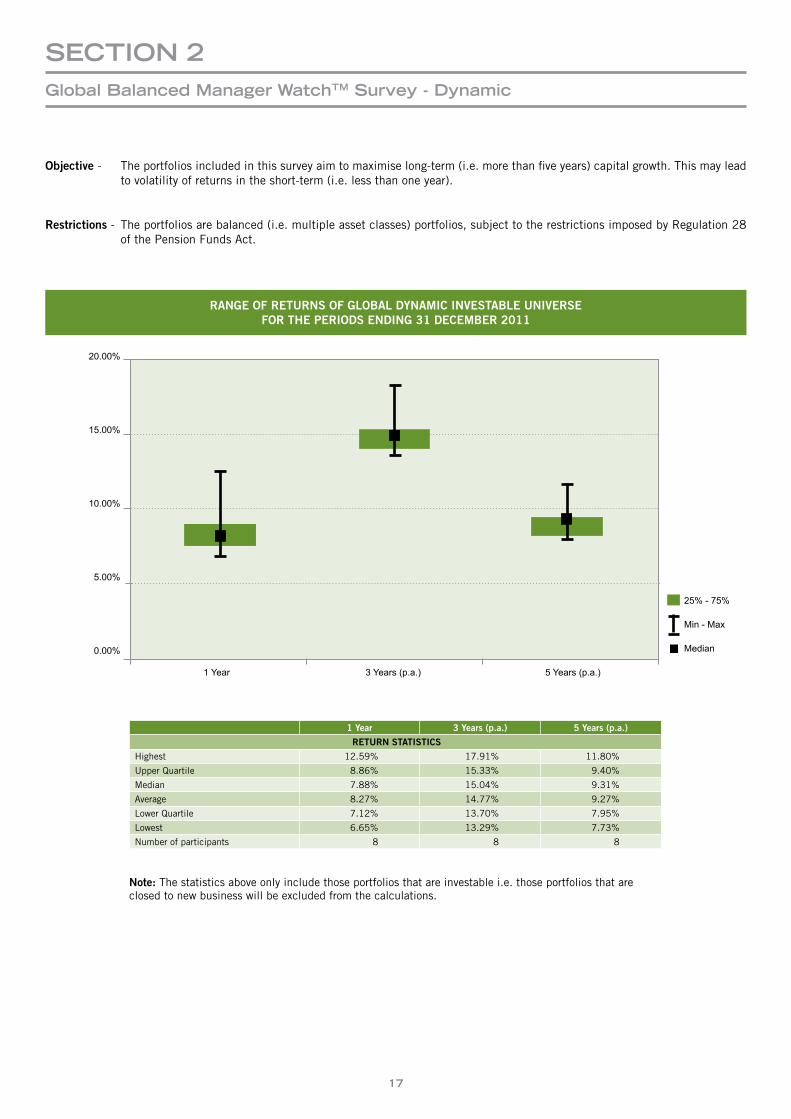
Objective - The portfolios included in this survey aim to maximise long-term (i.e. more than five years) capital growth. This may lead to volatility of returns in the short-term (i.e. less than one year).
Restrictions - The portfolios are balanced (i.e. multiple asset classes) portfolios, subject to the restrictions imposed by Regulation 28 of the Pension Funds Act.
1Year 3Years(p.a.) 5Years(p.a.)
RETURNSTATISTICS
Highest 12.59% 17.91% 11.80%
Upper Quartile 8.86% 15.33% 9.40%
Median 7.88% 15.04% 9.31%
Average 8.27% 14.77% 9.27%
Lower Quartile 7.12% 13.70% 7.95%
Lowest 6.65% 13.29% 7.73%
Number of participants 8 8 8
20.00%
15.00%
10.00%
5.00%
0.00%
1 Year 3 Years (p.a.) 5 Years (p.a.)
25% - 75%
Min - Max
Median
SectIOn 2global Balanced Manager WatchtM Survey - Dynamic
RANGEOFRETURNSOFGLOBALDYNAMICINVESTABLEUNIVERSEFORTHEPERIODSENDING31DECEMBER2011
Note: The statistics above only include those portfolios that are investable i.e. those portfolios that are closed to new business will be excluded from the calculations.
18
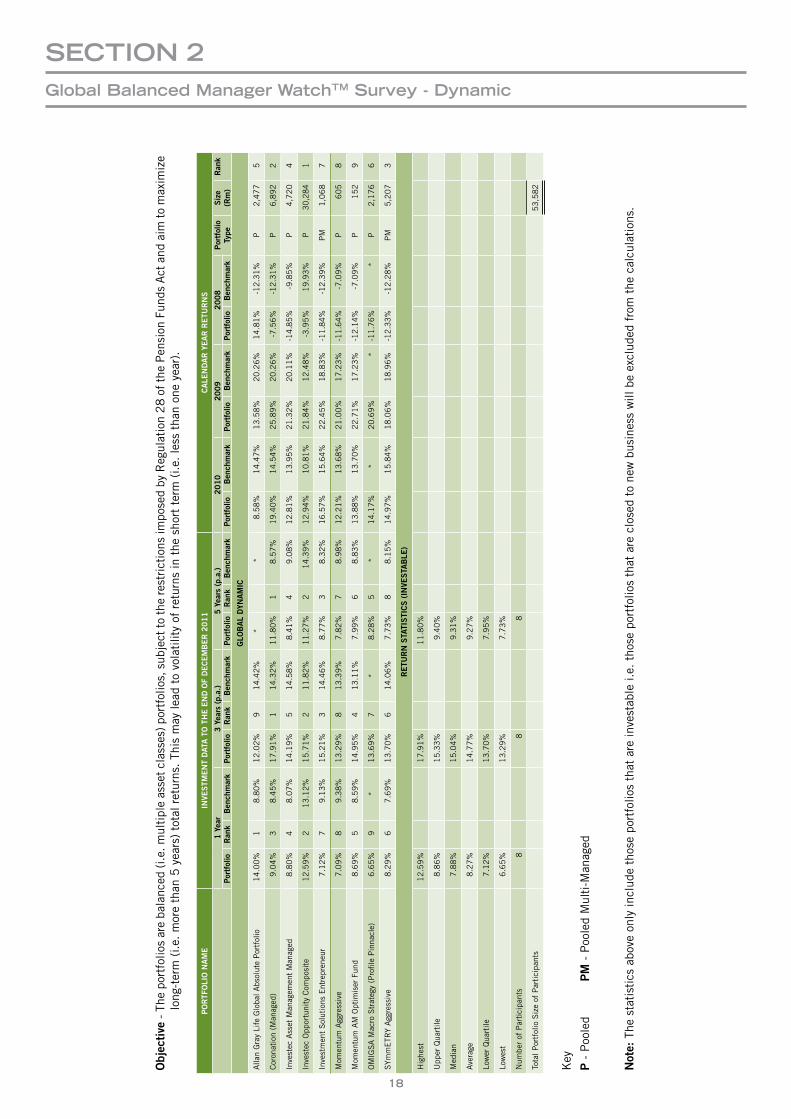
Objec
tive
- Th
e po
rtfo
lios
are
bala
nced
(i.e
. mul
tipl
e as
set c
lass
es) p
ortf
olio
s, s
ubje
ct to
the
rest
rict
ions
impo
sed
by R
egul
atio
n 2
8 o
f the
Pen
sion
Fun
ds A
ct a
nd a
im to
max
imiz
e lo
ng-t
erm
(i.e
. m
ore
than
5 y
ears
) to
tal r
etur
ns. Th
is m
ay le
ad t
o vo
lati
lity
of r
etur
ns in
the
sho
rt t
erm
(i.e
. le
ss t
han
one
year
).
PORTF
OLI
ON
AME
INVE
STM
ENTDAT
ATOTHEE
NDO
FDECEMBER2
011
CALE
NDARYEARR
ETU
RNS
1Yea
r3Yea
rs(p.a.)
5Yea
rs(p.a.)
2010
2009
2008
Portfolio
Type
Siz
e (R
m)
Ran
kPortfolio
Ran
kBen
chmark
Portfolio
Ran
kBen
chmark
Portfolio
Ran
kBen
chmark
Portfolio
Ben
chmark
Portfolio
Ben
chmark
Portfolio
Ben
chmark
GLO
BALDYN
AMIC
Alla
n G
ray
Life
Glo
bal A
bsol
ute
Por
tfol
io1
4.0
0%
1
8.8
0%
12
.02
% 9
1
4.4
2%
*
*8
.58
%1
4.4
7%
13
.58
%2
0.2
6%
14
.81
%-1
2.3
1%
P2
,47
7 5
Cor
onat
ion
(Man
aged
)9
.04
% 3
8
.45
%1
7.9
1%
1
14
.32
%1
1.8
0%
1
8.5
7%
19
.40
%1
4.5
4%
25
.89
%2
0.2
6%
-7.5
6%
-12
.31
%P
6,8
92
2
Inve
stec
Ass
et M
anag
emen
t M
anag
ed8
.80
% 4
8
.07
%1
4.1
9%
5
14
.58
%8
.41
% 4
9
.08
%1
2.8
1%
13
.95
%2
1.3
2%
20
.11
%-1
4.8
5%
-9.8
5%
P4
,72
0 4
Inve
stec
Opp
ortu
nity
Com
posi
te1
2.5
9%
2
13
.12
%1
5.7
1%
2
11
.82
%1
1.2
7%
2
14
.39
%1
2.9
4%
10
.81
%2
1.8
4%
12
.48
%-3
.95
%1
9.9
3%
P30
,284
1
Inve
stm
ent
Sol
utio
ns E
ntre
pren
eur
7.1
2%
7
9.1
3%
15
.21
% 3
1
4.4
6%
8.7
7%
3
8.3
2%
16
.57
%1
5.6
4%
22
.45
%1
8.8
3%
-11
.84
%-1
2.3
9%
PM
1,0
68
7
Mom
entu
m A
ggre
ssiv
e7
.09
% 8
9
.38
%1
3.2
9%
8
13
.39
%7
.82
% 7
8
.98
%1
2.2
1%
13
.68
%2
1.0
0%
17
.23
%-1
1.6
4%
-7.0
9%
P6
05
8
Mom
entu
m A
M O
ptim
iser
Fun
d8
.69
% 5
8
.59
%1
4.9
5%
4
13
.11
%7
.99
% 6
8
.83
%1
3.8
8%
13
.70
%2
2.7
1%
17
.23
%-1
2.1
4%
-7.0
9%
P1
52
9
OM
IGS
A M
acro
Str
ateg
y (P
rofil
e P
inna
cle)
6.6
5%
9
*1
3.6
9%
7
*8
.28
% 5
*
14
.17
%*
20
.69
%*
-11
.76
%*
P2
,17
6 6
SYm
mE
TRY
Agg
ress
ive
8.2
9%
6
7.6
9%
13
.70
% 6
1
4.0
6%
7.7
3%
8
8.1
5%
14
.97
%1
5.8
4%
18
.06
%1
8.9
6%
-12
.33
%-1
2.2
8%
PM
5,2
07
3
RETU
RNS
TATI
STI
CS(IN
VESTA
BLE
)
Hig
hest
12
.59
%1
7.9
1%
11
.80
%
Upp
er Q
uart
ile8
.86
%1
5.3
3%
9.4
0%
Med
ian
7.8
8%
15
.04
%9
.31
%
Ave
rage
8.2
7%
14
.77
%9
.27
%
Low
er Q
uart
ile7
.12
%1
3.7
0%
7.9
5%
Low
est
6.6
5%
13
.29
%7
.73
%
Num
ber
of P
arti
cipa
nts
88
8
Tota
l Por
tfol
io S
ize
of P
arti
cipa
nts
53
,58
2
Key
P -
Poo
led
PM
- P
oole
d M
ulti
-Man
aged
Note:
The
sta
tist
ics
abov
e on
ly in
clud
e th
ose
port
folio
s th
at a
re in
vest
able
i.e.
tho
se p
ortf
olio
s th
at a
re c
lose
d to
new
bus
ines
s w
ill b
e ex
clud
ed f
rom
the
cal
cula
tion
s.
SectIOn 2global Balanced Manager WatchtM Survey - Dynamic
RANGEOFRETURNSOFGLOBALBESTINVESTMENTVIEWINVESTABLEUNIVERSEFORTHEPERIODSENDING31DECEMBER2011
19
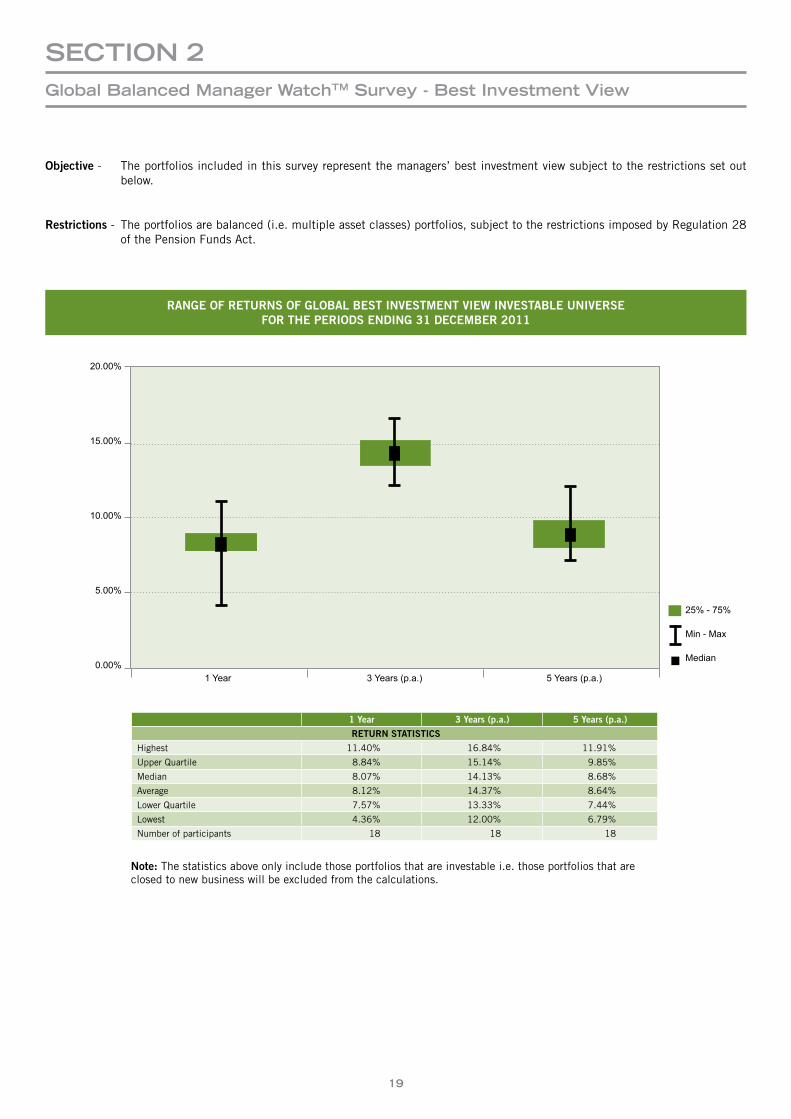
1Year 3Years(p.a.) 5Years(p.a.)
RETURNSTATISTICS
Highest 11.40% 16.84% 11.91%
Upper Quartile 8.84% 15.14% 9.85%
Median 8.07% 14.13% 8.68%
Average 8.12% 14.37% 8.64%
Lower Quartile 7.57% 13.33% 7.44%
Lowest 4.36% 12.00% 6.79%
Number of participants 18 18 18
Objective - The portfolios included in this survey represent the managers’ best investment view subject to the restrictions set out below.
Restrictions - The portfolios are balanced (i.e. multiple asset classes) portfolios, subject to the restrictions imposed by Regulation 28 of the Pension Funds Act.
1 Year 3 Years (p.a.) 5 Years (p.a.)
25% - 75%
Min - Max
Median
20.00%
15.00%
10.00%
5.00%
0.00%
SectIOn 2global Balanced Manager WatchtM Survey - Best Investment view
Note: The statistics above only include those portfolios that are investable i.e. those portfolios that are closed to new business will be excluded from the calculations.
20
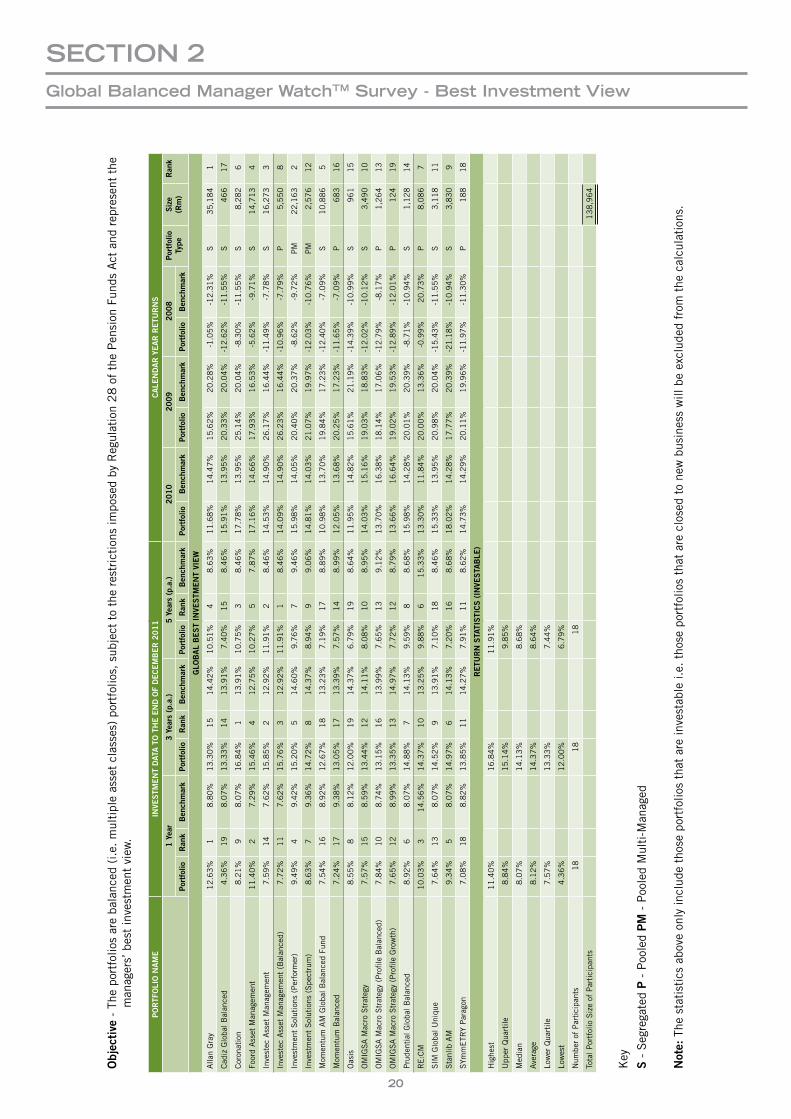
Objec
tive
- T
he p
ortf
olio
s ar
e ba
lanc
ed (
i.e. m
ulti
ple
asse
t cl
asse
s) p
ortf
olio
s, s
ubje
ct t
o th
e re
stri
ctio
ns im
pose
d by
Reg
ulat
ion
28
of
the
Pen
sion
Fun
ds A
ct a
nd r
epre
sent
the
m
anag
ers’
bes
t in
vest
men
t vi
ew.
PORTF
OLI
ON
AME
INVE
STM
ENTDAT
ATOTHEE
NDO
FDECEMBER2
011
CALE
NDARYEARR
ETU
RNS
1Yea
r3Yea
rs(p.a.)
5Yea
rs(p.a.)
2010
2009
2008
Portfolio
Type
Siz
e (R
m)
Ran
k
Portfolio
Ran
kBen
chmark
Portfolio
Ran
kBen
chmark
Portfolio
Ran
kBen
chmark
Portfolio
Ben
chmark
Portfolio
Ben
chmark
Portfolio
Ben
chmark
GLO
BALBESTIN
VESTM
ENTVI
EW
Alla
n G
ray
12
.63
% 1
8
.80
%1
3.3
0%
15
1
4.4
2%
10
.51
% 4
8
.63
%1
1.6
8%
14
.47
%1
5.6
2%
20
.28
%-1
.05
%-1
2.3
1%
S3
5,1
84
1
Cad
iz G
loba
l Bal
ance
d4
.36
% 1
9
8.0
7%
13
.33
% 1
4
13
.91
%7
.40
% 1
5
8.4
6%
15
.91
%1
3.9
5%
20
.33
%2
0.0
4%
-12
.62
%-1
1.5
5%
S4
66
17
Cor
onat
ion
8.2
1%
9
8.0
7%
16
.84
% 1
1
3.9
1%
10
.75
% 3
8
.46
%1
7.7
8%
13
.95
%2
5.1
4%
20
.04
%-8
.30
%-1
1.5
5%
S8
,28
2 6
Foor
d A
sset
Man
agem
ent
11
.40
% 2
7
.29
%1
5.4
6%
4
12
.75
%1
0.2
7%
5
7.8
7%
17
.16
%1
4.6
6%
17
.93
%1
6.5
3%
-5.6
2%
-9.7
1%
S1
4,7
13
4
Inve
stec
Ass
et M
anag
emen
t7
.59
% 1
4
7.6
2%
15
.85
% 2
1
2.9
2%
11
.91
% 2
8
.46
%1
4.5
3%
14
.90
%2
6.1
7%
16
.44
%-1
1.4
9%
-7.7
8%
S1
6,2
73
3
Inve
stec
Ass
et M
anag
emen
t (B
alan
ced)
7.7
2%
11
7
.62
%1
5.7
6%
3
12
.92
%1
1.9
1%
1
8.4
6%
14
.09
%1
4.9
0%
26
.23
%1
6.4
4%
-10
.96
%-7
.79
%P
5,5
50
8
Inve
stm
ent
Sol
utio
ns (
Per
form
er)
9.4
9%
4
9.4
2%
15
.20
% 5
1
4.6
0%
9.7
6%
7
9.4
6%
15
.98
%1
4.0
5%
20
.40
%2
0.3
7%
-8.6
2%
-9.7
2%
PM
22
,16
3 2
Inve
stm
ent
Sol
utio
ns (
Spe
ctru
m)
8.6
3%
7
9.3
6%
14
.72
% 8
1
4.3
7%
8.9
4%
9
9.0
6%
14
.81
%1
4.0
3%
21
.07
%1
9.9
7%
-12
.03
%-1
0.7
6%
PM
2,5
76
12
Mom
entu
m A
M G
loba
l Bal
ance
d Fu
nd7
.54
% 1
6
8.9
2%
12
.67
% 1
8
13
.23
%7
.19
% 1
7
8.8
9%
10
.98
%1
3.7
0%
19
.84
%1
7.2
3%
-12
.40
%-7
.09
%S
10
,88
6 5
Mom
entu
m B
alan
ced
7.2
4%
17
9
.38
%1
3.0
5%
17
1
3.3
9%
7.5
7%
14
8
.99
%1
2.0
5%
13
.68
%2
0.2
5%
17
.23
%-1
1.6
5%
-7.0
9%
P6
83
16
Oas
is8
.55
% 8
8
.12
%1
2.0
0%
19
1
4.3
7%
6.7
9%
19
8
.64
%1
1.9
5%
14
.82
%1
5.6
1%
21
.19
%-1
4.3
9%
-10
.99
%S
96
1 1
5
OM
IGS
A M
acro
Str
ateg
y 7
.57
% 1
5
8.5
9%
13
.44
% 1
2
14
.11
%8
.08
% 1
0
8.9
5%
14
.03
%1
5.1
6%
19
.03
%1
8.8
3%
-12
.02
%-1
0.1
2%
S3
,49
0 1
0
OM
IGS
A M
acro
Str
ateg
y (P
rofil
e B
alan
ced)
7.8
4%
10
8
.74
%1
3.1
5%
16
1
3.9
9%
7.6
5%
13
9
.12
%1
3.7
0%
16
.38
%1
8.1
4%
17
.06
%-1
2.7
9%
-8.1
7%
P1
,26
4 1
3
OM
IGS
A M
acro
Str
ateg
y (P
rofil
e G
row
th)
7.6
5%
12
8
.99
%1
3.3
5%
13
1
4.9
7%
7.7
2%
12
8
.79
%1
3.6
6%
16
.64
%1
9.0
2%
19
.53
%-1
2.8
9%
-12
.01
%P
12
4 1
9
Pru
dent
ial G
loba
l Bal
ance
d8
.92
% 6
8
.07
%1
4.8
8%
7
14
.13
%9
.59
% 8
8
.68
%1
5.9
8%
14
.28
%2
0.0
1%
20
.39
%-8
.71
%-1
0.9
4%
S1
,12
8 1
4
RE
:CM
1
0.0
3%
3
14
.56
%1
4.3
7%
10
1
3.2
5%
9.8
8%
6
15
.33
%1
3.3
0%
11
.84
%2
0.0
0%
13
.36
%-0
.99
%2
0.7
3%
P8
,08
6 7
SIM
Glo
bal U
niqu
e7
.64
% 1
3
8.0
7%
14
.52
% 9
1
3.9
1%
7.1
0%
18
8
.46
%1
5.3
3%
13
.95
%2
0.9
8%
20
.04
%-1
5.4
3%
-11
.55
%S
3,1
18
11
Sta
nlib
AM
9.3
4%
5
8.0
7%
14
.97
% 6
1
4.1
3%
7.2
0%
16
8
.68
%1
8.0
2%
14
.28
%1
7.7
7%
20
.39
%-2
1.1
8%
-10
.94
%S
3,8
30
9
SYm
mE
TRY
Par
agon
7.0
8%
18
8
.82
%1
3.8
5%
11
1
4.2
7%
7.9
1%
11
8
.62
%1
4.7
3%
14
.29
%2
0.1
1%
19
.96
%-1
1.9
7%
-11
.30
%P
18
8 1
8
RETU
RNS
TATI
STI
CS(IN
VESTA
BLE
)
Hig
hest
11
.40
%1
6.8
4%
11
.91
%
Upp
er Q
uart
ile8
.84
%1
5.1
4%
9.8
5%
Med
ian
8.0
7%
14
.13
%8
.68
%
Ave
rage
8.1
2%
14
.37
%8
.64
%
Low
er Q
uart
ile7
.57
%1
3.3
3%
7.4
4%
Low
est
4.3
6%
12
.00
%6
.79
%
Num
ber
of P
arti
cipa
nts
18
18
18
Tota
l Por
tfol
io S
ize
of P
arti
cipa
nts
13
8,9
64
Key
S -
Seg
rega
ted P
- P
oole
d PM
- P
oole
d M
ulti
-Man
aged
Note:
The
sta
tist
ics
abov
e on
ly in
clud
e th
ose
port
folio
s th
at a
re in
vest
able
i.e.
tho
se p
ortf
olio
s th
at a
re c
lose
d to
new
bus
ines
s w
ill b
e ex
clud
ed f
rom
the
cal
cula
tion
s.
SectIOn 2global Balanced Manager WatchtM Survey - Best Investment view
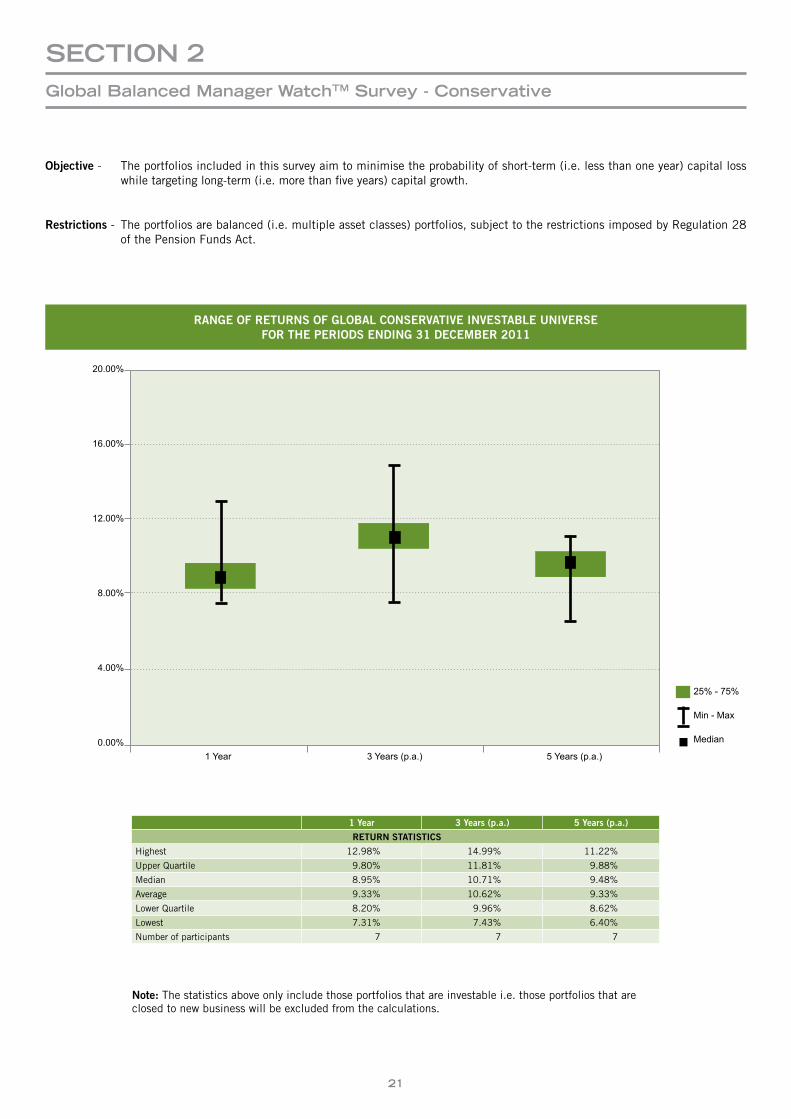
RANGEOFRETURNSOFGLOBALCONSERVATIVEINVESTABLEUNIVERSEFORTHEPERIODSENDING31DECEMBER2011
21
1Year 3Years(p.a.) 5Years(p.a.)
RETURNSTATISTICS
Highest 12.98% 14.99% 11.22%
Upper Quartile 9.80% 11.81% 9.88%
Median 8.95% 10.71% 9.48%
Average 9.33% 10.62% 9.33%
Lower Quartile 8.20% 9.96% 8.62%
Lowest 7.31% 7.43% 6.40%
Number of participants 7 7 7
Objective - The portfolios included in this survey aim to minimise the probability of short-term (i.e. less than one year) capital loss while targeting long-term (i.e. more than five years) capital growth.
Restrictions - The portfolios are balanced (i.e. multiple asset classes) portfolios, subject to the restrictions imposed by Regulation 28 of the Pension Funds Act.
1 Year 3 Years (p.a.) 5 Years (p.a.)
20.00%
16.00%
12.00%
8.00%
4.00%
0.00%
SectIOn 2global Balanced Manager WatchtM Survey - conservative
25% - 75%
Min - Max
Median
Note: The statistics above only include those portfolios that are investable i.e. those portfolios that are closed to new business will be excluded from the calculations.
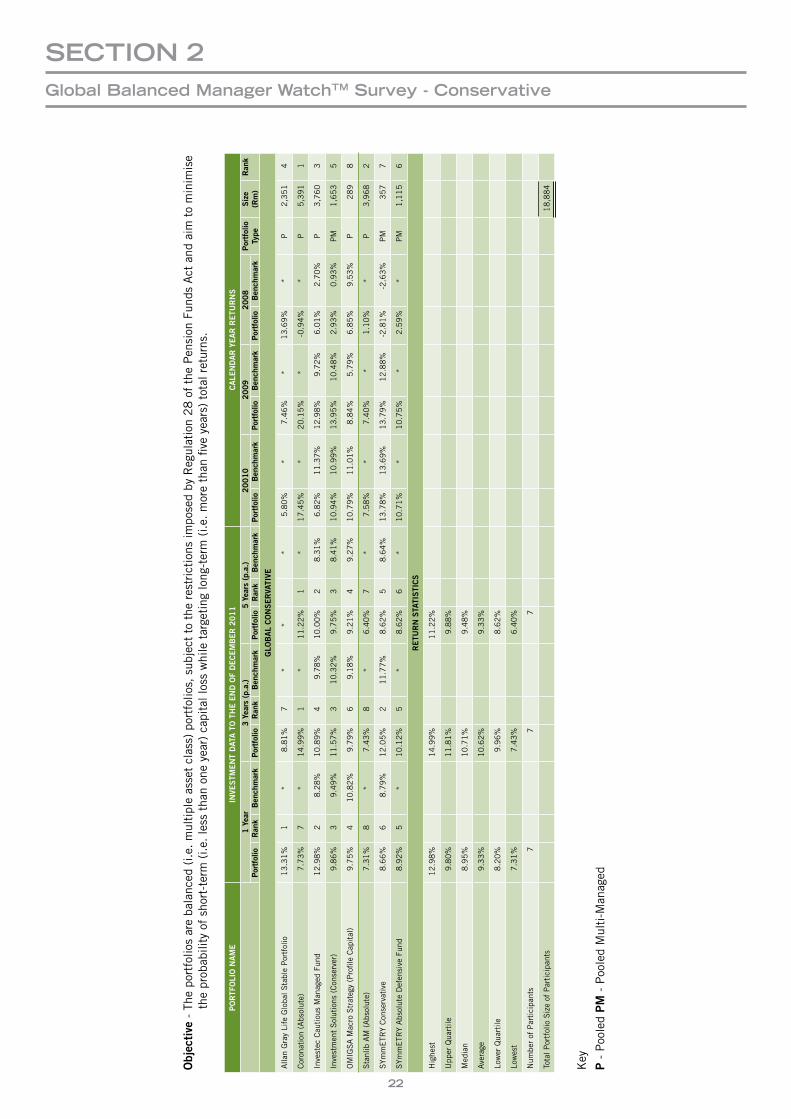
22
Objec
tive
- T
he p
ortf
olio
s ar
e ba
lanc
ed (
i.e. m
ulti
ple
asse
t cl
ass)
por
tfol
ios,
sub
ject
to
the
rest
rict
ions
impo
sed
by R
egul
atio
n 2
8 o
f th
e P
ensi
on F
unds
Act
and
aim
to
min
imis
e t
he p
roba
bilit
y of
sho
rt-t
erm
(i.e
. le
ss t
han
one
year
) ca
pita
l los
s w
hile
tar
geti
ng lo
ng-t
erm
(i.e
. m
ore
than
five
yea
rs)
tota
l ret
urns
.
PORTF
OLI
ON
AME
INVE
STM
ENTDAT
ATOTHEE
NDO
FDECEMBER2
011
CALE
NDARYEARR
ETU
RNS
1Yea
r3Yea
rs(p.a.)
5Yea
rs(p.a.)
20010
2009
2008
Portfolio
Type
Siz
e (R
m)
Ran
kPortfolio
Ran
kBen
chmark
Portfolio
Ran
kBen
chmark
Portfolio
Ran
kBen
chmark
Portfolio
Ben
chmark
Portfolio
Ben
chmark
Portfolio
Ben
chmark
GLO
BALCONSERVA
TIVE
Alla
n G
ray
Life
Glo
bal S
tabl
e P
ortf
olio
13
.31
% 1
*
8.8
1%
7
**
*
5.8
0%
*7
.46
%*
13
.69
%*
P2
,35
1 4
Cor
onat
ion
(Abs
olut
e)7
.73
% 7
*
14
.99
% 1
*
11
.22
% 1
*
17
.45
%*
20
.15
%*
-0.9
4%
*P
5,3
91
1
Inve
stec
Cau
tiou
s M
anag
ed F
und
12
.98
% 2
8
.28
%1
0.8
9%
4
9.7
8%
10
.00
% 2
8
.31
%6
.82
%1
1.3
7%
12
.98
%9
.72
%6
.01
%2
.70
%P
3,7
60
3
Inve
stm
ent
Sol
utio
ns (
Con
serv
er)
9.8
6%
3
9.4
9%
11
.57
% 3
1
0.3
2%
9.7
5%
3
8.4
1%
10
.94
%1
0.9
9%
13
.95
%1
0.4
8%
2.9
3%
0.9
3%
PM
1,6
53
5
OM
IGS
A M
acro
Str
ateg
y (P
rofil
e C
apit
al)
9.7
5%
4
10
.82
%9
.79
% 6
9
.18
%9
.21
% 4
9
.27
%1
0.7
9%
11
.01
%8
.84
%5
.79
%6
.85
%9
.53
%P
28
9 8
Sta
nlib
AM
(A
bsol
ute)
7.3
1%
8
*7
.43
% 8
*
6.4
0%
7
*7
.58
%*
7.4
0%
*1
.10
%*
P3
,96
8 2
SYm
mE
TRY
Con
serv
ativ
e8
.66
% 6
8
.79
%1
2.0
5%
2
11
.77
%8
.62
% 5
8
.64
%1
3.7
8%
13
.69
%1
3.7
9%
12
.88
%-2
.81
%-2
.63
%P
M3
57
7
SYm
mE
TRY
Abs
olut
e D
efen
sive
Fun
d8
.92
% 5
*
10
.12
% 5
*
8.6
2%
6
*1
0.7
1%
*1
0.7
5%
*2
.59
%*
PM
1,1
15
6
RETU
RNS
TATI
STI
CS
Hig
hest
12
.98
%1
4.9
9%
11
.22
%
Upp
er Q
uart
ile9
.80
%1
1.8
1%
9.8
8%
Med
ian
8.9
5%
10
.71
%9
.48
%
Ave
rage
9.3
3%
10
.62
%9
.33
%
Low
er Q
uart
ile8
.20
%9
.96
%8
.62
%
Low
est
7.3
1%
7.4
3%
6.4
0%
Num
ber
of P
arti
cipa
nts
77
7
Tota
l Por
tfol
io S
ize
of P
arti
cipa
nts
18
,88
4
Key
P -
Poo
led PM
- P
oole
d M
ulti
-Man
aged
SectIOn 2global Balanced Manager WatchtM Survey - conservative
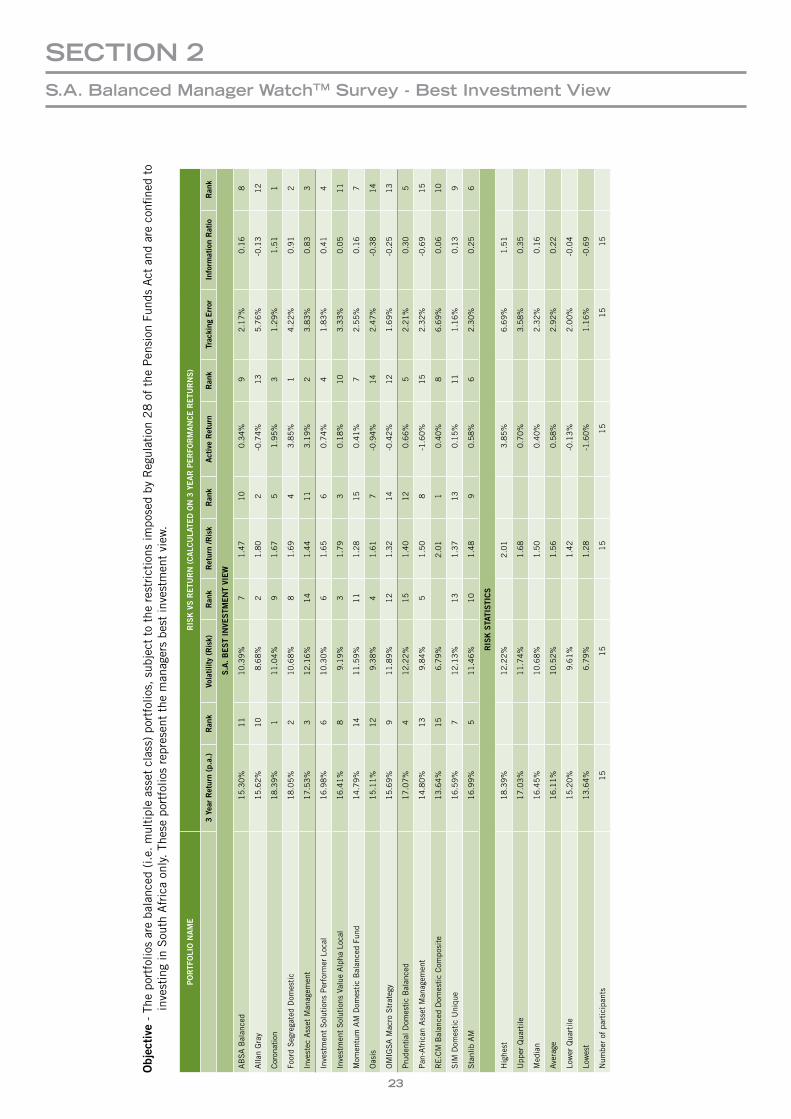
23
Objec
tive
- T
he p
ortf
olio
s ar
e ba
lanc
ed (
i.e. m
ulti
ple
asse
t cl
ass)
por
tfol
ios,
sub
ject
to
the
rest
rict
ions
impo
sed
by R
egul
atio
n 2
8 o
f th
e P
ensi
on F
unds
Act
and
are
con
fined
to
inv
esti
ng in
Sou
th A
fric
a on
ly. Th
ese
port
folio
s re
pres
ent
the
man
ager
s be
st in
vest
men
t vi
ew.
PORTF
OLI
ON
AME
RIS
KVSR
ETU
RN(CALC
ULA
TEDO
N3
YEARP
ERFO
RMANCER
ETU
RNS)
3Yea
rRetur
n(p
.a.)
Ran
kVo
latilit
y(R
isk)
Ran
kRetur
n/R
isk
Ran
kActiveRetur
nRan
kTrac
king
Error
Inform
ationRatio
Ran
k
S.A
.BESTIN
VESTM
ENTVI
EW
AB
SA
Bal
ance
d 1
5.3
0%
11
1
0.3
9%
7
1.4
7
10
0
.34
% 9
2
.17
%0
.16
8
Alla
n G
ray
15
.62
% 1
0
8.6
8%
2
1.8
0
2
-0.7
4%
13
5
.76
%-0
.13
12
Cor
onat
ion
18
.39
% 1
1
1.0
4%
9
1.6
7
5
1.9
5%
3
1.2
9%
1.5
1 1
Foor
d S
egre
gate
d D
omes
tic
18
.05
% 2
1
0.6
8%
8
1.6
9
4
3.8
5%
1
4.2
2%
0.9
1 2
Inve
stec
Ass
et M
anag
emen
t1
7.5
3%
3
12
.16
% 1
4
1.4
4
11
3
.19
% 2
3
.83
%0
.83
3
Inve
stm
ent
Sol
utio
ns P
erfo
rmer
Loc
al1
6.9
8%
6
10
.30
% 6
1
.65
6
0
.74
% 4
1
.83
%0
.41
4
Inve
stm
ent
Sol
utio
ns V
alue
Alp
ha L
ocal
16
.41
% 8
9
.19
% 3
1
.79
3
0
.18
% 1
0
3.3
3%
0.0
5 1
1
Mom
entu
m A
M D
omes
tic
Bal
ance
d Fu
nd1
4.7
9%
14
1
1.5
9%
11
1
.28
1
5
0.4
1%
7
2.5
5%
0.1
6 7
Oas
is1
5.1
1%
12
9
.38
% 4
1
.61
7
-0
.94
% 1
4
2.4
7%
-0.3
8 1
4
OM
IGS
A M
acro
Str
ateg
y1
5.6
9%
9
11
.89
% 1
2
1.3
2
14
-0
.42
% 1
2
1.6
9%
-0.2
5 1
3
Pru
dent
ial D
omes
tic
Bal
ance
d1
7.0
7%
4
12
.22
% 1
5
1.4
0
12
0
.66
% 5
2
.21
%0
.30
5
Pan
-Afr
ican
Ass
et M
anag
emen
t1
4.8
0%
13
9
.84
% 5
1
.50
8
-1
.60
% 1
5
2.3
2%
-0.6
9 1
5
RE
:CM
Bal
ance
d D
omes
tic
Com
posi
te1
3.6
4%
15
6
.79
% 2
.01
1
0
.40
% 8
6
.69
%0
.06
10
SIM
Dom
esti
c U
niqu
e1
6.5
9%
7
12
.13
% 1
3
1.3
7
13
0
.15
% 1
1
1.1
6%
0.1
3 9
Sta
nlib
AM
16
.99
% 5
1
1.4
6%
10
1
.48
9
0
.58
% 6
2
.30
%0
.25
6
RIS
KS
TATI
STI
CS
Hig
hest
18
.39
%1
2.2
2%
2.0
1
3.8
5%
6.6
9%
1.5
1
Upp
er Q
uart
ile1
7.0
3%
11
.74
% 1
.68
0
.70
%3
.58
% 0
.35
Med
ian
16
.45
%1
0.6
8%
1.5
0
0.4
0%
2.3
2%
0.1
6
Ave
rage
16
.11
%1
0.5
2%
1.5
6
0.5
8%
2.9
2%
0.2
2
Low
er Q
uart
ile1
5.2
0%
9.6
1%
1.4
2
-0.1
3%
2.0
0%
-0
.04
Low
est
13
.64
%6
.79
% 1
.28
-1
.60
%1
.16
% -
0.6
9
Num
ber
of p
arti
cipa
nts
15
1
5
15
1
5
15
1
5
SectIOn 2S.a. Balanced Manager WatchtM Survey - Best Investment view
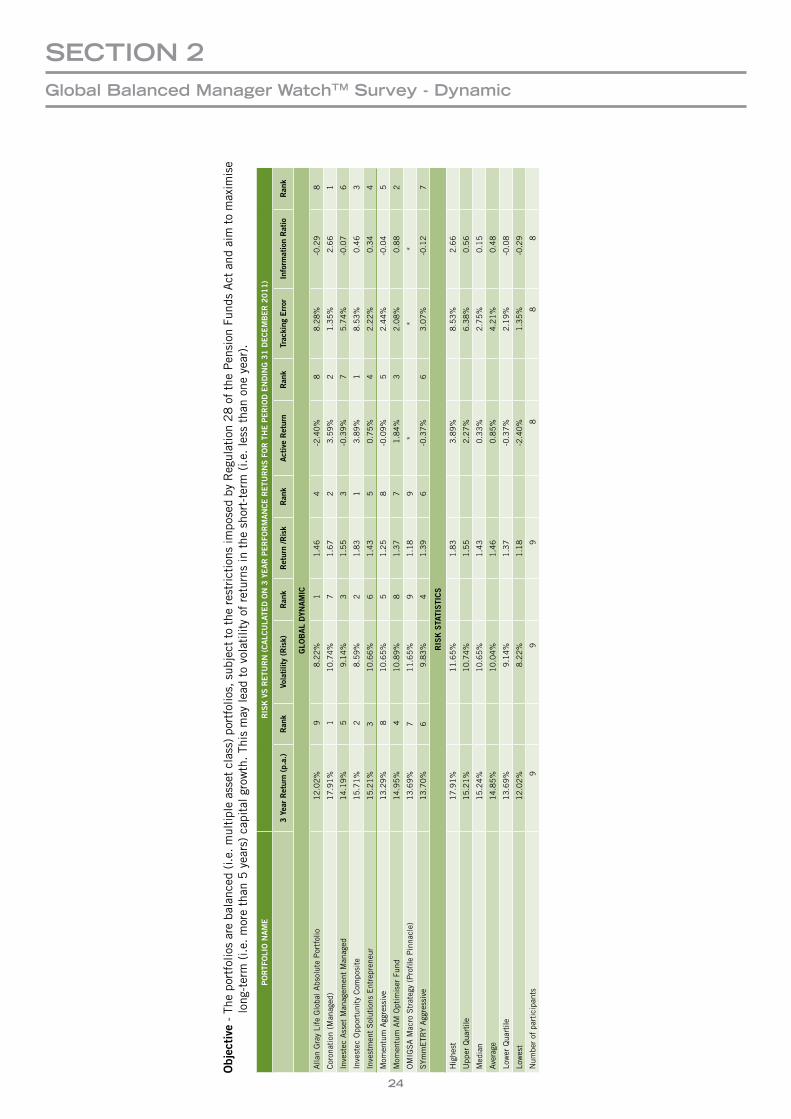
24
Objec
tive
- T
he p
ortf
olio
s ar
e ba
lanc
ed (
i.e. m
ulti
ple
asse
t cl
ass)
por
tfol
ios,
sub
ject
to
the
rest
rict
ions
impo
sed
by R
egul
atio
n 2
8 o
f th
e P
ensi
on F
unds
Act
and
aim
to
max
imis
e lo
ng-t
erm
(i.e
. m
ore
than
5 y
ears
) ca
pita
l gro
wth
. Th
is m
ay le
ad t
o vo
lati
lity
of r
etur
ns in
the
sho
rt-t
erm
(i.e
. le
ss t
han
one
year
).
PORTF
OLI
ON
AME
RIS
KVSR
ETU
RN(CALC
ULA
TEDO
N3
YEARP
ERFO
RMANCER
ETU
RNSFORTHEP
ERIO
DE
NDIN
G3
1D
ECEMBER
2011)
3Yea
rRetur
n(p
.a.)
Ran
kVo
latilit
y(R
isk)
Ran
kRetur
n/R
isk
Ran
kActiveRetur
nRan
kTrac
king
Error
Inform
ationRatio
Ran
k
GLO
BALDYN
AMIC
Alla
n G
ray
Life
Glo
bal A
bsol
ute
Por
tfol
io1
2.0
2%
9
8.2
2%
1
1.4
6
4
-2.4
0%
8
8.2
8%
-0.2
9 8
Cor
onat
ion
(Man
aged
)1
7.9
1%
1
10
.74
% 7
1
.67
2
3
.59
% 2
1
.35
%2
.66
1
Inve
stec
Ass
et M
anag
emen
t M
anag
ed1
4.1
9%
5
9.1
4%
3
1.5
5
3
-0.3
9%
7
5.7
4%
-0.0
7 6
Inve
stec
Opp
ortu
nity
Com
posi
te1
5.7
1%
2
8.5
9%
2
1.8
3
1
3.8
9%
1
8.5
3%
0.4
6 3
Inve
stm
ent
Sol
utio
ns E
ntre
pren
eur
15
.21
%3
10
.66
% 6
1
.43
5
0
.75
% 4
2
.22
%0
.34
4
Mom
entu
m A
ggre
ssiv
e1
3.2
9%
81
0.6
5%
5
1.2
5
8
-0.0
9%
5
2.4
4%
-0.0
4 5
Mom
entu
m A
M O
ptim
iser
Fun
d1
4.9
5%
4
10
.89
% 8
1
.37
7
1
.84
% 3
2
.08
%0
.88
2
OM
IGS
A M
acro
Str
ateg
y (P
rofil
e P
inna
cle)
13
.69
%7
11
.65
% 9
1
.18
9
*
*
*
SYm
mE
TRY
Agg
ress
ive
13
.70
%6
9.8
3%
4
1.3
9
6
-0.3
7%
6
3.0
7%
-0.1
2 7
RIS
KS
TATI
STI
CS
Hig
hest
17
.91
%1
1.6
5%
1.8
3
3.8
9%
8.5
3%
2.6
6
Upp
er Q
uart
ile1
5.2
1%
10
.74
% 1
.55
2
.27
%6
.38
% 0
.56
Med
ian
15
.24
%1
0.6
5%
1.4
3
0.3
3%
2.7
5%
0.1
5
Ave
rage
14
.85
%1
0.0
4%
1.4
6
0.8
5%
4.2
1%
0.4
8
Low
er Q
uart
ile1
3.6
9%
9.1
4%
1.3
7
-0.3
7%
2.1
9%
-0
.08
Low
est
12
.02
%8
.22
% 1
.18
-2
.40
%1
.35
% -
0.2
9
Num
ber
of p
arti
cipa
nts
9
9
9
8
8
8
SectIOn 2global Balanced Manager WatchtM Survey - Dynamic
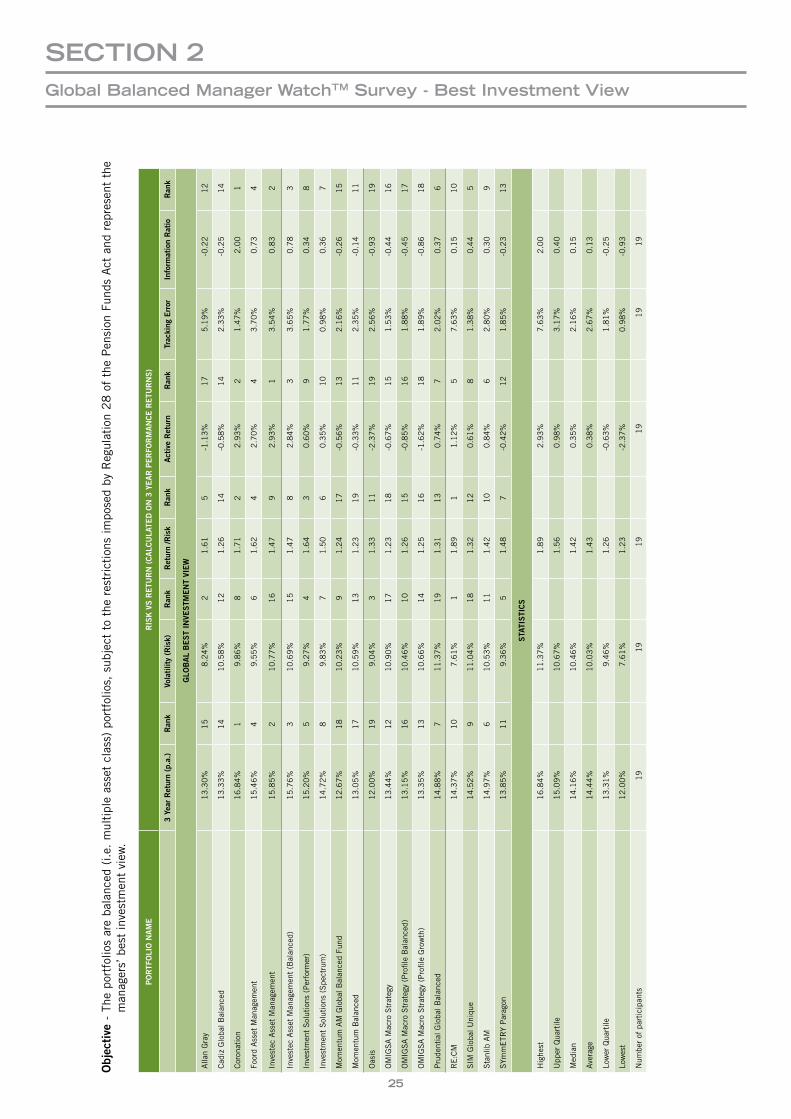
25
Objec
tive
- T
he p
ortf
olio
s ar
e ba
lanc
ed (
i.e.
mul
tipl
e as
set
clas
s) p
ortf
olio
s, s
ubje
ct t
o th
e re
stri
ctio
ns i
mpo
sed
by R
egul
atio
n 2
8 o
f th
e P
ensi
on F
unds
Act
and
rep
rese
nt t
he
man
ager
s’ b
est
inve
stm
ent
view
.
PORTF
OLI
ON
AME
RIS
KVSR
ETU
RN(CALC
ULA
TEDO
N3
YEARP
ERFO
RMANCER
ETU
RNS)
3Yea
rRetur
n(p
.a.)
Ran
kVo
latilit
y(R
isk)
Ran
kRetur
n/R
isk
Ran
kActiveRetur
nRan
kTrac
king
Error
Inform
ationRatio
Ran
k
GLO
BALBESTIN
VESTM
ENTVI
EW
Alla
n G
ray
13
.30
% 1
5
8.2
4%
2
1.6
1
5
-1.1
3%
17
5
.19
%-0
.22
12
Cad
iz G
loba
l Bal
ance
d1
3.3
3%
14
1
0.5
8%
12
1
.26
1
4
-0.5
8%
14
2
.33
%-0
.25
14
Cor
onat
ion
16
.84
% 1
9
.86
% 8
1
.71
2
2
.93
% 2
1
.47
%2
.00
1
Foor
d A
sset
Man
agem
ent
15
.46
% 4
9
.55
% 6
1
.62
4
2
.70
% 4
3
.70
%0
.73
4
Inve
stec
Ass
et M
anag
emen
t1
5.8
5%
2
10
.77
% 1
6
1.4
7
9
2.9
3%
1
3.5
4%
0.8
3 2
Inve
stec
Ass
et M
anag
emen
t (B
alan
ced)
15
.76
% 3
1
0.6
9%
15
1
.47
8
2
.84
% 3
3
.65
%0
.78
3
Inve
stm
ent
Sol
utio
ns (
Per
form
er)
15
.20
% 5
9
.27
% 4
1
.64
3
0
.60
% 9
1
.77
%0
.34
8
Inve
stm
ent
Sol
utio
ns (
Spe
ctru
m)
14
.72
% 8
9
.83
% 7
1
.50
6
0
.35
% 1
0
0.9
8%
0.3
6 7
Mom
entu
m A
M G
loba
l Bal
ance
d Fu
nd1
2.6
7%
18
1
0.2
3%
9
1.2
4
17
-0
.56
% 1
3
2.1
6%
-0.2
6 1
5
Mom
entu
m B
alan
ced
13
.05
% 1
7
10
.59
% 1
3
1.2
3
19
-0
.33
% 1
1
2.3
5%
-0.1
4 1
1
Oas
is1
2.0
0%
19
9
.04
% 3
1
.33
1
1
-2.3
7%
19
2
.56
%-0
.93
19
OM
IGS
A M
acro
Str
ateg
y 1
3.4
4%
12
1
0.9
0%
17
1
.23
1
8
-0.6
7%
15
1
.53
%-0
.44
16
OM
IGS
A M
acro
Str
ateg
y (P
rofil
e B
alan
ced)
13
.15
% 1
6
10
.46
% 1
0
1.2
6
15
-0
.85
% 1
6
1.8
8%
-0.4
5 1
7
OM
IGS
A M
acro
Str
ateg
y (P
rofil
e G
row
th)
13
.35
% 1
3
10
.66
% 1
4
1.2
5
16
-1
.62
% 1
8
1.8
9%
-0.8
6 1
8
Pru
dent
ial G
loba
l Bal
ance
d1
4.8
8%
7
11
.37
% 1
9
1.3
1
13
0
.74
% 7
2
.02
%0
.37
6
RE
:CM
1
4.3
7%
10
7
.61
% 1
1
.89
1
1
.12
% 5
7
.63
%0
.15
10
SIM
Glo
bal U
niqu
e1
4.5
2%
9
11
.04
% 1
8
1.3
2
12
0
.61
% 8
1
.38
%0
.44
5
Sta
nlib
AM
14
.97
% 6
1
0.5
3%
11
1
.42
1
0
0.8
4%
6
2.8
0%
0.3
0 9
SYm
mE
TRY
Par
agon
13
.85
% 1
1
9.3
6%
5
1.4
8
7
-0.4
2%
12
1
.85
%-0
.23
13
STA
TISTI
CS
Hig
hest
16
.84
%1
1.3
7%
1.8
9
2.9
3%
7.6
3%
2.0
0
Upp
er Q
uart
ile1
5.0
9%
10
.67
% 1
.56
0
.98
%3
.17
% 0
.40
Med
ian
14
.16
%1
0.4
6%
1.4
2
0.3
5%
2.1
6%
0.1
5
Ave
rage
14
.44
%1
0.0
3%
1.4
3
0.3
8%
2.6
7%
0.1
3
Low
er Q
uart
ile1
3.3
1%
9.4
6%
1.2
6
-0.6
3%
1.8
1%
-0
.25
Low
est
12
.00
%7
.61
% 1
.23
-2
.37
%0
.98
% -
0.9
3
Num
ber
of p
arti
cipa
nts
19
1
9
19
1
9
19
1
9
SectIOn 2global Balanced Manager WatchtM Survey - Best Investment view
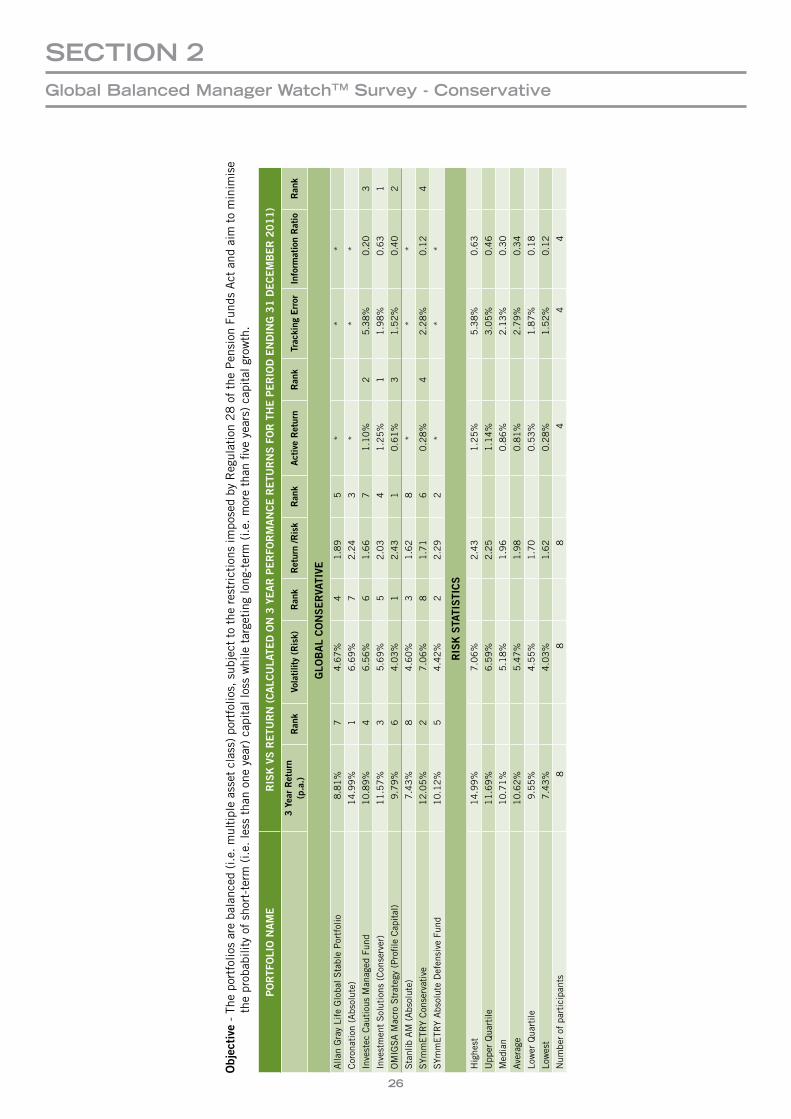
26
Objec
tive
- T
he p
ortf
olio
s ar
e ba
lanc
ed (
i.e. m
ulti
ple
asse
t cl
ass)
por
tfol
ios,
sub
ject
to
the
rest
rict
ions
impo
sed
by R
egul
atio
n 2
8 o
f th
e P
ensi
on F
unds
Act
and
aim
to
min
imis
e t
he p
roba
bilit
y of
sho
rt-t
erm
(i.e
. le
ss t
han
one
year
) ca
pita
l los
s w
hile
tar
geti
ng lo
ng-t
erm
(i.e
. m
ore
than
five
yea
rs)
capi
tal g
row
th.
PORTF
OLI
ON
AME
RIS
KVSR
ETU
RN(CALC
ULA
TEDO
N3
YEARP
ERFO
RMANCER
ETU
RNSFORTHEP
ERIO
DE
NDIN
G3
1D
ECEMBER2
011)
3Yea
rRetur
n(p
.a.)
Ran
kVo
latilit
y(R
isk)
Ran
kRetur
n/R
isk
Ran
kActiveRetur
nRan
kTrac
king
Error
Inform
ationRatio
Ran
k
GLO
BALCONSERVA
TIVE
Alla
n G
ray
Life
Glo
bal S
tabl
e P
ortf
olio
8.8
1%
7
4.6
7%
4
1.8
9
5
*
**
Cor
onat
ion
(Abs
olut
e)1
4.9
9%
1
6.6
9%
7
2.2
4
3
*
**
Inve
stec
Cau
tiou
s M
anag
ed F
und
10
.89
% 4
6
.56
% 6
1
.66
7
1
.10
%2
5
.38
%0
.20
3
Inve
stm
ent
Sol
utio
ns (
Con
serv
er)
11
.57
% 3
5
.69
% 5
2
.03
4
1
.25
%1
1
.98
%0
.63
1
OM
IGS
A M
acro
Str
ateg
y (P
rofil
e C
apit
al)
9.7
9%
6
4.0
3%
1
2.4
3
1
0.6
1%
3
1.5
2%
0.4
02
Sta
nlib
AM
(A
bsol
ute)
7.4
3%
8
4.6
0%
3
1.6
2
8
*
**
SYm
mE
TRY
Con
serv
ativ
e1
2.0
5%
2
7.0
6%
8
1.7
1
6
0.2
8%
4
2.2
8%
0.1
24
SYm
mE
TRY
Abs
olut
e D
efen
sive
Fun
d1
0.1
2%
5
4.4
2%
2
2.2
9
2
*
**
RIS
KS
TATI
STI
CS
Hig
hest
14
.99
%7
.06
%2
.43
1.2
5%
5.3
8%
0.6
3
Upp
er Q
uart
ile1
1.6
9%
6.5
9%
2.2
51
.14
%3
.05
%0
.46
Med
ian
10
.71
%5
.18
%1
.96
0.8
6%
2.1
3%
0.3
0
Ave
rage
10
.62
%5
.47
%1
.98
0.8
1%
2.7
9%
0.3
4
Low
er Q
uart
ile9
.55
%4
.55
%1
.70
0.5
3%
1.8
7%
0.1
8
Low
est
7.4
3%
4.0
3%
1.6
20
.28
%1
.52
%0
.12
Num
ber
of p
arti
cipa
nts
8
8
8
4
4
4
SectIOn 2global Balanced Manager WatchtM Survey - conservative
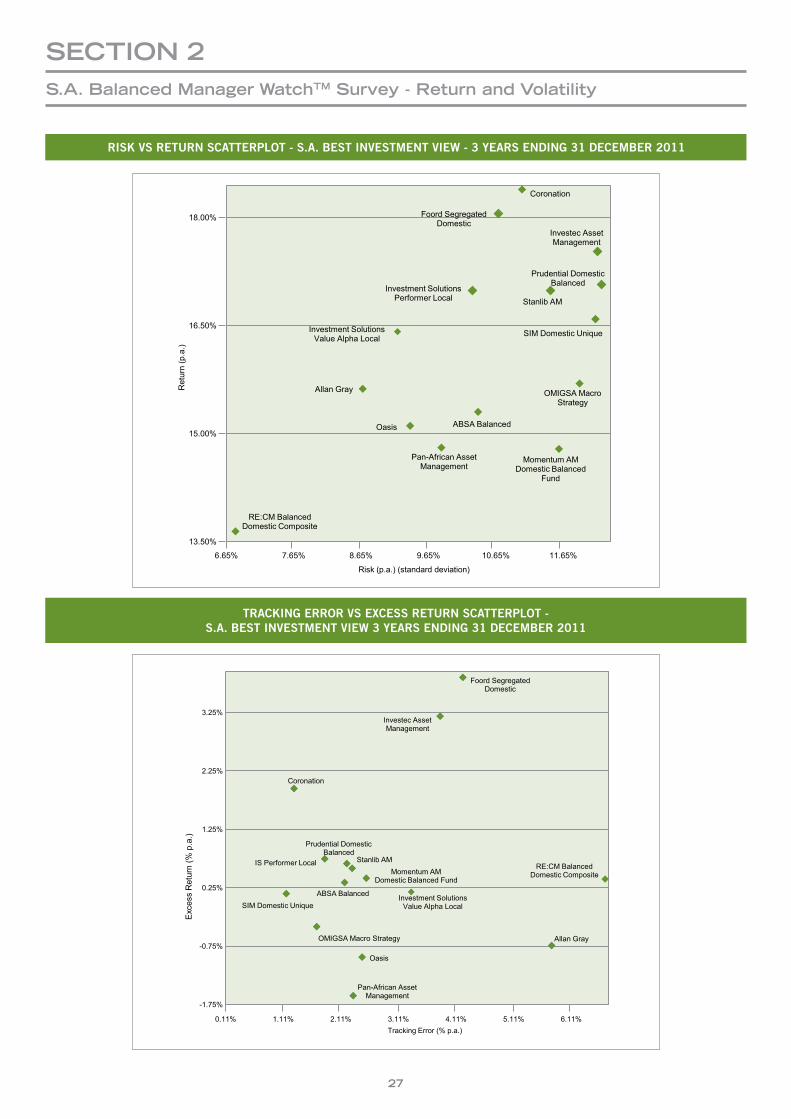
27
RISKVSRETURNSCATTERPLOT-S.A.BESTINVESTMENTVIEW-3YEARSENDING31DECEMBER2011
TRACKINGERRORVSEXCESSRETURNSCATTERPLOT-S.A.BESTINVESTMENTVIEW3YEARSENDING31DECEMBER2011
SectIOn 2S.a. Balanced Manager WatchtM Survey - return and volatility
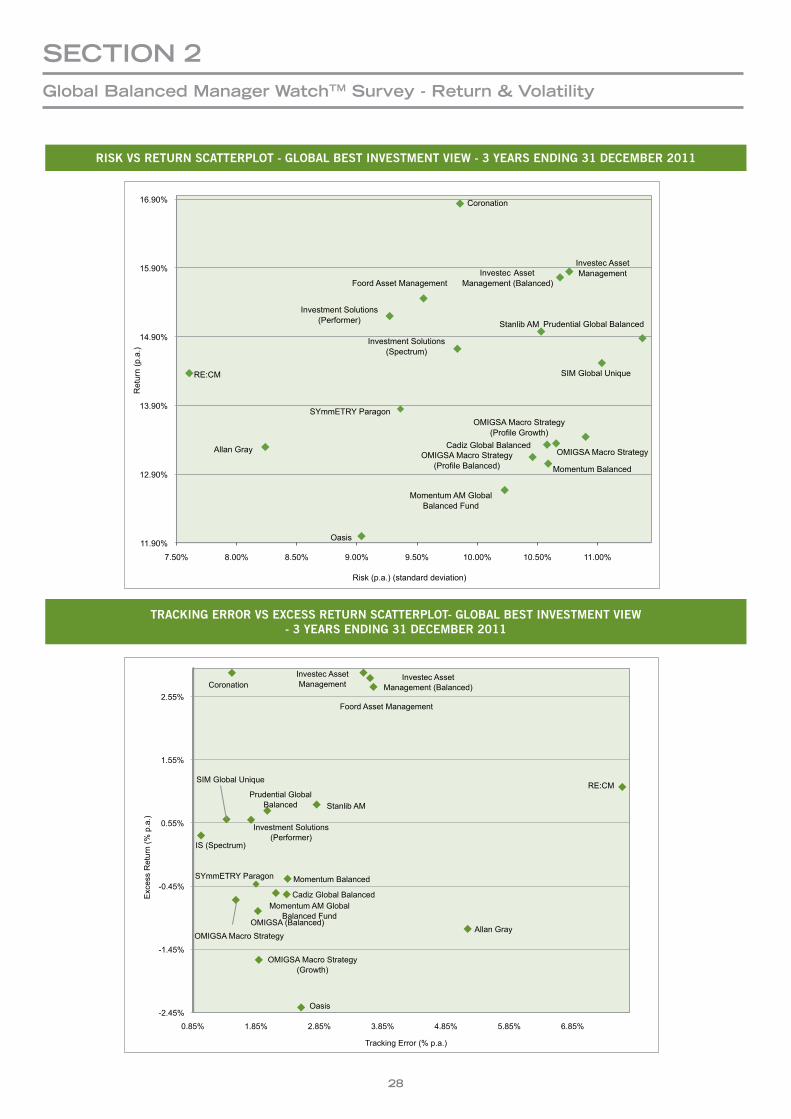
28
SectIOn 2global Balanced Manager WatchtM Survey - return & volatility
RISKVSRETURNSCATTERPLOT-GLOBALBESTINVESTMENTVIEW-3YEARSENDING31DECEMBER2011
TRACKINGERRORVSEXCESSRETURNSCATTERPLOT-GLOBALBESTINVESTMENTVIEW-3YEARSENDING31DECEMBER2011
Cadiz Global Balanced
Allan Gray
Coronation
Foord Asset Management
Investec Asset Management
Investec Asset Management (Balanced)
Investment Solutions (Performer)
IS (Spectrum)
Momentum Balanced
Oasis
OMIGSA Macro Strategy OMIGSA (Balanced)
OMIGSA Macro Strategy (Growth)
Prudential Global Balanced
Momentum AM Global Balanced Fund
SIM Global Unique
Stanlib AM
RE:CM
SYmmETRY Paragon
-2.45%
-1.45%
-0.45%
0.55%
1.55%
2.55%
0.85% 1.85% 2.85% 3.85% 4.85% 5.85% 6.85%
Exc
ess
Ret
urn
(% p
.a.)
Tracking Error (% p.a.)
Cadiz Global Balanced Allan Gray
Coronation
Foord Asset Management
Investec Asset Management Investec Asset
Management (Balanced)
Investment Solutions (Performer)
Investment Solutions (Spectrum)
Momentum Balanced
Oasis
OMIGSA Macro Strategy OMIGSA Macro Strategy (Profile Balanced)
OMIGSA Macro Strategy (Profile Growth)
Prudential Global Balanced
Momentum AM Global Balanced Fund
SIM Global Unique
Stanlib AM
RE:CM
SYmmETRY Paragon
11.90%
12.90%
13.90%
14.90%
15.90%
16.90%
7.50% 8.00% 8.50% 9.00% 9.50% 10.00% 10.50% 11.00%
Ret
urn
(p.a
.)
Risk (p.a.) (standard deviation)
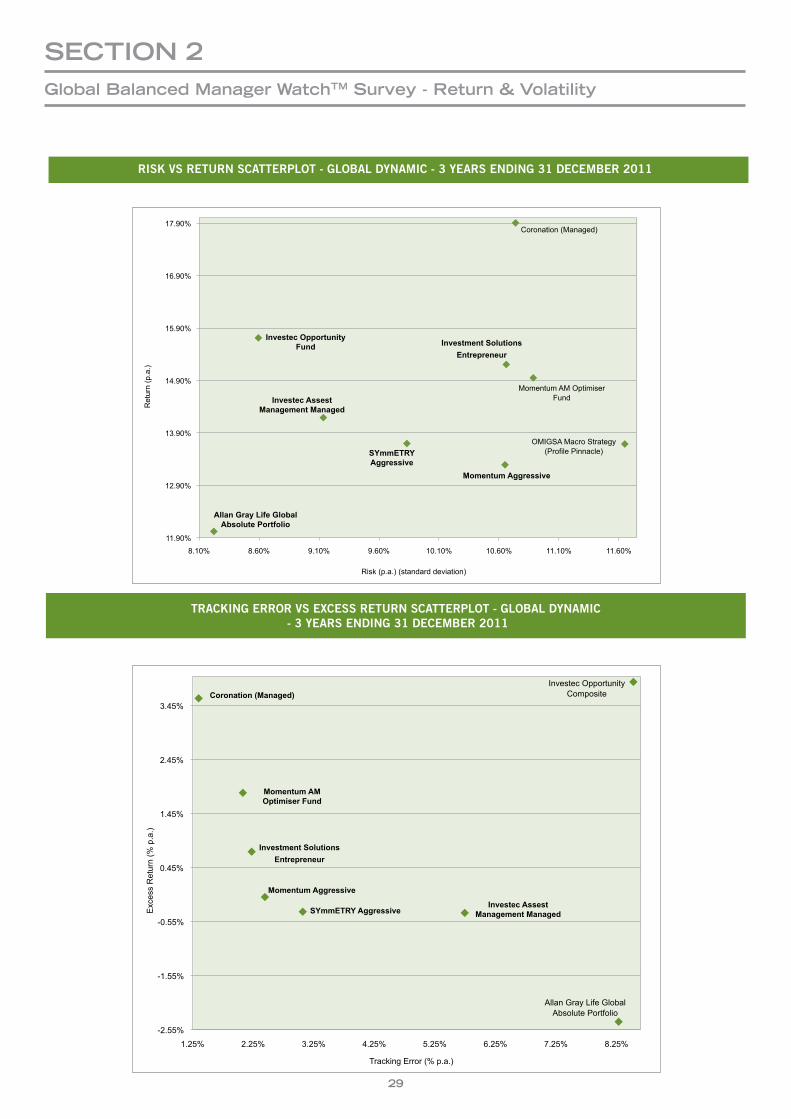
29
RISKVSRETURNSCATTERPLOT-GLOBALDYNAMIC-3YEARSENDING31DECEMBER2011
TRACKINGERRORVSEXCESSRETURNSCATTERPLOT-GLOBALDYNAMIC -3YEARSENDING31DECEMBER2011
SectIOn 2global Balanced Manager WatchtM Survey - return & volatility
Coronation (Managed)
OMIGSA Macro Strategy (Profile Pinnacle)
Momentum AM Optimiser Fund
11.90%
12.90%
13.90%
14.90%
15.90%
16.90%
17.90%
8.10% 8.60% 9.10% 9.60% 10.10% 10.60% 11.10% 11.60%
Ret
urn
(p.a
.)
Risk (p.a.) (standard deviation)
Investment SolutionsEntrepreneur
Investec OpportunityFund
Investec AssestManagement Managed
SYmmETRYAggressive
Allan Gray Life GlobalAbsolute Portfolio
Momentum Aggressive
Allan Gray Life Global Absolute Portfolio
Investec Opportunity Composite
-2.55%
-1.55%
-0.55%
0.45%
1.45%
2.45%
3.45%
1.25% 2.25% 3.25% 4.25% 5.25% 6.25% 7.25% 8.25%
Exc
ess
Ret
urn
(% p
.a.)
Tracking Error (% p.a.)
Investment SolutionsEntrepreneur
Momentum AMOptimiser Fund
Coronation (Managed)
Investec AssestManagement ManagedSYmmETRY Aggressive
Momentum Aggressive
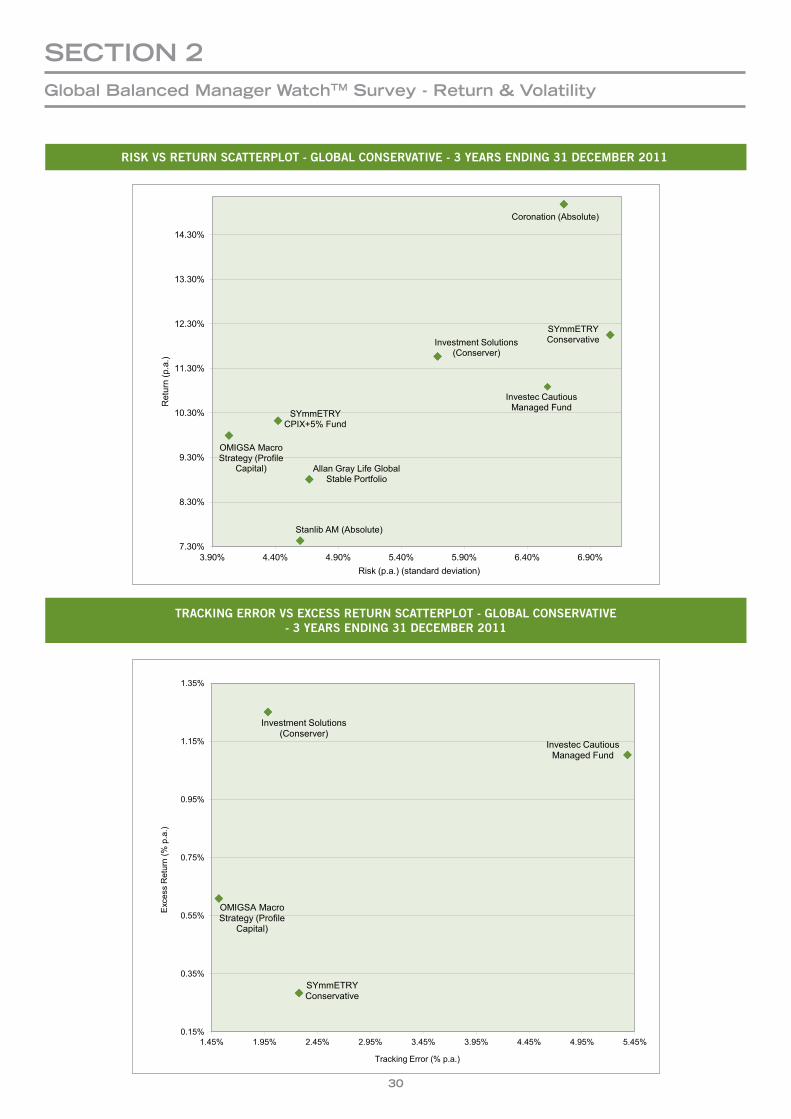
30
RISKVSRETURNSCATTERPLOT-GLOBALCONSERVATIVE-3YEARSENDING31DECEMBER2011
TRACKINGERRORVSEXCESSRETURNSCATTERPLOT-GLOBALCONSERVATIVE-3YEARSENDING31DECEMBER2011
SectIOn 2global Balanced Manager WatchtM Survey - return & volatility
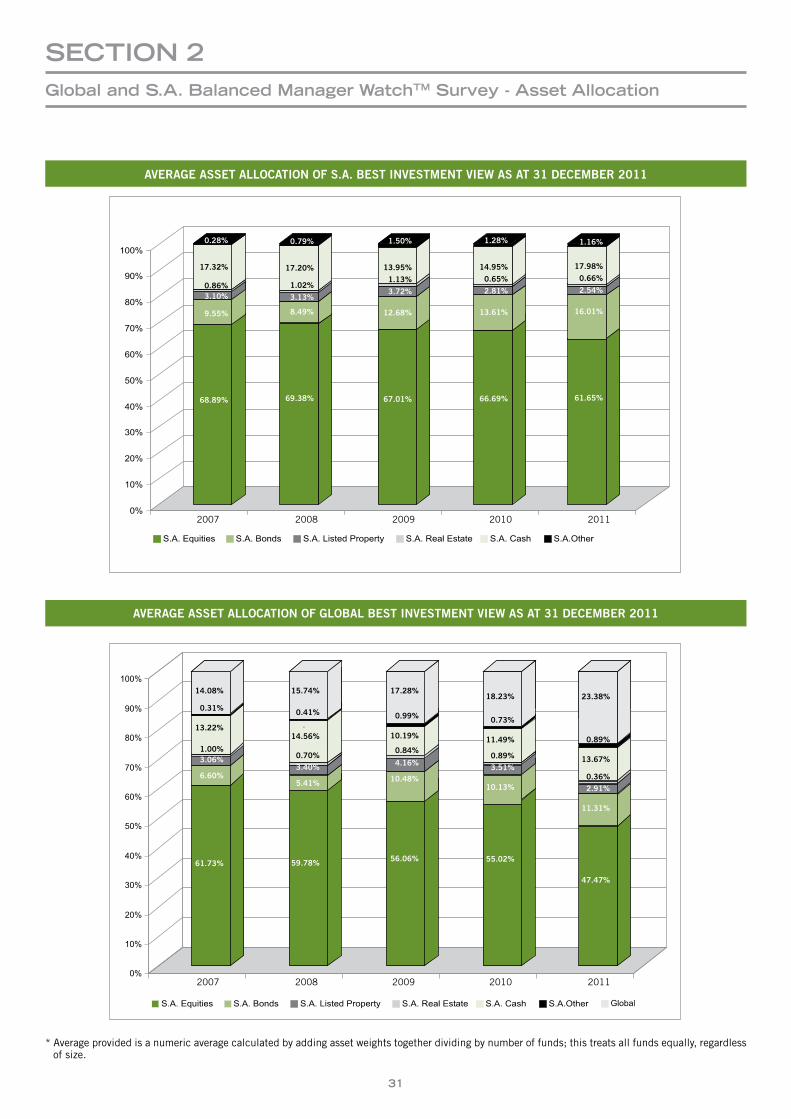
31
AVERAGEASSETALLOCATIONOFS.A.BESTINVESTMENTVIEWASAT31DECEMBER2011
AVERAGEASSETALLOCATIONOFGLOBALBESTINVESTMENTVIEWASAT31DECEMBER2011
* Average provided is a numeric average calculated by adding asset weights together dividing by number of funds; this treats all funds equally, regardless of size.
15.74%
0.41%
14.56%
0.70%3.40%
5.41%
59.78%
17.28%
0.99%
10.19%
0.84%
4.16%
10.48%
56.06%
14.08%
0.31%
13.22%
1.00%3.06%
6.60%
61.73%
2007 2008 2009 2010 2011
18.23%
0.73%
11.49%
0.89%3.51%
10.13%
55.02%
23.38%
0.89%
13.67%
0.36%2.91%
11.31%
47.47%
2007 2008 2009 2010 2011
0.79%
17.20%
1.02%
3.13%
8.49%
69.38%
0.28%
17.32%
0.86%3.10%
9.55%
68.89%
1.50%
13.95%
1.13%
3.72%
12.68%
67.01%
1.28%
14.95%
0.65%
2.81%
13.61%
66.69%
1.16%
17.98%
0.66%
2.54%
16.01%
61.65%
SectIOn 2global and S.a. Balanced Manager WatchtM Survey - asset allocation
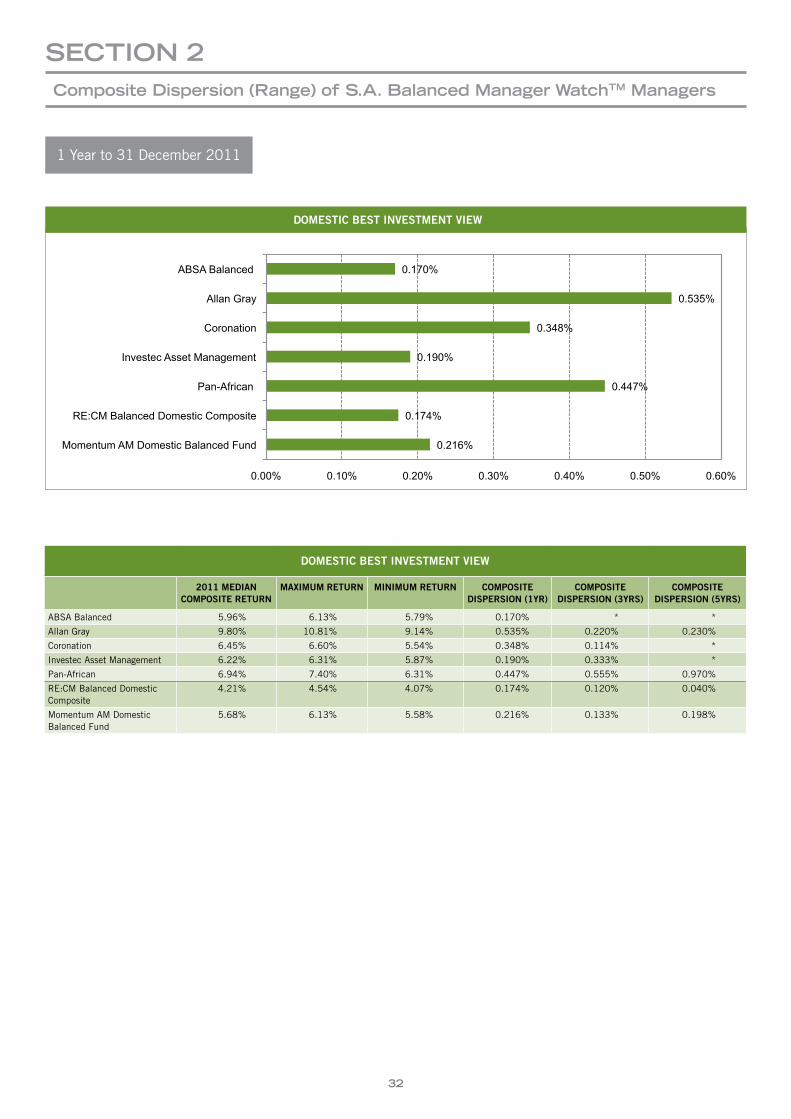
32
0.170%
0.535%
0.348%
0.190%
0.447%
0.174%
0.216%
0.00% 0.10% 0.20% 0.30% 0.40% 0.50% 0.60%
ABSA Balanced
Allan Gray
Coronation
Investec Asset Management
Pan-African
RE:CM Balanced Domestic Composite
Momentum AM Domestic Balanced Fund
DOMESTICBESTINVESTMENTVIEW
DOMESTICBESTINVESTMENTVIEW
2011MEDIANCOMPOSITERETURN
MAXIMUMRETURN MINIMUMRETURN COMPOSITEDISPERSION(1YR)
COMPOSITEDISPERSION(3YRS)
COMPOSITEDISPERSION(5YRS)
ABSA Balanced 5.96% 6.13% 5.79% 0.170% * *
Allan Gray 9.80% 10.81% 9.14% 0.535% 0.220% 0.230%
Coronation 6.45% 6.60% 5.54% 0.348% 0.114% *
Investec Asset Management 6.22% 6.31% 5.87% 0.190% 0.333% *
Pan-African 6.94% 7.40% 6.31% 0.447% 0.555% 0.970%
RE:CM Balanced Domestic Composite
4.21% 4.54% 4.07% 0.174% 0.120% 0.040%
Momentum AM Domestic Balanced Fund
5.68% 6.13% 5.58% 0.216% 0.133% 0.198%
SectIOn 2composite Dispersion (range) of S.a. Balanced Manager WatchtM Managers
1 Year to 31 December 2011
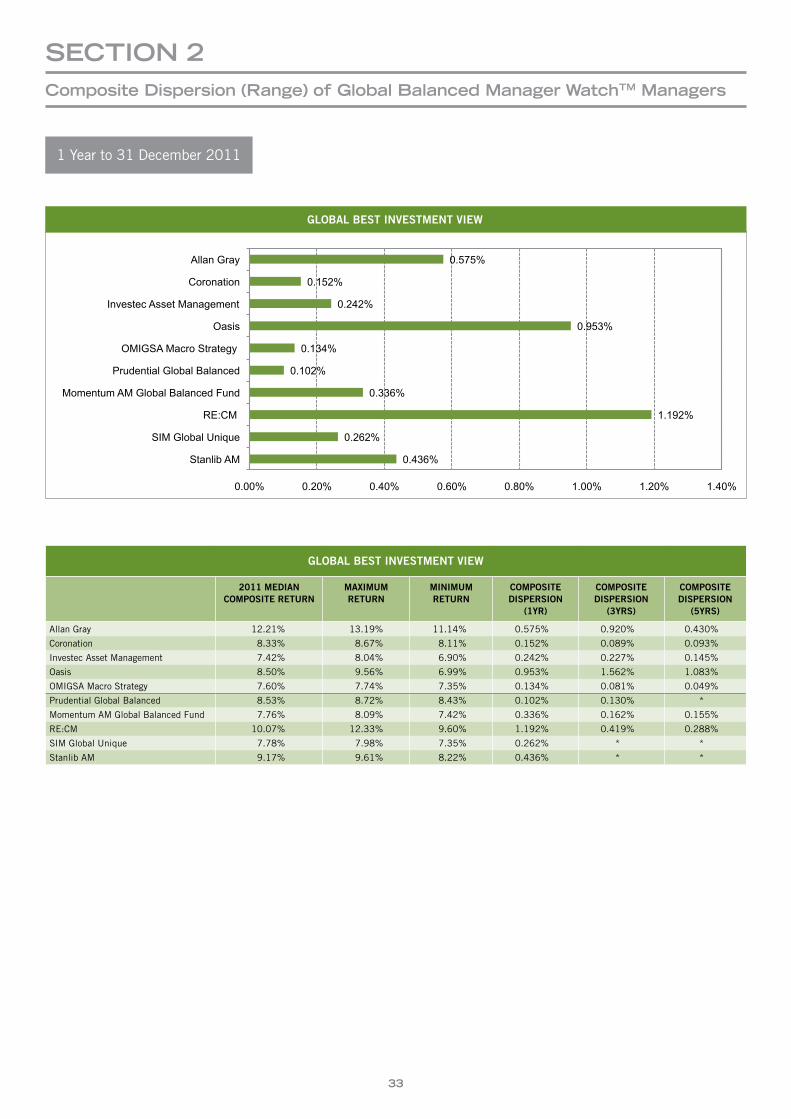
33
GLOBALBESTINVESTMENTVIEW
2011MEDIANCOMPOSITERETURN
MAXIMUMRETURN
MINIMUMRETURN
COMPOSITEDISPERSION
(1YR)
COMPOSITEDISPERSION
(3YRS)
COMPOSITEDISPERSION
(5YRS)
Allan Gray 12.21% 13.19% 11.14% 0.575% 0.920% 0.430%
Coronation 8.33% 8.67% 8.11% 0.152% 0.089% 0.093%
Investec Asset Management 7.42% 8.04% 6.90% 0.242% 0.227% 0.145%
Oasis 8.50% 9.56% 6.99% 0.953% 1.562% 1.083%
OMIGSA Macro Strategy 7.60% 7.74% 7.35% 0.134% 0.081% 0.049%
Prudential Global Balanced 8.53% 8.72% 8.43% 0.102% 0.130% *
Momentum AM Global Balanced Fund 7.76% 8.09% 7.42% 0.336% 0.162% 0.155%
RE:CM 10.07% 12.33% 9.60% 1.192% 0.419% 0.288%
SIM Global Unique 7.78% 7.98% 7.35% 0.262% * *
Stanlib AM 9.17% 9.61% 8.22% 0.436% * *
0.575%
0.152%
0.242%
0.953%
0.134%
0.102%
0.336%
1.192%
0.262%
0.436%
0.00% 0.20% 0.40% 0.60% 0.80% 1.00% 1.20% 1.40%
Allan Gray
Coronation
Investec Asset Management
Oasis
OMIGSA Macro Strategy
Prudential Global Balanced
Momentum AM Global Balanced Fund
RE:CM
SIM Global Unique
Stanlib AM
Global Best Investment View GLOBALBESTINVESTMENTVIEW
1 Year to 31 December 2011
SectIOn 2composite Dispersion (range) of global Balanced Manager WatchtM Managers

34
tbsp /// beyond the line 33926
Go on a shopping spree in Paris.
Dance in the rain with a friend.
Fall asleep under the stars.
Teach someone to read.
Audition for theatre.
Go on a blind date.
Build a snowman.
Kiss a celebrity.
Sing to a child.
Start a pillow fight.
Paint a self-portrait.
Learn to belly dance.
Help someone in need.
Cook something you’ve grown.
Test-drive a car you can’t afford.
Switch your cell phone off for a month.
Live without regret.
An Authorised Financial Service Provider

35
SectIOn 3S.a. equity Manager WatchtM Survey
Objective - The portfolios included represent specialist equity funds which are actively managed to various benchmarks. Owing to the differing benchmarks the survey ranks active returns or out - or underperformance over the benchmark and risk adjusted returns. No carve-outs are reflected.
The equity survey covers a broad universe of specialist equity products for institutional investors including value, growth, active quantitative, market-orientated styles all with different risk profiles.
1Year 3Years(p.a.) 5Years(p.a.)
RETURNSTATISTICS
Highest 12.21% 22.48% 15.45%
Upper Quartile 5.11% 18.69% 10.77%
Median 3.80% 17.68% 9.31%
Average 3.80% 17.81% 9.47%
Lower Quartile 1.72% 17.06% 8.25%
Lowest -1.71% 13.42% 6.68%
Number of participants 63 53 36
RANGEOFRETURNSOFEQUITYUNIVERSEFORTHEPERIODSENDING31DECEMBER2011
1 Year 3 Years (p.a.) 5 Years (p.a.)
25% - 75%
Min - Max
Median
25.00%
20.00%
15.00%
10.00%
5.00%
0.00%
-5.00%
BENCHMARKSOFPORTFOLIOSINTHEEQUITYSURVEYASPERCENTAGEOFTHESURVEYUNIVERSE
BENCHMARK %OFUNIVERSE
FTSE/JSE All Share Index 22.22%
FTSE/JSE Capped Index 4.76%
FTSE/JSE SWIX 55.56%
FTSE/JSE Top 40 3.17%
Other 14.29%
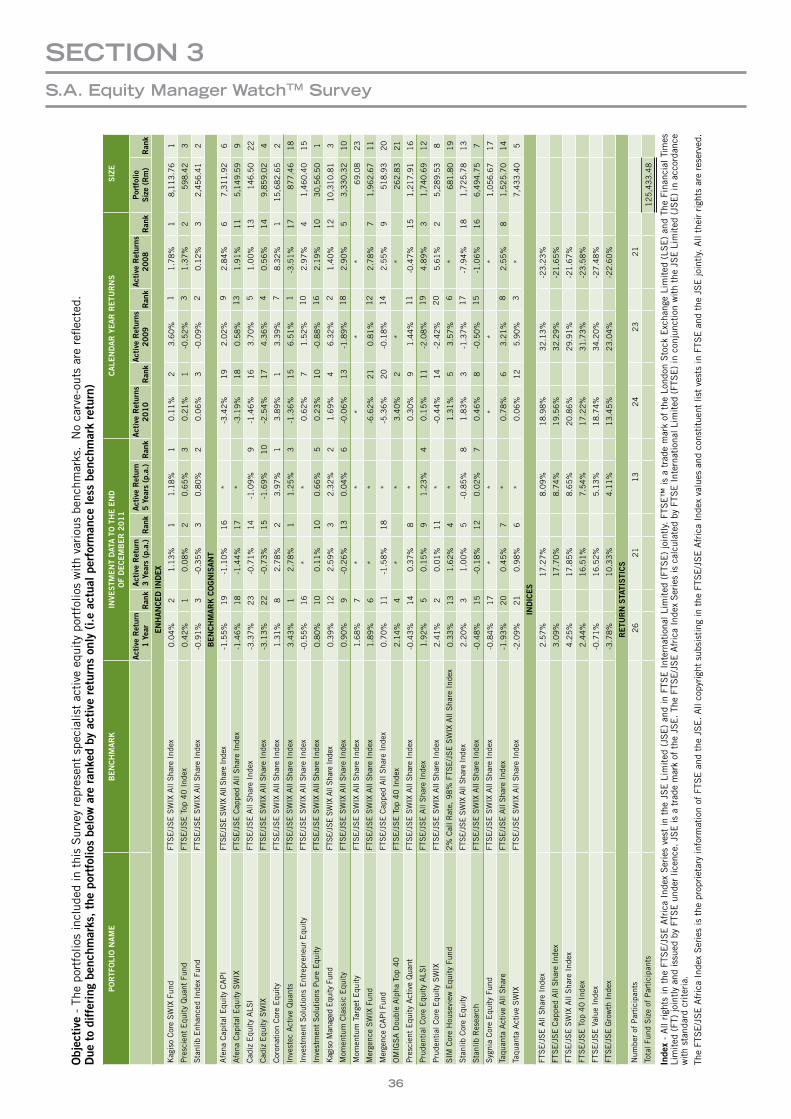
36
Objec
tive
- T
he p
ortf
olio
s in
clud
ed in
thi
s S
urve
y re
pres
ent
spec
ialis
t ac
tive
equ
ity
port
folio
s w
ith
vari
ous
benc
hmar
ks. N
o ca
rve-
outs
are
refl
ecte
d.Due
todifferingbe
nchm
arks
,th
epo
rtfolio
sbe
lowareran
kedby
activeretu
rnson
ly(i.e
actua
lperform
ance
less
ben
chmarkretu
rn)
PORTF
OLI
ON
AME
BENCHMARK
INVE
STM
ENTDAT
ATOTHEE
ND
OFDECEMBER2
011
CALE
NDARYEARR
ETU
RNS
SIZ
E
ActiveRetur
n1Yea
rRan
kActiveRetur
n3Yea
rs(p.a.)
Ran
kActiveRetur
n5Yea
rs(p.a.)
Ran
kActiveRetur
ns
2010
Ran
kActiveRetur
ns
2009
Ran
kActiveRetur
ns
2008
Ran
kPortfolio
Size(R
m)
Ran
k
ENHANCEDINDEX
Kag
iso
Cor
e S
WIX
Fun
d FT
SE
/JS
E S
WIX
All
Sha
re I
ndex
0.0
4%
21
.13
%1
1.1
8%
10
.11
%2
3.6
0%
11
.78
%1
8,1
13
.76
1
Pre
scie
nt E
quit
y Q
uant
Fun
d FT
SE
/JS
E T
op 4
0 I
ndex
0.4
2%
10
.08
%2
0.6
5%
30
.21
%1
-0.5
2%
31
.37
%2
59
8.4
2
3
Sta
nlib
Enh
ance
d In
dex
Fund
FTS
E/J
SE
SW
IX A
ll S
hare
Ind
ex-0
.91
%3
-0.3
5%
30
.80
%2
0.0
6%
3-0
.09
%2
0.1
2%
3 2
,45
6.4
1
2
BENCHMARKC
OGNIS
ANT
Afe
na C
apit
al E
quit
y C
AP
IFT
SE/J
SE S
WIX
All
Shar
e In
dex
-1.5
5%
19
-1.1
0%
16
*-3
.42
%1
92
.02
%9
2.8
4%
6 7
,31
1.9
2
6
Afe
na C
apit
al E
quit
y S
WIX
FTS
E/J
SE
Cap
ped
All
Sha
re I
ndex
-1.4
6%
18
-1.4
4%
17
*-3
.19
%1
80
.58
%1
31
.91
%1
1 5
,14
9.5
9
9
Cad
iz E
quit
y A
LSI
FTS
E/J
SE
All
Sha
re I
ndex
-3.3
7%
23
-0.7
1%
14
-1.0
9%
9-1
.46
%1
63
.70
%5
1.0
0%
13
14
6.5
0
22
Cad
iz E
quit
y S
WIX
FTS
E/J
SE
SW
IX A
ll S
hare
Ind
ex-3
.13
%2
2-0
.73
%1
5-1
.69
%1
0-2
.54
%1
74
.36
%4
0.5
6%
14
9,8
59
.02
4
Cor
onat
ion
Cor
e E
quit
y FT
SE
/JS
E S
WIX
All
Sha
re I
ndex
1.3
1%
82
.78
%2
3.9
7%
13
.89
%1
3.3
9%
78
.32
%1
15
,68
2.6
5
2
Inve
stec
Act
ive
Qua
nts
FTS
E/J
SE
SW
IX A
ll S
hare
Ind
ex3
.43
%1
2.7
8%
11
.25
%3
-1.3
6%
15
6.5
1%
1-3
.51
%1
7 8
77
.46
1
8
Inve
stm
ent
Sol
utio
ns E
ntre
pren
eur
Equ
ity
FTS
E/J
SE
SW
IX A
ll S
hare
Ind
ex-0
.55
%1
6*
*0
.62
%7
1.5
2%
10
2.9
7%
4 1
,46
0.4
0
15
Inve
stm
ent
Sol
utio
ns P
ure
Equ
ity
FTS
E/J
SE
SW
IX A
ll S
hare
Ind
ex0
.80
%1
00
.11
%1
00
.66
%5
0.2
3%
10
-0.8
8%
16
2.1
9%
10
30
,56
.50
1
Kag
iso
Man
aged
Equ
ity F
und
FTSE
/JSE
SW
IX A
ll Sh
are
Inde
x0
.39
%1
22
.59
%3
2.3
2%
21
.69
%4
6.3
2%
21
.40
%1
2 1
0,3
10
.81
3
Mom
entu
m C
lass
ic E
quit
yFT
SE
/JS
E S
WIX
All
Sha
re I
ndex
0.9
0%
9-0
.26
%1
30
.04
%6
-0.0
6%
13
-1.8
9%
18
2.9
0%
5 3
,33
0.3
2
10
Mom
entu
m T
arge
t E
quit
yFT
SE
/JS
E S
WIX
All
Sha
re I
ndex
1.6
8%
7*
**
*
*
6
9.0
8
23
Mer
genc
e S
WIX
Fun
dFT
SE
/JS
E S
WIX
All
Sha
re I
ndex
1.8
9%
6*
*-6
.62
%2
10
.81
%1
22
.78
%7
1,9
62
.67
1
1
Mer
genc
e CA
PI F
und
FTS
E/J
SE
Cap
ped
All
Sha
re I
ndex
0.7
0%
11
-1.5
8%
18
*-5
.36
%2
0-0
.18
%1
42
.55
%9
51
8.9
3
20
OM
IGS
A D
oubl
e A
lpha
Top
40
FTS
E/J
SE
Top
40
Ind
ex2
.14
%4
**
3.4
0%
2*
*
2
62
.83
2
1
Pre
scie
nt E
quit
y A
ctiv
e Q
uant
FTS
E/J
SE
SW
IX A
ll S
hare
Ind
ex-0
.43
%1
40
.37
%8
*0
.30
%9
1.4
4%
11
-0.4
7%
15
1,2
17
.91
1
6
Pru
dent
ial C
ore
Equ
ity
ALS
IFT
SE
/JS
E A
ll S
hare
Ind
ex1
.92
%5
0.1
5%
91
.23
%4
0.1
5%
11
-2.0
8%
19
4.8
9%
3 1
,74
0.6
9
12
Pru
dent
ial C
ore
Equ
ity
SW
IXFT
SE
/JS
E S
WIX
All
Sha
re I
ndex
2.4
1%
20
.01
%1
1*
-0.4
4%
14
-2.4
2%
20
5.6
1%
2 5
,28
9.5
3
8
SIM
Cor
e H
ouse
view
Equ
ity
Fund
2%
Cal
l Rat
e, 9
8%
FTS
E/J
SE
SW
IX A
ll S
hare
Ind
ex0
.33
%1
31
.62
%4
*1
.31
%5
3.5
7%
6*
6
81
.80
1
9
Sta
nlib
Cor
e E
quit
y FT
SE/J
SE S
WIX
All
Shar
e In
dex
2.2
0%
31
.00
%5
-0.8
5%
81
.83
%3
-1.3
7%
17
-7.9
4%
18
1,7
25
.78
1
3
Sta
nlib
Res
earc
hFT
SE
/JS
E S
WIX
All
Sha
re I
ndex
-0.4
8%
15
-0.1
8%
12
0.0
2%
70
.46
%8
-0.5
0%
15
-1.0
6%
16
6,4
94
.75
7
Syg
nia
Cor
e E
quit
y Fu
ndFT
SE
/JS
E S
WIX
All
Sha
re I
ndex
-0.8
4%
17
**
*
*
*
1,0
56
.67
1
7
Taqu
anta
Act
ive
All
Sha
reFT
SE
/JS
E A
ll S
hare
Ind
ex-1
.93
%2
00
.45
%7
*0
.78
%6
3.2
1%
82
.55
%8
1,5
25
.70
1
4
Taqu
anta
Act
ive
SW
IXFT
SE
/JS
E S
WIX
All
Sha
re I
ndex
-2.0
9%
21
0.9
8%
6*
0.0
6%
12
5.9
0%
3*
7
,43
3.4
05
INDIC
ES
FTS
E/J
SE
All
Sha
re I
ndex
2.5
7%
17
.27
%8
.09
%1
8.9
8%
32
.13
%-2
3.2
3%
FTS
E/J
SE
Cap
ped
All
Sha
re I
ndex
3.0
9%
17
.70
%8
.74
%1
9.5
6%
32
.29
%-2
1.6
5%
FTS
E/J
SE
SW
IX A
ll S
hare
Ind
ex4
.25
%1
7.8
5%
8.6
5%
20
.86
%2
9.9
1%
-21
.67
%
FTS
E/J
SE
Top
40
Ind
ex2
.44
%1
6.5
1%
7.5
4%
17
.22
%3
1.7
3%
-23
.58
%
FTS
E/J
SE
Val
ue I
ndex
-0.7
1%
16
.52
%5
.13
%1
8.7
4%
34
.20
%-2
7.4
8%
FTS
E/J
SE
Gro
wth
Ind
ex-3
.78
%1
0.3
3%
4.1
1%
13
.45
%2
3.0
4%
-22
.60
%
RETU
RNS
TATI
STI
CS
Num
ber
of P
arti
cipa
nts
26
21
13
24
23
21
Tota
l Fun
d S
ize
of P
arti
cipa
nts
12
5,4
33
.48
Inde
x -
All
righ
ts in
the
FTS
E/J
SE
Afr
ica
Inde
x S
erie
s ve
st in
the
JSE
Lim
ited
(JS
E)
and
in F
TSE
Int
erna
tion
al L
imit
ed (
FTS
E)
join
tly.
FTS
E™
is
a tr
ade
mar
k of
the
Lon
don
Sto
ck E
xcha
nge
Lim
ited
(LS
E)
and
The
Fina
ncia
l Ti
mes
Li
mit
ed (
FT)
join
tly
and
issu
ed b
y FT
SE
und
er li
cenc
e. J
SE
is a
tra
de m
ark
of t
he J
SE
. Th
e FT
SE
/JS
E A
fric
a In
dex
Ser
ies
is c
alcu
late
d by
FTS
E I
nter
nati
onal
Lim
ited
(FT
SE
) in
con
junc
tion
wit
h th
e JS
E L
imit
ed (
JSE
) in
acc
orda
nce
wit
h st
anda
rd c
rite
ria.
The
FTS
E/J
SE
Afr
ica
Inde
x S
erie
s is
the
pro
prie
tary
info
rmat
ion
of F
TSE
and
the
JS
E.
All
copy
righ
t su
bsis
ting
in t
he F
TSE
/JS
E A
fric
a In
dex
valu
es a
nd c
onst
itue
nt li
st v
ests
in F
TSE
and
the
JS
E jo
intl
y. A
ll th
eir
righ
ts a
re r
eser
ved.
SectIOn 3S.a. equity Manager WatchtM Survey
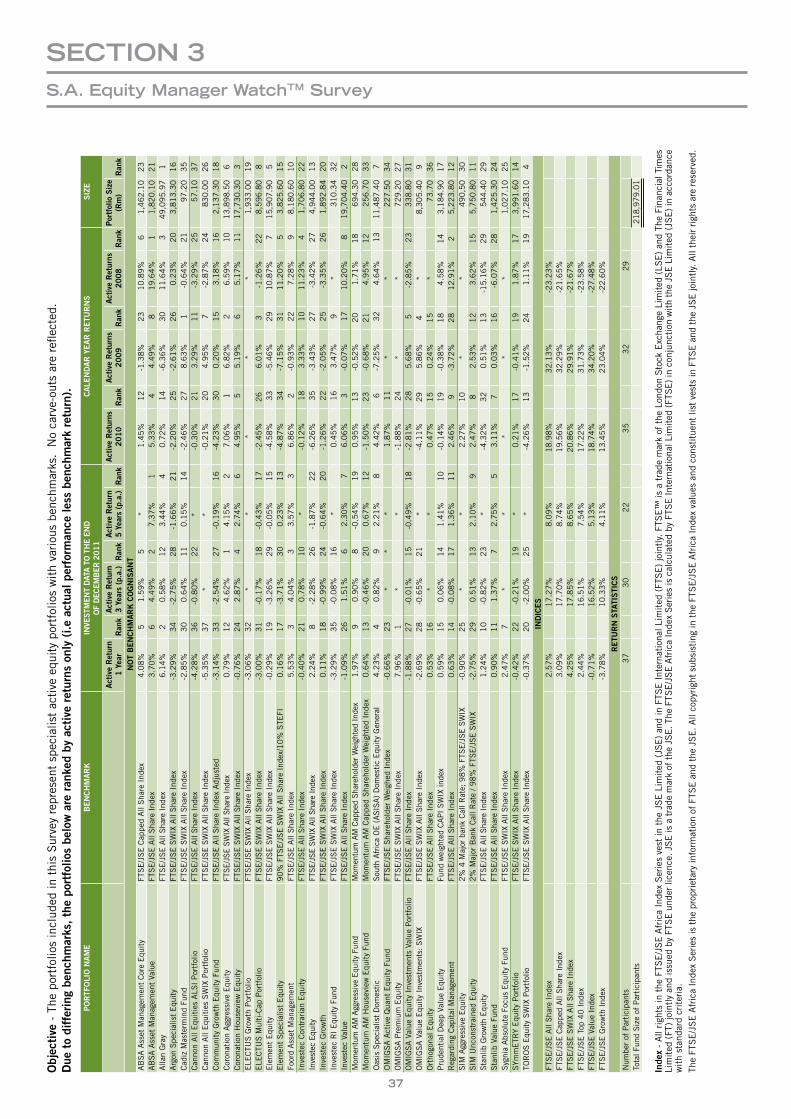
37
Objec
tive
- T
he p
ortf
olio
s in
clud
ed in
thi
s S
urve
y re
pres
ent
spec
ialis
t ac
tive
equ
ity
port
folio
s w
ith
vari
ous
benc
hmar
ks. N
o ca
rve-
outs
are
refl
ecte
d.Due
todifferingbe
nchm
arks
,th
epo
rtfolio
sbe
lowareran
kedby
activeretu
rnson
ly(i.e
actua
lperform
ance
less
ben
chmarkretu
rn).
PORTF
OLI
ON
AME
BENCHMARK
INVE
STMEN
TDAT
ATO
THEEN
D
OFDEC
EMBER
201
1CALE
NDARYEARR
ETU
RNS
SIZ
E
ActiveRetur
n1Yea
rRan
kActiveRetur
n3Yea
rs(p.a.)
Ran
kActiveRetur
n5Yea
rs(p.a.)
Ran
kActiveRetur
ns
2010
Ran
kActiveRetur
ns
2009
Ran
kActiveRetur
ns
2008
Ran
kPortfolioS
ize
(Rm)
Ran
kNOTBENCHMARKC
OGNIS
ANT
AB
SA
Ass
et M
anag
emen
t C
ore
Equ
ity
FTS
E/J
SE
Cap
ped
All
Sha
re I
ndex
4.0
8%
51
.59
%5
*1
.45
% 1
2
-1.3
8%
23
1
0.8
9%
6
1,4
62
.10
2
3A
BS
A A
sset
Man
agem
ent
Valu
eFT
SE
/JS
E A
ll S
hare
Ind
ex3
.70
%6
4.4
9%
27
.37
%1
5.3
3%
4
4.4
9%
8
19
.64
% 1
1
,82
0.1
0
21
Alla
n G
ray
FTS
E/J
SE
All
Sha
re I
ndex
6.1
4%
20
.58
%1
23
.44
%4
0.7
2%
14
-6
.36
% 3
0
11
.64
% 3
4
9,0
95
.97
1
Arg
on S
peci
alis
t E
quit
yFT
SE
/JS
E S
WIX
All
Sha
re I
ndex
-3.2
9%
34
-2.7
5%
28
-1.6
6%
21
-2.2
0%
25
-2
.61
% 2
6
0.2
3%
20
3
,81
3.3
0
16
Cad
iz M
aste
rmin
d Fu
ndFT
SE
/JS
E S
WIX
All
Sha
re I
ndex
-2.8
5%
30
0.6
4%
11
0.1
5%
14
-2.4
6%
27
8
.63
% 1
-0
.64
% 2
1
97
.20
3
5C
anno
n A
ll E
quit
ies
ALS
I P
ortf
olio
FTS
E/J
SE
All
Sha
re I
ndex
-4.2
8%
36
-0.8
0%
22
*-0
.30
% 2
1
3.2
9%
11
-3
.29
% 2
5
57
.10
3
7C
anno
n A
ll E
quit
ies
SW
IX P
ortf
olio
FTS
E/J
SE
SW
IX A
ll S
hare
Ind
ex-5
.35
%3
7*
*-0
.21
% 2
0
4.9
5%
7
-2.8
7%
24
8
30
.00
2
6C
omm
unit
y G
row
th E
quit
y Fu
ndFT
SE
/JS
E A
ll S
hare
Ind
ex A
djus
ted
-3.1
4%
33
-2.5
4%
27
-0.1
9%
16
-4.2
3%
30
0
.20
% 1
5
3.1
8%
16
2
,13
7.3
0
18
Cor
onat
ion
Agg
ress
ive
Equ
ity
FTSE
/JSE
SW
IX A
ll Sh
are
Inde
x0
.79
%1
24
.62
%1
4.1
5%
27
.06
% 1
6
.82
% 2
6
.59
% 1
0
13
,89
8.5
0
6C
oron
atio
n H
ouse
view
Equ
ity
FTS
E/J
SE
SW
IX A
ll S
hare
Ind
ex-0
.76
%2
42
.87
%4
2.7
4%
64
.95
% 5
5
.19
% 6
5
.17
% 1
1
17
,73
0.3
0
3E
LEC
TUS
Gro
wth
Por
tfol
ioFT
SE/J
SE S
WIX
All
Sha
re I
ndex
-3.0
6%
32
**
*
*
*
1,9
33
.00
1
9E
LEC
TUS
Mul
ti-C
ap P
ortf
olio
FT
SE
/JS
E S
WIX
All
Sha
re I
ndex
-3.0
0%
31
-0.1
7%
18
-0.4
3%
17
-2.4
5%
26
6.0
1%
3-1
.26
%2
2 8
,59
6.8
0
8E
lem
ent
Equ
ity
FTS
E/J
SE
SW
IX A
ll S
hare
Ind
ex-0
.29
%1
9-3
.26
%2
9-0
.05
%1
5-4
.58
% 3
3
-5.4
6%
29
1
0.8
7%
7
15
,90
7.9
0
5E
lem
ent
Spe
cial
ist
Equ
ity
90
% F
TSE
/JS
E S
WIX
All
Sha
re I
ndex
/10
% S
TEFI
0.1
6%
17
-3.7
1%
30
0.2
3%
13
-4.8
7%
34
-7
.15
% 3
1
11
.20
% 5
3
,82
5.6
0
15
Foor
d A
sset
Man
agem
ent
FTS
E/J
SE
All
Sha
re I
ndex
5.5
3%
34
.04
%3
3.5
7%
36
.86
% 2
-0
.93
% 2
2
7.2
8%
9
8,1
80
.60
1
0In
vest
ec C
ontr
aria
n E
quit
yFT
SE
/JS
E A
ll S
hare
Ind
ex-0
.40
%2
10
.78
%1
0*
-0.1
2%
18
3
.33
% 1
0
11
.23
% 4
1
,70
6.8
0
22
Inve
stec
Equ
ityFT
SE/J
SE S
WIX
All
Shar
e In
dex
2.2
4%
8-2
.28
%2
6-1
.87
%2
2-6
.26
% 3
5
-3.4
3%
27
-3
.42
% 2
7
4,9
44
.00
1
3In
vest
ec G
row
thFT
SE
/JS
E S
WIX
All
Sha
re I
ndex
0.1
1%
18
-0.9
9%
24
-0.6
4%
20
-1.2
6%
22
-2
.05
% 2
5
-3.3
5%
26
1
,89
2.8
4
20
Inve
stec
RI
Equ
ity
Fund
FTS
E/J
SE
SW
IX A
ll S
hare
Ind
ex-3
.29
%3
5-0
.08
%1
6*
0.4
5%
16
3
.47
% 9
*
3
10
.34
3
2In
vest
ec V
alue
FTS
E/J
SE
All
Sha
re I
ndex
-1.0
9%
26
1.5
1%
62
.30
%7
6.0
6%
3
-0.0
7%
17
1
0.2
0%
8
19
,70
4.4
0
2M
omen
tum
AM
Agg
ress
ive
Equ
ity F
und
Mom
entu
m A
M C
appe
d Sha
reho
lder
Wei
ghte
d In
dex
1.9
7%
90
.90
%8
-0.5
4%
19
0.9
5%
13
-0.5
2%
20
1.7
1%
18
69
4.3
0
28
Mom
entu
m A
M H
ouse
view
Equ
ity
Fund
Mom
entu
m A
M C
appe
d S
hare
hold
er W
eigh
ted
Inde
x0
.64
%1
3-0
.46
%2
00
.67
%1
2-1
.50
%2
3-0
.68
%2
14
.95
%1
2 2
56
.70
3
3O
asis
Spe
cial
ist
Dom
esti
cS
outh
Afr
ica
OE
(A
SIS
A)
Dom
esti
c E
quit
y G
ener
al4
.23
%4
0.8
2%
92
.21
%8
4.4
2%
6
-7.2
5%
32
4
.64
% 1
3
11
,48
7.4
0
7O
MIG
SA
Act
ive
Qua
nt E
quit
y Fu
ndFT
SE
/JS
E S
hare
hold
er W
eigh
ed I
ndex
-0.6
6%
23
**
*1
.87
% 1
1
*
*
22
7.5
0
34
OM
IGS
A P
rem
ium
Equ
ity
FTS
E/J
SE
SW
IX A
ll S
hare
Ind
ex7
.96
%1
**
-1.8
8%
24
*
* 7
29
.20
2
7O
MIG
SA
Val
ue E
quit
y In
vest
men
ts V
alue
Por
tfol
ioFT
SE
/JS
E A
ll S
hare
Ind
ex-1
.88
%2
7-0
.01
%1
5-0
.49
%1
8-2
.81
% 2
8
5.6
8%
5
-2.8
5%
23
3
38
.80
3
1O
MIG
SA
Val
ue E
quit
y In
vest
men
ts:
SW
IXFT
SE
/JS
E S
WIX
All
Sha
re I
ndex
-2.6
9%
28
-0.6
5%
21
*-4
.11
%2
95
.86
%4
*
8,3
05
.40
9
Ort
hogo
nal E
quit
yFT
SE
/JS
E A
ll S
hare
Ind
ex0
.53
%1
6*
*0
.47
%1
50
.24
%1
5*
7
3.7
0
36
Pru
dent
ial D
eep
Valu
e E
quit
yFu
nd w
eigh
ted
CA
PI
SW
IX in
dex
0.5
9%
15
0.0
6%
14
1.4
1%
10
-0.1
4%
19
-0.3
8%
18
4.5
8%
14
3,1
84
.90
1
7R
egar
ding
Cap
ital
Man
agem
ent
FTS
E/J
SE
All
Sha
re I
ndex
0.6
3%
14
-0.0
8%
17
1.3
6%
11
2.4
6%
9-3
.72
%2
81
2.9
1%
2 5
,22
3.8
0
12
SIM
Agg
ress
ive
Equ
ity
2%
4 M
ajor
ban
k C
all R
ate;
98
% F
TSE
/JS
E S
WIX
-0.9
0%
25
**
2.2
7%
10
*
*
49
0,5
0
30
SIM
Unc
onst
rain
ed E
quit
y2
% M
ajor
Ban
k C
all R
ate
/ 98
% F
TSE
/JS
E S
WIX
-2
.75
%2
90
.51
%1
32
.10
%9
2.4
7%
82
.53
%1
23
.62
%1
5 5
,75
0.8
0
11
Sta
nlib
Gro
wth
Equ
ity
FTS
E/J
SE
All
Sha
re I
ndex
1.2
4%
10
-0.8
2%
23
*-4
.32
%3
20
.51
%1
3-1
5.1
6%
29
54
4.4
0
29
Sta
nlib
Val
ue F
und
FTS
E/J
SE
All
Sha
re I
ndex
0.9
0%
11
1.3
7%
72
.75
%5
3.1
1%
70
.03
%1
6-6
.07
%2
8 1
,42
5.3
0
24
Syg
nia
Abs
olut
e Fo
cus
Equ
ity
Fund
FTS
E/J
SE
SW
IX A
ll S
hare
Ind
ex2
.47
%7
**
**
* 1
,02
7.1
0
25
SYm
mE
TRY
Equ
ity
Por
tfol
ioFT
SE
/JS
E S
WIX
All
Sha
re I
ndex
-0.4
2%
22
-0.2
1%
19
*0
.21
%1
7-0
.41
%1
91
.87
%1
7 3
,99
1.6
0
14
TOR
OS
Equ
ity
SW
IX P
ortf
olio
FTS
E/J
SE
SW
IX A
ll S
hare
Ind
ex-0
.37
%2
0-2
.00
%2
5*
-4.2
6%
13
-1.5
2%
24
1.1
1%
19
17
,28
3.1
0
4
INDIC
ES
FTS
E/J
SE
All
Sha
re I
ndex
2.5
7%
17
.27
%8
.09
%1
8.9
8%
32
.13
%-2
3.2
3%
FTS
E/J
SE
Cap
ped
All
Sha
re I
ndex
3.0
9%
17
.70
%8
.74
%1
9.5
6%
32
.29
%-2
1.6
5%
FTS
E/J
SE
SW
IX A
ll S
hare
Ind
ex4
.25
%1
7.8
5%
8.6
5%
20
.86
%2
9.9
1%
-21
.67
%FT
SE
/JS
E T
op 4
0 I
ndex
2.4
4%
16
.51
%7
.54
%1
7.2
2%
31
.73
%-2
3.5
8%
FTS
E/J
SE
Val
ue I
ndex
-0.7
1%
16
.52
%5
.13
%1
8.7
4%
34
.20
%-2
7.4
8%
FTS
E/J
SE
Gro
wth
Ind
ex-3
.78
%1
0.3
3%
4.1
1%
13
.45
%2
3.0
4%
-22
.60
%
RETU
RNS
TATI
STI
CS
Num
ber
of P
arti
cipa
nts
37
30
22
35
32
29
Tota
l Fun
d S
ize
of P
arti
cipa
nts
21
8,9
79
.01
Inde
x -
All
righ
ts in
the
FTS
E/J
SE
Afr
ica
Inde
x S
erie
s ve
st in
the
JS
E L
imit
ed (
JSE
) an
d in
FTS
E I
nter
nati
onal
Lim
ited
(FT
SE
) jo
intl
y. F
TSE
™ is
a t
rade
mar
k of
the
Lon
don
Sto
ck E
xcha
nge
Lim
ited
(LS
E)
and
The
Fina
ncia
l Tim
es
Lim
ited
(FT
) jo
intl
y an
d is
sued
by
FTS
E u
nder
lice
nce.
JS
E is
a tra
de m
ark
of the
JS
E. T
he F
TSE
/JS
E A
fric
a In
dex
Ser
ies
is c
alcu
late
d by
FTS
E Int
erna
tion
al L
imit
ed (FT
SE
) in
con
junc
tion
wit
h th
e JS
E L
imit
ed (JS
E) in
acc
orda
nce
wit
h st
anda
rd c
rite
ria.
The
FTS
E/J
SE
Afr
ica
Inde
x S
erie
s is
the
pro
prie
tary
info
rmat
ion
of F
TSE
and
the
JS
E. A
ll co
pyri
ght
subs
isti
ng in
the
FTS
E/J
SE
Afr
ica
Inde
x va
lues
and
con
stit
uent
list
ves
ts in
FTS
E a
nd t
he J
SE
join
tly.
All
thei
r ri
ghts
are
res
erve
d.
SectIOn 3S.a. equity Manager WatchtM Survey
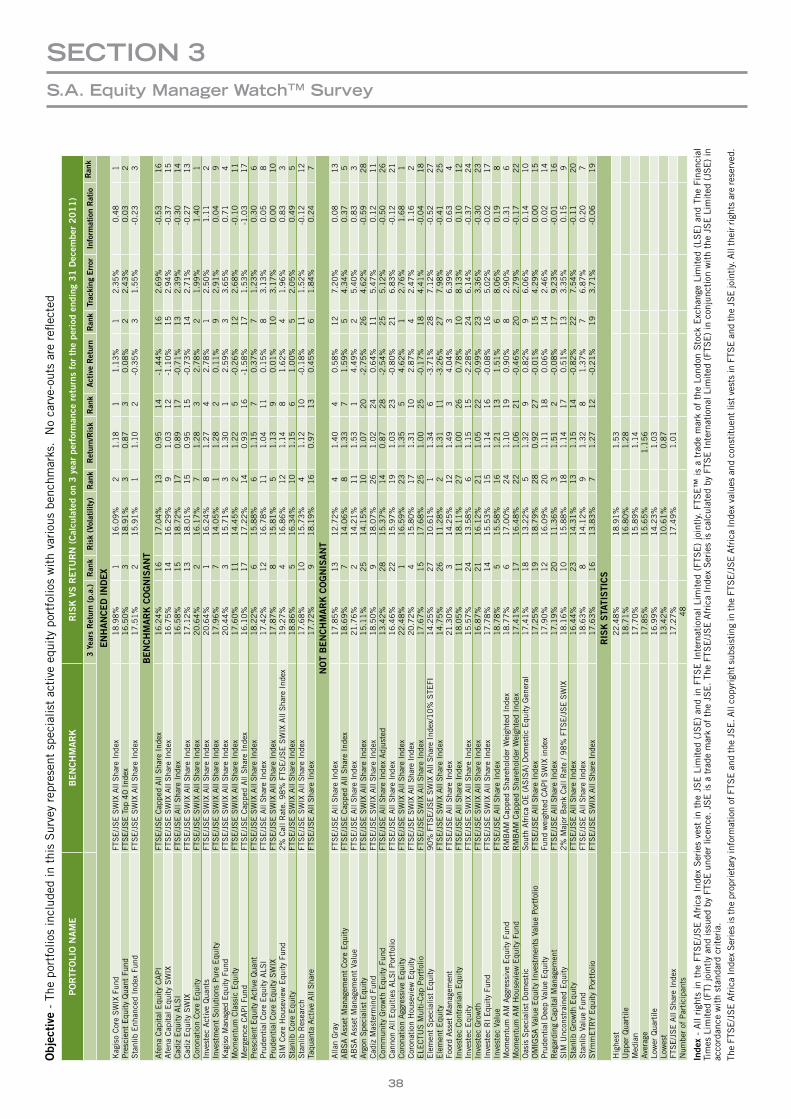
38
Objec
tive
- T
he p
ortf
olio
s in
clud
ed in
thi
s S
urve
y re
pres
ent
spec
ialis
t ac
tive
equ
ity
port
folio
s w
ith
vari
ous
benc
hmar
ks. N
o ca
rve-
outs
are
refl
ecte
d
PORTF
OLI
ON
AME
BENCHMARK
RIS
KVSR
ETU
RN(Calcu
latedon
3yea
rpe
rforman
ceretur
nsforthe
perioden
ding
31D
ecem
ber2011)
3Yea
rsR
etur
n(p
.a.)
Ran
kRisk(Volatility)
Ran
kRetur
n/Risk
Ran
kActiveRetur
nRan
kTrac
king
Error
Inform
ationRatio
Ran
k
ENHANCEDINDEX
Kag
iso
Cor
e S
WIX
Fun
d FT
SE
/JS
E S
WIX
All
Sha
re I
ndex
18
.98
% 1
1
6.0
9%
2
1.1
8 1
1
.13
% 1
2
.35
%0
.48
1
Pre
scie
nt E
quit
y Q
uant
Fun
d FT
SE
/JS
E T
op 4
0 I
ndex
16
.50
% 3
1
8.9
1%
3
0.8
7 3
0
.08
% 2
2
.43
%0
.03
2
Sta
nlib
Enh
ance
d In
dex
Fund
FTS
E/J
SE
SW
IX A
ll S
hare
Ind
ex1
7.5
1%
2
15
.91
% 1
1
.10
2
-0.3
5%
3
1.5
5%
-0.2
3 3
BENCHMARKC
OGNIS
ANT
Afe
na C
apit
al E
quit
y C
AP
IFT
SE
/JS
E C
appe
d A
ll S
hare
Ind
ex1
6.2
4%
16
1
7.0
4%
13
0
.95
14
-1
.44
% 1
6
2.6
9%
-0.5
3 1
6
Afe
na C
apit
al E
quit
y S
WIX
FTS
E/J
SE
SW
IX A
ll S
hare
Ind
ex1
6.7
5%
14
1
6.2
9%
9
1.0
3 1
2
-1.1
0%
15
2
.94
%-0
.37
15
C
adiz
Equ
ity
ALS
IFT
SE
/JS
E A
ll S
hare
Ind
ex1
6.5
8%
15
1
8.7
2%
17
0
.89
17
-0
.71
% 1
3
2.3
9%
-0.3
0 1
4
Cad
iz E
quit
y S
WIX
FTS
E/J
SE
SW
IX A
ll S
hare
Ind
ex1
7.1
2%
13
1
8.0
1%
15
0
.95
15
-0
.73
% 1
4
2.7
1%
-0.2
7 1
3
Cor
onat
ion
Cor
e E
quit
y FT
SE
/JS
E S
WIX
All
Sha
re I
ndex
20
.64
% 2
1
6.1
7%
7
1.2
8 3
2
.78
% 2
1
.99
%1
.40
1
Inve
stec
Act
ive
Qua
nts
FTS
E/J
SE
SW
IX A
ll S
hare
Ind
ex2
0.6
4%
1
16
.24
% 8
1
.27
4
2.7
8%
1
2.5
0%
1.1
1 2
In
vest
men
t S
olut
ions
Pur
e E
quit
yFT
SE
/JS
E S
WIX
All
Sha
re I
ndex
17
.96
% 7
1
4.0
5%
1
1.2
8 2
0
.11
% 9
2
.91
%0
.04
9
Kag
iso
Man
aged
Equ
ity F
und
FTS
E/J
SE
SW
IX A
ll S
hare
Ind
ex2
0.4
4%
3
15
.71
% 3
1
.30
1
2.5
9%
3
3.6
5%
0.7
1 4
M
omen
tum
Cla
ssic
Equ
ity
FTS
E/J
SE
SW
IX A
ll S
hare
Ind
ex1
7.6
0%
11
1
4.4
5%
2
1.2
2 5
-0
.26
% 1
2
2.6
8%
-0.1
0 1
1
Mer
genc
e C
AP
I Fu
ndFT
SE
/JS
E C
appe
d A
ll S
hare
Ind
ex1
6.1
0%
17
1
7.2
2%
14
0
.93
16
-1
.58
% 1
7
1.5
3%
-1.0
3 1
7
Pre
scie
nt E
quity
Act
ive
Qua
ntFT
SE
/JS
E S
WIX
All
Sha
re I
ndex
18
.22
% 6
1
5.8
8%
6
1.1
5 7
0
.37
% 7
1
.23
%0
.30
6
Pru
dent
ial C
ore
Equ
ity
ALS
IFT
SE
/JS
E A
ll S
hare
Ind
ex1
7.4
2%
12
1
6.7
8%
11
1
.04
11
0
.15
% 8
3
.13
%0
.05
8
Pru
dent
ial C
ore
Equ
ity
SW
IXFT
SE
/JS
E S
WIX
All
Sha
re I
ndex
17
.87
% 8
1
5.8
1%
5
1.1
3 9
0
.01
% 1
0
3.1
7%
0.0
0 1
0
SIM
Cor
e H
ouse
view
Equ
ity
Fund
2%
Cal
l Rat
e. 9
8%
FTS
E/J
SE
SW
IX A
ll S
hare
Ind
ex1
9.2
7%
4
16
.86
% 1
2
1.1
4 8
1
.62
% 4
1
.96
%0
.83
3
Sta
nlib
Cor
e E
quit
y FT
SE
/JS
E S
WIX
All
Sha
re I
ndex
18
.86
% 5
1
6.3
4%
10
1
.15
6
1.0
0%
5
2.0
5%
0.4
9 5
S
tanl
ib R
esea
rch
FTS
E/J
SE
SW
IX A
ll S
hare
Ind
ex1
7.6
8%
10
1
5.7
3%
4
1.1
2 1
0
-0.1
8%
11
1
.52
%-0
.12
12
Ta
quan
ta A
ctiv
e A
ll S
hare
FTS
E/J
SE
All
Sha
re I
ndex
17
.72
% 9
1
8.1
9%
16
0
.97
13
0
.45
% 6
1
.84
%0
.24
7
NOTBENCHMARKC
OGNIS
ANT
Alla
n G
ray
FTS
E/J
SE
All
Sha
re I
ndex
17
.85
% 1
3
12
.72
% 4
1
.40
4
0.5
8%
12
7
.20
%0
.08
13
A
BS
A A
sset
Man
agem
ent
Cor
e E
quit
yFT
SE
/JS
E C
appe
d A
ll S
hare
Ind
ex1
8.6
9%
7
14
.06
% 8
1
.33
7
1.5
9%
5
4.3
4%
0.3
7 5
A
BS
A A
sset
Man
agem
ent
Valu
eFT
SE
/JS
E A
ll S
hare
Ind
ex2
1.7
6%
2
14
.21
% 1
1
1.5
3 1
4
.49
% 2
5
.40
%0
.83
3
Arg
on S
peci
alis
t E
quit
yFT
SE
/JS
E S
WIX
All
Sha
re I
ndex
15
.11
% 2
5
14
.15
% 1
0
1.0
7 2
0
-2.7
5%
26
4
.62
%-0
.59
28
C
adiz
Mas
term
ind
Fund
FTS
E/J
SE
SW
IX A
ll S
hare
Ind
ex1
8.5
0%
9
18
.07
% 2
6
1.0
2 2
4
0.6
4%
11
5
.47
%0
.12
11
C
omm
unit
y G
row
th E
quit
y Fu
ndFT
SE
/JS
E A
ll S
hare
Ind
ex A
djus
ted
13
.42
% 2
8
15
.37
% 1
4
0.8
7 2
8
-2.5
4%
25
5
.12
%-0
.50
26
C
anno
n A
ll E
quit
ies
ALS
I P
ortf
olio
FTS
E/J
SE
All
Sha
re I
ndex
16
.46
% 2
2
15
.97
% 1
9
1.0
3 2
3
-0.8
0%
21
6
.83
%-0
.12
21
C
oron
atio
n A
ggre
ssiv
e E
quit
yFT
SE
/JS
E S
WIX
All
Sha
re I
ndex
22
.48
% 1
1
6.5
9%
23
1
.35
5
4.6
2%
1
2.7
6%
1.6
8 1
C
oron
atio
n H
ouse
view
Equ
ity
FTSE/J
SE S
WIX
All
Sha
re I
ndex
20
.72
% 4
1
5.8
0%
17
1
.31
10
2
.87
% 4
2
.47
%1
.16
2
ELE
CTU
S M
ulti
-Cap
Por
tfol
io
FTS
E/J
SE
SW
IX A
ll S
hare
Ind
ex1
7.6
7%
15
1
7.6
8%
25
1
.00
25
-0
.17
% 1
8
4.4
1%
-0.0
4 1
8
Ele
men
t S
peci
alis
t E
quit
y9
0%
FTS
E/J
SE
SW
IX A
ll S
hare
Ind
ex/1
0%
STE
FI1
4.2
5%
27
1
0.6
1%
1
1.3
4 6
-3
.71
% 2
8
7.1
2%
-0.5
2 2
7
Ele
men
t E
quit
yFT
SE
/JS
E S
WIX
All
Sha
re I
ndex
14
.75
% 2
6
11
.28
% 2
1
.31
11
-3
.26
% 2
7
7.9
8%
-0.4
1 2
5
Foor
d A
sset
Man
agem
ent
FTS
E/J
SE
All
Sha
re I
ndex
21
.30
% 3
1
4.2
5%
12
1
.49
3
4.0
4%
3
6.3
9%
0.6
3 4
In
vest
ec C
ontr
aria
n E
quit
yFT
SE
/JS
E A
ll S
hare
Ind
ex1
8.0
5%
11
1
8.1
1%
27
1
.00
26
0
.78
% 1
0
8.1
3%
0.1
0 1
2
Inve
stec
Equ
ity
FTS
E/J
SE
SW
IX A
ll S
hare
Ind
ex1
5.5
7%
24
1
3.5
8%
6
1.1
5 1
5
-2.2
8%
24
6
.14
%-0
.37
24
In
vest
ec G
row
thFT
SE
/JS
E S
WIX
All
Sha
re I
ndex
16
.87
% 2
1
16
.12
% 2
1
1.0
5 2
2
-0.9
9%
23
3
.36
%-0
.30
23
In
vest
ec R
I E
quit
y Fu
ndFT
SE
/JS
E S
WIX
All
Sha
re I
ndex
17
.78
% 1
4
15
.53
% 1
5
1.1
4 1
6
-0.0
8%
16
5
.02
%-0
.02
17
In
vest
ec V
alue
FTS
E/J
SE
All
Sha
re I
ndex
18
.78
% 5
1
5.5
8%
16
1
.21
13
1
.51
% 6
8
.06
%0
.19
8
Mom
entu
m A
M A
ggre
ssiv
e E
quit
y Fu
ndR
MB
AM
Cap
ped
Sha
reho
lder
Wei
ghte
d In
dex
18
.77
% 6
1
7.0
0%
24
1
.10
19
0
.90
% 8
2
.90
%0
.31
6
Mom
entu
m A
M H
ouse
view
Equ
ity
Fund
RM
BA
M C
appe
d S
hare
hold
er W
eigh
ted
Inde
x1
7.4
1%
17
1
6.4
8%
22
1
.06
21
-0
.46
% 2
0
2.7
9%
-0.1
7 2
2
Oas
is S
peci
alis
t D
omes
tic
Sou
th A
fric
a O
E (
AS
ISA
) D
omes
tic
Equ
ity
Gen
eral
17
.41
% 1
8
13
.22
% 5
1
.32
9
0.8
2%
9
6.0
6%
0.1
4 1
0
OM
IGS
A V
alue
Equ
ity
Inve
stm
ents
Val
ue P
ortf
olio
FTS
E/J
SE
All
Sha
re I
ndex
17
.25
% 1
9
18
.79
% 2
8
0.9
2 2
7
-0.0
1%
15
4
.29
%0
.00
15
P
rude
ntia
l Dee
p Va
lue
Equ
ity
Fund
wei
ghte
d C
AP
I S
WIX
inde
x1
7.9
0%
12
1
6.0
9%
20
1
.11
18
0
.06
% 1
4
2.4
6%
0.0
2 1
4
Reg
ardi
ng C
apit
al M
anag
emen
tFT
SE
/JS
E A
ll S
hare
Ind
ex1
7.1
9%
20
1
1.3
6%
3
1.5
1 2
-0
.08
% 1
7
9.2
3%
-0.0
1 1
6
SIM
Unc
onst
rain
ed E
quit
y2
% M
ajor
Ban
k C
all R
ate
/ 98
% F
TSE
/JS
E S
WIX
1
8.1
6%
10
1
5.8
8%
18
1
.14
17
0
.51
% 1
3
3.3
5%
0.1
5 9
S
tanl
ib G
row
th E
quit
yFT
SE
/JS
E A
ll S
hare
Ind
ex1
6.4
4%
23
1
4.3
1%
13
1
.15
14
-0
.82
% 2
2
7.5
4%
-0.1
1 2
0
Sta
nlib
Val
ue F
und
FTS
E/J
SE
All
Sha
re I
ndex
18
.63
% 8
1
4.1
2%
9
1.3
2 8
1
.37
% 7
6
.87
%0
.20
7
SYm
mE
TRY
Equ
ity
Por
tfol
ioFT
SE
/JS
E S
WIX
All
Sha
re I
ndex
17
.63
% 1
6
13
.83
% 7
1
.27
12
-0
.21
% 1
9
3.7
1%
-0.0
6 1
9
RIS
KS
TATI
STI
CS
Hig
hest
22
.48
%1
8.9
1%
1.5
3U
pper
Qua
rtile
18
.71
%1
6.8
0%
1.2
8M
edia
n1
7.7
0%
15
.89
%1
.14
Ave
rage
17
.85
%1
5.6
5%
1.1
56
Low
er Q
uart
ile1
6.9
9%
14
.23
%1
.03
Low
est
13
.42
%1
0.6
1%
0.8
7FT
SE
/JS
E A
ll S
hare
Ind
ex1
7.2
7%
17
.49
%1
.01
Num
ber
of P
arti
cipa
nts
48
Inde
x -
All
righ
ts i
n th
e FT
SE
/JS
E A
fric
a In
dex
Ser
ies
vest
in
the
JSE
Lim
ited
(JS
E)
and
in F
TSE
Int
erna
tion
al L
imit
ed (
FTS
E)
join
tly.
FTS
E™
is
a tr
ade
mar
k of
the
Lon
don
Sto
ck E
xcha
nge
Lim
ited
(LS
E)
and
The
Fina
ncia
l Ti
mes
Lim
ited
(FT
) jo
intl
y an
d is
sued
by
FTS
E u
nder
lice
nce.
JS
E is
a t
rade
mar
k of
the
JS
E.
The
FTS
E/J
SE
Afr
ica
Inde
x S
erie
s is
cal
cula
ted
by F
TSE
Int
erna
tion
al L
imit
ed (
FTS
E)
in c
onju
ncti
on w
ith
the
JSE
Lim
ited
(JS
E)
in
acco
rdan
ce w
ith
stan
dard
cri
teri
a.Th
e FT
SE
/JS
E A
fric
a In
dex
Ser
ies
is th
e pr
opri
etar
y in
form
atio
n of
FTS
E a
nd th
e JS
E. A
ll co
pyri
ght s
ubsi
stin
g in
the
FTS
E/J
SE
Afr
ica
Inde
x va
lues
and
con
stit
uent
list
ves
ts in
FTS
E a
nd th
e JS
E jo
intl
y. A
ll th
eir r
ight
s ar
e re
serv
ed.
SectIOn 3S.a. equity Manager WatchtM Survey
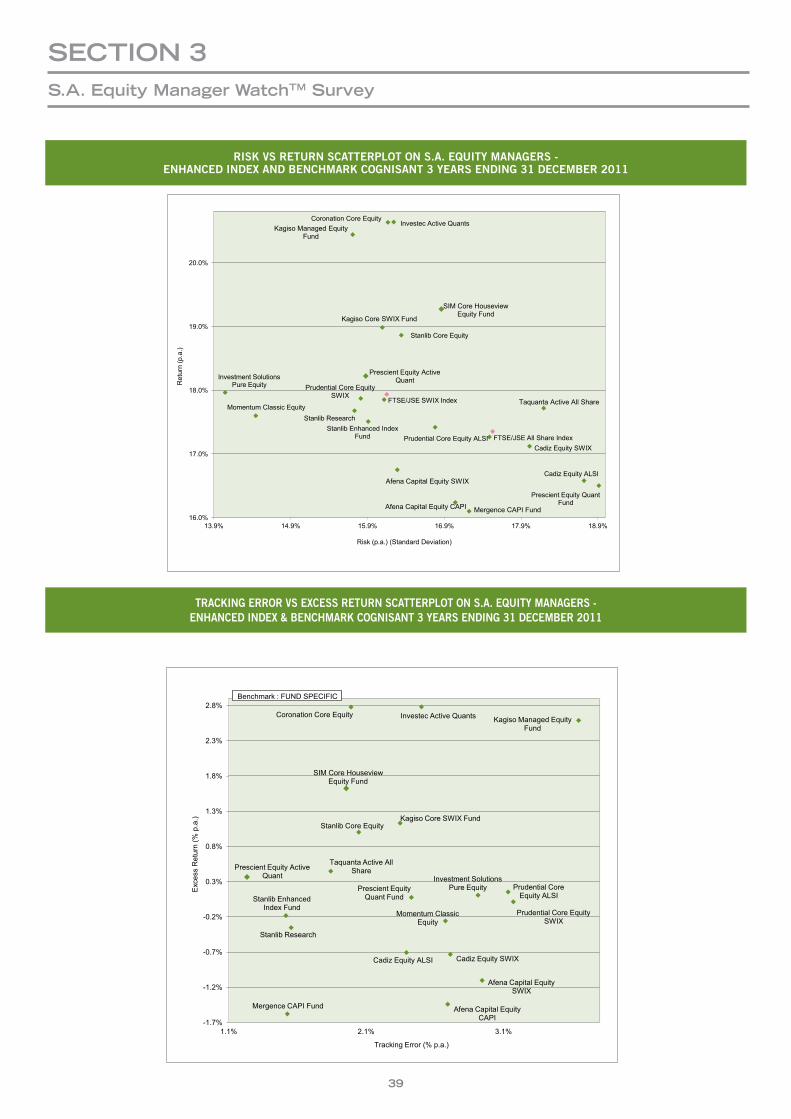
39
SectIOn 3S.a. equity Manager WatchtM Survey
RISKVSRETURNSCATTERPLOTONS.A.EQUITYMANAGERS-ENHANCEDINDEXANDBENCHMARKCOGNISANT3YEARSENDING31DECEMBER2011
TRACKINGERRORVSEXCESSRETURNSCATTERPLOTONS.A.EQUITYMANAGERS-ENHANCEDINDEX&BENCHMARKCOGNISANT3YEARSENDING31DECEMBER2011
FTSE/JSE All Share Index Prudential Core Equity ALSI
Momentum Classic Equity
Investment Solutions Pure Equity
Stanlib Research
Prescient Equity Quant Fund
Stanlib Enhanced Index Fund
Cadiz Equity SWIX
Stanlib Core Equity
Cadiz Equity ALSI
FTSE/JSE SWIX Index
Investec Active Quants Coronation Core Equity
Kagiso Core SWIX Fund
Afena Capital Equity SWIX
Kagiso Managed Equity Fund
Prescient Equity Active Quant
Afena Capital Equity CAPI
Prudential Core Equity SWIX
Mergence CAPI Fund
Taquanta Active All Share
SIM Core Houseview Equity Fund
16.0%
17.0%
18.0%
19.0%
20.0%
13.9% 14.9% 15.9% 16.9% 17.9% 18.9%
Ret
urn
(p.a
.)
Risk (p.a.) (Standard Deviation)
Risk vs Return Scatterplot on SA Equity Managers - Enhanced Index and Benchmark Cognisant
3 Years ended 31 December 2011
Prescient Equity Quant Fund
Cadiz Equity ALSI
Investment Solutions Pure Equity
Momentum Classic Equity
Prudential Core Equity ALSI
Stanlib Research
Stanlib Enhanced Index Fund
Cadiz Equity SWIX
Stanlib Core Equity
Investec Active Quants Coronation Core Equity
Kagiso Core SWIX Fund
Afena Capital Equity SWIX
Kagiso Managed Equity Fund
Prescient Equity Active Quant
Prudential Core Equity SWIX
Afena Capital Equity CAPI
Mergence CAPI Fund
Taquanta Active All Share
SIM Core Houseview Equity Fund
-1.7%
-1.2%
-0.7%
-0.2%
0.3%
0.8%
1.3%
1.8%
2.3%
2.8%
1.1% 2.1% 3.1%
Exc
ess
Ret
urn
(% p
.a.)
Tracking Error (% p.a.)
Excess Return vs Tracking Error Scatterplot - SA Equity Managers - Enhanced Index and Benchmark Cognisant 3 Years ended 31 December 2011
Benchmark : FUND SPECIFIC
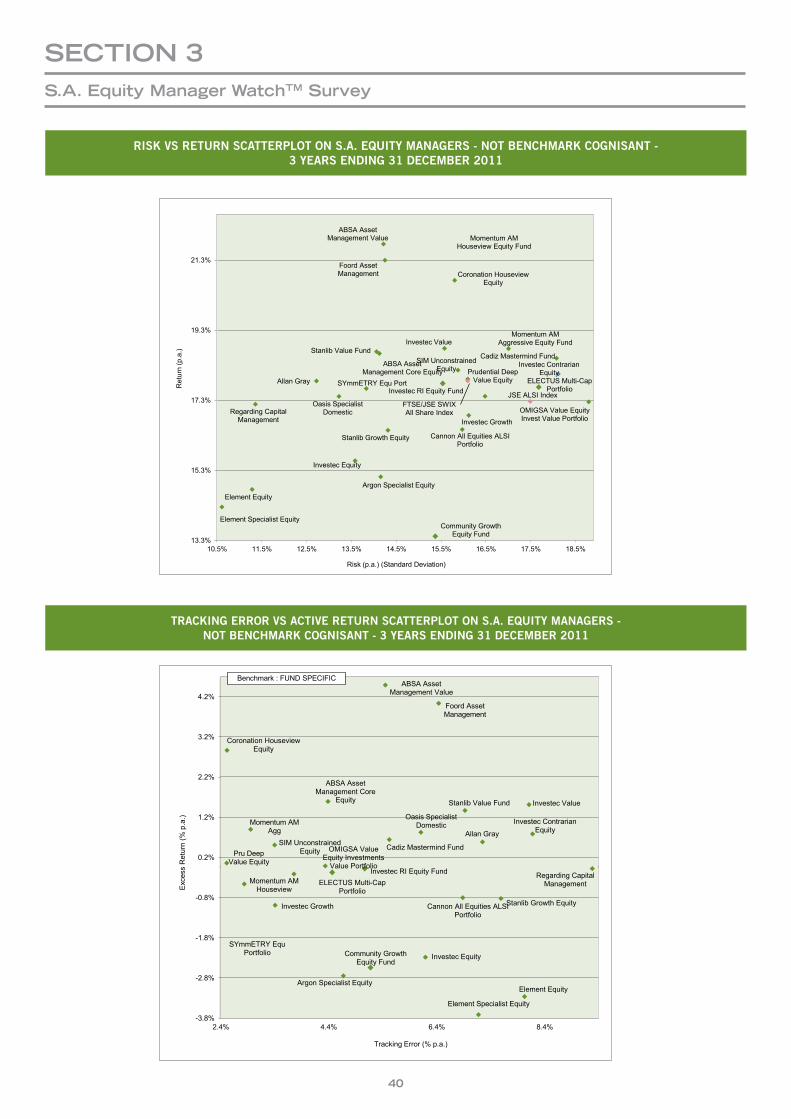
40
SectIOn 3S.a. equity Manager WatchtM Survey
RISKVSRETURNSCATTERPLOTONS.A.EQUITYMANAGERS-NOTBENCHMARKCOGNISANT-3YEARSENDING31DECEMBER2011
TRACKINGERRORVSACTIVERETURNSCATTERPLOTONS.A.EQUITYMANAGERS-NOTBENCHMARKCOGNISANT-3YEARSENDING31DECEMBER2011
S.A. EQUITY MANAGER WATCH™ SURVEY
Risk vs Return Scatterplot on SA Equity Managers - Not Benchmark Cognisant -3 Years ended 31 December 2011
JSE ALSI Index
Prudential Deep Value Equity
Oasis Specialist Domestic
Investec Value
Foord Asset Management
Allan Gray
OMIGSA Value Equity Invest Value Portfolio
Momentum AM Aggressive Equity Fund
Coronation Houseview Equity
ABSA Asset Management Value
Element Equity
Stanlib Value Fund
Regarding Capital Management
Element Specialist Equity
FTSE/JSE SWIX All Share Index
Momentum AM Houseview Equity Fund
Investec Equity
Investec Growth
ABSA Asset Management Core Equity
SYmmETRY Equ Port
Argon Specialist Equity
Stanlib Growth Equity Cannon All Equities ALSI Portfolio
Investec Contrarian Equity
SIM Unconstrained Equity
Cadiz Mastermind Fund
Investec RI Equity Fund
Community Growth Equity Fund
ELECTUS Multi-Cap Portfolio
13.3%
15.3%
17.3%
19.3%
21.3%
10.5% 11.5% 12.5% 13.5% 14.5% 15.5% 16.5% 17.5% 18.5%
Ret
urn
(p.a
.)
Risk (p.a.) (Standard Deviation)
Allan Gray
Foord Asset Management
Investec Value
Oasis Specialist Domestic
OMIGSA Value Equity Investments
Value Portfolio
Pru Deep Value Equity
Momentum AM Agg
Coronation Houseview Equity
ABSA Asset Management Value
Element Equity
Stanlib Value Fund
Regarding Capital Management
Element Specialist Equity
Momentum AM Houseview
Investec Equity
Investec Growth
ABSA Asset Management Core
Equity
SYmmETRY Equ Portfolio
Argon Specialist Equity
Stanlib Growth Equity Cannon All Equities ALSI Portfolio
Investec Contrarian Equity
SIM Unconstrained Equity Cadiz Mastermind Fund
Investec RI Equity Fund
Community Growth Equity Fund
ELECTUS Multi-Cap Portfolio
-3.8%
-2.8%
-1.8%
-0.8%
0.2%
1.2%
2.2%
3.2%
4.2%
2.4% 4.4% 6.4% 8.4%
Exc
ess
Ret
urn
(% p
.a.)
Tracking Error (% p.a.)
Excess return vs Tracking error Scatterplot - SA Equity Managers - Not Benchmark Cognisant 3 Years ended 31 December 2011
Benchmark : FUND SPECIFIC
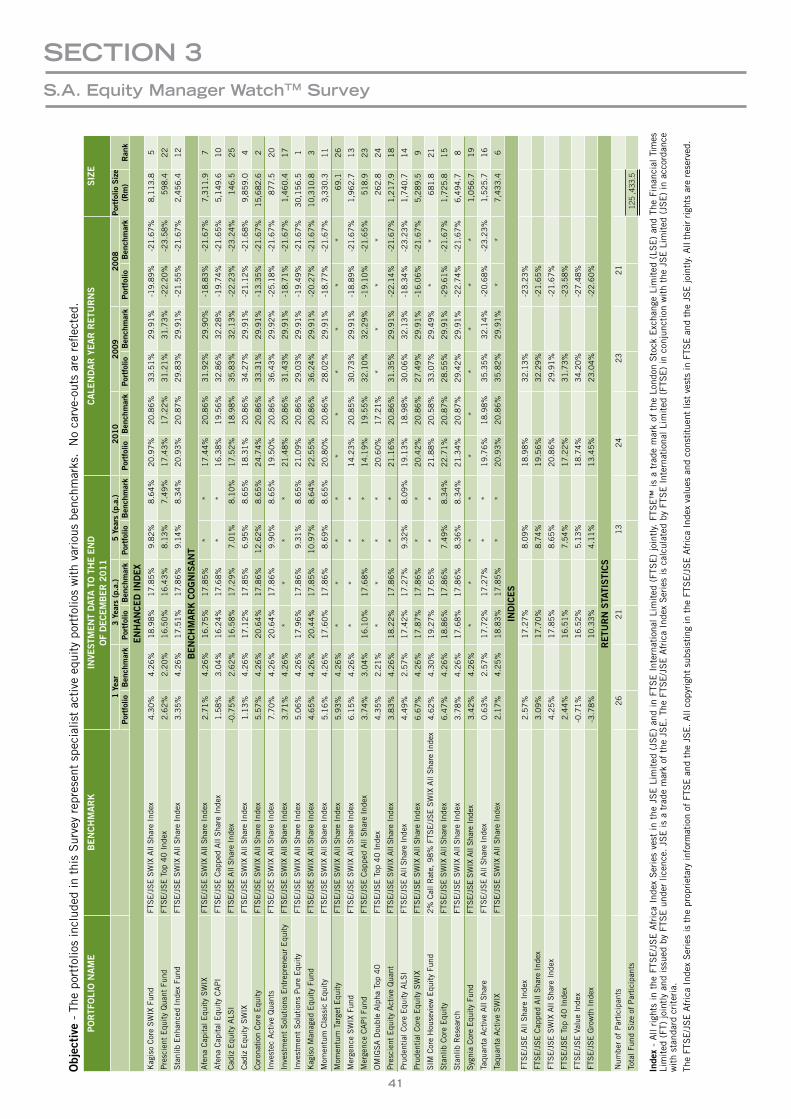
41
Objec
tive
- T
he p
ortf
olio
s in
clud
ed in
thi
s S
urve
y re
pres
ent
spec
ialis
t ac
tive
equ
ity
port
folio
s w
ith
vari
ous
benc
hmar
ks. N
o ca
rve-
outs
are
refl
ecte
d.PORTF
OLI
ON
AME
BENCHMARK
INVE
STMEN
TDAT
ATO
THEEN
D
OFDEC
EMBER
201
1CALE
NDARYEARR
ETU
RNS
SIZ
E
1Yea
r3Yea
rs(p.a.)
5Yea
rs(p.a.)
2010
2009
2008
PortfolioS
ize
(Rm)
Ran
kPortfolio
Ben
chmark
Portfolio
Ben
chmark
Portfolio
Ben
chmark
Portfolio
Ben
chmark
Portfolio
Ben
chmark
Portfolio
Ben
chmark
ENHANCEDINDEX
Kag
iso
Cor
e S
WIX
Fun
d FT
SE
/JS
E S
WIX
All
Sha
re I
ndex
4.3
0%
4.2
6%
18
.98
%1
7.8
5%
9.8
2%
8.6
4%
20
.97
%2
0.8
6%
33
.51
%2
9.9
1%
-19
.89
%-2
1.6
7%
8,1
13
.8
5
Pre
scie
nt E
quit
y Q
uant
Fun
d FT
SE
/JS
E T
op 4
0 I
ndex
2.6
2%
2.2
0%
16
.50
%1
6.4
3%
8.1
3%
7.4
9%
17
.43
%1
7.2
2%
31
.21
%3
1.7
3%
-22
.20
%-2
3.5
8%
59
8.4
2
2
Sta
nlib
Enh
ance
d In
dex
Fund
FTS
E/J
SE
SW
IX A
ll S
hare
Ind
ex3
.35
%4
.26
%1
7.5
1%
17
.86
%9
.14
%8
.34
%2
0.9
3%
20
.87
%2
9.8
3%
29
.91
%-2
1.5
5%
-21
.67
% 2
,45
6.4
1
2
BENCHMARKC
OGNIS
ANT
Afe
na C
apit
al E
quit
y S
WIX
FTS
E/J
SE
SW
IX A
ll S
hare
Ind
ex2
.71
%4
.26
%1
6.7
5%
17
.85
%*
*1
7.4
4%
20
.86
%3
1.9
2%
29
.90
%-1
8.8
3%
-21
.67
% 7
,31
1.9
7
Afe
na C
apit
al E
quit
y C
AP
IFT
SE
/JS
E C
appe
d A
ll S
hare
Ind
ex1
.58
%3
.04
%1
6.2
4%
17
.68
%*
*1
6.3
8%
19
.56
%3
2.8
6%
32
.28
%-1
9.7
4%
-21
.65
% 5
,14
9.6
1
0
Cad
iz E
quit
y A
LSI
FTS
E/J
SE
All
Sha
re I
ndex
-0.7
5%
2.6
2%
16
.58
%1
7.2
9%
7.0
1%
8.1
0%
17
.52
%1
8.9
8%
35
.83
%3
2.1
3%
-22
.23
%-2
3.2
4%
14
6.5
2
5
Cad
iz E
quit
y S
WIX
FTS
E/J
SE
SW
IX A
ll S
hare
Ind
ex1
.13
%4
.26
%1
7.1
2%
17
.85
%6
.95
%8
.65
%1
8.3
1%
20
.86
%3
4.2
7%
29
.91
%-2
1.1
2%
-21
.68
% 9
,85
9.0
4
Cor
onat
ion
Cor
e E
quit
y FT
SE
/JS
E S
WIX
All
Sha
re I
ndex
5.5
7%
4.2
6%
20
.64
%1
7.8
6%
12
.62
%8
.65
%2
4.7
4%
20
.86
%3
3.3
1%
29
.91
%-1
3.3
5%
-21
.67
% 1
5,6
82
.6
2
Inve
stec
Act
ive
Qua
nts
FTS
E/J
SE
SW
IX A
ll S
hare
Ind
ex7
.70
%4
.26
%2
0.6
4%
17
.86
%9
.90
%8
.65
%1
9.5
0%
20
.86
%3
6.4
3%
29
.92
%-2
5.1
8%
-21
.67
% 8
77
.5
20
Inve
stm
ent
Sol
utio
ns E
ntre
pren
eur
Equ
ity
FTS
E/J
SE
SW
IX A
ll S
hare
Ind
ex3
.71
%4
.26
%*
**
*2
1.4
8%
20
.86
%3
1.4
3%
29
.91
%-1
8.7
1%
-21
.67
% 1
,46
0.4
1
7
Inve
stm
ent
Sol
utio
ns P
ure
Equ
ity
FTS
E/J
SE
SW
IX A
ll S
hare
Ind
ex5
.06
%4
.26
%1
7.9
6%
17
.86
%9
.31
%8
.65
%2
1.0
9%
20
.86
%2
9.0
3%
29
.91
%-1
9.4
9%
-21
.67
% 3
0,1
56
.5
1
Kag
iso
Man
aged
Equ
ity
Fund
FTS
E/J
SE
SW
IX A
ll S
hare
Ind
ex4
.65
%4
.26
%2
0.4
4%
17
.85
%1
0.9
7%
8.6
4%
22
.55
%2
0.8
6%
36
.24
%2
9.9
1%
-20
.27
%-2
1.6
7%
10
,31
0.8
3
Mom
entu
m C
lass
ic E
quit
yFT
SE
/JS
E S
WIX
All
Sha
re I
ndex
5.1
6%
4.2
6%
17
.60
%1
7.8
6%
8.6
9%
8.6
5%
20
.80
%2
0.8
6%
28
.02
%2
9.9
1%
-18
.77
%-2
1.6
7%
3,3
30
.3
11
Mom
entu
m T
arge
t E
quit
yFT
SE
/JS
E S
WIX
All
Sha
re I
ndex
5.9
3%
4.2
6%
**
**
**
**
**
69
.1
26
Mer
genc
e S
WIX
Fun
dFT
SE
/JS
E S
WIX
All
Sha
re I
ndex
6.1
5%
4.2
6%
**
**
14
.23
%2
0.8
5%
30
.73
%2
9.9
1%
-18
.89
%-2
1.6
7%
1,9
62
.7
13
Mer
genc
e C
AP
I Fu
ndFT
SE
/JS
E C
appe
d A
ll S
hare
Ind
ex3
.74
%3
.04
%1
6.1
0%
17
.68
%*
*1
4.1
9%
19
.55
%3
2.1
0%
32
.29
%-1
9.1
0%
-21
.65
% 5
18
.9
23
OM
IGS
A D
oubl
e A
lpha
Top
40
FTS
E/J
SE
Top
40
Ind
ex4
.35
%2
.21
%*
**
*2
0.6
0%
17
.21
%*
**
* 2
62
.8
24
Pre
scie
nt E
quit
y A
ctiv
e Q
uant
FTS
E/J
SE
SW
IX A
ll S
hare
Ind
ex3
.83
%4
.26
%1
8.2
2%
17
.86
%*
*2
1.1
6%
20
.86
%3
1.3
5%
29
.91
%-2
2.1
4%
-21
.67
% 1
,21
7.9
1
8
Pru
dent
ial C
ore
Equ
ity
ALS
IFT
SE
/JS
E A
ll S
hare
Ind
ex4
.49
%2
.57
%1
7.4
2%
17
.27
%9
.32
%8
.09
%1
9.1
3%
18
.98
%3
0.0
6%
32
.13
%-1
8.3
4%
-23
.23
% 1
,74
0.7
1
4
Pru
dent
ial C
ore
Equ
ity
SW
IXFT
SE
/JS
E S
WIX
All
Sha
re I
ndex
6.6
7%
4.2
6%
17
.87
%1
7.8
6%
**
20
.42
%2
0.8
6%
27
.49
%2
9.9
1%
-16
.06
%-2
1.6
7%
5,2
89
.5
9
SIM
Cor
e H
ouse
view
Equ
ity
Fund
2%
Cal
l Rat
e, 9
8%
FTS
E/J
SE
SW
IX A
ll S
hare
Ind
ex4
.62
%4
.30
%1
9.2
7%
17
.65
%*
*2
1.8
8%
20
.58
%3
3.0
7%
29
.49
%*
* 6
81
.8
21
Sta
nlib
Cor
e E
quit
y FT
SE
/JS
E S
WIX
All
Sha
re I
ndex
6.4
7%
4.2
6%
18
.86
%1
7.8
6%
7.4
9%
8.3
4%
22
.71
%2
0.8
7%
28
.55
%2
9.9
1%
-29
.61
%-2
1.6
7%
1,7
25
.8
15
Sta
nlib
Res
earc
hFT
SE
/JS
E S
WIX
All
Sha
re I
ndex
3.7
8%
4.2
6%
17
.68
%1
7.8
6%
8.3
6%
8.3
4%
21
.34
%2
0.8
7%
29
.42
%2
9.9
1%
-22
.74
%-2
1.6
7%
6,4
94
.7
8
Syg
nia
Cor
e E
quit
y Fu
ndFT
SE/J
SE S
WIX
All
Sha
re I
ndex
3.4
2%
4.2
6%
**
**
**
**
**
1,0
56
.7
19
Taqu
anta
Act
ive
All
Sha
reFT
SE
/JS
E A
ll S
hare
Ind
ex0
.63
%2
.57
%1
7.7
2%
17
.27
%*
*1
9.7
6%
18
.98
%3
5.3
5%
32
.14
%-2
0.6
8%
-23
.23
% 1
,52
5.7
1
6
Taqu
anta
Act
ive
SW
IXFT
SE
/JS
E S
WIX
All
Sha
re I
ndex
2.1
7%
4.2
5%
18
.83
%1
7.8
5%
**
20
.93
%2
0.8
6%
35
.82
%2
9.9
1%
**
7,4
33
.4
6
INDIC
ES
FTS
E/J
SE
All
Sha
re I
ndex
2.5
7%
17
.27
%8
.09
%1
8.9
8%
32
.13
%-2
3.2
3%
FTS
E/J
SE
Cap
ped
All
Sha
re I
ndex
3.0
9%
17
.70
%8
.74
%1
9.5
6%
32
.29
%-2
1.6
5%
FTS
E/J
SE
SW
IX A
ll S
hare
Ind
ex4
.25
%1
7.8
5%
8.6
5%
20
.86
%2
9.9
1%
-21
.67
%
FTS
E/J
SE
Top
40
Ind
ex2
.44
%1
6.5
1%
7.5
4%
17
.22
%3
1.7
3%
-23
.58
%
FTS
E/J
SE
Val
ue I
ndex
-0.7
1%
16
.52
%5
.13
%1
8.7
4%
34
.20
%-2
7.4
8%
FTS
E/J
SE
Gro
wth
Ind
ex-3
.78
%1
0.3
3%
4.1
1%
13
.45
%2
3.0
4%
-22
.60
%
RETU
RNS
TATI
STI
CS
Num
ber
of P
arti
cipa
nts
26
21
13
24
23
21
Tota
l Fun
d S
ize
of P
arti
cipa
nts
125
,433
.5
Inde
x -
All
righ
ts i
n th
e FT
SE
/JS
E A
fric
a In
dex
Ser
ies
vest
in
the
JSE
Lim
ited
(JS
E)
and
in F
TSE
Int
erna
tion
al L
imit
ed (
FTS
E)
join
tly.
FTS
E™
is
a tr
ade
mar
k of
the
Lon
don
Sto
ck E
xcha
nge
Lim
ited
(LS
E)
and
The
Fina
ncia
l Ti
mes
Li
mit
ed (
FT)
join
tly
and
issu
ed b
y FT
SE
und
er lic
ence
. JS
E is
a tr
ade
mar
k of
the
JS
E.
The
FTS
E/J
SE
Afr
ica
Inde
x S
erie
s is
cal
cula
ted
by F
TSE
Int
erna
tion
al L
imit
ed (
FTS
E)
in c
onju
ncti
on w
ith
the
JSE
Lim
ited
(JS
E)
in a
ccor
danc
e w
ith
stan
dard
cri
teri
a.Th
e FT
SE
/JS
E A
fric
a In
dex
Ser
ies
is t
he p
ropr
ieta
ry in
form
atio
n of
FTS
E a
nd t
he J
SE
. A
ll co
pyri
ght
subs
isti
ng in
the
FTS
E/J
SE
Afr
ica
Inde
x va
lues
and
con
stit
uent
list
ves
ts in
FTS
E a
nd t
he J
SE
join
tly.
All
thei
r ri
ghts
are
res
erve
d.
SectIOn 3S.a. equity Manager WatchtM Survey
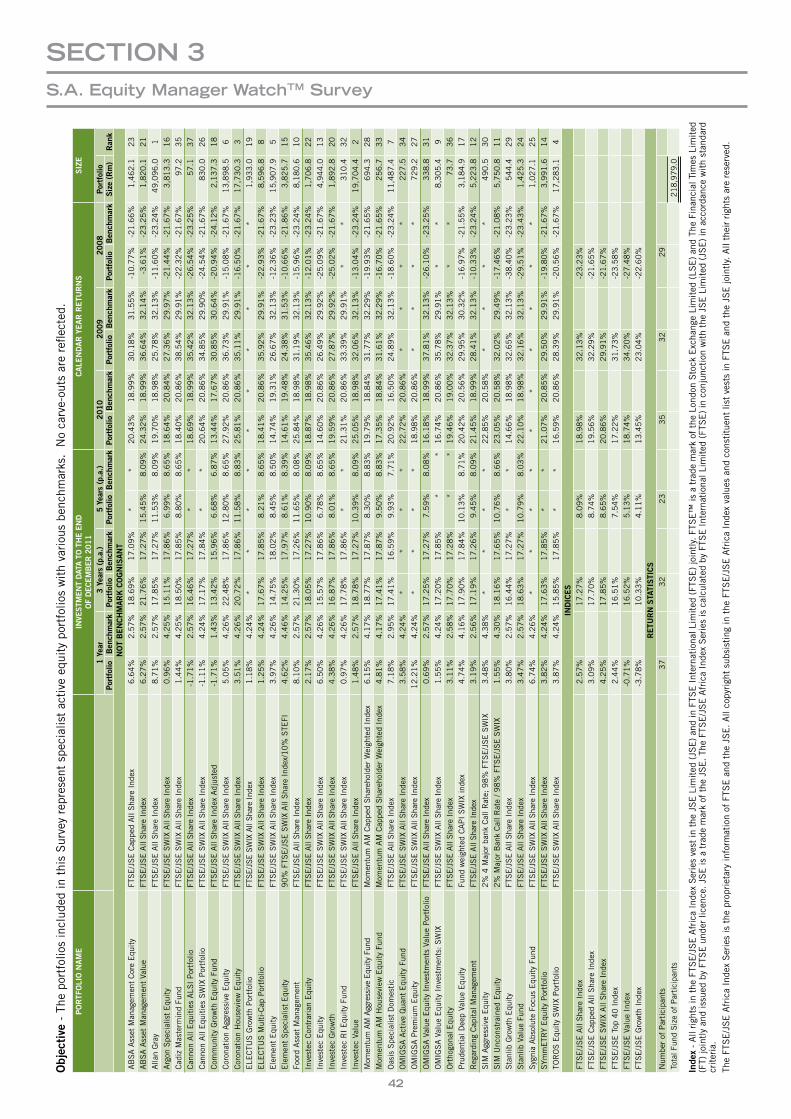
42
Objec
tive
- T
he p
ortf
olio
s in
clud
ed in
thi
s S
urve
y re
pres
ent
spec
ialis
t ac
tive
equ
ity
port
folio
s w
ith
vari
ous
benc
hmar
ks. N
o ca
rve-
outs
are
refl
ecte
d.PORTF
OLI
ON
AME
INVE
STMEN
TDAT
ATO
THEEN
D
OFDEC
EMBER
201
1CALE
NDARYEARR
ETU
RNS
SIZ
E
1Yea
r3Yea
rs(p.a.)
5Yea
rs(p.a.)
2010
2009
2008
Portfolio
Ran
kPortfolio
Ben
chmark
Portfolio
Ben
chmark
Portfolio
Ben
chmark
Portfolio
Ben
chmark
Portfolio
Ben
chmark
Portfolio
Ben
chmark
Size(R
m)
NOTBENCHMARKC
OGNIS
ANT
AB
SA
Ass
et M
anag
emen
t C
ore
Equ
ity
FTS
E/J
SE
Cap
ped
All
Sha
re I
ndex
6.6
4%
2.5
7%
18
.69
%1
7.0
9%
**
20
.43
%1
8.9
9%
30
.18
%3
1.5
5%
-10
.77
%-2
1.6
6%
1,4
62
.1
23
AB
SA
Ass
et M
anag
emen
t Va
lue
FTS
E/J
SE
All
Sha
re I
ndex
6.2
7%
2.5
7%
21
.76
%1
7.2
7%
15
.45
%8
.09
%2
4.3
2%
18
.99
%3
6.6
4%
32
.14
%-3
.61
%-2
3.2
5%
1,8
20
.1
21
Alla
n G
ray
FTS
E/J
SE
All
Sha
re I
ndex
8.7
1%
2.5
7%
17
.85
%1
7.2
7%
11
.53
%8
.09
%1
9.7
0%
18
.98
%2
5.7
8%
32
.13
%-1
1.6
0%
-23
.24
%4
9,0
96
.0
1A
rgon
Spe
cial
ist
Equ
ity
FTS
E/J
SE
SW
IX A
ll S
hare
Ind
ex0
.96
%4
.25
%1
5.1
1%
17
.86
%6
.99
%8
.65
%1
8.6
4%
20
.84
%2
7.3
6%
29
.97
%-2
1.4
4%
-21
.67
% 3
,81
3.3
1
6C
adiz
Mas
term
ind
Fund
FTS
E/J
SE
SW
IX A
ll S
hare
Ind
ex1
.44
%4
.25
%1
8.5
0%
17
.85
%8
.80
%8
.65
%1
8.4
0%
20
.86
%3
8.5
4%
29
.91
%-2
2.3
2%
-21
.67
% 9
7.2
3
5C
anno
n A
ll E
quit
ies
ALS
I P
ortf
olio
FTS
E/J
SE
All
Sha
re I
ndex
-1.7
1%
2.5
7%
16
.46
%1
7.2
7%
**
18
.69
%1
8.9
9%
35
.42
%3
2.1
3%
-26
.54
%-2
3.2
5%
57
.1
37
Can
non
All
Equ
itie
s S
WIX
Por
tfol
ioFT
SE
/JS
E S
WIX
All
Sha
re I
ndex
-1.1
1%
4.2
4%
17
.17
%1
7.8
4%
**
20
.64
%2
0.8
6%
34
.85
%2
9.9
0%
-24
.54
%-2
1.6
7%
83
0.0
2
6C
omm
unit
y G
row
th E
quit
y Fu
ndFT
SE
/JS
E A
ll S
hare
Ind
ex A
djus
ted
-1.7
1%
1.4
3%
13
.42
%1
5.9
6%
6.6
8%
6.8
7%
13
.44
%1
7.6
7%
30
.85
%3
0.6
4%
-20
.94
%-2
4.1
2%
2,1
37
.3
18
Cor
onat
ion
Agg
ress
ive
Equ
ity
FTS
E/J
SE
SW
IX A
ll S
hare
Ind
ex5
.05
%4
.26
%2
2.4
8%
17
.86
%1
2.8
0%
8.6
5%
27
.92
%2
0.8
6%
36
.73
%2
9.9
1%
-15
.08
%-2
1.6
7%
13
,89
8.5
6
Cor
onat
ion
Hou
sevi
ew E
quit
yFT
SE
/JS
E S
WIX
All
Sha
re I
ndex
3.5
1%
4.2
6%
20
.72
%1
7.8
6%
11
.58
%8
.83
%2
5.8
1%
20
.86
%3
5.1
1%
29
.91
%-1
6.5
0%
-21
.67
%1
7,7
30
.3
3E
LEC
TUS
Gro
wth
Por
tfol
ioFT
SE/J
SE S
WIX
All
Shar
e In
dex
1.1
8%
4.2
4%
**
**
**
**
**
1,9
33
.0
19
ELE
CTU
S M
ulti
-Cap
Por
tfol
io
FTS
E/J
SE
SW
IX A
ll S
hare
Ind
ex1
.25
%4
.24
%1
7.6
7%
17
.85
%8
.21
%8
.65
%1
8.4
1%
20
.86
%3
5.9
2%
29
.91
%-2
2.9
3%
-21
.67
% 8
,59
6.8
8
Ele
men
t E
quit
yFT
SE
/JS
E S
WIX
All
Sha
re I
ndex
3.9
7%
4.2
6%
14
.75
%1
8.0
2%
8.4
5%
8.5
0%
14
.74
%1
9.3
1%
26
.67
%3
2.1
3%
-12
.36
%-2
3.2
3%
15
,90
7.9
5
Ele
men
t S
peci
alis
t E
quit
y9
0%
FTS
E/J
SE
SW
IX A
ll S
hare
Ind
ex/1
0%
STE
FI4
.62
%4
.46
%1
4.2
5%
17
.97
%8
.61
%8
.39
%1
4.6
1%
19
.48
%2
4.3
8%
31
.53
%-1
0.6
6%
-21
.86
% 3
,82
5.7
1
5Fo
ord
Ass
et M
anag
emen
tFT
SE
/JS
E A
ll S
hare
Ind
ex8
.10
%2
.57
%2
1.3
0%
17
.26
%1
1.6
5%
8.0
8%
25
.84
%1
8.9
8%
31
.19
%3
2.1
3%
-15
.96
%-2
3.2
4%
8,1
80
.6
10
Inve
stec
Con
trar
ian
Equ
ity
FTS
E/J
SE
All
Sha
re I
ndex
2.1
7%
2.5
7%
18
.05
%1
7.2
7%
10
.90
%8
.09
%1
8.8
7%
18
.98
%3
5.4
6%
32
.13
%-1
2.0
1%
-23
.24
% 1
,70
6.8
2
2In
vest
ec E
quit
yFT
SE
/JS
E S
WIX
All
Sha
re I
ndex
6.5
0%
4.2
6%
15
.57
%1
7.8
6%
6.7
8%
8.6
5%
14
.60
%2
0.8
6%
26
.49
%2
9.9
2%
-25
.09
%-2
1.6
7%
4,9
44
.0
13
Inve
stec
Gro
wth
FTS
E/J
SE
SW
IX A
ll S
hare
Ind
ex4
.38
%4
.26
%1
6.8
7%
17
.86
%8
.01
%8
.65
%1
9.5
9%
20
.86
%2
7.8
7%
29
.92
%-2
5.0
2%
-21
.67
% 1
,89
2.8
2
0In
vest
ec R
I E
quit
y Fu
ndFT
SE
/JS
E S
WIX
All
Sha
re I
ndex
0.9
7%
4.2
6%
17
.78
%1
7.8
6%
**
21
.31
%2
0.8
6%
33
.39
%2
9.9
1%
**
31
0.4
3
2In
vest
ec V
alue
FTS
E/J
SE
All
Sha
re I
ndex
1.4
8%
2.5
7%
18
.78
%1
7.2
7%
10
.39
%8
.09
%2
5.0
5%
18
.98
%3
2.0
6%
32
.13
%-1
3.0
4%
-23
.24
%1
9,7
04
.4
2M
omen
tum
AM
Agg
ress
ive
Equi
ty F
und
Mom
entu
m A
M C
appe
d S
hare
hold
er W
eigh
ted
Inde
x6
.15
%4
.17
%1
8.7
7%
17
.87
%8
.30
%8
.83
%1
9.7
9%
18
.84
%3
1.7
7%
32
.29
%-1
9.9
3%
-21
.65
% 6
94
.3
28
Mom
entu
m A
M H
ouse
view
Equ
ity
Fund
Mom
entu
m A
M C
appe
d S
hare
hold
er W
eigh
ted
Inde
x4
.81
%4
.17
%1
7.4
1%
17
.87
%9
.50
%8
.83
%1
7.3
5%
18
.84
%3
1.6
1%
32
.29
%-1
6.7
0%
-21
.65
% 2
56
.7
33
Oas
is S
peci
alis
t D
omes
tic
FTS
E/J
SE
All
Sha
re I
ndex
7.1
8%
2.9
5%
17
.41
%1
6.5
9%
9.9
3%
7.7
1%
20
.92
%1
6.5
0%
24
.89
%3
2.1
3%
-18
.60
%-2
3.2
4%
11
,48
7.4
7
OM
IGS
A A
ctiv
e Q
uant
Equ
ity
Fund
FTS
E/J
SE
SW
IX A
ll S
hare
Ind
ex3
.58
%4
.24
%*
**
*2
2.7
2%
20
.86
%*
**
* 2
27
.5
34
OM
IGS
A P
rem
ium
Equ
ity
FTS
E/J
SE
SW
IX A
ll S
hare
Ind
ex1
2.2
1%
4.2
4%
**
**
18
.98
%2
0.8
6%
**
**
72
9.2
2
7O
MIG
SA
Val
ue E
quit
y In
vest
men
ts V
alue
Por
tfol
ioFT
SE
/JS
E A
ll S
hare
Ind
ex0
.69
%2
.57
%1
7.2
5%
17
.27
%7
.59
%8
.08
%1
6.1
8%
18
.99
%3
7.8
1%
32
.13
%-2
6.1
0%
-23
.25
% 3
38
.8
31
OM
IGS
A V
alue
Equ
ity
Inve
stm
ents
: S
WIX
FTS
E/J
SE
SW
IX A
ll S
hare
Ind
ex1
.55
%4
.24
%1
7.2
0%
17
.85
%*
*1
6.7
4%
20
.86
%3
5.7
8%
29
.91
%*
* 8
,30
5.4
9
Ort
hogo
nal E
quit
yFT
SE
/JS
E A
ll S
hare
Ind
ex3
.11
%2
.58
%1
7.7
0%
17
.28
%*
*1
9.4
6%
19
.00
%3
2.3
7%
32
.13
%*
* 7
3.7
3
6P
rude
ntia
l Dee
p Va
lue
Equ
ity
Fund
wei
ghte
d C
AP
I S
WIX
inde
x4
.74
%4
.16
%1
7.9
0%
17
.84
%1
0.1
3%
8.7
1%
20
.42
%2
0.5
6%
29
.95
%3
0.3
2%
-16
.97
%-2
1.5
5%
3,1
84
.9
17
Reg
ardi
ng C
apit
al M
anag
emen
tFT
SE/J
SE A
ll Sha
re I
ndex
3.1
9%
2.5
6%
17
.19
%1
7.2
6%
9.4
5%
8.0
9%
21
.45
%1
8.9
9%
28
.41
%3
2.1
3%
-10
.33
%-2
3.2
4%
5,2
23
.8
12
SIM
Agg
ress
ive
Equ
ity
2%
4 M
ajor
ban
k C
all R
ate;
98
% F
TSE
/JS
E S
WIX
3.4
8%
4.3
8%
**
**
22
.85
%2
0.5
8%
**
**
49
0.5
3
0S
IM U
ncon
stra
ined
Equ
ity
2%
Maj
or B
ank
Cal
l Rat
e / 9
8%
FTS
E/J
SE
SW
IX
1.5
5%
4.3
0%
18
.16
%1
7.6
5%
10
.76
%8
.66
%2
3.0
5%
20
.58
%3
2.0
2%
29
.49
%-1
7.4
6%
-21
.08
% 5
,75
0.8
1
1S
tanl
ib G
row
th E
quit
yFT
SE
/JS
E A
ll S
hare
Ind
ex3
.80
%2
.57
%1
6.4
4%
17
.27
%*
*1
4.6
6%
18
.98
%3
2.6
5%
32
.13
%-3
8.4
0%
-23
.23
% 5
44
.4
29
Sta
nlib
Val
ue F
und
FTS
E/J
SE
All
Sha
re I
ndex
3.4
7%
2.5
7%
18
.63
%1
7.2
7%
10
.79
%8
.03
%2
2.1
0%
18
.98
%3
2.1
6%
32
.13
%-2
9.5
1%
-23
.43
% 1
,42
5.3
2
4S
ygni
a A
bsol
ute
Focu
s E
quit
y Fu
ndFT
SE
/JS
E S
WIX
All
Sha
re I
ndex
6.7
4%
4.2
6%
**
**
**
**
**
1,0
27
.1
25
SYm
mE
TRY
Equ
ity
Por
tfol
ioFT
SE
/JS
E S
WIX
All
Sha
re I
ndex
3.8
2%
4.2
4%
17
.63
%1
7.8
5%
**
21
.07
%2
0.8
5%
29
.50
%2
9.9
1%
-19
.80
%-2
1.6
7%
3,9
91
.6
14
TOR
OS
Equ
ity
SW
IX P
ortf
olio
FTS
E/J
SE
SW
IX A
ll S
hare
Ind
ex3
.87
%4
.24
%1
5.8
5%
17
.85
%*
*1
6.5
9%
20
.86
%2
8.3
9%
29
.91
%-2
0.5
6%
-21
.67
%1
7,2
83
.1
4IN
DIC
ES
FTS
E/J
SE
All
Sha
re I
ndex
2.5
7%
17
.27
%8
.09
%1
8.9
8%
32
.13
%-2
3.2
3%
FTS
E/J
SE
Cap
ped
All
Sha
re I
ndex
3.0
9%
17
.70
%8
.74
%1
9.5
6%
32
.29
%-2
1.6
5%
FTS
E/J
SE
SW
IX A
ll S
hare
Ind
ex4
.25
%1
7.8
5%
8.6
5%
20
.86
%2
9.9
1%
-21
.67
%FT
SE
/JS
E T
op 4
0 I
ndex
2.4
4%
16
.51
%7
.54
%1
7.2
2%
31
.73
%-2
3.5
8%
FTS
E/J
SE
Val
ue I
ndex
-0.7
1%
16
.52
%5
.13
%1
8.7
4%
34
.20
%-2
7.4
8%
FTS
E/J
SE
Gro
wth
Ind
ex-3
.78
%1
0.3
3%
4.1
1%
13
.45
%2
3.0
4%
-22
.60
%RETU
RNS
TATI
STI
CS
Num
ber
of P
arti
cipa
nts
37
32
23
35
32
29
Tota
l Fun
d S
ize
of P
arti
cipa
nts
218,9
79.0
Inde
x -
All
righ
ts in
the
FTS
E/J
SE
Afr
ica
Inde
x S
erie
s ve
st in
the
JS
E L
imit
ed (
JSE
) an
d in
FTS
E I
nter
nati
onal
Lim
ited
(FT
SE
) jo
intl
y. F
TSE
™ is
a t
rade
mar
k of
the
Lon
don
Sto
ck E
xcha
nge
Lim
ited
(LS
E)
and
The
Fina
ncia
l Tim
es L
imit
ed
(FT)
join
tly
and
issu
ed b
y FT
SE
und
er li
cenc
e. J
SE
is a
tra
de m
ark
of t
he J
SE
. The
FTS
E/J
SE
Afr
ica
Inde
x S
erie
s is
cal
cula
ted
by F
TSE
Int
erna
tion
al L
imit
ed (
FTS
E)
in c
onju
ncti
on w
ith
the
JSE
Lim
ited
(JS
E)
in a
ccor
danc
e w
ith
stan
dard
cr
iter
ia.
The
FTS
E/J
SE
Afr
ica
Inde
x S
erie
s is
the
pro
prie
tary
info
rmat
ion
of F
TSE
and
the
JS
E.
All
copy
righ
t su
bsis
ting
in t
he F
TSE
/JS
E A
fric
a In
dex
valu
es a
nd c
onst
itue
nt li
st v
ests
in F
TSE
and
the
JS
E jo
intl
y. A
ll th
eir
righ
ts a
re r
eser
ved.
SectIOn 3S.a. equity Manager WatchtM Survey
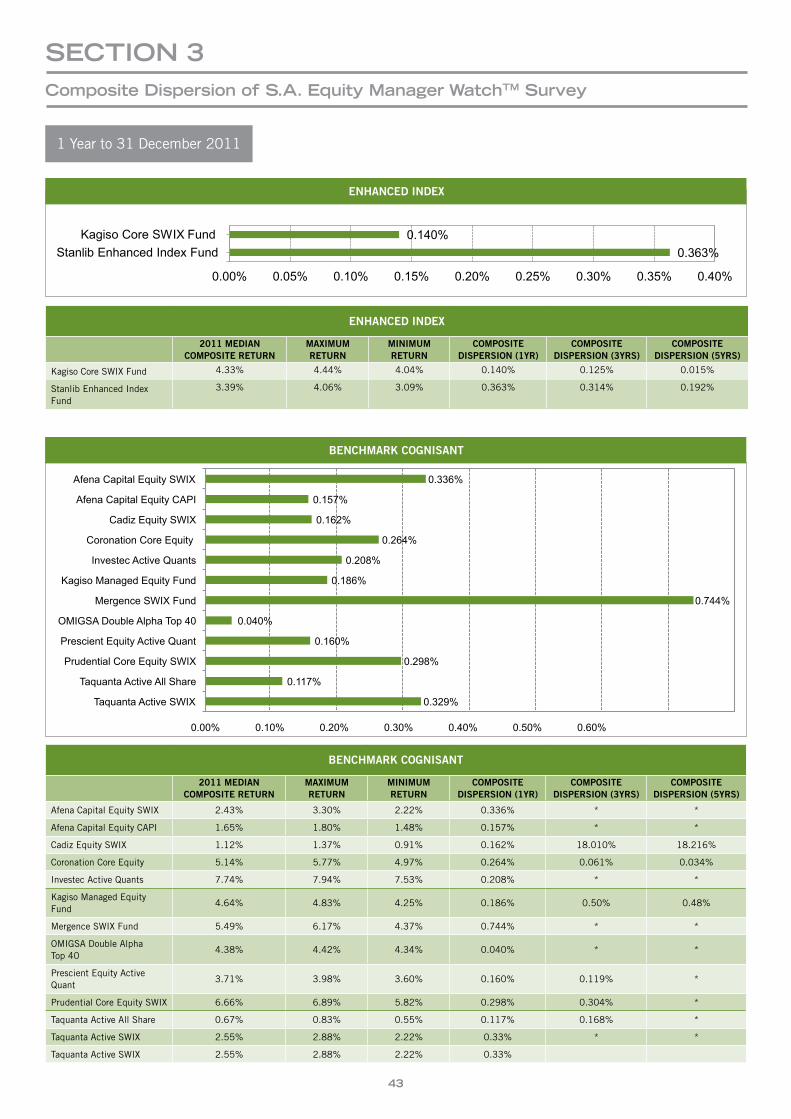
43
SectIOn 3composite Dispersion of S.a. equity Manager WatchtM Survey
0.140% 0.363%
0.00% 0.05% 0.10% 0.15% 0.20% 0.25% 0.30% 0.35% 0.40%
Kagiso Core SWIX Fund Stanlib Enhanced Index Fund
Enhanced Index
0.336%
0.157%
0.162%
0.264%
0.208%
0.186%
0.744%
0.040%
0.160%
0.298%
0.117%
0.329%
0.00% 0.10% 0.20% 0.30% 0.40% 0.50% 0.60% 0.70% 0.80%
Afena Capital Equity SWIX
Afena Capital Equity CAPI
Cadiz Equity SWIX
Coronation Core Equity
Investec Active Quants
Kagiso Managed Equity Fund
Mergence SWIX Fund
OMIGSA Double Alpha Top 40
Prescient Equity Active Quant
Prudential Core Equity SWIX
Taquanta Active All Share
Taquanta Active SWIX
Benchmark Cognisant
ENHANCEDINDEX
ENHANCEDINDEX
2011MEDIANCOMPOSITERETURN
MAXIMUMRETURN
MINIMUMRETURN
COMPOSITEDISPERSION(1YR)
COMPOSITEDISPERSION(3YRS)
COMPOSITEDISPERSION(5YRS)
Kagiso Core SWIX Fund 4.33% 4.44% 4.04% 0.140% 0.125% 0.015%
Stanlib Enhanced Index Fund
3.39% 4.06% 3.09% 0.363% 0.314% 0.192%
1 Year to 31 December 2011
BENCHMARKCOGNISANT
2011MEDIANCOMPOSITERETURN
MAXIMUMRETURN
MINIMUMRETURN
COMPOSITEDISPERSION(1YR)
COMPOSITEDISPERSION(3YRS)
COMPOSITEDISPERSION(5YRS)
Afena Capital Equity SWIX 2.43% 3.30% 2.22% 0.336% * *
Afena Capital Equity CAPI 1.65% 1.80% 1.48% 0.157% * *
Cadiz Equity SWIX 1.12% 1.37% 0.91% 0.162% 18.010% 18.216%
Coronation Core Equity 5.14% 5.77% 4.97% 0.264% 0.061% 0.034%
Investec Active Quants 7.74% 7.94% 7.53% 0.208% * *
Kagiso Managed Equity Fund
4.64% 4.83% 4.25% 0.186% 0.50% 0.48%
Mergence SWIX Fund 5.49% 6.17% 4.37% 0.744% * *
OMIGSA Double Alpha Top 40
4.38% 4.42% 4.34% 0.040% * *
Prescient Equity Active Quant
3.71% 3.98% 3.60% 0.160% 0.119% *
Prudential Core Equity SWIX 6.66% 6.89% 5.82% 0.298% 0.304% *
Taquanta Active All Share 0.67% 0.83% 0.55% 0.117% 0.168% *
Taquanta Active SWIX 2.55% 2.88% 2.22% 0.33% * *
Taquanta Active SWIX 2.55% 2.88% 2.22% 0.33%
0.336%
0.157%
0.162%
0.264%
0.208%
0.186%
0.744%
0.040%
0.160%
0.298%
0.117%
0.329%
0.00% 0.10% 0.20% 0.30% 0.40% 0.50% 0.60%
Afena Capital Equity SWIX
Afena Capital Equity CAPI
Cadiz Equity SWIX
Coronation Core Equity
Investec Active Quants
Kagiso Managed Equity Fund
Mergence SWIX Fund
OMIGSA Double Alpha Top 40
Prescient Equity Active Quant
Prudential Core Equity SWIX
Taquanta Active All Share
Taquanta Active SWIX
Benchmark Cognisant BENCHMARKCOGNISANT
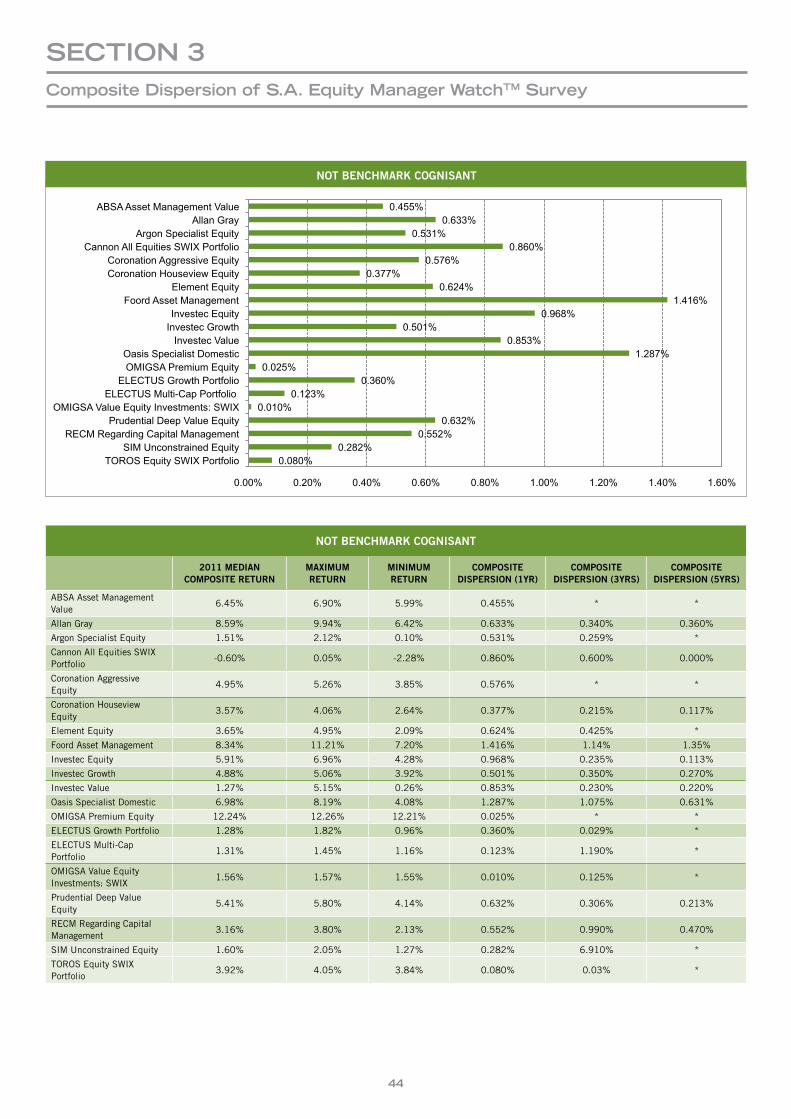
44
0.455% 0.633%
0.531% 0.860%
0.576% 0.377%
0.624% 1.416%
0.968% 0.501%
0.853% 1.287%
0.025% 0.360%
0.123% 0.010%
0.632% 0.552%
0.282% 0.080%
0.00% 0.20% 0.40% 0.60% 0.80% 1.00% 1.20% 1.40% 1.60%
ABSA Asset Management Value Allan Gray
Argon Specialist Equity Cannon All Equities SWIX Portfolio
Coronation Aggressive Equity Coronation Houseview Equity
Element Equity Foord Asset Management
Investec Equity Investec Growth
Investec Value Oasis Specialist Domestic OMIGSA Premium Equity
ELECTUS Growth Portfolio ELECTUS Multi-Cap Portfolio
OMIGSA Value Equity Investments: SWIX Prudential Deep Value Equity
RECM Regarding Capital Management SIM Unconstrained Equity
TOROS Equity SWIX Portfolio
Not Benchmark Cognisant NOTBENCHMARKCOGNISANT
NOTBENCHMARKCOGNISANT
2011MEDIANCOMPOSITERETURN
MAXIMUMRETURN
MINIMUMRETURN
COMPOSITEDISPERSION(1YR)
COMPOSITEDISPERSION(3YRS)
COMPOSITEDISPERSION(5YRS)
ABSA Asset Management Value
6.45% 6.90% 5.99% 0.455% * *
Allan Gray 8.59% 9.94% 6.42% 0.633% 0.340% 0.360%
Argon Specialist Equity 1.51% 2.12% 0.10% 0.531% 0.259% *
Cannon All Equities SWIX Portfolio
-0.60% 0.05% -2.28% 0.860% 0.600% 0.000%
Coronation Aggressive Equity
4.95% 5.26% 3.85% 0.576% * *
Coronation Houseview Equity
3.57% 4.06% 2.64% 0.377% 0.215% 0.117%
Element Equity 3.65% 4.95% 2.09% 0.624% 0.425% *
Foord Asset Management 8.34% 11.21% 7.20% 1.416% 1.14% 1.35%
Investec Equity 5.91% 6.96% 4.28% 0.968% 0.235% 0.113%
Investec Growth 4.88% 5.06% 3.92% 0.501% 0.350% 0.270%
Investec Value 1.27% 5.15% 0.26% 0.853% 0.230% 0.220%
Oasis Specialist Domestic 6.98% 8.19% 4.08% 1.287% 1.075% 0.631%
OMIGSA Premium Equity 12.24% 12.26% 12.21% 0.025% * *
ELECTUS Growth Portfolio 1.28% 1.82% 0.96% 0.360% 0.029% *
ELECTUS Multi-Cap Portfolio
1.31% 1.45% 1.16% 0.123% 1.190% *
OMIGSA Value Equity Investments: SWIX
1.56% 1.57% 1.55% 0.010% 0.125% *
Prudential Deep Value Equity
5.41% 5.80% 4.14% 0.632% 0.306% 0.213%
RECM Regarding Capital Management
3.16% 3.80% 2.13% 0.552% 0.990% 0.470%
SIM Unconstrained Equity 1.60% 2.05% 1.27% 0.282% 6.910% *
TOROS Equity SWIX Portfolio
3.92% 4.05% 3.84% 0.080% 0.03% *
SectIOn 3composite Dispersion of S.a. equity Manager WatchtM Survey
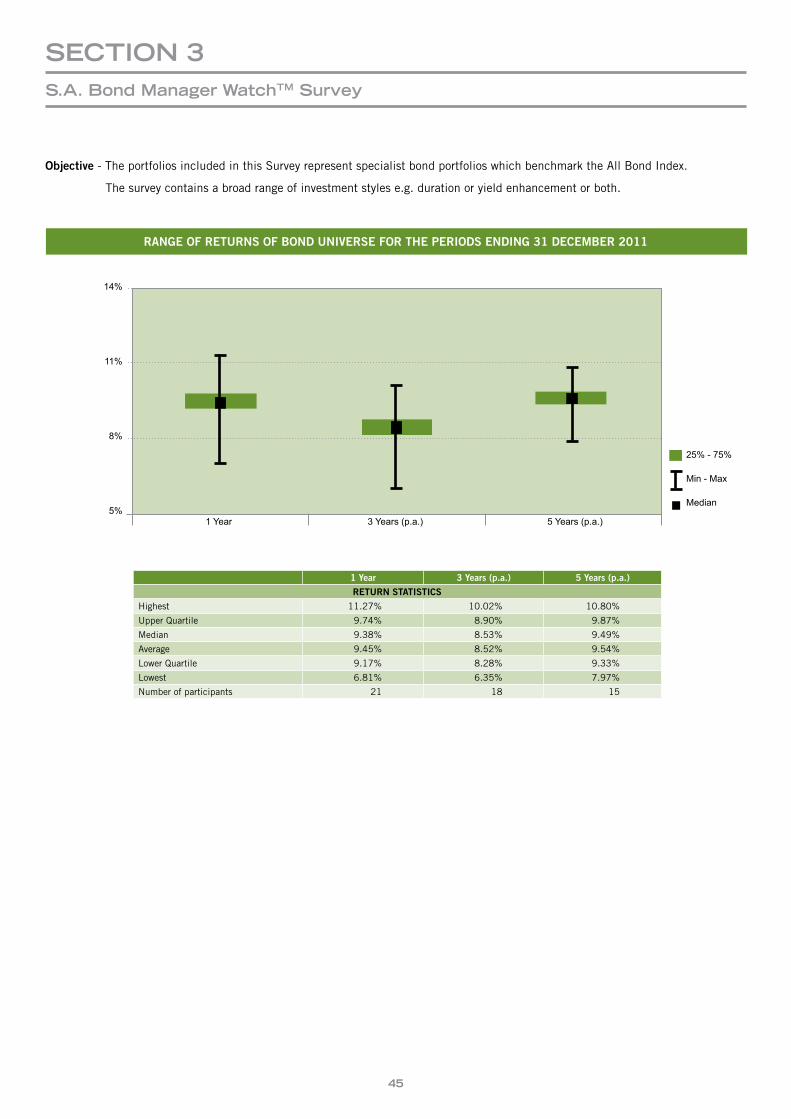
45
1Year 3Years(p.a.) 5Years(p.a.)
RETURNSTATISTICS
Highest 11.27% 10.02% 10.80%
Upper Quartile 9.74% 8.90% 9.87%
Median 9.38% 8.53% 9.49%
Average 9.45% 8.52% 9.54%
Lower Quartile 9.17% 8.28% 9.33%
Lowest 6.81% 6.35% 7.97%
Number of participants 21 18 15
RANGEOFRETURNSOFBONDUNIVERSEFORTHEPERIODSENDING31DECEMBER2011
Objective - The portfolios included in this Survey represent specialist bond portfolios which benchmark the All Bond Index.
The survey contains a broad range of investment styles e.g. duration or yield enhancement or both.
14%
11%
8%
5%1 Year 3 Years (p.a.) 5 Years (p.a.)
25% - 75%
Min - Max
Median
SectIOn 3S.a. Bond Manager WatchtM Survey

46
Objec
tive
- The
por
tfol
ios
incl
uded
in th
is S
urve
y re
pres
ent s
peci
alis
t bon
d po
rtfo
lios
with
ALB
I as
thei
r ben
chm
ark
and
have
an
effe
ctiv
e m
odifi
ed d
urat
ion
man
date
of +
/- 2
year
s ar
ound
the
ALB
I
PORTF
OLI
ON
AME
INVE
STM
ENTDAT
ATOTHEE
NDO
FDECEMBER2
011
CALE
NDARYEARR
ETU
RNS
CHARACTE
RIS
TICS
1Yea
rRan
k3
Yea
rs(p.a.)
Ran
k5Yea
rs(p.a.)
Ran
k2010
Ran
k2009
Ran
k2008
Ran
k
Upp
erand
Low
er
Dur
ationLimits
(Yea
rs)(R
elativeto
ALB
I)Portfolio
Dur
ation
%ofpo
rfolio
inve
sted
in
AAArated
instru
men
tsPortfolio
Type
Size(R
m)
Ran
kSPECIA
LISTBONDS
Arg
on D
omes
tic
Cor
e B
ond
6.8
1%
21
6.3
5%
18
7.9
7%
15
13
.81
%2
0-1
.04
%1
81
6.9
8%
16
1.0
05
.70
57
%S
90
.02
1C
adiz
Cor
e B
ond
8.8
2%
20
8.0
0%
16
9.2
0%
14
16
.13
%1
1-0
.33
%1
61
7.5
6%
12
1.0
05
.48
67
%S
1,1
91
.41
4C
adiz
Dyn
amic
Bon
d8
.98
%1
8*
*1
6.0
7%
12
**
2.0
05
.56
67
%S
2,6
05
.01
1C
oron
atio
n A
ctiv
e B
ond
Por
tfol
io (
Com
posi
te)
9.8
5%
48
.37
%1
19
.51
%7
15
.86
%1
30
.00
%1
21
7.7
8%
52
.00
5.8
36
5%
P4
,66
6.8
7C
oron
atio
n S
trat
egic
Bon
d C
ompo
site
9.7
0%
78
.88
%6
*1
6.3
4%
81
.14
%6
18
.54
%2
*5
.28
64
%S
1,8
70
.41
3Fu
ture
grow
th C
ore
Bon
d C
ompo
site
9.3
5%
12
8.2
7%
14
9.3
1%
12
16
.39
%7
-0.2
7%
15
17
.64
%8
1.0
05
.36
64
%S
17
73
2,1
1Fu
ture
grow
th Y
ield
Enh
ance
d1
1.2
7%
11
0.0
2%
11
0.8
0%
11
8.4
4%
11
.06
%7
18
.70
%1
1.0
05
.32
30
%S
3,7
73
.29
Inve
stec
Dyn
amic
Bon
d P
ortf
olio
8.9
2%
19
7.8
7%
17
9.2
4%
13
15
.53
%1
5-0
.24
%1
41
8.1
2%
43
.00
5.5
96
8%
P4
,79
1.5
6In
vest
ec T
ripl
e A
lpha
9.8
2%
5*
*1
6.4
8%
6*
*3
.00
5.5
56
0%
S3
,44
3.5
10
Inve
stm
ent
Sol
utio
ns P
ure
Fixe
d In
tere
st P
ortf
olio
9.2
8%
13
8.3
4%
12
9.4
4%
91
5.5
2%
16
0.7
5%
91
7.6
5%
72
.00
5.0
65
4%
P6
,17
4.6
5JM
BU
SH
A B
ondP
lus
9.2
4%
15
8.1
5%
15
*1
3.6
4%
21
1.8
8%
41
3.7
1%
18
1.5
-25
.92
82
%S
67
0.9
19
Mom
entu
m A
M B
ond
Fund
9.5
8%
98
.91
%5
9.9
4%
31
6.3
0%
91
.35
%5
18
.53
%3
1.0
05
.63
68
%S
6,
41
2,3
4M
omen
tum
Mod
erat
e B
ond
FOF
9.3
8%
11
8.9
7%
49
.92
%4
15
.82
%1
42
.14
%3
17
.18
%1
41
.50
5.4
36
5%
S4
03
.12
0P
an A
fric
a A
M S
egre
gate
d D
omes
tic
Bon
d9
.07
%1
78
.61
%9
9.6
2%
61
6.7
2%
40
.65
%1
01
7.6
1%
92
.00
5.5
55
0%
S2
,29
0.9
12
Pre
scie
nt B
ond
Qua
nt9
.46
%1
08
.44
%1
09
.40
%1
01
5.4
0%
17
0.9
6%
81
7.3
3%
13
0.5
05
.15
62
%S
91
6.1
16
Pre
scie
nt B
ond
Qua
ntP
lus
9.1
7%
16
9.1
3%
21
0.0
4%
21
4.9
1%
19
3.5
9%
11
7.5
8%
11
1.5
04
.00
73
%S
9,1
16
.72
Pru
dent
ial Y
ield
Enh
ance
d P
ortf
olio
10
.58
%3
9.0
7%
39
.82
%5
17
.30
%2
0.0
3%
11
17
.59
%1
01
.00
5.5
65
2%
S1
,12
9.4
15
SIM
Ins
titu
tion
al T
otal
Ret
urn
Bon
d Fu
nd
9.6
7%
88
.32
%1
39
.34
%1
11
6.8
2%
3-0
.78
%1
71
7.7
2%
62
.00
5.8
27
0%
S7
,38
4.9
3S
tanl
ib C
ore
Bon
d P
ortf
olio
10
.61
%2
8.6
8%
89
.49
%8
16
.26
%1
0-0
.19
%1
31
7.0
1%
15
3.8
-7.8
5.8
06
1%
S3
,84
7.1
8S
Ymm
ETR
Y B
ond
Por
tfol
io9
.26
%1
48
.88
%7
*1
5.3
9%
18
2.3
7%
21
5.3
9%
17
2.0
03
.55
72
%P
85
4.1
17
Vuna
ni A
ctiv
e B
ond
Fund
9.7
4%
6*
*1
6.7
2%
5*
*2
.00
5.6
73
7%
S7
34
.21
8IN
FLAT
IONLIN
KEDB
ONDS
Cor
onat
ion
Abs
olut
e B
ond
Por
tfol
io1
3.8
8%
11
3.9
5%
11
2.6
7%
11
5.6
6%
11
2.3
4%
11
3.2
9%
3*
6.4
73
3%
S7
52
.64
Mom
entu
m A
M I
nflat
ion
Link
ed B
ond
Fund
13
.48
%2
**
12
.00
%2
**
2.0
09
.79
81
%P
2,3
84
.13
Pre
scie
nt I
nflat
ion
Link
ed B
ond
Com
posi
te1
1.4
5%
5*
*1
0.9
2%
5*
**
6.8
24
0%
S2
,99
2.0
1P
rude
ntia
l Infl
atio
n Li
nked
Bon
d Fu
nd1
3.2
5%
31
0.6
7%
31
1.0
2%
31
1.5
6%
37
.29
%3
13
.96
%1
*1
0.1
08
4%
S1
97
.85
SIM
Infl
atio
n Li
nked
Bon
d Fu
nd1
3.0
4%
41
0.8
1%
21
1.1
4%
21
1.3
6%
48
.10
%2
13
.93
%2
2.0
09
.03
81
%S
2,6
85
.22
SPECIA
LISTBONDS
TATI
STI
CS
Hig
hest
11
.27
%1
0.0
2%
10
.80
%1
8.4
4%
3.5
9%
18
.70
%U
pper
Qua
rtile
9.7
4%
8.9
0%
9.8
7%
16
.48
%1
.29
%1
7.7
6%
Med
ian
9.3
8%
8.5
3%
9.4
9%
16
.13
%0
.70
%1
7.6
0%
Ave
rage
9.4
5%
8.5
2%
9.5
4%
15
.99
%0
.73
%1
7.3
7%
Low
er Q
uart
ile9
.17
%8
.28
%9
.33
%1
5.5
2%
-0.2
3%
17
.22
%Lo
wes
t6
.81
%6
.35
%7
.97
%1
3.6
4%
-1.0
4%
13
.71
%N
umbe
r of
Par
tici
pant
s/To
tal
21
18
15
21
18
18
80
,09
8.5
INFL
ATIO
NLIN
KEDB
ONDS
TATI
STI
CS
Hig
hest
13
.88
%1
3.9
5%
12
.67
%1
5.6
6%
12
.34
%1
3.9
6%
Upp
er Q
uart
ile1
3.4
8%
12
.38
%1
1.9
0%
12
.00
%1
0.2
2%
13
.95
%M
edia
n1
3.2
5%
10
.81
%1
1.1
4%
11
.56
%8
.10
%1
3.9
3%
Ave
rage
13
.02
%1
1.8
1%
11
.61
%1
2.3
0%
9.2
4%
13
.73
%Lo
wer
Qua
rtile
13
.04
%1
0.7
4%
11
.08
%1
1.3
6%
7.6
9%
13
.61
%Lo
wes
t1
1.4
5%
10
.67
%1
1.0
2%
10
.92
%7
.29
%1
3.2
9%
Num
ber
of P
arti
cipa
nts/
Tota
l5
33
53
39
,01
1.7
MARKETSTA
TISTI
CS
All
Bon
d In
dex
8.8
2%
7.3
9%
8.5
9%
14
.96
%-0
.99
%1
6.9
7%
All
Bon
d In
dex
- D
urat
ion
5.7
9
1-3
Yea
r B
ond
Inde
x8
.90
%8
.46
%9
.05
%8
.75
%7
.74
%1
2.9
0%
3-7
Yea
r B
ond
Inde
x1
0.1
8%
8.5
1%
9.2
3%
12
.79
%2
.80
%1
5.7
2%
7-1
2 Y
ear
Bon
d In
dex
10
.20
%7
.73
%8
.90
%1
6.0
0%
-2.1
9%
17
.43
%1
2+ Y
ear
Bon
d In
dex
6.0
0%
4.3
5%
6.4
9%
15
.86
%-7
.47
%1
8.8
3%
Bar
clay
s -
BE
SA
SA
Infl
atio
n Li
nked
Ind
ex1
3.0
5%
10
.54
%1
0.8
7%
10
.97
%7
.66
%1
3.6
2%
BE
SA
Sta
ndar
d B
ank
Cre
dit
Inde
x1
0.0
2%
10
.77
%1
0.2
1%
20
.50
%2
.51
%1
4.8
2%
GO
VI7
.84
%7
.15
%7
.95
%1
4.5
8%
-0.4
4%
14
.17
%S
TeFI
5.7
3%
7.2
5%
8.5
3%
6.9
3%
9.1
3%
11
.69
%
SectIOn 3S.a. Bond Manager WatchtM Survey
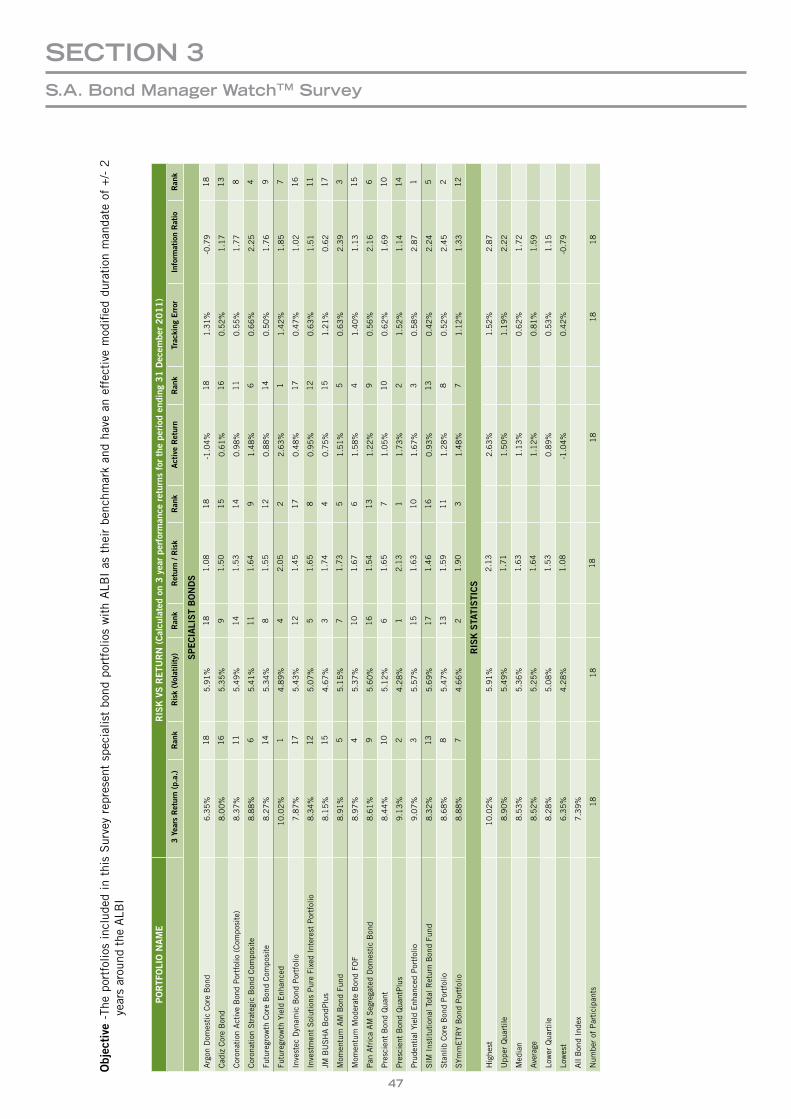
47
Objec
tive
-Th
e po
rtfo
lios
incl
uded
in
this
Sur
vey
repr
esen
t sp
ecia
list
bond
por
tfol
ios
wit
h A
LBI
as t
heir
ben
chm
ark
and
have
an
effe
ctiv
e m
odifi
ed d
urat
ion
man
date
of
+/-
2
year
s ar
ound
the
ALB
I
PORTF
OLI
ON
AME
RIS
KVSR
ETU
RN(Calcu
latedon
3yea
rpe
rforman
ceretur
nsforthe
perioden
ding
31D
ecem
ber2011)
3Yea
rsR
etur
n(p
.a.)
Ran
kRisk(Volatility)
Ran
kRetur
n/R
isk
Ran
kActiveRetur
nRan
kTrac
king
Error
Inform
ationRatio
Ran
k
SPECIA
LISTBONDS
Arg
on D
omes
tic
Cor
e B
ond
6.3
5%
18
5.9
1%
18
1.0
81
8-1
.04
%1
81
.31
%-0
.79
18
Cad
iz C
ore
Bon
d8
.00
%1
65
.35
%9
1.5
01
50
.61
%1
60
.52
%1
.17
13
Cor
onat
ion
Act
ive
Bon
d P
ortf
olio
(C
ompo
site
)8
.37
%1
15
.49
%1
41
.53
14
0.9
8%
11
0.5
5%
1.7
78
Cor
onat
ion
Str
ateg
ic B
ond
Com
posi
te8
.88
%6
5.4
1%
11
1.6
49
1.4
8%
60
.66
%2
.25
4
Futu
regr
owth
Cor
e B
ond
Com
posi
te8
.27
%1
45
.34
%8
1.5
51
20
.88
%1
40
.50
%1
.76
9
Futu
regr
owth
Yie
ld E
nhan
ced
10
.02
%1
4.8
9%
42
.05
22
.63
%1
1.4
2%
1.8
57
Inve
stec
Dyn
amic
Bon
d P
ortf
olio
7.8
7%
17
5.4
3%
12
1.4
51
70
.48
%1
70
.47
%1
.02
16
Inve
stm
ent
Sol
utio
ns P
ure
Fixe
d In
tere
st P
ortf
olio
8.3
4%
12
5.0
7%
51
.65
80
.95
%1
20
.63
%1
.51
11
JM B
US
HA
Bon
dPlu
s8
.15
%1
54
.67
%3
1.7
44
0.7
5%
15
1.2
1%
0.6
21
7
Mom
entu
m A
M B
ond
Fund
8.9
1%
55
.15
%7
1.7
35
1.5
1%
50
.63
%2
.39
3
Mom
entu
m M
oder
ate
Bon
d FO
F8
.97
%4
5.3
7%
10
1.6
76
1.5
8%
41
.40
%1
.13
15
Pan
Afr
ica
AM
Seg
rega
ted
Dom
esti
c B
ond
8.6
1%
95
.60
%1
61
.54
13
1.2
2%
90
.56
%2
.16
6
Pre
scie
nt B
ond
Qua
nt8
.44
%1
05
.12
%6
1.6
57
1.0
5%
10
0.6
2%
1.6
91
0
Pre
scie
nt B
ond
Qua
ntP
lus
9.1
3%
24
.28
%1
2.1
31
1.7
3%
21
.52
%1
.14
14
Pru
dent
ial Y
ield
Enh
ance
d P
ortf
olio
9.0
7%
35
.57
%1
51
.63
10
1.6
7%
30
.58
%2
.87
1
SIM
Ins
titu
tion
al T
otal
Ret
urn
Bon
d Fu
nd
8.3
2%
13
5.6
9%
17
1.4
61
60
.93
%1
30
.42
%2
.24
5
Sta
nlib
Cor
e B
ond
Por
tfol
io8
.68
%8
5.4
7%
13
1.5
91
11
.28
%8
0.5
2%
2.4
52
SYm
mE
TRY
Bon
d P
ortf
olio
8.8
8%
74
.66
%2
1.9
03
1.4
8%
71
.12
%1
.33
12
RIS
KS
TATI
STI
CS
Hig
hest
10
.02
%5
.91
%2
.13
2.6
3%
1.5
2%
2.8
7
Upp
er Q
uart
ile8
.90
%5
.49
%1
.71
1.5
0%
1.1
9%
2.2
2
Med
ian
8.5
3%
5.3
6%
1.6
31
.13
%0
.62
%1
.72
Ave
rage
8.5
2%
5.2
5%
1.6
41
.12
%0
.81
%1
.59
Low
er Q
uart
ile8
.28
%5
.08
%1
.53
0.8
9%
0.5
3%
1.1
5
Low
est
6.3
5%
4.2
8%
1.0
8-1
.04
%0
.42
%-0
.79
All
Bon
d In
dex
7.3
9%
Num
ber
of P
arti
cipa
nts
18
18
18
18
18
18
SectIOn 3S.a. Bond Manager WatchtM Survey
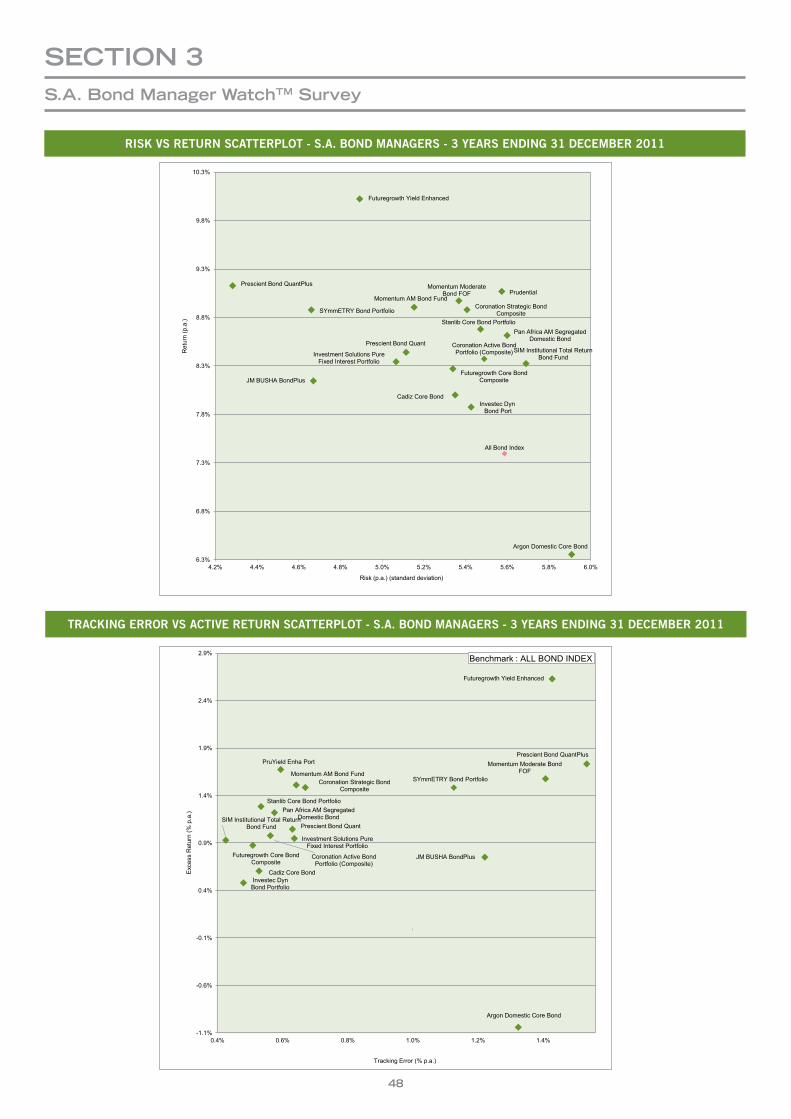
SectIOn 3S.a. Bond Manager WatchtM Survey
48
RISKVSRETURNSCATTERPLOT-S.A.BONDMANAGERS-3YEARSENDING31DECEMBER2011
TRACKINGERRORVSACTIVERETURNSCATTERPLOT-S.A.BONDMANAGERS-3YEARSENDING31DECEMBER2011
Momentum Moderate Bond FOF
Argon Domestic Core Bond
Cadiz Core Bond
Futuregrowth Yield Enhanced
Investec Dyn Bond Port
Investment Solutions Pure Fixed Interest Portfolio
Futuregrowth Core Bond Composite
Prescient Bond Quant
Prescient Bond QuantPlus Prudential
Pan Africa AM Segregated Domestic Bond
Momentum AM Bond Fund
SIM Institutional Total Return Bond Fund
Stanlib Core Bond Portfolio
All Bond Index
SYmmETRY Bond Portfolio
JM BUSHA BondPlus
Coronation Active Bond Portfolio (Composite)
Coronation Strategic Bond Composite
6.3%
6.8%
7.3%
7.8%
8.3%
8.8%
9.3%
9.8%
10.3%
4.2% 4.4% 4.6% 4.8% 5.0% 5.2% 5.4% 5.6% 5.8% 6.0%
Ret
urn
(p.a
.)
Risk (p.a.) (standard deviation)
Risk vs Return Scatterplot - SA Bond Managers Bond 3 Years ended 31 December 2011
Cadiz Core Bond
Futuregrowth Yield Enhanced
Investec Dyn Bond Portfolio
Investment Solutions Pure Fixed Interest Portfolio
Momentum Moderate Bond FOF
Futuregrowth Core Bond Composite
Prescient Bond Quant
Prescient Bond QuantPlus PruYield Enha Port
Pan Africa AM Segregated Domestic Bond
Momentum AM Bond Fund
SIM Institutional Total Return Bond Fund
Stanlib Core Bond Portfolio
Argon Domestic Core Bond
SYmmETRY Bond Portfolio
JM BUSHA BondPlus Coronation Active Bond Portfolio (Composite)
Coronation Strategic Bond Composite
-1.1%
-0.6%
-0.1%
0.4%
0.9%
1.4%
1.9%
2.4%
2.9%
0.4% 0.6% 0.8% 1.0% 1.2% 1.4%
Exce
ss R
etur
n (%
p.a
.)
Tracking Error (% p.a.)
Excess return vs Tracking Error Scatterplot - SA Bond Managers 3 Years ended 31 December 2011
Benchmark : ALL BOND INDEX
Momentum Moderate Bond FOF
Argon Domestic Core Bond
Cadiz Core Bond
Futuregrowth Yield Enhanced
Investec Dyn Bond Port
Investment Solutions Pure Fixed Interest Portfolio
Futuregrowth Core Bond Composite
Prescient Bond Quant
Prescient Bond QuantPlus Prudential
Pan Africa AM Segregated Domestic Bond
Momentum AM Bond Fund
SIM Institutional Total Return Bond Fund
Stanlib Core Bond Portfolio
All Bond Index
SYmmETRY Bond Portfolio
JM BUSHA BondPlus
Coronation Active Bond Portfolio (Composite)
Coronation Strategic Bond Composite
6.3%
6.8%
7.3%
7.8%
8.3%
8.8%
9.3%
9.8%
10.3%
4.2% 4.4% 4.6% 4.8% 5.0% 5.2% 5.4% 5.6% 5.8% 6.0%
Ret
urn
(p.a
.)
Risk (p.a.) (standard deviation)
Risk vs Return Scatterplot - SA Bond Managers Bond 3 Years ended 31 December 2011
Cadiz Core Bond
Futuregrowth Yield Enhanced
Investec Dyn Bond Portfolio
Investment Solutions Pure Fixed Interest Portfolio
Momentum Moderate Bond FOF
Futuregrowth Core Bond Composite
Prescient Bond Quant
Prescient Bond QuantPlus PruYield Enha Port
Pan Africa AM Segregated Domestic Bond
Momentum AM Bond Fund
SIM Institutional Total Return Bond Fund
Stanlib Core Bond Portfolio
Argon Domestic Core Bond
SYmmETRY Bond Portfolio
JM BUSHA BondPlus Coronation Active Bond Portfolio (Composite)
Coronation Strategic Bond Composite
-1.1%
-0.6%
-0.1%
0.4%
0.9%
1.4%
1.9%
2.4%
2.9%
0.4% 0.6% 0.8% 1.0% 1.2% 1.4%
Exce
ss R
etur
n (%
p.a
.)
Tracking Error (% p.a.)
Excess return vs Tracking Error Scatterplot - SA Bond Managers 3 Years ended 31 December 2011
Benchmark : ALL BOND INDEX
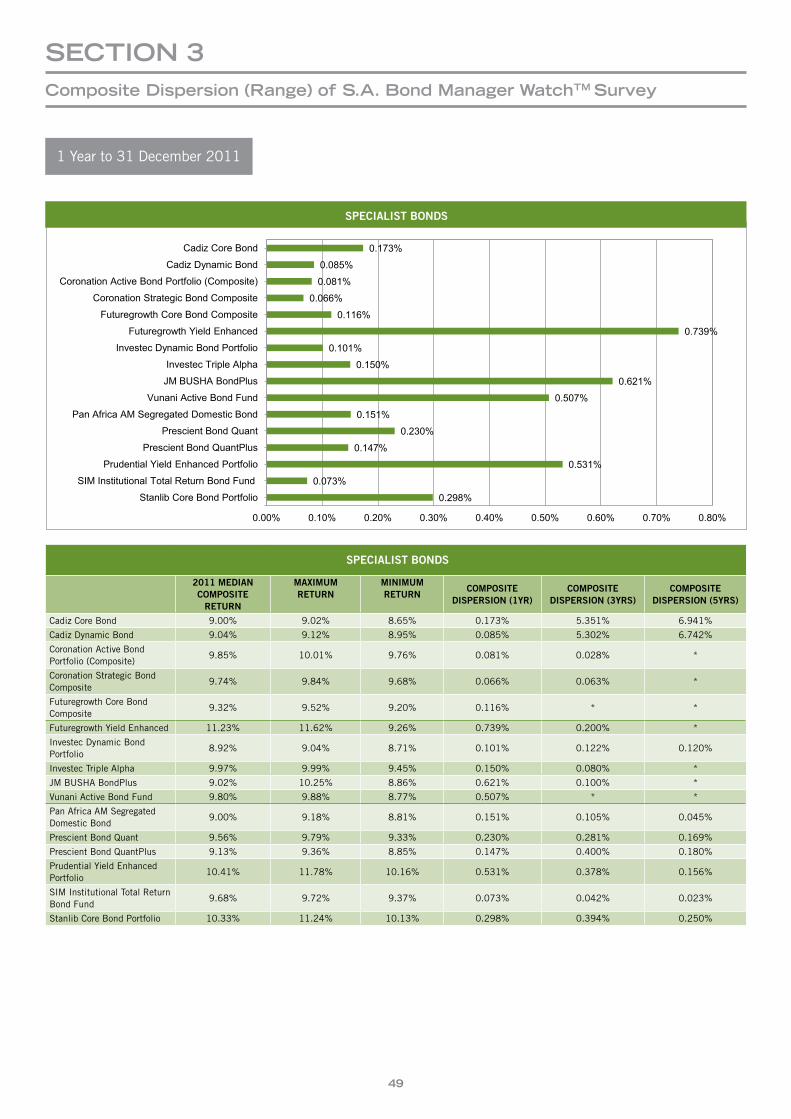
49
SectIOn 3composite Dispersion (range) of S.a. Bond Manager WatchtM Survey
0.173%
0.085%
0.081%
0.066%
0.116%
0.739%
0.101%
0.150%
0.621%
0.507%
0.151%
0.230%
0.147%
0.531%
0.073%
0.298%
0.00% 0.10% 0.20% 0.30% 0.40% 0.50% 0.60% 0.70% 0.80%
Cadiz Core Bond
Cadiz Dynamic Bond
Coronation Active Bond Portfolio (Composite)
Coronation Strategic Bond Composite
Futuregrowth Core Bond Composite
Futuregrowth Yield Enhanced
Investec Dynamic Bond Portfolio
Investec Triple Alpha
JM BUSHA BondPlus
Vunani Active Bond Fund
Pan Africa AM Segregated Domestic Bond
Prescient Bond Quant
Prescient Bond QuantPlus
Prudential Yield Enhanced Portfolio
SIM Institutional Total Return Bond Fund
Stanlib Core Bond Portfolio
Specialist Bonds SPECIALISTBONDS
SPECIALISTBONDS
2011MEDIANCOMPOSITERETURN
MAXIMUMRETURN
MINIMUMRETURN
COMPOSITEDISPERSION(1YR)
COMPOSITEDISPERSION(3YRS)
COMPOSITEDISPERSION(5YRS)
Cadiz Core Bond 9.00% 9.02% 8.65% 0.173% 5.351% 6.941%
Cadiz Dynamic Bond 9.04% 9.12% 8.95% 0.085% 5.302% 6.742%
Coronation Active Bond Portfolio (Composite)
9.85% 10.01% 9.76% 0.081% 0.028% *
Coronation Strategic Bond Composite
9.74% 9.84% 9.68% 0.066% 0.063% *
Futuregrowth Core Bond Composite
9.32% 9.52% 9.20% 0.116% * *
Futuregrowth Yield Enhanced 11.23% 11.62% 9.26% 0.739% 0.200% *
Investec Dynamic Bond Portfolio
8.92% 9.04% 8.71% 0.101% 0.122% 0.120%
Investec Triple Alpha 9.97% 9.99% 9.45% 0.150% 0.080% *
JM BUSHA BondPlus 9.02% 10.25% 8.86% 0.621% 0.100% *
Vunani Active Bond Fund 9.80% 9.88% 8.77% 0.507% * *
Pan Africa AM Segregated Domestic Bond
9.00% 9.18% 8.81% 0.151% 0.105% 0.045%
Prescient Bond Quant 9.56% 9.79% 9.33% 0.230% 0.281% 0.169%
Prescient Bond QuantPlus 9.13% 9.36% 8.85% 0.147% 0.400% 0.180%
Prudential Yield Enhanced Portfolio
10.41% 11.78% 10.16% 0.531% 0.378% 0.156%
SIM Institutional Total Return Bond Fund
9.68% 9.72% 9.37% 0.073% 0.042% 0.023%
Stanlib Core Bond Portfolio 10.33% 11.24% 10.13% 0.298% 0.394% 0.250%
1 Year to 31 December 2011
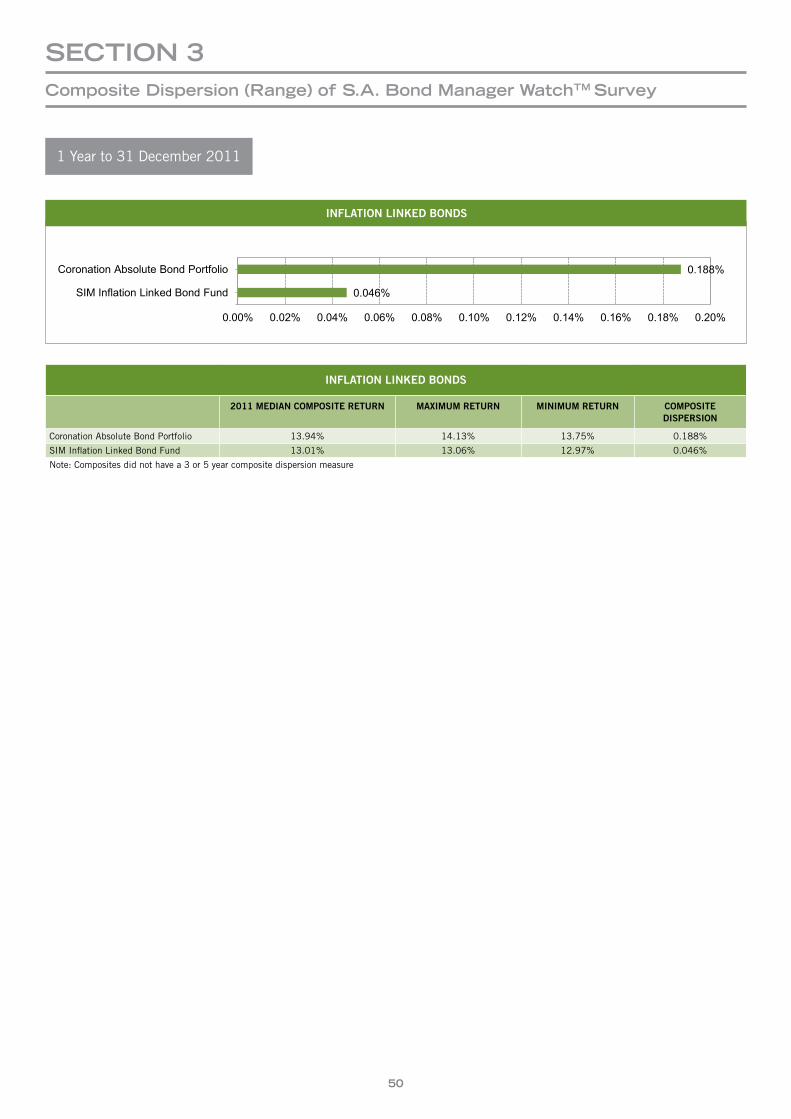
50
SectIOn 3composite Dispersion (range) of S.a. Bond Manager WatchtM Survey
1 Year to 31 December 2011
0.188%
0.046%
0.00% 0.02% 0.04% 0.06% 0.08% 0.10% 0.12% 0.14% 0.16% 0.18% 0.20%
Coronation Absolute Bond Portfolio
SIM Inflation Linked Bond Fund
Inflation Linked Bonds INFLATIONLINKEDBONDS
INFLATIONLINKEDBONDS
2011MEDIANCOMPOSITERETURN MAXIMUMRETURN MINIMUMRETURN COMPOSITEDISPERSION
Coronation Absolute Bond Portfolio 13.94% 14.13% 13.75% 0.188%
SIM Inflation Linked Bond Fund 13.01% 13.06% 12.97% 0.046%
Note: Composites did not have a 3 or 5 year composite dispersion measure
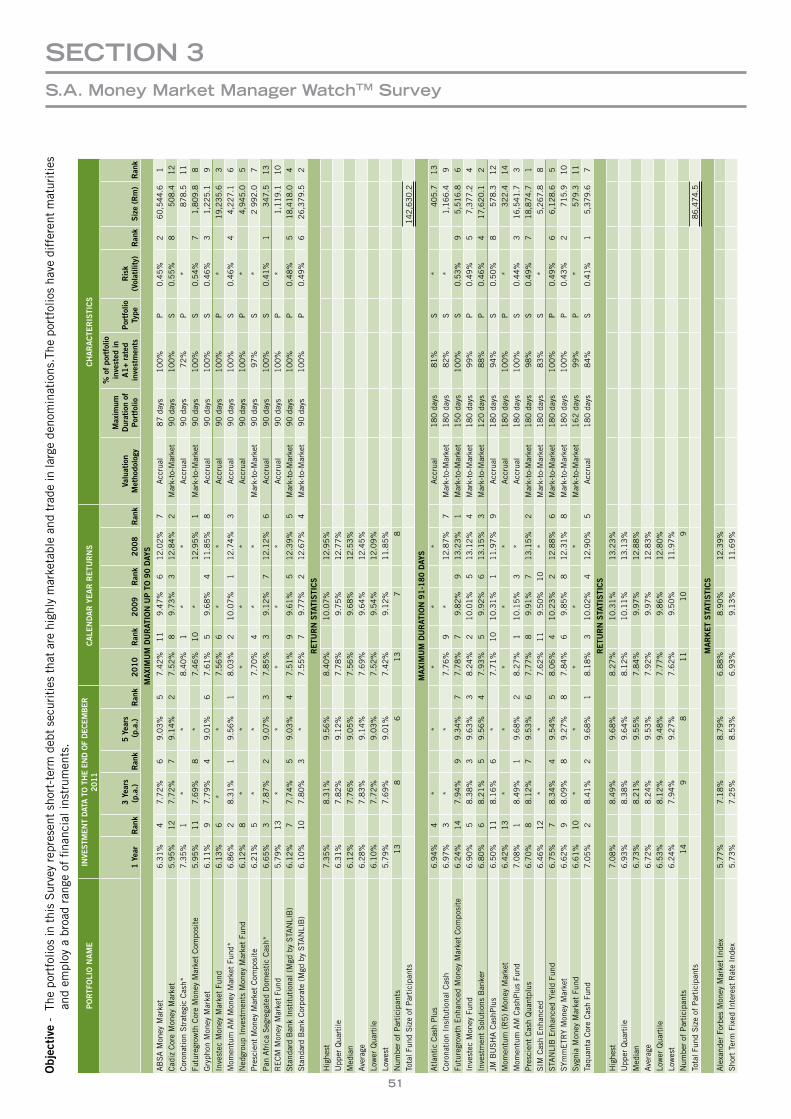
51
Objec
tive
- T
he p
ortf
olio
s in
thi
s S
urve
y re
pres
ent
shor
t-te
rm d
ebt
secu
riti
es t
hat
are
high
ly m
arke
tabl
e an
d tr
ade
in la
rge
deno
min
atio
ns.T
he p
ortf
olio
s ha
ve d
iffe
rent
mat
urit
ies
an
d em
ploy
a b
road
ran
ge o
f fin
anci
al in
stru
men
ts.
PORTF
OLI
ON
AME
INVE
STMEN
TDAT
ATO
THEEN
DO
FDEC
EMBER
20
11CALE
NDARYEARR
ETU
RNS
CHARACTE
RIS
TICS
1Yea
rRan
k3
Yea
rs
(p.a.)
Ran
k5Yea
rs
(p.a.)
Ran
k2010
Ran
k2009
Ran
k2008
Ran
kVa
luation
Metho
dology
Max
imum
Dur
ationof
Portfolio
%ofpo
rtfolio
inve
sted
in
A1+
rated
inve
stmen
tsPortfolio
Type
Risk
(Volatility)
Ran
kSize(R
m)
Ran
k
MAXI
MUMD
URAT
IONU
PTO9
0D
AYS
AB
SA
Mon
ey M
arke
t6
.31
%4
7.7
2%
69
.03
%5
7.4
2%
11
9.4
7%
61
2.0
2%
7A
ccru
al8
7 d
ays
10
0%
P0
.45
%2
60
,54
4.6
1C
adiz
Cor
e M
oney
Mar
ket
5.9
5%
12
7.7
2%
79
.14
%2
7.5
2%
89
.73
%3
12
.84
%2
Mar
k-to
-Mar
ket
90
day
s 1
00
%S
0.5
5%
85
08
.41
2C
oron
atio
n S
trat
egic
Cas
h*7
.35
%1
**
8.4
0%
1*
*A
ccru
al9
0 d
ays
72
%P
*8
78
.51
1Fu
ture
grow
th C
ore
Mon
ey M
arke
t C
ompo
site
5.9
5%
11
7.6
9%
8*
7.4
6%
10
*1
2.9
5%
1M
ark-
to-M
arke
t9
0 d
ays
10
0%
S0
.54
%7
1,8
09
.88
Gry
phon
Mon
ey M
arke
t6
.11
%9
7.7
9%
49
.01
%6
7.6
1%
59
.68
%4
11
.85
%8
Acc
rual
90
day
s 1
00
%S
0.4
6%
31
,22
5.1
9In
vest
ec M
oney
Mar
ket
Fund
6.1
3%
6*
*7
.56
%6
**
Acc
rual
90
day
s 1
00
%P
*1
9,2
35
.63
Mom
entu
m A
M M
oney
Mar
ket
Fund
*6
.86
%2
8.3
1%
19
.56
%1
8.0
3%
21
0.0
7%
11
2.7
4%
3A
ccru
al9
0 d
ays
10
0%
S0
.46
%4
4,2
27
.16
Ned
grou
p In
vest
men
ts M
oney
Mar
ket
Fund
6.1
2%
8*
**
**
Acc
rual
90
day
s 1
00
%P
*4
,94
5.0
5P
resc
ient
Mon
ey M
arke
t C
ompo
site
6.2
1%
5*
*7
.70
%4
**
Mar
k-to
-Mar
ket
90
day
s 9
7%
S*
2 9
92
.07
Pan
Afr
ica
Seg
rega
ted
Dom
esti
c C
ash*
6.6
5%
37
.87
%2
9.0
7%
37
.85
%3
9.1
2%
71
2.1
2%
6A
ccru
al9
0 d
ays
10
0%
S0
.41
%1
34
7.5
13
RE
CM
Mon
ey M
arke
t Fu
nd5
.79
%1
3*
**
**
Acc
rual
90
day
s 1
00
%P
*1
,11
9.1
10
Sta
ndar
d B
ank
Inst
itut
iona
l (M
gd b
y S
TAN
LIB
)6
.12
%7
7.7
4%
59
.03
%4
7.5
1%
99
.61
%5
12
.39
%5
Mar
k-to
-Mar
ket
90
day
s1
00
%P
0.4
8%
51
8,4
18
.04
Sta
ndar
d B
ank
Cor
pora
te (
Mgd
by
STA
NLI
B)
6.1
0%
10
7.8
0%
3*
7.5
5%
79
.77
%2
12
.67
%4
Mar
k-to
-Mar
ket
90
day
s1
00
%P
0.4
9%
62
6,3
79
.52
RETU
RNS
TATI
STI
CS
Hig
hest
7.3
5%
8.3
1%
9.5
6%
8.4
0%
10
.07
%1
2.9
5%
Upp
er Q
uart
ile6
.31
%7
.82
%9
.12
%7
.78
%9
.75
%1
2.7
7%
Med
ian
6.1
2%
7.7
6%
9.0
5%
7.5
6%
9.6
8%
12
.53
%Ave
rage
6.2
8%
7.8
3%
9.1
4%
7.6
9%
9.6
4%
12
.45
%Lo
wer
Qua
rtile
6.1
0%
7.7
2%
9.0
3%
7.5
2%
9.5
4%
12
.09
%Lo
wes
t5
.79
%7
.69
%9
.01
%7
.42
%9
.12
%1
1.8
5%
Num
ber
of P
arti
cipa
nts
13
86
13
78
Tota
l Fun
d S
ize
of P
arti
cipa
nts
14
2,6
30
.2
MAXI
MUMD
URAT
ION9
1-1
80D
AYS
Atl
anti
c C
ash
Plu
s6
.94
%4
**
**
*A
ccru
al 1
80
day
s 8
1%
S*
40
5.7
13
Cor
onat
ion
Insi
tuti
onal
Cas
h6
.97
%3
**
7.7
6%
9*
12
.87
%7
Mar
k-to
-Mar
ket
18
0 d
ays
82
%S
*1
,16
6.4
9Fu
ture
grow
th E
nhan
ced
Mon
ey M
arke
t C
ompo
site
6.2
4%
14
7.9
4%
99
.34
%7
7.7
8%
79
.82
%9
13
.23
%1
Mar
k-to
-Mar
ket
15
0 d
ays
1
00
%S
0.5
3%
95
,51
6.8
6In
vest
ec M
oney
Fun
d6
.90
%5
8.3
8%
39
.63
%3
8.2
4%
21
0.0
1%
51
3.1
2%
4M
ark-
to-M
arke
t 1
80
day
s
99
%P
0.4
9%
57
,37
7.2
4In
vest
men
t S
olut
ions
Ban
ker
6.8
0%
68
.21
%5
9.5
6%
47
.93
%5
9.9
2%
61
3.1
5%
3M
ark-
to-M
arke
t 1
20
day
s 8
8%
P0
.46
%4
17
,62
0.1
2JM
BU
SH
A C
ashP
lus
6.5
0%
11
8.1
6%
6*
7.7
1%
10
10
.31
%1
11
.97
%9
Acc
rual
18
0 d
ays
94
%S
0.5
0%
85
78
.31
2M
omen
tum
(R
5)
Mon
ey M
arke
t6
.42
%1
3*
**
**
Acc
rual
18
0 d
ays
10
0%
P*
32
2.4
14
Mom
entu
m A
M C
ashP
lus
Fund
7.0
8%
18
.49
%1
9.6
8%
28
.27
%1
10
.15
%3
*A
ccru
al 1
80
day
s
10
0%
S0
.44
%3
16
,54
1.7
3P
resc
ient
Cas
h Q
uant
plus
6.7
0%
88
.12
%7
9.5
3%
67
.77
%8
9.9
1%
71
3.1
5%
2M
ark-
to-M
arke
t 1
80
day
s 9
8%
S0
.49
%7
18
,87
4.7
1S
IM C
ash
Enh
ance
d6
.46
%1
2*
*7
.62
%1
19
.50
%1
0*
Mar
k-to
-Mar
ket
18
0 d
ays
83
%S
*5
,26
7.8
8S
TAN
LIB
Enh
ance
d Yi
eld
Fund
6.7
5%
78
.34
%4
9.5
4%
58
.06
%4
10
.23
%2
12
.88
%6
Mar
k-to
-Mar
ket
18
0 d
ays
1
00
%P
0.4
9%
66
,12
8.6
5S
Ymm
ETR
Y M
oney
Mar
ket
6.6
2%
98
.09
%8
9.2
7%
87
.84
%6
9.8
5%
81
2.3
1%
8M
ark-
to-M
arke
t 1
80
day
s
10
0%
P0
.43
%2
71
5.9
10
Syg
nia
Mon
ey M
arke
t Fu
nd6
.61
%1
0*
**
**
Mar
k-to
-Mar
ket
16
2 d
ays
99
%P
*5
79
.31
1Ta
quan
ta C
ore
Cas
h Fu
nd7
.05
%2
8.4
1%
29
.68
%1
8.1
8%
31
0.0
2%
41
2.9
0%
5A
ccru
al 1
80
day
s
84
%S
0.4
1%
15
,37
9.6
7
RETU
RNS
TATI
STI
CS
Hig
hest
7.0
8%
8.4
9%
9.6
8%
8.2
7%
10
.31
%1
3.2
3%
Upp
er Q
uart
ile6
.93
%8
.38
%9
.64
%8
.12
%1
0.1
1%
13
.13
%M
edia
n6
.73
%8
.21
%9
.55
%7
.84
%9
.97
%1
2.8
8%
Ave
rage
6.7
2%
8.2
4%
9.5
3%
7.9
2%
9.9
7%
12
.83
%Lo
wer
Qua
rtile
6.5
3%
8.1
2%
9.4
8%
7.7
7%
9.8
6%
12
.80
%Lo
wes
t6
.24
%7
.94
%9
.27
%7
.62
%9
.50
%1
1.9
7%
Num
ber
of P
arti
cipa
nts
14
98
11
10
9To
tal F
und
Siz
e of
Par
tici
pant
s8
6,4
74
.5
MARKETSTA
TISTI
CS
Ale
xand
er F
orbe
s M
oney
Mar
ket
Inde
x5
.77
%7
.18
%8
.79
%6
.88
%8
.90
%1
2.3
9%
Sho
rt T
erm
Fix
ed I
nter
est
Rat
e In
dex
5.7
3%
7.2
5%
8.5
3%
6.9
3%
9.1
3%
11
.69
%
SectIOn 3S.a. Money Market Manager WatchtM Survey
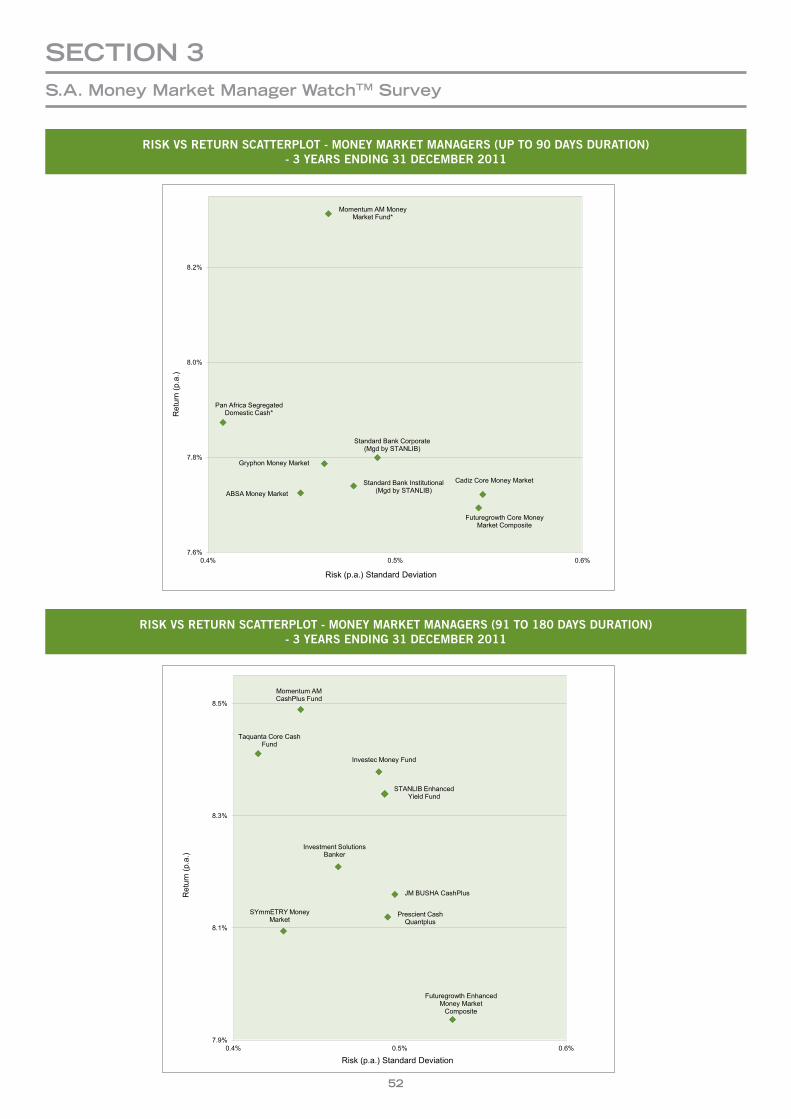
52
SectIOn 3S.a. Money Market Manager WatchtM Survey
RISKVSRETURNSCATTERPLOT-MONEYMARKETMANAGERS(91TO180DAYSDURATION)-3YEARSENDING31DECEMBER2011
RISKVSRETURNSCATTERPLOT-MONEYMARKETMANAGERS(UPTO90DAYSDURATION)-3YEARSENDING31DECEMBER2011
Ret
urn
(p.a
.)R
etur
n (p
.a.)
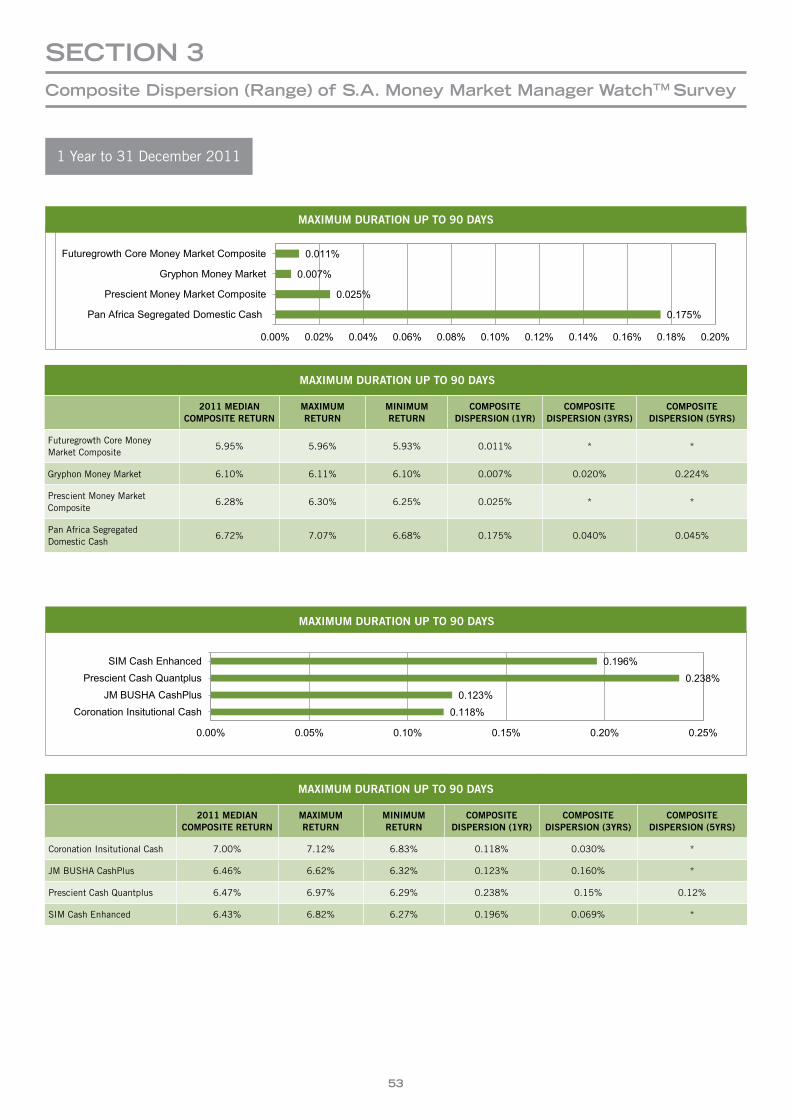
53
SectIOn 3composite Dispersion (range) of S.a. Money Market Manager WatchtM Survey
1 Year to 31 December 2011
0.011%
0.007%
0.025%
0.175%
0.00% 0.02% 0.04% 0.06% 0.08% 0.10% 0.12% 0.14% 0.16% 0.18% 0.20%
Futuregrowth Core Money Market Composite
Gryphon Money Market
Prescient Money Market Composite
Pan Africa Segregated Domestic Cash
Maximum Duration Up To 90 Days
0.118% 0.123%
0.238% 0.196%
0.00% 0.05% 0.10% 0.15% 0.20% 0.25%
Coronation Insitutional Cash JM BUSHA CashPlus
Prescient Cash Quantplus SIM Cash Enhanced
Maximum Duration 91-180 Days
MAXIMUMDURATIONUPTO90DAYS
MAXIMUMDURATIONUPTO90DAYS
MAXIMUMDURATIONUPTO90DAYS
2011MEDIANCOMPOSITERETURN
MAXIMUMRETURN
MINIMUMRETURN
COMPOSITEDISPERSION(1YR)
COMPOSITEDISPERSION(3YRS)
COMPOSITEDISPERSION(5YRS)
Futuregrowth Core Money Market Composite
5.95% 5.96% 5.93% 0.011% * *
Gryphon Money Market 6.10% 6.11% 6.10% 0.007% 0.020% 0.224%
Prescient Money Market Composite
6.28% 6.30% 6.25% 0.025% * *
Pan Africa Segregated Domestic Cash
6.72% 7.07% 6.68% 0.175% 0.040% 0.045%
MAXIMUMDURATIONUPTO90DAYS
2011MEDIANCOMPOSITERETURN
MAXIMUMRETURN
MINIMUMRETURN
COMPOSITEDISPERSION(1YR)
COMPOSITEDISPERSION(3YRS)
COMPOSITEDISPERSION(5YRS)
Coronation Insitutional Cash 7.00% 7.12% 6.83% 0.118% 0.030% *
JM BUSHA CashPlus 6.46% 6.62% 6.32% 0.123% 0.160% *
Prescient Cash Quantplus 6.47% 6.97% 6.29% 0.238% 0.15% 0.12%
SIM Cash Enhanced 6.43% 6.82% 6.27% 0.196% 0.069% *
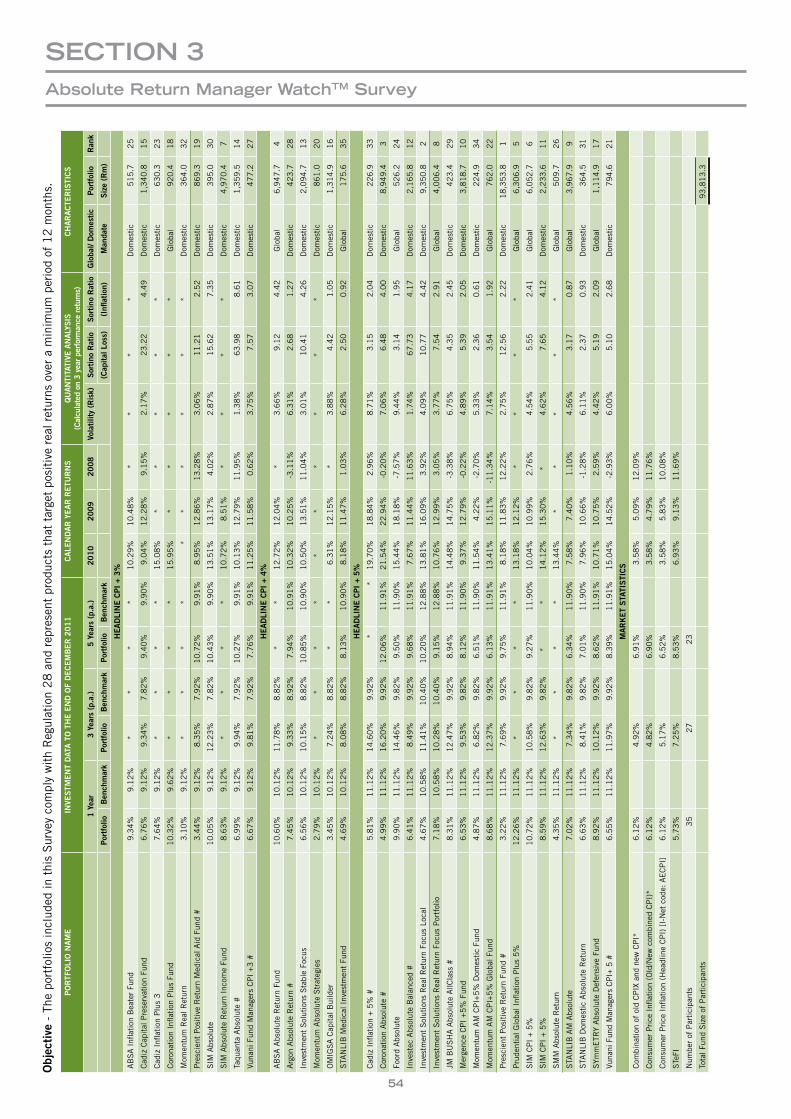
54
Objec
tive
- T
he p
ortf
olio
s in
clud
ed in
thi
s S
urve
y co
mpl
y w
ith
Reg
ulat
ion
28
and
rep
rese
nt p
rodu
cts
that
tar
get
posi
tive
rea
l ret
urns
ove
r a
min
imum
per
iod
of 1
2 m
onth
s.
PORTF
OLI
ON
AME
INVE
STM
ENTDAT
ATOTHEE
NDO
FDECEMBER2
011
CALE
NDARYEARR
ETU
RNS
QUAN
TITA
TIVE
ANAL
YSIS
(C
alcu
latedon
3yea
rperform
ance
returns)
CHARACTE
RIS
TICS
1Yea
r3Yea
rs(p.a.)
5Yea
rs(p.a.)
2010
2009
2008
Volatilit
y(R
isk)
Sortino
Ratio
Sortino
Ratio
Globa
l/Dom
estic
Portfolio
Ran
k
Portfolio
Ben
chmark
Portfolio
Ben
chmark
Portfolio
Ben
chmark
(Cap
italLos
s)(Infl
ation)
Man
date
Size(R
m)
HEADLI
NEC
PI+
3%
AB
SA
Infl
atio
n B
eate
r Fu
nd9
.34
%9
.12
%*
**
*1
0.2
9%
10
.48
%*
**
*D
omes
tic
51
5.7
25
Cad
iz C
apit
al P
rese
rvat
ion
Fund
6.7
6%
9.1
2%
9.3
4%
7.8
2%
9.4
0%
9.9
0%
9.0
4%
12
.28
%9
.15
%2
.17
%2
3.2
24
.49
Dom
esti
c1
,34
0.8
15
Cad
iz I
nflat
ion
Plu
s 3
7.6
4%
9.1
2%
**
**
15
.08
%*
**
**
Dom
esti
c6
30
.32
3
Cor
onat
ion
Infla
tion
Plu
s Fu
nd1
0.3
2%
9.6
2%
**
**
15
.95
%*
**
**
Glo
bal
92
0.4
18
Mom
entu
m R
eal R
etur
n 3
.10
%9
.12
%*
**
**
**
**
*D
omes
tic
36
4.0
32
Pre
scie
nt P
osit
ive
Ret
urn
Med
ical
Aid
Fun
d #
3.4
4%
9.1
2%
8.3
5%
7.9
2%
10
.72
%9
.91
%8
.95
%1
2.8
6%
13
.28
%3
.06
%1
1.2
12
.52
Dom
esti
c8
69
.31
9
SIM
Abs
olut
e1
0.0
5%
9.1
2%
12
.23
%7
.82
%1
0.4
3%
9.9
0%
13
.51
%1
3.1
7%
4.0
2%
2.8
7%
15
.62
7.3
5D
omes
tic
39
5.0
30
SIM
Abs
olut
e R
etur
n In
com
e Fu
nd8
.63
%9
.12
%*
**
*1
0.7
2%
8.5
1%
**
**
Dom
esti
c4
,97
0.4
7
Taqu
anta
Abs
olut
e #
6.9
9%
9.1
2%
9.9
4%
7.9
2%
10
.27
%9
.91
%1
0.1
3%
12
.79
%1
1.9
5%
1.3
8%
63
.98
8.6
1D
omes
tic
1,3
59
.51
4
Vuna
ni F
und
Man
ager
s C
PI
+3
#6
.67
%9
.12
%9
.81
%7
.92
%7
.76
%9
.91
%1
1.2
5%
11
.58
%0
.62
%3
.75
%7
.57
3.0
7D
omes
tic
47
7.2
27
HEADLI
NEC
PI+
4%
AB
SA
Abs
olut
e R
etur
n Fu
nd1
0.6
0%
10
.12
%1
1.7
8%
8.8
2%
**
12
.72
%1
2.0
4%
*3
.66
%9
.12
4.4
2G
loba
l6
,94
7.7
4
Arg
on A
bsol
ute
Ret
urn
#7
.45
%1
0.1
2%
9.3
3%
8.9
2%
7.9
4%
10
.91
%1
0.3
2%
10
.25
%-3
.11
%6
.31
%2
.68
1.2
7D
omes
tic
42
3.7
28
Inve
stm
ent
Sol
utio
ns S
tabl
e Fo
cus
6.5
6%
10
.12
%1
0.1
5%
8.8
2%
10
.85
%1
0.9
0%
10
.50
%1
3.5
1%
11
.04
%3
.01
%1
0.4
14
.26
Dom
esti
c2
,09
4.7
13
Mom
entu
m A
bsol
ute
Str
ateg
ies
2.7
9%
10
.12
%*
**
**
**
**
*D
omes
tic
86
1.0
20
OM
IGS
A C
apit
al B
uild
er3
.45
%1
0.1
2%
7.2
4%
8.8
2%
**
6.3
1%
12
.15
%*
3.8
8%
4.4
21
.05
Dom
esti
c1
,31
4.9
16
STA
NLI
B M
edic
al I
nves
tmen
t Fu
nd4
.69
%1
0.1
2%
8.0
8%
8.8
2%
8.1
3%
10
.90
%8
.18
%1
1.4
7%
1.0
3%
6.2
8%
2.5
00
.92
Glo
bal
17
5.6
35
HEADLI
NEC
PI+
5%
Cad
iz I
nflat
ion
+ 5
% #
5.8
1%
11
.12
%1
4.6
0%
9.9
2%
**
19
.70
%1
8.8
4%
2.9
6%
8.7
1%
3.1
52
.04
Dom
esti
c2
26
.93
3
Cor
onat
ion
Abs
olut
e #
4.9
9%
11
.12
%1
6.2
0%
9.9
2%
12
.06
%1
1.9
1%
21
.54
%2
2.9
4%
-0.2
0%
7.0
6%
6.4
84
.00
Dom
esti
c8
,94
9.4
3
Foor
d A
bsol
ute
9.9
0%
11
.12
%1
4.4
6%
9.8
2%
9.5
0%
11
.90
%1
5.4
4%
18
.18
%-7
.57
%9
.44
%3
.14
1.9
5G
loba
l5
26
.22
4
Inve
stec
Abs
olut
e B
alan
ced
#6
.41
%1
1.1
2%
8.4
9%
9.9
2%
9.6
8%
11
.91
%7
.67
%1
1.4
4%
11
.63
%1
.74
%6
7.7
34
.17
Dom
esti
c2
,16
5.8
12
Inve
stm
ent
Sol
utio
ns R
eal R
etur
n Fo
cus
Loca
l4
.67
%1
0.5
8%
11
.41
%1
0.4
0%
10
.20
%1
2.8
8%
13
.81
%1
6.0
9%
3.9
2%
4.0
9%
10
.77
4.4
2D
omes
tic
9,3
50
.82
Inve
stm
ent
Sol
utio
ns R
eal R
etur
n Fo
cus
Por
tfol
io7
.18
%1
0.5
8%
10
.28
%1
0.4
0%
9.1
5%
12
.88
%1
0.7
6%
12
.99
%3
.05
%3
.77
%7
.54
2.9
1G
loba
l 4
,00
6.4
8
JM B
US
HA
Abs
olut
e A
llCla
ss #
8.3
1%
11
.12
%1
2.4
7%
9.9
2%
8.9
4%
11
.91
%1
4.4
8%
14
.75
%-3
.38
%6
.75
%4
.35
2.4
5D
omes
tic
42
3.4
29
Mer
genc
e C
PI
+5
% F
und
6.5
3%
11
.12
%9
.53
%9
.82
%8
.12
%1
1.9
0%
9.3
7%
12
.79
%-0
.22
%4
.89
%5
.39
2.0
5D
omes
tic
3,8
18
.71
0
Mom
entu
m A
M C
PI+
5%
Dom
esti
c Fu
nd4
.87
%1
1.1
2%
6.8
2%
9.8
2%
6.5
1%
11
.90
%1
1.5
4%
4.2
2%
-2.7
0%
5.3
3%
2.3
60
.61
Dom
esti
c2
24
.93
4
Mom
entu
m A
M C
PI+
5%
Glo
bal F
und
8.6
8%
11
.12
%1
2.3
7%
9.9
2%
6.1
3%
11
.91
%1
3.4
1%
15
.11
%-1
1.3
4%
7.1
4%
3.5
41
.92
Glo
bal
76
2.0
22
Pre
scie
nt P
osit
ive
Ret
urn
Fund
#3
.22
%1
1.1
2%
7.6
9%
9.9
2%
9.7
5%
11
.91
%8
.18
%1
1.8
3%
12
.22
%2
.75
%1
2.5
62
.22
Dom
esti
c1
8,3
53
.81
Pru
dent
ial G
loba
l Infl
atio
n P
lus
5%
12
.26
%1
1.1
2%
**
**
13
.18
%1
2.1
2%
**
**
Glo
bal
6,3
06
.95
SIM
CP
I + 5
%1
0.7
2%
11
.12
%1
0.5
8%
9.8
2%
9.2
7%
11
.90
%1
0.0
4%
10
.99
%2
.76
%4
.54
%5
.55
2.4
1G
loba
l6
,05
2.7
6
SIM
CP
I + 5
%8
.59
%1
1.1
2%
12
.63
%9
.82
%*
*1
4.1
2%
15
.30
%*
4.6
2%
7.6
54
.12
Dom
esti
c2
,23
3.6
11
SM
M A
bsol
ute
Ret
urn
4.3
5%
11
.12
%*
**
*1
3.4
4%
**
**
*G
loba
l5
09
.72
6
STA
NLI
B A
M A
bsol
ute
7.0
2%
11
.12
%7
.34
%9
.82
%6
.34
%1
1.9
0%
7.5
8%
7.4
0%
1.1
0%
4.5
6%
3.1
70
.87
Glo
bal
3,9
67
.99
STA
NLI
B D
omes
tic
Abs
olut
e R
etur
n6
.63
%1
1.1
2%
8.4
1%
9.8
2%
7.0
1%
11
.90
%7
.96
%1
0.6
6%
-1.2
8%
6.1
1%
2.3
70
.93
Dom
esti
c3
64
.53
1
SYm
mE
TRY
Abs
olut
e D
efen
sive
Fun
d8
.92
%1
1.1
2%
10
.12
%9
.92
%8
.62
%1
1.9
1%
10
.71
%1
0.7
5%
2.5
9%
4.4
2%
5.1
92
.09
Glo
bal
1,1
14
.91
7
Vuna
ni F
und
Man
ager
s C
PI+
5 #
6.5
5%
11
.12
%1
1.9
7%
9.9
2%
8.3
9%
11
.91
%1
5.0
4%
14
.52
%-2
.93
%6
.00
%5
.10
2.6
8D
omes
tic
79
4.6
21
MARKETSTA
TISTI
CS
Com
bina
tion
of
old
CP
IX a
nd n
ew C
PI*
6.1
2%
4.9
2%
6.9
1%
3.5
8%
5.0
9%
12
.09
%
Con
sum
er P
rice
Infl
atio
n (O
ld/N
ew c
ombi
ned
CP
I)*
6.1
2%
4.8
2%
6.9
0%
3.5
8%
4.7
9%
11
.76
%
Con
sum
er P
rice
Infl
atio
n (H
eadl
ine
CP
I) [
I-N
et c
ode:
AE
CP
I]6
.12
%5
.17
%6
.52
%3
.58
%5
.83
%1
0.0
8%
STe
FI5
.73
%7
.25
%8
.53
%6
.93
%9
.13
%1
1.6
9%
Num
ber
of P
arti
cipa
nts
35
27
23
Tota
l Fun
d S
ize
of P
arti
cipa
nts
93
,81
3.3
SectIOn 3absolute return Manager WatchtM Survey
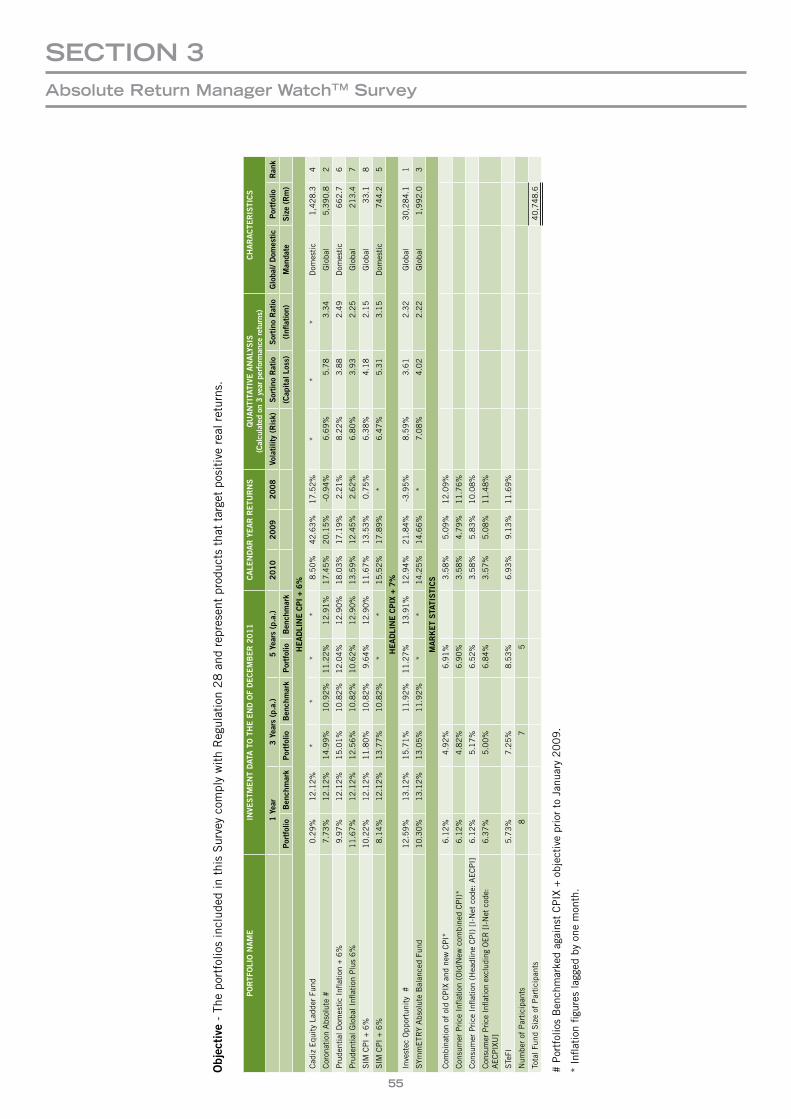
55
Objec
tive
- T
he p
ortf
olio
s in
clud
ed in
thi
s S
urve
y co
mpl
y w
ith
Reg
ulat
ion
28
and
rep
rese
nt p
rodu
cts
that
tar
get
posi
tive
rea
l ret
urns
.
PORTF
OLI
ON
AME
INVE
STM
ENTDAT
ATOTHEE
NDO
FDECEMBER2
011
CALE
NDARYEARR
ETU
RNS
QUANTI
TATI
VEA
NALY
SIS
(C
alcu
latedon
3yea
rperform
ance
returns)
CHARACTE
RIS
TICS
1Yea
r3Yea
rs(p.a.)
5Yea
rs(p.a.)
2010
2009
2008
Volatilit
y(R
isk)
Sortino
Ratio
Sortino
Ratio
Globa
l/Dom
estic
Portfolio
Ran
k
Portfolio
Ben
chmark
Portfolio
Ben
chmark
Portfolio
Ben
chmark
(Cap
italLos
s)(Infl
ation)
Man
date
Size(R
m)
HEADLI
NEC
PI+
6%
Cad
iz E
quit
y La
dder
Fun
d0
.29
%1
2.1
2%
**
**
8.5
0%
42
.63
%1
7.5
2%
**
*D
omes
tic
1,4
28
.34
Cor
onat
ion
Abs
olut
e #
7.7
3%
12
.12
%1
4.9
9%
10
.92
%1
1.2
2%
12
.91
%1
7.4
5%
20
.15
%-0
.94
%6
.69
%5
.78
3.3
4G
loba
l5
,39
0.8
2
Pru
dent
ial D
omes
tic
Infla
tion
+ 6
%
9.9
7%
12
.12
%1
5.0
1%
10
.82
%1
2.0
4%
12
.90
%1
8.0
3%
17
.19
%2
.21
%8
.22
%3
.88
2.4
9D
omes
tic
66
2.7
6
Pru
dent
ial G
loba
l Infl
atio
n P
lus
6%
1
1.6
7%
12
.12
%1
2.5
6%
10
.82
%1
0.6
2%
12
.90
%1
3.5
9%
12
.45
%2
.62
%6
.80
%3
.93
2.2
5G
loba
l 2
13
.47
SIM
CP
I + 6
%1
0.2
2%
12
.12
%1
1.8
0%
10
.82
%9
.64
%1
2.9
0%
11
.67
%1
3.5
3%
0.7
5%
6.3
8%
4.1
82
.15
Glo
bal
33
.18
SIM
CP
I + 6
%8
.14
%1
2.1
2%
13
.77
%1
0.8
2%
**
15
.52
%1
7.8
9%
*6
.47
%5
.31
3.1
5D
omes
tic
74
4.2
5
HEADLI
NEC
PIX
+7
%
Inve
stec
Opp
ortu
nity
#
12
.59
%1
3.1
2%
15
.71
%1
1.9
2%
11
.27
%1
3.9
1%
12
.94
%2
1.8
4%
-3.9
5%
8.5
9%
3.6
12
.32
Glo
bal
30
,28
4.1
1
SYm
mE
TRY
Abs
olut
e B
alan
ced
Fund
10
.30
%1
3.1
2%
13
.05
%1
1.9
2%
**
14
.25
%1
4.6
6%
*7
.08
%4
.02
2.2
2G
loba
l1
,99
2.0
3
MARKETSTA
TISTI
CS
Com
bina
tion
of
old
CP
IX a
nd n
ew C
PI*
6.1
2%
4.9
2%
6.9
1%
3.5
8%
5.0
9%
12
.09
%
Con
sum
er P
rice
Infl
atio
n (O
ld/N
ew c
ombi
ned
CP
I)*
6.1
2%
4.8
2%
6.9
0%
3.5
8%
4.7
9%
11
.76
%
Con
sum
er P
rice
Infl
atio
n (H
eadl
ine
CP
I) [
I-N
et c
ode:
AE
CP
I]6
.12
%5
.17
%6
.52
%3
.58
%5
.83
%1
0.0
8%
Con
sum
er P
rice
Infla
tion
excl
udin
g O
ER
[I-
Net
cod
e:
AECPIX
U]
6.3
7%
5.0
0%
6.8
4%
3.5
7%
5.0
8%
11
.48
%
STe
FI5
.73
%7
.25
%8
.53
%6
.93
%9
.13
%1
1.6
9%
Num
ber
of P
arti
cipa
nts
87
5
Tota
l Fun
d S
ize
of P
arti
cipa
nts
40
,74
8.6
# P
ortf
olio
s B
ench
mar
ked
agai
nst
CP
IX +
obj
ecti
ve p
rior
to
Janu
ary
20
09
.
* In
flati
on fi
gure
s la
gged
by
one
mon
th.
SectIOn 3absolute return Manager WatchtM Survey
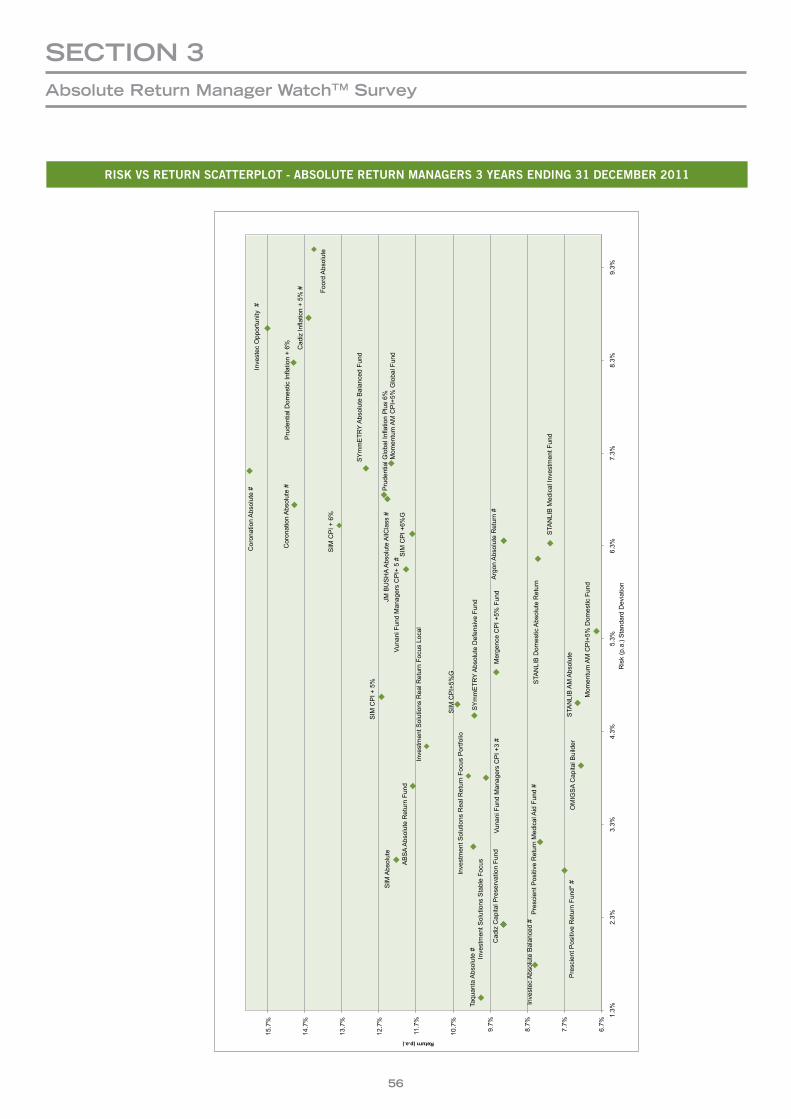
56
RISKVSRETURNSCATTERPLOT-ABSOLUTERETURNMANAGERS3YEARSENDING31DECEMBER2011
SectIOn 3absolute return Manager WatchtM Survey
Cad
iz C
apita
l Pre
serv
atio
n Fu
nd
SIM
Abs
olut
e
Vuna
ni F
und
Man
ager
s C
PI +
3 #
Pre
scie
nt P
ositi
ve R
etur
n M
edic
al A
id F
und
#
Taqu
anta
Abs
olut
e #
Inve
stm
ent S
olut
ions
Sta
ble
Focu
s
STA
NLI
B M
edic
al In
vest
men
t Fun
d
Foor
d A
bsol
ute
Mom
entu
m A
M C
PI+
5% D
omes
tic F
und
SIM
CP
I+5%
G
SIM
CP
I + 5
%
STA
NLI
B A
M A
bsol
ute
STA
NLI
B D
omes
tic A
bsol
ute
Ret
urn
Mer
genc
e C
PI +
5% F
und
Cor
onat
ion
Abs
olut
e #
Inve
stec
Abs
olut
e B
alan
ced
#
JM B
US
HA
Abs
olut
e A
llCla
ss #
Vu
nani
Fun
d M
anag
ers
CP
I+ 5
#
Pre
scie
nt P
ositi
ve R
etur
n Fu
nd*
#
Mom
entu
m A
M C
PI+
5% G
loba
l Fun
d
SY
mm
ETR
Y A
bsol
ute
Def
ensi
ve F
und
Pru
dent
ial D
omes
tic In
flatio
n +
6%
Pru
dent
ial G
loba
l Inf
latio
n P
lus
6%
Cor
onat
ion
Abs
olut
e #
Inve
stec
Opp
ortu
nity
#
SY
mm
ETR
Y A
bsol
ute
Bal
ance
d Fu
nd
SIM
CP
I +6%
G
SIM
CP
I + 6
%
Cad
iz In
flatio
n +
5% #
AB
SA
Abs
olut
e R
etur
n Fu
nd
Arg
on A
bsol
ute
Ret
urn
#
Inve
stm
ent S
olut
ions
Rea
l Ret
urn
Focu
s Lo
cal
Inve
stm
ent S
olut
ions
Rea
l Ret
urn
Focu
s P
ortfo
lio
OM
IGS
A C
apita
l Bui
lder
6.7%
7.7%
8.7%
9.7%
10.7
%
11.7
%
12.7
%
13.7
%
14.7
%
15.7
% 1.
3%
2.3%
3.
3%
4.3%
5.
3%
6.3%
7.
3%
8.3%
9.
3%
Ris
k (p
.a.)
Sta
ndar
d D
evia
tion
Ris
k vs
Ret
urn
Scat
terp
lot o
n A
bsol
ute
Ret
urn
Man
ager
s
for t
he 3
Yea
rs e
nded
Dec
embe
r 201
1
Return (p.a.)
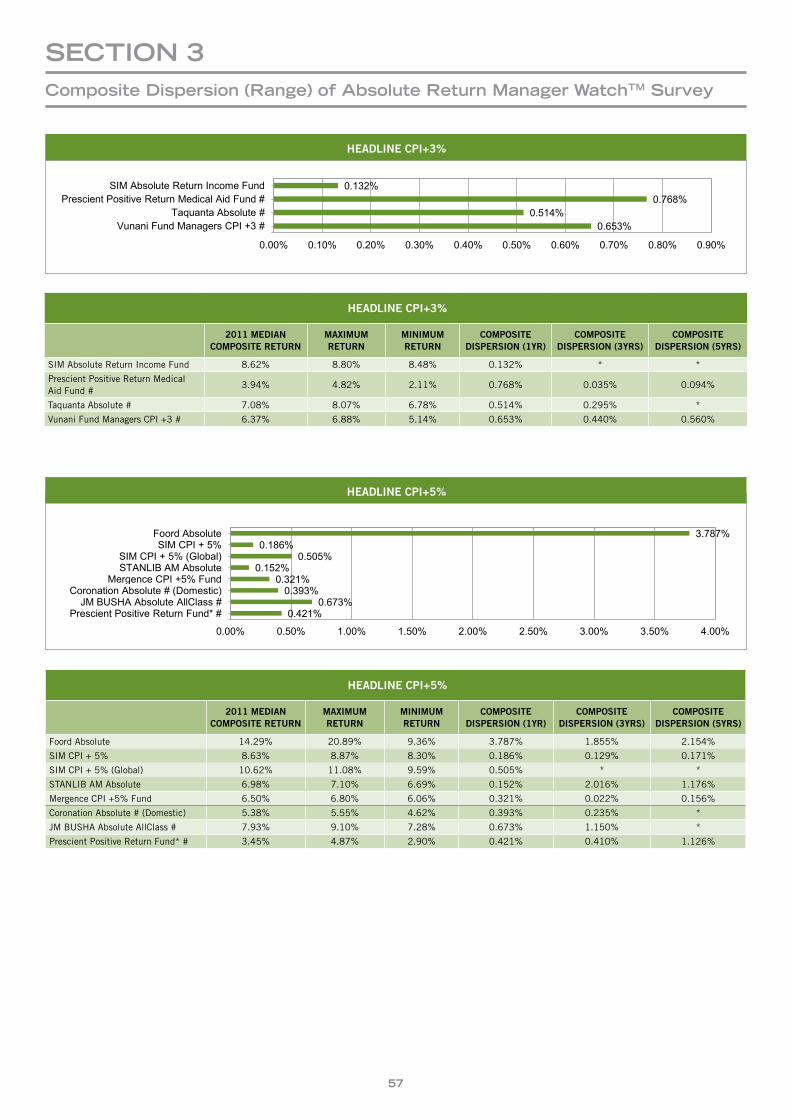
57
SectIOn 3composite Dispersion (range) of absolute return Manager WatchtM Survey
0.132% 0.768%
0.514% 0.653%
0.00% 0.10% 0.20% 0.30% 0.40% 0.50% 0.60% 0.70% 0.80% 0.90%
SIM Absolute Return Income Fund Prescient Positive Return Medical Aid Fund #
Taquanta Absolute # Vunani Fund Managers CPI +3 #
Headline CPI+3%
3.787% 0.186%
0.505% 0.152%
0.321% 0.393%
0.673% 0.421%
0.00% 0.50% 1.00% 1.50% 2.00% 2.50% 3.00% 3.50% 4.00%
Foord Absolute SIM CPI + 5%
SIM CPI + 5% (Global) STANLIB AM Absolute
Mergence CPI +5% Fund Coronation Absolute # (Domestic)
JM BUSHA Absolute AllClass # Prescient Positive Return Fund* #
Headline CPI+5%
HEADLINECPI+3%
0.132% 0.768%
0.514% 0.653%
0.00% 0.10% 0.20% 0.30% 0.40% 0.50% 0.60% 0.70% 0.80% 0.90%
SIM Absolute Return Income Fund Prescient Positive Return Medical Aid Fund #
Taquanta Absolute # Vunani Fund Managers CPI +3 #
Headline CPI+3%
3.787% 0.186%
0.505% 0.152%
0.321% 0.393%
0.673% 0.421%
0.00% 0.50% 1.00% 1.50% 2.00% 2.50% 3.00% 3.50% 4.00%
Foord Absolute SIM CPI + 5%
SIM CPI + 5% (Global) STANLIB AM Absolute
Mergence CPI +5% Fund Coronation Absolute # (Domestic)
JM BUSHA Absolute AllClass # Prescient Positive Return Fund* #
Headline CPI+5% HEADLINECPI+5%
HEADLINECPI+3%
2011MEDIANCOMPOSITERETURN
MAXIMUMRETURN
MINIMUMRETURN
COMPOSITEDISPERSION(1YR)
COMPOSITEDISPERSION(3YRS)
COMPOSITEDISPERSION(5YRS)
SIM Absolute Return Income Fund 8.62% 8.80% 8.48% 0.132% * *
Prescient Positive Return Medical Aid Fund #
3.94% 4.82% 2.11% 0.768% 0.035% 0.094%
Taquanta Absolute # 7.08% 8.07% 6.78% 0.514% 0.295% *
Vunani Fund Managers CPI +3 # 6.37% 6.88% 5.14% 0.653% 0.440% 0.560%
HEADLINECPI+5%
2011MEDIANCOMPOSITERETURN
MAXIMUMRETURN
MINIMUMRETURN
COMPOSITEDISPERSION(1YR)
COMPOSITEDISPERSION(3YRS)
COMPOSITEDISPERSION(5YRS)
Foord Absolute 14.29% 20.89% 9.36% 3.787% 1.855% 2.154%
SIM CPI + 5% 8.63% 8.87% 8.30% 0.186% 0.129% 0.171%
SIM CPI + 5% (Global) 10.62% 11.08% 9.59% 0.505% * *
STANLIB AM Absolute 6.98% 7.10% 6.69% 0.152% 2.016% 1.176%
Mergence CPI +5% Fund 6.50% 6.80% 6.06% 0.321% 0.022% 0.156%
Coronation Absolute # (Domestic) 5.38% 5.55% 4.62% 0.393% 0.235% *
JM BUSHA Absolute AllClass # 7.93% 9.10% 7.28% 0.673% 1.150% *
Prescient Positive Return Fund* # 3.45% 4.87% 2.90% 0.421% 0.410% 1.126%
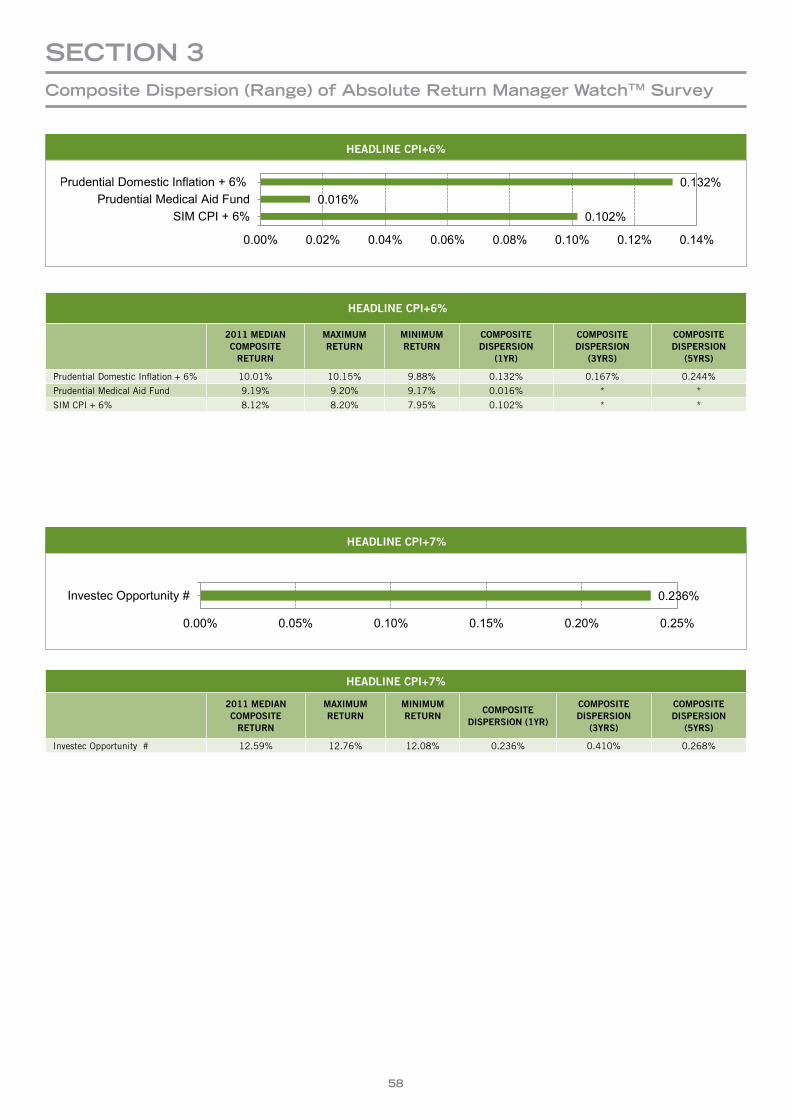
58
SectIOn 3composite Dispersion (range) of absolute return Manager WatchtM Survey
HEADLINECPI+6%
HEADLINECPI+6%
2011MEDIANCOMPOSITERETURN
MAXIMUMRETURN
MINIMUMRETURN
COMPOSITEDISPERSION
(1YR)
COMPOSITEDISPERSION
(3YRS)
COMPOSITEDISPERSION
(5YRS)
Prudential Domestic Inflation + 6% 10.01% 10.15% 9.88% 0.132% 0.167% 0.244%
Prudential Medical Aid Fund 9.19% 9.20% 9.17% 0.016% * *
SIM CPI + 6% 8.12% 8.20% 7.95% 0.102% * *
HEADLINECPI+7%
2011MEDIANCOMPOSITERETURN
MAXIMUMRETURN
MINIMUMRETURN
COMPOSITEDISPERSION(1YR)
COMPOSITEDISPERSION
(3YRS)
COMPOSITEDISPERSION
(5YRS)
Investec Opportunity # 12.59% 12.76% 12.08% 0.236% 0.410% 0.268%
0.132% 0.016%
0.102%
0.00% 0.02% 0.04% 0.06% 0.08% 0.10% 0.12% 0.14%
Prudential Domestic Inflation + 6% Prudential Medical Aid Fund
SIM CPI + 6%
Headline CPI+6%
0.236%
0.00% 0.05% 0.10% 0.15% 0.20% 0.25%
Investec Opportunity #
Headline CPI+7%
HEADLINECPI+7%
0.132% 0.016%
0.102%
0.00% 0.02% 0.04% 0.06% 0.08% 0.10% 0.12% 0.14%
Prudential Domestic Inflation + 6% Prudential Medical Aid Fund
SIM CPI + 6%
Headline CPI+6%
0.236%
0.00% 0.05% 0.10% 0.15% 0.20% 0.25%
Investec Opportunity #
Headline CPI+7%
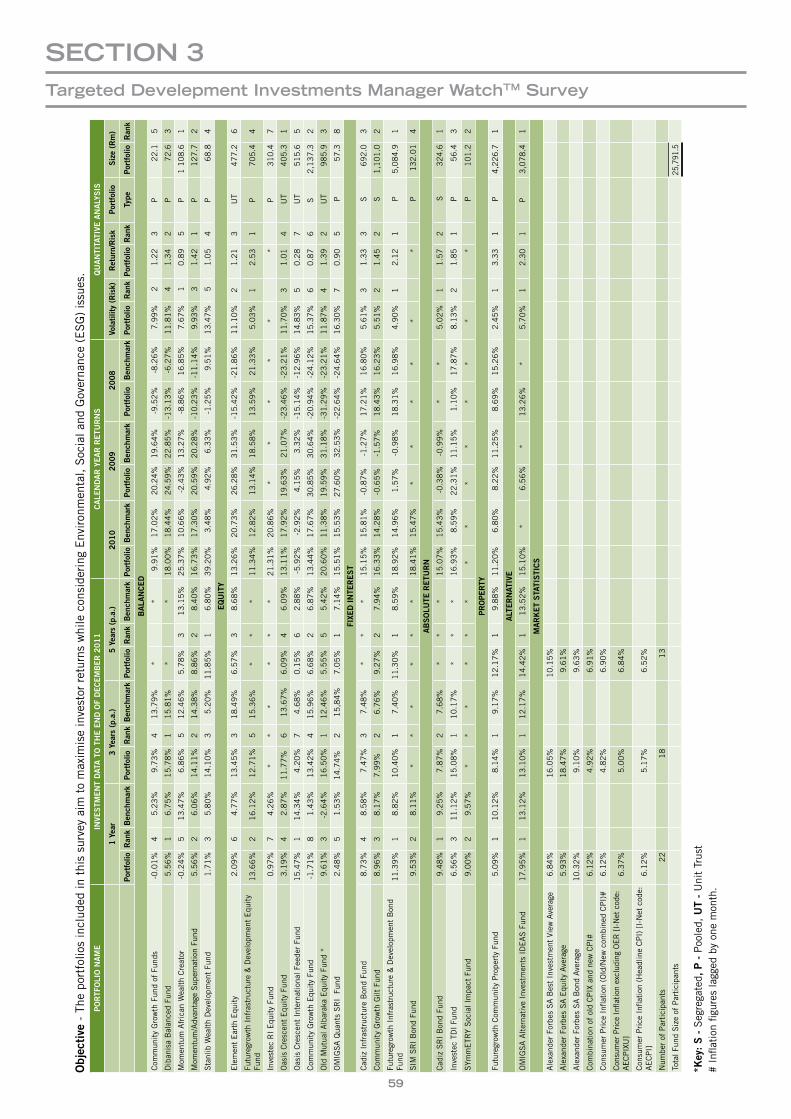
59
Objec
tive
- T
he p
ortf
olio
s in
clud
ed in
thi
s su
rvey
aim
to
max
imis
e in
vest
or r
etur
ns w
hile
con
side
ring
Env
iron
men
tal,
Soc
ial a
nd G
over
nanc
e (E
SG
) is
sues
.PORTF
OLI
ON
AME
INVE
STM
ENTDAT
ATOTHEE
NDO
FDECEMBER2
011
CALE
NDARYEARR
ETU
RNS
QUANTI
TATI
VEA
NALY
SIS
1Yea
r3Yea
rs(p.a.)
5Yea
rs(p.a.)
2010
2009
2008
Volatilit
y(R
isk)
Retur
n/Risk
Portfolio
Size(R
m)
Portfolio
Ran
kBen
chmark
Portfolio
Ran
kBen
chmark
Portfolio
Ran
kBen
chmark
Portfolio
Ben
chmark
Portfolio
Ben
chmark
Portfolio
Ben
chmark
Portfolio
Ran
kPortfolio
Ran
kTy
pePortfolio
Ran
k
BALA
NCED
Com
mun
ity
Gro
wth
Fun
d of
Fun
ds-0
.01
%4
5.2
3%
9.7
3%
41
3.7
9%
**
9.9
1%
17
.02
%20.2
4%
19
.64
%-9
.52
%-8
.26
%7
.99
% 2
1
.22
3
P 2
2.1
5
Dib
anis
a B
alan
ced
Fund
5.5
6%
16
.75
%1
5.7
8%
11
5.8
1%
**
18
.00
%1
8.4
4%
24.5
9%
22
.85
%-1
3.1
3%
-6.2
7%
11
.81
% 4
1
.34
2
P
72
.6
3
Mom
entu
m A
fric
an W
ealt
h C
reat
or-0
.24
%5
13
.47
%6
.86
%5
12
.46
%5
.78
%3
13
.15
%2
5.3
7%
10
.66
%-2
.43%
13
.27
%-8
.86
%1
6.8
5%
7.6
7%
1
0.8
9
5P
1 1
08
.6
1
Mom
entu
m/A
dvan
tage
Sup
erna
tion
Fun
d5
.56
%2
6.0
6%
14
.11
%2
14
.38
%8
.86
%2
8.4
0%
16
.73
%1
7.3
0%
20.5
9%
20
.28
%-1
0.2
3%
-11
.14
%9
.93
% 3
1
.42
1
P 1
27
.7
2
Sta
nlib
Wea
lth
Dev
elop
men
t Fu
nd1
.71
%3
5.8
0%
14
.10
%3
5.2
0%
11
.85
%1
6.8
0%
39
.20
%3
.48
%4.9
2%
6.3
3%
-1.2
5%
9.5
1%
13
.47
% 5
1
.05
4
P 6
8.8
4
EQUIT
Y
Ele
men
t E
arth
Equ
ity
2.0
9%
64
.77
%1
3.4
5%
31
8.4
9%
6.5
7%
38
.68
%1
3.2
6%
20
.73
%26.2
8%
31
.53
%-1
5.4
2%
-21
.86
%1
1.1
0%
2 1
.21
3
UT
47
7.2
6
Futu
regr
owth
Inf
rast
ruct
ure
& D
evel
opm
ent
Equ
ity
Fund
13
.66
%2
16
.12
%1
2.7
1%
51
5.3
6%
**
*1
1.3
4%
12
.82
%13.1
4%
18
.58
%1
3.5
9%
21
.33
%5
.03
%1
2.5
3
1P
7
05
.4
4
Inve
stec
RI
Equ
ity
Fund
0.9
7%
74
.26
%*
**
**
*2
1.3
1%
20
.86
%*
**
**
*
P
31
0.4
7
Oas
is C
resc
ent
Equ
ity
Fund
3.1
9%
42
.87
%1
1.7
7%
61
3.6
7%
6.0
9%
46
.09
%1
3.1
1%
17
.92
%19.6
3%
21
.07
%-2
3.4
6%
-23
.21
%1
1.7
0%
3 1
.01
4
UT
4
05
.3
1
Oas
is C
resc
ent
Inte
rnat
iona
l Fee
der
Fund
15
.47
%1
14
.34
%4
.20
%7
4.6
8%
0.1
5%
62
.88
%-5
.92
%-2
.92
%4.1
5%
3.3
2%
-15
.14
%-1
2.9
6%
14
.83
%5
0.2
8
7 U
T 5
15
.6
5
Com
mun
ity
Gro
wth
Equ
ity
Fund
-1.7
1%
81
.43
%1
3.4
2%
41
5.9
6%
6.6
8%
26
.87
%1
3.4
4%
17
.67
%30.8
5%
30
.64
%-2
0.9
4%
-24
.12
%1
5.3
7%
6 0
.87
6
S
2,1
37
.3
2
Old
Mut
ual A
lbar
aka
Equ
ity
Fund
*9
.61
%3
-2.6
4%
16
.50
%1
12
.46
%5
.55
%5
5.4
2%
20
.60
%1
1.3
8%
19.5
9%
31
.18
%-3
1.2
9%
-23
.21
%1
1.8
7%
4 1
.39
2
UT
98
5.9
3
OM
IGS
A Q
uant
s S
RI
Fun
d2
.48
%5
1.5
3%
14
.74
%2
15
,84
%7
.05
%1
7.1
4%
15
.51
%1
5.5
3%
27.6
0%
32
.53
%-2
2.6
4%
-24
.64
%1
6.3
0%
7 0
.90
5
P 5
7.3
8
FIXE
DINTE
REST
Cad
iz I
nfra
stru
ctur
e B
ond
Fund
8
.73
%4
8.5
8%
7.4
7%
37
.48
%*
**
15
.15
%1
5.8
1%
-0.8
7%
-1.2
7%
17
.21
%1
6.8
0%
5.6
1%
3 1
.33
3
S
69
2.0
3
Com
mun
ity
Gro
wth
Gilt
Fun
d8
.96
%3
8.1
7%
7.9
9%
26
.76
%9
.27
%2
7.9
4%
16
.33
%1
4.2
8%
-0.6
5%
-1.5
7%
18
.43
%1
6.2
3%
5.5
1%
2 1
.45
2
S
1,1
01
.0
2
Futu
regr
owth
Inf
rast
ruct
ure
& D
evel
opm
ent
Bon
d Fu
nd1
1.3
9%
18
.82
%1
0.4
0%
17
.40
%1
1.3
0%
18
.59
%1
8.9
2%
14
.96
%1
.57
%-0
.98
%1
8.3
1%
16
.98
%4
.90
%1
2.1
2
1 P
5
,08
4.9
1
SIM
SR
I B
ond
Fund
9
.53
%2
8.1
1%
**
**
**
18
.41
%1
5.4
7%
**
**
**
P
13
2.0
14
ABSOLU
TER
ETU
RN
Cad
iz S
RI
Bon
d Fu
nd9
.48
%1
9.2
5%
7.8
7%
27
.68
%*
**
15
.07
%1
5.4
3%
-0.3
8%
-0.9
9%
**
5.0
2%
1 1
.57
2
S 3
24
.6
1
Inve
stec
TD
I Fu
nd6
.56
%3
11
.12
%1
5.0
8%
11
0.1
7%
**
*1
6.9
3%
8.5
9%
22
.31
%1
1.1
5%
1.1
0%
17
.87
%8
.13
%2
1.8
5
1 P
5
6.4
3
SYm
mE
TRY
Soc
ial I
mpa
ct F
und
9.0
0%
29
.57
%*
**
**
**
**
**
**
* P
10
1.2
2
PROPE
RTY
Futu
regr
owth
Com
mun
ity
Pro
pert
y Fu
nd5
.09
%1
10
.12
%8
.14
%1
9.1
7%
12
.17
%1
9.8
8%
11
.20
%6
.80
%8
.22
%1
1.2
5%
8.6
9%
15
.26
%2
.45
%1
3.3
3
1 P
4
,22
6.7
1
ALT
ERNAT
IVE
OM
IGS
A A
lter
nati
ve I
nves
tmen
ts I
DE
AS
Fun
d1
7.9
5%
11
3.1
2%
13
.10
%1
12
.17
%1
4.4
2%
11
3.5
2%
15
.10
%*
6.5
6%
*1
3.2
6%
*5
.70
%1
2.3
0
1P
3,0
78
.41
MARKETSTA
TISTI
CS
Ale
xand
er F
orbe
s S
A B
est
Inve
stm
ent
View
Ave
rage
6
.84
%1
6.0
5%
10
.15
%
Ale
xand
er F
orbe
s S
A E
quit
y Ave
rage
5.9
3%
18
.47
%9
.61
%
Ale
xand
er F
orbe
s S
A B
ond
Ave
rage
10
.32
%9
.10
%9
.63
%
Com
bina
tion
of
old
CP
IX a
nd n
ew C
PI#
6.1
2%
4.9
2%
6.9
1%
Con
sum
er P
rice
Infl
atio
n (O
ld/N
ew c
ombi
ned
CP
I)#
6.1
2%
4.8
2%
6.9
0%
Con
sum
er P
rice
Infla
tion
excl
udin
g O
ER
[I-
Net
cod
e:
AECPIX
U]
6.3
7%
5.0
0%
6.8
4%
Con
sum
er P
rice
Infl
atio
n (H
eadl
ine
CP
I) [
I-N
et c
ode:
A
EC
PI]
6.1
2%
5.1
7%
6.5
2%
Num
ber
of P
arti
cipa
nts
22
18
13
Tota
l Fun
d S
ize
of P
arti
cipa
nts
25,7
91.5
*Key
:S-S
egre
gate
d,P
-P
oole
d,U
T-
Uni
t Tr
ust
# I
nflat
ion
figur
es la
gged
by
one
mon
th.
SectIOn 3targeted Develepment Investments Manager WatchtM Survey

60
RISKVSRETURNSCATTERPLOT-TDIBALANCED&EQUITY-3YEARSENDING31DECEMBER2011
RISKVSRETURNSCATTERPLOT-TDIFIXEDINTERESTPORTFOLIOS-3YEARSENDING31DECEMBER2011
SectIOn 3targeted Development Investments Manager WatchtM Survey
Ret
urn
(p.a
.)R
etur
n (p
.a.)
Return (p.a.) Standard Deviation
Return (p.a.) Standard Deviation
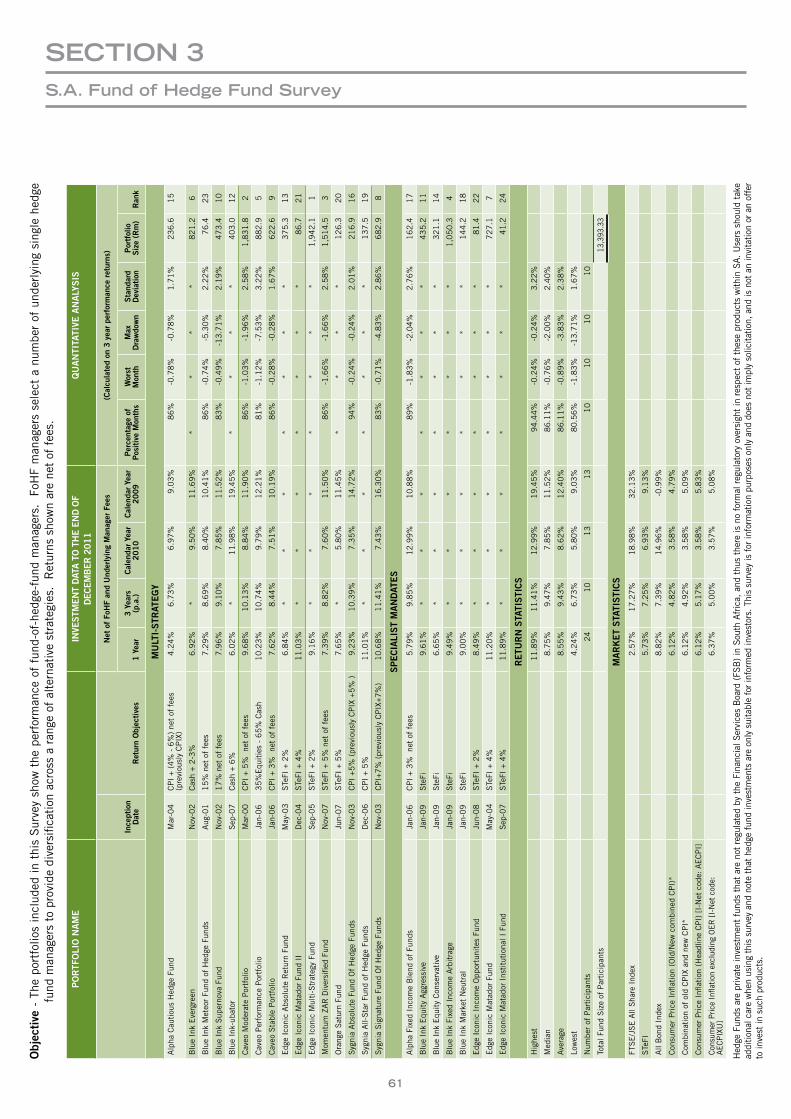
61
Objec
tive
- T
he p
ortf
olio
s in
clud
ed i
n th
is S
urve
y sh
ow t
he p
erfo
rman
ce o
f fu
nd-o
f-he
dge-
fund
man
ager
s.
FoH
F m
anag
ers
sele
ct a
num
ber
of u
nder
lyin
g si
ngle
hed
ge
fund
man
ager
s to
pro
vide
div
ersi
ficat
ion
acro
ss a
ran
ge o
f al
tern
ativ
e st
rate
gies
. R
etur
ns s
how
n ar
e ne
t of
fee
s.
PORTF
OLI
ON
AME
INVE
STMEN
TDAT
ATO
THEEN
DO
F
DEC
EMBER
201
1QUANTI
TATI
VEA
NALY
SIS
Ince
ption
Date
Retur
nObjec
tive
s
NetofFo
HFan
dUnd
erlyingMan
agerFee
s(C
alcu
latedon
3yea
rpe
rforman
ceretur
ns)
1Yea
r3Yea
rs
(p.a.)
Calen
darYe
ar
2010
Calen
darYe
ar
2009
Perce
ntag
eof
Pos
itiveMon
ths
Worst
Mon
thMax
Drawdo
wn
Stand
ard
Dev
iation
Portfolio
Size(R
m)
Ran
k
MULT
I-STR
ATEGY
Alp
ha C
auti
ous
Hed
ge F
und
Mar
-04
CP
I + (
4%
- 6
%)
net
of f
ees
(pre
viou
sly
CP
IX)
4.2
4%
6.7
3%
6.9
7%
9.0
3%
86
%-0
.78
%-0
.78
%1
.71
%2
36
.6 1
5
Blu
e In
k E
verg
reen
Nov
-02
Cas
h + 2
-3%
6.9
2%
*9
.50
%1
1.6
9%
**
**
82
1.2
6
Blu
e In
k M
eteo
r Fu
nd o
f H
edge
Fun
dsA
ug-0
11
5%
net
of
fees
7.2
9%
8.6
9%
8.4
0%
10
.41
%8
6%
-0.7
4%
-5.3
0%
2.2
2%
76
.4 2
3
Blu
e In
k S
uper
nova
Fun
dN
ov-0
21
7%
net
of
fees
7.9
6%
9.1
0%
7.8
5%
11
.52
%8
3%
-0.4
9%
-13
.71
%2
.19
%4
73
.4 1
0
Blu
e In
k-ub
ator
Sep
-07
Cas
h + 6
%6
.02
%*
11
.98
%1
9.4
5%
**
**
40
3.0
12
Cav
eo M
oder
ate
Por
tfol
ioM
ar-0
0C
PI
+ 5
% ne
t of
fee
s9
.68
%1
0.1
3%
8.8
4%
11
.90
%8
6%
-1.0
3%
-1.9
6%
2.5
8%
1,8
31
.8 2
Cav
eo P
erfo
rman
ce P
ortf
olio
Jan-
06
35
%E
quit
ies
- 6
5%
Cas
h1
0.2
3%
10
.74
%9
.79
%1
2.2
1%
81
%-1
.12
%-7
.53
%3
.22
%8
82
.9 5
Cav
eo S
tabl
e P
ortf
olio
Jan-
06
CP
I + 3
% ne
t of
fee
s7
.62
%8
.44
%7
.51
%1
0.1
9%
86
%-0
.28
%-0
.28
%1
.67
%6
22
.6 9
Edg
e Ic
onic
Abs
olut
e R
etur
n Fu
ndM
ay-0
3S
TeFI
+ 2
%6
.84
%*
**
**
**
37
5.3
13
Edg
e Ic
onic
Mat
ador
Fun
d II
Dec
-04
STe
FI +
4%
11
.03
%*
**
**
**
86
.7 2
1
Edg
e Ic
onic
Mul
ti-S
trat
egy
Fund
S
ep-0
5S
TeFI
+ 2
%9
.16
%*
**
**
**
1,9
42
.1 1
Mom
entu
m Z
AR
Div
ersi
fied
Fund
Nov
-07
STe
FI +
5%
net
of
fees
7.3
9%
8.8
2%
7.6
0%
11
.50
%8
6%
-1.6
6%
-1.6
6%
2.5
8%
1,5
14
.5 3
Ora
nge
Sat
urn
Fund
Jun-
07
STe
FI +
5%
7.6
5%
*5
.80
%1
1.4
5%
**
**
12
6.3
20
Syg
nia
Abs
olut
e Fu
nd O
f H
edge
Fun
ds
Nov
-03
CP
I +5
% (
prev
ious
ly C
PIX
+5
% )
9.2
3%
10
.39
%7
.35
%1
4.7
2%
94
%-0
.24
%-0
.24
%2
.01
%2
16
.9 1
6
Syg
nia
All-
Sta
r Fu
nd o
f H
edge
Fun
dsD
ec-0
6C
PI
+ 5
%1
1.0
1%
**
**
**
*1
37
.5 1
9
Syg
nia
Sig
natu
re F
und
Of
Hed
ge F
unds
N
ov-0
3C
PI+
7%
(pr
evio
usly
CP
IX+7
%)
10
.68
%1
1.4
1%
7.4
3%
16
.30
%8
3%
-0.7
1%
-4.8
3%
2.8
6%
68
2.9
8
SPECIA
LISTMANDAT
ES
Alp
ha F
ixed
Inc
ome
Ble
nd o
f Fu
nds
Jan-
06
CP
I + 3
% ne
t of
fee
s5
.79
%9
.85
%1
2.9
9%
10
.88
%8
9%
-1.8
3%
-2.0
4%
2.7
6%
16
2.4
17
Blu
e In
k E
quit
y A
ggre
ssiv
eJa
n-0
9S
teFi
9.6
1%
**
**
**
*4
35
.2 1
1
Blu
e In
k E
quit
y C
onse
rvat
ive
Jan-
09
Ste
Fi6
.65
%*
**
**
**
32
1.1
14
Blu
e In
k Fi
xed
Inco
me
Arb
itra
geJa
n-0
9S
teFi
9.4
9%
**
**
**
*1
,05
0.3
4
Blu
e In
k M
arke
t N
eutr
alJa
n-0
9S
teFi
9.0
0%
**
**
**
*1
44
.2 1
8
Edg
e Ic
onic
Inc
ome
Opp
ortu
nite
s Fu
ndJu
n-0
8S
TeFI
+ 2
%8
.49
%*
**
**
**
81
.4 2
2
Edg
e Ic
onic
Mat
ador
Fun
dM
ay-0
4S
TeFI
+ 4
%1
1.2
0%
**
**
**
*7
27
.1 7
Edg
e Ic
onic
Mat
ador
Ins
titu
tion
al I
Fun
dS
ep-0
7S
TeFI
+ 4
%1
1.8
9%
**
**
**
*4
1.2
24
RETU
RNS
TATI
STI
CS
Hig
hest
11
.89
%1
1.4
1%
12
.99
%1
9.4
5%
94
.44
%-0
.24
%-0
.24
%3
.22
%
Med
ian
8.7
5%
9.4
7%
7.8
5%
11
.52
%8
6.1
1%
-0.7
6%
-2.0
0%
2.4
0%
Ave
rage
8.5
5%
9.4
3%
8.6
2%
12
.40
%8
6.1
1%
-0.8
9%
-3.8
3%
2.3
8%
Low
est
4.2
4%
6.7
3%
5.8
0%
9.0
3%
80
.56
%-1
.83
%-1
3.7
1%
1.6
7%
Num
ber
of P
arti
cipa
nts
24
1
0 1
3
13
10
1
0
10
1
0
Tota
l Fun
d S
ize
of P
arti
cipa
nts
13,3
93.3
3
MARKETSTA
TISTI
CS
FTS
E/J
SE
All
Sha
re I
ndex
2.5
7%
17
.27
%1
8.9
8%
32
.13
%
STe
FI5
.73
%7
.25
%6
.93
%9
.13
%
All
Bon
d In
dex
8.8
2%
7.3
9%
14
.96
%-0
.99
%
Con
sum
er P
rice
Infl
atio
n (O
ld/N
ew c
ombi
ned
CP
I)*
6.1
2%
4.8
2%
3.5
8%
4.7
9%
Com
bina
tion
of
old
CP
IX a
nd n
ew C
PI*
6.1
2%
4.9
2%
3.5
8%
5.0
9%
Con
sum
er P
rice
Infl
atio
n (H
eadl
ine
CP
I) [
I-N
et c
ode:
AE
CP
I]6
.12
%5
.17
%3
.58
%5
.83
%
Con
sum
er P
rice
Infla
tion
excl
udin
g O
ER
[I-
Net
cod
e:
AECPIX
U]
6.3
7%
5.0
0%
3.5
7%
5.0
8%
Hed
ge F
unds
are
priv
ate
inve
stm
ent
fund
s th
at a
re n
ot r
egul
ated
by
the
Fina
ncia
l Ser
vice
s B
oard
(FS
B)
in S
outh
Afr
ica,
and
thu
s th
ere
is n
o fo
rmal
reg
ulat
ory
over
sigh
t in
res
pect
of
thes
e pr
oduc
ts w
ithin
SA.
Use
rs s
houl
d ta
ke
addi
tiona
l car
e w
hen
usin
g th
is s
urve
y an
d no
te t
hat
hedg
e fu
nd in
vest
men
ts a
re o
nly
suita
ble
for
info
rmed
inve
stor
s. T
his
surv
ey is
for
info
rmat
ion
purp
oses
onl
y an
d do
es n
ot im
ply
solic
itatio
n, a
nd is
not
an
invi
tatio
n or
an
offe
r to
inve
st in
suc
h pr
oduc
ts.
SectIOn 3S.a. Fund of hedge Fund Survey
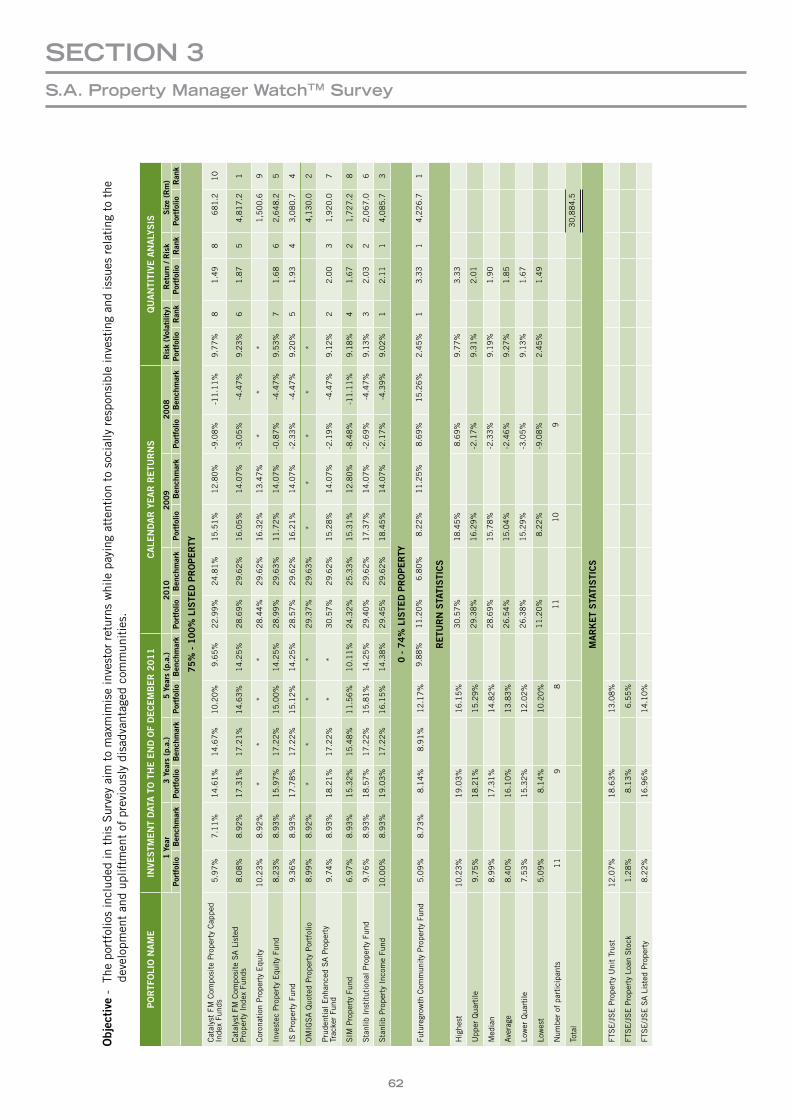
62
SectIOn 3S.a. Property Manager WatchtM Survey
Objec
tive
-
The
port
folio
s in
clud
ed in
thi
s S
urve
y ai
m t
o m
axm
imis
e in
vest
or r
etur
ns w
hile
pay
ing
atte
ntio
n to
soc
ially
res
pons
ible
inve
stin
g an
d is
sues
rel
atin
g to
the
deve
lopm
ent
and
uplif
tmen
t of
pre
viou
sly
disa
dvan
tage
d co
mm
unit
ies.
PORTF
OLI
ON
AME
INVE
STM
ENTDAT
ATOTHEE
NDO
FDECEMBER2
011
CALE
NDARYEARR
ETU
RNS
QUANTI
TIVE
ANALY
SIS
1Yea
r3Yea
rs(p.a.)
5Yea
rs(p.a.)
2010
2009
2008
Risk(Volatility)
Retur
n/R
isk
Size(R
m)
Portfolio
Ben
chmark
Portfolio
Ben
chmark
Portfolio
Ben
chmark
Portfolio
Ben
chmark
Portfolio
Ben
chmark
Portfolio
Ben
chmark
Portfolio
Ran
kPortfolio
Ran
kPortfolio
Ran
k
75%
-1
00%
LIS
TEDP
ROPERTY
Cat
alys
t FM
Com
posi
te P
rope
rty
Cap
ped
Inde
x Fu
nds
5.9
7%
7.1
1%
14
.61
%1
4.6
7%
10
.20
%9
.65
%2
2.9
9%
24
.81
%1
5.5
1%
12
.80
%-9
.08
%-1
1.1
1%
9.7
7%
81
.49
8 6
81
.2
10
Cat
alys
t FM
Com
posi
te S
A L
iste
d P
rope
rty
Inde
x Fu
nds
8.0
8%
8.9
2%
17
.31
%1
7.2
1%
14
.63
%1
4.2
5%
28
.69
%2
9.6
2%
16
.05
%1
4.0
7%
-3.0
5%
-4.4
7%
9.2
3%
61
.87
5 4
,81
7.2
1
Cor
onat
ion
Pro
pert
y E
quit
y1
0.2
3%
8.9
2%
**
**
28
.44
%2
9.6
2%
16
.32
%1
3.4
7%
**
* 1
,50
0.6
9
Inve
stec
Pro
pert
y E
quit
y Fu
nd8
.23
%8
.93
%1
5.9
7%
17
.22
%1
5.0
0%
14
.25
%2
8.9
9%
29
.63
%1
1.7
2%
14
.07
%-0
.87
%-4
.47
%9
.53
%7
1.6
86
2,6
48
.2
5
IS P
rope
rty
Fund
9.3
6%
8.9
3%
17
.78
%1
7.2
2%
15
.12
%1
4.2
5%
28
.57
%2
9.6
2%
16
.21
%1
4.0
7%
-2.3
3%
-4.4
7%
9.2
0%
51
.93
4 3
,08
0.7
4
OM
IGS
A Q
uote
d P
rope
rty
Por
tfol
io8
.99
%8
.92
%*
**
*2
9.3
7%
29
.63
%*
**
**
4,1
30
.0
2
Pru
dent
ial E
nhan
ced
SA
Pro
pert
y Tr
acke
r Fu
nd9
.74
%8
.93
%1
8.2
1%
17
.22
%*
*3
0.5
7%
29
.62
%1
5.2
8%
14
.07
%-2
.19
%-4
.47
%9
.12
%2
2.0
03
1,9
20
.0
7
SIM
Pro
pert
y Fu
nd6
.97
%8
.93
%1
5.3
2%
15
.48
%1
1.5
6%
10
.11
%2
4.3
2%
25
.33
%1
5.3
1%
12
.80
%-8
.48
%-1
1.1
1%
9.1
8%
41
.67
2 1
,72
7.2
8
Sta
nlib
Ins
titu
tion
al P
rope
rty
Fund
9.7
6%
8.9
3%
18
.57
%1
7.2
2%
15
.81
%1
4.2
5%
29
.40
%2
9.6
2%
17
.37
%1
4.0
7%
-2.6
9%
-4.4
7%
9.1
3%
32
.03
2 2
,06
7.0
6
Sta
nlib
Pro
pert
y In
com
e Fu
nd1
0.0
0%
8.9
3%
19
.03
%1
7.2
2%
16
.15
%1
4.3
8%
29
.45
%2
9.6
2%
18
.45
%1
4.0
7%
-2.1
7%
-4.3
9%
9.0
2%
12
.11
1 4
,08
5.7
3
0-7
4%
LIS
TEDP
ROPERTY
Futu
regr
owth
Com
mun
ity
Pro
pert
y Fu
nd5
.09
%8
.73
%8
.14
%8
.91
%1
2.1
7%
9.8
8%
11
.20
%6
.80
%8
.22
%1
1.2
5%
8.6
9%
15
.26
%2
.45
%1
3.3
31
4,2
26
.7
1
RETU
RNS
TATI
STI
CS
Hig
hest
10
.23
%1
9.0
3%
16
.15
%3
0.5
7%
18
.45
%8
.69
%9
.77
%3
.33
Upp
er Q
uart
ile9
.75
%1
8.2
1%
15
.29
%2
9.3
8%
16
.29
%-2
.17
%9
.31
%2
.01
Med
ian
8.9
9%
17
.31
%1
4.8
2%
28
.69
%1
5.7
8%
-2.3
3%
9.1
9%
1.9
0
Ave
rage
8.4
0%
16
.10
%1
3.8
3%
26
.54
%1
5.0
4%
-2.4
6%
9.2
7%
1.8
5
Low
er Q
uart
ile7
.53
%1
5.3
2%
12
.02
%2
6.3
8%
15
.29
%-3
.05
%9
.13
%1
.67
Low
est
5.0
9%
8.1
4%
10
.20
%1
1.2
0%
8.2
2%
-9.0
8%
2.4
5%
1.4
9
Num
ber
of p
arti
cipa
nts
11
98
11
10
9
Tota
l3
0,8
84
.5
MARKETSTA
TISTI
CS
FTS
E/J
SE
Pro
pert
y U
nit
Trus
t1
2.0
7%
18
.63
%1
3.0
8%
FTS
E/J
SE
Pro
pert
y Lo
an S
tock
1.2
8%
8.1
3%
6.5
5%
FTS
E/J
SE
SA
Lis
ted
Pro
pert
y8
.22
%1
6.9
6%
14
.10
%
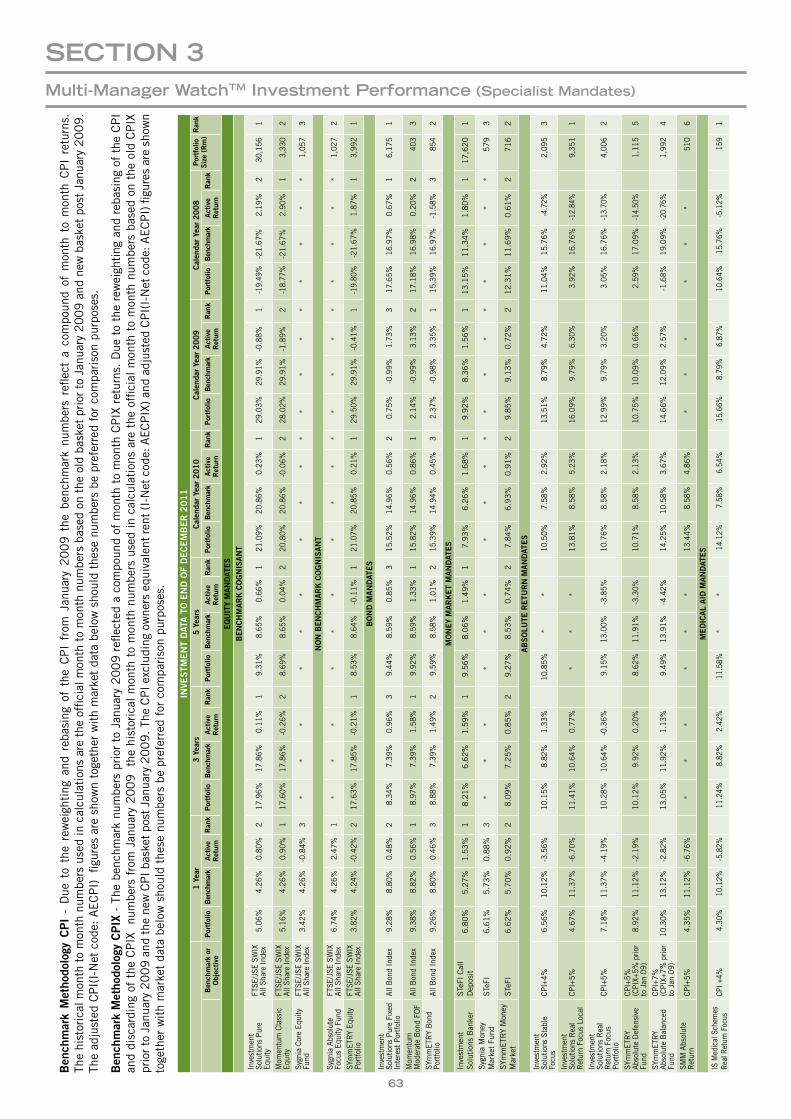
63
Ben
chmark
Metho
dology
CPI
- D
ue t
o th
e re
wei
ghti
ng a
nd r
ebas
ing
of t
he C
PI
from
Jan
uary
20
09
the
ben
chm
ark
num
bers
refl
ect
a co
mpo
und
of m
onth
to
mon
th C
PI
retu
rns.
Th
e hi
stor
ical
mon
th t
o m
onth
num
bers
use
d in
cal
cula
tion
s ar
e th
e of
ficia
l mon
th t
o m
onth
num
bers
bas
ed o
n th
e ol
d ba
sket
pri
or t
o Ja
nuar
y 2
00
9 a
nd n
ew b
aske
t po
st J
anua
ry 2
00
9.
The
adju
sted
CP
I(I-
Net
cod
e: A
EC
PI)
fig
ures
are
sho
wn
toge
ther
wit
h m
arke
t da
ta b
elow
sho
uld
thes
e nu
mbe
rs b
e pr
efer
red
for
com
pari
son
purp
oses
.
Ben
chmarkMetho
dology
CPIX
- T
he b
ench
mar
k nu
mbe
rs p
rior
to
Janu
ary
20
09
refl
ecte
d a
com
poun
d of
mon
th t
o m
onth
CP
IX r
etur
ns.
Due
to
the
rew
eigh
ting
and
reb
asin
g of
the
CP
I an
d di
scar
ding
of
the
CP
IX
num
bers
fro
m J
anua
ry 2
00
9
the
hist
oric
al m
onth
to
mon
th n
umbe
rs u
sed
in c
alcu
lati
ons
are
the
offic
ial m
onth
to
mon
th n
umbe
rs b
ased
on
the
old
CP
IX
prio
r to
Jan
uary
20
09
and
the
new
CP
I ba
sket
pos
t Ja
nuar
y 2
00
9. T
he C
PI ex
clud
ing
owne
rs e
quiv
alen
t re
nt (I-
Net
cod
e: A
EC
PIX
) an
d ad
just
ed C
PI(
I-N
et c
ode:
AE
CP
I) fi
gure
s ar
e sh
own
toge
ther
wit
h m
arke
t da
ta b
elow
sho
uld
thes
e nu
mbe
rs b
e pr
efer
red
for
com
pari
son
purp
oses
.
INVE
STM
ENTDAT
ATOE
NDO
FDECEMBER2
011
1Yea
r3
Yea
rs5Yea
rsCalen
darYe
ar2
010
Calen
darYe
ar2
009
Calen
darYe
ar2
008
Portfolio
Size(R
m)Ran
k
Ben
chmarkor
Objec
tive
Portfolio
Ben
chmark
Active
Ret
urn
Ran
kPortfolio
Ben
chmark
Active
Ret
urn
Ran
kPortfolio
Ben
chmark
Active
Ret
urn
Ran
kPortfolio
Ben
chmark
Active
Ret
urn
Ran
kPortfolio
Ben
chmark
Active
Ret
urn
Ran
kPortfolio
Ben
chmark
Active
Ret
urn
Ran
k
EQUIT
YMANDAT
ES
BENCHMARKC
OGNIS
ANT
Inve
stm
ent
Solu
tions
Pur
e Eq
uity
FTSE
/JSE
SW
IX
All S
hare
Inde
x5.
06%
4.26
%0.
80%
217
.96%
17.8
6%0.
11%
19.
31%
8.65
%0.
66%
121
.09%
20.8
6%0.
23%
1
29.0
3%29
.91%
-0.8
8% 1
-1
9.49
%-2
1.67
%2.
19%
2
30,
156
1
Mom
entu
m C
lass
ic
Equi
tyFT
SE/J
SE S
WIX
Al
l Sha
re In
dex
5.16
%4.
26%
0.90
%1
17.6
0%17
.86%
-0.2
6%2
8.69
%8.
65%
0.04
%2
20.8
0%20
.86%
-0.0
6% 2
28
.02%
29.9
1%-1
.89%
2
-18.
77%
-21.
67%
2.90
% 1
3
,330
2
Sygn
ia C
ore
Equi
ty
Fund
FTSE
/JSE
SW
IX
All S
hare
Inde
x3.
42%
4.26
%-0
.84%
3*
**
**
**
**
*
**
* *
*
**
*
1,0
57
3
NONB
ENCHMARKC
OGNIS
ANT
Sygn
ia A
bsol
ute
Focu
s Eq
uity
Fun
dFT
SE/J
SE S
WIX
Al
l Sha
re In
dex
6.74
%4.
26%
2.47
%1
**
**
**
**
* *
*
**
*
**
* *
1
,027
2
SYm
mET
RY
Equi
ty
Port
folio
FTSE
/JSE
SW
IX
All S
hare
Inde
x3.
82%
4.24
%-0
.42%
217
.63%
17.8
5%-0
.21%
18.
53%
8.64
%-0
.11%
121
.07%
20.8
5%0.
21%
1
29.5
0%29
.91%
-0.4
1% 1
-1
9.80
%-2
1.67
%1.
87%
1
3,9
92
1
BONDM
ANDAT
ES
Inve
stm
ent
Solu
tions
Pur
e Fi
xed
Inte
rest
Por
tfol
ioAl
l Bon
d In
dex
9.28
%8.
80%
0.48
%2
8.34
%7.
39%
0.96
%3
9.44
%8.
59%
0.85
%3
15.5
2%14
.96%
0.56
% 2
0.
75%
-0.9
9%1.
73%
3
17.6
5%16
.97%
0.67
% 1
6
,175
1
Mom
entu
m
Mod
erat
e B
ond
FOF
All B
ond
Inde
x9.
38%
8.82
%0.
56%
18.
97%
7.39
%1.
58%
19.
92%
8.59
%1.
33%
115
.82%
14.9
6%0.
86%
1
2.14
%-0
.99%
3.13
% 2
17
.18%
16.9
8%0.
20%
2
403
3
SYm
mET
RY
Bon
d Po
rtfo
lioAl
l Bon
d In
dex
9.26
%8.
80%
0.46
%3
8.88
%7.
39%
1.49
%2
9.59
%8.
58%
1.01
%2
15.3
9%14
.94%
0.45
% 3
2.
37%
-0.9
8%3.
35%
1
15.3
9%16
.97%
-1.5
8% 3
8
54
2
MONEYMARKETMANDAT
ES
Inve
stm
ent
Sol
utio
ns B
anke
rSTe
FI C
all
Dep
osit
6.8
0%
5.2
7%
1.5
3%
18.2
1%
6.6
2%
1.5
9%
19.5
6%
8.0
6%
1.4
9%
17.9
3%
6.2
6%
1.6
8%
1
9.9
2%
8.3
6%
1.5
6%
1
13.1
5%
11.3
4%
1.8
0%
1
17,6
20
1
Syg
nia
Mon
ey
Mar
ket
Fund
STe
FI6.6
1%
5.7
3%
0.8
8%
3*
**
**
**
**
*
**
* *
*
**
*
579
3
SYm
mETR
Y M
oney
M
arke
tSTe
FI6.6
2%
5.7
0%
0.9
2%
28.0
9%
7.2
5%
0.8
5%
29.2
7%
8.5
3%
0.7
4%
27.8
4%
6.9
3%
0.9
1%
2
9.8
5%
9.1
3%
0.7
2%
2
12.3
1%
11.6
9%
0.6
1%
2
716
2
ABSOLU
TER
ETU
RNM
ANDAT
ES
Inve
stm
ent
Solu
tions
Sta
ble
Focu
sCP
I+4%
6.56
%10
.12%
-3.5
6%10
.15%
8.82
%1.
33%
10.8
5%*
*10
.50%
7.58
%2.
92%
13.5
1%8.
79%
4.72
%11
.04%
15.7
6%-4
.72%
2,0
95
3
Inve
stm
ent
Solu
tions
Rea
l R
etur
n Fo
cus
Loca
lCP
I+5%
4.67
%11
.37%
-6.7
0%11
.41%
10.6
4%0.
77%
**
*13
.81%
8.58
%5.
23%
16.0
9%9.
79%
6.30
%3.
92%
16.7
6%-1
2.84
% 9
,351
1
Inve
stm
ent
Solu
tions
Rea
l R
etur
n Fo
cus
Port
folio
CPI+
5%7.
18%
11.3
7%-4
.19%
10.2
8%10
.64%
-0.3
6%9.
15%
13.0
0%-3
.85%
10.7
6%8.
58%
2.18
%12
.99%
9.79
%3.
20%
3.05
%16
.76%
-13.
70%
4,0
06
2
SYm
mET
RY
Abso
lute
Def
ensi
ve
Fund
CPI+
5%
(CPI
X+5%
prio
r to
Jan
09)
8.92
%11
.12%
-2.1
9%10
.12%
9.92
%0.
20%
8.62
%11
.91%
-3.3
0%10
.71%
8.58
%2.
13%
10.7
5%10
.09%
0.66
%2.
59%
17.0
9%-1
4.50
% 1
,115
5
SYm
mET
RY
Abso
lute
Bal
ance
d Fu
nd
CPI+
7%
(CPI
X+7%
prio
r to
Jan
09)
10.3
0%13
.12%
-2.8
2%13
.05%
11.9
2%1.
13%
9.49
%13
.91%
-4.4
2%14
.25%
10.5
8%3.
67%
14.6
6%12
.09%
2.57
%-1
.68%
19.0
9%-2
0.76
% 1
,992
4
SMM
Abs
olut
e R
etur
nCP
I+5%
4.35
%11
.12%
-6.7
6%*
**
**
*13
.44%
8.58
%4.
86%
**
**
**
510
6
MEDIC
ALAID
MANDAT
ES
IS M
edic
al S
chem
es
Real
Ret
urn
Focu
sCP
I +4%
4.30
%10
.12%
-5.8
2%11
.24%
8.82
%2.
42%
11.5
8%*
*14
.12%
7.58
%6.
54%
15.6
6%8.
79%
6.87
%10
.64%
15.7
6%-5
.12%
159
1
SectIOn 3Multi-Manager WatchtM Investment Performance (Specialist Mandates)
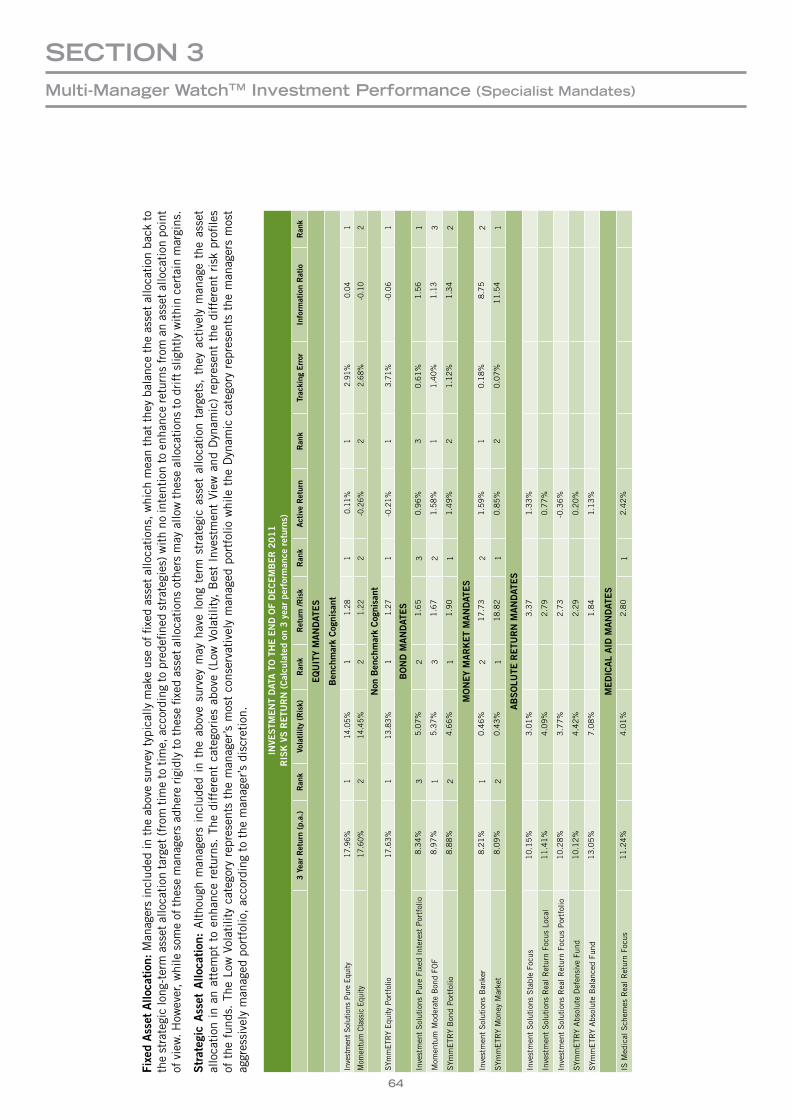
64
Fixe
dAss
etA
lloca
tion
: Man
ager
s in
clud
ed in
the
abo
ve s
urve
y ty
pica
lly m
ake
use
of fi
xed
asse
t al
loca
tion
s, w
hich
mea
n th
at t
hey
bala
nce
the
asse
t al
loca
tion
bac
k to
th
e st
rate
gic
long
-ter
m a
sset
allo
cati
on ta
rget
(fro
m ti
me
to ti
me,
acc
ordi
ng to
pred
efine
d st
rate
gies
) wit
h no
inte
ntio
n to
enh
ance
retu
rns
from
an
asse
t allo
cati
on p
oint
of
vie
w. H
owev
er, w
hile
som
e of
the
se m
anag
ers
adhe
re rig
idly
to
thes
e fix
ed a
sset
allo
cati
ons
othe
rs m
ay a
llow
the
se a
lloca
tion
s to
dri
ft s
light
ly w
ithi
n ce
rtai
n m
argi
ns.
Strateg
icA
ssetA
lloca
tion
: A
ltho
ugh
man
ager
s in
clud
ed i
n th
e ab
ove
surv
ey m
ay h
ave
long
ter
m s
trat
egic
ass
et a
lloca
tion
tar
gets
, th
ey a
ctiv
ely
man
age
the
asse
t al
loca
tion
in
an a
ttem
pt t
o en
hanc
e re
turn
s. T
he d
iffe
rent
cat
egor
ies
abov
e (L
ow V
olat
ility
, B
est
Inve
stm
ent
View
and
Dyn
amic
) re
pres
ent
the
diff
eren
t ri
sk p
rofil
es
of t
he f
unds
. Th
e Lo
w V
olat
ility
cat
egor
y re
pres
ents
the
man
ager
’s m
ost
cons
erva
tive
ly m
anag
ed p
ortf
olio
whi
le t
he D
ynam
ic c
ateg
ory
repr
esen
ts t
he m
anag
ers
mos
t ag
gres
sive
ly m
anag
ed p
ortf
olio
, ac
cord
ing
to t
he m
anag
er’s
dis
cret
ion.
INVE
STM
ENTDAT
ATOTHEE
NDO
FDECEMBER2
011
RIS
KVSR
ETU
RN(Calcu
latedon
3yea
rpe
rforman
ceretur
ns)
3Yea
rRetur
n(p
.a.)
Ran
kVo
latilit
y(R
isk)
Ran
kRetur
n/R
isk
Ran
kActiveRetur
nRan
kTrac
king
Error
Inform
ationRatio
Ran
k
EQUIT
YMANDAT
ES
Ben
chmarkCog
nisa
nt
Inve
stm
ent S
olut
ions
Pur
e Eq
uity
17.9
6% 1
14
.05%
1
1.2
8 1
0.11
%1
2.91
%0.
041
Mom
entu
m C
lass
ic E
quity
17.6
0% 2
14
.45%
2
1.2
2 2
-0.2
6%2
2.68
%-0
.10
2
Non
Ben
chmarkCog
nisa
ntSY
mm
ETR
Y Eq
uity
Por
tfol
io17
.63%
1
13.8
3% 1
1
.27
1-0
.21%
13.
71%
-0.0
61
BONDM
ANDAT
ES
Inve
stm
ent
Sol
utio
ns P
ure
Fixe
d In
tere
st P
ortf
olio
8.3
4%
3
5.0
7%
2
1.6
5
30
.96
%3
0.6
1%
1.5
61
Mom
entu
m M
oder
ate
Bon
d FO
F8
.97
% 1
5
.37
% 3
1
.67
2
1.5
8%
11
.40
%1
.13
3
SYm
mE
TRY
Bon
d P
ortf
olio
8.8
8%
2
4.6
6%
1
1.9
0
11
.49
%2
1.1
2%
1.3
42
MONEYMARKETMANDAT
ES
Inve
stm
ent
Sol
utio
ns B
anke
r8
.21
% 1
0
.46
% 2
1
7.7
3
21
.59
%1
0.1
8%
8.7
52
SYm
mE
TRY
Mon
ey M
arke
t8
.09
% 2
0
.43
% 1
1
8.8
2
10
.85
%2
0.0
7%
11
.54
1
ABSOLU
TER
ETU
RNM
ANDAT
ES
Inve
stm
ent
Sol
utio
ns S
tabl
e Fo
cus
10
.15
%3
.01
% 3
.37
1
.33
%
Inve
stm
ent
Sol
utio
ns R
eal R
etur
n Fo
cus
Loca
l1
1.4
1%
4.0
9%
2.7
9
0.7
7%
Inve
stm
ent
Sol
utio
ns R
eal R
etur
n Fo
cus
Por
tfol
io1
0.2
8%
3.7
7%
2.7
3
-0.3
6%
SYm
mE
TRY
Abs
olut
e D
efen
sive
Fun
d1
0.1
2%
4.4
2%
2.2
9
0.2
0%
SYm
mE
TRY
Abs
olut
e B
alan
ced
Fund
13
.05
%7
.08
% 1
.84
1
.13
%
MEDIC
ALAID
MANDAT
ES
IS M
edic
al S
chem
es R
eal R
etur
n Fo
cus
11
.24
%4
.01
% 2
.80
1
2.4
2%
SectIOn 3Multi-Manager WatchtM Investment Performance (Specialist Mandates)
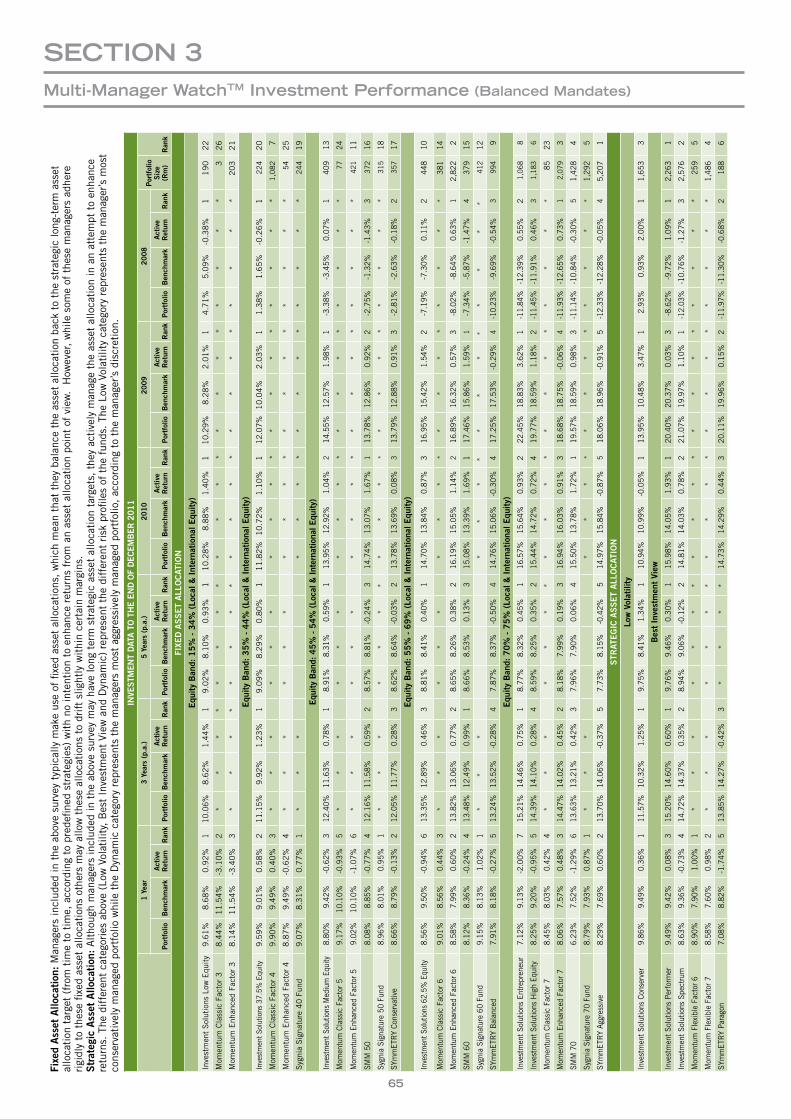
65
Fixe
dAssetA
lloca
tion
: M
anag
ers
incl
uded
in t
he a
bove
sur
vey
typi
cally
mak
e us
e of
fixe
d as
set
allo
cati
ons,
whi
ch m
ean
that
the
y ba
lanc
e th
e as
set
allo
cati
on b
ack
to t
he s
trat
egic
long
-ter
m a
sset
al
loca
tion
tar
get
(fro
m t
ime
to t
ime,
acc
ordi
ng t
o pr
edefi
ned
stra
tegi
es)
wit
h no
inte
ntio
n to
enh
ance
ret
urns
fro
m a
n as
set
allo
cati
on p
oint
of
view
. H
owev
er,
whi
le s
ome
of t
hese
man
ager
s ad
here
ri
gidl
y to
the
se fi
xed
asse
t al
loca
tion
s ot
hers
may
allo
w t
hese
allo
cati
ons
to d
rift
slig
htly
wit
hin
cert
ain
mar
gins
.Strateg
icA
ssetA
lloca
tion
: A
ltho
ugh
man
ager
s in
clud
ed in
the
abo
ve s
urve
y m
ay h
ave
long
ter
m s
trat
egic
ass
et a
lloca
tion
tar
gets
, th
ey a
ctiv
ely
man
age
the
asse
t al
loca
tion
in a
n at
tem
pt t
o en
hanc
e re
turn
s. T
he d
iffe
rent
cat
egor
ies
abov
e (L
ow V
olat
ility
, B
est
Inve
stm
ent
View
and
Dyn
amic
) re
pres
ent
the
diff
eren
t ri
sk p
rofil
es o
f th
e fu
nds.
The
Low
Vol
atili
ty c
ateg
ory
repr
esen
ts t
he m
anag
er’s
mos
t co
nser
vati
vely
man
aged
por
tfol
io w
hile
the
Dyn
amic
cat
egor
y re
pres
ents
the
man
ager
s m
ost
aggr
essi
vely
man
aged
por
tfol
io,
acco
rdin
g to
the
man
ager
’s d
iscr
etio
n.IN
VEST
MEN
TDAT
ATO
THEEN
DO
FDEC
EMBER
201
11Yea
r3Yea
rs(p.a.)
5Yea
rs(p.a.)
2010
2009
2008
Portfolio
Siz
e (R
m)
Ran
kPortfolio
Ben
chmark
Active
Ret
urn
Ran
kPortfolio
Ben
chmark
Active
Ret
urn
Ran
kPortfolio
Ben
chmark
Active
Ret
urn
Ran
kPortfolio
Ben
chmark
Active
Ret
urn
Ran
kPortfolio
Ben
chmark
Active
Ret
urn
Ran
kPortfolio
Ben
chmark
Active
Ret
urn
Ran
k
FIXE
DA
SSETALL
OCAT
ION
Equ
ityBan
d:1
5%
-3
4%
(Lo
cal&
Int
erna
tion
alE
quity)
Inve
stm
ent
Sol
utio
ns L
ow E
quit
y9
.61
%8
.68
%0
.92
%1
10.0
6%8
.62
%1
.44
%1
9.0
2%
8.1
0%
0.9
3%
11
0.2
8%
8.8
8%
1.4
0%
1
10.2
9%
8.2
8%
2.0
1%
1
4.7
1%
5.0
9%
-0.3
8%
1
19
0
22
Mom
entu
m C
lass
ic F
acto
r 3
8.4
4%
11
.54
%-3
.10
%2
**
**
**
**
**
* *
*
**
*
**
* *
3
2
6
Mom
entu
m E
nhan
ced
Fact
or 3
8.1
4%
11
.54
%-3
.40
%3
**
**
**
**
**
* *
*
**
*
**
* *
2
03
2
1
Equ
ityBan
d:3
5%
-4
4%
(Lo
cal&
Int
erna
tion
alE
quity)
Inve
stm
ent So
lutio
ns 3
7.5%
Equ
ity9
.59
%9
.01
%0
.58
%2
11.1
5%9
.92
%1
.23
%1
9.0
9%
8.2
9%
0.8
0%
11
1.8
2%
10
.72
%1
.10
% 1
12
.07%
10
.04
%2
.03
% 1
1
.38
%1
.65
%-0
.26
% 1
2
24
2
0
Mom
entu
m C
lass
ic F
acto
r 4
9.9
0%
9.4
9%
0.4
0%
3*
**
**
**
**
*
**
* *
*
**
*
1,0
82
7
Mom
entu
m E
nhan
ced
Fact
or 4
8.8
7%
9.4
9%
-0.6
2%
4*
**
**
**
**
*
**
* *
*
**
*
54
2
5
Syg
nia
Sig
natu
re 4
0 F
und
9.0
7%
8.3
1%
0.7
7%
1*
**
**
* *
*
**
*
**
* *
2
44
1
9
EquityB
and:4
5%-5
4%(Lo
cal&
Interna
tiona
lEqu
ity)
Inve
stm
ent S
olut
ions
Med
ium
Equ
ity8.
80%
9.42
%-0
.62%
312
.40%
11.6
3%0.
78%
18.
91%
8.31
%0.
59%
113
.95%
12.9
2%1.
04%
2
14.5
5%12
.57%
1.98
% 1
-3
.38%
-3.4
5%0.
07%
1
409
1
3
Mom
entu
m C
lass
ic F
acto
r 59.
17%
10.1
0%-0
.93%
5*
**
**
**
**
*
**
* *
*
**
*
77
24
Mom
entu
m E
nhan
ced
Fact
or 5
9.02
%10
.10%
-1.0
7%6
**
**
**
**
* *
*
**
*
**
* *
4
21
11
SMM
50
8.08
%8.
85%
-0.7
7%4
12.1
6%11
.58%
0.59
%2
8.57
%8.
81%
-0.2
4%3
14.7
4%13
.07%
1.67
% 1
13
.78%
12.8
6%0.
92%
2
-2.7
5%-1
.32%
-1.4
3% 3
3
72
16
Sygn
ia S
igna
ture
50
Fund
8.96
%8.
01%
0.95
%1
**
**
**
**
**
*
**
* *
*
**
*
315
1
8
SYm
mET
RY
Cons
erva
tive
8.66
%8.
79%
-0.1
3%2
12.0
5%11
.77%
0.28
%3
8.62
%8.
64%
-0.0
3%2
13.7
8%13
.69%
0.08
% 3
13
.79%
12.8
8%0.
91%
3
-2.8
1%-2
.63%
-0.1
8% 2
3
57
17
Equ
ityBan
d:5
5%
-6
9%
(Lo
cal&
Int
erna
tion
alE
quity)
Inve
stm
ent S
olut
ions
62.
5% E
quity
8.56
%9.
50%
-0.9
4%6
13.3
5%12
.89%
0.46
%3
8.81
%8.
41%
0.40
%1
14.7
0%13
.84%
0.87
%3
16.9
5%15
.42%
1.54
%2
-7.1
9%-7
.30%
0.11
% 2
44
8 10
Mom
entu
m C
lass
ic F
acto
r 69.
01%
8.56
%0.
44%
3*
**
**
**
**
*
**
* *
*
**
*
381
1
4
Mom
entu
m E
nhan
ced
Fact
or 6
8.58
%7.
99%
0.60
%2
13.8
2%13
.06%
0.77
%2
8.65
%8.
26%
0.38
%2
16.1
9%15
.05%
1.14
% 2
16
.89%
16.3
2%0.
57%
3
-8.0
2%-8
.64%
0.63
% 1
2
,822
2
SMM
60
8.12
%8.
36%
-0.2
4%4
13.4
8%12
.49%
0.99
%1
8.66
%8.
53%
0.13
%3
15.0
8%13
.39%
1.69
% 1
17
.46%
15.8
6%1.
59%
1
-7.3
4%-5
.87%
-1.4
7% 4
3
79
15
Sygn
ia S
igna
ture
60
Fund
9.15
%8.
13%
1.02
%1
**
**
**
*
**
* *
*
**
*
412
1
2
SYm
mET
RY
Bal
ance
d7.
91%
8.18
%-0
.27%
513
.24%
13.5
2%-0
.28%
47.
87%
8.37
%-0
.50%
414
.76%
15.0
6%-0
.30%
4
17.2
5%17
.53%
-0.2
9% 4
-1
0.23
%-9
.69%
-0.5
4% 3
9
94
9
Equ
ityBan
d:7
0%
-7
5%
(Lo
cal&
Int
erna
tion
alE
quity)
Inve
stm
ent S
olut
ions
Ent
repr
eneu
r7.
12%
9.13
%-2
.00%
715
.21%
14.4
6%0.
75%
18.
77%
8.32
%0.
45%
116
.57%
15.6
4%0.
93%
2
22.4
5%18
.83%
3.62
% 1
-1
1.84
%-1
2.39
%0.
55%
2
1,0
68
8
Inve
stm
ent S
olut
ions
Hig
h Eq
uity
8.25
%9.
20%
-0.9
5%5
14.3
9%14
.10%
0.28
%4
8.59
%8.
25%
0.35
%2
15.4
4%14
.72%
0.72
% 4
19
.77%
18.5
9%1.
18%
2
-11.
45%
-11.
91%
0.46
% 3
1
,183
6
Mom
entu
m C
lass
ic F
acto
r 78.
45%
8.03
%0.
42%
4*
**
**
**
**
* *
*
**
*
**
* *
8
5 2
3
Mom
entu
m E
nhan
ced
Fact
or 7
8.06
%7.
57%
0.48
%3
14.4
7%14
.02%
0.45
%2
8.18
%7.
99%
0.19
%3
16.9
4%16
.03%
0.91
% 3
18
.68%
18.7
5%-0
.06%
4
-11.
93%
-12.
65%
0.73
% 1
2
,079
3
SMM
70
6.23
%7.
52%
-1.2
9%6
13.6
3%13
.21%
0.42
%3
7.96
%7.
90%
0.06
%4
15.5
0%13
.78%
1.72
% 1
19
.57%
18.5
9%0.
98%
3
-11.
14%
-10.
84%
-0.3
0% 5
1
,428
4
Sygn
ia S
igna
ture
70
Fund
8.79
%7.
93%
0.87
%1
**
**
**
*
**
* *
*
**
*
1,2
92
5
SYm
mET
RY
Aggr
essi
ve8.
29%
7.69
%0.
60%
213
.70%
14.0
6%-0
.37%
57.
73%
8.15
%-0
.42%
514
.97%
15.8
4%-0
.87%
5
18.0
6%18
.96%
-0.9
1% 5
-1
2.33
%-1
2.28
%-0
.05%
4
5,2
07
1
STR
ATEGIC
ASSETALL
OCAT
ION
LowVolatility
Inve
stm
ent S
olut
ions
Con
serv
er9.
86%
9.49
%0.
36%
111
.57%
10.3
2%1.
25%
19.
75%
8.41
%1.
34%
110
.94%
10.9
9%-0
.05%
1
13.9
5%10
.48%
3.47
% 1
2.
93%
0.93
%2.
00%
1
1,6
53
3
Bes
tIn
vestmen
tView
Inve
stm
ent S
olut
ions
Per
form
er9.
49%
9.42
%0.
08%
315
.20%
14.6
0%0.
60%
19.
76%
9.46
%0.
30%
115
.98%
14.0
5%1.
93%
1
20.4
0%20
.37%
0.03
% 3
-8
.62%
-9.7
2%1.
09%
1
2,2
63
1
Inve
stm
ent S
olut
ions
Spe
ctru
m8.
63%
9.36
%-0
.73%
414
.72%
14.3
7%0.
35%
28.
94%
9.06
%-0
.12%
214
.81%
14.0
3%0.
78%
2
21.0
7%19
.97%
1.10
% 1
-1
2.03
%-1
0.76
%-1
.27%
3
2,5
76
2
Mom
entu
m F
lexi
ble
Fact
or 6
8.90
%7.
90%
1.00
%1
**
**
**
**
**
*
**
* *
*
**
*
259
5
Mom
entu
m F
lexi
ble
Fact
or 7
8.58
%7.
60%
0.98
%2
**
**
**
**
**
*
**
* *
*
**
*
1,4
86
4
SYm
mET
RY
Para
gon
7.08
%8.
82%
-1.7
4%5
13.8
5%14
.27%
-0.4
2%3
**
**
14.7
3%14
.29%
0.44
% 3
20
.11%
19.9
6%0.
15%
2
-11.
97%
-11.
30%
-0.6
8% 2
1
88
6
SectIOn 3Multi-Manager WatchtM Investment Performance (Balanced Mandates)
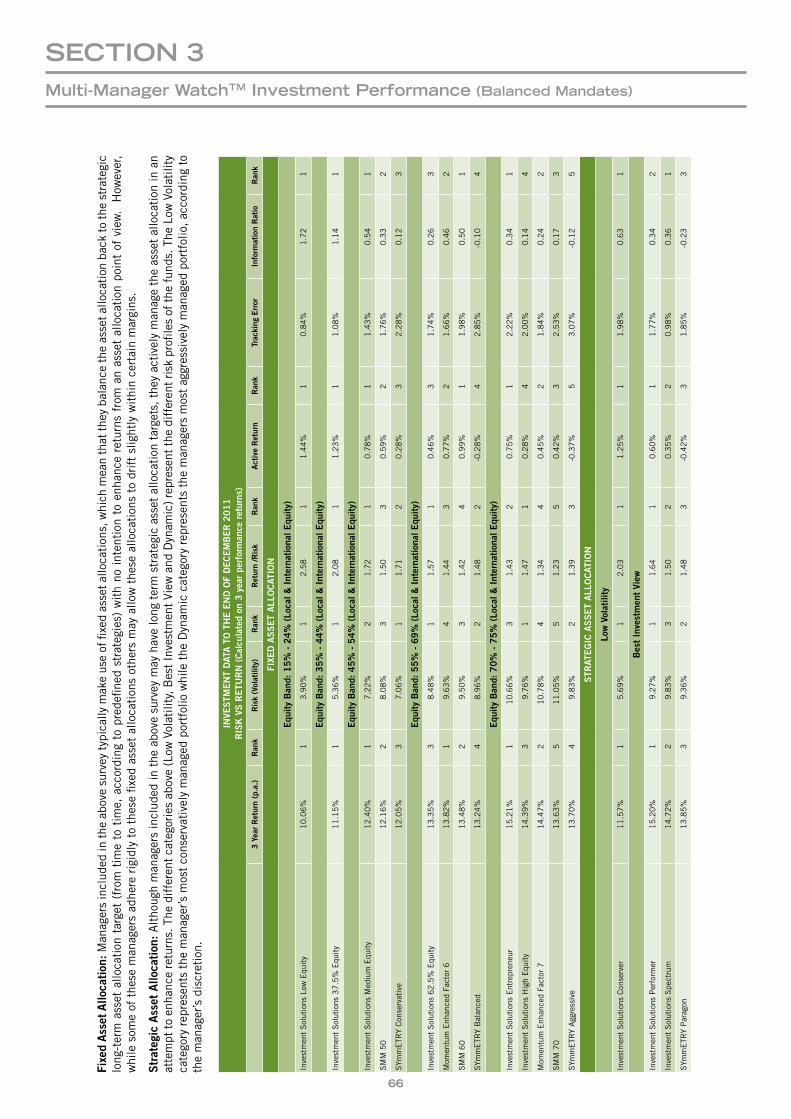
66
Fixe
dAss
etAllo
cation
: Man
ager
s in
clud
ed in
the
abov
e su
rvey
typi
cally
mak
e us
e of
fixe
d as
set a
lloca
tion
s, w
hich
mea
n th
at th
ey b
alan
ce th
e as
set a
lloca
tion
bac
k to
the
stra
tegi
c lo
ng-t
erm
ass
et a
lloca
tion
tar
get
(fro
m t
ime
to t
ime,
acc
ordi
ng t
o pr
edefi
ned
stra
tegi
es)
wit
h no
int
enti
on t
o en
hanc
e re
turn
s fr
om a
n as
set
allo
cati
on p
oint
of
view
. H
owev
er,
whi
le s
ome
of t
hese
man
ager
s ad
here
rig
idly
to
thes
e fix
ed a
sset
allo
cati
ons
othe
rs m
ay a
llow
the
se a
lloca
tion
s to
dri
ft s
light
ly w
ithi
n ce
rtai
n m
argi
ns.
Strateg
icA
ssetA
lloca
tion
: Alt
houg
h m
anag
ers
incl
uded
in t
he a
bove
sur
vey
may
hav
e lo
ng t
erm
str
ateg
ic a
sset
allo
cati
on t
arge
ts, th
ey a
ctiv
ely
man
age
the
asse
t al
loca
tion
in a
n at
tem
pt to
enha
nce
retu
rns.
The
dif
fere
nt c
ateg
orie
s ab
ove
(Low
Vol
atili
ty, B
est In
vest
men
t Vi
ew a
nd D
ynam
ic) re
pres
ent th
e di
ffer
ent ri
sk p
rofil
es o
f th
e fu
nds.
The
Low
Vol
atili
ty
cate
gory
rep
rese
nts
the
man
ager
’s m
ost
cons
erva
tive
ly m
anag
ed p
ortf
olio
whi
le t
he D
ynam
ic c
ateg
ory
repr
esen
ts t
he m
anag
ers
mos
t ag
gres
sive
ly m
anag
ed p
ortf
olio
, acc
ordi
ng t
o th
e m
anag
er’s
dis
cret
ion.
INVE
STM
ENTDAT
ATOTHEE
NDO
FDECEMBER2
011
RIS
KVSR
ETU
RN(Calcu
latedon
3yea
rpe
rforman
ceretur
ns)
3Yea
rRetur
n(p
.a.)
Ran
kRisk(Volatility)
Ran
kRetur
n/R
isk
Ran
kActiveRetur
nRan
kTrac
king
Error
Inform
ationRatio
Ran
k
FIXE
DA
SSETALL
OCAT
ION
Equ
ityBan
d:1
5%
-2
4%
(Lo
cal&
Int
erna
tion
alE
quity)
Inve
stm
ent
Sol
utio
ns L
ow E
quit
y1
0.0
6%
1
3.9
0%
1
2.5
8
11
.44
%1
0.8
4%
1.7
21
Equ
ityBan
d:3
5%
-4
4%
(Lo
cal&
Int
erna
tion
alE
quity)
Inve
stm
ent
Sol
utio
ns 3
7.5
% E
quit
y1
1.1
5%
1
5.3
6%
1
2.0
8
11
.23
%1
1.0
8%
1.1
41
Equ
ityBan
d:4
5%
-5
4%
(Lo
cal&
Int
erna
tion
alE
quity)
Inve
stm
ent
Sol
utio
ns M
ediu
m E
quit
y1
2.4
0%
1
7.2
2%
2
1.7
2
10
.78
%1
1.4
3%
0.5
41
SM
M 5
01
2.1
6%
2
8.0
8%
3
1.5
0
30
.59
%2
1.7
6%
0.3
32
SYm
mE
TRY
Con
serv
ativ
e1
2.0
5%
3
7.0
6%
1
1.7
1
20
.28
%3
2.2
8%
0.1
23
Equ
ityBan
d:5
5%
-6
9%
(Lo
cal&
Int
erna
tion
alE
quity)
Inve
stm
ent
Sol
utio
ns 6
2.5
% E
quit
y1
3.3
5%
3
8.4
8%
1
1.5
7
10
.46
%3
1.7
4%
0.2
63
Mom
entu
m E
nhan
ced
Fact
or 6
13
.82
% 1
9
.63
% 4
1
.44
3
0.7
7%
21
.66
%0
.46
2
SM
M 6
01
3.4
8%
2
9.5
0%
3
1.4
2
40
.99
%1
1.9
8%
0.5
01
SYm
mE
TRY
Bal
ance
d1
3.2
4%
4
8.9
6%
2
1.4
8
2-0
.28
%4
2.8
5%
-0.1
04
Equ
ityBan
d:7
0%
-7
5%
(Lo
cal&
Int
erna
tion
alE
quity)
Inve
stm
ent
Sol
utio
ns E
ntre
pren
eur
15
.21
% 1
1
0.6
6%
3
1.4
3
20
.75
%1
2.2
2%
0.3
41
Inve
stm
ent
Sol
utio
ns H
igh
Equ
ity
14
.39
% 3
9
.76
% 1
1
.47
1
0.2
8%
42
.00
%0
.14
4
Mom
entu
m E
nhan
ced
Fact
or 7
14
.47
% 2
1
0.7
8%
4
1.3
4
40
.45
%2
1.8
4%
0.2
42
SM
M 7
01
3.6
3%
5
11
.05
% 5
1
.23
5
0.4
2%
32
.53
%0
.17
3
SYm
mE
TRY
Agg
ress
ive
13
.70
% 4
9
.83
% 2
1
.39
3
-0.3
7%
53
.07
%-0
.12
5
STR
ATEGIC
ASSETALL
OCAT
ION
LowVolatility
Inve
stm
ent
Sol
utio
ns C
onse
rver
11
.57
% 1
5
.69
% 1
2
.03
1
1.2
5%
11
.98
%0
.63
1
Bes
tIn
vestmen
tView
Inve
stm
ent
Sol
utio
ns P
erfo
rmer
15
.20
% 1
9
.27
% 1
1
.64
1
0.6
0%
11
.77
%0
.34
2
Inve
stm
ent
Sol
utio
ns S
pect
rum
14
.72
% 2
9
.83
% 3
1
.50
2
0.3
5%
20
.98
%0
.36
1
SYm
mE
TRY
Par
agon
13
.85
% 3
9
.36
% 2
1
.48
3
-0.4
2%
31
.85
%-0
.23
3
SectIOn 3Multi-Manager WatchtM Investment Performance (Balanced Mandates)
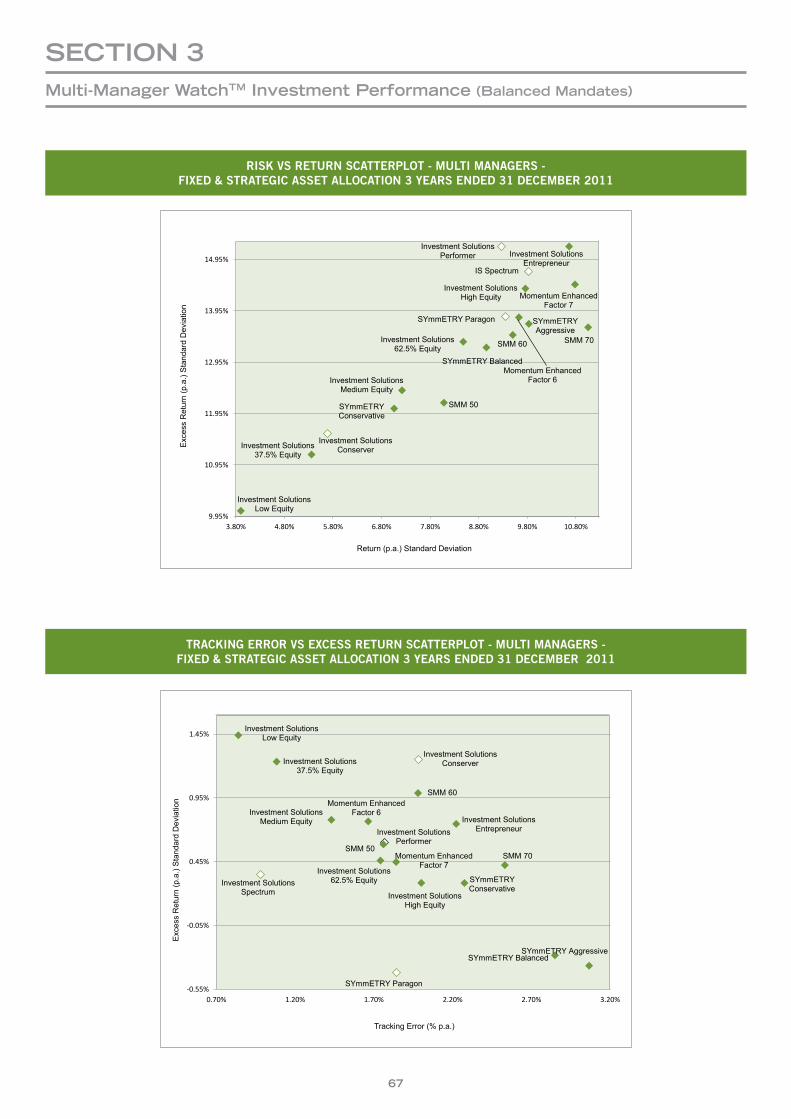
67
TRACKINGERRORVSEXCESSRETURNSCATTERPLOT-MULTIMANAGERS-FIXED&STRATEGICASSETALLOCATION3YEARSENDED31DECEMBER2011
SectIOn 3Multi-Manager WatchtM Investment Performance (Balanced Mandates)
MULTI-MANAGER WATCH™ INVESTMENT PERFORMANCE (Balanced Mandates)
Investment Solutions Low Equity
Investment Solutions 37.5% Equity
Investment Solutions Medium Equity
SMM 50 SYmmETRY Conservative
Momentum Enhanced Factor 6
Investment Solutions 62.5% Equity SMM 60
SYmmETRY Balanced
Momentum Enhanced Factor 7
Investment Solutions Entrepreneur
Investment Solutions High Equity
SMM 70
SYmmETRY Aggressive
Investment Solutions Conserver
Investment Solutions Performer
IS Spectrum
SYmmETRY Paragon
9.95%
10.95%
11.95%
12.95%
13.95%
14.95%
3.80% 4.80% 5.80% 6.80% 7.80% 8.80% 9.80% 10.80%
Risk vs Return Scatterplot - Multi Managers Fixed & Strategic Asset Allocation 3 Years ended 31 December 2011
Investment Solutions Low Equity
Investment Solutions 37.5% Equity
Investment Solutions Medium Equity
SMM 50
SYmmETRY Conservative
Momentum Enhanced Factor 6
Investment Solutions 62.5% Equity
SMM 60
SYmmETRY Balanced
Momentum Enhanced Factor 7
Investment Solutions Entrepreneur
Investment Solutions High Equity
SMM 70
SYmmETRY Aggressive
Investment Solutions Conserver
Investment Solutions Performer
Investment Solutions Spectrum
SYmmETRY Paragon -0.55%
-0.05%
0.45%
0.95%
1.45%
0.70% 1.20% 1.70% 2.20% 2.70% 3.20%
Exess Return vs Tracking Error Scatterplot - Multi Managers Fixed & Strategic Asset Allocation 3 Years ended 31 December 2011
RISKVSRETURNSCATTERPLOT-MULTIMANAGERS-FIXED&STRATEGICASSETALLOCATION3YEARSENDED31DECEMBER2011
MULTI-MANAGER WATCH™ INVESTMENT PERFORMANCE (Balanced Mandates)
Investment Solutions Low Equity
Investment Solutions 37.5% Equity
Investment Solutions Medium Equity
SMM 50 SYmmETRY Conservative
Momentum Enhanced Factor 6
Investment Solutions 62.5% Equity SMM 60
SYmmETRY Balanced
Momentum Enhanced Factor 7
Investment Solutions Entrepreneur
Investment Solutions High Equity
SMM 70
SYmmETRY Aggressive
Investment Solutions Conserver
Investment Solutions Performer
IS Spectrum
SYmmETRY Paragon
9.95%
10.95%
11.95%
12.95%
13.95%
14.95%
3.80% 4.80% 5.80% 6.80% 7.80% 8.80% 9.80% 10.80%
Risk vs Return Scatterplot - Multi Managers Fixed & Strategic Asset Allocation 3 Years ended 31 December 2011
Investment Solutions Low Equity
Investment Solutions 37.5% Equity
Investment Solutions Medium Equity
SMM 50
SYmmETRY Conservative
Momentum Enhanced Factor 6
Investment Solutions 62.5% Equity
SMM 60
SYmmETRY Balanced
Momentum Enhanced Factor 7
Investment Solutions Entrepreneur
Investment Solutions High Equity
SMM 70
SYmmETRY Aggressive
Investment Solutions Conserver
Investment Solutions Performer
Investment Solutions Spectrum
SYmmETRY Paragon -0.55%
-0.05%
0.45%
0.95%
1.45%
0.70% 1.20% 1.70% 2.20% 2.70% 3.20%
Exess Return vs Tracking Error Scatterplot - Multi Managers Fixed & Strategic Asset Allocation 3 Years ended 31 December 2011
Return (p.a.) Standard Deviation
Tracking Error (% p.a.)
Exc
ess
Ret
urn
(p.a
.) S
tand
ard
Dev
iatio
nE
xces
s R
etur
n (p
.a.)
Sta
ndar
d D
evia
tion
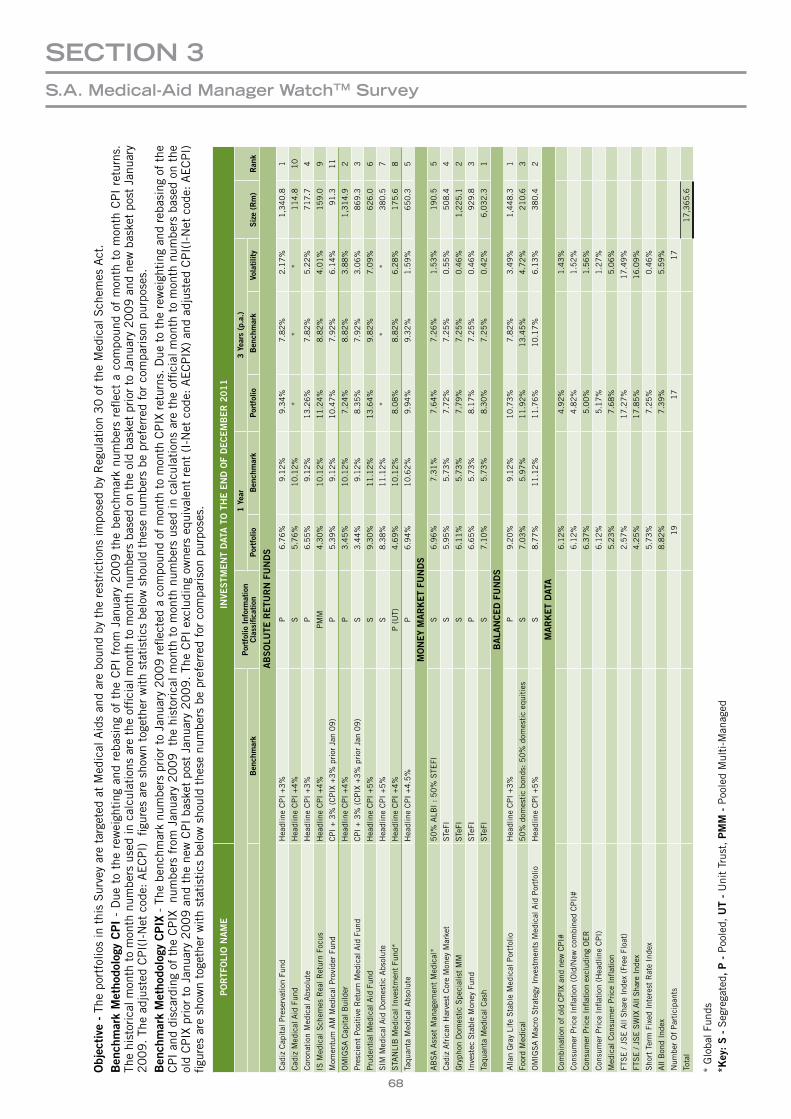
68
Objec
tive
-T
he p
ortf
olio
s in
thi
s S
urve
y ar
e ta
rget
ed a
t M
edic
al A
ids
and
are
boun
d by
the
res
tric
tion
s im
pose
d by
Reg
ulat
ion
30
of
the
Med
ical
Sch
emes
Act
.Ben
chmarkMetho
dology
CPI
- D
ue t
o th
e re
wei
ghti
ng a
nd r
ebas
ing
of t
he C
PI
from
Jan
uary
20
09
the
ben
chm
ark
num
bers
refl
ect
a co
mpo
und
of m
onth
to
mon
th C
PI
retu
rns.
Th
e hi
stor
ical
mon
th t
o m
onth
num
bers
use
d in
cal
cula
tion
s ar
e th
e of
ficia
l mon
th t
o m
onth
num
bers
bas
ed o
n th
e ol
d ba
sket
pri
or t
o Ja
nuar
y 2
00
9 a
nd n
ew b
aske
t po
st J
anua
ry
20
09
. Th
e ad
just
ed C
PI(
I-N
et c
ode:
AE
CP
I) fig
ures
are
sho
wn
toge
ther
wit
h st
atis
tics
bel
ow s
houl
d th
ese
num
bers
be
pref
erre
d fo
r co
mpa
riso
n pu
rpos
es.
Ben
chmarkMetho
dology
CPIX
- T
he b
ench
mar
k nu
mbe
rs p
rior
to
Janu
ary
20
09
refl
ecte
d a
com
poun
d of
mon
th t
o m
onth
CP
IX r
etur
ns. D
ue t
o th
e re
wei
ghti
ng a
nd r
ebas
ing
of t
he
CP
I an
d di
scar
ding
of
the
CP
IX
num
bers
fro
m J
anua
ry 2
00
9
the
hist
oric
al m
onth
to
mon
th n
umbe
rs u
sed
in c
alcu
lati
ons
are
the
offic
ial m
onth
to
mon
th n
umbe
rs b
ased
on
the
old
CP
IX p
rior
to
Janu
ary
20
09
and
the
new
CP
I ba
sket
pos
t Ja
nuar
y 2
00
9.
The
CP
I ex
clud
ing
owne
rs e
quiv
alen
t re
nt (
I-N
et c
ode:
AE
CP
IX)
and
adju
sted
CP
I(I-
Net
cod
e: A
EC
PI)
fig
ures
are
sho
wn
toge
ther
wit
h st
atis
tics
bel
ow s
houl
d th
ese
num
bers
be
pref
erre
d fo
r co
mpa
riso
n pu
rpos
es.
PORTF
OLI
ON
AME
INVE
STM
ENTDAT
ATOTHEE
NDO
FDECEMBER2
011
PortfolioInf
ormation
Class
ifica
tion
1Yea
r3Yea
rs(p.a.)
Size(R
m)
Ran
kBen
chmark
Portfolio
Ben
chmark
Portfolio
Ben
chmark
Volatilit
y
ABSOLU
TER
ETU
RNFUNDS
Cad
iz C
apit
al P
rese
rvat
ion
Fund
Hea
dlin
e C
PI
+3
%P
6.7
6%
9.1
2%
9.3
4%
7.8
2%
2.1
7%
1,3
40
.81
Cad
iz M
edic
al A
id F
und
Hea
dlin
e C
PI
+4
%S
5.7
6%
10
.12
%*
**
11
4.8
10
Cor
onat
ion
Med
ical
Abs
olut
eH
eadl
ine
CP
I +3
%P
6.5
5%
9.1
2%
13
.26
%7
.82
%5
.22
%7
17
.74
IS M
edic
al S
chem
es R
eal R
etur
n Fo
cus
Hea
dlin
e C
PI
+4
%P
MM
4.3
0%
10
.12
%1
1.2
4%
8.8
2%
4.0
1%
15
9.0
9
Mom
entu
m A
M M
edic
al P
rovi
der
Fund
CP
I + 3
% (
CP
IX +
3%
pri
or J
an 0
9)
P5
.39
%9
.12
%1
0.4
7%
7.9
2%
6.1
4%
91
.31
1
OM
IGS
A C
apit
al B
uild
erH
eadl
ine
CP
I +4
%P
3.4
5%
10
.12
%7
.24
%8
.82
%3
.88
%1
,31
4.9
2
Pre
scie
nt P
osit
ive
Ret
urn
Med
ical
Aid
Fun
dC
PI
+ 3
% (
CP
IX +
3%
pri
or J
an 0
9)
S3
.44
%9
.12
%8
.35
%7
.92
%3
.06
%8
69
.33
Pru
dent
ial M
edic
al A
id F
und
Hea
dlin
e C
PI
+5
%S
9.3
0%
11
.12
%1
3.6
4%
9.8
2%
7.0
9%
62
6.0
6
SIM
Med
ical
Aid
Dom
esti
c A
bsol
ute
Hea
dlin
e C
PI
+5
%S
8.3
8%
11
.12
%*
**
38
0.5
7
STA
NLI
B M
edic
al I
nves
tmen
t Fu
nd*
Hea
dlin
e C
PI
+4
%P
(U
T)4
.69
%1
0.1
2%
8.0
8%
8.8
2%
6.2
8%
17
5.6
8
Taqu
anta
Med
ical
Abs
olut
eH
eadl
ine
CP
I +4
.5%
P6
.94
%1
0.6
2%
9.9
4%
9.3
2%
1.5
9%
65
0.3
5
MONEYMARKETFU
NDS
AB
SA
Ass
et M
anag
emen
t M
edic
al*
50
% A
LBI
: 5
0%
STE
FIS
6.9
6%
7.3
1%
7.6
4%
7.2
6%
1.5
3%
19
0.5
5
Cad
iz A
fric
an H
arve
st C
ore
Mon
ey M
arke
tS
TeFI
S5
.95
%5
.73
%7
.72
%7
.25
%0
.55
%5
08
.44
Gry
phon
Dom
esti
c S
peci
alis
t M
MS
TeFI
S6
.11
%5
.73
%7
.79
%7
.25
%0
.46
%1
,22
5.1
2
Inve
stec
Sta
ble
Mon
ey F
und
STe
FIP
6.6
5%
5.7
3%
8.1
7%
7.2
5%
0.4
6%
92
9.8
3
Taqu
anta
Med
ical
Cas
hS
TeFI
S7
.10
%5
.73
%8
.30
%7
.25
%0
.42
%6
,03
2.3
1
BALA
NCEDFUNDS
Alla
n G
ray
Life
Sta
ble
Med
ical
Por
tfol
ioH
eadl
ine
CP
I +3
%P
9.2
0%
9.1
2%
10
.73
%7
.82
%3
.49
%1
,44
8.3
1
Foor
d M
edic
al5
0%
dom
esti
c bo
nds:
50
% d
omes
tic
equi
ties
S7
.03
%5
.97
%1
1.9
2%
13
.45
%4
.72
%2
10
.63
OM
IGS
A M
acro
Str
ateg
y In
vest
men
ts M
edic
al A
id P
ortf
olio
Hea
dlin
e C
PI
+5
%S
8.7
7%
11
.12
%1
1.7
6%
10
.17
%6
.13
%3
80
.42
MARKETDAT
AC
ombi
nati
on o
f ol
d C
PIX
and
new
CP
I#6
.12
%4
.92
%1
.43
%
Con
sum
er P
rice
Infl
atio
n (O
ld/N
ew c
ombi
ned
CP
I)#
6.1
2%
4.8
2%
1.5
2%
Con
sum
er P
rice
Infl
atio
n ex
clud
ing
OE
R6
.37
%5
.00
%1
.56
%
Con
sum
er P
rice
Infl
atio
n (H
eadl
ine
CP
I)6
.12
%5
.17
%1
.27
%
Med
ical
Con
sum
er P
rice
Infl
atio
n5
.23
%7
.68
%5
.06
%
FTS
E /
JSE
All
Sha
re I
ndex
(Fr
ee F
loat
)2
.57
%1
7.2
7%
17
.49
%
FTS
E /
JSE
SW
IX A
ll S
hare
Ind
ex
4.2
5%
17
.85
%1
6.0
9%
Sho
rt T
erm
Fix
ed I
nter
est
Rat
e In
dex
5.7
3%
7.2
5%
0.4
6%
All
Bon
d In
dex
8.8
2%
7.3
9%
5.5
9%
Num
ber
Of
Par
tici
pant
s1
91
71
7
Tota
l1
7,3
65
.6
* G
loba
l Fun
ds*K
ey:S-S
egre
gate
d,P
-P
oole
d,U
T-
Uni
t Tr
ust,
PMM-P
oole
d M
ulti
-Man
aged
SectIOn 3S.a. Medical-aid Manager WatchtM Survey
151211_AFFS_Print Ad_297mmx210mm.indd 1 15/12/2011 11:55:23 AM
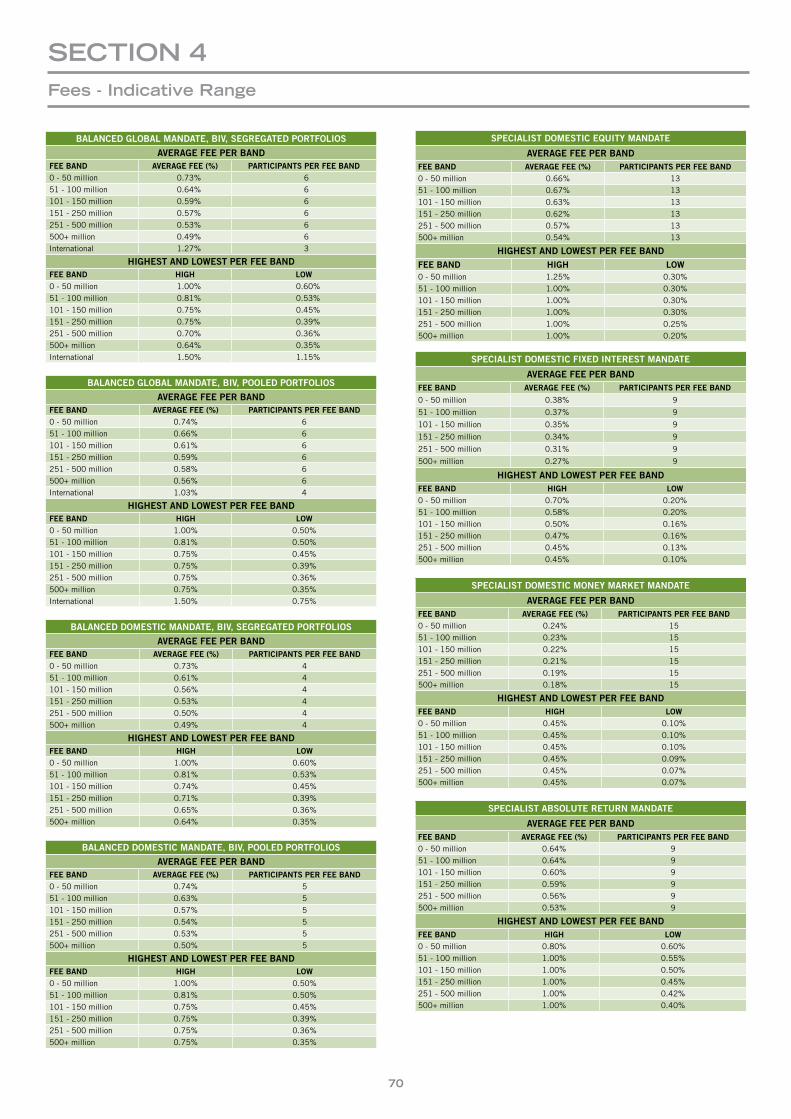
70
BALANCEDGLOBALMANDATE,BIV,SEGREGATEDPORTFOLIOS
AVERAGEFEEPERBANDFEEBAND AVERAGEFEE(%) PARTICIPANTSPERFEEBAND0 - 50 million 0.73% 651 - 100 million 0.64% 6101 - 150 million 0.59% 6151 - 250 million 0.57% 6251 - 500 million 0.53% 6500+ million 0.49% 6International 1.27% 3
HIGHESTANDLOWESTPERFEEBANDFEEBAND HIGH LOW0 - 50 million 1.00% 0.60%51 - 100 million 0.81% 0.53%101 - 150 million 0.75% 0.45%151 - 250 million 0.75% 0.39%251 - 500 million 0.70% 0.36%500+ million 0.64% 0.35%International 1.50% 1.15%
BALANCEDGLOBALMANDATE,BIV,POOLEDPORTFOLIOS
AVERAGEFEEPERBANDFEEBAND AVERAGEFEE(%) PARTICIPANTSPERFEEBAND0 - 50 million 0.74% 651 - 100 million 0.66% 6101 - 150 million 0.61% 6151 - 250 million 0.59% 6251 - 500 million 0.58% 6500+ million 0.56% 6International 1.03% 4
HIGHESTANDLOWESTPERFEEBANDFEEBAND HIGH LOW0 - 50 million 1.00% 0.50%51 - 100 million 0.81% 0.50%101 - 150 million 0.75% 0.45%151 - 250 million 0.75% 0.39%251 - 500 million 0.75% 0.36%500+ million 0.75% 0.35%International 1.50% 0.75%
BALANCEDDOMESTICMANDATE,BIV,SEGREGATEDPORTFOLIOS
AVERAGEFEEPERBANDFEEBAND AVERAGEFEE(%) PARTICIPANTSPERFEEBAND0 - 50 million 0.73% 451 - 100 million 0.61% 4101 - 150 million 0.56% 4151 - 250 million 0.53% 4251 - 500 million 0.50% 4500+ million 0.49% 4
HIGHESTANDLOWESTPERFEEBANDFEEBAND HIGH LOW0 - 50 million 1.00% 0.60%51 - 100 million 0.81% 0.53%101 - 150 million 0.74% 0.45%151 - 250 million 0.71% 0.39%251 - 500 million 0.65% 0.36%500+ million 0.64% 0.35%
BALANCEDDOMESTICMANDATE,BIV,POOLEDPORTFOLIOS
AVERAGEFEEPERBANDFEEBAND AVERAGEFEE(%) PARTICIPANTSPERFEEBAND0 - 50 million 0.74% 551 - 100 million 0.63% 5101 - 150 million 0.57% 5151 - 250 million 0.54% 5251 - 500 million 0.53% 5500+ million 0.50% 5
HIGHESTANDLOWESTPERFEEBANDFEEBAND HIGH LOW0 - 50 million 1.00% 0.50%51 - 100 million 0.81% 0.50%101 - 150 million 0.75% 0.45%151 - 250 million 0.75% 0.39%251 - 500 million 0.75% 0.36%500+ million 0.75% 0.35%
SPECIALISTDOMESTICEQUITYMANDATE
AVERAGEFEEPERBANDFEEBAND AVERAGEFEE(%) PARTICIPANTSPERFEEBAND0 - 50 million 0.66% 1351 - 100 million 0.67% 13101 - 150 million 0.63% 13151 - 250 million 0.62% 13251 - 500 million 0.57% 13500+ million 0.54% 13
HIGHESTANDLOWESTPERFEEBANDFEEBAND HIGH LOW0 - 50 million 1.25% 0.30%51 - 100 million 1.00% 0.30%101 - 150 million 1.00% 0.30%151 - 250 million 1.00% 0.30%251 - 500 million 1.00% 0.25%500+ million 1.00% 0.20%
SPECIALISTDOMESTICFIXEDINTERESTMANDATE
AVERAGEFEEPERBANDFEEBAND AVERAGEFEE(%) PARTICIPANTSPERFEEBAND
0 - 50 million 0.38% 9
51 - 100 million 0.37% 9
101 - 150 million 0.35% 9
151 - 250 million 0.34% 9
251 - 500 million 0.31% 9
500+ million 0.27% 9
HIGHESTANDLOWESTPERFEEBANDFEEBAND HIGH LOW0 - 50 million 0.70% 0.20%51 - 100 million 0.58% 0.20%101 - 150 million 0.50% 0.16%151 - 250 million 0.47% 0.16%251 - 500 million 0.45% 0.13%500+ million 0.45% 0.10%
SPECIALISTDOMESTICMONEYMARKETMANDATE
AVERAGEFEEPERBANDFEEBAND AVERAGEFEE(%) PARTICIPANTSPERFEEBAND0 - 50 million 0.24% 1551 - 100 million 0.23% 15101 - 150 million 0.22% 15151 - 250 million 0.21% 15251 - 500 million 0.19% 15500+ million 0.18% 15
HIGHESTANDLOWESTPERFEEBANDFEEBAND HIGH LOW0 - 50 million 0.45% 0.10%51 - 100 million 0.45% 0.10%101 - 150 million 0.45% 0.10%151 - 250 million 0.45% 0.09%251 - 500 million 0.45% 0.07%500+ million 0.45% 0.07%
SPECIALISTABSOLUTERETURNMANDATE
AVERAGEFEEPERBANDFEEBAND AVERAGEFEE(%) PARTICIPANTSPERFEEBAND0 - 50 million 0.64% 951 - 100 million 0.64% 9101 - 150 million 0.60% 9151 - 250 million 0.59% 9251 - 500 million 0.56% 9500+ million 0.53% 9
HIGHESTANDLOWESTPERFEEBANDFEEBAND HIGH LOW0 - 50 million 0.80% 0.60%51 - 100 million 1.00% 0.55%101 - 150 million 1.00% 0.50%151 - 250 million 1.00% 0.45%251 - 500 million 1.00% 0.42%500+ million 1.00% 0.40%
SectIOn 4Fees - Indicative range

71 www.vunanifm.co.za
Others may raise the bar, but it’s through experience that one exceeds what is expected
With an average of over 19 years experience in asset management, Vunani Fund Managers is committed to building a leading, truly black-owned fund management business. We focus on investment performance and client service in Multi-Asset, Specialist Bonds, Specialist Equity and Specialist Property. For more information please call us on (021) 670 4900 or email on [email protected]
Vunani Fund Managers is an Authorised Financial Services Provider (license no. 608) in terms of the Financial Advisory and Intermediary Services Act, No. 37 of 2002.
72
ABSOLUTE/REALRETURNPORTFOLIOS
Employ an investment strategy targeting a positive nominal/real return e.g. capital preservation over rolling 12 months or inflation plus 5% over rolling 36 months.
ACTIVEMANAGEMENT
Approach to investment management, which aims to outperform a particular index or benchmark through either asset allocation or stock selection or both.
ALBI
Bond Exchange of South Africa All Bond Index. A total return index of major bonds traded on the Bond Exchange.
ANNUALISED
To convert an investment return of over one year into an equivalent one-year rate of return.
ASSETCLASS
Broad category of assets e.g. equities, bonds, property and cash.
BALANCEDMANDATES
Where an investment manager is given broad discretion with respect to the management of assets across multiple asset classes.
BASISPOINT
100 Basis points = 1%, i.e. one basis point is 1/100th of 1%.
BENCHMARK
Measure against which a portfolio’s performance is assessed. Benchmarks may take many forms, but unfortunately, some of the benchmarks used are not appropriate for performance evaluation (e.g. CPI+x% or peer universe medians and averages). For performance evaluation, benchmarks used should have the properties of valid benchmarks.
BOND
Debt issued by a government or a company, typically promising regular payments of coupons (interest) on specified dates with a final capital payment at redemption (maturity). Bonds may have many different characteristics to those specified here.
COMPOSITE
A group of similarly managed portfolios within a single asset manager, and typically defined within the asset managers’ GIPS™ policy.
COMPOUNDRATEOFRETURNS
Total return calculated by multiplying returns for different periods.
CREDIT
Debt that is not guaranteed by local (not foreign) Government, and hence could default on its promise to repay the debt holder. Although debt issued and guaranteed by local Government can also default, this does not typically happen because local Government can print unrestricted amounts of local currency.
CPI
Consumer Price Index. Also see Inflation.
CUMULATIVERETURNS
The cumulative return for a portfolio or an asset is the cumulative compound return over the full length of a specified time period. The percentage measure of this return is not annualised and as such represents the actual total return of the portfolio or asset over the period. By annualising the percentage figure, one can calculate the average annual return of the portfolio or asset over the period.
DURATION
Average term of payments from a bond taking into account the present value of each payment. The longer the duration the more sensitive the price of the bond to the changes in yields. Duration effectively measures the price sensitivity of a bond to a change in its yield, and is almost always different to its maturity i.e. the term to its final payment.
EQUITIES
Commonly used name for ordinary shares.
FEES
Charges levied by investment managers usually in the form of a percentage of assets under management. Charges could be on a fixed or sliding scale that decreases with fund size.
FTSE/JSEALLSHAREINDEX
An index of approximately 165 of the largest (by market capitalization) companies with the most liquid shares on the JSE. It includes the Large Cap, Medium Cap and Small Cap shares, but excludes the Fledgling and AltX shares.
GIPSTM
The Global Investment Performance Standards, is a set of standards for promoting fair and full disclosure and transparency for investment managers. They are sponsored by CFA Institute™ and intended for global use.
HEDGEFUNDS
Hedge Funds represent a heterogeneous group of investment strategies. They can operate on very narrow asset classes, or across the globe. They can be very liquid or illiquid. They can contain leveraged exposure to systematic risks, or hedge these away. They may use derivative instruments and may take short positions directly with futures contracts or by borrowing securities and selling these. Due to these factors, hedge funds are subject to unique risks and fewer restrictions compared to traditional investments.
INFLATION
Measure of the rate of increase in prices e.g. CPI.
INFORMATIONRATIO
Ratio of excess return (relative to benchmark) to risk taken (as measured by tracking error). A risk-adjusted measure of return, relative to benchmark.
DISPERSION
The extent to which the returns of all portfolios within a composite differ. It can be measured in different ways, including: the difference between the maximum and the
SectIOn 5glossary
73
minimum return (range); the difference between the 1st and 3rd quartile (inter-quartile range); or the standard deviation of returns.
INVESTMENTMANAGER
Organisation that invests assets on behalf of third parties for a fee.
INVESTMENTPHILOSOPHY
The investment premises and beliefs that asset managers use in formulating the way they invest assets.
LEVERAGE
Arises where the investor’s financial exposure to moves in the price of the underlying asset exceeds that implied by the capital invested by the investor. Leverage can be achieved by borrowing or by purchasing securities or instruments on margin (e.g. futures and options).
LONGPOSITION
Positive exposure to the underlying asset i.e. the value of your investment increases as the underlying asset increases in value. This is in contrast to a short position (see below).
LOWERQUARTILE
The value below which one quarter of returns or data fall.
MAXIMUMDRAWDOWN
The largest continuous cumulative negative return i.e. it represents the maximum change in value (in percentage terms) of a portfolio from a peak to a trough if looking at unit prices/ NAVs / cumulative returns.
MEDIAN
The value which half the returns or data fall above, and half fall below.
MONEYMARKET
Market for short-term loans and deposits with a maturity less than one year.
OVERWEIGHT
Exposure to specific asset or asset class, which is higher than the proportion it represents in the market index or benchmark against which the portfolio is measured.
POOLEDPORTFOLIO
Vehicle in which a number of investors pool their assets so they can be managed on a collective basis. Shares in a pooled fund are denominated in units and are repriced regularly to reflect changes in underlying assets. This allows investors to value their holdings.
QUARTERLY
Usually refers to 3-month periods ending 31 March, 30 June, 30 September, and 31 December.
RETURN
Percentage increase in the value of an investment over a period of time, expressed as a percentage of the value of the investment
at the start of the period. All returns in this survey are calculated as Time Weighted Rates or Return (defined below).
RETURNRISKRATIO
A measure of return per unit of risk, where risk is represented by volatility (defined below).
RISK
Risk is a very generic term. In this survey (and generally in investments), risk is usually represented by volatility (defined below) i.e. volatility is used as a proxy for risk.
SRI
Socially Responsible Investments or Investing. Also a very generic term that refers generally to environmental, social and governance considerations when considering investments.
SEGREGATEDPORTFOLIO
Investment portfolio, which is managed for and on behalf of a single investor and has separately identifiable assets registered in the investors name.
SHARPERATIO
Risk adjusted return ratio of return per unit of risk. It is calculated as excess return (over the risk-free return) divided by volatility.
SHORTPOSITION
Negative exposure to the underlying asset i.e. the value of your investment decreases as the underlying asset increases in value. This is in contrast to a long position (see above).
SORTINORATIO(CAPITALLOSSORINFLATION)
A risk adjusted return measure similar to the Sharpe ratio, with the difference being that the Sharpe ratio uses volatility as the proxy for risk, but the Sortino ratio uses only returns below a certain target (0% in the case of Capital Loss and inflation in the case of Inflation) when calculating the risk.
TDI
Targeted Development Investment.
TIME-WEIGHTEDRATEOFRETURN(TWRR)
Rate of return on an asset or portfolio that removes the effect of cash flows. The time-weighted return can be used to compare portfolio performances against each other and against market indices, without being unduly influenced by the timing of large cash flows.
TRACKINGERROR
Measure of variability of returns relative to benchmark or index. It is usually expressed as annualised standard deviation of active returns.
UPPERQUARTILE
The value above which one quarter of returns or data fall.
VOLATILITY
Is a proxy for risk and is calculated as the annualised standard deviation of monthly returns.
SectIOn 5glossary

An Authorised Financial Services Provider
tbsp
///
bey
ond
the
line
3371
7/E
Securing your financial well-being
ALEXANDERFORBEs
Install solar panels on your roof.
Donate money to a charity.
Dance at the Rio Carnival.
See a gorilla in the wild.
Learn to play piano.
Take more pictures.
Race a sports car.
Raise a dog.
Scuba dive.
Build your own library.
Learn to speak French.
Drink tequila in Mexico.
Teach someone to read.
Buy art that moves you.
Run the New York Marathon.
Write something and get it published.
Live without regret.
75
cOMPany DetaILS
FAISFSPRegistrationnumber: 1997/017903/07
SwitchBoard +27 11 480 5344
Faxnumber: +27 11 480 5332
GeneralE-mail: [email protected]
Address: 65 Empire Road Parktown 2193 PO Box 6115 Johannesburg 2000
ComplianceOfficerName: Anthony Smith [email protected] +27 11 350 7555
BuSIneSS PhILOSOPhy
ABSA Asset Management is committed to achieving consistently superior, risk-adjusted long-term performance. We seek do this by committing to the abiding principles of valueinvesting. We invest in shares of a company that trade below our objective assessment of intrinsic value.
We are also prepared to invest in companies with strong growth prospects, but we are not willing to overpay for unrealistic growth expectations. For this reason we think of ourselves as pragmaticvalueorientedinvestors.
We focus on consistent long-term returns and we take every precaution to ensure that the investments we select are reputable and well managed, and will add value to your portfolio.
aBSa aSSet ManageMent (Pty) LtD
www.abam.co.za
FaIS reQuIreMentS
Who is your FAIS complaints officer?Anthony Smith
Please provide the link to the complaints policy on your websiteN/A
OWnerShIP
What is the ownership structure of the company? 100% owned by ABSA Group Limited
Who are the directors of the company?Colin Beggs, Brian Connellan, Yolanda Cuba, Shauket Fakie, Garth Griffin, David Hodnett, Mohamed Husain, Antony Jenkins, Robert Le Blanc, Peter Matlare, Thoko Mokgosi-Mwantembe, Eduardo Mondlane Jr., Trevor Munday, Brand Pretorius, Maria Ramos, Ivan Ritossa, Louis von Zeuner, Johan Willemse
Do staff and management have an interest in ownership? Please provide the percentage held by staff and management.No
hIStOry
When was the company established?1997
List of mergers that have taken place since being established.None
B-BBee creDentIaLS
Are you B-BBEE accredited?Yes
What is your B-BBEE statusLevel 3 contributor
By whom have you been accredited?NERA National Empowerment Rating Agency
Date of accreditation15/02/2012
gIPS
Are you GIPS compliant?Yes
Are you GIPS verified?Yes
By whom have you been verified?KPMG
Date of verification03/06/2011(for Period 01/01/2004 to 31/12/2010).
Expiry date of verificationAnnual GIPS verifications done by KPMG for the past calendar year.
InveStMent ManDateS
What are your total Assets Under Management?R101.444 Billion
Please detail the mandates you currently manage and the size of each of these mandates.AUM for period ending December 2011Unit Trust: R79.136 BillionSegregated: R22.307 Billion
Key InveStMent PerSOnneL
Errol Shear Chief Investment Officer BBusSc(Hons) Finance, CA(SA), CFA27 years industry experience6 years with ABAM
Busisa Jiya Managing Director BBusSc(Hons) Economics 15 years industry experience 3 months with ABAM
Greg Kettles Portfolio Manager BCom(Hons), CA(SA), CFA 19 years industry experience 5 years with ABAM
Stephen Arthur Portfolio Manager BScEng(Mining), CFA 23 years industry experience 6 years with ABAM
Snowy Musundwa Head of Instituitional Sales & Marketing BCom(Hons), BEcSc9 years industry experience 1 year with ABAM
76
cOMPany DetaILS
FAISFSPRegistrationnumber: 22877
SwitchBoard +27 21 927 6700
Faxnumber: +27 21 927 6550
GeneralE-mail: [email protected]
Address: 163 Hendrik Verwoerd Drive, Plattekloof, 7500
ComplianceOfficerName: Segabe Ditodi [email protected]
BuSIneSS PhILOSOPhy
Absa Capital Alternative Asset Management (Pty) Ltd (AAM) is a FSB registered asset management business with Category I and II licenses. The team specialises in the design and management of alternative investment strategies including absolute return, overlay protection, alpha transport and other alternative investment portfolios. The series of absolute return portfolios managed by the team since 1999 have not only provided investors with explicit capital protection at various levels, but also achieved returns significantly in excess of inflation over this period. The building blocks of all AAM’s solutions are acquired through the mechanism of a proven independent, broad-based, best price procedure. Other areas of expertise include bespoke strategies for retail investors, money market strategies, equity market execution in the transition management process, offshore absolute return and hedge fund strategies.
aBSa caPItaL aLternatIve aSSet ManageMent (Pty) LtD
www.absacapital.com
FaIS reQuIreMentS
Who is your FAIS complaints officer?Segabe Ditodi
Please provide the link to the complaints policy on your websitehttp://www.absa.co.za/Absacoza/Contact-Us
OWnerShIP
What is the ownership structure of the company? 100% owned by Absa Group Limited
Who are the directors of the company?Andrew Selby and Andre Visser
Do staff and management have an interest in ownership? Please provide the percentage held by staff and management.No
hIStOry
When was the company established?2005
List of mergers that have taken place since being established - NoneNone.
B-BBee creDentIaLS
Are you B-BBEE accredited?Yes
What is your B-BBEE statusLevel 3 contributor
By whom have you been accredited?NERA National Empowerment Rating Agency
Date of accreditation16/02/2011
gIPS
Are you GIPS compliant?No
Are you GIPS verified?N/A
By whom have you been verified?N/A
Date of verificationN/A
Expiry date of verificationN/A
InveStMent ManDateS
What are your total Assets Under Management?R15 Billion
Please detail the mandates you currently manage and the size of each of these mandates.Capital Protected Portfolios: R6 BillionDynamic Hedging: R3.125 BillionAlpha Transport: R4.6 BillionOffshore Investments: R560 MillionIndex Tracking: R550 Million
Key InveStMent PerSOnneL
Glanville RetiefHead: Portfolio ConstructionBCom(Hons) Mathematics12 years industry experience8 years with ABSA Capital
Chris WattsPortfolio ManagerBBusSci(Hons) Finance, CFA6 years industry experience2.5 years with ABSA Capital
77
cOMPany DetaILS
FAISFSPRegistrationnumber: 27126
SwitchBoard +27 21 670 5297/8
Faxnumber: +27 86 508 0685
GeneralE-mail: [email protected]
Address: 4th Floor Montclare Place, Cnr Campground and Main Rds, Claremont, 7708 PO Box 24020, Claremont, 7735
ComplianceOfficerName: Enrique Goosen Independent Compliance Services +27 21 975 6597
BuSIneSS PhILOSOPhy
Our objective is to build a performance signature sought after by clients, focusing solely on investment management and outsourcing all non-core activities. Training and developing investment professionals with a deep understanding of risk and return, and encouraging innovation in research ideas is a key driver and differentiator of the team culture.
Aeon Investment Management directors have a strong history of political activism and commitment to the underprivileged. It is our belief and commitment that cost effective and efficient investment products must be made available to the broader lower income mass market. We are of the view that the problem of a lack of saving amongst lower income households can be tackled through increased value for money and transparency. Over the long term we would like our unit trusts to be efficient investment vehicles for low income savers.
aeOn InveStMent ManageMent
www.aeonim.co.za
FaIS reQuIreMentS
Who is your FAIS complaints officer?Enrique Goosen
Please provide the link to the complaints policy on your websitewww.aeonim.co.za
OWnerShIP
What is the ownership structure of the company? Shareholders: Asief Mohamed & Rashaad Tayob
Who are the directors of the company?Asief Mohamed and Rashaad Tayob
Do staff and management have an interest in ownership? Please provide the percentage held by staff and management.Asief Mohamed, 50% and Rashaad Tayob, 50%.A third will be reserved for current and future employees (33%). 3% has been allocated to staff as Share Options.
hIStOry
When was the company established?01/12/2005
List of mergers that have taken place since being established.None.
B-BBee creDentIaLS
Are you B-BBEE accredited?Yes
What is your B-BBEE statusLevel 1 contributor
By whom have you been accredited?PKF BEE Solutions
Date of accreditation07/12/2011
gIPS
Are you GIPS compliant?Yes
Are you GIPS verified?No
By whom have you been verified?N/A
Date of verificationN/A
Expiry date of verificationN/A
InveStMent ManDateS
What are your total Assets Under Management?R976 Million
Please detail the mandates you currently manage and the size of each of these mandates.Aeon Active Equity Fund: R729 Million Aeon Absolute Return Fund: R145 Million Fixed Income: R101 Million
Key InveStMent PerSOnneL
Asief Mohamed CIOBCom, CA(SA), CFA23 years industry experience6 years with Aeon IM
Rashaad TayobPortfolio ManagerBBusSci, CFA10 years industry experience3 years with Aeon IM
Jordan-Lee RahmanAnalystBBusSci (Actuarial Science)2 years industry experience2 years with Aeon IM
Richard ChinamasaAnalystBCom4 years industry experience2 years with Aeon IM
Dean MarksAnalystBBusSci (Actuarial Science), MPhil(Mathematical Finance)2 years industry experience2 years with Aeon IM
Yanni YangAnalystBBusSci (Actuarial Science), MPhil(Mathematical Finance)1 year industry experience1 year with Aeon IM
78
cOMPany DetaILS
FAISFSPRegistrationnumber:25033
SwitchBoard+27 21 657 6240
Faxnumber:+27 21 671 4658
GeneralE-mail:[email protected]
Address:5th Floor, Montclare Place, C/O Campground and Main Roads, Claremont, 7708PO Box 23883, Claremont, 7735
ComplianceOfficerName:Tim Howse+27 21 671 8162
BuSIneSS PhILOSOPhy
We invest our clients’ money to provide them with excellent long term investment returns. We are active, valuation driven long term investors and generate returns by adhering to a clearly defined investment philosophy. We believe that investing in businesses by buying shares is the best way to grow your money over the long term. Afena Capital is primarily a specialist equity investment firm. Determining equity valuations is our core competency. In our balanced portfolios, we leverage our equity valuation skills to allocate assets across different asset classes based on the relative valuation of equities in order to preserve and grow our investors’ capital. Independent, proprietary research is the basis of our investment decisions. Quality in-depth fundamental research is the heart of our process. Our analysts make use of detailed independent and proprietary research to assess investment ideas and the opportunities that they offer relative to their risks. This enables us to make good long term investment decisions with confidence and conviction. There are always risks with investing, but we take great care to manage and control these risks. Our highly experienced portfolio managers remain individually accountable for their decisions but operate in a team based environment. The team that manages clients’ assets today is the same team that has been managing clients’ assets since our inception. Our professional client service team means that we have a more focused investment team. Our professional client service and operations teams enable our investment team to focus on investment results. The members of our business team (client service and operations) are highly experienced in each of their areas of expertise. The strength of these teams ensure that our analysts and portfolio managers remain completely focused on research and portfolio management.
aFena caPItaL (Pty) LtD
www.afenacapital.com
FaIS reQuIreMentS
Who is your FAIS complaints officer?Michael Dabrowski
Please provide the link to the complaints policy on your websitehttp://www.afenacapital.com/newsletter/doc_download/72-afena-fais-complaints-handling-procedure.html
OWnerShIP
What is the ownership structure of the company? Private company 100% owned by management and staff
Who are the directors of the company?Tebogo Naledi (CEO), Andrew Joannou, Khulekani Dlamini, Khaya Gobodo
Do staff and management have an interest in ownership? Please provide the percentage held by staff and management.100%
hIStOry
When was the company established?November 2005
List of mergers that have taken place since being established.None
B-BBee creDentIaLS
Are you B-BBEE accredited?Yes
What is your B-BBEE statusLevel 2 contributor
By whom have you been accredited?Empowerdex
Date of accreditation29/03/2011
gIPS
Are you GIPS compliant?Yes
Are you GIPS verified?Yes
By whom have you been verified?eComply
Date of verification14/04/2011
Expiry date of verificationN/A
InveStMent ManDateS
What are your total Assets Under Management?R19.3 Billion
Please detail the mandates you currently manage and the size of each of these mandates.Specialist Equity and Multi-Asset Mandates (all are domestic mandates)
Key InveStMent PerSOnneL
Tebogo Naledi CEOBBusSc14 years industry experience6 years with Afena
Andrew JoannouCIOBBusSc, CFA12 years industry experience6 years with Afena
Khulekani DlaminiHead of ResearchBSc, MSc11 years industry experience6 years with Afena
Khaya GobodoPortfolio ManagerBCom, MSc, CFA12 years industry experience6 years with Afena
79
cOMPany DetaILS
FAISFSPRegistrationnumber: 27145
SwitchBoard +27 21 415 2330
Faxnumber: +27 21 415 2490
GeneralE-mail: [email protected]
Address: Granger Bay Court, Beach Road, V&A Waterfront, Cape Town, 8001P O Box 51318, V&A Waterfront, Cape Town, 8002, South Africa ComplianceOfficerName: Edgar Loxton Tel + 27 21 415 [email protected]
BuSIneSS PhILOSOPhy
Allan Gray investment philosophy is valuation orientated which means that our research effort is focused on identifying good quality assets that are priced below intrinsic value. Intrinsic value is calculated using a number of methodologies but is usually defined as the discounted value of expected future cash flows. Valuation investing typically means buying shares when research and analysis indicates that the intrinsic value of the company far exceeds its market price. The valuation oriented investor anticipates that the price will rise to the intrinsic value. This is in contrast to the “momentum” approach where a manager identifies an upward trend and follows this by purchasing stock in the belief that the trend will continue.
aLLan gray PrOPrIetary LIMIteD
www.allangray.co.za
FaIS reQuIreMentS
Who is your FAIS complaints officer?Edgar Loxton
Please provide the link to the complaints policy on your websitewww.allangray.co.za
OWnerShIP
What is the ownership structure of the company? Allan Gray is a privately owned company
Who are the directors of the company?Simon Marais, Rob Dower, Ian Liddle, Mahesh Cooper, William Gray Thando Mhlambiso, Teboho Mahuma
Do staff and management have an interest in ownership? Please provide the percentage held by staff and management.14% of the company has been reserved for our staff scheme
hIStOry
When was the company established?June 1974
List of mergers that have taken place since being established.None.
B-BBee creDentIaLS
Are you B-BBEE accredited?Yes
What is your B-BBEE statusLevel 3 contributor
By whom have you been accredited?AQRate
Date of accreditation04/07/2011
gIPS
Are you GIPS compliant?Yes
Are you GIPS verified?Yes
By whom have you been verified?Ernst and Young
Date of verificationDecember 2010
Expiry date of verificationThe assurance report confirms compliance with the composite construction requirements of the GIPS standards for the period 01/01/2007 - 31/12/2008. Our verification for the two year period ending 31/12/2010 is currently underway, and we expect to receive the assurance report in due course.
InveStMent ManDateS
What are your total Assets Under Management?R317.60 Billion
Please detail the mandates you currently manage and the size of each of these mandates.Segregated: R135.53 BillionPooled: R49.627 BillionUnit Trust: R126.43 BillionOther: R6.01 Billion
Key InveStMent PerSOnneL
Simon MaraisChairman, DirectorMSc, PhD, CFA20 years industry experience20 years with Allan Gray
Rob DowerCOO, DirectorBSc(Eng), MBA19 years industry experience8 years with Allan Gray
Ian LiddleCIO, Portfolio Manager, DirectorBBusSc(Hons), CFA10 years industry experience10 years with Allan Gray
Mahesh CooperDirector, Head Institutional Client ServicingBBusSc, FIA, FASSA, MBA11 years industry experience9 years with Allan Gray
William GrayNon Executive DirectorBCom, MBA, CFA
Thando MhlambisoNon Executive DirectorAB, MBA, DB
Teboho MahumaNon Executive DirectorBA(Social Work) Hons, MPhil
80
cOMPany DetaILS
FAISFSPRegistrationnumber:534
SwitchBoard+27 21 707 1340
Faxnumber:+27 21 706 9711
GeneralE-mail:[email protected]
Address:Block D, Hobart Square, Hobart Road, Bryanston 2021, Johannesburg
ComplianceOfficerName:Sueney De Bruin+27 11 707 1340
BuSIneSS PhILOSOPhy
The Alpha Group is a specialist wealth manager with a multimanager investment covering long only asset allocation as well as alternative investment solutions such as hedge funds and private equity, both locally and internationally. The group was established in 1997 and has developed into a best of breed asset manager servicing a full spectrum of clients. Bespoke holistic investment solutions are constructed in line with the Alpha Groups’ value proposition which is to deliver relevant investment advice, superior risk-adjusted investment performance and unparalleled service delivery. Our core philosophy is to preserve and grow capital strategically over the long term, whilst participating tactically in superior return-generating opportunities.
aLPha aSSet ManageMent (Pty) LtD
www.aam.co.za
FaIS reQuIreMentS
Who is your FAIS complaints officer?Sueney De Bruin
Please provide the link to the complaints policy on your websitewww.aam.co.za
OWnerShIP
What is the ownership structure of the company? 100% held by Alpha Holdings (Pty) Ltd
Who are the directors of the company?James Gilfillan and Kerry West Fynn
Do staff and management have an interest in ownership? Please provide the percentage held by staff and management.No
hIStOry
When was the company established?1997
List of mergers that have taken place since being established.None
B-BBee creDentIaLS
Are you B-BBEE accredited?No
What is your B-BBEE statusN/A
By whom have you been accredited?N/A
Date of accreditationN/A
gIPS
Are you GIPS compliant?No
Are you GIPS verified?N/A
By whom have you been verified?N/A
Date of verificationN/A
Expiry date of verificationN/A
InveStMent ManDateS
What are your total Assets Under Management?R6 Billion
Please detail the mandates you currently manage and the size of each of these mandates.4 South African HFOF 8 Offshore Funds and 6 Local Multi- manager
Key InveStMent PerSOnneL
Jacques du PlessisJoint CIOBCompt, CAIA10 years industry experience1 year with Alpha
James GilfillanJoint CIOAB(Harvard), CFA22 years industry experience14 years with Alpha
John HaslettResearch Analyst BCom(Hons) Accounting, CA(SA)1 year industry experience1 year with Alpha
Haseena EssaResearch Analyst BSc(Actuarial Science)5 years industry experience1 year with Alpha
Hazel PillayResearch Analyst BCom2 years industry experience1 year with Alpha
Hubert SteenkampResearch Analyst BBusSci(Hons) Quantitative Finance6 years industry experience6 years with Alpha
Reza HendrickseResearch Analyst BBusSci(Hons) Economics & Finance5 years industry experience5 years with Alpha
81
cOMPany DetaILS
FAISFSPRegistrationnumber:835
SwitchBoard+27 21 670 6570
Faxnumber:+27 21 671 8252
GeneralE-mail:[email protected]
Address:1st Floor, Colinton House, The Oval, 1Oakdale Road, Newlands 7700PO Box 23254, Claremont 7735
ComplianceOfficerName:Lentle & [email protected]+27 11 339 7647
BuSIneSS PhILOSOPhy
Premier Asset Management Firm
FaIS reQuIreMentS
Who is your FAIS complaints officer?Lentle & Associates
Please provide the link to the complaints policy on your websiteN/A
OWnerShIP
What is the ownership structure of the company? Independent, no group structure
Who are the directors of the company?Mothobi Seseli, Mduduzi Ndlovu, James Mohlaba, Nazeem Hendricks
Do staff and management have an interest in ownership? Please provide the percentage held by staff and management.100% currently held by founding members. Staff participation is being finalised
hIStOry
When was the company established?April 2005
List of mergers that have taken place since being established.None
argOn aSSet ManageMent (Pty) LtD
www.argonassetmanagement.co.za
B-BBee creDentIaLS
Are you B-BBEE accredited?Yes
What is your B-BBEE statusLevel 2 contributor
By whom have you been accredited?DTI
Date of accreditation16/05/2011
gIPS
Are you GIPS compliant?Yes
Are you GIPS verified?Yes
By whom have you been verified?E Comply - Mrs. Lesley Havey
Date of verificationAnnually
Expiry date of verificationCalendar year
InveStMent ManDateS
What are your total Assets Under Management?R10.652 Billion
Please detail the mandates you currently manage and the size of each of these mandates.Argon SA Value Equity: R8.235 BillionArgon SA Core Bond: R219 MillionArgon Enhanced Money Market: R603 MillionArgon Multi Asset Class Absolute Return: R1.354 BillionArgon Low Equity Domestic Balanced: R241 Million
Key InveStMent PerSOnneL
Dr. Manas BapelaCIOMSc(Mathematics) Sum Laude, PhD(Mathematics)16 years industry experience1.5 years with Argon Saul MillerHead of EquitiesMBusSc(Acturial Science), Fellow of the Faculty of Actuaries,FFA (UK)14 years industry experience7 months with Argon
Mduduzi NdlovuFinancials AnalystBCom, CFA, MPhil cum laude16 years industry experience6 years with Argon
Nazeem HendricksIndustrials AnalystBcompt(Hons) Acc, CFA17 years industry experience6 years with Argon
James MohlabaResources AnalystBCom, BScChemEng, MCom(Finance)10 years industry experience6 years with Argon
Dipolelo MakhubeduEquities DealerBCom(Hons) Fin & Port Mgt, MCom(Fin) II candidate5.5 years industry experience5.5 years with Argon
Kyle HulettHead of Multi Asset ClassBBusSci(Acturial Science), Fellow of the Faculty of Actuaries, FFA(UK), CFA11 years industry experience6 months with Argon
Krishna SatheeHead of Fixed IncomeBSc(Hons) Statistics14 years industry experience2 years with Argon
Mokgatla MadishaFixed Income Portfolio ManagerBSc(Mechanical Eng), BCom(Hons) Financial Analysis & Portfolio Management11 years industry experience9 months with Argon
Sophie van GarderenEquity AnalystBCom(Hons), MCom, CFA16 years industry experience2 months with Argon
Nompumelelo KhumaloPerformance and Risk AnalystBusSci(Finance) UCT3 years industry experience3 years with Argon
82
cOMPany DetaILS
FAISFSPRegistrationnumber:31756
SwitchBoard+27 21 913 8941
Faxnumber:+27 21 913 9205
GeneralE-mail:[email protected]
Address:1st Floor, Barinor’s Vineyard North, The Vineyard Office Estate and, 99 Jip de Jager Road, Bellville, 7530, South AfricaSuite 243, Private Bag X22, Tygervalley, 7536
ComplianceOfficerName:Louisa Ruwiel (email [email protected])+27 83 663 6634
BuSIneSS PhILOSOPhy
Atlantic Asset Management is a niche fixed income asset manager.
Atlantic’s approach to money management is based upon a macro-thematic top down asset allocation philosophy
atLantIc aSSet ManageMent (Pty) LtD
www.atlanticam.com
FaIS reQuIreMentS
Who is your FAIS complaints officer?Louisa Ruwiel (email [email protected])
Please provide the link to the complaints policy on your websitehttp://www.atlanticam.com/pdf/complaints-procedure.pdf
OWnerShIP
What is the ownership structure of the company? Privately owned
Who are the directors of the company?Murray Anderson, Arno Lawrenz, Roddy Sparks, Paul Stewart
Do staff and management have an interest in ownership? Please provide the percentage held by staff and management.Murray Anderson 28% Arno Lawrenze 42%
hIStOry
When was the company established?July 2007
List of mergers that have taken place since being established.None
B-BBee creDentIaLS
Are you B-BBEE accredited?In process of being accredited
What is your B-BBEE statusN/A
By whom have you been accredited?In process - Contract with Empowerdex
Date of accreditationN/A
gIPS
Are you GIPS compliant?We follow GIPS standards, but have not been verified.
Are you GIPS verified?N/A
By whom have you been verified?N/A
Date of verificationN/A
Expiry date of verificationN/A
InveStMent ManDateS
What are your total Assets Under Management?R3.2 Billion
Please detail the mandates you currently manage and the size of each of these mandates.Unit Trust Fund: R1.65 BillionSegregated Funds (Multimanager or Fund of funds): R325 MillionMedical Aid Fund: R95 MillionPension Fund: R405 MillionSegregated Funds: R150 MillionHedge Funds: R121 MillionTotal Return Fund: R195 Million
Key InveStMent PerSOnneL
Arno LawrenzChief Investment Officer, Portfolio Manager BSc(Hons), CFA20 years industry experience4.5 years (founder) with Atlantic
Erik NelFixed Income Strategist ICMQ, FSA11 years industry experience3 years with Atlantic
Albert BothaFixed Income Analyst, Portfolio Manager BCom, Member of Faculty of Actuaries4 years industry experience2.5 years with Atlantic
83
cOMPany DetaILS
FAISFSPRegistrationnumber:712
SwitchBoard+27 21 673 3333
Faxnumber:+27 21 673 3344
GeneralE-mail:[email protected]
Address:3rd Floor 200 on Main, cnr Main and Bowwood Roads, Claremont, 7708PO Box 44771, Claremont, 7708
ComplianceOfficerName:Denver Hendricks+27 21 673 3333
BuSIneSS PhILOSOPhy
Protection and preservation of clients’ capital. Production of consistent, risk-adjusted, positive returns.
BLue InK InveStMentS (Pty) LtD
www.blueink.co.za
FaIS reQuIreMentS
Who is your FAIS complaints officer?Complaints can be made directly to the CEO
Please provide the link to the complaints policy on your websiteN/A
OWnerShIP
What is the ownership structure of the company? 75% owned by Sanlam and 25% owned by Ubunto-Botho Investments
Who are the directors of the company?Aloysius Jacobs, Nersan Naidoo, Robert Roux
Do staff and management have an interest in ownership? Please provide the percentage held by staff and management.No
hIStOry
When was the company established?1995
List of mergers that have taken place since being established.None.
B-BBee creDentIaLS
Are you B-BBEE accredited?Yes - Part of the Sanlam Group
What is your B-BBEE statusLevel 3 contributor
By whom have you been accredited?ICA
Date of accreditation14/05/2011
gIPS
Are you GIPS compliant?No
Are you GIPS verified?No
By whom have you been verified?N/A
Date of verificationN/A
Expiry date of verificationN/A
InveStMent ManDateS
What are your total Assets Under Management?R3 Billion
Please detail the mandates you currently manage and the size of each of these mandates.Our investment mandates are risk-profiled products
Key InveStMent PerSOnneL
Thomas SchlebuschChief Executive OfficerMEng, GDP, MBA13 years industry experience5 years with Blue Ink
84
cOMPany DetaILS
FAISFSPRegistrationnumber:636
SwitchBoard+27 21 670 4600
Faxnumber:+27 21 670 4651
GeneralE-mail:[email protected]
Address:4th Floor, The Terraces, 25 Protea Road, ClaremontPO Box 44547, Claremont, 7735
ComplianceOfficerName:Lynne Jennings+27 21 670 4692
BuSIneSS PhILOSOPhy
We are value investors. This is an investment approach that has a proven history of generating better returns than the market over the long term, but also provides a natural way of limiting potential losses. Our approach is based on the belief that markets are inefficient in the short term. Within a normal business cycle, asset prices can be substantially different from their long-run true business or intrinsic value. These differences between asset prices and asset values are caused by the collective behaviour of investors acting out of fear or greed. Investors tend to over extend recent asset price trends upwards (in greed) or downwards (in fear). We strive to remain rational, dispassionate and exploit the opportunities that this investor behaviour creates, thereby generating superior returns for our clients. In order to identify the mispriced opportunities, we follow a sound, systematic and disciplined bottom-up fundamental approach. This means we do not perform any forecasting in our investment process but rather price an asset by studying its long-term performance and risk compensation metrics and by normalising these trends. As a discipline, we only become interested in buying an asset once we are convinced that we will be generously compensated for the risk we propose to take. Conversely, we only sell an asset once we believe that we have been more than compensated by its return. In this way, we aim to generate superior returns for our clients with the least amount of risk.
caDIZ aSSet ManageMent (Pty) LtD
www.cadiz.co.za
FaIS reQuIreMentS
Who is your FAIS complaints officer?Lynne Jennings
Please provide the link to the complaints policy on your websiteN/A
OWnerShIP
What is the ownership structure of the company? Management and staff 30%, Makana Investment Corporation 15%, and Institutional and private shareholders 55%
Who are the directors of the company?Frank Cadiz, Evan Jones, Phil Sturgess, Ram Barkai
Do staff and management have an interest in ownership? Please provide the percentage held by staff and management.Management and staff 30%
hIStOry
When was the company established?1996 - originally formed as Cadiz Specialised Asset Management (CSAM)
List of mergers that have taken place since being established.Cadiz bought Prodigy Coris in 2004, then acquired African Harvest Fund Managers in Nov 2006; both were integrated into Cadiz African Harvest Asset Management (CAHAM); CAHAM underwent a name change to Cadiz Asset Management in 2009
B-BBee creDentIaLS
Are you B-BBEE accredited?Yes
What is your B-BBEE statusLevel 3 contributor
By whom have you been accredited?Empowerdex
Date of accreditationNovember 2011
gIPS
Are you GIPS compliant?Yes
Are you GIPS verified?Yes
By whom have you been verified?eComply
Date of verificationAugust 2011
Expiry date of verificationAugust 2012
InveStMent ManDateS
What are your total Assets Under Management?R41.4 Billion as at end of November 2011
Please detail the mandates you currently manage and the size of each of these mandates.Absolute Return: R4.259 BillionBalanced: R2.339 BillionEquity: R19.01 BillionFixed Interest: R9.106 BillionMoney Market: R6.415 BillionHedge Funds: R130.666 MillionOther: R161.015 Million
Key InveStMent PerSOnneL
Francois van WykCIO - Head of Multi-Asset Class Funds BScAgric(Hons), MBA15 years industry experience6 years with Cadiz
Kurt BennHead of EquityBBusSc, BEcon(Hons), CFA16 years industry experience5 years with Cadiz
Francois FinlayHead of Protected InvestmentsBBusSc, BCom(Hons) Accounting, HDipTax, Certificate in the Mathematical Modelling of Derivatives, CA(SA), CFA14 years industry experience10 years with Cadiz
Jonathan MyersonHead of Fixed InterestMSocSci(Econ)16 years industry experience5 years with Cadiz
Allan AllisonHead of Dealing: Equities and BondsBCom(Hons, FAPM)20 years industry experience7 years with Cadiz
Heather JacksonHead of SRIBA(Hons), CFA20 years industry experience10 years with Cadiz
85
cOMPany DetaILS
FAISFSPRegistrationnumber:736
SwitchBoard+27 11 463 3140
Faxnumber:+27 11 463 3143
GeneralE-mail:[email protected]
Address:First Floor, Building B, Bryanston Corner, 18 Ealing Crescent, Bryanston, 2194, South AfricaPO Box 70997, Bryanston, 2021, South Africa
ComplianceOfficerName:Craig Simpkins+27 31 566 6633
BuSIneSS PhILOSOPhy
Cannon Asset Managers is an owner-managed asset management firm, that manages assets across all of the major asset classes domestically and globally. We manage assets on behalf of private client, retail and institutional clients, in segregated portfolios and in our unit trust funds. Our business philosophy is that we will only manage assets with our well-established deep value investment process, regardless of client type. At all times, we couple superior investment processes with industry-leading risk, administrative and compliance protocols, and always act in the best interests of clients.
cannOn aSSet ManagerS (Pty) LtD
www.cannonassets.co.za
FaIS reQuIreMentS
Who is your FAIS complaints officer?Craig Simpkins
Please provide the link to the complaints policy on your [email protected]
OWnerShIP
What is the ownership structure of the company? 69% owned by Hollard Life Assurance Limited, 31% owned by executive directors
Who are the directors of the company?Geoff Blount (CEO), Adrian Saville (CIO), Craig Simpkins (COO), Ash Desai (non-exec), Scott Gilmour (non-exec)
Do staff and management have an interest in ownership? Please provide the percentage held by staff and management.31% of the ownership of the company is held by executive directors, who are listed above. Staff do not participate in ownership, they participate in profit share on invitation.
hIStOry
When was the company established?2000
List of mergers that have taken place since being established.Although there have been shareholding changes over time, there have been no mergers.
B-BBee creDentIaLS
Are you B-BBEE accredited?Yes
What is your B-BBEE statusLevel 2
By whom have you been accredited?Empowerdex
Date of accreditation14/12/2011
gIPS
Are you GIPS compliant?Yes
Are you GIPS verified?No
By whom have you been verified?N/A
Date of verificationN/A
Expiry date of verificationN/A
InveStMent ManDateS
What are your total Assets Under Management?R3.2 Billion
Please detail the mandates you currently manage and the size of each of these mandates.Cannon All Equities ALSI Portfolio: R310 MillionCannon All Equities SWIX Portfolio: R825 MillionCannon All Equities CAPI Porfolio: R170 MillionCannon Multi-Asset(CPI+5%) Portfolio: R32 Million
Key InveStMent PerSOnneL
Dr Adrian Saville - Chief Investment OfficerBA(Hons) Cum Laude, MCom(Cum Laude), PhD17 years industry experience13 years with Cannon
Andrew Dittberner - Senior Investment ManagerBEconSci(Hons), MCom5 years industry experience5 years with Cannon
Tshepo Modiba - Senior Investment ManagerBSc(Hons)5 years industry experience2 years with Cannon
86
cOMPany DetaILS
FAISFSPRegistrationnumber:24297
SwitchBoard+27 11 505 6200
Faxnumber:+27 11 263 0747
GeneralE-mail:[email protected]
Address:Bldg. 1, Inanda Greens, 54 Wierda Rd. West, Wierda ValleyPO Box 786055 Sandton 2146
ComplianceOfficerName:Andre Vorster+27 11 505 6151
BuSIneSS PhILOSOPhy
Caveo believes that:
Well constructed FoHF’s produce efficient and superb risk adjusted returns to other asset classes;
The inclusion of a fund of hedge funds within a portfolio will add diversification to that portfolio and improve the investor’s risk adjusted return;
Skilled investment managers deliver absolute returns in isolation of the market environment
Creating successful portfolios relies on an in depth qualitative manager due diligence process backed by a sound quantitative framework;
Diversification by manager style is essential in order to achieve the investment objectives in a variety of market conditions;
Ultimately, however, manager selection is the prime source of absolute returns;
Information disclosure by managers has a direct effect on the quality of ongoing risk assessment and proactive risk management that a fund of hedge fund manager can carry out
caveO FunD SOLutIOnS (Pty) LtD
www.caveo.co.za
FaIS reQuIreMentS
Who is your FAIS complaints officer?Andre Vorster
Please provide the link to the complaints policy on your websiteN/A
OWnerShIP
What is the ownership structure of the company? 50.01% Investment Solutions; 49.99% Peregrine Holdings
Who are the directors of the company?Byron Green, Derrick Msibi, Steven Price, Jan van Niekerk, Robert Katz
Do staff and management have an interest in ownership? Please provide the percentage held by staff and management.No
hIStOry
When was the company established?01/01/2006
List of mergers that have taken place since being established.None
B-BBee creDentIaLS
Are you B-BBEE accredited?No
What is your B-BBEE statusN/A
By whom have you been accredited?N/A
Date of accreditationN/A
gIPS
Are you GIPS compliant?Yes
Are you GIPS verified?No
By whom have you been verified?N/A
Date of verificationN/A
Expiry date of verificationN/A
InveStMent ManDateS
What are your total Assets Under Management?R3.5 Billion
Please detail the mandates you currently manage and the size of each of these mandates.Stable: R627 MillionModerate: R1.837 BillionPerformance: R879 MillionSegregated Account: R130 MillionFocus: R1 Million
Key InveStMent PerSOnneL
Gyongyi KingChief Investment OfficerCFA, BSc(Hons)15 years industry experience3 years with Caveo
87
cOMPany DetaILS
FAISFSPRegistrationnumber:548
SwitchBoard+27 21 680 2000
Faxnumber:+27 21 680 2100
GeneralE-mail:[email protected]
Address:7th Floor MontClare Place, Cnr Campground and Main Roads, Claremont, Cape Town, South Africa, 7708PO Box 44684, Claremont 7735
ComplianceOfficerName:Leeza Myburgh+27 21 680 2409
BuSIneSS PhILOSOPhy
A single business philosophy of long-term investment
cOrOnatIOn aSSet ManageMent (Pty) LtD
www.coronation.com
FaIS reQuIreMentS
Who is your FAIS complaints officer?Leeza Myburgh
Please provide the link to the complaints policy on your websiteN/A
OWnerShIP
What is the ownership structure of the company? Coronation Asset Management Limited is listed on the JSE
Who are the directors of the company?Anton Pillay, Jock McKenzie, Alexandra Watson, Hugo Nelson, Judith February, Shams Pather
Do staff and management have an interest in ownership? Please provide the percentage held by staff and management.Yes, 29% of the business is staff owned
hIStOry
When was the company established?1993
List of mergers that have taken place since being established.None
B-BBee creDentIaLS
Are you B-BBEE accredited?Yes
What is your B-BBEE statusLevel 3
By whom have you been accredited?Empowerdex
Date of accreditation26/01/2011
gIPS
Are you GIPS compliant?Yes
Are you GIPS verified?Yes
By whom have you been verified?KPMG
Date of verification18/03/2011
Expiry date of verificationCurrently being audited for a new verification term
InveStMent ManDateS
What are your total Assets Under Management?R273.605 Billion
Please detail the mandates you currently manage and the size of each of these mandates.Specialist equity: R87.940 Billion Global Balanced: R45.703 Billion Domestic Balanced: R14.303 BillionDomestic Absolute: R16.734 BillionGlobal Absolute: R16.951 BillionFixed interest: R10.955 BillionInternational: R6.328 BillionCash: R2.316 BillionHedge funds: R1.284 BillionProperty: R729. 627 MillionUnit trust: R70.349 Billion
Key InveStMent PerSOnneL
Karl LeinbergerChief Investment OfficerBBusSci, PGDA, CFA, CA(SA)14 years industry experience11 years with Coronation
Neville ChesterSenior Portfolio ManagerBCom, PGDA, CA(SA) CFA17 years industry experience11 years with Coronation
Louis StassenSenior Portfolio ManagerBSc, BCom(Hons), CFA 22 years industry experience18 years with Coronation
Gavin JoubertSenior Portfolio ManagerBBusSc, PGDA, CA(SA), CFA 15 years industry experience12 years with Coronation
88
cOMPany DetaILS
FAISFSPRegistrationnumber: 721
SwitchBoard+27 11 217 1147
Faxnumber:+27 11 217 1355
GeneralE-mail:[email protected]
Address:3rd Floor, Umnotho Building, Old Mutual Square, 93 Grayston Drive, SandtonPO Box 782574, Sandton, 2196
ComplianceOfficerName:Zulfa Abdurahman+27 21 509 2570
BuSIneSS PhILOSOPhy
Efficient Local and Global Index Tracking
OLD MutuaL gLOBaL InDex tracKerS (Pty) LtD, traDIng aS DIBanISa FunD ManagerS, IS a MeMBer OF the OLD MutuaL InveStMent grOuP (SOuth aFrIca) (Pty) LtD.
www.dibanisafundmanagers.co.za
FaIS reQuIreMentS
Who is your FAIS complaints officer?Zulfa Abdurahman
Please provide the link to the complaints policy on your websiteN/A
OWnerShIP
What is the ownership structure of the company? 25.1% Stone Capital, 74.9% OMIGSA
Who are the directors of the company?Dr. D Konar, DC Radley, PG de Beyer, CE Maynard, M Patel, LL Dhlamini, Mr RT Mupita, I Kgaboesele, C Chambers, T Musikivanhu
Do staff and management have an interest in ownership? Please provide the percentage held by staff and management.Yes, 25.1% through DFM with an additional (2.73% in 74.9% of OMIGSA)
hIStOry
When was the company established?1998
List of mergers that have taken place since being established.2001, OMIGSA buys 33%, 2006 OMIGSA buys additional 33% (66%), OMGISA obtained an additional 8.3% in 2011
B-BBee creDentIaLS
Are you B-BBEE accredited?Yes
What is your B-BBEE statusLevel 2 contributor
By whom have you been accredited?AQ rate
Date of accreditation18/10/2011
gIPS
Are you GIPS compliant?Yes
Are you GIPS verified?Yes
By whom have you been verified?PricewaterhouseCoopers
Date of verificationJune 2011
Expiry date of verificationDecember 2010
InveStMent ManDateS
What are your total Assets Under Management?R39.759 Billion
Please detail the mandates you currently manage and the size of each of these mandates.South Africa- FTSE/JSE ALSI 40: R478.4 MillionSouth Africa- FTSE/JSE SWIX ALSI & 40: R31.24 BillionSouth Africa- FTSE/JSE RAFI ALSI & 40: R761 MillionSouth Africa- ALBI: R187.9 MillionSouth Africa- SRI: R36.13 MillionSouth Africa- Absolute Return: R56.65 MillionSouth Africa- Multi Asset Class: R72.56 MillionSouth Africa- Other Equity (Equally Weighted & Green): R184.76 MillionGlobal-FTSE EDHEC Emerging Market: R772.12 MillionGlobal- MSCI Emerging Market: R912.67 MillionGlobal- MSCI World: R28.74 MillionGlobal- MSCI All Country World: R108.88 MillionGlobal- MSCI Small Cap: R369.27 MillionRegional- S&P Africa Custom: R1.07 BillionGlobal- MSCI Frontiers Global: R2.15 BillionGlobal- Flexible Fund: R1.51 Billion
Key InveStMent PerSOnneL
Tendai MusikavahnuCEOBCompt(Accounting Science), CFA17 years industry experience10 years with Dibanisa
Craig ChambersManaging Director and CIOBCom(Accounts), PDm(Business Administration), CFA, SAFEX SA Futures Exchange Exam16 years industry experience10 years with Dibanisa
Anver DollieDeputy CIOCIS(Chartered Institutes Secretaries & Administration)14 years industry experience6 years with Dibanisa
Kingsley WilliamsPortfolio Manager & Head of ResearchMBA, BSc(Hons)11 years industry experience3 years with Dibanisa
Miranda NelHead of International SalesBCom, CFA19 years industry experience2 years with Dibanisa
Zack BezuidenhoudtBusiness Development ExecutiveBSc(Financial Mathematics), CIPM6 years industry experience2 years with Dibanisa
89
cOMPany DetaILS
FAISFSPRegistrationnumber:663
SwitchBoard+27 21 426 1313
Faxnumber:+27 21 426 0999
GeneralE-mail:[email protected]
Address:8th Floor, 125 Buitengracht Street, Cape Town, 8001PO Box 13, Cape Town, 8000
ComplianceOfficerName:Ian [email protected]
BuSIneSS PhILOSOPhy
Long-term value contrarian
eLeMent InveStMent ManagerS
www.elementim.co.za
FaIS reQuIreMentS
Who is your FAIS complaints officer?Ian Jones
Please provide the link to the complaints policy on your websiteN/A
OWnerShIP
What is the ownership structure of the company? Element Staff / Staff Trust: 55.5%J&J Group: 25.5%Original BEE VC Investors: 12.0%Original Family: 7.0%”
Who are the directors of the company?Dr. Anwah Nagia (Chairman), Terence Craig (CIO), Ian Jones (COO), Lulamile Xate (Independent, Non-Exec), Yunus Mohamed (Non-Exec), Jayendra Naidoo (Non-Exec), Ashleen Bredeveldt (Independent, Non-Exec)
Do staff and management have an interest in ownership? Please provide the percentage held by staff and management.Yes, 55%
hIStOry
When was the company established?1998
List of mergers that have taken place since being established.None
B-BBee creDentIaLS
Are you B-BBEE accredited?Yes
What is your B-BBEE statusLevel 3 contributor with a score of 83.87%
By whom have you been accredited?BEEScore
Date of accreditation13/12/2010
gIPS
Are you GIPS compliant?Yes
Are you GIPS verified?Yes
By whom have you been verified?E-Comply
Date of verification01/01/2003
Expiry date of verification31/12/2009
InveStMent ManDateS
What are your total Assets Under Management?R23 Billion at 30/11/2011
Please detail the mandates you currently manage and the size of each of these mandates.Institutional Equity: R20 BillionInstitutional Balanced: R907 MillionShari’ah: R556 MillionRetail: R1.8 Billion
Key InveStMent PerSOnneL
Terence CraigCIO, Portfolio ManagerBusSc(Hons), CA(SA), CFA18 years industry experience11 years with Element
Matthew KreevePortfolio ManagerBCom(Hons) (McGill)17 years industry experience8 years with Element
Mohamed Shafee LoonatHead: Shariah, Portfolio ManagerBCom(Eco), BCompt & Advanced Tax(Hons), CA(SA), CFA, PGDip(Islamic Banking and Insurance)14 years industry experience6 years with Element
Johny LambridisPortfolio ManagerBEconSc, FFA14 years industry experience4 years with Element
90
cOMPany DetaILS
FAISFSPRegistrationnumber:578
SwitchBoard+27 21 532 6988
Faxnumber:+27 21 532 6999
GeneralE-mail:[email protected]
Address:8 Forest Mews, Forest Drive, Pinelands, 7405PO Box 135, Howard Place, 7450
ComplianceOfficerName:Donnetta McKinley+27 21 532 [email protected]
BuSIneSS PhILOSOPhy
Our investment philosophy is to provide a professional yet personalised investment service. We aim to achieve investment returns for clients in the top quartile of all recognised performance surveys on a rolling 3-year basis. We aim for longer-term consistency, not expecting to achieve industry out-performance each year as we seek absolute investment value. We dislike losing money for clients - a true measure of risk, and avoiding capital losses forms a core tenet of our philosophy. We aim to get the big calls right, take a longer term view when investing our clients’ assets, understand the value of time, and diversify client portfolios.
FOOrD aSSet ManageMent (Pty) LtD
www.foord.co.za
FaIS reQuIreMentS
Who is your FAIS complaints officer?Donnetta McKinley
Please provide the link to the complaints policy on your websitehttp://www.foord.co.za/foord/content/en/complaints
OWnerShIP
What is the ownership structure of the company? The company is owned by the founder and senior staff members.
Who are the directors of the company?Dave Foord, William L Fraser, Paul E Cluer, Brian R Davey
Do staff and management have an interest in ownership? Please provide the percentage held by staff and management.The majority of the company is owned by management and staff.
hIStOry
When was the company established?01/10/1981
List of mergers that have taken place since being established.None
B-BBee creDentIaLS
Are you B-BBEE accredited?No
What is your B-BBEE statusN/A
By whom have you been accredited?N/A
Date of accreditationN/A
gIPS
Are you GIPS compliant?Yes
Are you GIPS verified?No
By whom have you been verified?N/A
Date of verificationN/A
Expiry date of verificationN/A
InveStMent ManDateS
What are your total Assets Under Management?R40.0 Billion
Please detail the mandates you currently manage and the size of each of these mandates.Global Balanced: R15 BillionDomestic Balanced: R4 BillionEquity only: R11 BillionLow Equity Balanced: R5 BillionAbsolute Return: R2 BillionInternational: R7 BillionFlexible Asset Allocation: R700 MillionHedge Funds: R400 MillionBond only: R260 MillionMedical Aid Portfolio: R200 Million
Key InveStMent PerSOnneL
Dave FoordCIO, Portfolio ManagerBCom, CA(SA)34 years industry experience30 years with Foord
Brian DaveyPortfolio ManagerBCom, CA(SA)20 years industry experience15 years with Foord
Dane SchrauwenPortfolio ManagerBA, LLB19 years industry experience2 years with Foord
Mike Townsend Head: Company ResearchBSc(Hons), BA, MBA15 years indsutry experience6 years with Foord
William FraserPortfolio ManagerBCom(Actuarial), Cert(Financial Engineering)12 years industry experience6 years with Foord
Nicholas BalkinPortfolio ManagerBCom(Hons) Finance, CFA7 years industry experience6 years with Foord
91
cOMPany DetaILS
FAISFSPRegistrationnumber:520
SwitchBoard+27 21 659 5300
Faxnumber:+27 21 659 5333
GeneralE-mail:[email protected]
Address:3rd Floor, 240 Great Westerford, 240 Main Road, Rondebosch, 7800Private Bag X6, Newlands, 7725
ComplianceOfficerName:Gerald Saacks+27 21 6595447
BuSIneSS PhILOSOPhy
The Futuregrowth Fixed interest team manages the full range of fixed interest products, with specialist expertise in corporate debt and a competitive advantage in the unlisted debt space. As the largest fixed interest team in the industry, this team has developed the requisite specialist skills to extract value and manage the risk and reward that these bonds offer.
Apart from delivering enhanced returns, investing in the corporate bond market creates better diversification of portfolios and hence a better risk/return profile. Creating diversified portfolios with substantial yield enhancement allows our fund managers to take relatively small interest rate views and yield curve plays, thereby reducing volatility in producing long-term, stable outperformance.
Our team manages a variety of mandates including money market, active bond funds, passive bond funds, yield enhanced income funds and infrastructure and development funds. The SRI arm of the business supports Futuregrowth’s ethos of doing well by doing good.
Futuregrowth is dedicated to the development and empowerment of South Africa and its people, with many of our products geared towards supporting change. With this in mind the team continuously strives to identify opportunities that will not only yield optimal financial returns for stakeholders, but also make significant contributions to society.
FaIS reQuIreMentS
Who is your FAIS complaints officer?Gerald Saacks
Please provide the link to the complaints policy on your websitehttp://www.futuregrowth.co.za/page/complaints-procedure
FuturegrOWth aSSet ManageMent (Pty) LtD
www.futuregrowth.co.za
OWnerShIP
What is the ownership structure of the company? Futuregrowth is owned by Old Mutual Investment Group South Africa.
Who are the directors of the company?Paul Rackstraw Managing DirectorAndrew Canter Chief Investment Officer Diane Radley Chief Executive Officer (OMIGSA) Henk Beets External Non-Executive Director Mobasheer Patel Financial Director (OMIGSA) Kerrin Land Head of Boutique Capability Management (OMIGSA) Daisy Naidoo Independent Director
Do staff and management have an interest in ownership? Please provide the percentage held by staff and management.Yes they do, 11.4%
hIStOry
When was the company established?2000
List of mergers that have taken place since being established.In 2002, the company structure changed significantly when Wipcapital, the financial services subsidiary of WIPHOLD bought a 40% equity stake in Futuregrowth. 20% was transferred to an Employee Share Ownership Plan (ESOP) with the remaining 40% owned by Firstrand.In 2005 Wipcapital increased its shareholding to over 70%. In 2008 Old Mutual Investment Group (SA) (OMIGSA), a subsidiary of Old Mutual South Africa, acquired WIPHOLD’s 69% shareholding in Futuregrowth. As a result of the transaction, OMIGSA’s Fixed Income Investments boutique merged with Futuregrowth’s fixed income team under the Futuregrowth brand to create what is one of the largest fixed income asset managers in South Africa.
B-BBee creDentIaLS
Are you B-BBEE accredited?Yes
What is your B-BBEE statusLevel 3 contributor for 2012 (for the year 2010)
By whom have you been accredited?AQRate
Date of accreditation24/01/2012
gIPS
Are you GIPS compliant?Yes
Are you GIPS verified?Yes
By whom have you been verified?E_Comply
Date of verification2008
Expiry date of verification2009 (we are awaiting sign off on 2009-2010)
InveStMent ManDateS
What are your total Assets Under Management?As of December 2011, R109.8 Billion
Please detail the mandates you currently manage and the size of each of these mandates.Fixed Income (31/12/2011) - R89.1 BillionMoney Market Funds: R26.1 MillionYield Enhanced Money Market Funds: R24.5 BillionYield Enhanced Bonds Funds: R4.9 BillionActive Bonds Funds: R21.9 BillionPassive Bonds: R1.0 BillionCPI Linked Funds: R4.4 BillionIncome Funds: R2.8 BillionEnhanced Income Funds: R3.4 BillionInterest Rate Asset Allocation: R0.1 BillionIBA of Balanced Funds (31/12/2011) - R10.9 BillionMoney Market/Inflation Linked: R8.6 BillionMoney Market/Core Bond: R2.3 BillionSRI Funds (31 December 2011) - R9.8 BillionInfrastructure & Development Bonds: R4.7 BillionCommunity Property: R4.2 BillionDevelopment Equity: R0.7 BillionAgri-Fund: R0.2 Billion
Key InveStMent PerSOnneL
Paul Rackstraw - Managing DirectorCA(SA)21 years industry experience11 years with Futuregrowth
Andrew Canter - Chief Investment OfficerBSc, CFA20 years industry experience12 years with Futuregrowth
Wikus Furstenberg - Portfolio ManagerMCom(Economics)20 years industry experience3 years with Futuregrowth
Daphne Botha - Portfolio ManagerBcom(Hons) Diploma in Financial Markets13 years industry experience11 years with Futuregrowth
James Howard - Portfolio ManagerBCom25 years industry experience12 years with Futuregrowth
Michael Van Rensburg - Portfolio ManagerBCom21 years industry experience3 years with Futuregrowth
Ameesha Chagan - Portfolio ManagerBCom17 years industry experience3 years with Futuregrowth
Jenny Sheehy - Portfolio ManagerBSc(Hons)22 years industry experience3 years with Futuregrowth
92
cOMPany DetaILS
FAISFSPRegistrationnumber:581
SwitchBoard+27 21 915 5100
Faxnumber:+27 21 915 5111
GeneralE-mail:[email protected]
Address:2nd Floor Prosano Park East, South Gate Tyger Waterfront, Charl Cronje Road, BellvillePrivate Bag X20, Tyger Valley, 7536
ComplianceOfficerName:Pankie KellermanTel: +27 21 915 5120Email: [email protected]
BuSIneSS PhILOSOPhy
Gryphon Asset Management subscribes to a core-satellite approach to funds management in order to deliver an optimal risk-return profile to investors:
The core component comprises no frills, low-cost index tracking with concise and clear mandates, lowest cost execution and no requirement to reassess the choice of asset managers.
Alternative investment strategies make up the satellite component of the approach. These funds are focused on achieving outperformance relative to predetermined absolute returns or relative benchmarks.
gryPhOn aSSet ManageMent (Pty) LtD
www.gryphon.com
FaIS reQuIreMentS
Who is your FAIS complaints officer?Pankie Kellerman
Please provide the link to the complaints policy on your websitehttp://www.gryphon.com/uploads/files/File/Section%2051%20Gryphon%20Asset%20Management.pdf
OWnerShIP
What is the ownership structure of the company? 100% Management
Who are the directors of the company?A Du Plessis and MJ Kellerman
Do staff and management have an interest in ownership? Please provide the percentage held by staff and management.100%
hIStOry
When was the company established?1998
List of mergers that have taken place since being established.None
B-BBee creDentIaLS
Are you B-BBEE accredited?No
What is your B-BBEE statusN/A
By whom have you been accredited?N/A
Date of accreditationN/A
gIPS
Are you GIPS compliant?Yes
Are you GIPS verified?No
By whom have you been verified?N/A
Date of verificationN/A
Expiry date of verificationN/A
InveStMent ManDateS
What are your total Assets Under Management?R4.1 Billion
Please detail the mandates you currently manage and the size of each of these mandates.Dividend Income: R2.413 Billion Money Market: R1.676 Billion Equity: 32 Million Hedge Funds: R48 Million
Key InveStMent PerSOnneL
Abri Du PlessisCEOMCom21 years industry experience13 years with Gryphon
Reuben BeeldersCIOBCom(Hons), CA(SA), CFA15 years industry experience11 years with Gryphon
Sunette SwartPortfolio ManagerBCompt(Hons)7 years industry experience7 years with Gryphon
Cassie TreurnichtBCom(Hons)5 years industry experience1 year with Gryphon
93
cOMPany DetaILS
FAISFSPRegistrationnumber:587
SwitchBoard+27 21 416 2000
Faxnumber:+27 21 416 2001
GeneralE-mail:[email protected]
Address:36 Hans Strijdom Avenue, Cape Town, 8001PO Box 1655, Cape Town, 8001
ComplianceOfficerName:Elsabé de Vries, Head of SA Compliance+27 21 416 1785
BuSIneSS PhILOSOPhy
Investec Asset Management does not have an over-arching house style instead choosing to allow the heads of our small specialist investment teams the freedom to operate according to their investment beliefs, with complete discretion over their own teams.
This has been our approach since the inception of the firm; we believe it is better to be diversified in philosophy and style across the business. This philosophy has not changed over time, and we believe this approach is much more successful long term.
InveStec aSSet ManageMent (Pty) LtD
www.investecassetmanagement.com
FaIS reQuIreMentS
Who is your FAIS complaints officer?Clifford Clibborn-Dyer
Please provide the link to the complaints policy on your websitehttp://www.investecassetmanagement.com/south-africa/footer-menu/complaints/
OWnerShIP
What is the ownership structure of the company? 100% owned entity of Investec Ltd
Who are the directors of the company?Hendrik du Toit (Executive)John Green (Executive)Thabo Khojane (Executive)André Roux (Executive)Cunningham Ngcukana (Executive)John McNab (Executive)Kim McFarland (Executive)
Do staff and management have an interest in ownership? Please provide the percentage held by staff and management.Employee’s holdings of Investec shares represent approximately 15% of the company’s total shares (at 31/03/2011)
hIStOry
When was the company established?1991
List of mergers that have taken place since being established.Guinness Flight - 1998Alliance Capital - 2006
B-BBee creDentIaLS
Are you B-BBEE accredited?Yes
What is your B-BBEE statusLevel 4 Contributor
By whom have you been accredited?Emperdex
Date of accreditation05/10/2011
gIPS
Are you GIPS compliant?Yes
Are you GIPS verified?Yes (for period 01/01/00 to 31/12/10)
By whom have you been verified?KPMG
Date of verification27/06/2011
Expiry date of verificationN/A
InveStMent ManDateS
What are your total Assets Under Management?R665 Billion at 30/09/2011
Please detail the mandates you currently manage and the size of each of these mandates.At 30/09/2011 we managed 1,036 mandates on behalf of Southern Africa institutional
Key InveStMent PerSOnneL
Hendrik du ToitChief Executive OfficerMCom(Econ & Int Fin) Cum Laude, MPhil(Econ & Politics of Dev), BCom(Hons) Economics Cum Laude, BCom(Law)23 years industry experience20 years with Investec
Thabo KhojaneManaging Director, AfricaBA(Hons) Economics, BSc(Eng)13 years industry experience13 years with Investec
John McNabCo-Chief Investment OfficerMEng(Industrial) Cum Laude, CFA16 years industry experience16 years with Investec
André RouxCo-Head of Fixed IncomeMPhil(Economics), MSc(Maths), BSc(Hons) Maths, BSocSc(Maths, Sociology)12 years industry experience12 years with Investec
94
cOMPany DetaILS
FAISFSPRegistrationnumber:711
SwitchBoard+27 11 505 6000
Faxnumber:+27 11 263 1001
GeneralE-mail:[email protected]
Address:Building 1, Inanda Greens Office Park, 54 Wierda Road West, Wierda Valley, 2196 PO Box, 786055, Sandton, 2146, RSA
ComplianceOfficerName:Andre [email protected]+27 11 505 6151
BuSIneSS PhILOSOPhy
Multi-Manager
InveStMent SOLutIOnS LIMIteD
www.investmentsolutions.co.za
FaIS reQuIreMentS
Who is your FAIS complaints officer?Andre Vorster
Please provide the link to the complaints policy on your websitehttp://sa.investmentsolutions.co.za/Risk-Compliance/Legislation
OWnerShIP
What is the ownership structure of the company? 100% owned by AF equity Holdings
Who are the directors of the company?EC Kieswetter, DV Viljoen (alternate) Managing Director - DTV Msibi Directors - D Konar, M Msimang, N Nyawo, B Petersen, MC Ramaphosa, Company Secretary - JE Salvado
Do staff and management have an interest in ownership? Please provide the percentage held by staff and management.Yes - at the AF Equity holdings level through a management share trust
hIStOry
When was the company established?1997
List of mergers that have taken place since being established.Superflex - 1999
B-BBee creDentIaLS
Are you B-BBEE accredited?Yes
What is your B-BBEE statusLevel 3 contributor
By whom have you been accredited?Empowerdex
Date of accreditation2011
gIPS
Are you GIPS compliant?No
Are you GIPS verified?No
By whom have you been verified?N/A
Date of verificationN/A
Expiry date of verification
N/A
InveStMent ManDateS
What are your total Assets Under Management?R190 Billion
Please detail the mandates you currently manage and the size of each of these mandates.N/A - pooled multi managed funds
Key InveStMent PerSOnneL
Glenn SilvermanCIOBCom, BAcc, CA(SA), CFA 19 years industry experience13 years with IS
Nina SaadHead of Portfolio ManagementBSc, CFA13 years industry experience3 years with IS
Ann LeepileHead of Manager ResearchBCom, CFA 10 years industry experience1.5 years with IS
Brink VermaakHead of Market & Economic ResearchMCom6.5 years industry experience3.5 years with IS
Chris HartChief StrategistHDipED, BCom10 years industry experience4.5 years with IS
95
cOMPany DetaILS
FAISFSPRegistrationnumber:730
SwitchBoard+27 11 325 2027
Faxnumber:+27 11 325 2047
GeneralE-mail:[email protected]
Address:28 Bompas Road, Dunkeld West, 2196PO BOX 31250, Braamfontein, 2017.
ComplianceOfficerName:Joseph Makamba Busha+27 11 325 2027
BuSIneSS PhILOSOPhy
Honesty, transparency, client needs prioritisation and product (service) relevance and value creates a winning and mutually beneficial, sustainable, partnership-based business relationship. Nothing else does other than these aspects.
JM BuSha InveStMent grOuP (Pty) LtD
www.jmbusha.com
FaIS reQuIreMentS
Who is your FAIS complaints officer?Joseph Makamba Busha
Please provide the link to the complaints policy on your websitewww.jmbusha.com
OWnerShIP
What is the ownership structure of the company? Employee Owned
Who are the directors of the company?Joseph Busha, McLean Sibanda, Thokozani W. Magwaza
Do staff and management have an interest in ownership? Please provide the percentage held by staff and management.SIP (30%), JMBIG(50%), SEP(20%)
hIStOry
When was the company established?17/07/2000
List of mergers that have taken place since being established.None
B-BBee creDentIaLS
Are you B-BBEE accredited?Yes
What is your B-BBEE statusLevel 4 contributor (1/03/2010 - 28/02/2011)
By whom have you been accredited?BEE Rating Solutions (Pty) Ltd
Date of accreditationIn progress
gIPS
Are you GIPS compliant?Yes
Are you GIPS verified?No
By whom have you been verified?N/A
Date of verificationN/A
Expiry date of verificationN/A
InveStMent ManDateS
What are your total Assets Under Management?R2.962 Billion
Please detail the mandates you currently manage and the size of each of these mandates.Institutional: R2.914 BillionRetail (unit trust): R50.6 Million
Key InveStMent PerSOnneL
Joseph M BushaCIOBSc, BSc(Hons), MSc, MPhil19 years industry experience12 years with JM BUSHA - Capital BUSHA
Limakatso LehoboEconomic ResearchBA, BCom, MCom5 years industry experience4 years with JM BUSHA - Capital BUSHA
Mageshine ReddyInvestment ResearchBSc(Act Sci)9 years industry experience2 years with JM BUSHA - Capital BUSHA
Patrick SerereInvestment ResearchBCom10 years industry experience0.5 years with JM BUSHA - Capital BUSHA
96
cOMPany DetaILS
FAISFSPRegistrationnumber:784
SwitchBoard+27 21 673 6300
Faxnumber:+27 86 675 8501
GeneralE-mail:[email protected]
Address:Fifth floor, MontClare Place, Cnr Main & Campground Roads, Claremont, 7708.P O Box 1016, Cape Town, 8000.
ComplianceOfficerName:Tracy-Lee Scott+27 21 673 6303 [email protected]
BuSIneSS PhILOSOPhy
Opportunities arise when market prices deviate from intrinsic value
All investments represent a set of future cashflows, which can be valued with reasonable accuracy. The progression of this intrinsic value is fairly stable through time. Investment market prices, however, vary considerably over time – most often due to self-reinforcing cycles of enthusiasm or negativity.
The patient, skilled investor will benefit from buying investments at prices well below intrinsic value and holding them until they can be sold at above intrinsic value.
The future is never certain.
There is considerable danger in operating with the comfort of a false sense of certainty and the accompanying behavioural reinforcement cycles that lead to a distorted evaluation of new information.
Recognition that one’s view may be incorrect, and that one cannot know all the facts, drives one to think more deeply, to work harder and to be more alert. The future should be viewed in terms of probabilities, alternative scenarios should be explored, risk should be diversified and hedged and potential asymmetries should be sought.
KagISO aSSet ManageMent
www.kagisoam.com
FaIS reQuIreMentS
Who is your FAIS complaints officer?Tracy-Lee Scott
Please provide the link to the complaints policy on your websiteN/A
OWnerShIP
What is the ownership structure of the company? Kagiso Tiso Holdings (previously Kagiso Trust Investments prior to the merger with Tiso Group on 01/07/2011) owns 50.1% of the company and management and staff own the remaining 49.9%.
Who are the directors of the company?Roland Greaver, Gavin Wood, Frencel Gillion, Bryan Hopkins
Do staff and management have an interest in ownership? Please provide the percentage held by staff and management.49.9% owned by management and staff
hIStOry
When was the company established?December 2001
List of mergers that have taken place since being established.None
B-BBee creDentIaLS
Are you B-BBEE accredited?Yes
What is your B-BBEE statusLevel 1 contributor
By whom have you been accredited?NERA
Date of accreditation14/09/2010 (We are in the process of obtaining an up to date certificate)
gIPS
Are you GIPS compliant?Yes
Are you GIPS verified?Yes
By whom have you been verified?KPMG
Date of verification2008
Expiry date of verification31/12/2008 (we are in the process of obtaining an up to date certificate which should be available early in 2012)
InveStMent ManDateS
What are your total Assets Under Management?R33.955 Billion as at 30/11/2011
Please detail the mandates you currently manage and the size of each of these mandates.Managed equity: R16.373 BillionCore equity: R16.747 BillionBalanced: R519 MillionOther: R316 Million
Key InveStMent PerSOnneL
Gavin Wood CIOBBusSc, FFA, CFA15 years industry experience10 years with Kagiso
Abdul DavidsHead of ResearchBCom, CFA13 years industry experience4 years with Kagiso
97
cOMPany DetaILS
FAISFSPRegistrationnumber:16134
SwitchBoard+27 21 433 2960
Faxnumber:+27 21 433 0675
GeneralE-mail:[email protected]
Address:6th Floor, The Equinox, cnr Milton & Main Roads, Sea Point, 8005P O Box 8275, Roggebaai, 8012
ComplianceOfficerName:Brandon Furstenburg (Int)/Richard Rautte (Ext)+27 83 400 2946/ +27 82 775 0730
BuSIneSS PhILOSOPhy
Pragmatic investing.
FaIS reQuIreMentS
Who is your FAIS complaints officer?Brandon Furstenburg
Please provide the link to the complaints policy on your websiteNot currently available on website, but available on request
OWnerShIP
What is the ownership structure of the company? Wholly owned subsidiary of Mergence Africa Holdings (Pty) Ltd.
Who are the directors of the company?Masimo Magerman, Fabian de Beer, Bongani Jack
Do staff and management have an interest in ownership? Please provide the percentage held by staff and management.A share incentive scheme allows for up to 30% if the company’s economic interest to be allocated to staff
hIStOry
When was the company established?2005
List of mergers that have taken place since being established.None
Mergence InveStMent ManagerS
www.mergence.co.za
B-BBee creDentIaLS
Are you B-BBEE accredited?Yes
What is your B-BBEE statusAAA, level 1
By whom have you been accredited?Empowerdex
Date of accreditation14/10/2011
gIPS
Are you GIPS compliant?Yes
Are you GIPS verified?Yes
By whom have you been verified?PWC
Date of verification10/05/2011
Expiry date of verificationN/A
InveStMent ManDateS
What are your total Assets Under Management?R7.5 Billion
Please detail the mandates you currently manage and the size of each of these mandates.Absolute Mandates (CPI +3%, +4% and +5%): R4.886 Billion Long-only Equity Mandates (SWIX & CAPI): R2.521 Billion SRI Mandates: R98 Million.
Key InveStMent PerSOnneL
Bradley PrestonHead: Quantitative Analysis & Portfolio ManagerBSc(Hons), MSc(Financial Mathematics)6 years industry experience6 years with Mergence
Brandon FurstenburgChief Operating OfficerBCom(Hons), MCom, MSc(Finance)12 years industry experience1 year with Mergence
Chitongwa SiameEquity AnalystBSc(Hons), ACCA4 years industry experience9 months with Mergence
Dirk SteynRisk ManagerBSc, BEng, MSc(Financial Mathematics)6 years industry experience4 years with Mergence
Fabian de BeerChief Investment OfficerBCom, H.Dip.Ed24 years industry experience5 years with Mergence
Masimo MagermanManaging Director & Portfolio ManagerBMSc(Fin), MBA(Fin)16 years industry experience6 years with Mergence
Zwelakhe MnguniHead: Equities & Portfolio ManagerBCom(Hons)UCT, MCom(Finance)12 years industry experience1 year with Mergence
Mark van WykPortfolio ManagerBCom(Hons), CA(SA)11 years industry experience1 year with Mergence
98
cOMPany DetaILS
FAISFSPRegistrationnumber:623
SwitchBoard+27 11 505 1555
Faxnumber:+27 11 505 1440
GeneralE-mail:[email protected]
Address:7 Merchant Place, 9 Fredman Drive, Sandton, 2196Private Bag 9959, Sandton, 2146
ComplianceOfficerName:Carmen MalcolmTel +27 11 505 1449 Fax +27 86 573 7449 Email: [email protected]
BuSIneSS PhILOSOPhy
Momentum Asset Management aims to be the asset manager of choice for both clients and employees. To create value for all stakeholders by ensuring the optimal allocation and stewardship of funds, so contributing to a sustainable economy that delivers improving standards of living to the broader society.
To deliver exceptional service to our clients in consistently meeting their investment objectives by leveraging our talented and cohesive team, our innovative and disciplined processes and our best-in-class systems.
FaIS reQuIreMentS
Who is your FAIS complaints officer?Carmen Malcolm
Please provide the link to the complaints policy on your websitehttp://www.momentuminv.co.za/Libraries/Legal_Documents/Complaints_Resolution_Policy_and_Procedure_-_22_June_2011.sflb.ashx
OWnerShIP
What is the ownership structure of the company? N/A
Who are the directors of the company?SC Mabuza, M Mthombeni, FW van Zyl
Do staff and management have an interest in ownership? Please provide the percentage held by staff and management.Ownership structures are through MMI Shareholding
MOMentuM aSSet ManageMent (Pty) LtD
www.momentuminv.co.za
hIStOry
When was the company established?Momentum Asset Management was formed on 01/09/2011. It is a wholly owned subsidiary of Momentum which is a wholly owned subsidiary of one South Africa’s largest financial services group, MMI. The company, which is an integration of two asset management companies, namely RMB Asset Management and Metropolitan Asset Management was formed as a result of a merger between Momentum and Metropolitan. The merged entity, MMI Holdings was listed on the 01/12/2010.
List of mergers that have taken place since being established.Please refer to above.
B-BBee creDentIaLS
Are you B-BBEE accredited?As a result of the merger, we are still in the process of finalizing teams and processes and therefore do not yet have the new entity’s BBBEE accreditation. Accreditation is expected in April 2012.
What is your B-BBEE statusPlease refer to above.
By whom have you been accredited?Please refer to above.
Date of accreditationPlease refer to above.
gIPS
Are you GIPS compliant?Our firm (as described by GIPS) has just gone through a merger and GIPS verification for the new entity is in the process of being confirmed. RMB Asset Management is GIPS Compliant.
Are you GIPS verified?Our firm (as described by GIPS) has just gone through a merger and GIPS verification for the new entity is in the process of being confirmed. RMB Asset Management had been independently verified for the periods June 1999 to June 2010.
By whom have you been verified?Please refer to above.
Date of verificationPlease refer to above.
Expiry date of verificationPlease refer to above.
InveStMent ManDateS
What are your total Assets Under Management?R185.2 Billion
Please detail the mandates you currently manage and the size of each of these mandates.Absolute Return: R2.747 BillionBalanced: R97.894 BillionBonds: R20.134 BillionCash: R38.845 BillionEquity: R8.354 BillionProperty: R815.639 MillionOther: R16.450 Billion
Key InveStMent PerSOnneL
Jonathan StewartCIOBCom(Hons), MCom, CFA15 years industry experience9 years with Momentum Asset Management
Waynne McCurrieHead: Portfolio ManagersBAcc(Hons), CA(SA)24 years industry experience4 years with Momentum Asset Management
Leon MichaelidesHead: Equity ResearchBcom(Hons), CA(SA)12 years industry experience2 years with Momentum Asset Management
Gordon SmithHead of StrategyBSocSci(Hons) Economics21 years industry experience3 years with Momentum Asset Management
Lynn can CollerHead:Portfolio ConstructionMSc, PhD15 years industry experience4 years with Momentum Asset Management
Conrad WoodHead: Fixed InterestBCom(Economics), CFA17 years industry experience17 years with Momentum Asset Management
99
cOMPany DetaILS
FAISFSPRegistrationnumber:19840
SwitchBoard+27 86 153 8732
Faxnumber:+27 86 573 7384
GeneralE-mail:[email protected]
Address:2nd floor, 6 Merchant Place, Cnr Fredman Drive and Bute Avenue, SandtonPO Box 330, Gallo Manor, 2052
ComplianceOfficerName:Samantha [email protected]
BuSIneSS PhILOSOPhy
Momentum Manager of Manager’s vision is to partner with consultants, advisers and trustees in delivering a flexible and scalable investment platform, creating custom and pre-packaged investment savings and market-linked liability-management solutions for the needs of corporate, wholesale retail and institutional investors, primarily in South Africa, and other select African countries.
The company aspires to create solutions for clients based on their particular needs. Most investors have unique requirements and therefore a black-box solution is not always appropriate. Momentum Manager of Managers strives to offer the required flexibility, expertise, transparency, service and performance to meet those requirements.
FaIS reQuIreMentS
Who is your FAIS complaints officer?Samantha Padayachee
Please provide the link to the complaints policy on your websiteN/A
OWnerShIP
What is the ownership structure of the company? Momentum Manager of Managers is 100% owned by Momentum Investments, a wholly-owned subsidiary of the MMI Group
Who are the directors of the company?Leon Greyling, Sonja Saunderson, Neelan Pillay, Morris Mthombeni (Non-executive), Heidi Kerwan
MOMentuM Manager OF ManagerS (Pty) LtD
www.momentum.co.za
Do staff and management have an interest in ownership? Please provide the percentage held by staff and management.No
hIStOry
When was the company established?January 2005
List of mergers that have taken place since being established.Momentum International Multi-managers and m Cubed Holdings (2005)
B-BBee creDentIaLS
Are you B-BBEE accredited?Yes. Please note that the accreditation details listed below are for FirstRand Limited. At the time of accreditation, Momentum Manager of Managers (previously known as Advantage Asset Managers) was included in the accreditation as it was part of Momentum Group Limited, which itself was part of FirstRand Limited. Subsequent to this, Momentum Group Limited unbundled from FirstRand Limited and merged with Metropolitan Holdings Limited to form MMI Holdings Limited. MMI Holdings Limited is currently engaged in a process to obtain B-BBEE accreditation.
What is your B-BBEE statusLevel 3 contributor
By whom have you been accredited?SizweNtsaluba VSP
Date of accreditation14/02/2011
gIPS
Are you GIPS compliant?No
Are you GIPS verified?No
By whom have you been verified?N/A
Date of verificationN/A
Expiry date of verificationN/A
InveStMent ManDateS
What are your total Assets Under Management?R40.3 Billion (30/06/2011)
Please detail the mandates you currently manage and the size of each of these mandates.Balanced: R3.6 BillionSpecialist: R30.3 BillionAbsolute Return: R255 MillionOther: R6.1 Billion
Key InveStMent PerSOnneL
Sonja SaundersonCIOBSc, Bcom(Hons), MCom11 years industry experience11 years with Momentum Manager of Managers
Bredan HowieDeputy CIOBSc(Hons), CFA, CIPM12 years industry experience1 year with Momentum Manager of Managers
Jako de JagerHead: Portfolio ManagementBCom(Hons)10 years industry experience10 years with Momentum Manager of Managers
Melissa BredaHead: Portfolio ConstructionBSc(Hons)9 years industry experience9 years with Momentum Manager of Managers
Wynford HeynesHead: ImplementationBSc(Hons), MSc(Cum Laude)15 years industry experience1 year with Momentum Manager of Managers
Jean BadenhorstHead: Manager ResearchBCom18 years industry experience15 years with Momentum Manager of Managers
Eugene BothaHead: Quantitative ResearchBSc(Hons), MSc6 years industry experience6 years with Momentum Manager of Managers
Mike AdsettsHead:Specialised InvestmentsBSc(Hons), CFA, MBA9 years industry experience3 years with Momentum Manager of Managers
100
cOMPany DetaILS
FAISFSPRegistrationnumber:N/A
SwitchBoard+27 860 123 263
Faxnumber:+27 861 119 733
GeneralE-mail:[email protected]
Address:2nd Floor BoE Building, Clocktower Precinct, V&A Waterfront, Cape TownPO Box 1510, Cape Town, 8000
ComplianceOfficerName:Liezel Momberg+27 21 416 6204
BuSIneSS PhILOSOPhy
We offer individual and institutional investors access to a range of South African and offshore unit trust portfolios to meet their investment needs. These portfolios are managed by a range of Best of breedTM investment managers that we actively monitor and review, so that clients don’t have to.
neDgrOuP cOLLectIve InveStMentS LtD
www.nedgroupinvestments.co.za
FaIS reQuIreMentS
Who is your FAIS complaints officer?N/A
Please provide the link to the complaints policy on your websitehttp://www.nedgroupinvestments.co.za/Content/Files/Client_Complaint_procedure_2010.pdf
OWnerShIP
What is the ownership structure of the company? Wholly owned subsidiary on Nedbank Group Ltd
Who are the directors of the company?NA Andrew, CE Sevenaoks, D Macready
Do staff and management have an interest in ownership? Please provide the percentage held by staff and management.None.
hIStOry
When was the company established?1997
List of mergers that have taken place since being established.None.
B-BBee creDentIaLS
Are you B-BBEE accredited?No, fall under Nedbank Ltd accreditation
What is your B-BBEE statusLevel 2 contributor
By whom have you been accredited?SANAS
Date of accreditation05/02/2011
gIPS
Are you GIPS compliant?N/A
Are you GIPS verified?N/A
By whom have you been verified?N/A
Date of verificationN/A
Expiry date of verificationN/A
InveStMent ManDateS
What are your total Assets Under Management?R100 Billion
Please detail the mandates you currently manage and the size of each of these mandates.45 pooled mandates - ranging in size up to the largest being R13.5 Billion
Key InveStMent PerSOnneL
Nic AndrewExecutive Head of Asset ManagementBCom, CA(SA), PGDip Tax Law, CFA16 years industry experience13 years with Nedgroup
Matthew De WetHead of InvestmentsBSc, CFA, CFP13 years industry experience11 years with Nedgroup
Trevor GarvinHead of Multi-managementBCom(Hons) Economics, MCom(Finance), MBA, Dip FMI(Cum Laude), SAFEX, ACIBM, CAIA14 years industry experience8 years with Nedgroup
101
cOMPany DetaILS
FAISFSPRegistrationnumber:OCK FSP no: 796 and OAM FSP no: 603
SwitchBoard+27 21 4137860
Faxnumber:+27 21 4137900
GeneralE-mail:[email protected]
Address:Oasis House, 96 Upper Roodebloom Road, University Estate, Cape Town, 8000PO Box 1217, Cape Town, South Africa, 8000
ComplianceOfficerName:Mr Nazeem EbrahimTel: +27 21 4137860Email: [email protected]
BuSIneSS PhILOSOPhy
Integrated business, investment & human resources philosophy;
Experienced management team, driven by long-term goals;
In-sourcing of all asset management disciplines and investment in best of breed systems;
Highly regulated operations and products;
We stick to our proven instrument selection criteria and detailed in-house research;
Our primary focus is on maintaining and growing the wealth of our clients.
OaSIS creScent caPItaL (Pty) LtD (OcK) anD OaSIS aSSet ManageMent (Pty) LtD (OaM)
www.oasiscrescent.com
FaIS reQuIreMentS
Who is your FAIS complaints officer?Mr Nazeem Ebrahim
Please provide the link to the complaints policy on your websiteEmail address available for complaints at http://www.oasis.co.za/default/content.aspx?initial=true&moveto=710. Complaints policy not on website but available on request
OWnerShIP
What is the ownership structure of the company? The underlying subsidiaries are 100% owned by Oasis Group Holdings (PTY) LTD.
Who are the directors of the company?A (Adam) Ebrahim, M S (Mohamed) Ebrahim, N I (Nazeem) Ebrahim
Do staff and management have an interest in ownership? Please provide the percentage held by staff and management.Yes. Note: Over the period June 2010 to December 2010 our executive share incentive sheme which provided for senior staff to own up to 20% of the value of the company was converted to a profit sharing scheme of a similar value.
hIStOry
When was the company established?OCK est. 2002 and OAM est. 1997
List of mergers that have taken place since being established.None
B-BBee creDentIaLS
Are you B-BBEE accredited?Yes
What is your B-BBEE statusLevel 1 contributor
By whom have you been accredited?IQuad
Date of accreditationDecember 2011
gIPS
Are you GIPS compliant?Yes
Are you GIPS verified?Yes
By whom have you been verified?SAB&T
Date of verification28/06/2011
Expiry date of verificationAnnual Review
InveStMent ManDateS
What are your total Assets Under Management?R30.149 Billion
Please detail the mandates you currently manage and the size of each of these mandates.AUM (R) Summary as at 20/12/2011Segregated Equity: R11.282 BillionSegregated Balanced: R1.772 BillionPooled: R1.657 BillionCIS: R13.222 BillionOther: R2.214 Billion
Key InveStMent PerSOnneL
Adam EbrahimCIOCA(SA), CFA23 years industry experience14 years with Oasis
Michael SwinglerSenior AnalystCA(SA), CFA17 years industry experience14 years with Oasis
Hassan MotalaSenior AnalystCA(SA), CFA13 years industry experience10 years with Oasis
102
cOMPany DetaILS
FAISFSPRegistrationnumber:604
SwitchBoard+27 21 509 5022
Faxnumber:+27 21 509 4663
GeneralE-mail:[email protected]
Address:West Campus, Entrance 1, Mutualpark, Jan Smuts Drive, Pinelands, 7405P.O.Box 878, Cape Town, 8000
ComplianceOfficerName:Zulfa Abdurahman +27 21 509 2570
BuSIneSS PhILOSOPhy
We believe that by combining independent boutique businesses with world class research and supporting infrastructure, we have a combination that will deliver consistently to clients’ objectives. We believe that performance is achieved through focus - expert professionals, focusing on their areas of specialisation. With boutique members investing alongside their clients for the long-term ensures, the fortunes of the investment professionals are strongly linked with client outcomes - both in terms of the income they receive and the wealth they accumulate. We foster a culture that encourages innovation, empowerment and accountability.
OLD MutuaL InveStMent grOuP (SOuth aFrIca) (Pty) LtD
www.omigsa.com
FaIS reQuIreMentS
Who is your FAIS complaints officer?Zulfa Abdurahman
Please provide the link to the complaints policy on your websiteN/A
OWnerShIP
What is the ownership structure of the company? 100% owned by Old Mutual South Africa
Who are the directors of the company?Dr. D Konar, DC Radley, PG de Beyer, KD Dlamini, CE Maynard, M Patel, LL Dhlamini, RT Mupita, I Kgaboesele
Do staff and management have an interest in ownership? Please provide the percentage held by staff and management.Staff can take up to 20% ownership
hIStOry
When was the company established?1993
List of mergers that have taken place since being established.In December 2006, OMIGSA bought a controlling stake in Dibanisa Fund Managers. In February 2008, OMIGSA acquired a controlling stake in Futuregrowth Asset Managment and OMIGSA’s Fixed Interest Team merged with Futuregrowth.
B-BBee creDentIaLS
Are you B-BBEE accredited?Yes
What is your B-BBEE statusLevel 2 contributor
By whom have you been accredited?AQ rate
Date of accreditation18/10/2011
gIPS
Are you GIPS compliant?Yes
Are you GIPS verified?Yes
By whom have you been verified?PricewaterhouseCoopers
Date of verificationJune 2011
Expiry date of verificationDecember 2010
InveStMent ManDateS
What are your total Assets Under Management?R445.683 Billion at 30/09/2011
Please detail the mandates you currently manage and the size of each of these mandates.Absolute Return: R18.257 BillionAlternative: R29.955 BillionGeneral Equity: R140.533 BillionSector Equity: R5.506 BillionBonds: R91.192 BillionIncome Focus: R13.167 BillionShort Term IBA: R51.759 BillionBalanced: R65.236 BillionProperty: R30.074 Billion
103
Key InveStMent PerSOnneL
Tom ConnellHead of Absolute Return InvestmentsCA24 years industry experience16 years with OMIGSA
Paul BoyntonExecutive Director: Head of Alternative InvestmentsBCom, BSc(Hons), MBA, CA(SA)22 years industry experience16 years with OMIGSA
Peter LinleyBoutique Head: Toros Equity BoutiqueBCompt(Accounting Science), CFA17 years industry experience10 years with OMIGSA
Andrew CanterCIO and Head of Fixed InterestBSc(Fin), CFA22 years industry experience12 years with OMIGSA
Tanja TippettBoutique Head: LDIMSc(Applied Maths), CFA13 years industry experience11 years with OMIGSA
Godwin SepengBoutique Head: Long Term Equity InvestmentsBSc, CFA18 years industry experience14 years with OMIGSA
Peter BrookeHead: Macro Strategy InvestmentsBBusSc(Hons) Finance16 years industry experience6 years with OMIGSA
Peter LevettHead of PropertyMCom, CA, MBA22 years industry experience14 years with OMIGSA
Bradley KalilManaging Director OMSFINBBSc, CA(SA), CFA17 years industry experience15 years with OMIGSA
Grant WatsonJoint Boutique Head: Quantitative InvestmentsBCom, MCom, MBA, SAIS, CMMD18 years industry experience8 years with OMIGSA
Saliegh SalaamJoint Boutique Head: Quantitative InvestmentsBCom, CFA18 years industry experience8 years with OMIGSA
Richard HassonELECTUS Senior Portfolio ManagerBCom, CA(SA), CFA14 years industry experience14 years with OMIGSA
Neil BrownELECTUS Senior Porfolio ManagerNatDip(Co. Admin), MBA20 years industry experience7 years with OMIGSA
Michael SchroderHead of Value Equity Investments BoutiqueMSc, MBA21 years industry experience21 years with OMIGSA
Brian PyleHead: Equity ResearchBCom, CA(SA), CFA13 years industry experience13 years with OMIGSA
OLD MutuaL InveStMent grOuP (SOuth aFrIca) (Pty) LtD
continued
104
cOMPany DetaILS
FAISFSPRegistrationnumber:620
SwitchBoard+27 11 463 0300
Faxnumber:+27 11 463 0299
GeneralE-mail:[email protected]
Address:6 Blackpool Road, Bryanston, 2021Private Bag X9962, Sandton, 2146
ComplianceOfficerName:Independent Compliance Services - Debbi Wahl+27 21 975 6597
BuSIneSS PhILOSOPhy
PAM investment philosophy is based on the fact that markets are increasingly becoming integrated and interactive, that investment risk is as important as investment returns and that both should be managed diligently. The fundamental PAM approach to managing money stems from a clear and consistent investment methodology.
PAM, an asset management company, is driven by independent thinkers, clearly not part of the herd, with a contrarian theme based outlook on markets, while balancing the risk and return of monies invested.
Pan-aFrIcan aSSet ManageMent (Pty) LtD
www.pam-asset.co.za
FaIS reQuIreMentS
Who is your FAIS complaints officer?Independent Compliance Services - Debbi Wahl
Please provide the link to the complaints policy on your websiteN/A
OWnerShIP
What is the ownership structure of the company? FABCOS 34%; African General Equity 40%; Staff 26%
Who are the directors of the company?Executive: Helen M. Masson; Non-executive: Dr. George F. Lindeque; Reggie Naidoo; Mxolisi Zwane
Do staff and management have an interest in ownership? Please provide the percentage held by staff and management.26%
hIStOry
When was the company established?1996
List of mergers that have taken place since being established.Oct 2001 - Merger between Real Africa Asset Managment “RAAM” & WIPAM 2006: Name changed from Real Africa Asset Management to Pan-African Asset Management
B-BBee creDentIaLS
Are you B-BBEE accredited?Yes
What is your B-BBEE statusLevel 2 contributor
By whom have you been accredited?Empowerdex
Date of accreditation05/09/2011
gIPS
Are you GIPS compliant?PAM’s performance measurement is outsourced to Maitland Fund Services (Pty) Ltd, GIPS compliant. PAM further subscribes and adheres to the CFA Institute’s Code of Conduct, which encompasses the GIPS principles.
Are you GIPS verified?N/A
By whom have you been verified?N/A
Date of verificationN/A
Expiry date of verificationN/A
InveStMent ManDateS
What are your total Assets Under Management?R3.3 Billion
Please detail the mandates you currently manage and the size of each of these mandates.Pan-African Money Market Fund: R0.4 BillionPan-African Bond Fund: R2.3 BillionPan-African Balanced Fund: R0.3 BillionStructured Product: R0.3 Billion
Key InveStMent PerSOnneL
Helen MassonCIOMCom(Econometrics), CFA31 years industry experience16 years with Pan-African
Mike HaworthAnalystBSc, MBA27 years industry experience4 years with Pan-African
Thavanesen PadiachyCOOBCom(Hons)21 years industry experience7 years with Pan-African
Miranda ScheepersHead of AdministrationNational diploma & Financial Accounting30 years industry experience6 years with Pan-African
Marga van DeventerAnalystBSc(Hons) Quantitative Risk Management7 years industry experience3 years with Pan-African
Julian MassonTraderBCom(Hons) Financial Analysis and Portfolio Management2 years industry experience1 year with Pan-African
105
cOMPany DetaILS
FAISFSPRegistrationnumber:612
SwitchBoard+27 21 700 3600
Faxnumber:+27 21 700 3700
GeneralE-mail:[email protected]
Address:Prescient House, Westlake Business Park, Otto Close,Westlake,7945PO Box31142,Tokai,7966
ComplianceOfficerName:Moneen d` Hotman de Villiers+27 21 700 3600
BuSIneSS PhILOSOPhy
Prescient is a quantitative investment manager. At Prescient, we define risk as the probability of not meeting the investment objectives if the client. To this extent, positions taken in portfolios are mathematically tested using different scenarios to determine portfolio outcome. This ensures that position taken will, on the upside, deliver on client expectation, while at the same time, in down markets, it will not breach the risk objective of the client. The core of Prescient’s investment philosophy is capital preservation and the management of downside risk.
PreScIent InveStMent ManageMent Pty LtD
www.prescient.co.za
FaIS reQuIreMentS
Who is your FAIS complaints officer?Moneen d` Hotman de Villiers
Please provide the link to the complaints policy on your websiteN/A
OWnerShIP
What is the ownership structure of the company? Founder members own 50.23%, staff 26.5% and external BEE parties 23.2%
Who are the directors of the company?Herman Steyn, Guy Toms, Carey Millerd, Eldria Fraser, Sharon Bailey
Do staff and management have an interest in ownership? Please provide the percentage held by staff and management.Management and Staff- 76.8%External Partners- 23.2%
hIStOry
When was the company established?Prescient Investment Management was established on the 1st of September 1998 and is an independent quantitative investment management company specialising in the portfolio and risk management of institutional, pension, provident fund and retail assets.
List of mergers that have taken place since being established.None.
B-BBee creDentIaLS
Are you B-BBEE accredited?Yes
What is your B-BBEE status73.33% - Level 4 contributor
By whom have you been accredited?AQRate Verification Services
Date of accreditation19/08/2011
gIPS
Are you GIPS compliant?Yes
Are you GIPS verified?Yes
By whom have you been verified?eComply
Date of verification21/08/2011
Expiry date of verification31/03/2012
InveStMent ManDateS
What are your total Assets Under Management?Total Asset under Management: R94.4 Billion (AUM - R86.6 Billion AUA - R 7.8 Billion) as at 30 November 2011
Please detail the mandates you currently manage and the size of each of these mandates.Cash: R24.7 BillionIncome: R8.6 BillionBond: R15.4 BillionEquity: R1.9 BillionBalanced: R34.0 BillionGlobal: R2.0 Billion
Key InveStMent PerSOnneL
Herman SteynChairmanBBusSc27 years industry experience13 years with Prescient
Eldria FraserCEOBCom(Hons), CFA18 years industry experience6 years with Prescient
Guy TomsCIOBBusSc26 years industry experience13 years with Prescient
Sharon BaileyExecutive Director- Head of Business Development and Marketing21 years industry experience9 years with Prescient
106
cOMPany DetaILS
FAISFSPRegistrationnumber:38318
SwitchBoard+27 21 801 5925
Faxnumber:+27 86 614 7173
GeneralE-mail:[email protected]
Address:15 Springbok Close, Pinelands, 7405
ComplianceOfficerName:Enrique Goosen+27 21 975 6468
BuSIneSS PhILOSOPhy
Prowess’ vision is to continue building a business based on expertise, agile structure while focused on customised client-centric solutions and service. Prowess’ philosophy is that focused and specialized attention to core business areas, which is investment management, is crucial in adding investment value to client portfolios. In this vein, Prowess aims to outsource all non core functions and focus on Investment Management and in-source other necessary expertise as the business requires e.g. branding and marketing, risk management, etc.
PrOWeSS InveStMent ManagerS (Pty) LtD
www.prowessinvestments.com
FaIS reQuIreMentS
Who is your FAIS complaints officer?Enrique Goosen
Please provide the link to the complaints policy on your websiteN/A
OWnerShIP
What is the ownership structure of the company? 100% held by Kelebogile Moloko
Who are the directors of the company?Kelebogile Moloko and Janine De Bryun
Do staff and management have an interest in ownership? Please provide the percentage held by staff and management.100% held by Kelebogile Moloko with plans of establishing an employee share ownership scheme in due course
hIStOry
When was the company established?December 2008
List of mergers that have taken place since being established.None.
B-BBee creDentIaLS
Are you B-BBEE accredited?Yes
What is your B-BBEE statusLevel 3 as an exempt micro enterprise
By whom have you been accredited?Rated by Codex Rating
Date of accreditation14/04/2011
gIPS
Are you GIPS compliant?Not yet
Are you GIPS verified?Not yet
By whom have you been verified?N/A
Date of verificationN/A
Expiry date of verificationN/A
InveStMent ManDateS
What are your total Assets Under Management?R193 Million
Please detail the mandates you currently manage and the size of each of these mandates.3 Mandates. R63 Million, R55 Million, R75 Million
Key InveStMent PerSOnneL
Kelebogile MolokoCIO/CEOBCom(Hons) Portfolio Management and Financial Analysis, Diploma(Advanced Leadership)11 years industry experience3 years with Prowess
107
cOMPany DetaILS
FAISFSPRegistrationnumber:615
SwitchBoard+27 21 670 5100
Faxnumber:+27 21 683 7156
GeneralE-mail:[email protected]
Address:7th Floor, Protea Place, 40 Dreyer Street, Claremont, 7708PO Box 44813, Claremont, 7735
ComplianceOfficerName:Kerry Horseley (Head of Risk and Compliance)[email protected]
BuSIneSS PhILOSOPhy
Our philosophy is based on the belief that market prices are broadly efficient over the long term, but can be very inefficient over shorter periods. Therefore, at any point in time, market prices may not reflect fundamental values, either of individual stocks or of entire markets. Prices do not stay at unrealistic levels indefinitely; sooner or later they reflect fundamental economic factors. This convergence of market prices to reflect fundamental values provides the opportunity for active, long-term investors to earn excess returns.
FaIS reQuIreMentS
Who is your FAIS complaints officer?Kerry Horseley
Please provide the link to the complaints policy on your websitehttp://www.prudential.co.za/?pid=57
OWnerShIP
What is the ownership structure of the company? 75% owned by M&G Investments Limited, 10% owned by staff, and 15% owned by Thesele Group
Who are the directors of the company?Directors: Graham Mason - Chairman, Bernard Fick - Chief Executive Officer, John Kinsley - Managing Director: Prudential Unit Trusts, Winston Africa - Financial Director, Marc Beckenstrater - Chief Investment Officer, Doc Sethole - Director of Institutional Business Development, Thabo Leeuw , Sibusiso Mthembo, David Knee - Head of Fixed Income, Ziyaad Bassadien - Risk and Compliance Manager
PruDentIaL POrtFOLIO ManagerS (SOuth aFrIca) (Pty) LtD
www.prudential.co.za
Thabo Leeuw and Sibusiso Mthembu serve on the Board of Thesele, the BEE shareholder of Prudential SA.
Do staff and management have an interest in ownership? Please provide the percentage held by staff and management.We are in the process of agreeing a new shareholding structure which aims to better align the various ownership interests in our business.A key part of this new arrangement will be the establishment of the Prudential Staff Investment Company (“NewCo”) which will hold shares in Prudential.
All Prudential staff will become shareholders of the Staff Investment Company, via a Staff Trust that will act as nominee and consolidate voting rights. Note that staff will hold restricted shares in the Investment Company, which entitles them to dividends from their shareholding whilst they remain in service. It is intended that shares will be sold / issued to existing / new employees for nominal subscription value, and repurchased for the same value on termination of service.
hIStOry
When was the company established?Prudential Plc was Founded in 1848. The Cape Town Office opened in 1994.
List of mergers that have taken place since being established.None.
B-BBee creDentIaLS
Are you B-BBEE accredited?Yes
What is your B-BBEE statusDTI rating of level 5
By whom have you been accredited?AQRate Verification Services
Date of accreditation15/05/2011
gIPS
Are you GIPS compliant?Yes
Are you GIPS verified?Yes
By whom have you been verified?KMPG
Date of verification31/12/2010
Expiry date of verification 31/12/2011
InveStMent ManDateS
What are your total Assets Under Management?R102.2 Billion as at 31/12/2011.
Please detail the mandates you currently manage and the size of each of these mandates.Specialist Fixed Interest: R26.9 BillionSpecialist Listed Property: R2.3 BillionSpecialist Equities: R31.1 BillionMulti Asset Class: R30.4 BillionSpecialist Tactical Asset Allocation: R8.7 BillionSpecialist International: R2.8 Billion
Key InveStMent PerSOnneL
Marc BeckenstraterChief Investment OfficerBSc(Eng), MBA17 years industry experience12 years with Prudential
Gary QuinnHead of EquitiesBSc(Eng), MBA17 years industry experience12 years with Prudential
David KneeHead of Fixed IncomeBSc(Eco), MSc(Eco), ASIP20 years industry experience14 years with Prudential
Michael MoyleHead of Real ReturnBSc(Eng), MSc, MBA, CFA15 years industry experience5 years with Prudential
108
cOMPany DetaILS
FAISFSPRegistrationnumber:18834
SwitchBoard+27 21 657 3440
Faxnumber:+27 21 674 1085
GeneralE-mail:[email protected]
Address:7th Floor, Claremont Central, 8 Vineyard Road, Claremont, Cape Town, 7700P O Box 45040, Claremont, Cape Town, 7735
ComplianceOfficerName:Guy Simpson+27 21 657 3441
BuSIneSS PhILOSOPhy
Our investment philosophy explains what we aim to do for our clients. We aim to buy cheap assets that are of good quality.Importantly, we distinguish between price and value. •Valueiswhatwecalculateanassettobeworth.•Priceiswhatthemarketispreparedtopayforit.Sometimes they are the same, often they are not. When price is substantially below value, we get interested. When a low price is associated with a good quality asset, we are even more interested. By quality we mean the ability of a company to withstand competitive pressures; as well as its ability to increase its intrinsic value over time.These attributes of a good investment - quality and cheapness - help us reduce the chances of our clients suffering a permanent loss of capital. A cheap asset has a large margin of safety to cater for our analysis being wrong, and a good quality business can grow its way out of trouble over time. We devote a significant amount of our research and debate to understanding the business models of the companies we invest in. We believe in investing in quality companies for long periods of time if we can accumulate them at a good price. We will typically sell as companies approach their fair value. Our overall approach results in low turnover because we are not trying to achieve short-term out-performance. As a result of our equity-centric and bottom-up approach, we set maximum weights for individual equities in our portfolios based on our assessment of long-term fair value, the stage in the cycle and the popularity of each stock. We have a matrix on which we base the range of weights equity can have in the portfolio.Particularly for balanced portfolios, if we cannot fill our full equity allocation in the portfolio, we populate the balance of the portfolio with fixed income investments or property.In this case our base line is the risk-free money market rate. If we think other fixed income investments offer better long-term return prospects than cash we include them in the portfolio. This whole process means that we do not asset allocate, as such. Our asset weightings derive from our bottom-up assessment of value, starting with equities and then relative to cash, on a long-term basis.
regarDIng caPItaL ManageMent (Pty) LtD
www.recm.co.za
FaIS reQuIreMentS
Who is your FAIS complaints officer?Tim House
Please provide the link to the complaints policy on your websiteN/A
OWnerShIP
What is the ownership structure of the company? Staff 44%, External Shareholders 56% of RE:CM Holdings (Pty) which owns 100% of Regarding Capital Management (Pty) Ltd and RE:CM Collective Investments (Pty) Ltd
Who are the directors of the company?Piet Viljoen (Chairman), Lonn Potgieter,Daniel Malan, Theunis de Bruyn(non executive),Werner Stals (non executive)
Do staff and management have an interest in ownership? Please provide the percentage held by staff and management.Staff 44%, External Shareholders 56% of RE:CM Holdings (Pty) which owns 100% of Regarding Capital Management (Pty) Ltd and RE:CM Collective Investments (Pty) Ltd
hIStOry
When was the company established?April 2003
List of mergers that have taken place since being established.None.
B-BBee creDentIaLS
Are you B-BBEE accredited?No
What is your B-BBEE statusN/A
By whom have you been accredited?N/A
Date of accreditationN/A
gIPS
Are you GIPS compliant?Yes
Are you GIPS verified?Yes
By whom have you been verified?e-Comply
Date of verification01/05/2010
Expiry date of verification31/12/2010
InveStMent ManDateS
What are your total Assets Under Management?R17.975 Billion (as at 30/11/2011)
Please detail the mandates you currently manage and the size of each of these mandates.Institutional R12.812 Billion (Balanced: R8.183 Billion; Equity:R4.628 Billion) Retail: R5.163 Billion (As at 30/11/2011)
Key InveStMent PerSOnneL
Piet ViljoenPortfolio ManagerBCom(Hons), CFA26 years industry experience8 years with RECM
Danie MalanPortfolio ManagerBCom(Mathematics), CFA15 industry experience8 years with RECM
Wilhelm HertzogPortfolio ManagerBCom(Law), BAcc(Hons), CA(SA), CFA6 years industry experience4 years with RECM
Thompson GanyekaPortfolio ManagerBCom(Accounting)8 years industry experience1 year with RECM
109
cOMPany DetaILS
FAISFSPRegistrationnumber:579
SwitchBoard+27 21 950 2500
Faxnumber:+27 21 950 2916
GeneralE-mail:[email protected]
Address:55 Willie van Schoor Avenue, Bellville, 7530Private Bag X8, Tyger Valley, 7536
ComplianceOfficerName:Nelize Jacobs+27 21 9502690
BuSIneSS PhILOSOPhy
Our shared business philosophy has its roots in an entrepreneurial culture with its essence captured in traditional values of honesty, diligence, superior ethical behaviour, innovation, stakeholder values and strong ties with business partners. Our business model is focused on client-centricity and on being solution orientated, SIM is a developer of solutions rather than a supplier of “off the shelf products”. As such it has a dedicated Product Development Team which develops customised solutions for prospective clients.In addition, they also scan the market place for opportunities to develop new and innovative solutions for a particular market segment.
FaIS reQuIreMentS
Who is your FAIS complaints officer?Nelize Jacobs
Please provide the link to the complaints policy on your websiteWe do not have a complaints policy on our website.
OWnerShIP
What is the ownership structure of the company? We are a wholly owned subsidiary of Sanlam Limited
Who are the directors of the company?Temba Mvusi, Mbusowemvelo Mtshali, Yvonne Muthien, Bhekithemba Gamedze, Cora Fernandez, Johannes van der Merwe
Do staff and management have an interest in ownership? Please provide the percentage held by staff and management.Staff and management have no ownership interest in SIM. However, SIM Unconstrained Capital Partners, a division within SIM, was set up in April 2011 in order to allow
SanLaM InveStMent ManageMent (Pty) LtD
www.sim.sanlam.com
Claude van Cuyck and Ricco Friedrich to give their undivided attention to managing the Unconstrained Equity assets. Remuneration is now more aligned to the long term objectives of the clients as the portfolio managers have equity stakes in the business.
The remuneration structure for Claude and Ricco changed effective 01/04/2011 where both have become shareholders of SIM Unconstrained Capital Partners. The newly formed company pays them a basic salary whilst quarterly dividend distributions are made to all shareholders based on their respective shareholding. Claude and Ricco have a 35% equity stake in the business, while Sanlam is the majority shareholder with the remaining 65% equity.
hIStOry
When was the company established?01/01/1997
List of mergers that have taken place since being established.None
B-BBee creDentIaLS
Are you B-BBEE accredited?Yes
What is your B-BBEE statusLevel 4 Contributor
By whom have you been accredited?AQ Rate Verification Services
Date of accreditation15/12/2011 gIPS
Are you GIPS compliant?Yes
Are you GIPS verified?Yes
By whom have you been verified?PWC
Date of verification11/05/2011
Expiry date of verificationVerification for the period 01/01/2010 to 31/12/2010. Verification for 2011 year will be undertaken soon
InveStMent ManDateS
What are your total Assets Under Management?R332.398 Billion at 30/05/2011
Please detail the mandates you currently manage and the size of each of these mandates.N/A
Key InveStMent PerSOnneL
André RouxHead: SIM NamibiaBCom(Hons) Economics22 years industry experience13 years with SIM
Erik KnoetzeHead of ImplementationBCom(Economics), BCom(Hons), MCom(Economics)26 years industry experience26 years with SIM
Frederick WhiteHead of ResearchBEng, MEng, MBA, CFA21 years industry experience9 years with SIM
Gerhard CruywagenCIO: Portfolio ManagerCFA, BSc(Pure & Applied Maths), DPhil(Mathematics), BSc (Hons) Applied Mathematics16 years industry experience3 years with SIM
Haydn FrankeissHead of Asset Liability SolutionsCA(SA), BCom, BAccountancy18 years industry experience12 years with SIM
Helena ConradieHead of SIM.SmartcoreMSc(Applied Mathematics), CFA, BSc(Hons)16 years industry experience11 years with SIM
Johan KurtzHead: Gen-XBCom(Hons) Investment Management, BCom(Economics & Bus Economics)18 years industry experience 4 years with AIM
Patrice RassouHead: Equities/ Portfolio ManagerBSc(Econ), MSc, ACA, MBA14 years industry experience5 years with SIM
Philip LiebenbergHead: Absolute ReturnMEng, PhD(Eng), CFA10 years industry experience5 years with SIM
Roy ChapmanHead: Equity ResearchBSc(Engineering), MBA16 years industry experience6 years with SIM
110
cOMPany DetaILS
FAISFSPRegistrationnumber:845
SwitchBoard+27 21 950 2600
Faxnumber:+27 21 950 2126
GeneralE-mail:[email protected]
Address:1st Floor, Tygerpark V, Willie van Schoor Avenue, 7530Private Bag X 8, Tygervalley, 7536
ComplianceOfficerName:Noleen [email protected]+27 21 950 2563
BuSIneSS PhILOSOPhy
SMMI’s investment philosophy is based on the belief that if you pick a team of thought leaders to select the finest managers, combine them in ways that optimise their talents, and adopt an active approach to risk management and asset allocation, then significant alpha generation will follow.
SanLaM MuLtI Manager InternatIOnaL (Pty) LtD
www.smmi.com
FaIS reQuIreMentS
Who is your FAIS complaints officer?Carla Fouche
Please provide the link to the complaints policy on your websitehttp://www.sanlam.co.za/wps/wcm/connect/Sanlam_EN/sanlam/contact+us/compliments+and+complaints
OWnerShIP
What is the ownership structure of the company? SMMI is a 100% owned subsidiary of Sanlam and forms part of the Sanlam Investment Cluster
Who are the directors of the company?J.H.P van der Merwe and N. Naidoo
Do staff and management have an interest in ownership? Please provide the percentage held by staff and management.Staff and Management do not have an interest in ownership. The company is 100% owned by outside shareholders
hIStOry
When was the company established?Sanlam Multi Manager International was established in 2002
List of mergers that have taken place since being established.There has been no mergers, only the acquisition of Coris Capital Multi-managers in 2006.
B-BBee creDentIaLS
Are you B-BBEE accredited?Yes, we fall under Sanlam’s BEE Credentials
What is your B-BBEE status
N/A
By whom have you been accredited?AQRate
Date of accreditation14/06/2011
gIPS
Are you GIPS compliant?No
Are you GIPS verified?No
By whom have you been verified?N/A
Date of verificationN/A
Expiry date of verificationN/A
InveStMent ManDateS
What are your total Assets Under Management?R73 Billion
Please detail the mandates you currently manage and the size of each of these mandates.N/A; multi-managed portfolios.
Key InveStMent PerSOnneL
Andrew RumbelowChief Investment OfficerBCom, PGDAC, CA(SA), CFA 17 years industry experience4 years with SMMI
111
cOMPany DetaILS
FAISFSPRegistrationnumber:26/10/719
SwitchBoard+27 11 448 6000
Faxnumber:+27 11 448 5555
GeneralE-mail:[email protected]
Address:17 Melrose Blvd, Melrose Arch, Johannesburg, 2196PO Box 202, Melrose Arch, 2076
ComplianceOfficerName:Bernard Pieterse+27 11 448 6399
BuSIneSS PhILOSOPhy
STANLIB provides multiple capabilities to meet the diverse and exacting needs of our clients through different market cycles. Each franchise is focused only on its area of expertise and the franchise business model helps ensure that there is alignment between the interests of clients and their managers.
StanLIB aSSet ManageMent
www.stanlib.com
FaIS reQuIreMentS
Who is your FAIS complaints officer?Barbara Egan
Please provide the link to the complaints policy on your websitewww.stanlib.com/Contactus/Pages/RateSTANLIB.aspx
OWnerShIP
What is the ownership structure of the company? STANLIB is 100% owned by Liberty
Who are the directors of the company?Thabo Dloti, Iain Bennie, Patrick Mamathuba, Martin Rabe, Stewart Rider, Charlotte Mbewu-Sanqela
Do staff and management have an interest in ownership? Please provide the percentage held by staff and management.No they do not - they do, however, have their own money invested in units of the funds that they manage
hIStOry
When was the company established?STANLIB was established in May 2002 with the merger of SCMB Asset Management and Liberty Asset Management
List of mergers that have taken place since being established.None
B-BBee creDentIaLS
Are you B-BBEE accredited?Yes
What is your B-BBEE statusAs a subsidiary of Liberty we are rated a Level 2 Contributor
By whom have you been accredited?Empowerdex
Date of accreditation30/05/2011
gIPS
Are you GIPS compliant?Yes
Are you GIPS verified?Yes
By whom have you been verified?PricewaterhouseCoopers
Date of verification08/10/2010
Expiry date of verificationVerification currently being finalised
InveStMent ManDateS
What are your total Assets Under Management?June 2011 - R338 Billion
Please detail the mandates you currently manage and the size of each of these mandates.Balanced: R13.3 Billion Absolute Return: R9.1 Billion Equities (Value, Growth Core, Life): R61 Billion, Fixed Interest: R46.5 Billion Money Market: R66.5 Billion Property: R33.1 Billion International: R14.1 Billion and Other: R6.6 Billion
Key InveStMent PerSOnneL
Thabo DlotiCEOBBusSc(Actuarial Science)21 years industry experience2 years with Stanlib
Stewart RiderCIOCA(SA)15 years industry experience2 years with Stanlib
Henk ViljoenHead of Fixed InterestMCom(Econ) Cum Laude27 years indsutry experience21 years with Stablib
Patrick MamathubaHead of AlternativesBCom(Hons), CFA20 years industry experience13 years with Stanlib
Andrew VintcentHead of ResearchBBusSc, CA(SA), CFA12 years industry experience2 years with Stanlib
Herman van VelzeHead of Balanced and Core EquityBEng, MBL19 years industry experience17 years with Stanlib
Keillen NdlovuHead of PropertyBCom(Hons), CAIB(SA) Treasury & Intl Banking7 years indsutry experience7 years with Stanlib
112
cOMPany DetaILS
FAISFSPRegistrationnumber:873
SwitchBoard+27 21 446 4940
Faxnumber:+27 21 446 4950
GeneralE-mail:[email protected]
Address:7th Floor, The Foundry, Cardiff Street, Green Point, 8001PO Box 51591, Waterfront, 8002
ComplianceOfficerName:Ferdi Schenck+27 21 446 4954
BuSIneSS PhILOSOPhy
Providing customised multi-manager investment solutions to the institutional investment market, backed by leading edge technology solutions allowing unprecedented levels of investor oversight, reporting and risk management.
SygnIa aSSet ManageMent (Pty) LtD
www.sygnia.co.za
FaIS reQuIreMentS
Who is your FAIS complaints officer?Ferdi Schenck
Please provide the link to the complaints policy on your websitewww.sygnia.co.za
OWnerShIP
What is the ownership structure of the company? The company is wholly owned by its management and staff.
Who are the directors of the company?MF Wierzycka, SJB Peile, WS van der Merwe, SJ Mhkwanazi
Do staff and management have an interest in ownership? Please provide the percentage held by staff and management.100%
hIStOry
When was the company established?2006
List of mergers that have taken place since being established.None
B-BBee creDentIaLS
Are you B-BBEE accredited?BEE audit in progress
What is your B-BBEE statusN/A
By whom have you been accredited?N/A
Date of accreditationN/A
gIPS
Are you GIPS compliant?Yes
Are you GIPS verified?No
By whom have you been verified?N/A
Date of verificationN/A
Expiry date of verificationN/A
InveStMent ManDateS
What are your total Assets Under Management?R74 Billion
Please detail the mandates you currently manage and the size of each of these mandates.Wide range of customised multi-manager portfolios.
Key InveStMent PerSOnneL
Magda WierzyckaCEOBBusSc(Actuarial), PhDip(Actuarial), FFA, FASSA, CFP FIFM18 years industry experience
Niki GilesCOOBBusSc(Finance), CA(SA), CFA14 years industry experience
Simon PeileJoint Head:InvestmentsBBusSc(Actuarial), FFA, FASSA, CFP23 years industry experience
Willem van der MerweJoint Head:InvestmentsBSc(Actuarial), BCom(Honours in Financial Analysis), CFA14 years industry experience
Trevor AbromowitzHead: Institutional BusinessBSc(Actuarial), FIA, FASSA8 years industry experience
113
cOMPany DetaILS
FAISFSPRegistrationnumber:703
SwitchBoard+27 21 509 6566
Faxnumber:+27 21 503 4079
GeneralE-mail:[email protected]
Address:WestEnd Mall, 2nd Floor, Mutual Park, Jan Smuts Drive, Pinelands, 7405PO Box 1014, Cape Town, 8000
ComplianceOfficerName:Zulfa Abdurahman [email protected]
BuSIneSS PhILOSOPhy
Our philosophy is built on four key pillars:
•Thoroughmanagerresearchthatstartsbyasking the right questions.
•Portfolioconstructionthatoptimizesthereturn for a given level of risk.
•Riskmanagementthatfocusesonavoidingunintended risk concentration.
•Apatientapproachwithalongtermfocus.
Sym|metry MuLtI-Manager
www.symmetry.co.za
FaIS reQuIreMentS
Who is your FAIS complaints officer?Zulfa Abdurahman
Please provide the link to the complaints policy on your [email protected]
OWnerShIP
What is the ownership structure of the company? SYm|mETRY Multi-Manager is a division of Old Mutual Life Assurance Company of South Africa Limited (OMLACSA), part of the Old Mutual plc Group.
Who are the directors of the company?Prof AH van Wyk (Chairman), PB Hanratty (Managing Director) (Irish), AS Birrell, T Dloti, Prof GJ Gerwel, Dr IA Goldin, Dr D Konar, Ms AA Maule, J Naidoo, Ms DC Radley, JVF Roberts (British), Mrs GT Serobe, IB Skosana, PGM Truyens (Dutch) and GS van Niekerk. Company Secretary: RF Foster
Do staff and management have an interest in ownership? Please provide the percentage held by staff and management.Current ownership, based on the Broad-Based BEE Codes of Good Practice, is as follows:10.1% to Management and Staff5.0% to Intermediaries and Customers5.0% to Black Business Partners20.1% of OMSA Group’s South African business
hIStOry
When was the company established?2000
List of mergers that have taken place since being established.None
B-BBee creDentIaLS
Are you B-BBEE accredited?Yes
What is your B-BBEE statusLevel 2 Contributor
By whom have you been accredited?AQRate
Date of accreditation18 October 2011 (valid until 17 October 2012)
gIPS
Are you GIPS compliant?Not applicable as SYm|mETRY is a Multi-Manager and this would apply to underlying managers.
Are you GIPS verified?N/A
By whom have you been verified?N/A
Date of verificationN/A
Expiry date of verificationN/A
InveStMent ManDateS
What are your total Assets Under Management?Approximately R40 billion
Please detail the mandates you currently manage and the size of each of these mandates.Not Available
Key InveStMent PerSOnneL
Trevor PascoeCEOBSc(Hons), FASSA, FIA23 years industry experience2 years with Symmetry
Monene WatsonHead: Equity Manager ResearchBCom(Hons), CFA18 years industry experience9 years with Symmetry
Roland GräbeCIOCFA13 years industry experience1 year with Symmetry
Fred LiebenbergHead: Absolute Investments & Fixed InterestBCom(Actuarial), CFA11 years industry experience10 years with Symmetry
Meyer CoetzeeHead: Product Development & Portfolio ManagementBCom(Actuarial), CFA, FIA20 years industry experience8 years with Symmetry
Stephen BrierleyHead: Fund of Hedge FundsBCom(Economics)12 years industry experience3 years with Symmetry
Andreea BuneaHead: Global InvestmentsBCom(Honours), CFA9 years industry experience4 years with Symmetry
114
cOMPany DetaILS
FAISFSPRegistrationnumber:618
SwitchBoard+27 21 681 5100
Faxnumber:+27 21 681 5199
GeneralE-mail:[email protected]
Address:7th Floor, Newlands Terraces, Boundary Road, Newlands, Cape Town, South Africa, 7700PO Box 23540, Claremont, South Africa, 7735
ComplianceOfficerName:Tim Howse+27 21 671 8162
BuSIneSS PhILOSOPhy
We are a specialised institutional asset manager building on our core competencies in cash and quantitative management and seeking to be recognised for our ethical dealing with clients and value adding investment strategies.
taQuanta aSSet ManagerS
www.taquanta.co.za
FaIS reQuIreMentS
Who is your FAIS complaints officer?Tim Howse
Please provide the link to the complaints policy on your [email protected]
OWnerShIP
What is the ownership structure of the company? 100% owned by Taquanta Investment Holdings (Pty) Ltd
Who are the directors of the company?Dr. Vincent Maphai, Sandile Zungu, William Rowland, Justin Kretzschmar
Do staff and management have an interest in ownership? Please provide the percentage held by staff and management.Yes - 40%
hIStOry
When was the company established?9/29/1999
List of mergers that have taken place since being established.In 2002 merged with Nedbank Cash Management Business. In July 2007 Taquanta Investment Holdings, a new black-owned entity whose shareholders include several members of the original Taquanta consortium, acquired Nedbank’s shareholding in Taquanta Asset Managers, Taquanta Securities and Taquanta Treasury Solutions.
B-BBee creDentIaLS
Are you B-BBEE accredited?Yes
What is your B-BBEE statusLevel 3 Contributor
By whom have you been accredited?AQRate
Date of accreditation29/09/2011
gIPS
Are you GIPS compliant?Yes
Are you GIPS verified?Yes
By whom have you been verified?eComply Consultants (Pty) Ltd
Date of verificationDecember 2011
Expiry date of verificationN/A
InveStMent ManDateS
What are your total Assets Under Management?R61 Billion
Please detail the mandates you currently manage and the size of each of these mandates.Cash: R43.2 BillionEquity: R12.7 BillionMulti-Strategy: R5.1 Billion
Key InveStMent PerSOnneL
Stephen RobertsJoint Managing DirectorBA(Hons)27 years industry experience26 years with Taquanta and its predecessors
Steve RogersJoint Managing DirectorFCIS28 years industry experience26 years with Taquanta and its predecessors
Richard GosnellCIO: QuantsMSc(Eng), CFA15 years industry experience15 years with Taquanta and its predecessors
Saleem GamzaHead: Cash ManagementInvestment Management Certificate (UNISA)26 years industry experience24 years with Taquanta and its predecessors
Ray WallaceHead: Asset SeekingBcompt(Hons), CFA17 years industry experience16 years with Taquanta and its predecessors
115
cOMPany DetaILS
FAISFSPRegistrationnumber:608
SwitchBoard+27 21 670 4900
Faxnumber:+27 21 683 5788
GeneralE-mail:[email protected]
Address: 6th Floor, Letterstedt House, Newlands on Main, Newlands, 7700P O Box 44586, Claremont, 7735
ComplianceOfficerName:Kirsten Elvin-Jensen+27 21 670 [email protected]
BuSIneSS PhILOSOPhy
With an average of over 19 years experience in asset management, Vunani Fund Managers is committed to building a leading, truly black-owned fund management business. We focus on investment performance and client service in Multi-Asset, Specialist Bonds, Specialist Equity and Specialist Property.
vunanI FunD ManagerS (Pty) LtD
www.vunanifm.co.za
FaIS reQuIreMentS
Who is your FAIS complaints officer?Kirsten Elvin-Jensen
Please provide the link to the complaints policy on your websitehttp://www.vunanifm.co.za/about/downloads/Vunani_FAIS_Disclosure_statement.pdf
OWnerShIP
What is the ownership structure of the company? Vunani Fund Managers is 100% owned by Vunani Capital
Who are the directors of the company?Executive Directors: Romeo Makhubela, Guy Fletcher, Azola Zuma Non-Executive Directors: Butana Khoza, Nathi Chonco
Do staff and management have an interest in ownership? Please provide the percentage held by staff and management.Not currently, but discussions are taking place to allocate 30% of equity to key staff.
hIStOry
When was the company established?July 1999
List of mergers that have taken place since being established.None. In June 2010 long-term empowerment partner, the Vunani Group, increased its stake from 11% to a majority 51% shareholding, whilst the controlling company at the time, Peregrine Holdings, retained a meaningful 49% interest. On 15/08/2011 Vunani Fund Managers became 100% owned by Vunani Capital.
B-BBee creDentIaLS
Are you B-BBEE accredited?Yes
What is your B-BBEE statusVunani Fund Managers has been BEE verified as a Level 1 Contributor by EmpowerLogic for 2012 at the 169% level.
By whom have you been accredited?EmpowerLogic
Date of accreditation25/01/2012
gIPS
Are you GIPS compliant?Yes
Are you GIPS verified?Yes
By whom have you been verified?Deloitte & Touche
Date of verificationVerified to December 2010 in February 2011
Expiry date of verificationDecember 2010
InveStMent ManDateS
What are your total Assets Under Management?R8.781 Billion
Please detail the mandates you currently manage and the size of each of these mandates.Equity: R4.195 BillionBonds: R879.24 MillionTarget Return: R2.434 BillionAbsolute Return: R171.87 MillionProperty: 41.08 MillionInternational: R106.20 MillionStructured Products: R953.01 Million
Key InveStMent PerSOnneL
Romeo MakhubelaCEOBCom, PDG Business Administration23 years industry experience4 months with Vunani Fund Managers
Guy FletcherCIOBSc(Hons), CFA23 years industry experience10 years with Vunani Fund Managers
Azola ZumaDirector / Business DevelopmentBBusSc, MBA, MA (Int. Business)7 years industry experience1.5 years with Vunani Fund Managers
Tony BellPortfolio Manager: Multi-AssetBCom(Hons), MBA24 years industry experience10 years with Vunani Fund Managers
Rowan WilliamsShort Portfolio Manager: Interest BearingMSc, FIFM, CFA24 years industry experience4 months with Vunani Fund Managers
aBSa aSSet ManageMent
Snowy Musundwa
Tel: +27 11 480 5006Fax: +27 86 682 0078Email: [email protected]
aFena caPItaL
tebogo naledi
Tel: +27 21 657 6250Fax: +27 86 687 6890Email: [email protected]
aLLan gray PrOPrIetary LIMIteD
Mahesh cooper
Tel: +27 21 415 2300 Email: [email protected] www.allangray.co.za
argOn aSSet ManageMent (Pty) LtD
Luyanda Joxo
Tel: +27 21 670 6576Fax: +27 86 674 1100Email: [email protected]
Beyond the becnhmark
atLantIc aSSet ManageMent (Pty) LtD
Murray anderson
Tel: +27 21 913 8941Email: [email protected]
caDIZ aSSet ManageMent (Pty) LtD
gerald Mafunda
Email: [email protected]
caveO FunD SOLutIOnS (Pty) LtD
Byron green
Tel: +27 11 505 6308Email: [email protected]
DIBanISa FunD ManagerS
Zack Bezuidenhoudt
Tel: +27 11 217 1147Email: zbezuidenhoudt@dibanisafundmanagers.co.zawww.dibanisafundmanagers.co.za
eLeMent InveStMent ManagerS
Ian Jones
Tel: +27 21 426 1313Email: [email protected]
Independent Active Investors
eLectuS
russell Bodill
Tel: +27 21 504 7296Email: [email protected]
FuturegrOWth aSSet ManageMent (Pty) LtD
glynnis Jeffries
Tel: +27 21 659 5475Fax: +27 21 659 5333Email: [email protected]
Returns that matter
InveStec aSSet ManageMent (Pty) LtD
thabo Khojane
Tel: +27 21 416 2000Fax: +27 21 416 2001Email: iam.institutitional@investecmail.comwww.investecassetmanagement.com
JM BuSha InveStMent grOuP (Pty) LtD
Joseph Makamba Busha
Tel: +27 11 325 2027Fax: +27 11 325 2047Email: [email protected]
Absolutely Positive Performance
Mergence InveStMent ManagerS (Pty) LtD
ronel Bantjes
Tel: +27 21 433 2960Email: [email protected]
Pragmatic investing
neDgrOuP InveStMentS
Matthew de Wet
Tel: +27 21 416 6085Fax: +27 21 416 8085Email: [email protected]
OLD MutuaL InveStMent grOuP (SOuth aFrIca) (Pty) LtD
Mike van heerden
Tel: +27 21 509-5082Email: [email protected]
OaSIS aSSet ManageMent LIMIteD
adam ebrahim
Tel: +27 21 413 7860Fax: +27 21 413 7900Email: [email protected]
Superior returns at lower than market risk
Pan-aFrIcan aSSet ManageMent (Pty) LtD
Miranda Scheepers
Tel: +27 11 463 0300Email: [email protected]
Real in Africa- Real in Returns
PreScIent InveStMent ManageMent (Pty) LtD
Sharon Bailey
Tel: +27 21 700 3670Fax: +27 21 700 3700Email: [email protected]
PruDentIaL POrtFOLIO ManagerS (SOuth aFrIca) (Pty) LtD
valdon theron
Tel: +27 21 670 5069Email: [email protected]
ALL THINGS CONSIDERED
SanLaM InveStMent ManageMent (Pty) LtD
Phillip Mjoli
Tel: +27 21 950 2567Fax: +27 21 950 2226Email: [email protected]
Rational thinking. Smarter investing.
SanLaM MuLtI Manager InternatIOnaL (Pty) LtD
corita van Wyk
Tel: +27 21 950 2600Fax: +27 21 950 2126Switchboard: +27 21 950 2600Email: [email protected]
Sym|metry MuLtI-Manager
trevor Pascoe
Tel: +27 21 509 0605Email: [email protected]
taQuanta
Stephen roberts
Tel: +27 21 681 5101Fax: +27 21 681 5199Email: [email protected]
For Certainty
truFFLe aSSet ManageMent
SJ Du Preez
Tel: +27 11 325 0030Email: [email protected]
Asset Management and Customised Solutions

122
nOteS

tbsp
/// beyo
nd th
e line 3
3740
An Authorised Financial Services Provider FAIS Licence no. 30414
Call 0860 111 234 or visit www.alexanderforbes.co.za
MOTOR & HOUSEHOLD INSURANCE
Getting the best insurance should be as easy as a phone call. So we’ve made it our mission to be the best provider of sound insurance advice and tailor-made policies in the country. After all, what’s the use of insurance cover that’s only good some of the time?
Be one of the first 50 callers and get the same incredible advice as our next 50 callers.
aLexanDer FOrBeS aSSet cOnSuLtIng
Alexander Forbes Place, 61 Katherine Street, Sandown, Sandton
PO Box 786055, Sandton, 2146
Tel:+27 (0) 11 269 2030
Fax: +27 (0) 11 263 2435
e-mail: [email protected] or [email protected]
www.alexanderforbes.co.za or www.afac.co.za
Designed by Alexander Forbes Financial Services Communications 5520