alamos corp presentation nov 3 2017 final (1)
TRANSCRIPT
November 2017 Corporate Presentation
2
Cautionary Notes
This presentation, the information contained herein, any other materials provided in connection with this presentation and any oral remarks accompanying this presentation (collectively, this “Presentation”) has been prepared by Alamos Gold Inc. (“Alamos”) solely for information purposes concerning a potential transaction (a “Potential Transaction”) involving Alamos and Richmont Mines Inc. (“Richmont”). No Stock exchange, securities commission or other regulatory authority has approved or disapproved of the information contained herein. This presentation does not constitute an offering of securities and the information contained herein is subject to the information contained in the Company’s continuous disclosure documents at www.sedar.com.
Cautionary NotesCertain statements in this presentation are “forward-looking statements”, including within the meaning of applicable laws. All statements other than statements of historical fact included in this presentation, including, without limitation, statements regarding the timing and closing of the Proposed Transaction, statements regarding synergies resulting from the Proposed Transaction, statements regarding the effect of the Proposed Transaction on Alamos’ net asset value, operating cash flow, free cash flow, forecast gold production, reserves, resources, gold grades, recoveries, waste-to-ore ratios, total cash cost, all-in sustaining costs, debt levels and future plans and objectives of Alamos are forward-looking statements based on forecasts of future operational or financial results, estimates of amounts not yet determinable and assumptions of management that involve various risks and uncertainties. Any statements that express or involve discussions with respect to predictions, expectations, beliefs, plans, projections, objectives, assumptions or future events or performance (often, but not always, using words or phrases such as “expects” or “does not expect”, “is expected”, “anticipates” or “does not anticipate”, “plans”, “estimates” or “intends”, or stating that certain actions, events or results “may”, “could”, “would”, “might”, or “will” be taken, occur or be achieved) are not statements of historical fact and may be “forward-looking statements.” Alamos cautions that forward-looking information involves known and unknown risks, uncertainties and other factors that may cause Alamos’ actual results, performance or achievements to be materially different from those expressed or implied by such information, including, but not limited to, that the Proposed Transaction is completed on terms and timeframe contemplated; failure to obtain shareholder approval of Alamos or Richmont; failure to obtain the necessary regulatory and other approvals; conditions to the Proposed Transaction may not be satisfied; anticipated synergies and other benefits of the Proposed Transaction may not be realized; gold and silver price volatility; fluctuations in foreign exchange rates and interest rates; the impact of any hedging activities; discrepancies between actual and estimated production, between actual and estimated reserves and resources or between actual and estimated metallurgical recoveries; costs of production; capital expenditure requirements; the costs and timing of construction and development of new deposits; and the success of exploration and permitting activities. In addition, the factors described or referred to in the section entitled “Risk Factors” in Alamos’ Annual Information Form for the year ended December 31, 2016, which is available on the SEDAR website at www.sedar.com, should be reviewed in conjunction with the information found in thispresentation. Although Alamos has attempted to identify important factors that could cause actual results, performance or achievements to differ materially from those contained in forward-looking information, there can be other factors that cause results,performance or achievements not to be as anticipated, estimated or intended. There can be no assurance that such information will prove to be accurate or that management’s expectations or estimates of future developments, circumstances or results will materialize. Accordingly, readers should not place undue reliance on forward-looking information.
Market data and other statistical information used throughout this Presentation are based on internal company research, independent industry publications, government publications, reports by market research firms or their published independent sources. Industry publications, governmental publications, market research surveys and forecasts generally state that the information contained therein has been obtained from sources believed to be reliable. Although Alamos believes such information is accurate and reliable, it has not independently verified any of the data from third party sources cited or used for our management’s industry estimates, nor has Alamos ascertained the underlying economic assumptions relied upon therein. While Alamos believes internal company estimates are reliable, such estimates have not been verified by any independent sources, and Alamos makes no representations as to the accuracy of such estimates.
Note to U.S. InvestorsAlamos prepares its disclosure in accordance with the requirements of securities laws in effect in Canada, which differ from the requirements of U.S. securities laws. Terms relating to mineral resources in this presentation are defined in accordance with National Instrument 43 101 Standards of Disclosure for Mineral Projects under the guidelines set out in the Canadian Institute of Mining, Metallurgy, and Petroleum Standards on Mineral Resources and Mineral Reserves. The Unites States Securities and Exchange Commission (the “SEC”) permits mining companies, in their filings with the SEC, to disclose only those mineral deposits that a company can economically and legally extract or produce. Alamos may use certain terms, such as “measured mineral resources”, “indicated mineral resources”, “inferred mineral resources” and “probable mineral reserves” that the SEC does not recognize (these terms may be used in this presentation and are included in the public filings of Alamos, which have been filed with the SEC and the securities commissions or similar authorities in Canada).
Cautionary non-GAAP Measures and Additional GAAP Measures
Note that for purposes of this section, GAAP refers to IFRS. The Company believes that investors use certain non-GAAP and additional GAAP measures as indicators to assess gold mining companies. They are intended to provide additional
information and should not be considered in isolation or as a substitute for measures of performance prepared with GAAP.
“Cash flow from operating activities before changes in non-cash working capital” is a non-GAAP performance measure that could provide an indication of the Company’s ability to generate cash flows from operations, and is calculated by adding
back the change in non-cash working capital to “Cash provided by (used in) operating activities” as presented on the Company’s consolidated statements of cash flows. “Free cash flow” is a non-GAAP performance measure that is calculated as
cash flows from operations net of cash flows invested in mineral property, plant and equipment and exploration and evaluation assets as presented on the Company’s consolidated statements of cash flows and that would provide an indication of
the Company’s ability to generate cash flows from its mineral projects. “Mine site free cash flow” is a non-GAAP measure which includes cash flow from operating activities at, less capital expenditures at each mine site. Return on Equity is
defined as Earnings from Continuing Operations divided by the average Total Equity for the current and previous year. “Mining cost per tonne of ore” and “Cost per tonne of ore” are non-GAAP performance measures that could provide an
indication of the mining and processing efficiency and effectiveness of the mine. These measures are calculated by dividing the relevant mining and processing costs and total costs by the tonnes of ore processed in the period. “Cost per tonne
of ore” is usually affected by operating efficiencies and waste-to-ore ratios in the period. “Total cash costs per ounce”, “all-in sustaining costs per ounce”, and “mine-site all-in sustaining costs” as used in this analysis are non-GAAP terms
typically used by gold mining companies to assess the level of gross margin available to the Company by subtracting these costs from the unit price realized during the period. These non-GAAP terms are also used to assess the ability of a
mining company to generate cash flow from operations. There may be some variation in the method of computation of these metrics as determined by the Company compared with other mining companies. In this context, “total cash costs”
reflects mining and processing costs allocated from in-process and dore inventory associated and associated royalties with ounces of gold sold in the period. Total cash costs per ounce are exclusive of exploration costs. “All-in sustaining costs
per ounce” include total cash costs, exploration, corporate and administrative, share based compensation and sustaining capital costs. “Mine-site all-in sustaining costs” include total cash costs, exploration, and sustaining capital costs for the
mine-site, but exclude an allocation of corporate and administrative and share based compensation.
Additional GAAP measures that are presented on the face of the Company’s consolidated statements of comprehensive income and are not meant to be a substitute for other subtotals or totals presented in accordance with IFRS, but rather
should be evaluated in conjunction with such IFRS measures. This includes “Earnings from operations”, which is intended to provide an indication of the Company’s operating performance, and represents the amount of earnings before net
finance income/expense, foreign exchange gain/loss, other income/loss, and income tax expense. Non-GAAP and additional GAAP measures do not have a standardized meaning prescribed under IFRS and therefore may not be comparable to
similar measures presented by other companies. A reconciliation of historical non-GAAP and additional GAAP measures are available at www.alamosgold.com.
Technical Information
Chris Bostwick, FAusIMM, Alamos Gold’s Vice President, Technical Services, has reviewed and approved the scientific and technical information contained in this presentation. Chris Bostwick is a Qualified Person within the meaning of Canadian Securities Administrator’s National Instrument 43-101 (“NI 43-101”). The Qualified Persons for the National Instrument 43-101 compliant mineral reserve and resource estimates are detailed in the tables in the appendix of this presentation.
All figures in US$ unless otherwise indicated.
3
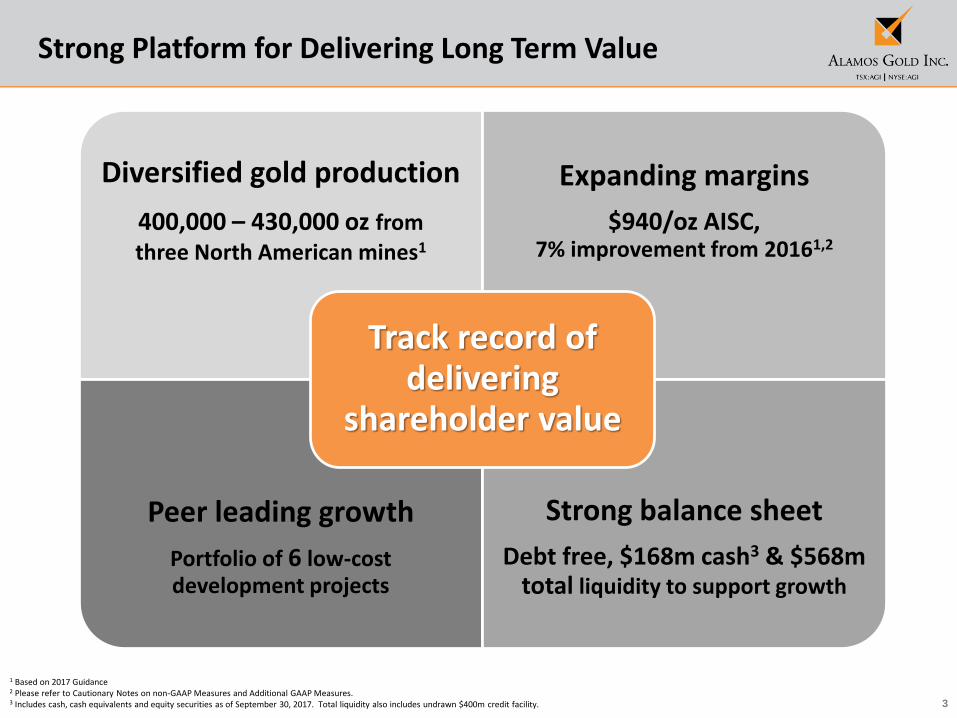
1 Based on 2017 Guidance2 Please refer to Cautionary Notes on non-GAAP Measures and Additional GAAP Measures.3 Includes cash, cash equivalents and equity securities as of September 30, 2017. Total liquidity also includes undrawn $400m credit facility.
Strong Platform for Delivering Long Term Value
Diversified gold production
400,000 – 430,000 oz from three North American mines1
Expanding margins
$940/oz AISC, 7% improvement from 20161,2
Peer leading growth
Portfolio of 6 low-cost development projects
Strong balance sheet
Debt free, $168m cash3 & $568m total liquidity to support growth
Track record of delivering
shareholder value
42015A 2016A 2017E
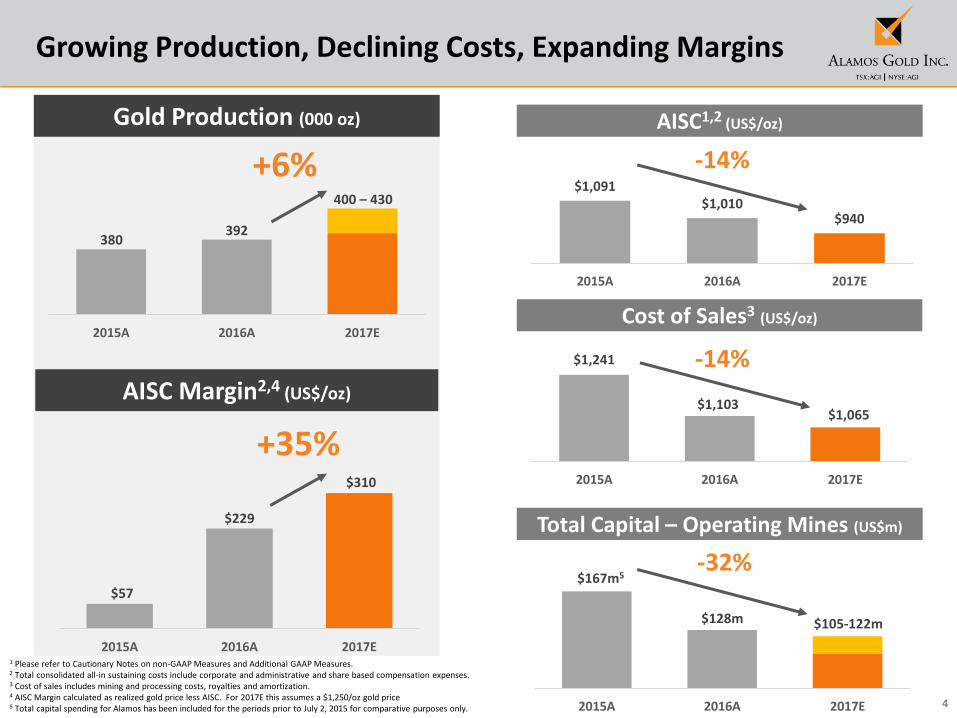
$1,091$1,010
$940
2015A 2016A 2017E
2015A 2016A 2017E
$1,241
$1,103$1,065
2015A 2016A 2017E
Growing Production, Declining Costs, Expanding Margins
Gold Production (000 oz) AISC1,2 (US$/oz)
-14%
Total Capital – Operating Mines (US$m)
$128m $105-122m
Cost of Sales3 (US$/oz)
1 Please refer to Cautionary Notes on non-GAAP Measures and Additional GAAP Measures. 2 Total consolidated all-in sustaining costs include corporate and administrative and share based compensation expenses. 3 Cost of sales includes mining and processing costs, royalties and amortization.4 AISC Margin calculated as realized gold price less AISC. For 2017E this assumes a $1,250/oz gold price5 Total capital spending for Alamos has been included for the periods prior to July 2, 2015 for comparative purposes only.
392
400 – 430
+6%
380
$167m5
$57
$229
$310
2015A 2016A 2017E
+35%
AISC Margin2,4 (US$/oz)
-14%
-32%
5
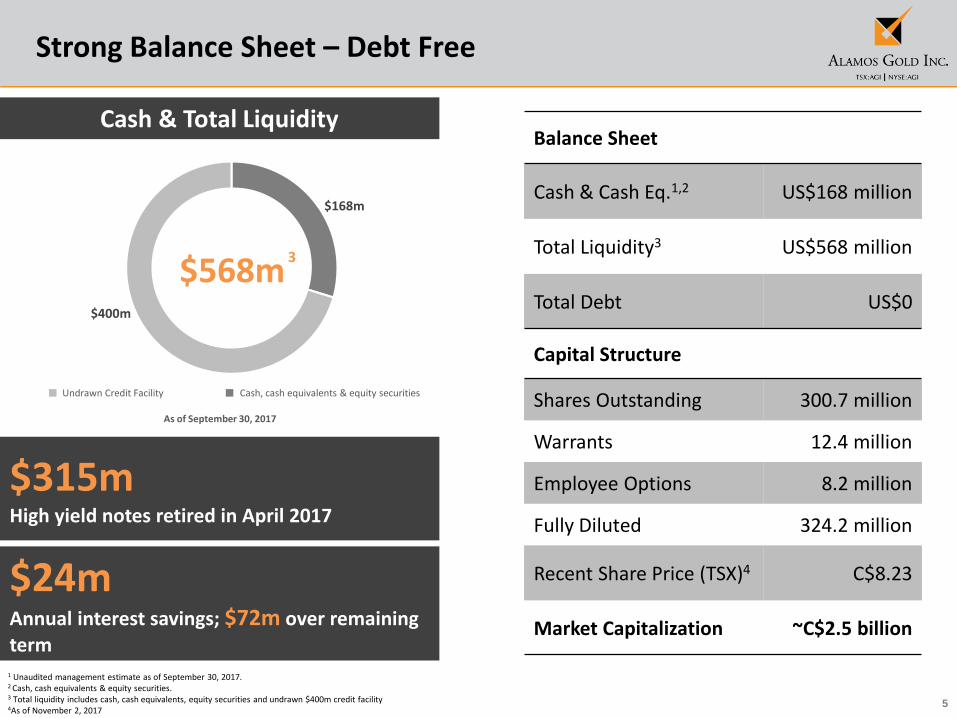
$315m High yield notes retired in April 2017
Strong Balance Sheet – Debt Free
1 Unaudited management estimate as of September 30, 2017.2 Cash, cash equivalents & equity securities.3 Total liquidity includes cash, cash equivalents, equity securities and undrawn $400m credit facility4As of November 2, 2017
Balance Sheet
Cash & Cash Eq.1,2 US$168 million
Total Liquidity3 US$568 million
Total Debt US$0
Capital Structure
Shares Outstanding 300.7 million
Warrants 12.4 million
Employee Options 8.2 million
Fully Diluted 324.2 million
Recent Share Price (TSX)4 C$8.23
Market Capitalization ~C$2.5 billion
$24m Annual interest savings; $72m over remaining term
$168m
$400m
$568m
As of September 30, 2017
Cash & Total Liquidity
Cash, cash equivalents & equity securitiesUndrawn Credit Facility
3
6
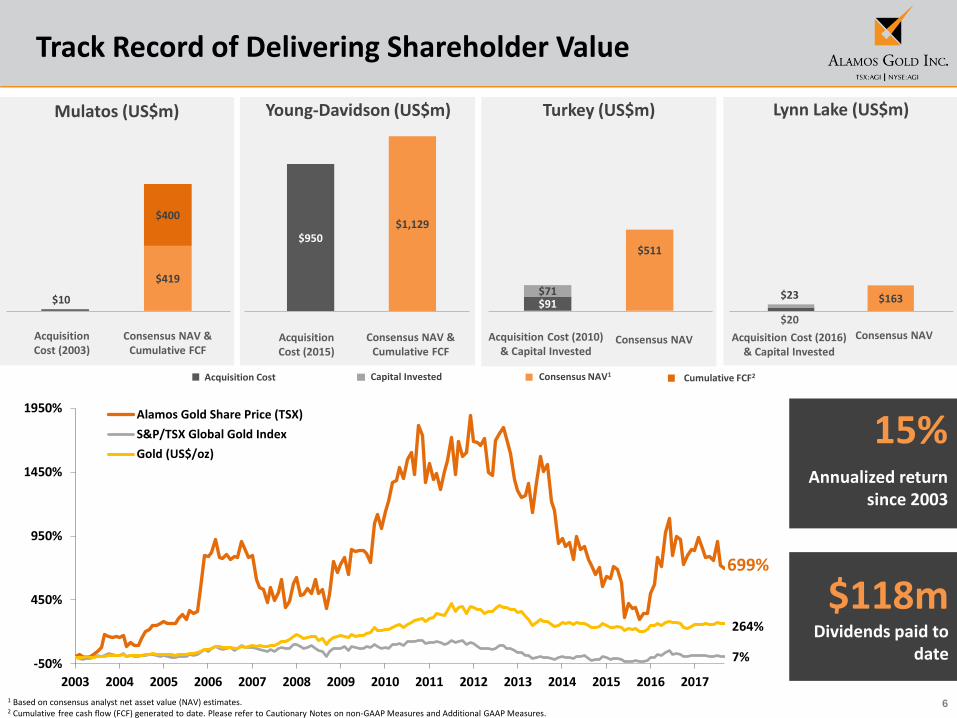
699%
7%
264%
-50%
450%
950%
1450%
1950%
2003 2004 2005 2006 2007 2008 2009 2010 2011 2012 2013 2014 2015 2016 2017
Alamos Gold Share Price (TSX)
S&P/TSX Global Gold Index
Gold (US$/oz)
$91
$511
$71$10
$419
$400
$950$1,129
$163
Track Record of Delivering Shareholder Value
1 Based on consensus analyst net asset value (NAV) estimates.2 Cumulative free cash flow (FCF) generated to date. Please refer to Cautionary Notes on non-GAAP Measures and Additional GAAP Measures.
15%Annualized return
since 2003
$118m Dividends paid to
date
Mulatos (US$m) Turkey (US$m)Young-Davidson (US$m) Lynn Lake (US$m)
Acquisition Cost (2003)
Acquisition Cost (2015)
Acquisition Cost (2010) & Capital Invested
Acquisition Cost (2016) & Capital Invested
Consensus NAV & Cumulative FCF
Consensus NAV Consensus NAV
$20
$23
Consensus NAV & Cumulative FCF
Capital Invested Consensus NAV1 Cumulative FCF2Acquisition Cost
7
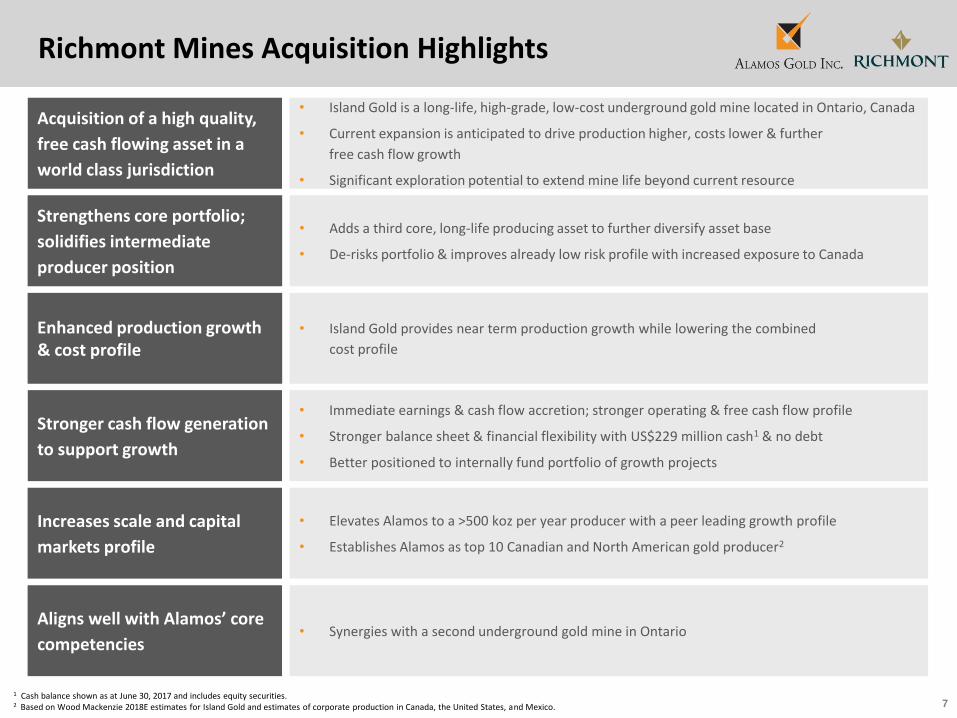
Richmont Mines Acquisition Highlights
Acquisition of a high quality,
free cash flowing asset in a
world class jurisdiction
• Island Gold is a long-life, high-grade, low-cost underground gold mine located in Ontario, Canada
• Current expansion is anticipated to drive production higher, costs lower & further
free cash flow growth
• Significant exploration potential to extend mine life beyond current resource
Strengthens core portfolio;
solidifies intermediate
producer position
• Adds a third core, long-life producing asset to further diversify asset base
• De-risks portfolio & improves already low risk profile with increased exposure to Canada
Stronger cash flow generation
to support growth
• Immediate earnings & cash flow accretion; stronger operating & free cash flow profile
• Stronger balance sheet & financial flexibility with US$229 million cash1 & no debt
• Better positioned to internally fund portfolio of growth projects
Aligns well with Alamos’ core
competencies• Synergies with a second underground gold mine in Ontario
Enhanced production growth & cost profile
• Island Gold provides near term production growth while lowering the combined
cost profile
Increases scale and capital
markets profile
• Elevates Alamos to a >500 koz per year producer with a peer leading growth profile
• Establishes Alamos as top 10 Canadian and North American gold producer2
1 Cash balance shown as at June 30, 2017 and includes equity securities.2 Based on Wood Mackenzie 2018E estimates for Island Gold and estimates of corporate production in Canada, the United States, and Mexico.

8
35 42
52
82
95 $1,452
$1,192 $1,136
$745 $723
2013A 2014A 2015A 2016A 2017E
Ounces Sold (koz) AISC (US$/oz)
Island Gold Mine Overview
Source: Company filings, SNL, street research1 Ore processed averaged 933 tpd in H1 2017.2 Expansion capital of C$28.2 mm converted at 0.80x US$ per C$.
• High grade underground gold mine located northeast of Wawa, Ontario in a well established gold district
• Began commercial production in October 2007
• Ore currently processed at rate of ~930 tpd1
• Expansion underway to 1,100 tpd as detailed in May 2017 PEA
– Annual production expected to increase to average 125 koz at mine-site AISC of US$550/oz for the period of 2019-2024
– Minimal incremental capital of US$23 mm2 with mill expansion expected to be completed in latter part of 2018
• Upside potential reflecting inclusion of all mineral resources and exploration potential laterally and at depth
Asset Description
Growing Production; Declining Costs
Highly Productive Gold Mining District
4
0 50 100km
Marathon
Wawa
Hearst
Timmins
Iroquois Falls
Smooth Rock Falls
Eagle River, Wesdome
Borden, Goldcorp
Island Gold, Richmont
Magino, Argonaut
Cote, IAMGOLD
Black Fox, McEwen
Timmins West, Tahoe
Holloway, Kirkland Lake
Porcupine, Goldcorp
Bell Creek, Tahoe
Young Davidson, Alamos
Macassa, Kirkland Lake
Holt, Kirkland Lake
Lake Superior
ONTARIO
Hemlo, Barrick
144
101
17
17
11
101
Mine/ProjectCity
Dome Mine, Goldcorp
Hoyle Pond, Goldcorp
Cochrane
Pamour (PJV), Goldcorp
Taylor, Kirkland Lake
Detour Lake Mine, Detour Gold
Recent Operating Performance
Gold Reserves & ResourcesTonnes (000)
Grade (g/t Au)
oz Au(000)
P&P Reserves 2,551 9.17 752M&I Resources 479 5.94 91Inferred Resources 3,042 10.18 996
Q1/17A Q2/17A Q3/17AQ3 YTD
20172017E6
Gold Production (koz) 23.8 26.1 26.7 76.5 87-93Total Cash Costs7 (US$/oz) $504 $431 $532 $487 $550-$590Mine-site AISC7 (US$/oz) $640 $503 $725-$765Sustaining Capital (US$ mm) $3.1 $2.1 $15-$17Expansion Capital (US$ mm) $4.5 $4.4 $25-$27Exploration (US$ mm) $2.8 $3.6 $11-$12RIC Corporate FCF5 (US$ mm) $0.4 $14.3
3 Since 1985.4 Based on analyst consensus estimates.
5 Richmont consolidated corporate OCF less capex.6 Richmont 2017E guidance.
>25 Moz gold produced3
>35 Moz in defined reserves
7 Please refer to Cautionary Notes on non-GAAP Measures and Additional GAAP Measures.
9
20.8
14.6
9.2 9.2 8.8 8.4 8.3 7.7 7.3
6.4 6.1
4.6 4.5 4.3 4.3 4.2 3.6
2.7
1.1 1.0
Mac
assa
Bru
ceja
ck
Isla
nd
Go
ld
Eagl
e R
ive
r
We
stw
oo
d
Seab
ee
Re
d L
ake
Ho
pe
Bay
Me
liad
ine
Mu
sse
lwh
ite
Eleo
no
re
Lap
a
LaR
on
de
Cas
a B
erar
di
Bla
ck F
ox
Be
ll C
reek
Tim
min
s W
est
You
ng-
Dav
idso
n
Can
adia
n M
alar
tic
De
tou
r La
ke
$7
00
$7
13
$7
15
$7
20
$7
30
$7
75
$7
82
$7
87
$8
70
$9
80
$9
85
$1
,05
0
$1
,07
5
$1
,11
3
$1
,15
0
$1
,20
0
$5
50
$7
35
Isla
nd
PEA
20
19
-20
24
Seab
ee
LaR
on
de
Mu
sse
lwh
ite
Me
liad
ine
Can
adia
n M
alar
tic
Isla
nd
Go
ld
You
ng-
Dav
idso
n
Lap
a
Mac
assa
Re
d L
ake
We
stw
oo
d
Eleo
no
re
Be
ll C
reek
De
tou
r La
ke
Eagl
e R
ive
r
Cas
a B
erar
di
Bla
ck F
ox
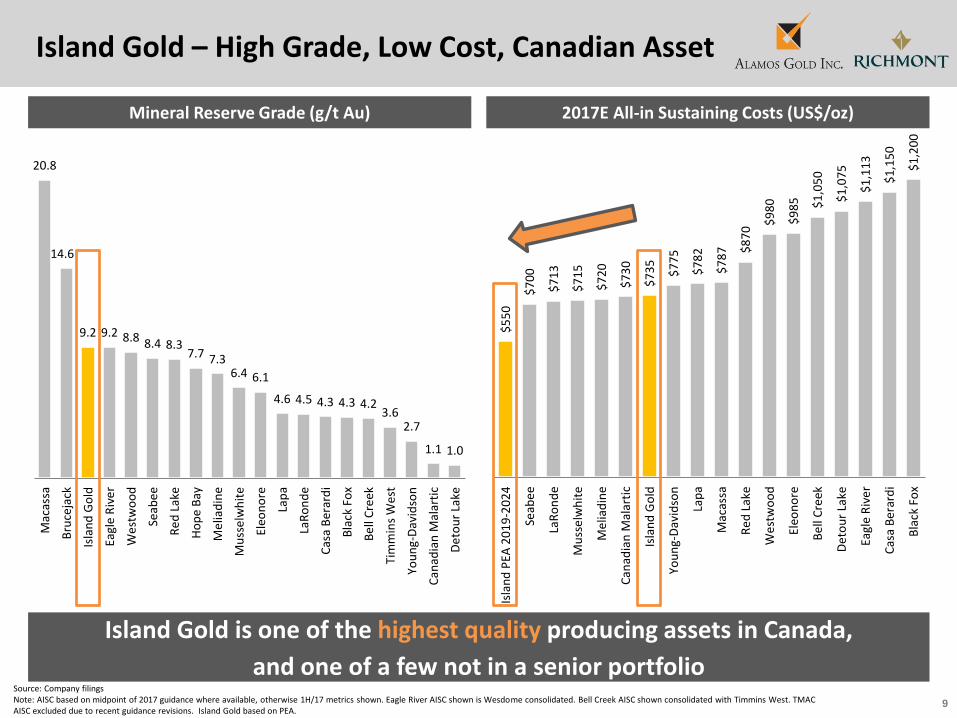
Island Gold – High Grade, Low Cost, Canadian Asset
Island Gold is one of the highest quality producing assets in Canada,
and one of a few not in a senior portfolio
2017E All-in Sustaining Costs (US$/oz)Mineral Reserve Grade (g/t Au)
Source: Company filingsNote: AISC based on midpoint of 2017 guidance where available, otherwise 1H/17 metrics shown. Eagle River AISC shown is Wesdome consolidated. Bell Creek AISC shown consolidated with Timmins West. TMAC AISC excluded due to recent guidance revisions. Island Gold based on PEA.

10
Island Gold PEA Highlights & Operating Profile
Source: Company disclosure, street research1 The Expansion Case PEA assumes a spot gold price of C$1,700/oz and US$1,260/oz and a C$:US$ exchange rate of 1.35.2 Excludes the 2017 and 2018 ramp-up period. 3 Project capital includes incremental expansion capital of C$28.2m and accelerated mine development/infrastructure capital of C$40m.4 Net cash flow is undiscounted pre-tax cash flow after all operating costs, project and sustaining capital.5 Please refer to Cautionary Notes on non-GAAP Measures and Additional GAAP Measures.
Expansion Case PEA Summary (1,100 tpd)1 Island Gold Operating Profile (PEA)
C$ US$
Targeted mill throughput run-rate year H2 2018 H2 2018
Avg annual production (koz): 2019 – 20242 125 koz 125 koz
Avg operating unit cost ($/t) $191 $141
Avg annual Cash Costs ($/oz): LOM 5 $652 $483
Avg annual AISC ($/oz): 2019 – 20242,5 $743 $550
Avg annual AIC ($/oz): LOM5 $910 $674
Sustaining capital ($m): LOM $168 $124
Project capital ($m)3: LOM $68 $50
Cumulative Net Cash Flow ($m)4 $749 $555
90 94
125
$735
$881
$550
2017E 2018E 2019E - 2024E Average
Gold Production (koz) AISC (US$/oz)
39% Growth
39%
projected
production growth
C$28.2 mm
Low incremental
expansion capital
-25%
expected decrease
in LOM AISC
Significant upside potential
>750 koz of Inferred resources not factored
into mine plan + ongoing exploration potential
11
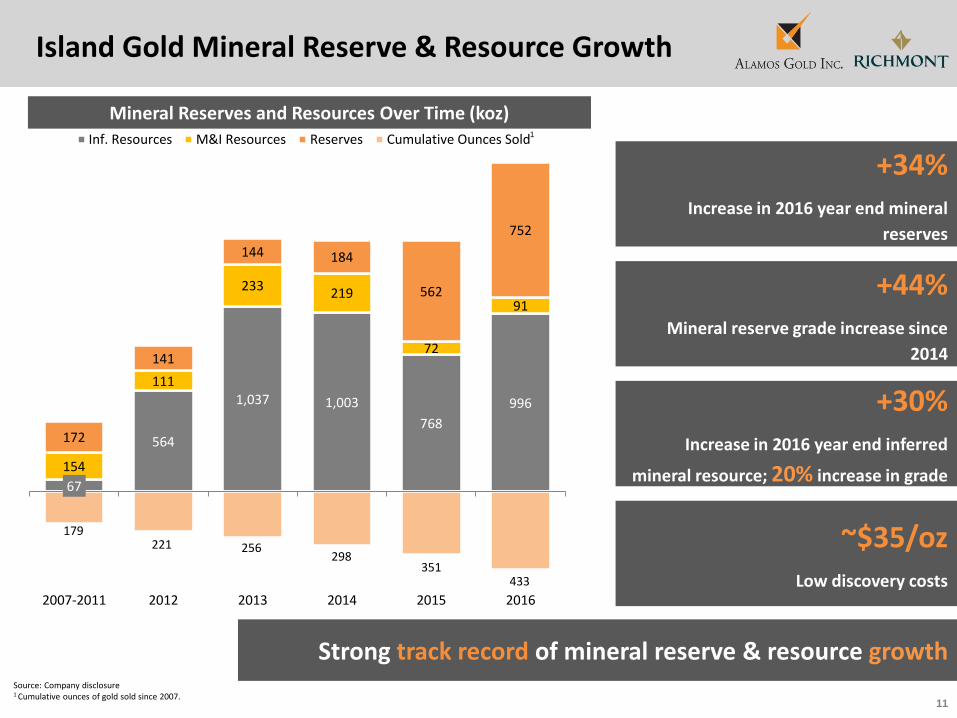
Island Gold Mineral Reserve & Resource Growth
67
564
1,037 1,003
768
996
154
111
233 219
72
91
172
141
144 184
562
752
2007-2011 2012 2013 2014 2015 2016
Inf. Resources M&I Resources Reserves Cumulative Ounces Sold
179 221 256
298 351
433
Source: Company disclosure1 Cumulative ounces of gold sold since 2007.
Mineral Reserves and Resources Over Time (koz)1
+34%Increase in 2016 year end mineral
reserves
Strong track record of mineral reserve & resource growth
~$35/ozLow discovery costs
+30%Increase in 2016 year end inferred
mineral resource; 20% increase in grade
+44%Mineral reserve grade increase since
2014
12
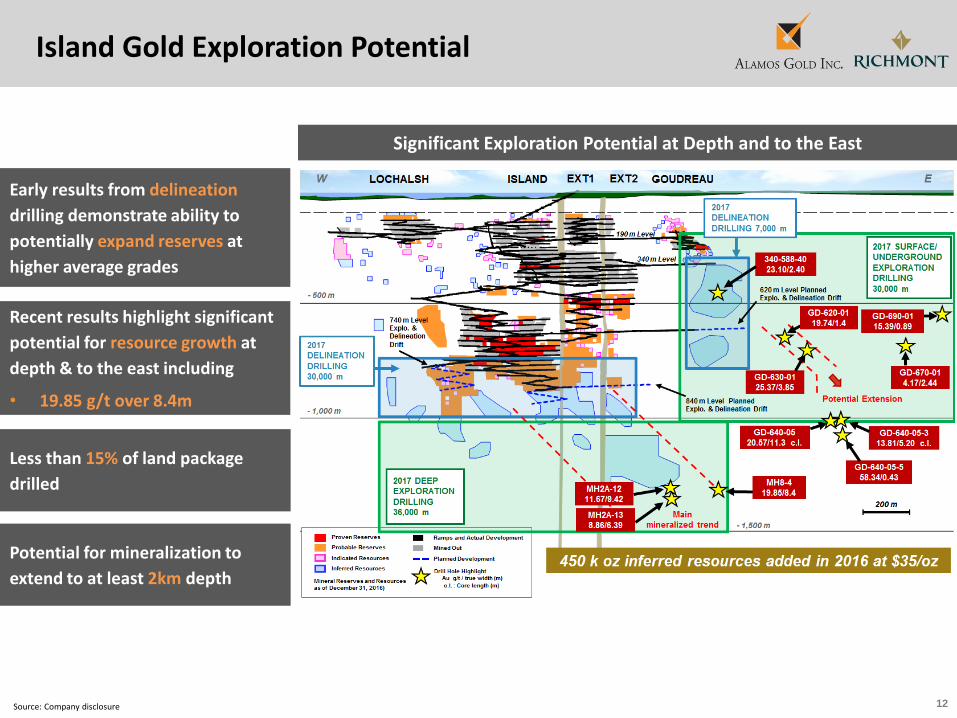
Island Gold Exploration Potential
Source: Company disclosure
Significant Exploration Potential at Depth and to the East
Recent results highlight significant
potential for resource growth at
depth & to the east including
• 19.85 g/t over 8.4m
Less than 15% of land package
drilled
Potential for mineralization to
extend to at least 2km depth
Early results from delineation
drilling demonstrate ability to
potentially expand reserves at
higher average grades
13
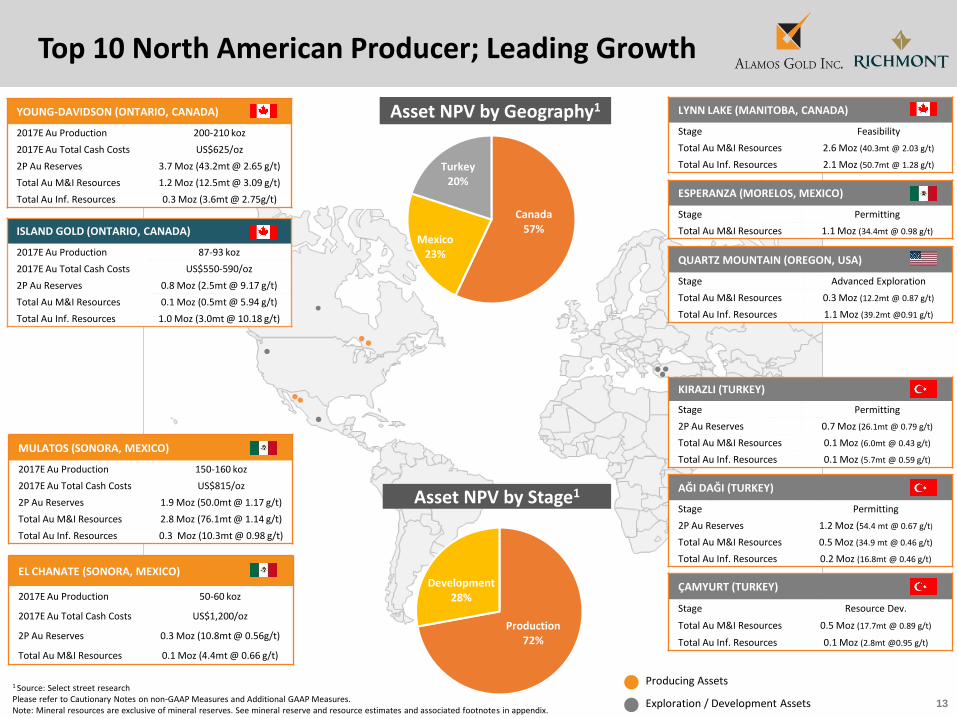
AĞI DAĞI (TURKEY)
Stage Permitting
2P Au Reserves 1.2 Moz (54.4 mt @ 0.67 g/t)
Total Au M&I Resources 0.5 Moz (34.9 mt @ 0.46 g/t)
Total Au Inf. Resources 0.2 Moz (16.8mt @ 0.46 g/t)
KIRAZLI (TURKEY)
Stage Permitting
2P Au Reserves 0.7 Moz (26.1mt @ 0.79 g/t)
Total Au M&I Resources 0.1 Moz (6.0mt @ 0.43 g/t)
Total Au Inf. Resources 0.1 Moz (5.7mt @ 0.59 g/t)
ÇAMYURT (TURKEY)
Stage Resource Dev.
Total Au M&I Resources 0.5 Moz (17.7mt @ 0.89 g/t)
Total Au Inf. Resources 0.1 Moz (2.8mt @0.95 g/t)
Top 10 North American Producer; Leading Growth
MULATOS (SONORA, MEXICO)
2017E Au Production 150-160 koz
2017E Au Total Cash Costs US$815/oz
2P Au Reserves 1.9 Moz (50.0mt @ 1.17 g/t)
Total Au M&I Resources 2.8 Moz (76.1mt @ 1.14 g/t)
Total Au Inf. Resources 0.3 Moz (10.3mt @ 0.98 g/t)
EL CHANATE (SONORA, MEXICO)
2017E Au Production 50-60 koz
2017E Au Total Cash Costs US$1,200/oz
2P Au Reserves 0.3 Moz (10.8mt @ 0.56g/t)
Total Au M&I Resources 0.1 Moz (4.4mt @ 0.66 g/t)
YOUNG-DAVIDSON (ONTARIO, CANADA)
2017E Au Production 200-210 koz
2017E Au Total Cash Costs US$625/oz
2P Au Reserves 3.7 Moz (43.2mt @ 2.65 g/t)
Total Au M&I Resources 1.2 Moz (12.5mt @ 3.09 g/t)
Total Au Inf. Resources 0.3 Moz (3.6mt @ 2.75g/t)
Producing Assets
Exploration / Development Assets
1 Source: Select street researchPlease refer to Cautionary Notes on non-GAAP Measures and Additional GAAP Measures.Note: Mineral resources are exclusive of mineral reserves. See mineral reserve and resource estimates and associated footnotes in appendix.
ISLAND GOLD (ONTARIO, CANADA)
2017E Au Production 87-93 koz
2017E Au Total Cash Costs US$550-590/oz
2P Au Reserves 0.8 Moz (2.5mt @ 9.17 g/t)
Total Au M&I Resources 0.1 Moz (0.5mt @ 5.94 g/t)
Total Au Inf. Resources 1.0 Moz (3.0mt @ 10.18 g/t)
QUARTZ MOUNTAIN (OREGON, USA)
Stage Advanced Exploration
Total Au M&I Resources 0.3 Moz (12.2mt @ 0.87 g/t)
Total Au Inf. Resources 1.1 Moz (39.2mt @0.91 g/t)
ESPERANZA (MORELOS, MEXICO)
Stage Permitting
Total Au M&I Resources 1.1 Moz (34.4mt @ 0.98 g/t)
LYNN LAKE (MANITOBA, CANADA)
Stage Feasibility
Total Au M&I Resources 2.6 Moz (40.3mt @ 2.03 g/t)
Total Au Inf. Resources 2.1 Moz (50.7mt @ 1.28 g/t)
Asset NPV by Geography1
Asset NPV by Stage1
Canada57%
Mexico23%
Turkey20%
Production72%
Development28%
14
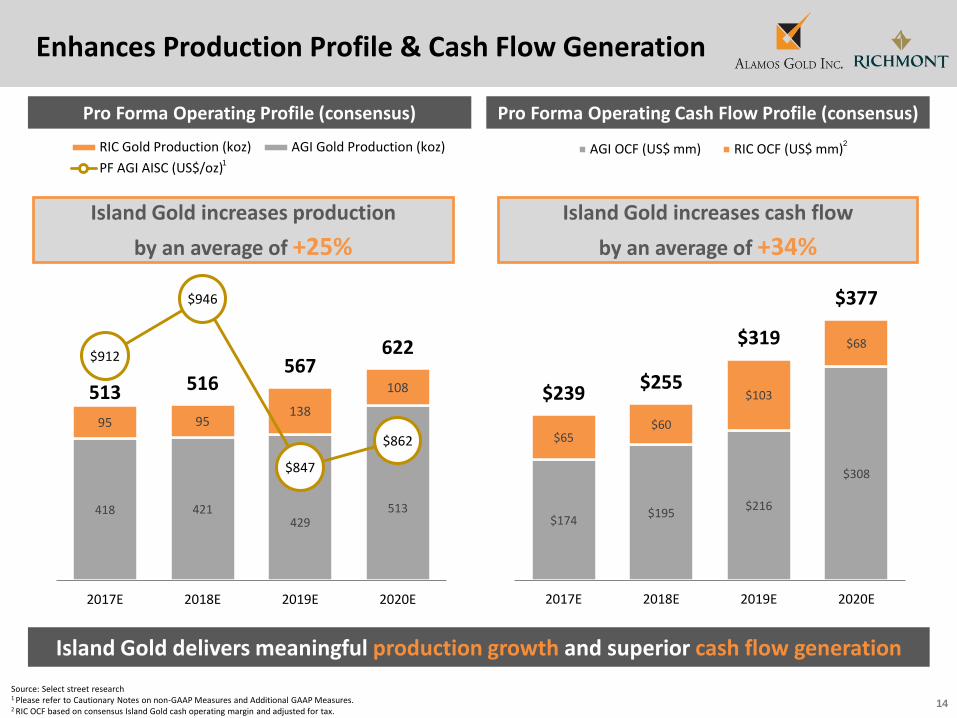
$174 $195
$216
$308
$65 $60
$103
$68
$239 $255
$319
$377
2017E 2018E 2019E 2020E
AGI OCF (US$ mm) RIC OCF (US$ mm)
Enhances Production Profile & Cash Flow Generation
Pro Forma Operating Profile (consensus) Pro Forma Operating Cash Flow Profile (consensus)
418 421 429
513
95 95 138
108 513 516 567
622 $912
$946
$847
$862
2017E 2018E 2019E 2020E
RIC Gold Production (koz) AGI Gold Production (koz)
PF AGI AISC (US$/oz)
Island Gold increases production
by an average of +25%
Island Gold increases cash flow
by an average of +34%
Source: Select street research1 Please refer to Cautionary Notes on non-GAAP Measures and Additional GAAP Measures.2 RIC OCF based on consensus Island Gold cash operating margin and adjusted for tax.
Island Gold delivers meaningful production growth and superior cash flow generation
2
1
15
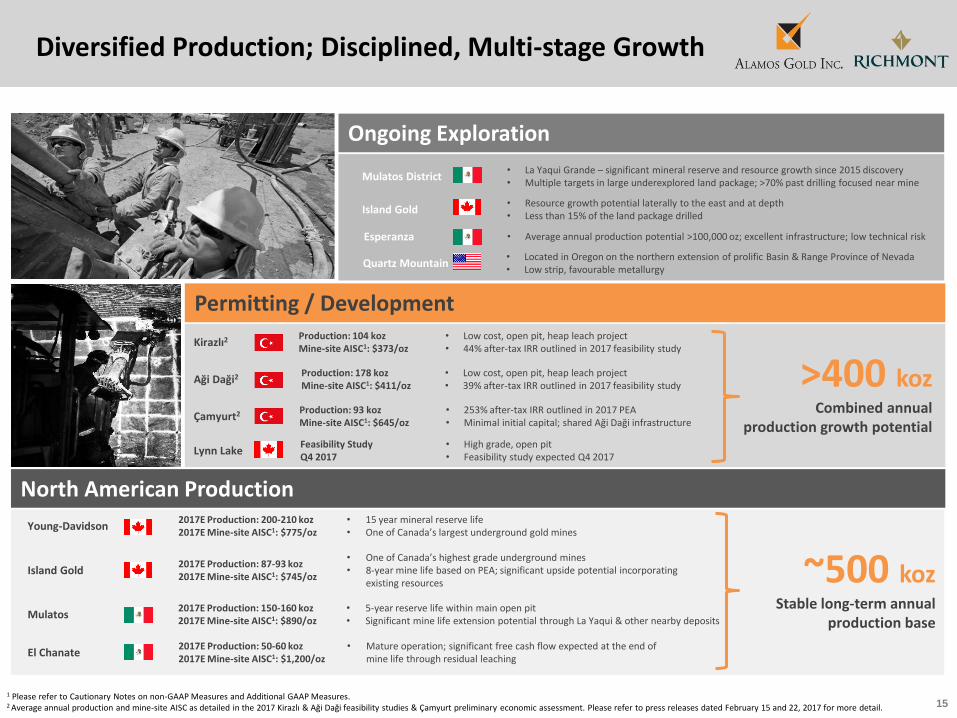
Mulatos District• La Yaqui Grande – significant mineral reserve and resource growth since 2015 discovery• Multiple targets in large underexplored land package; >70% past drilling focused near mine
Quartz Mountain• Located in Oregon on the northern extension of prolific Basin & Range Province of Nevada• Low strip, favourable metallurgy
Island Gold• Resource growth potential laterally to the east and at depth• Less than 15% of the land package drilled
Aği Daği2 Production: 178 kozMine-site AISC1: $411/oz
• Low cost, open pit, heap leach project • 39% after-tax IRR outlined in 2017 feasibility study
Çamyurt2 Production: 93 kozMine-site AISC1: $645/oz
• 253% after-tax IRR outlined in 2017 PEA• Minimal initial capital; shared Aği Daği infrastructure
Lynn LakeFeasibility Study Q4 2017
• High grade, open pit• Feasibility study expected Q4 2017
Kirazlı2Production: 104 kozMine-site AISC1: $373/oz
• Low cost, open pit, heap leach project • 44% after-tax IRR outlined in 2017 feasibility study
Esperanza • Average annual production potential >100,000 oz; excellent infrastructure; low technical risk
~500 koz Stable long-term annual
production base
Diversified Production; Disciplined, Multi-stage Growth
>400 kozCombined annual
production growth potential
Young-Davidson2017E Production: 200-210 koz2017E Mine-site AISC1: $775/oz
• 15 year mineral reserve life• One of Canada’s largest underground gold mines
North American Production
Permitting / Development
Ongoing Exploration
Mulatos2017E Production: 150-160 koz2017E Mine-site AISC1: $890/oz
• 5-year reserve life within main open pit• Significant mine life extension potential through La Yaqui & other nearby deposits
El Chanate2017E Production: 50-60 koz2017E Mine-site AISC1: $1,200/oz
• Mature operation; significant free cash flow expected at the end of mine life through residual leaching
Island Gold2017E Production: 87-93 koz2017E Mine-site AISC1: $745/oz
• One of Canada’s highest grade underground mines• 8-year mine life based on PEA; significant upside potential incorporating
existing resources
1 Please refer to Cautionary Notes on non-GAAP Measures and Additional GAAP Measures.2 Average annual production and mine-site AISC as detailed in the 2017 Kirazlı & Aği Daği feasibility studies & Çamyurt preliminary economic assessment. Please refer to press releases dated February 15 and 22, 2017 for more detail.

16
Operations – Diversified North American Production
Long life reserve base
Declining costs & capital
Growing free cash flow
Growing production
17
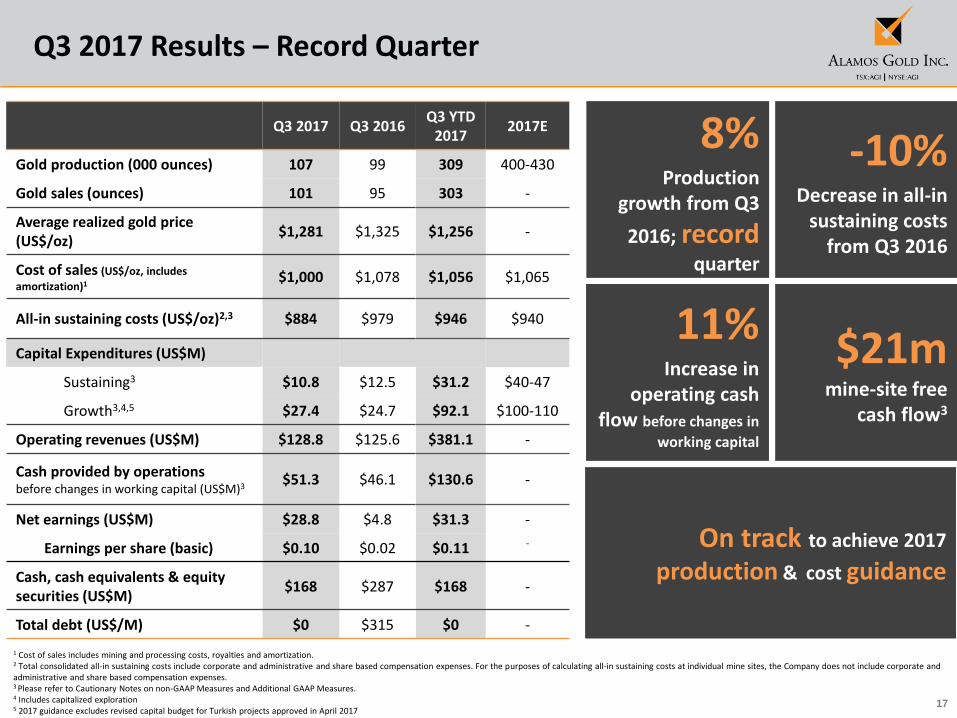
Q3 2017 Results – Record Quarter
1 Cost of sales includes mining and processing costs, royalties and amortization.2 Total consolidated all-in sustaining costs include corporate and administrative and share based compensation expenses. For the purposes of calculating all-in sustaining costs at individual mine sites, the Company does not include corporate and administrative and share based compensation expenses.3 Please refer to Cautionary Notes on non-GAAP Measures and Additional GAAP Measures. 4 Includes capitalized exploration5 2017 guidance excludes revised capital budget for Turkish projects approved in April 2017
8%Production
growth from Q3
2016; recordquarter
-10%Decrease in all-in
sustaining costs from Q3 2016
11%Increase in
operating cash flow before changes in
working capital
$21mmine-site free
cash flow3
On track to achieve 2017
production & cost guidance
Q3 2017 Q3 2016Q3 YTD
20172017E
Gold production (000 ounces) 107 99 309 400-430
Gold sales (ounces) 101 95 303 -
Average realized gold price (US$/oz)
$1,281 $1,325 $1,256 -
Cost of sales (US$/oz, includes
amortization)1$1,000 $1,078 $1,056 $1,065
All-in sustaining costs (US$/oz)2,3 $884 $979 $946 $940
Capital Expenditures (US$M)
Sustaining3 $10.8 $12.5 $31.2 $40-47
Growth3,4,5 $27.4 $24.7 $92.1 $100-110
Operating revenues (US$M) $128.8 $125.6 $381.1 -
Cash provided by operations before changes in working capital (US$M)3
$51.3 $46.1 $130.6 -
Net earnings (US$M) $28.8 $4.8 $31.3 -
Earnings per share (basic) $0.10 $0.02 $0.11 -
Cash, cash equivalents & equity securities (US$M)
$168 $287 $168 -
Total debt (US$/M) $0 $315 $0 -
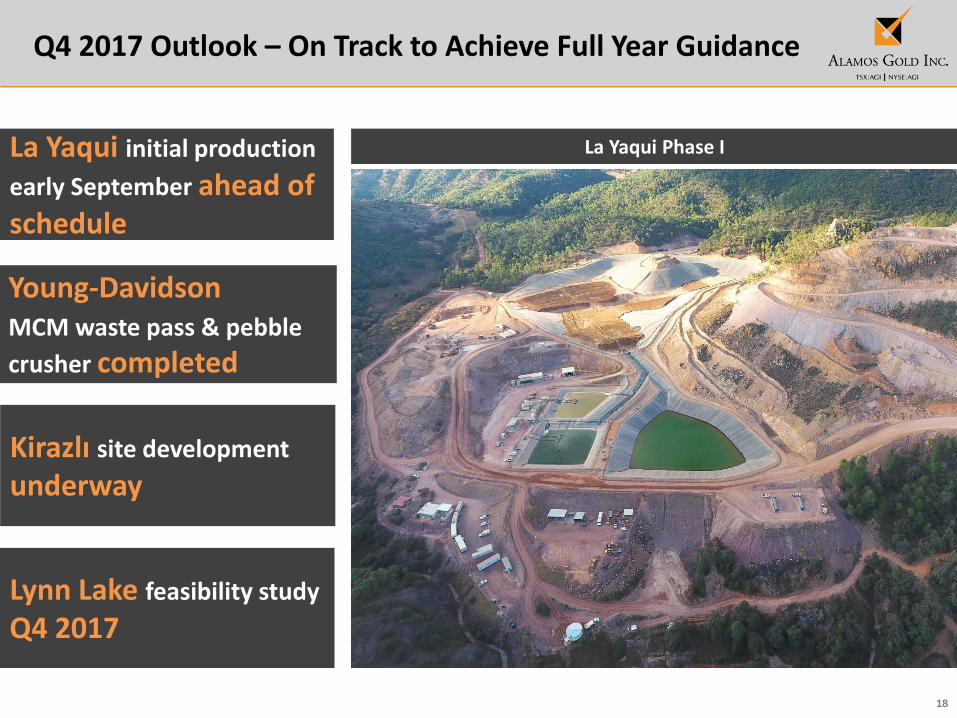
18
La Yaqui Phase I
Q4 2017 Outlook – On Track to Achieve Full Year Guidance
La Yaqui initial production
early September ahead of schedule
Kirazlı site development
underway
Lynn Lake feasibility study
Q4 2017
Young-Davidson MCM waste pass & pebble
crusher completed
19
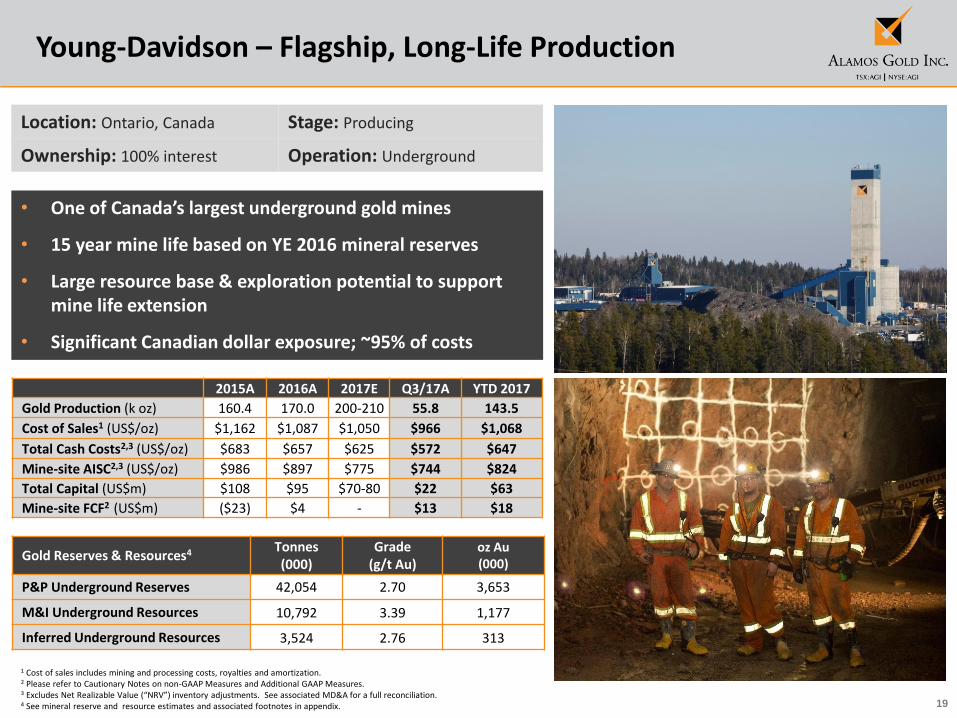
Young-Davidson – Flagship, Long-Life Production
2015A 2016A 2017E Q3/17A YTD 2017
Gold Production (k oz) 160.4 170.0 200-210 55.8 143.5
Cost of Sales1 (US$/oz) $1,162 $1,087 $1,050 $966 $1,068
Total Cash Costs2,3 (US$/oz) $683 $657 $625 $572 $647
Mine-site AISC2,3 (US$/oz) $986 $897 $775 $744 $824
Total Capital (US$m) $108 $95 $70-80 $22 $63
Mine-site FCF2 (US$m) ($23) $4 - $13 $18
• One of Canada’s largest underground gold mines
• 15 year mine life based on YE 2016 mineral reserves
• Large resource base & exploration potential to support mine life extension
• Significant Canadian dollar exposure; ~95% of costs
Location: Ontario, Canada Stage: Producing
Ownership: 100% interest Operation: Underground
Gold Reserves & Resources4 Tonnes (000)
Grade (g/t Au)
oz Au (000)
P&P Underground Reserves 42,054 2.70 3,653
M&I Underground Resources 10,792 3.39 1,177
Inferred Underground Resources 3,524 2.76 313
1 Cost of sales includes mining and processing costs, royalties and amortization.2 Please refer to Cautionary Notes on non-GAAP Measures and Additional GAAP Measures.3 Excludes Net Realizable Value (“NRV”) inventory adjustments. See associated MD&A for a full reconciliation.4 See mineral reserve and resource estimates and associated footnotes in appendix.
20
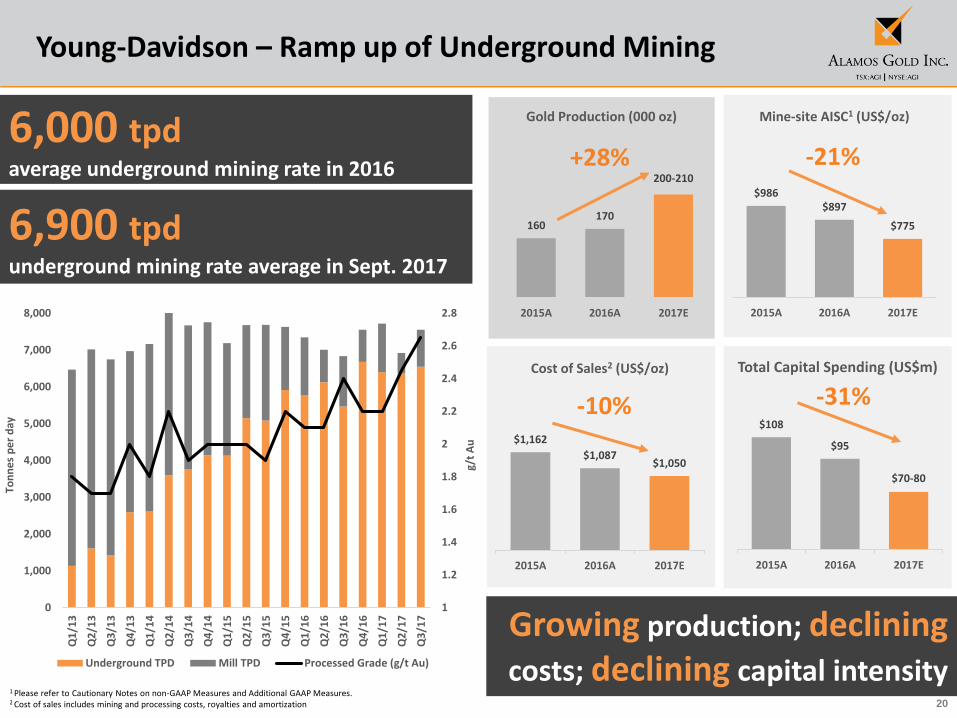
160170
200-210
2015A 2016A 2017E
Gold Production (000 oz)
$1,162
$1,087 $1,050
2015A 2016A 2017E
Cost of Sales2 (US$/oz)
$986 $897
$775
2015A 2016A 2017E
Mine-site AISC1 (US$/oz)
$108
$95
$70-80
2015A 2016A 2017E
-31%
Growing production; decliningcosts; declining capital intensity
Young-Davidson – Ramp up of Underground Mining
-21%+28%
6,900 tpdunderground mining rate average in Sept. 2017
-10%
6,000 tpdaverage underground mining rate in 2016
1 Please refer to Cautionary Notes on non-GAAP Measures and Additional GAAP Measures.2 Cost of sales includes mining and processing costs, royalties and amortization
Total Capital Spending (US$m)
1
1.2
1.4
1.6
1.8
2
2.2
2.4
2.6
2.8
0
1,000
2,000
3,000
4,000
5,000
6,000
7,000
8,000
Q1
/13
Q2
/13
Q3
/13
Q4
/13
Q1
/14
Q2
/14
Q3
/14
Q4
/14
Q1
/15
Q2
/15
Q3
/15
Q4
/15
Q1
/16
Q2
/16
Q3
/16
Q4
/16
Q1
/17
Q2
/17
Q3
/17
Underground TPD Mill TPD Processed Grade (g/t Au)
Ton
ne
s p
er
day
g/t
Au

21
Mulatos – Our Founding Operation
• Initial production 2005
• ~$400m of free cash flow1 generated to date
• Declining cost profile; 5% NSR royalty nearing completion
• Large underexplored land package (28,773 ha)
Location: Sonora, Mexico Stage: Producing
Ownership: 100% interestOperation: Open pit, heap leach & high grade mill
2015A 2016A 2017E Q3/17A YTD 2017
Gold Production (k oz) 140.3 154.0 150-160 36.3 117.3
Cost of Sales1 (US$/oz) $1,128 $1,088 $1,015 $956 $964
Total Cash Costs2 (US$/oz) $869 $838 $815 $785 $782
Mine-site AISC2 (US$/oz) $1,047 $916 $890 $864 $852
Total Capital3 (US$m) $45 $33 $33-40 $7 $22
Mine-site FCF2,4 (US$m) ($19) $27 - $6 $20
Gold Reserves & Resources5 Tonnes (000)
Grade (g/t Au)
oz Au(000)
P&P Reserves 49,995 1.17 1,885
M&I Resources 76,084 1.14 2,798
Inferred Resources 10,280 0.98 3251 Cost of sales includes mining and processing costs, royalties and amortization.2 Please refer to Cautionary Notes on non-GAAP Measures and Additional GAAP Measures.3 Capital spending guidance for 2016 and 2017 excludes capitalized exploration. 2017 guidance includes La Yaqui Phase I development capital4 Excluding LY Phase I capital expenditures.5 See mineral reserve and resource estimates and associated footnotes in appendix.
22
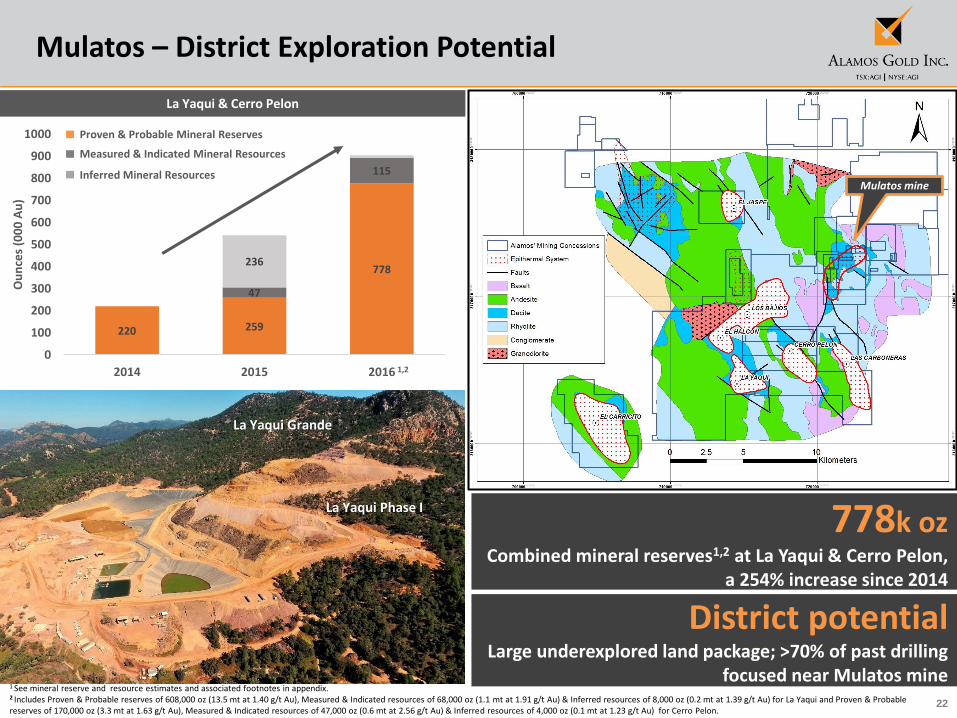
La Yaqui & Cerro Pelon
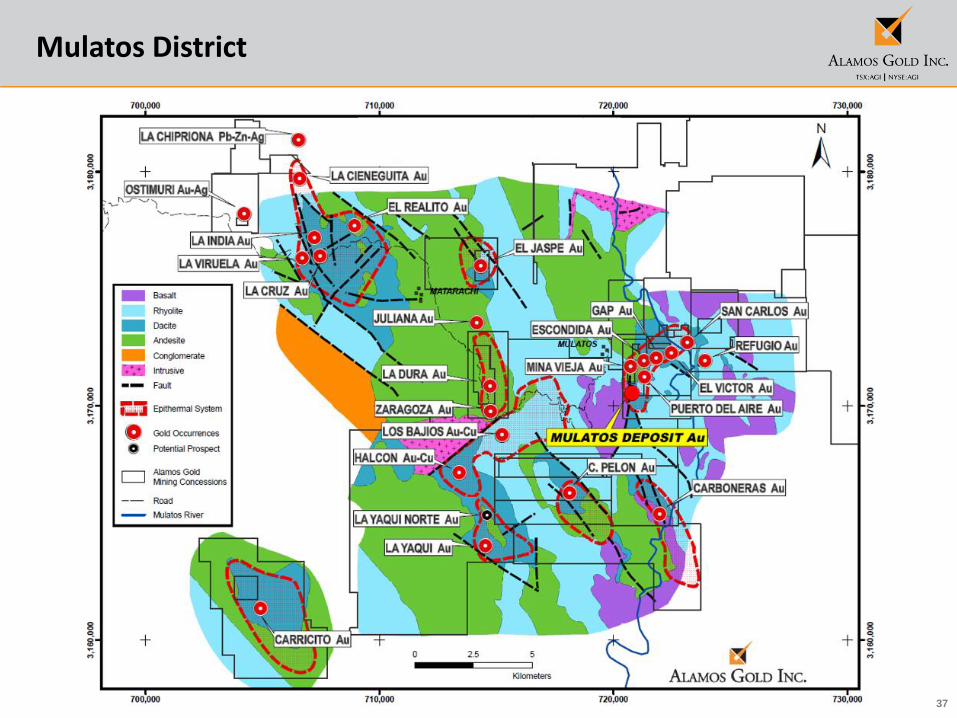
Mulatos – District Exploration Potential
1 See mineral reserve and resource estimates and associated footnotes in appendix.2 Includes Proven & Probable reserves of 608,000 oz (13.5 mt at 1.40 g/t Au), Measured & Indicated resources of 68,000 oz (1.1 mt at 1.91 g/t Au) & Inferred resources of 8,000 oz (0.2 mt at 1.39 g/t Au) for La Yaqui and Proven & Probable reserves of 170,000 oz (3.3 mt at 1.63 g/t Au), Measured & Indicated resources of 47,000 oz (0.6 mt at 2.56 g/t Au) & Inferred resources of 4,000 oz (0.1 mt at 1.23 g/t Au) for Cerro Pelon.
District potentialLarge underexplored land package; >70% of past drilling
focused near Mulatos mine
Mulatos District
Mulatos mine
220 259
778
47
115
236
0
100
200
300
400
500
600
700
800
900
1000
2014 2015 2016
Ou
nce
s (0
00
Au
)
Proven & Probable Mineral Reserves
Inferred Mineral Resources
Measured & Indicated Mineral Resources
1,2
La Yaqui Phase I
La Yaqui Grande
778k oz Combined mineral reserves1,2 at La Yaqui & Cerro Pelon,
a 254% increase since 2014
23
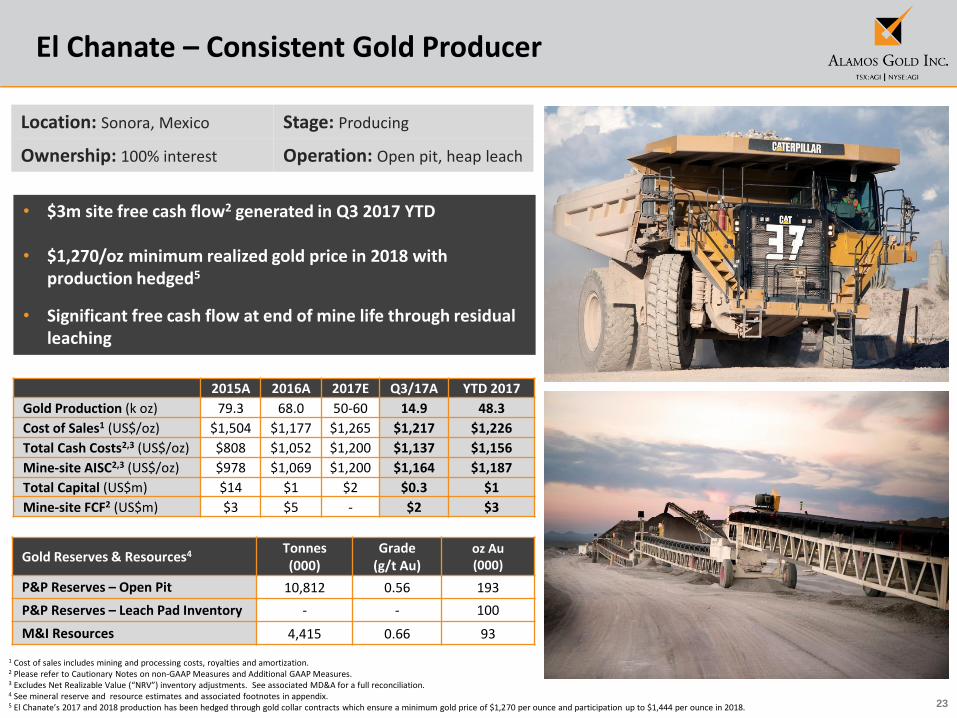
El Chanate – Consistent Gold Producer
• $3m site free cash flow2 generated in Q3 2017 YTD
• $1,270/oz minimum realized gold price in 2018 with production hedged5
• Significant free cash flow at end of mine life through residual leaching
Location: Sonora, Mexico Stage: Producing
Ownership: 100% interest Operation: Open pit, heap leach
Gold Reserves & Resources4 Tonnes (000)
Grade (g/t Au)
oz Au(000)
P&P Reserves – Open Pit 10,812 0.56 193
P&P Reserves – Leach Pad Inventory - - 100
M&I Resources 4,415 0.66 93
2015A 2016A 2017E Q3/17A YTD 2017
Gold Production (k oz) 79.3 68.0 50-60 14.9 48.3
Cost of Sales1 (US$/oz) $1,504 $1,177 $1,265 $1,217 $1,226
Total Cash Costs2,3 (US$/oz) $808 $1,052 $1,200 $1,137 $1,156
Mine-site AISC2,3 (US$/oz) $978 $1,069 $1,200 $1,164 $1,187
Total Capital (US$m) $14 $1 $2 $0.3 $1
Mine-site FCF2 (US$m) $3 $5 - $2 $3
1 Cost of sales includes mining and processing costs, royalties and amortization.2 Please refer to Cautionary Notes on non-GAAP Measures and Additional GAAP Measures.3 Excludes Net Realizable Value (“NRV”) inventory adjustments. See associated MD&A for a full reconciliation.4 See mineral reserve and resource estimates and associated footnotes in appendix.5 El Chanate’s 2017 and 2018 production has been hedged through gold collar contracts which ensure a minimum gold price of $1,270 per ounce and participation up to $1,444 per ounce in 2018.
24
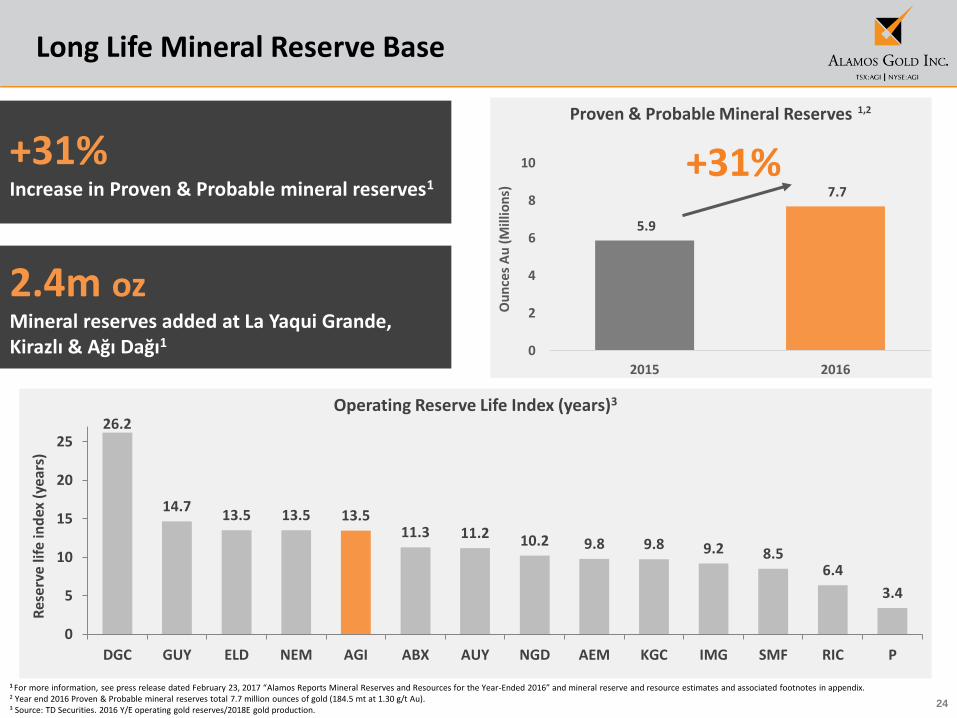
Proven & Probable Mineral Reserves
Long Life Mineral Reserve Base
Operating Reserve Life Index (years)3
1 For more information, see press release dated February 23, 2017 “Alamos Reports Mineral Reserves and Resources for the Year-Ended 2016” and mineral reserve and resource estimates and associated footnotes in appendix.2 Year end 2016 Proven & Probable mineral reserves total 7.7 million ounces of gold (184.5 mt at 1.30 g/t Au).3 Source: TD Securities. 2016 Y/E operating gold reserves/2018E gold production.
5.9
7.7
0
2
4
6
8
10
2015 2016
+31%
Ou
nce
s A
u (
Mill
ion
s)
1,2
+31%Increase in Proven & Probable mineral reserves1
2.4m ozMineral reserves added at La Yaqui Grande, Kirazlı & Ağı Dağı1
26.2
14.713.5 13.5 13.5
11.3 11.2 10.2 9.8 9.8 9.2 8.56.4
3.4
0
5
10
15
20
25
DGC GUY ELD NEM AGI ABX AUY NGD AEM KGC IMG SMF RIC P
Res
erv
e lif
e in
dex
(ye
ars)
25
Development – Peer Leading Growth Profile
Low cost, low capital intensity growth
Capacity to doublecurrent rate of production
6 development projects
26
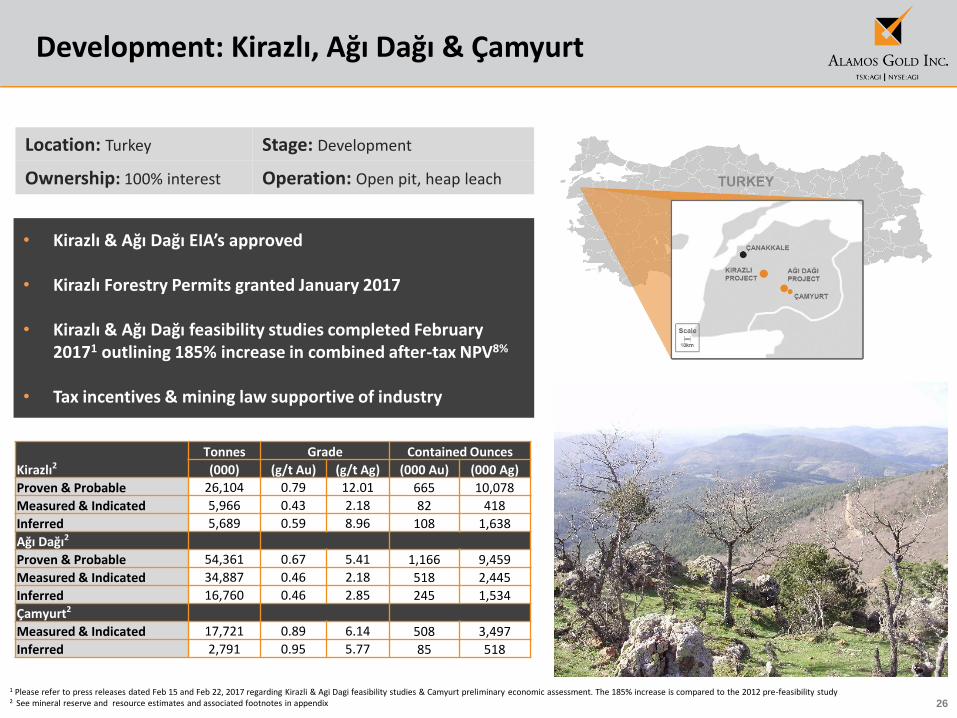
Development: Kirazlı, Ağı Dağı & Çamyurt
Location: Turkey Stage: Development
Ownership: 100% interest Operation: Open pit, heap leach
• Kirazlı & Ağı Dağı EIA’s approved
• Kirazlı Forestry Permits granted January 2017
• Kirazlı & Ağı Dağı feasibility studies completed February 20171 outlining 185% increase in combined after-tax NPV8%
• Tax incentives & mining law supportive of industry
Kirazlı2
Tonnes Grade Contained Ounces
(000) (g/t Au) (g/t Ag) (000 Au) (000 Ag)
Proven & Probable 26,104 0.79 12.01 665 10,078
Measured & Indicated 5,966 0.43 2.18 82 418
Inferred 5,689 0.59 8.96 108 1,638
Ağı Dağı2
Proven & Probable 54,361 0.67 5.41 1,166 9,459
Measured & Indicated 34,887 0.46 2.18 518 2,445
Inferred 16,760 0.46 2.85 245 1,534
Çamyurt2
Measured & Indicated 17,721 0.89 6.14 508 3,497
Inferred 2,791 0.95 5.77 85 518
1 Please refer to press releases dated Feb 15 and Feb 22, 2017 regarding Kirazli & Agi Dagi feasibility studies & Camyurt preliminary economic assessment. The 185% increase is compared to the 2012 pre-feasibility study2 See mineral reserve and resource estimates and associated footnotes in appendix
27
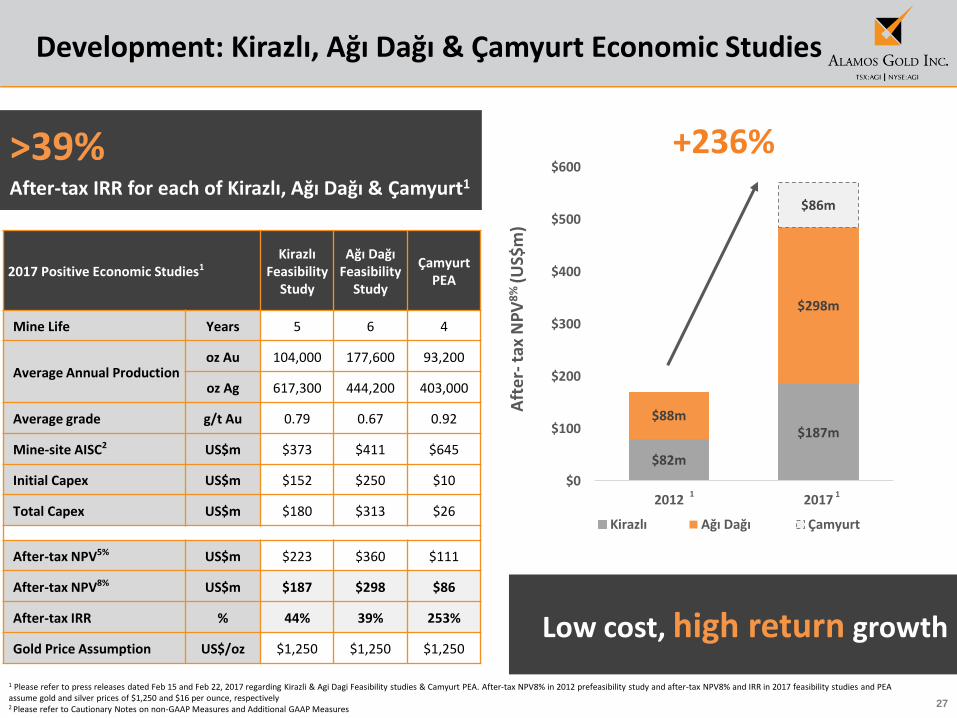
Development: Kirazlı, Ağı Dağı & Çamyurt Economic Studies
Aft
er-
tax
NP
V8
% (U
S$m
)
$82m
$187m$88m
$298m
$86m
$0
$100
$200
$300
$400
$500
$600
2012 2017
Kirazlı Ağı Dağı Çamyurt
+236%
1 Please refer to press releases dated Feb 15 and Feb 22, 2017 regarding Kirazli & Agi Dagi Feasibility studies & Camyurt PEA. After-tax NPV8% in 2012 prefeasibility study and after-tax NPV8% and IRR in 2017 feasibility studies and PEA assume gold and silver prices of $1,250 and $16 per ounce, respectively 2 Please refer to Cautionary Notes on non-GAAP Measures and Additional GAAP Measures
11
2017 Positive Economic Studies1Kirazlı
Feasibility Study
Ağı Dağı Feasibility
Study
ÇamyurtPEA
Mine Life Years 5 6 4
Average Annual Productionoz Au 104,000 177,600 93,200
oz Ag 617,300 444,200 403,000
Average grade g/t Au 0.79 0.67 0.92
Mine-site AISC2 US$m $373 $411 $645
Initial Capex US$m $152 $250 $10
Total Capex US$m $180 $313 $26
After-tax NPV5% US$m $223 $360 $111
After-tax NPV8% US$m $187 $298 $86
After-tax IRR % 44% 39% 253%
Gold Price Assumption US$/oz $1,250 $1,250 $1,250
>39%After-tax IRR for each of Kirazlı, Ağı Dağı & Çamyurt1
Low cost, high return growth

28
Quartz Mountain
Location: Oregon, United States
Ownership: Right to earn a 100% interest4
Stage: Advanced Exploration
Esperanza
Location: Morelos State, Mexico
Ownership: 100% interest
Stage: Development
Operation: Open pit, heap leach
Development: Lynn Lake, Esperanza & Quartz Mountain
1 Please refer to Cautionary Notes on non-GAAP Measures and Additional GAAP Measures.2 Historic column recovery tests for gold at Quartz Mountain varied between 74% and 88% for the felsic rock hosted mineralization; see Orsa Ventures press release dated February 12, 20133 See mineral reserve and resource estimates and associated footnotes in appendix.4 Additional C$3m due on completion of feasibility study & C$15m or 2% NSR upon successful permitting
Lynn Lake
Location: Manitoba, Canada
Ownership: 100% interest
Stage: Feasibility
Operation: Open pit
Tonnes (000)
Grade (g/t Au)
oz Au (000)
M&I Resources3 40,303 2.03 2,629
Inferred Resources 50,704 1.28 2,089
• Located in highly-prospective Lynn Lake Mining District
• High grade, open pit with significant exploration potential
• Existing infrastructure in place
• Low cost hydroelectric power
• Feasibility study expected Q4 2017
Tonnes Grade Oz Au
(000) (g/t Au) (g/t Ag) (000 Au) (000 Ag)
M&I3 Resources 34,352 0.98 8.09 1,083 8,936
Inf. Resources 718 0.80 15.04 18 347
Tonnes Grade Oz Au
(000) (g/t Au) (000 Au)
M&I Resources3 12,156 0.87 339
Inferred Resources 39,205 0.91 1,147
• Excellent infrastructure; low technical risk
• Low capital intensity & operating costs
• Average annual production potential > 100k oz
• AISC expected to be lowest quartile1
• Located on northern extension of prolific Basin & Range Province of Nevada
• Low strip ratio, favourable metallurgy2
• Acquisition cost $3.5m
29
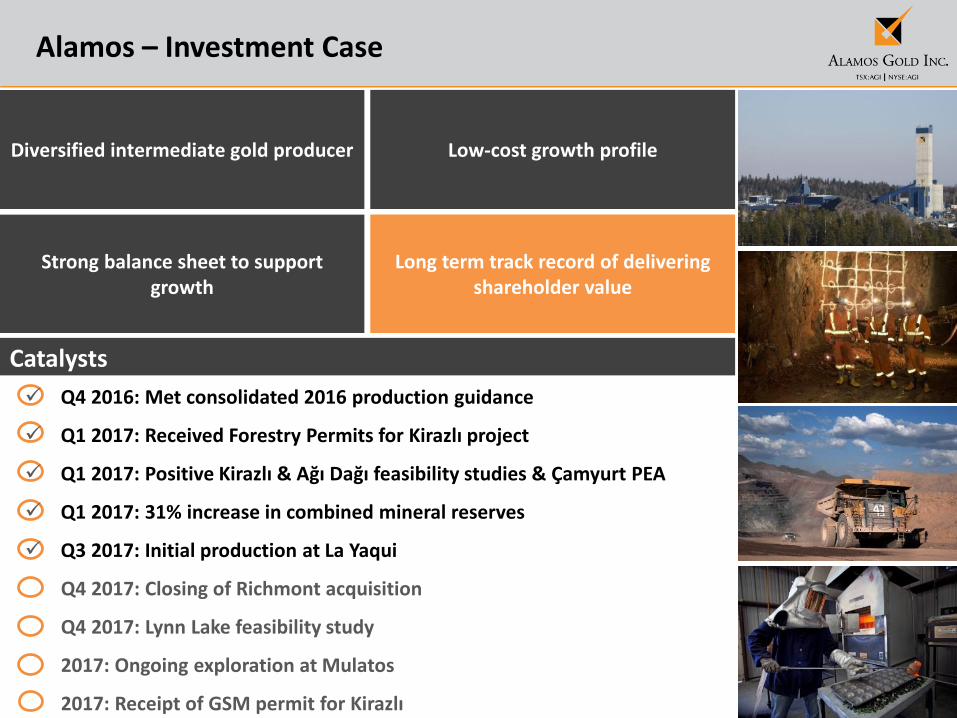
Alamos – Investment Case
Catalysts
Diversified intermediate gold producer Low-cost growth profile
Strong balance sheet to support growth
Long term track record of delivering shareholder value
✓ Q4 2016: Met consolidated 2016 production guidance
✓ Q1 2017: Received Forestry Permits for Kirazlı project
✓ Q1 2017: Positive Kirazlı & Ağı Dağı feasibility studies & Çamyurt PEA
✓ Q1 2017: 31% increase in combined mineral reserves
✓ Q3 2017: Initial production at La Yaqui
Q4 2017: Closing of Richmont acquisition
Q4 2017: Lynn Lake feasibility study
2017: Ongoing exploration at Mulatos
2017: Receipt of GSM permit for Kirazlı
30
Appendices

31
Board of Directors and Executive and Management Team
Board of Directors
Executive and Management Team
Paul J. Murphy John A.
McCluskey Mark J. Daniel
Patrick D. Downey
David Fleck David GowerClaire M. C.
KennedyRonald E. Smith Kenneth Stowe
Chairman Director Director Director Director Director Director Director Director
John A. McCluskey Jamie Porter Peter MacPhail Christine Barwell Chris Bostwick Luis Chavez
President and CEO Chief Financial Officer Chief Operating Officer VP, Human Resources VP, Technical Services Senior VP, Mexico
Andrew Cormier Nils Engelstad Greg Fisher Aoife McGrath Scott Parsons Colin Webster
VP, Development & Construction VP, General Counsel VP, Finance VP, Exploration VP, Investor Relations VP Sustainability & External Affairs
32
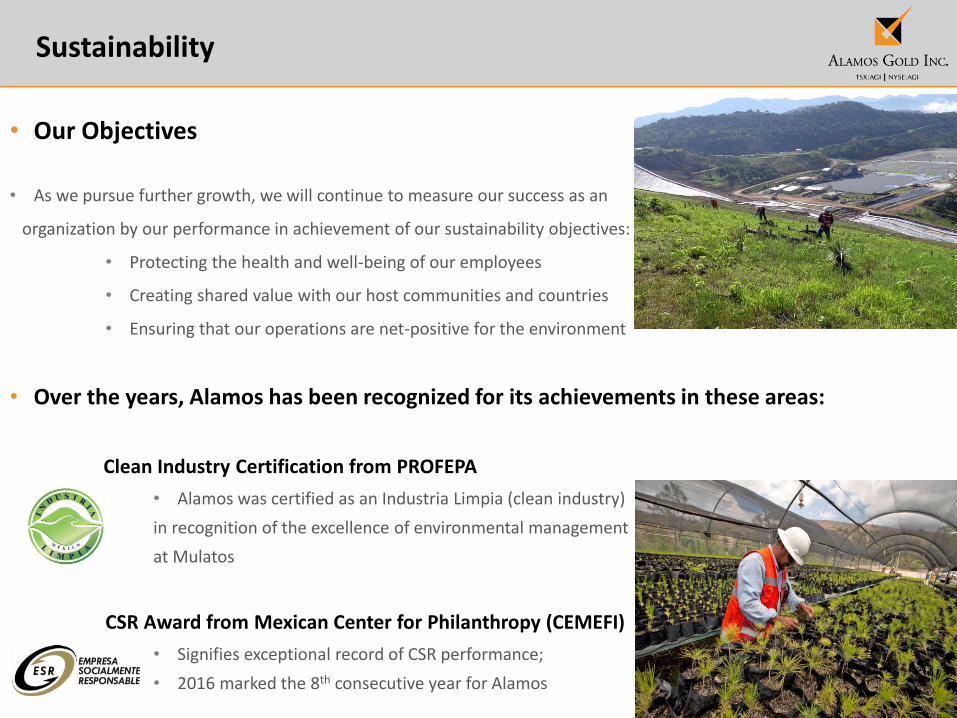
Sustainability
• Our Objectives
• As we pursue further growth, we will continue to measure our success as an
organization by our performance in achievement of our sustainability objectives:
• Protecting the health and well-being of our employees
• Creating shared value with our host communities and countries
• Ensuring that our operations are net-positive for the environment
• Over the years, Alamos has been recognized for its achievements in these areas:
Clean Industry Certification from PROFEPA
• Alamos was certified as an Industria Limpia (clean industry)
in recognition of the excellence of environmental management
at Mulatos
CSR Award from Mexican Center for Philanthropy (CEMEFI)
• Signifies exceptional record of CSR performance;
• 2016 marked the 8th consecutive year for Alamos
33
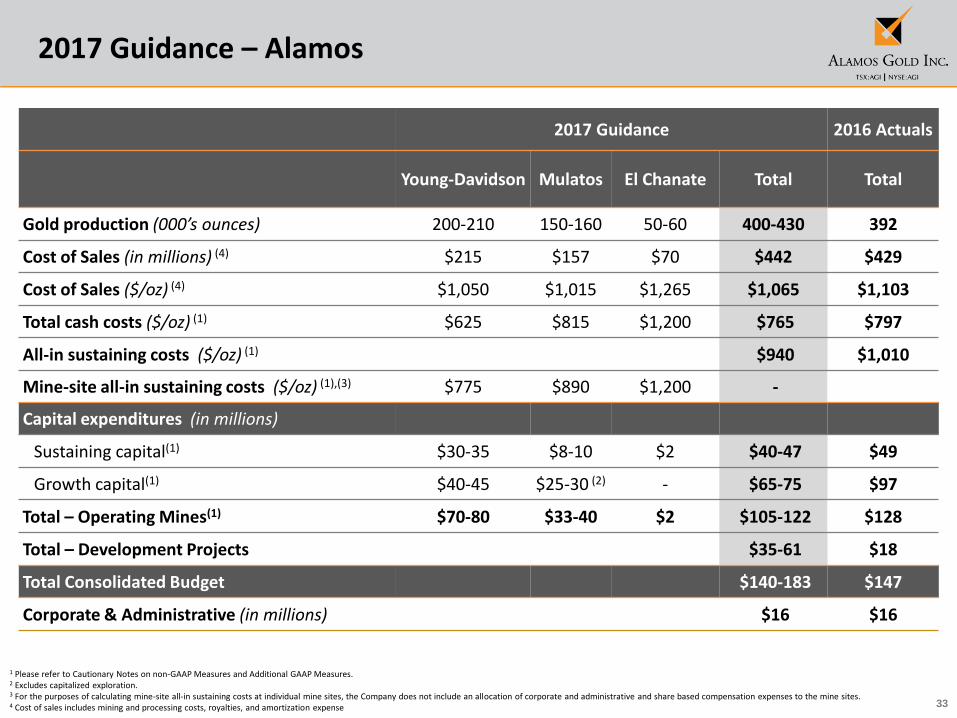
1 Please refer to Cautionary Notes on non-GAAP Measures and Additional GAAP Measures. 2 Excludes capitalized exploration.3 For the purposes of calculating mine-site all-in sustaining costs at individual mine sites, the Company does not include an allocation of corporate and administrative and share based compensation expenses to the mine sites.4 Cost of sales includes mining and processing costs, royalties, and amortization expense
2017 Guidance – Alamos
2017 Guidance 2016 Actuals
Young-Davidson Mulatos El Chanate Total Total
Gold production (000’s ounces) 200-210 150-160 50-60 400-430 392
Cost of Sales (in millions) (4) $215 $157 $70 $442 $429
Cost of Sales ($/oz) (4) $1,050 $1,015 $1,265 $1,065 $1,103
Total cash costs ($/oz) (1) $625 $815 $1,200 $765 $797
All-in sustaining costs ($/oz) (1) $940 $1,010
Mine-site all-in sustaining costs ($/oz) (1),(3) $775 $890 $1,200 -
Capital expenditures (in millions)
Sustaining capital(1) $30-35 $8-10 $2 $40-47 $49
Growth capital(1) $40-45 $25-30 (2) - $65-75 $97
Total – Operating Mines(1) $70-80 $33-40 $2 $105-122 $128
Total – Development Projects $35-61 $18
Total Consolidated Budget $140-183 $147
Corporate & Administrative (in millions) $16 $16
34
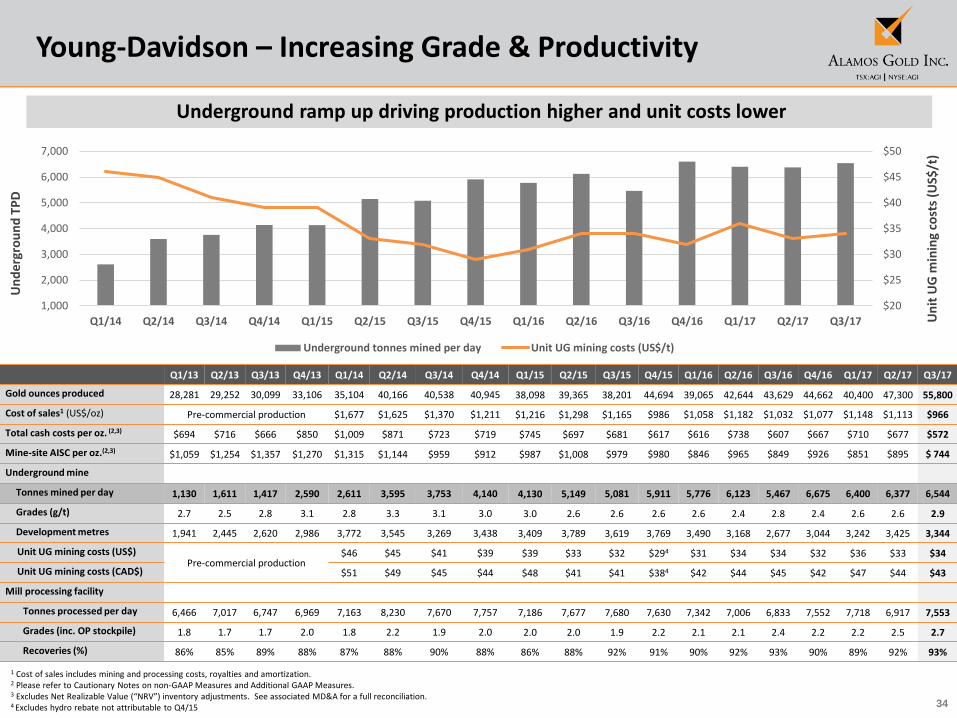
Young-Davidson – Increasing Grade & Productivity
1 Cost of sales includes mining and processing costs, royalties and amortization.2 Please refer to Cautionary Notes on non-GAAP Measures and Additional GAAP Measures.3 Excludes Net Realizable Value (“NRV”) inventory adjustments. See associated MD&A for a full reconciliation.4 Excludes hydro rebate not attributable to Q4/15
Underground ramp up driving production higher and unit costs lower
Q1/13 Q2/13 Q3/13 Q4/13 Q1/14 Q2/14 Q3/14 Q4/14 Q1/15 Q2/15 Q3/15 Q4/15 Q1/16 Q2/16 Q3/16 Q4/16 Q1/17 Q2/17 Q3/17
Gold ounces produced 28,281 29,252 30,099 33,106 35,104 40,166 40,538 40,945 38,098 39,365 38,201 44,694 39,065 42,644 43,629 44,662 40,400 47,300 55,800
Cost of sales1 (US$/oz) Pre-commercial production $1,677 $1,625 $1,370 $1,211 $1,216 $1,298 $1,165 $986 $1,058 $1,182 $1,032 $1,077 $1,148 $1,113 $966
Total cash costs per oz. (2,3) $694 $716 $666 $850 $1,009 $871 $723 $719 $745 $697 $681 $617 $616 $738 $607 $667 $710 $677 $572
Mine-site AISC per oz.(2,3) $1,059 $1,254 $1,357 $1,270 $1,315 $1,144 $959 $912 $987 $1,008 $979 $980 $846 $965 $849 $926 $851 $895 $ 744
Underground mine
Tonnes mined per day 1,130 1,611 1,417 2,590 2,611 3,595 3,753 4,140 4,130 5,149 5,081 5,911 5,776 6,123 5,467 6,675 6,400 6,377 6,544
Grades (g/t) 2.7 2.5 2.8 3.1 2.8 3.3 3.1 3.0 3.0 2.6 2.6 2.6 2.6 2.4 2.8 2.4 2.6 2.6 2.9
Development metres 1,941 2,445 2,620 2,986 3,772 3,545 3,269 3,438 3,409 3,789 3,619 3,769 3,490 3,168 2,677 3,044 3,242 3,425 3,344
Unit UG mining costs (US$)Pre-commercial production
$46 $45 $41 $39 $39 $33 $32 $294 $31 $34 $34 $32 $36 $33 $34
Unit UG mining costs (CAD$) $51 $49 $45 $44 $48 $41 $41 $384 $42 $44 $45 $42 $47 $44 $43
Mill processing facility
Tonnes processed per day 6,466 7,017 6,747 6,969 7,163 8,230 7,670 7,757 7,186 7,677 7,680 7,630 7,342 7,006 6,833 7,552 7,718 6,917 7,553
Grades (inc. OP stockpile) 1.8 1.7 1.7 2.0 1.8 2.2 1.9 2.0 2.0 2.0 1.9 2.2 2.1 2.1 2.4 2.2 2.2 2.5 2.7
Recoveries (%) 86% 85% 89% 88% 87% 88% 90% 88% 86% 88% 92% 91% 90% 92% 93% 90% 89% 92% 93%
$20
$25
$30
$35
$40
$45
$50
1,000
2,000
3,000
4,000
5,000
6,000
7,000
Q1/14 Q2/14 Q3/14 Q4/14 Q1/15 Q2/15 Q3/15 Q4/15 Q1/16 Q2/16 Q3/16 Q4/16 Q1/17 Q2/17 Q3/17
Underground tonnes mined per day Unit UG mining costs (US$/t)
Un
der
gro
un
d T
PD
Un
it U
G m
inin
g co
sts
(US$
/t)

35
2016 2017 2018 2019
✓ Commissioning of MCM shaft
✓ Transition to 100% owner development
✓ Ramp up to 7,000 tpd
✓ Raise boring of lower NG shaft
✓ Completion of MCM waste pass
• Shaft bottom infrastructure
• Northgate shaft hoisting from 8900L
Young-Davidson – Development Schedule
Please refer to Cautionary Notes on non-GAAP Measures and Additional GAAP Measures.
Declining capital intensity
36
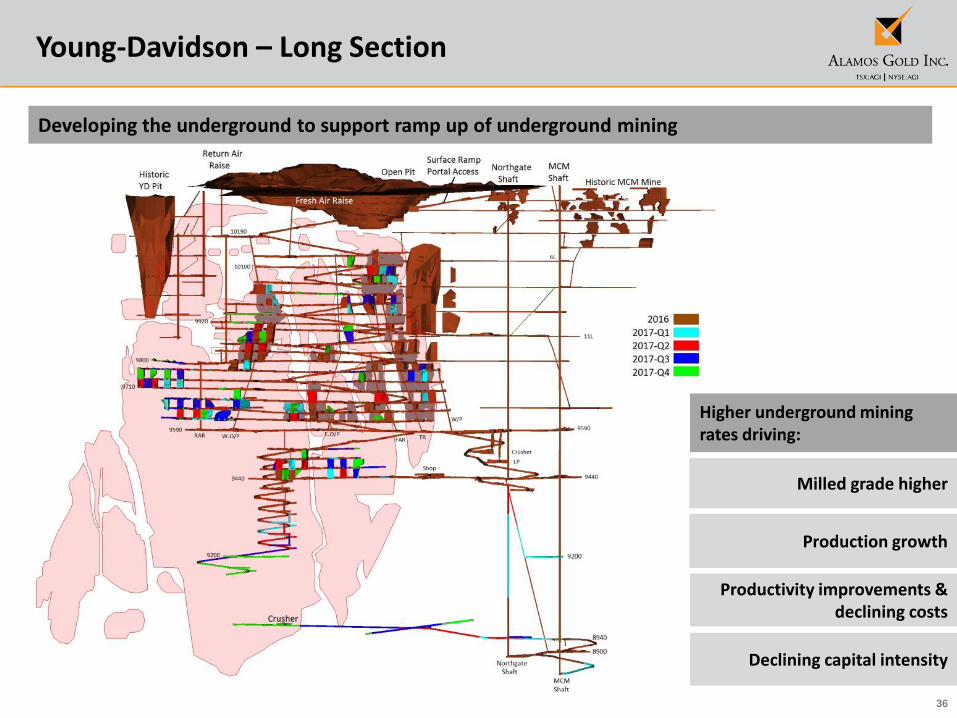
Young-Davidson – Long Section
Productivity improvements & declining costs
Developing the underground to support ramp up of underground mining
Milled grade higher
Declining capital intensity
Higher underground mining rates driving:
Production growth
37
Mulatos District
38
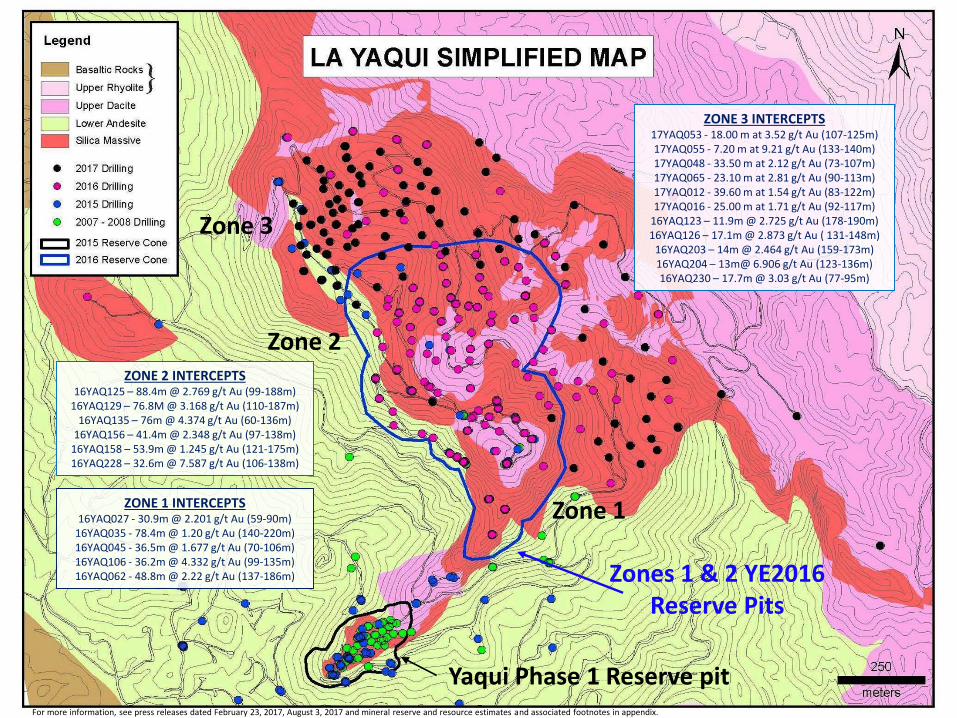
Zone 3
Zone 2
Zone 1
Zones 1 & 2 YE2016 Reserve Pits
ZONE 3 INTERCEPTS17YAQ053 - 18.00 m at 3.52 g/t Au (107-125m)17YAQ055 - 7.20 m at 9.21 g/t Au (133-140m)17YAQ048 - 33.50 m at 2.12 g/t Au (73-107m)17YAQ065 - 23.10 m at 2.81 g/t Au (90-113m)17YAQ012 - 39.60 m at 1.54 g/t Au (83-122m)17YAQ016 - 25.00 m at 1.71 g/t Au (92-117m)
16YAQ123 – 11.9m @ 2.725 g/t Au (178-190m)16YAQ126 – 17.1m @ 2.873 g/t Au ( 131-148m)
16YAQ203 – 14m @ 2.464 g/t Au (159-173m)16YAQ204 – 13m@ 6.906 g/t Au (123-136m)16YAQ230 – 17.7m @ 3.03 g/t Au (77-95m)
ZONE 2 INTERCEPTS16YAQ125 – 88.4m @ 2.769 g/t Au (99-188m)
16YAQ129 – 76.8M @ 3.168 g/t Au (110-187m)16YAQ135 – 76m @ 4.374 g/t Au (60-136m)
16YAQ156 – 41.4m @ 2.348 g/t Au (97-138m)16YAQ158 – 53.9m @ 1.245 g/t Au (121-175m)16YAQ228 – 32.6m @ 7.587 g/t Au (106-138m)
ZONE 1 INTERCEPTS16YAQ027 - 30.9m @ 2.201 g/t Au (59-90m)
16YAQ035 - 78.4m @ 1.20 g/t Au (140-220m)16YAQ045 - 36.5m @ 1.677 g/t Au (70-106m)16YAQ106 - 36.2m @ 4.332 g/t Au (99-135m)16YAQ062 - 48.8m @ 2.22 g/t Au (137-186m)
Yaqui Phase 1 Reserve pit For more information, see press releases dated February 23, 2017, August 3, 2017 and mineral reserve and resource estimates and associated footnotes in appendix.
39
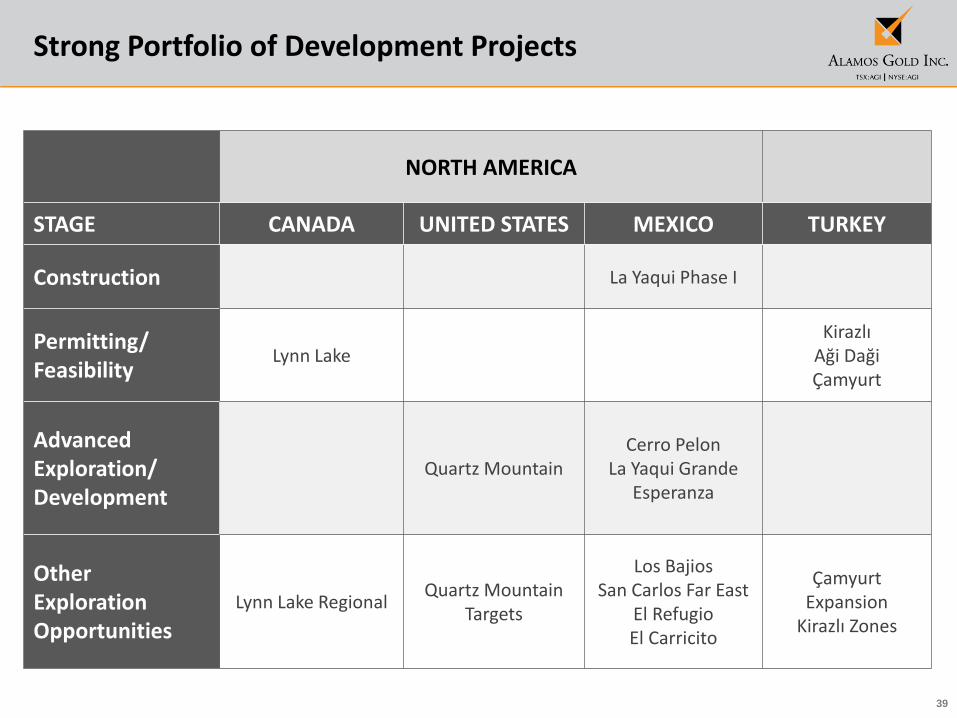
Strong Portfolio of Development Projects
NORTH AMERICA
STAGE CANADA UNITED STATES MEXICO TURKEY
Construction La Yaqui Phase I
Permitting/Feasibility
Lynn LakeKirazlı
Aği DağiÇamyurt
Advanced Exploration/Development
Quartz MountainCerro Pelon
La Yaqui GrandeEsperanza
OtherExplorationOpportunities
Lynn Lake RegionalQuartz Mountain
Targets
Los BajiosSan Carlos Far East
El RefugioEl Carricito
Çamyurt Expansion
Kirazlı Zones
40
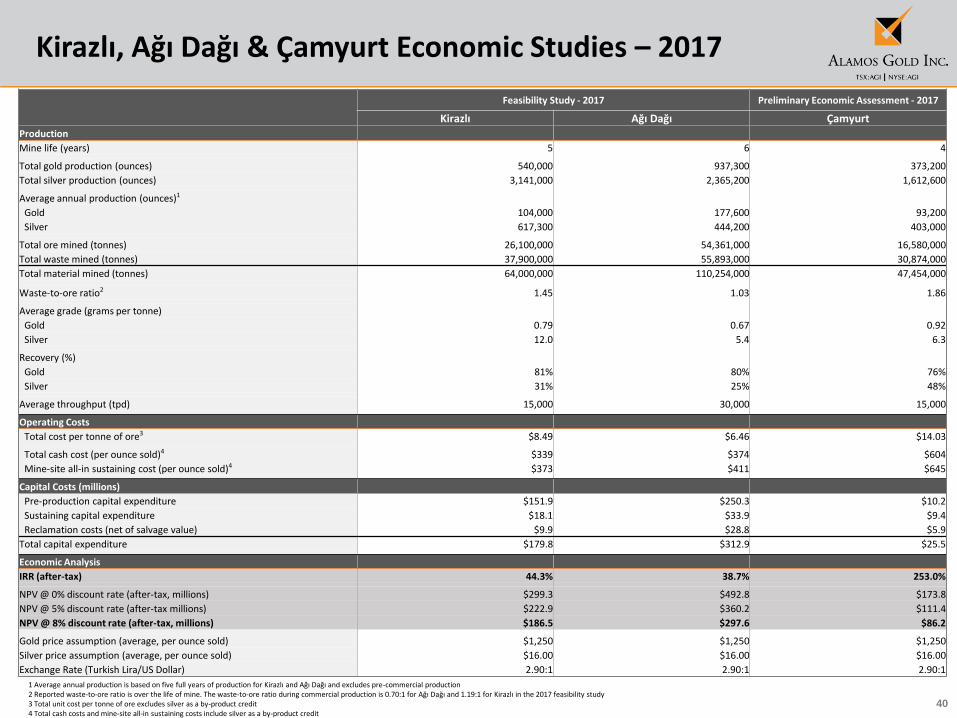
Kirazlı, Ağı Dağı & Çamyurt Economic Studies – 2017
Feasibility Study - 2017 Preliminary Economic Assessment - 2017
Kirazlı Ağı Dağı ÇamyurtProduction
Mine life (years) 5 6 4
Total gold production (ounces) 540,000 937,300 373,200
Total silver production (ounces) 3,141,000 2,365,200 1,612,600
Average annual production (ounces)1
Gold 104,000 177,600 93,200
Silver 617,300 444,200 403,000
Total ore mined (tonnes) 26,100,000 54,361,000 16,580,000
Total waste mined (tonnes) 37,900,000 55,893,000 30,874,000
Total material mined (tonnes) 64,000,000 110,254,000 47,454,000
Waste-to-ore ratio2 1.45 1.03 1.86
Average grade (grams per tonne)
Gold 0.79 0.67 0.92
Silver 12.0 5.4 6.3
Recovery (%)
Gold 81% 80% 76%
Silver 31% 25% 48%
Average throughput (tpd) 15,000 30,000 15,000
Operating Costs
Total cost per tonne of ore3 $8.49 $6.46 $14.03
Total cash cost (per ounce sold)4 $339 $374 $604
Mine-site all-in sustaining cost (per ounce sold)4 $373 $411 $645
Capital Costs (millions)
Pre-production capital expenditure $151.9 $250.3 $10.2
Sustaining capital expenditure $18.1 $33.9 $9.4
Reclamation costs (net of salvage value) $9.9 $28.8 $5.9
Total capital expenditure $179.8 $312.9 $25.5
Economic Analysis
IRR (after-tax) 44.3% 38.7% 253.0%
NPV @ 0% discount rate (after-tax, millions) $299.3 $492.8 $173.8
NPV @ 5% discount rate (after-tax millions) $222.9 $360.2 $111.4
NPV @ 8% discount rate (after-tax, millions) $186.5 $297.6 $86.2
Gold price assumption (average, per ounce sold) $1,250 $1,250 $1,250
Silver price assumption (average, per ounce sold) $16.00 $16.00 $16.00
Exchange Rate (Turkish Lira/US Dollar) 2.90:1 2.90:1 2.90:1
1 Average annual production is based on five full years of production for Kirazlı and Ağı Dağı and excludes pre-commercial production2 Reported waste-to-ore ratio is over the life of mine. The waste-to-ore ratio during commercial production is 0.70:1 for Ağı Dağı and 1.19:1 for Kirazlı in the 2017 feasibility study3 Total unit cost per tonne of ore excludes silver as a by-product credit 4 Total cash costs and mine-site all-in sustaining costs include silver as a by-product credit
41
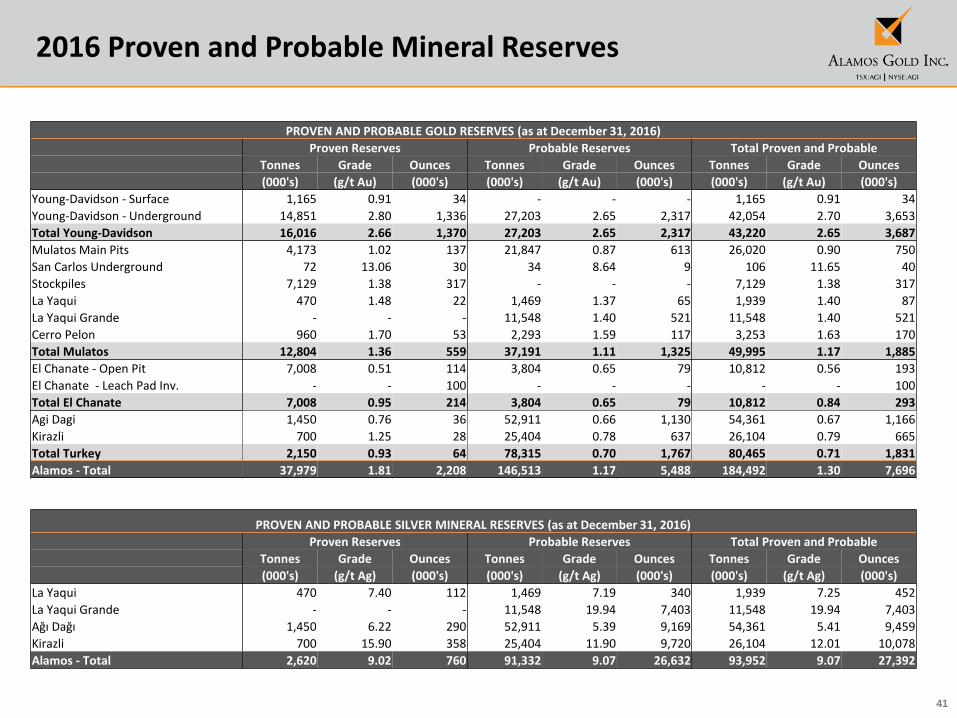
2016 Proven and Probable Mineral Reserves
PROVEN AND PROBABLE GOLD RESERVES (as at December 31, 2016)
Proven Reserves Probable Reserves Total Proven and Probable
Tonnes Grade Ounces Tonnes Grade Ounces Tonnes Grade Ounces
(000's) (g/t Au) (000's) (000's) (g/t Au) (000's) (000's) (g/t Au) (000's)
Young-Davidson - Surface 1,165 0.91 34 - - - 1,165 0.91 34
Young-Davidson - Underground 14,851 2.80 1,336 27,203 2.65 2,317 42,054 2.70 3,653
Total Young-Davidson 16,016 2.66 1,370 27,203 2.65 2,317 43,220 2.65 3,687
Mulatos Main Pits 4,173 1.02 137 21,847 0.87 613 26,020 0.90 750
San Carlos Underground 72 13.06 30 34 8.64 9 106 11.65 40
Stockpiles 7,129 1.38 317 - - - 7,129 1.38 317
La Yaqui 470 1.48 22 1,469 1.37 65 1,939 1.40 87
La Yaqui Grande - - - 11,548 1.40 521 11,548 1.40 521
Cerro Pelon 960 1.70 53 2,293 1.59 117 3,253 1.63 170
Total Mulatos 12,804 1.36 559 37,191 1.11 1,325 49,995 1.17 1,885
El Chanate - Open Pit 7,008 0.51 114 3,804 0.65 79 10,812 0.56 193
El Chanate - Leach Pad Inv. - - 100 - - - - - 100
Total El Chanate 7,008 0.95 214 3,804 0.65 79 10,812 0.84 293
Agi Dagi 1,450 0.76 36 52,911 0.66 1,130 54,361 0.67 1,166
Kirazli 700 1.25 28 25,404 0.78 637 26,104 0.79 665
Total Turkey 2,150 0.93 64 78,315 0.70 1,767 80,465 0.71 1,831
Alamos - Total 37,979 1.81 2,208 146,513 1.17 5,488 184,492 1.30 7,696
PROVEN AND PROBABLE SILVER MINERAL RESERVES (as at December 31, 2016)
Proven Reserves Probable Reserves Total Proven and Probable
Tonnes Grade Ounces Tonnes Grade Ounces Tonnes Grade Ounces
(000's) (g/t Ag) (000's) (000's) (g/t Ag) (000's) (000's) (g/t Ag) (000's)
La Yaqui 470 7.40 112 1,469 7.19 340 1,939 7.25 452
La Yaqui Grande - - - 11,548 19.94 7,403 11,548 19.94 7,403
Ağı Dağı 1,450 6.22 290 52,911 5.39 9,169 54,361 5.41 9,459
Kirazli 700 15.90 358 25,404 11.90 9,720 26,104 12.01 10,078
Alamos - Total 2,620 9.02 760 91,332 9.07 26,632 93,952 9.07 27,392
42
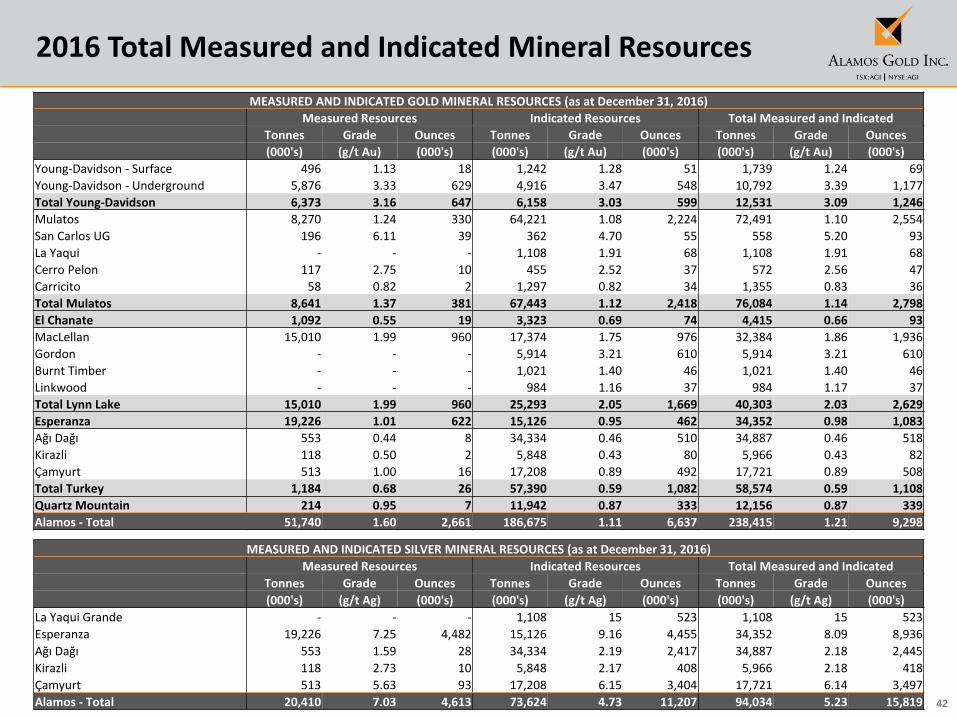
2016 Total Measured and Indicated Mineral Resources
MEASURED AND INDICATED GOLD MINERAL RESOURCES (as at December 31, 2016)
Measured Resources Indicated Resources Total Measured and Indicated
Tonnes Grade Ounces Tonnes Grade Ounces Tonnes Grade Ounces
(000's) (g/t Au) (000's) (000's) (g/t Au) (000's) (000's) (g/t Au) (000's)
Young-Davidson - Surface 496 1.13 18 1,242 1.28 51 1,739 1.24 69
Young-Davidson - Underground 5,876 3.33 629 4,916 3.47 548 10,792 3.39 1,177
Total Young-Davidson 6,373 3.16 647 6,158 3.03 599 12,531 3.09 1,246
Mulatos 8,270 1.24 330 64,221 1.08 2,224 72,491 1.10 2,554
San Carlos UG 196 6.11 39 362 4.70 55 558 5.20 93
La Yaqui - - - 1,108 1.91 68 1,108 1.91 68
Cerro Pelon 117 2.75 10 455 2.52 37 572 2.56 47
Carricito 58 0.82 2 1,297 0.82 34 1,355 0.83 36
Total Mulatos 8,641 1.37 381 67,443 1.12 2,418 76,084 1.14 2,798
El Chanate 1,092 0.55 19 3,323 0.69 74 4,415 0.66 93
MacLellan 15,010 1.99 960 17,374 1.75 976 32,384 1.86 1,936
Gordon - - - 5,914 3.21 610 5,914 3.21 610
Burnt Timber - - - 1,021 1.40 46 1,021 1.40 46
Linkwood - - - 984 1.16 37 984 1.17 37
Total Lynn Lake 15,010 1.99 960 25,293 2.05 1,669 40,303 2.03 2,629
Esperanza 19,226 1.01 622 15,126 0.95 462 34,352 0.98 1,083
Ağı Dağı 553 0.44 8 34,334 0.46 510 34,887 0.46 518
Kirazli 118 0.50 2 5,848 0.43 80 5,966 0.43 82
Çamyurt 513 1.00 16 17,208 0.89 492 17,721 0.89 508
Total Turkey 1,184 0.68 26 57,390 0.59 1,082 58,574 0.59 1,108
Quartz Mountain 214 0.95 7 11,942 0.87 333 12,156 0.87 339
Alamos - Total 51,740 1.60 2,661 186,675 1.11 6,637 238,415 1.21 9,298
MEASURED AND INDICATED SILVER MINERAL RESOURCES (as at December 31, 2016)
Measured Resources Indicated Resources Total Measured and Indicated
Tonnes Grade Ounces Tonnes Grade Ounces Tonnes Grade Ounces
(000's) (g/t Ag) (000's) (000's) (g/t Ag) (000's) (000's) (g/t Ag) (000's)
La Yaqui Grande - - - 1,108 15 523 1,108 15 523
Esperanza 19,226 7.25 4,482 15,126 9.16 4,455 34,352 8.09 8,936
Ağı Dağı 553 1.59 28 34,334 2.19 2,417 34,887 2.18 2,445
Kirazli 118 2.73 10 5,848 2.17 408 5,966 2.18 418
Çamyurt 513 5.63 93 17,208 6.15 3,404 17,721 6.14 3,497
Alamos - Total 20,410 7.03 4,613 73,624 4.73 11,207 94,034 5.23 15,819
43
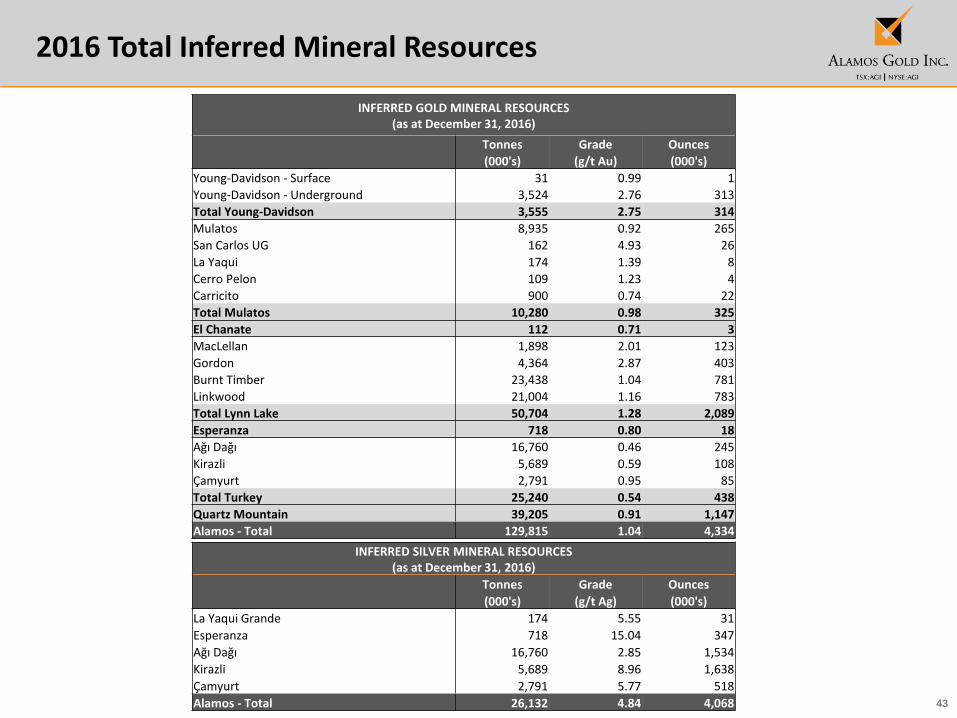
2016 Total Inferred Mineral Resources
INFERRED GOLD MINERAL RESOURCES (as at December 31, 2016)
Tonnes Grade Ounces
(000's) (g/t Au) (000's)
Young-Davidson - Surface 31 0.99 1
Young-Davidson - Underground 3,524 2.76 313
Total Young-Davidson 3,555 2.75 314
Mulatos 8,935 0.92 265
San Carlos UG 162 4.93 26
La Yaqui 174 1.39 8
Cerro Pelon 109 1.23 4
Carricito 900 0.74 22
Total Mulatos 10,280 0.98 325
El Chanate 112 0.71 3
MacLellan 1,898 2.01 123
Gordon 4,364 2.87 403
Burnt Timber 23,438 1.04 781
Linkwood 21,004 1.16 783
Total Lynn Lake 50,704 1.28 2,089
Esperanza 718 0.80 18
Ağı Dağı 16,760 0.46 245
Kirazli 5,689 0.59 108
Çamyurt 2,791 0.95 85
Total Turkey 25,240 0.54 438
Quartz Mountain 39,205 0.91 1,147
Alamos - Total 129,815 1.04 4,334
INFERRED SILVER MINERAL RESOURCES (as at December 31, 2016)
Tonnes Grade Ounces
(000's) (g/t Ag) (000's)
La Yaqui Grande 174 5.55 31
Esperanza 718 15.04 347
Ağı Dağı 16,760 2.85 1,534
Kirazli 5,689 8.96 1,638
Çamyurt 2,791 5.77 518
Alamos - Total 26,132 4.84 4,068
44
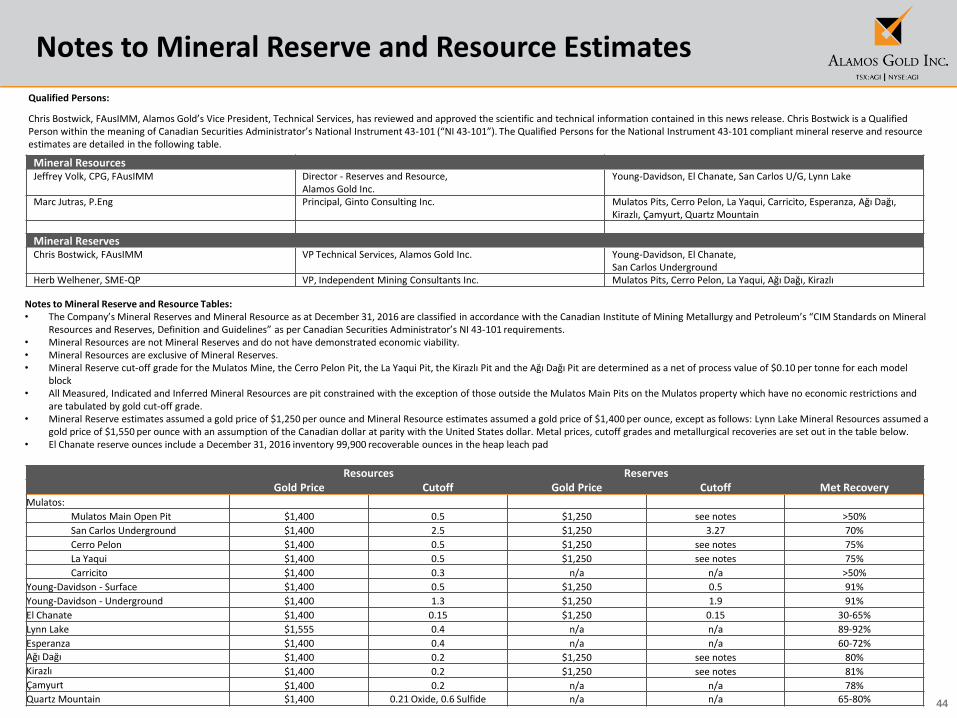
Notes to Mineral Reserve and Resource Estimates
Notes to Mineral Reserve and Resource Tables:• The Company’s Mineral Reserves and Mineral Resource as at December 31, 2016 are classified in accordance with the Canadian Institute of Mining Metallurgy and Petroleum’s “CIM Standards on Mineral
Resources and Reserves, Definition and Guidelines” as per Canadian Securities Administrator’s NI 43-101 requirements. • Mineral Resources are not Mineral Reserves and do not have demonstrated economic viability.• Mineral Resources are exclusive of Mineral Reserves.• Mineral Reserve cut-off grade for the Mulatos Mine, the Cerro Pelon Pit, the La Yaqui Pit, the Kirazlı Pit and the Ağı Dağı Pit are determined as a net of process value of $0.10 per tonne for each model
block• All Measured, Indicated and Inferred Mineral Resources are pit constrained with the exception of those outside the Mulatos Main Pits on the Mulatos property which have no economic restrictions and
are tabulated by gold cut-off grade.• Mineral Reserve estimates assumed a gold price of $1,250 per ounce and Mineral Resource estimates assumed a gold price of $1,400 per ounce, except as follows: Lynn Lake Mineral Resources assumed a
gold price of $1,550 per ounce with an assumption of the Canadian dollar at parity with the United States dollar. Metal prices, cutoff grades and metallurgical recoveries are set out in the table below.• El Chanate reserve ounces include a December 31, 2016 inventory 99,900 recoverable ounces in the heap leach pad
Qualified Persons:
Chris Bostwick, FAusIMM, Alamos Gold’s Vice President, Technical Services, has reviewed and approved the scientific and technical information contained in this news release. Chris Bostwick is a Qualified Person within the meaning of Canadian Securities Administrator’s National Instrument 43-101 (“NI 43-101”). The Qualified Persons for the National Instrument 43-101 compliant mineral reserve and resource estimates are detailed in the following table.
Mineral ResourcesJeffrey Volk, CPG, FAusIMM Director - Reserves and Resource,
Alamos Gold Inc.Young-Davidson, El Chanate, San Carlos U/G, Lynn Lake
Marc Jutras, P.Eng Principal, Ginto Consulting Inc. Mulatos Pits, Cerro Pelon, La Yaqui, Carricito, Esperanza, Ağı Dağı,Kirazlı, Çamyurt, Quartz Mountain
Mineral ReservesChris Bostwick, FAusIMM VP Technical Services, Alamos Gold Inc. Young-Davidson, El Chanate,
San Carlos UndergroundHerb Welhener, SME-QP VP, Independent Mining Consultants Inc. Mulatos Pits, Cerro Pelon, La Yaqui, Ağı Dağı, Kirazlı
Resources ReservesGold Price Cutoff Gold Price Cutoff Met Recovery
Mulatos:
Mulatos Main Open Pit $1,400 0.5 $1,250 see notes >50%
San Carlos Underground $1,400 2.5 $1,250 3.27 70%
Cerro Pelon $1,400 0.5 $1,250 see notes 75%
La Yaqui $1,400 0.5 $1,250 see notes 75%
Carricito $1,400 0.3 n/a n/a >50%
Young-Davidson - Surface $1,400 0.5 $1,250 0.5 91%
Young-Davidson - Underground $1,400 1.3 $1,250 1.9 91%
El Chanate $1,400 0.15 $1,250 0.15 30-65%
Lynn Lake $1,555 0.4 n/a n/a 89-92%
Esperanza $1,400 0.4 n/a n/a 60-72%
Ağı Dağı $1,400 0.2 $1,250 see notes 80%
Kirazlı $1,400 0.2 $1,250 see notes 81%
Çamyurt $1,400 0.2 n/a n/a 78%
Quartz Mountain $1,400 0.21 Oxide, 0.6 Sulfide n/a n/a 65-80%
45
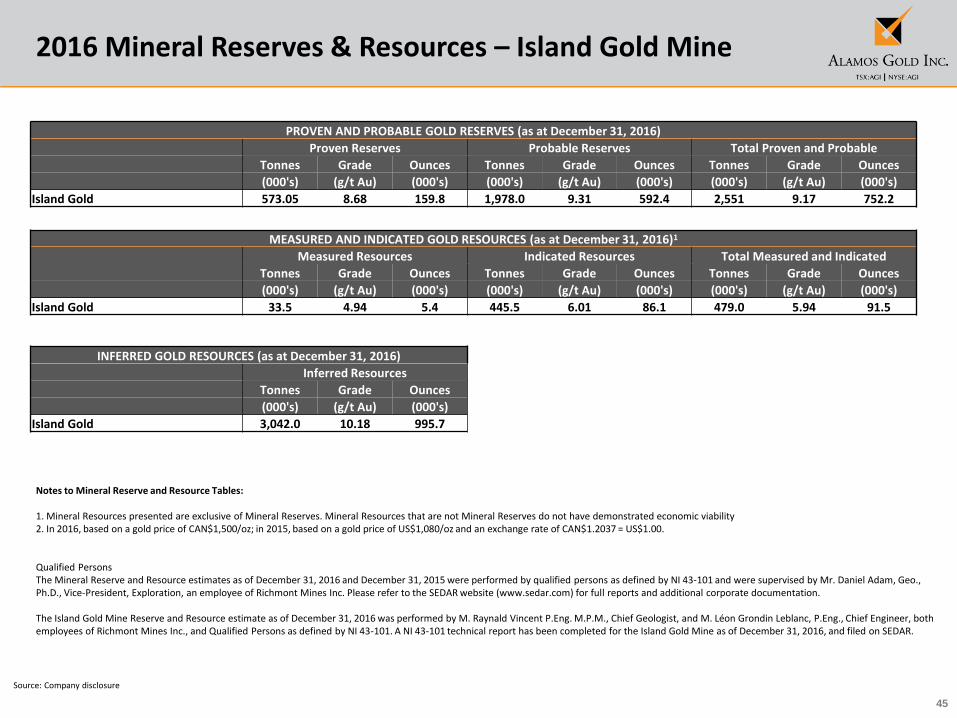
2016 Mineral Reserves & Resources – Island Gold Mine
PROVEN AND PROBABLE GOLD RESERVES (as at December 31, 2016)
Proven Reserves Probable Reserves Total Proven and Probable
Tonnes Grade Ounces Tonnes Grade Ounces Tonnes Grade Ounces
(000's) (g/t Au) (000's) (000's) (g/t Au) (000's) (000's) (g/t Au) (000's)
Island Gold 573.05 8.68 159.8 1,978.0 9.31 592.4 2,551 9.17 752.2
MEASURED AND INDICATED GOLD RESOURCES (as at December 31, 2016)1
Measured Resources Indicated Resources Total Measured and Indicated
Tonnes Grade Ounces Tonnes Grade Ounces Tonnes Grade Ounces
(000's) (g/t Au) (000's) (000's) (g/t Au) (000's) (000's) (g/t Au) (000's)
Island Gold 33.5 4.94 5.4 445.5 6.01 86.1 479.0 5.94 91.5
INFERRED GOLD RESOURCES (as at December 31, 2016)
Inferred Resources
Tonnes Grade Ounces
(000's) (g/t Au) (000's)
Island Gold 3,042.0 10.18 995.7
Source: Company disclosure
Notes to Mineral Reserve and Resource Tables:
1. Mineral Resources presented are exclusive of Mineral Reserves. Mineral Resources that are not Mineral Reserves do not have demonstrated economic viability2. In 2016, based on a gold price of CAN$1,500/oz; in 2015, based on a gold price of US$1,080/oz and an exchange rate of CAN$1.2037 = US$1.00.
Qualified Persons The Mineral Reserve and Resource estimates as of December 31, 2016 and December 31, 2015 were performed by qualified persons as defined by NI 43-101 and were supervised by Mr. Daniel Adam, Geo., Ph.D., Vice-President, Exploration, an employee of Richmont Mines Inc. Please refer to the SEDAR website (www.sedar.com) for full reports and additional corporate documentation.
The Island Gold Mine Reserve and Resource estimate as of December 31, 2016 was performed by M. Raynald Vincent P.Eng. M.P.M., Chief Geologist, and M. Léon Grondin Leblanc, P.Eng., Chief Engineer, both employees of Richmont Mines Inc., and Qualified Persons as defined by NI 43-101. A NI 43-101 technical report has been completed for the Island Gold Mine as of December 31, 2016, and filed on SEDAR.