airfield concrete pavement smoothness – a handbook
TRANSCRIPT
An IPRF Research Report Innovative Pavement Research Foundation Airport Concrete Pavement Technology Program Report IPRF-01-G-002-02-4 Airfield Concrete Pavement Smoothness – A Handbook
Programs Management Office 5420 Old Orchard Road Skokie, IL 60077 April, 2007
i
An IPRF Research Report Innovative Pavement Research Foundation Airfield Concrete Pavement Technology Program
Report IPRF 01-G-002-02-4 Airfield Concrete Pavement Smoothness - A Reference
Principal Investigator Mr. Tony Gerardi
APR Consultants Inc. 27 Oaklawn Avenue Medway OH 45341
Contributing Authors Mr. Michael Gerardi, APR Consultants Inc. Mr. Dan Freeman, APR Consultants Inc.
Mr. Michael Freeman, APR Consultants Inc. Dr. Robert Otto Rasmussen, P.E., The Transtec Group, Inc.
Dr. George Chang, P.E., The Transtec Group, Inc. Programs Management Office 5420 Old Orchard Road Skokie, IL 60077 April 2007

ii
This report has been prepared by the Innovative Pavement Research Foundation (IPRF) under the American Concrete Pavement Technology Program. Funding is provided by the Federal Aviation Administration (FAA) under Cooperative Agreement Number 01-G-002. Dr. Satish Agrawal is the manager of the Cooperative Agreement. Mr. Jim Lafrenz, P.E., is the Program Manager for the IPRF. The IPRF and the FAA thank the Technical Panel that willingly gave of their expertise and time for the development of this report. They were responsible for the oversight and the technical direction. The names of those individuals on the Technical Panel are as follows: Dr. Gordon Hayhoe FAA WJ Hughes Technical Center Mr. Raymond Zee P.E. Port Authority of NY and NJ Mr. Monte J. Wade P.E. Applied Pavement Technology, Inc. Dr. John Anderson P.E. Tigerbrain Engineering, Inc. Mr. Steve Pembleton P.E. Jacobs Mr. Jim Thomas P.E. The Harper Company
The contents of this report reflect the views of the authors, who are responsible for the facts and the accuracy of the data presented within. The contents do not necessarily reflect the official views of the Federal Aviation Administration. This report does not constitute a standard, specification or regulation.
iii
Acknowledgements The research team would like to acknowledge the contributions of the following individuals.
Mr. Jim Thomas, Mr. Russell Tomlinson, Mr. Subash Reddy Kuchikulla, Mr. Gary Obert, Mr. Dirk Holtman, and Mr. Jerry Voigt who participated in the interview portion of this project.
The Pennsylvania DOT, the Gomaco Corporation and the Harper Co. for their participation at the Cincinnati pavement tests.
Special thanks to the Harper Co. for their assistance during the Cincinnati airfield pavement testing.
Dr. Steve Karamihas, for his assistance in acquiring the profiler roundup data.
The project team would also like to acknowledge that the handbook incorporates the collective experience of a broad range of experts who have, over the years, contributed to the understanding of what it takes to build smooth concrete airfield pavements. In addition, we would like to acknowledge the collective experience of those who have developed successful ways of assessing smoothness.

iv
Table of Contents 1 EXECUTIVE SUMMARY................................................................................................................. 1
2 INTRODUCTION............................................................................................................................... 3 2.1 OVERVIEW OF AVAILABLE PROFILER TYPES .................................................................................... 6 3 CHARACTERISTICS OF OFF-THE-SHELF PROFILER TYPES AND SMOOTHNESS INDICES ....................................................................................................................................................... 7 3.1 NON-CONTACT PROFILERS ............................................................................................................... 7
3.1.1 Lightweight Inertial Profiler................................................................................................... 7 3.1.2 High Speed Inertial Profiler ................................................................................................... 8 3.1.3 Wet or Dry Profiler................................................................................................................. 9
3.2 CONTACT PROFILERS ...................................................................................................................... 10 3.2.1 Slow Speed Profilers – Inclinometers................................................................................... 10 3.2.2 Walking Speed Profilers – Inclinometers ............................................................................. 10 3.2.3 Walking Speed Profilers – External Reference..................................................................... 11
3.3 EXISTING SMOOTHNESS INDICES .................................................................................................... 12 4 THE PROCESS USED FOR EVALUATION OF SURFACE PROFILERS.............................. 12 4.1 EVALUATION CRITERIA .................................................................................................................. 13
4.1.1 Longitudinal Accuracy.......................................................................................................... 14 4.1.2 Measurement Intervals ......................................................................................................... 14 4.1.3 Reproducibility and Repeatability ........................................................................................ 14
4.2 FIELD TESTING................................................................................................................................ 15 4.2.1 Site 1 (FHWA Profiler Roundup).......................................................................................... 15 4.2.2 Site 2 (Cincinnati-Northern Kentucky IAP).......................................................................... 15 4.2.3 Site 3 ..................................................................................................................................... 16 4.2.4 Site 4 ..................................................................................................................................... 16
4.3 COMPARISON OF PROFILERS TO THE PHYSICAL STRAIGHTEDGE ..................................................... 16 4.4 COMPARISON OF CALIFORNIA PROFILOGRAPH TO STRAIGHTEDGE .................................................. 17 5 RESULTS OF THE PROFILER EVALUATION......................................................................... 19 5.1 DUPLICATION OF THE ELEVATION PROFILE .................................................................................... 19 5.2 PROFILER EMULATION OF THE 16-FOOT (4.88 M) STRAIGHTEDGE.................................................. 21
5.2.1 A Method to Display the Measured Results.......................................................................... 28 5.2.2 The Straightedge Smoothness Index (SSI) Defined.............................................................. 29 5.2.3 The Straightedge Smoothness Index (SSI) Computed by Each Profiler Type...................... 30
5.3 OTHER FACTORS CONSIDERED IN PROFILER EVALUATION ............................................................. 30 5.3.1 Transverse Measurements .................................................................................................... 31 5.3.2 Birdbath Detection ............................................................................................................... 31 5.3.3 Measurement of Smoothness in Confined Areas................................................................... 32 5.3.4 Impact of Significant Deviations in Profile .......................................................................... 34 5.3.5 Longitudinal Accuracy.......................................................................................................... 34 5.3.6 Measurement Intervals ......................................................................................................... 34
5.4 SUMMARY OF PROFILER EVALUATION............................................................................................ 35 6 SMOOTHNESS CRITERIA............................................................................................................ 36
7 REFERENCES.................................................................................................................................. 42
8 APPENDIX A: (ENCLOSED CD): SOFTWARE FOR COMPUTING STRAIGHTEDGE SMOOTHNESS INDEX (SSI)................................................................................................................... 44
9 APPENDIX B: DATA FROM KNOWN ROUGH TO KNOWN SMOOTH PAVEMENTS .... 45
10 APPENDIX C: - CONSTRUCTING SMOOTH CONCRETE PAVEMENTS........................... 48

v
10.1 DESIGN AND SPECIFICATION FACTORS ........................................................................................... 48 10.1.1 Smoothness Specifications ............................................................................................... 48 10.1.2 Base, Subbase and Track Line Considerations................................................................ 49 10.1.3 Integration with Other Pavements ................................................................................... 49 10.1.4 Grade and Staking Calculations ...................................................................................... 50 10.1.5 Embedded Items............................................................................................................... 51 10.1.6 Concrete Mixture ............................................................................................................. 51
10.2 CONSTRUCTION FACTORS ............................................................................................................... 52 10.2.1 Educating and Motivating the Work Crew....................................................................... 52 10.2.2 Preparing the Grade........................................................................................................ 53 10.2.3 Setting Up Fixed Forms ................................................................................................... 53 10.2.4 Setting Up and Maintaining a Stringline ......................................................................... 53 10.2.5 Producing Consistent Concrete ....................................................................................... 55 10.2.6 Delivering the Mix ........................................................................................................... 55 10.2.7 Operating the Paving Machine ........................................................................................ 55 10.2.8 Finishing the Surface and Headers.................................................................................. 56 10.2.9 Feedback to the Paving Crew .......................................................................................... 56 10.2.10 Construction with Constraints ......................................................................................... 56
10.3 CONSTRUCTING SMOOTH AIRFIELD PAVEMENTS: FIELD EXPERIENCE............................................ 57

vi
List of Tables TABLE 1. SUMMARY OF RESULTS OF MULTIPLE PASSES BY THE CALIFORNIA PROFILOGRAPH .... 18 TABLE 2. SUMMARY OF SSI CALCULATIONS COMPARING PROFILES ........................................... 30 TABLE 3. A COMPARISON OF THE PROFILER TYPES TESTED .......................................................... 35 TABLE 4. SUMMARY OF TARGET SMOOTHNESS VALUES ............................................................... 41 List of Figures FIGURE 1. USING A 16-FOOT STRAIGHTEDGE ................................................................................. 3 FIGURE 2. PROFILE WITH SMALL BUMPS ON 25-FOOT (7.6 M) INTERVALS ...................................... 5 FIGURE 3. LONG WAVELENGTH RUNWAY ROUGHNESS ................................................................... 5 FIGURE 4. THE CALIFORNIA PROFILOGRAPH .................................................................................. 6 FIGURE 5. TYPICAL LIGHTWEIGHT PROFILER CONFIGURATIONS..................................................... 8 FIGURE 6. THE FAA HIGH OR LOW SPEED PROFILER ....................................................................... 9 FIGURE 7. A WET / DRY PROFILING DEVICE ..................................................................................... 9 FIGURE 8. EXAMPLES OF (SLOW SPEED) INCLINOMETER PROFILERS............................................. 10 FIGURE 9. WALKING SPEED PROFILERS: INCLINOMETER (LEFT) AND EXTERNAL REFERENCE
(RIGHT).................................................................................................................................. 11 FIGURE 10. COMPARISON OF PROFILER TO STRAIGHTEDGE MEASUREMENT................................. 17 FIGURE 11. CALIFORNIA PROFILOGRAPH VS. ROLLING STRAIGHTEDGE........................................ 19 FIGURE 12. LIGHT WEIGHT, WET OR DRY, AND EXTERNAL REFERENCE COMPARED TO A
CONTROL .............................................................................................................................. 20 FIGURE 13. INCLINOMETERAND INERTIAL PROFILER COMPARED TO A CONTROL........................ 21 FIGURE 14. SLOW SPEED INCLINOMETER WITH AND WITHOUT ROD & LEVEL UPDATES............. 22 FIGURE 15. WALKING SPEED INCLINOMETER AND CONTROL ........................................................ 23 FIGURE 16. LIGHTWEIGHT PROFILER AND CONTROL ..................................................................... 24 FIGURE 17. FAA PROFILER (LOW SPEED MODE) AND CONTROL.................................................... 25 FIGURE 18. FAA PROFILER (HIGH SPEED MODE) AND CONTROL ................................................... 26 FIGURE 19. WET OR DRY PROFILER AND CONTROL........................................................................ 27 FIGURE 20. EXTERNAL REFERENCE PROFILER AND CONTROL ....................................................... 28 FIGURE 21. TRANSVERSE PROFILE BY WALKING INCLINOMETER................................................. 32 FIGURE 22. DISTORTION DURING ACCELERATION (16-FOOT STRAIGHTEDGE) .............................. 33 FIGURE 23. DISTORTION DURING ACCELERATION FOR THE 100-FOOT STRAIHGTEDGE .............. 33 FIGURE 24. PROFILER’S CAPACITY TO MEASURE LARGE DEVIATIONS.......................................... 34 FIGURE 25. STRAIGHTEDGE SMOOTHNESS INDEX (SSI) CHART ................................................... 39 FIGURE 26. TYPICAL SSI PLOT USING ENCLOSED CD. (PROFILER ROUNDUP DATA MEASURED
BY FAA HIGH SPEED INERTIAL PROFILER) .......................................................................... 44 FIGURE 27. 25-FOOT STRAIGHTEDGE ASSESSMENT FOR FOUR VERY SMOOTH AIRFIELD
PAVEMENTS........................................................................................................................... 45 FIGURE 28. 25-FOOT STRAIGHTEDGE ASSESSMENT FOR FOUR ROUGH AIRFIELD PAVEMENTS...... 46 FIGURE 29. 25-FOOT STRAIGHTEDGE ASSESSMENT FOR FOUR VERY ROUGH AIRFIELD PAVEMENTS
.............................................................................................................................................. 47 FIGURE 30. COMPARISON CHART FOR BUMP LENGTH VERSES AMPLITUDE ASSESSMENT ............. 47 FIGURE 31. THE BOEING CURVE COMPARING EVENT WAVELENGTH VERSES AMPLITUDE ........... 50 FIGURE 32. REPEATED BUMPS MOST LIKELY CAUSED BY SAGGING STRINGLINE. ......................... 54
vii
Notes to the Reader Acronyms FAA: Federal Aviation Administration
FHWA: Federal Highways Administration
UMTRI: University of Michigan Transportation Research Institute
PI: Profile Index
Definitions Keel Section: Typically, the keel section is the center 50 feet (18 m) of a runway
divided equally left and right of centerline.
MSL: Mean Sea Level
Reproducibility: The ability of a device to match a reference profile, both in elevation and distance.
Repeatability: The ability to repeat the measurements using the same device, both in elevation and distance.
Resolution: The minimal measurement increment.
Subbase: The layer between the pavement and the subgrade.
References Many of the primary references cited in this handbook are listed at the end of this document; however, many other sources, published and unpublished, were also used to compile this handbook.
1
1 EXECUTIVE SUMMARY The primary reason for measuring a profile as soon as it can be walked on is so that there can be immediate corrections to the paving operation. It really doesn’t matter when remediation is made. The important thing is to discontinue whatever it was that caused the smoothness issue. Item P-501, Portland Cement Concrete Pavement, included in the FAA Advisory Circular (AC 150/5370-10B), Standards for Specifying Construction of Airports, referenced as the “P-501” specification, requires the use of a 16-foot straightedge for smoothness assessments of new concrete pavement. The criteria in P-501, when met, will result in smooth airfield pavement. However, using a physical straightedge is a manpower intensive process. Consequently, practice has evolved to where it is common to use the California profilograph for airfield pavement evaluation. Alternatively, the automated pavement profilers provide an emulation of the 16-foot straightedge that makes them attractive from the perspective of efficiency and ease of use when implementing the smoothness component of P-501. Different types of pavement profilers were tested as a part of this study for their accuracy and reliability when using them in lieu of the 16-foot straightedge specified in P-501. The types of profilers included static and rolling inclinometers, lightweight inertial profilers, wet/dry profilers and external reference profilers. When properly calibrated and operated, all of the devices tested were found to be capable of assessing airfield pavement for smoothness. However, each type has advantages and limitations, some of which are significant. The California profilograph was not included in this evaluation except for use as a relative comparison. The amplification and attenuation of measurements at various wavelengths is a potential problem with the device. In addition, the profilograph measures smoothness based upon deviation from center. The criterion in P-501 is the measured deviation anywhere along the length of the 16-foot straightedge. Lightweight profilers are fast, accurate, and typically measure two lines of survey simultaneously. They require room to accelerate to optimal speed, and then room to decelerate, resulting in restricted use in confined areas. Lightweight profilers cannot measure true profile with respect to mean sea level (MSL) and cannot measure transverse slopes or areas of local depression (birdbath). Results imply that lightweight profilers that use a larger footprint compensate for pavement texture, and therefore, more accurately match the reference profiler that was used in this study. Static inclinometers are sufficiently accurate, and can measure true profile with respect to mean sea level, but they are also very slow. Rolling inclinometers are also sufficiently accurate and can measure true profile with respect to mean sea level. They are considerably faster than static inclinometers.
2
External reference profilers are sufficiently accurate, particularly for longer wavelengths, and can measure true profile with respect to mean sea level. They are the fastest of the walking profilers. The wet/dry profiler included in this study is sufficiently accurate to measure smoothness and it is also capable of measuring MSL data. While slow operating, the device will keep pace with the paving train. The wet/dry profiler used for these tests measured multiple lines of survey simultaneously. A significant advantage of the device tested is that, as part of the paving train, there was real-time feedback to the paving crew. The California profilograph has the benefit of quantifying smoothness as an index. It is commonly referred to as the Profile Index (PI). An index simplifies interpretation of measured data. However, PI values used for acceptance of highways require modification to accommodate airfield pavement application. But the idea of using an index to interpret results has merit. Profiling technology currently available allows the assessment of the smoothness of an airfield pavement using the P-501 criteria, but there is also a need to develop an index for quantifying smoothness levels based on P-501 criteria. One technique that can be used to establish a “standard of measure” is the Straightedge Smoothness Index (SSI). Software for computing the (SSI) and plotting the results is included as Appendix A.∗ Another automated procedure that can calculate the SSI is available through the FAA (PROFAA). SSI is calculated by simulating a 16-foot (4.88 m) straightedge placed on the profile measured by a profiler. The calculation begins by putting the end of the simulated straightedge on the first data point. Then the point of maximum deviation, anywhere along that straightedge, is determined and that value is recorded. The simulated straightedge is then moved to the next data point and the maximum deviation is again determined and plotted. The process is repeated for the entire profile length producing a chart that displays the entire pavement surface. This enables the user to see points of significant deviation at a glance. It also allows the quick identification and location of those spots where corrections to the measured profile must be accomplished. How smooth is smooth enough? What is the best straightedge length to access smoothness? Should it be a physical straightedge or a rolling straightedge? What is an acceptable SSI? Target values for each of these questions and more are presented in this report. However, they are just that, “target values”, and are based on a limited number of known smooth runways and taxiways. These numbers should be validated/refined with additional field application and evaluation. Therefore, the SSI and other suggested parameters proposed herein, are target values for smoothness that could eventually replace the current P-501 criteria. The goal was to develop target criteria that results in acceptable aircraft ride quality, and yet, is compatible with design and construction practices. Guidance for constructing smooth concrete airfield pavements is included. This guidance is based on a search of available literature, observation of airfield pavement construction, ∗ The SSI was originally developed by APR Consultants, Inc. and has been used by APR for assessing the ride quality of airfield pavements.
3
interviews with the stakeholders, and empirical knowledge in the measurement and evaluation of airfield pavements for roughness.
2 INTRODUCTION Item P-501, Portland Cement Concrete Pavement, included in the FAA Advisory Circular, Standards for Specifying Construction of Airports (AC 150/5370-10B), referred to as “P-501”, establishes the criteria that is to be used to assess the smoothness of the constructed pavement surface.(1) Some FAA regions do allow changes to P-501 by allowing the use of the California profilograph for new airfield pavement acceptance. The evolution of the straightedge criteria has roots in highway construction. As the criteria evolved, so did the correlation between smoothness measurement and ride quality experienced in the passenger car. But a car or truck has a suspension system that dampens the experienced roughness. The primary purpose of an aircraft suspension system is not to absorb pavement roughness. Its primary function is to absorb the energy of landing impact, which means that most of the available strut stroke is already used up when the aircraft is on the ground. And, the pavement used by aircraft is significant in two dimensions, meaning that the width is just as important as the length of a pavement feature. The pavement surface must be consistent across joints, and also through the interior of panels. The surface irregularities that cause undesirable aircraft response or poor drainage characteristics must be identified by measurement prior to opening to traffic.
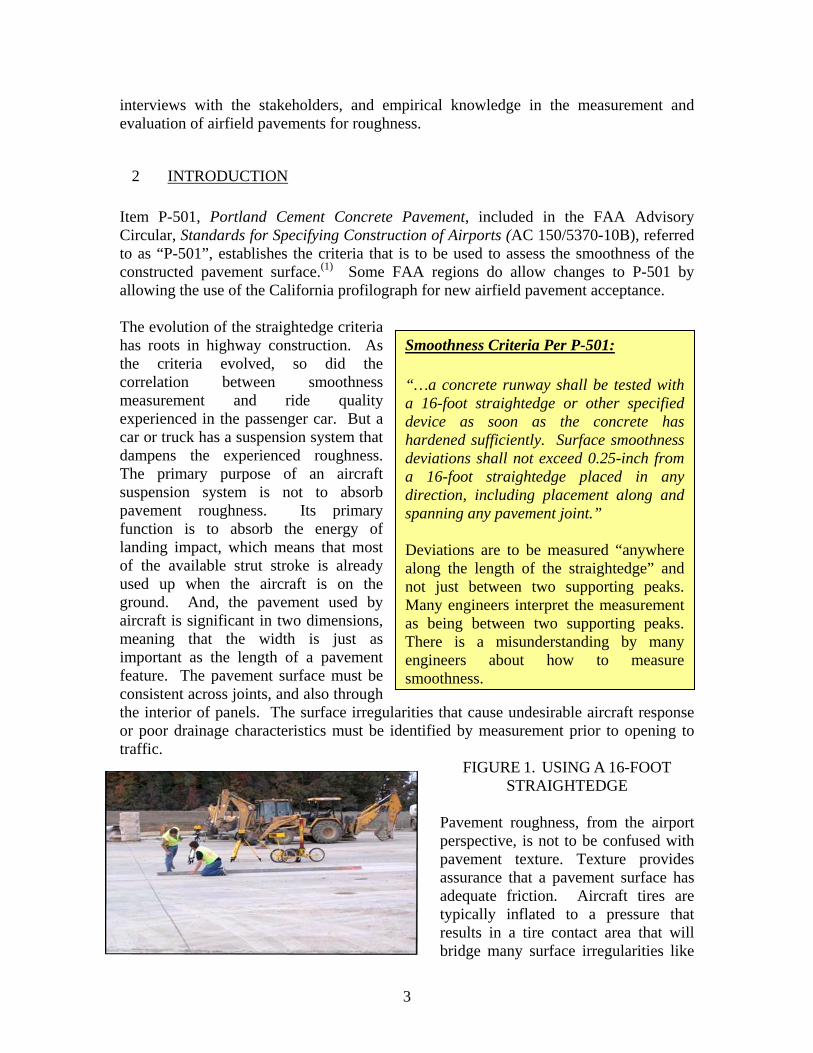
FIGURE 1. USING A 16-FOOT STRAIGHTEDGE
Pavement roughness, from the airport perspective, is not to be confused with pavement texture. Texture provides assurance that a pavement surface has adequate friction. Aircraft tires are typically inflated to a pressure that results in a tire contact area that will bridge many surface irregularities like
Smoothness Criteria Per P-501: “…a concrete runway shall be tested with a 16-foot straightedge or other specified device as soon as the concrete has hardened sufficiently. Surface smoothness deviations shall not exceed 0.25-inch from a 16-foot straightedge placed in any direction, including placement along and spanning any pavement joint.” Deviations are to be measured “anywhere along the length of the straightedge” and not just between two supporting peaks. Many engineers interpret the measurement as being between two supporting peaks. There is a misunderstanding by many engineers about how to measure smoothness.
4
texture, grooving and saw joints. The tire will also have the tendency to engulf certain peaks in the surface, such as those seen on textured pavement surfaces. For smoothness determination it is only necessary to identify surface irregularities that affect aircraft ride and pavement drainage. For the purpose of this study, pavement texture needed for friction is not considered pavement roughness.
New pavements are checked for surface consistency, drainage, and smoothness. The primary reason smoothness is required is to minimize undesirable aircraft response. Neither the 16-foot (4.87 m) straightedge criterion, nor the California profilograph, is based on aircraft response. Each is based on deviation from a straightedge. The criteria of using 0.25-inch (6.35 mm) in 16 feet (4.88 m) has been in use for many years, and empirical knowledge suggests that when enforced, that criteria will result in a smooth airfield pavement having acceptable aircraft ride quality with positive drainage. While the 0.25-inch (6.35 mm) in 16 feet (4.88 m) process is sound, the difficulty is that using a physical straightedge is manpower intensive, and therefore, difficult to implement. It is also acceptable to recognize that meeting the P-501 criteria for smoothness 100 percent of the time is not realistic. There must be some allowance for the variability in the construction process and at the same time, there must be a determination as to what constitutes smoothness that is unacceptable. Consequently, part of the challenge in measurement is to establish target values that are achievable, assuming that a good paving technique is being used. The questions about “How smooth is smooth enough?” and “How to measure it?” are the unknowns. The straightedge approach is directly relatable to construction practices, but it alone cannot be used to predict how an aircraft will respond to the pavement profile.
It cannot, for example, account for the non-linear effect of multiple bumps or dips at regular intervals. It cannot account for aircraft velocity. Repeated short wavelength
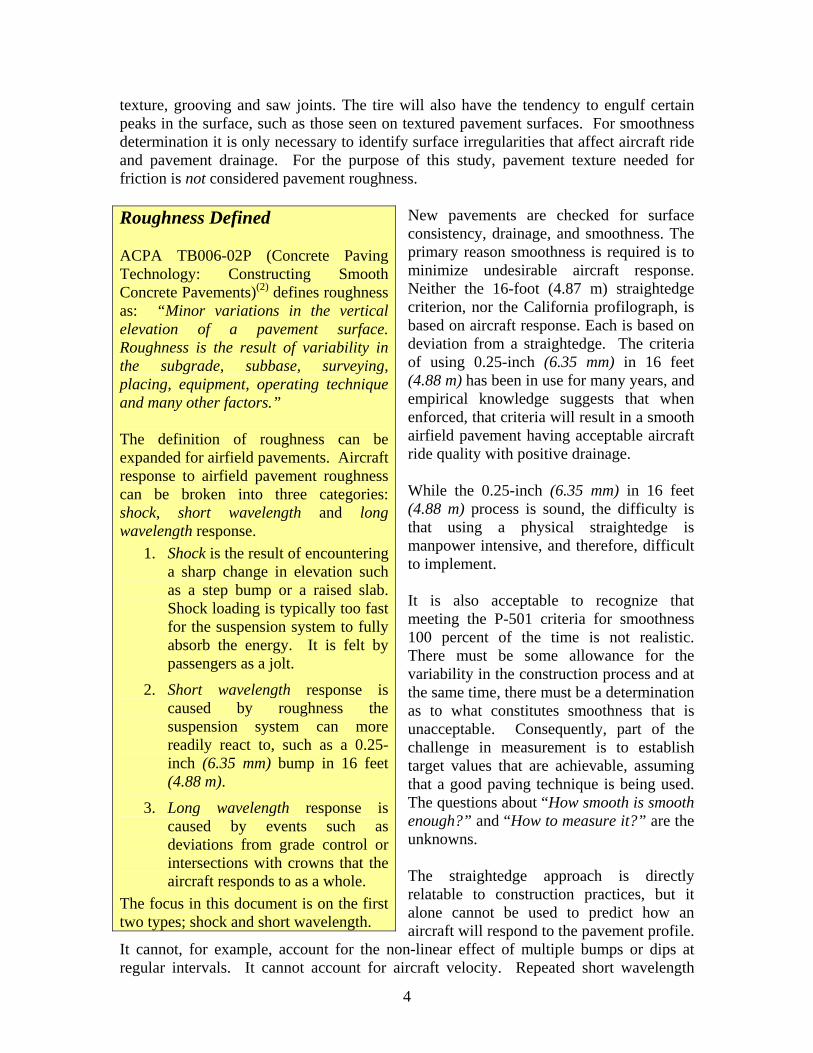
Roughness Defined ACPA TB006-02P (Concrete Paving Technology: Constructing Smooth Concrete Pavements)(2) defines roughness as: “Minor variations in the vertical elevation of a pavement surface. Roughness is the result of variability in the subgrade, subbase, surveying, placing, equipment, operating technique and many other factors.”
The definition of roughness can be expanded for airfield pavements. Aircraft response to airfield pavement roughness can be broken into three categories: shock, short wavelength and long wavelength response.
1. Shock is the result of encountering a sharp change in elevation such as a step bump or a raised slab. Shock loading is typically too fast for the suspension system to fully absorb the energy. It is felt by passengers as a jolt.
2. Short wavelength response is caused by roughness the suspension system can more readily react to, such as a 0.25-inch (6.35 mm) bump in 16 feet (4.88 m).
3. Long wavelength response is caused by events such as deviations from grade control or intersections with crowns that the aircraft responds to as a whole.
The focus in this document is on the first two types; shock and short wavelength.
5
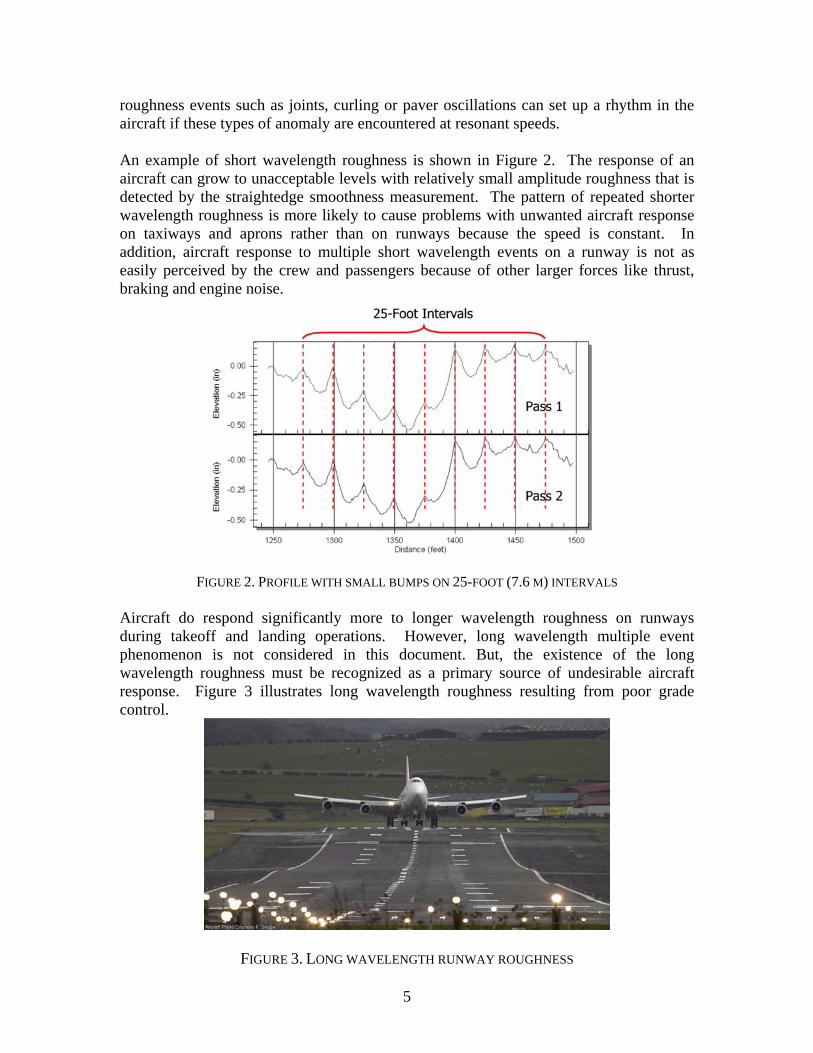
roughness events such as joints, curling or paver oscillations can set up a rhythm in the aircraft if these types of anomaly are encountered at resonant speeds. An example of short wavelength roughness is shown in Figure 2. The response of an aircraft can grow to unacceptable levels with relatively small amplitude roughness that is detected by the straightedge smoothness measurement. The pattern of repeated shorter wavelength roughness is more likely to cause problems with unwanted aircraft response on taxiways and aprons rather than on runways because the speed is constant. In addition, aircraft response to multiple short wavelength events on a runway is not as easily perceived by the crew and passengers because of other larger forces like thrust, braking and engine noise.
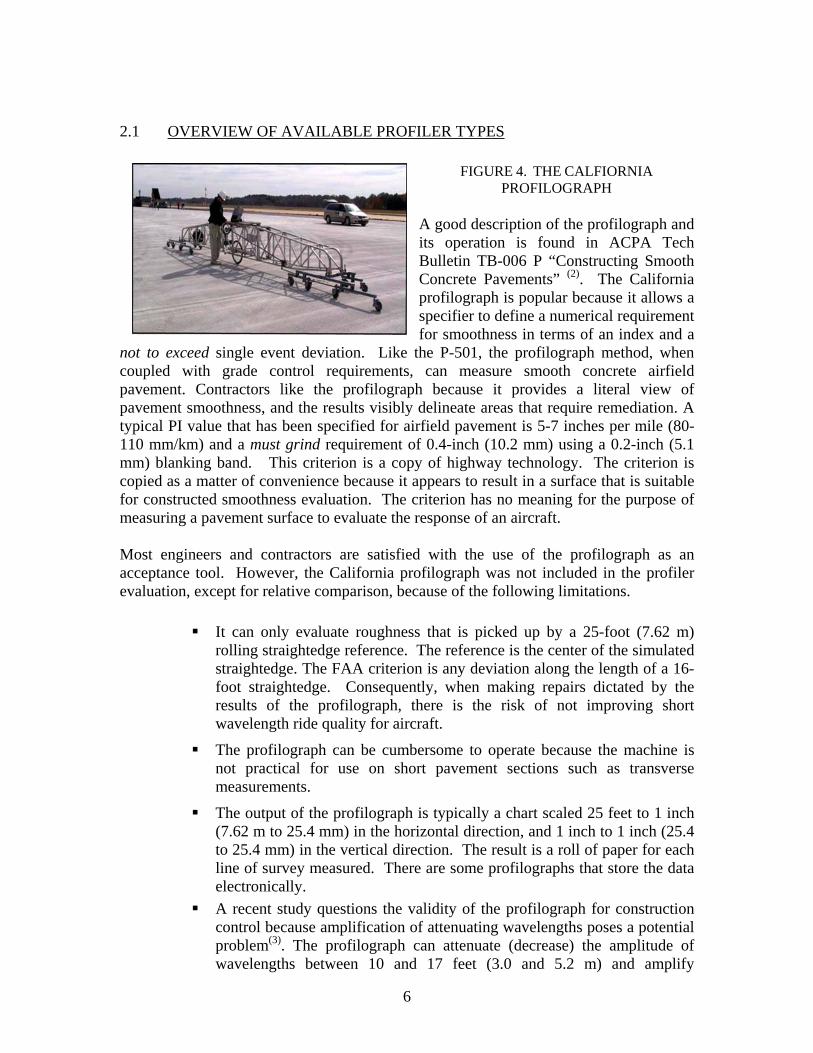
FIGURE 2. PROFILE WITH SMALL BUMPS ON 25-FOOT (7.6 M) INTERVALS Aircraft do respond significantly more to longer wavelength roughness on runways during takeoff and landing operations. However, long wavelength multiple event phenomenon is not considered in this document. But, the existence of the long wavelength roughness must be recognized as a primary source of undesirable aircraft response. Figure 3 illustrates long wavelength roughness resulting from poor grade control.
FIGURE 3. LONG WAVELENGTH RUNWAY ROUGHNESS
6
2.1 OVERVIEW OF AVAILABLE PROFILER TYPES
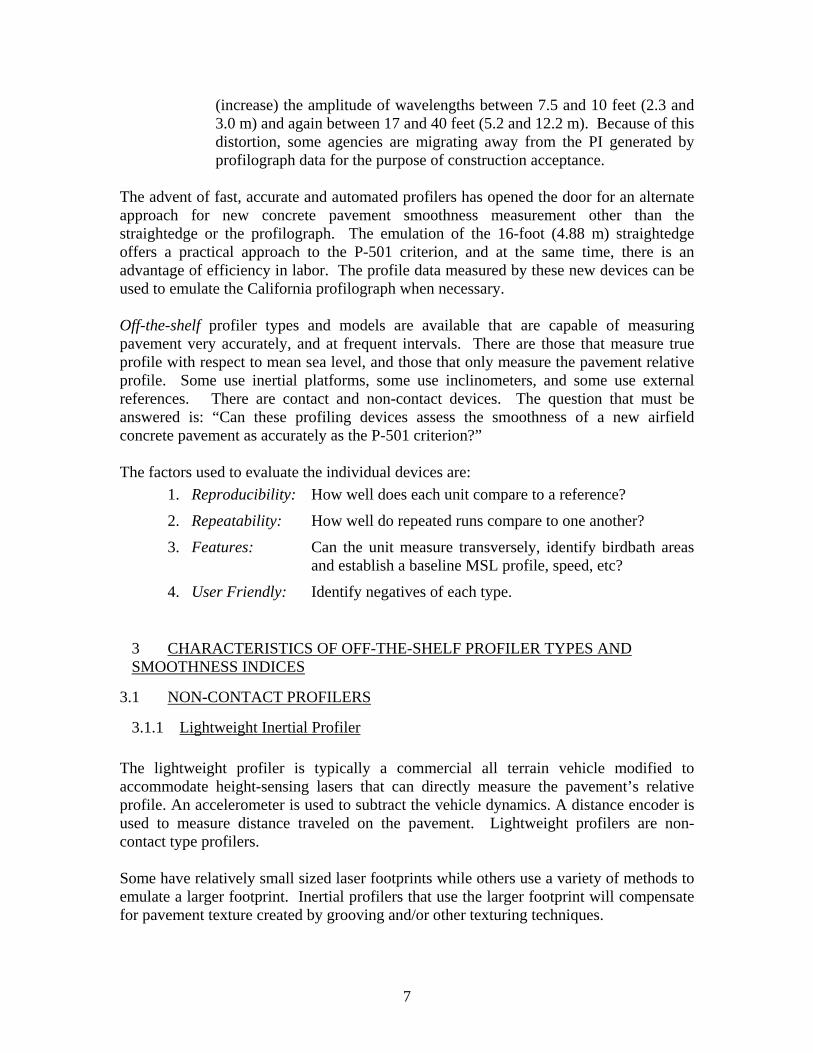
FIGURE 4. THE CALFIORNIA PROFILOGRAPH
A good description of the profilograph and its operation is found in ACPA Tech Bulletin TB-006 P “Constructing Smooth Concrete Pavements” (2). The California profilograph is popular because it allows a specifier to define a numerical requirement for smoothness in terms of an index and a
not to exceed single event deviation. Like the P-501, the profilograph method, when coupled with grade control requirements, can measure smooth concrete airfield pavement. Contractors like the profilograph because it provides a literal view of pavement smoothness, and the results visibly delineate areas that require remediation. A typical PI value that has been specified for airfield pavement is 5-7 inches per mile (80-110 mm/km) and a must grind requirement of 0.4-inch (10.2 mm) using a 0.2-inch (5.1 mm) blanking band. This criterion is a copy of highway technology. The criterion is copied as a matter of convenience because it appears to result in a surface that is suitable for constructed smoothness evaluation. The criterion has no meaning for the purpose of measuring a pavement surface to evaluate the response of an aircraft. Most engineers and contractors are satisfied with the use of the profilograph as an acceptance tool. However, the California profilograph was not included in the profiler evaluation, except for relative comparison, because of the following limitations.
It can only evaluate roughness that is picked up by a 25-foot (7.62 m) rolling straightedge reference. The reference is the center of the simulated straightedge. The FAA criterion is any deviation along the length of a 16-foot straightedge. Consequently, when making repairs dictated by the results of the profilograph, there is the risk of not improving short wavelength ride quality for aircraft.
The profilograph can be cumbersome to operate because the machine is not practical for use on short pavement sections such as transverse measurements.
The output of the profilograph is typically a chart scaled 25 feet to 1 inch (7.62 m to 25.4 mm) in the horizontal direction, and 1 inch to 1 inch (25.4 to 25.4 mm) in the vertical direction. The result is a roll of paper for each line of survey measured. There are some profilographs that store the data electronically.
A recent study questions the validity of the profilograph for construction control because amplification of attenuating wavelengths poses a potential problem(3). The profilograph can attenuate (decrease) the amplitude of wavelengths between 10 and 17 feet (3.0 and 5.2 m) and amplify
7
(increase) the amplitude of wavelengths between 7.5 and 10 feet (2.3 and 3.0 m) and again between 17 and 40 feet (5.2 and 12.2 m). Because of this distortion, some agencies are migrating away from the PI generated by profilograph data for the purpose of construction acceptance.
The advent of fast, accurate and automated profilers has opened the door for an alternate approach for new concrete pavement smoothness measurement other than the straightedge or the profilograph. The emulation of the 16-foot (4.88 m) straightedge offers a practical approach to the P-501 criterion, and at the same time, there is an advantage of efficiency in labor. The profile data measured by these new devices can be used to emulate the California profilograph when necessary. Off-the-shelf profiler types and models are available that are capable of measuring pavement very accurately, and at frequent intervals. There are those that measure true profile with respect to mean sea level, and those that only measure the pavement relative profile. Some use inertial platforms, some use inclinometers, and some use external references. There are contact and non-contact devices. The question that must be answered is: “Can these profiling devices assess the smoothness of a new airfield concrete pavement as accurately as the P-501 criterion?” The factors used to evaluate the individual devices are:
1. Reproducibility: How well does each unit compare to a reference?
2. Repeatability: How well do repeated runs compare to one another?
3. Features: Can the unit measure transversely, identify birdbath areas and establish a baseline MSL profile, speed, etc?
4. User Friendly: Identify negatives of each type.
3 CHARACTERISTICS OF OFF-THE-SHELF PROFILER TYPES AND SMOOTHNESS INDICES
3.1 NON-CONTACT PROFILERS
3.1.1 Lightweight Inertial Profiler The lightweight profiler is typically a commercial all terrain vehicle modified to accommodate height-sensing lasers that can directly measure the pavement’s relative profile. An accelerometer is used to subtract the vehicle dynamics. A distance encoder is used to measure distance traveled on the pavement. Lightweight profilers are non-contact type profilers. Some have relatively small sized laser footprints while others use a variety of methods to emulate a larger footprint. Inertial profilers that use the larger footprint will compensate for pavement texture created by grooving and/or other texturing techniques.
8
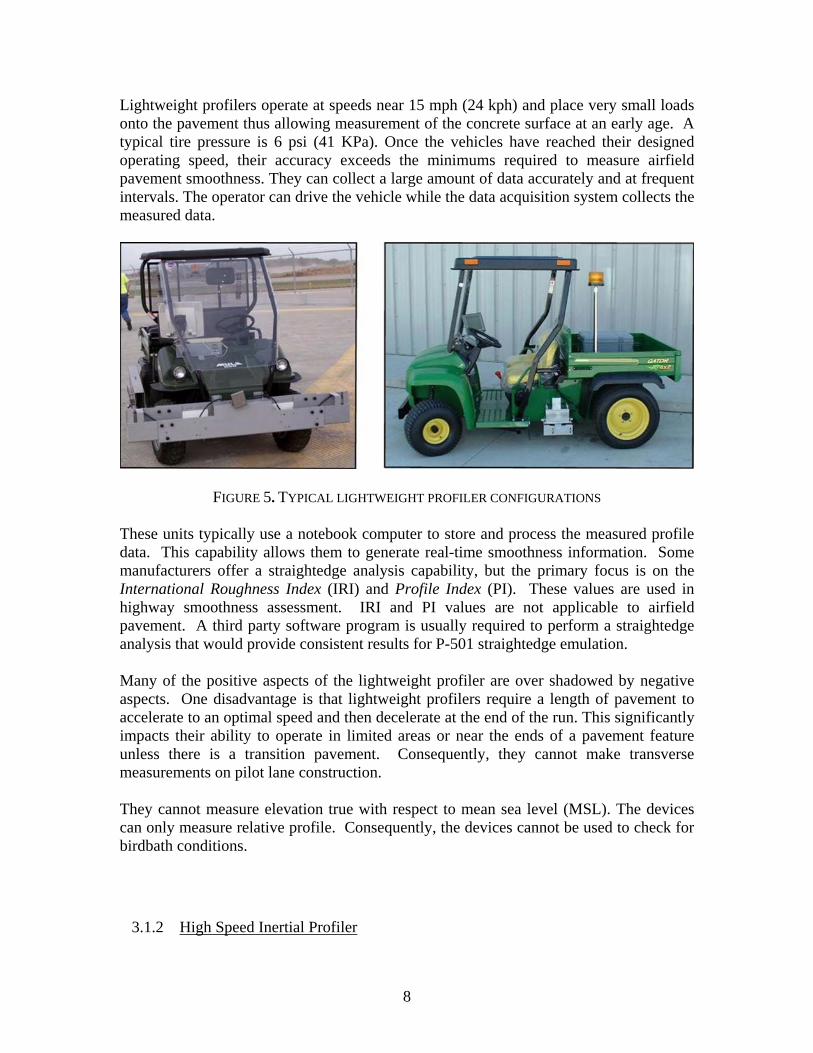
Lightweight profilers operate at speeds near 15 mph (24 kph) and place very small loads onto the pavement thus allowing measurement of the concrete surface at an early age. A typical tire pressure is 6 psi (41 KPa). Once the vehicles have reached their designed operating speed, their accuracy exceeds the minimums required to measure airfield pavement smoothness. They can collect a large amount of data accurately and at frequent intervals. The operator can drive the vehicle while the data acquisition system collects the measured data.
FIGURE 5. TYPICAL LIGHTWEIGHT PROFILER CONFIGURATIONS These units typically use a notebook computer to store and process the measured profile data. This capability allows them to generate real-time smoothness information. Some manufacturers offer a straightedge analysis capability, but the primary focus is on the International Roughness Index (IRI) and Profile Index (PI). These values are used in highway smoothness assessment. IRI and PI values are not applicable to airfield pavement. A third party software program is usually required to perform a straightedge analysis that would provide consistent results for P-501 straightedge emulation. Many of the positive aspects of the lightweight profiler are over shadowed by negative aspects. One disadvantage is that lightweight profilers require a length of pavement to accelerate to an optimal speed and then decelerate at the end of the run. This significantly impacts their ability to operate in limited areas or near the ends of a pavement feature unless there is a transition pavement. Consequently, they cannot make transverse measurements on pilot lane construction. They cannot measure elevation true with respect to mean sea level (MSL). The devices can only measure relative profile. Consequently, the devices cannot be used to check for birdbath conditions.
3.1.2 High Speed Inertial Profiler

9
High speed inertial profilers operate on the same principle as the lightweight profilers. The principal advantage of the high speed profiler is that it is capable of capturing long wavelength events because of its higher operating speed. The disadvantages of typical high speeds are that they generally require more room to accelerate to operating speed and put more load on the pavement. High speed profilers cannot measure elevation true with respect to mean sea level.
FIGURE 6. THE FAA HIGH OR
LOW SPEED PROFILER The people at the Pavement Research Center, FAA William J. Hughes Technical Center, operate an inertial profiler that can be used as a high or low speed profiler. The principal of operation is basically the same as the lightweight profiler except the unit can be mounted on any vehicle. Figure 6 shows the FAA device mounted on a
standard passenger car. It can also be mounted on a golf cart or ATV. It is a non-contact profiler. This unit provides a stable platform for effective profile measurement at high or low rates of speed. The FAA software enables the device to collect usable profile data during acceleration (4). The software for this device is available to the public at no cost. Hardware devices similar to the FAA unit are commercially available.
3.1.3 Wet or Dry Profiler FIGURE 7. A WET / DRY
PROFILING DEVICE
A new technology is a wet or dry profiler. It is a non-contact device, and the advantages are that it can measure multiple lines of survey simultaneously and is capable of behind-the-
paver measurements. The unit (Figure 7) measured 4 lines of survey on a 25-foot (7.62 m) paving lane at the Cincinnati-Northern Kentucky International Airport (CVG). Up to 8 lines can be surveyed simultaneously if desired. It is designed to be part of the paving train. By measuring the profile wet, immediate feedback can be provided to the paving crew so that real-time corrections can be made if necessary.

10
This device uses non-contact sonic sensors and slope indicators to measure the smoothness of the pavement. The slope and sonic sensors are mounted on the unit’s frame facing downward over the pavement. The speed of operation is sufficient to keep pace with the paving train. This profiler has the unique advantage that it can make transverse measurements simultaneously with the profile measurement. This allows the detection of potential birdbath areas without making a transverse set up and measurement. However, the number of measurements required to adequately define the cross section was not determined.
3.2 CONTACT PROFILERS
3.2.1 Slow Speed Profilers – Inclinometers Inclinometers are contact-type profilers, and therefore, reduce the effect of texture on elevation measurements. Two configurations are shown in Figure 8. All inclinometers, measure the slope in the direction of measurement of the pavement using tilt sensing technology.
FIGURE 8. EXAMPLES OF (SLOW SPEED) INCLINOMETER PROFILERS
The profile is measured by calculating the difference in the angle between two known points. These identified differences are accumulated to calculate the continuous profile of the pavement. Some static profilers require the unit to come to a complete stop, and the operator listen for a beep before the device is advanced. The beep indicates that an elevation reading has been recorded. The profile data collected by static inclinometers is sufficiently accurate for smoothness assessment of airfield pavement. Slow speed static inclinometers can measure true elevation with respect to mean sea level (MSL) subsequent to the operator accomplishing a short closed loop calibration. They can be used for direct transverse measurements. They are very accurate, repeatable, easy to use and reliable. Generally, they are light, easy to ship and assemble. The primary disadvantage is their slow speed.
3.2.2 Walking Speed Profilers – Inclinometers
11
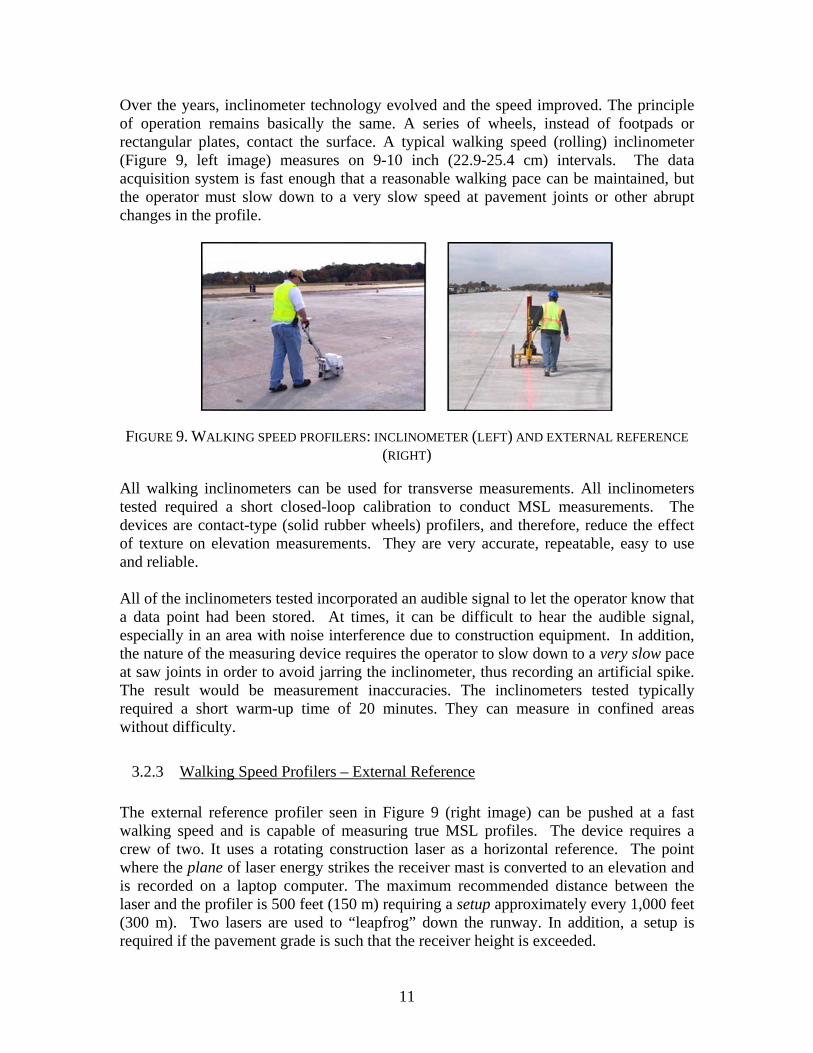
Over the years, inclinometer technology evolved and the speed improved. The principle of operation remains basically the same. A series of wheels, instead of footpads or rectangular plates, contact the surface. A typical walking speed (rolling) inclinometer (Figure 9, left image) measures on 9-10 inch (22.9-25.4 cm) intervals. The data acquisition system is fast enough that a reasonable walking pace can be maintained, but the operator must slow down to a very slow speed at pavement joints or other abrupt changes in the profile.
FIGURE 9. WALKING SPEED PROFILERS: INCLINOMETER (LEFT) AND EXTERNAL REFERENCE
(RIGHT) All walking inclinometers can be used for transverse measurements. All inclinometers tested required a short closed-loop calibration to conduct MSL measurements. The devices are contact-type (solid rubber wheels) profilers, and therefore, reduce the effect of texture on elevation measurements. They are very accurate, repeatable, easy to use and reliable. All of the inclinometers tested incorporated an audible signal to let the operator know that a data point had been stored. At times, it can be difficult to hear the audible signal, especially in an area with noise interference due to construction equipment. In addition, the nature of the measuring device requires the operator to slow down to a very slow pace at saw joints in order to avoid jarring the inclinometer, thus recording an artificial spike. The result would be measurement inaccuracies. The inclinometers tested typically required a short warm-up time of 20 minutes. They can measure in confined areas without difficulty.
3.2.3 Walking Speed Profilers – External Reference The external reference profiler seen in Figure 9 (right image) can be pushed at a fast walking speed and is capable of measuring true MSL profiles. The device requires a crew of two. It uses a rotating construction laser as a horizontal reference. The point where the plane of laser energy strikes the receiver mast is converted to an elevation and is recorded on a laptop computer. The maximum recommended distance between the laser and the profiler is 500 feet (150 m) requiring a setup approximately every 1,000 feet (300 m). Two lasers are used to “leapfrog” down the runway. In addition, a setup is required if the pavement grade is such that the receiver height is exceeded.

12
The device is easily used for transverse measurements and it can operate in confined areas. It is a contact-type profiler, and therefore, the effect of texture on elevation measurements is reduced. The primary advantage of the unit tested is that it can measure true grade and long wavelengths fast and accurately. The unit also accommodates user comments inserted into the data stream as the profile is being measured. It also plots in real-time allowing the operator a view of the profile as it is being measured. Specific disadvantages of this type of device are that the accuracy can be affected by high winds which induce vibration into the laser transmitter. This can be minimized with wind blocks. Passing vehicles can also block the reference laser on occasion.
3.3 EXISTING SMOOTHNESS INDICES Three indices are used by the industry to quantify smoothness levels. They are PI (Profile Index), IRI (International Roughness Index) and RN (Ride Number). IRI is a response-based index used for highways. RN was developed by the NCHRP in the 1980’s and is a means of estimating a mean rating. And recently, the highway industry moved to start using the International Roughness Index (IRI). The Ride Number (RN) is still used for acceptance by some state Departments of Transportation. There is no known relationship between the straightedge measurement and the IRI or RN. Therefore, PI is the only existing index that could have application for airfield pavement smoothness characterization.
The California profilograph approach uses a Profile Index (PI) to provide an overall assessment of the pavement smoothness, usually in 1/10th mile sections. The data from the profilograph is used to calculate an overall index usually expressed in inches per mile. This index is based on the deviations measured by the 25-foot (7.6 m) rolling straightedge with the sensing wheel in the center of the profilograph truss. The index is used on
highways and has been specified on some airfield pavement projects. Typically, the engineer will use a PI of 5-7 inches per mile (80-110 mm/km) using a 2/10-inch (5 mm) blanking band as average and attainable for an airfield pavement surface. P-501 requires that the maximum deviation at any point along the straightedge not exceed ¼-inch in 16 feet. But, with the straightedge, there are no official “indices” that can be used to categorize when the straightedge results suggest that a pavement is not smooth. There is a need to establish an index that can be used to correlate the measurements made by profilers and the straightedge measurement.
4 THE PROCESS USED FOR EVALUATION OF SURFACE PROFILERS
PI, defined in ACPA TB006-02P Concrete Paving Technology: Constructing Smooth Concrete Pavements, “is a smoothness statistic derived from the trace of a California profilograph. It is determined by summing all of the bumps and dips from the profile trace (in meters or inches) and dividing by the length of the pavement section (in kilometers or miles)”.
13
All of the profiler types described (inertial, inclinometer, external reference and wet/dry) were assessed with regard to their ability to measure airfield pavement for smoothness using the P-501 specification criteria as the baseline.
4.1 EVALUATION CRITERIA Prior to evaluating the profilers considered to be readily available, or off-the-shelf, a set of criteria for determining their acceptability as a device to measure airfield smoothness had to be established. What accuracy is required? What needs to be measured? What features are required and desired by the stakeholders? The pavement profile characteristics for short wavelength phenomena that are transmitted to the aircraft structure are a complex averaging of the influence of aircraft tire-pavement interaction. Aircraft tires bridge runway grooves, engulf small peaks and average slight deviations that are the result of pavement texture. The tire has the tendency to ride on the average of the peaks. The non-contact devices, such as lightweight and high speed profilers, will record all of the readings taken including bottom of grooves and bottom and top elevation of texture. Some profilers increase the frequency of the spot elevation readings, and then average the data to accommodate some of these issues. But, this is not what is encountered by the tire. The average of all of the data including all readings does not represent where the tire rides. Steps are currently being taken by the industry to more accurately measure what the tire encounters. One advantage contact profilers have is that the surface texture issues are inherently accounted for by the nature of the profiler’s design. There is a contact patch area between the profiler and the pavement’s surface. But some of the issues are not overcome. Profilers with rigid footpads will bridge valleys, but will not engulf small peaks. Profilers with soft contact patches (tires) engulf small peaks and bridge valleys, but they represent a very small tire patch size in comparison to the aircraft tire. Because of all of these issues, no one should expect an exact replication of the profile. It is not practical. But, reasonable agreement as to the pavement profile is expected if these deficiencies are included by using a blanking band, or by ignoring all measurements recorded that fall within a specified accuracy. Texture and roughness are two distinctly different issues and they must remain distinct. It is actually counter-productive to measure to accuracies that do not affect aircraft response. For this reason, a blanking band of 0.125-inch (3 mm) was used in the evaluation of all devices. The band selected is 50% of the 0.25-inch (6.35 mm) in 16 feet (4.88 m) as measured by the straightedge. This means that the profiling device should be capable of measuring to elevation accuracies equal to or greater than that of the blanking band value if the device is considered accurate.
14
The overall accuracy requirement selected for reproducibility and repeatability is 1/16-inch (1.63mm). The number was chosen to represent a value where pavement texture is separated from short wavelength roughness.
4.1.1 Longitudinal Accuracy The criterion used for distance measurement accuracy is 0.02%. This is achievable by most profilers. In addition, most profilers have pre and post-processing software that can modify the data intervals to match stationing benchmarks or known distances.
4.1.2 Measurement Intervals The minimum interval of longitudinal measurement was set at 1 foot (0.3m). Non contact profilers like high speeds, lightweights or wet/dry profilers will capture much more frequent intervals, but the goal is not to capture every event. The goal is to obtain a profile that represents the deviation seen by the aircraft tire. Doing the profile on a one foot interval will emulate the incorporation of the effects of tire bridging. A specific criterion to measure for transverse profiles, i.e., birdbath detection, etc., could not be assigned. When comparing devices, only the ability and relative ease of making a transverse measurement could be determined.
4.1.3 Reproducibility and Repeatability Assuming that the profile device is measuring what needs to be measured, can the device repeat the data stream for both distance and elevation for successive measurements? Because of the issues with texture and minor surface deviations, the profiler selected as the control was a contact profiler. The device was equipped with a finite contact patch which would minimize the effects of texture. To establish a control for elevation measurements there must be assurance that a device being used to compare data is measuring the same spot. This is not possible when comparing devices that measure at different intervals and use a variety of measuring techniques. For example, the area scanned by a spot laser will be different than the base of a survey rod. Since the goal is to determine if a profile device can be used to assess for smoothness using the 16-foot (4.88 m) straightedge as a baseline standard, that becomes the method selected for device evaluation. To emulate a 16-foot straightedge using the data by the profiler, a pavement smoothness evaluation software package, APRas, developed by APR Consultants, was used. PROFAA, developed at the FAA William J. Hughes Technical Center, Atlantic City, NJ, and ProVal, developed by The Transtec Group Inc. for the FHWA, are other software programs that can be used to do the same emulation. APRas simulates a rolling straightedge, not a physical straightedge as specified in P-501. A rolling straightedge is used to evaluate the profilers because it more closely represents
15
a vehicle traversing the surface, and it eliminates the confusion of where to measure along the length of the straightedge. The simulation determines the maximum deviation anywhere along the 16-foot rolling straightedge. This is similar to the method described in P-501. The straightedge simulation was used to make direct comparison to actual 16-foot straightedge field measurements. The same evaluation technique (a rolling straightedge, not a physical straightedge) was used evaluate all of the devices tested. The only variable was the input profile data recorded by each unit.
4.2 FIELD TESTING Four field sites were utilized to determine the ability of profiler devices to measure the smoothness of an airfield pavement. At Site 1, FHWA profiler roundup, a precise rod and level survey with measurements taken every 3 inches (7.62 cm) was used as the control reference. The control reference used at test site 2 (Cincinnati Northern Kentucky International Airport) was a walking speed (rolling) inclinometer. A static inclinometer was used at the other sites as a control device. Both the rolling and static inclinometers used as control were calibrated to the rod and level survey at Site 1.
4.2.1 Site 1 (FHWA Profiler Roundup) The FHWA sponsored the University of Michigan Transportation Research Institute (UMTRI) to conduct a profiler roundup on nine test sections. Sections 1 and 7 were used in this study. Site 1 (the profiler roundup) provided an opportunity to compare a large number of profilers against professionally measured references. Site 1 was used primarily for accuracy assessment of the various devices. • Section 1 is an asphalt pavement, 6% grade, at the Virginia Smart Road test
facility. California profilograph measurements were made available for comparison purposes.
• Section 7 at the Pennsylvania DOT test track, is a concrete pavement with some surface areas treated by diamond grinding and texturing by tining. The rod and level control was supplemented with a slow speed (static) inclinometer-type profiler. Section 7 was an ideal surface for an evaluation of the repeatability portion of the field comparison of devices.
4.2.2 Site 2 (Cincinnati-Northern Kentucky IAP) Airfield pavement construction issues were studied at the Cincinnati-Northern Kentucky International Airport (CVG). At CVG there was opportunity to evaluate profiling equipment on new PCC airfield pavement. The testing focused on the effects of transverse grooving, texturing, joints, and transverse measurement capability. Three test sections were used and one device from each type of available profilers was evaluated.
Section 1, a 2,000-foot (610 m) extension of Runway 9-27. Paved in six lanes, each 25 feet (7.62 m) wide. There was a 12-inch (0.3 m) crown. The surface was grooved and had a burlap drag finish.
16
Section 2, a 600-foot (182.9 m) section of Taxiway K. Taxiway K is a parallel taxiway paved in four 25-foot wide lanes with a 6-inch crown. The final surface has a burlap drag finish.
Section 3, a 600-foot (182.9 m) section of a parking apron. This relatively new pavement was constructed in 2001. It was included in the study because it contained numerous features that contribute to short wavelength roughness such as drains. The surface is a burlap drag finish.
4.2.3 Site 3 Two taxiways at Atlanta Hartsfield-Jackson International Airport (ATL) were used to measure smoothness on airfield pavement constructed that had been constructed under accelerated conditions. Taxiways L and F were constructed in 500 to 1,000-foot (152-304 m) increments at night during the summer of 2004. Profilograph data from the construction records was used to compare with those measurements made with a walking speed profiler during the summer of 2005.
4.2.4 Site 4 Fargo/Hector International Airfield (FAR) constructed a new primary runway in 2004. A walking speed profiler was used to collect profile measurements on the pavement.
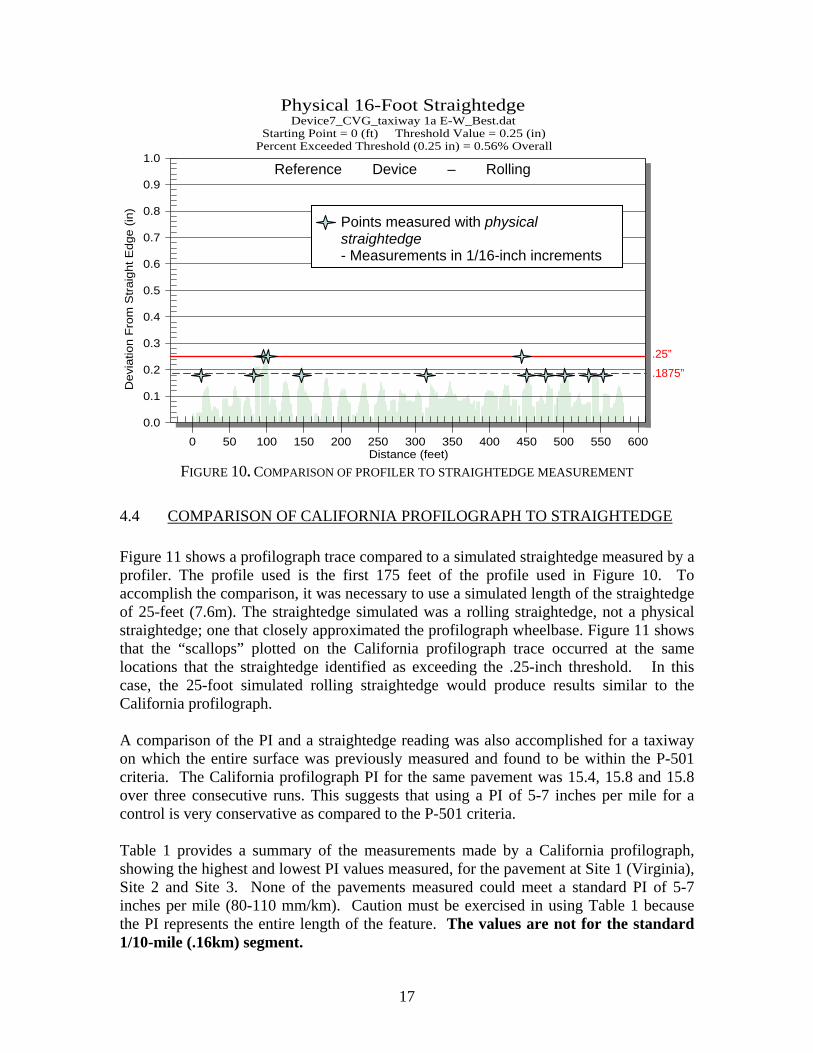
4.3 COMPARISON OF PROFILERS TO THE PHYSICAL STRAIGHTEDGE Establishing a control was established by making actual straightedge measurements on a 600-foot (182.9 m) test section. The straightedge was moved every 8 feet (2.44 m) and a measurement was recorded when departure exceeded 3/16-inch (4.76 mm). The smallest detectable increment of measurement was 1/16-inch (1.59 mm). For the test site, all maximum deviations occurred between the two points upon which the straightedge rests. The same profile was measured using an external reference rolling inclinometer. Figure 10 is a plot of the straightedge emulation for the rolling inclinometer and the physical straightedge deviations. The slight discrepancies between measurements made with an actual straightedge and the rolling inclinometer are attributed to the lack of precision encountered when a person is in the awkward position of being on his knees sighting under a straightedge. The results show that the external reference rolling profiler device can emulate the straightedge. In fact, the profiler emulation is considered more precise than the physical straightedge because more frequent measurements are made and the manual measurements are eliminated.
17
FIGURE 10. COMPARISON OF PROFILER TO STRAIGHTEDGE MEASUREMENT
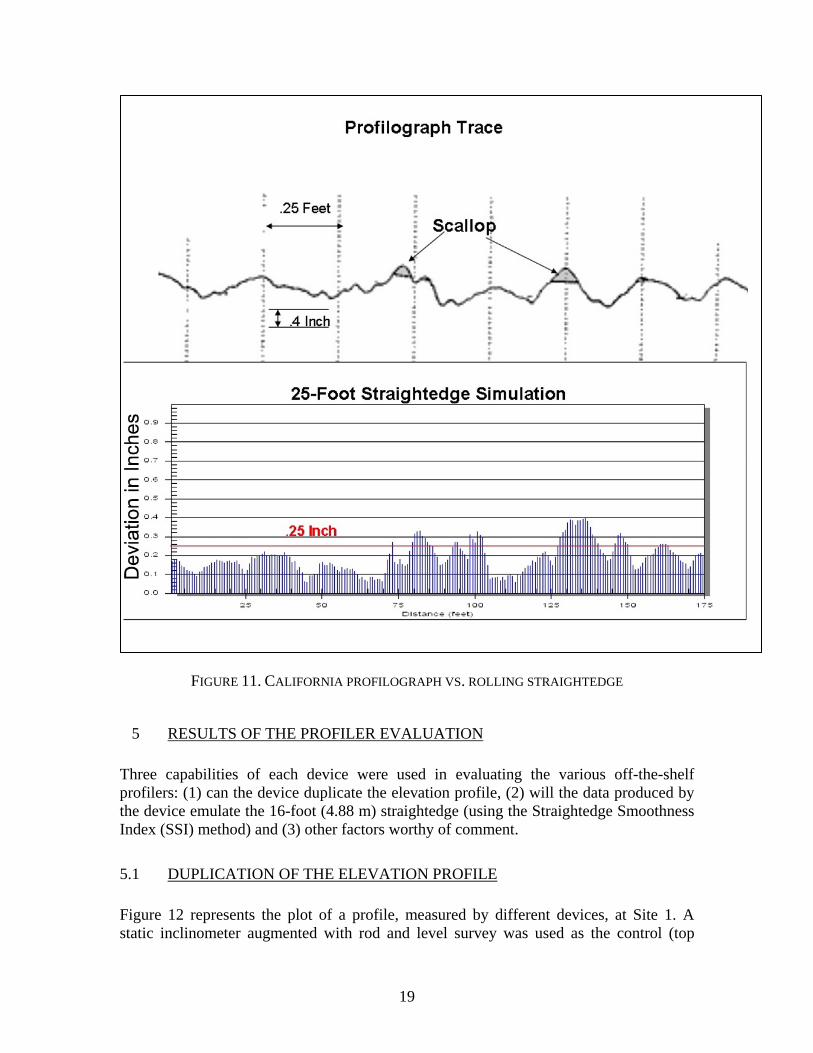
4.4 COMPARISON OF CALIFORNIA PROFILOGRAPH TO STRAIGHTEDGE Figure 11 shows a profilograph trace compared to a simulated straightedge measured by a profiler. The profile used is the first 175 feet of the profile used in Figure 10. To accomplish the comparison, it was necessary to use a simulated length of the straightedge of 25-feet (7.6m). The straightedge simulated was a rolling straightedge, not a physical straightedge; one that closely approximated the profilograph wheelbase. Figure 11 shows that the “scallops” plotted on the California profilograph trace occurred at the same locations that the straightedge identified as exceeding the .25-inch threshold. In this case, the 25-foot simulated rolling straightedge would produce results similar to the California profilograph. A comparison of the PI and a straightedge reading was also accomplished for a taxiway on which the entire surface was previously measured and found to be within the P-501 criteria. The California profilograph PI for the same pavement was 15.4, 15.8 and 15.8 over three consecutive runs. This suggests that using a PI of 5-7 inches per mile for a control is very conservative as compared to the P-501 criteria. Table 1 provides a summary of the measurements made by a California profilograph, showing the highest and lowest PI values measured, for the pavement at Site 1 (Virginia), Site 2 and Site 3. None of the pavements measured could meet a standard PI of 5-7 inches per mile (80-110 mm/km). Caution must be exercised in using Table 1 because the PI represents the entire length of the feature. The values are not for the standard 1/10-mile (.16km) segment.
0.0
0.1
0.2
0.3
0.4
0.5
0.6
0.7
0.8
0.9
1.0
0 50 100 150 200 250 300 350 400 450 500 550 600
0.25
Physical 16-Foot StraightedgeDevice7_CVG_taxiway 1a E-W_Best.dat
Starting Point = 0 (ft) Threshold Value = 0.25 (in)Percent Exceeded Threshold (0.25 in) = 0.56% Overall
Dev
iatio
n Fr
om S
traig
ht E
dge
(in)
Distance (feet)
Reference Device – Rolling
Points measured with physical straightedge - Measurements in 1/16-inch increments
.1875”
.25”
18
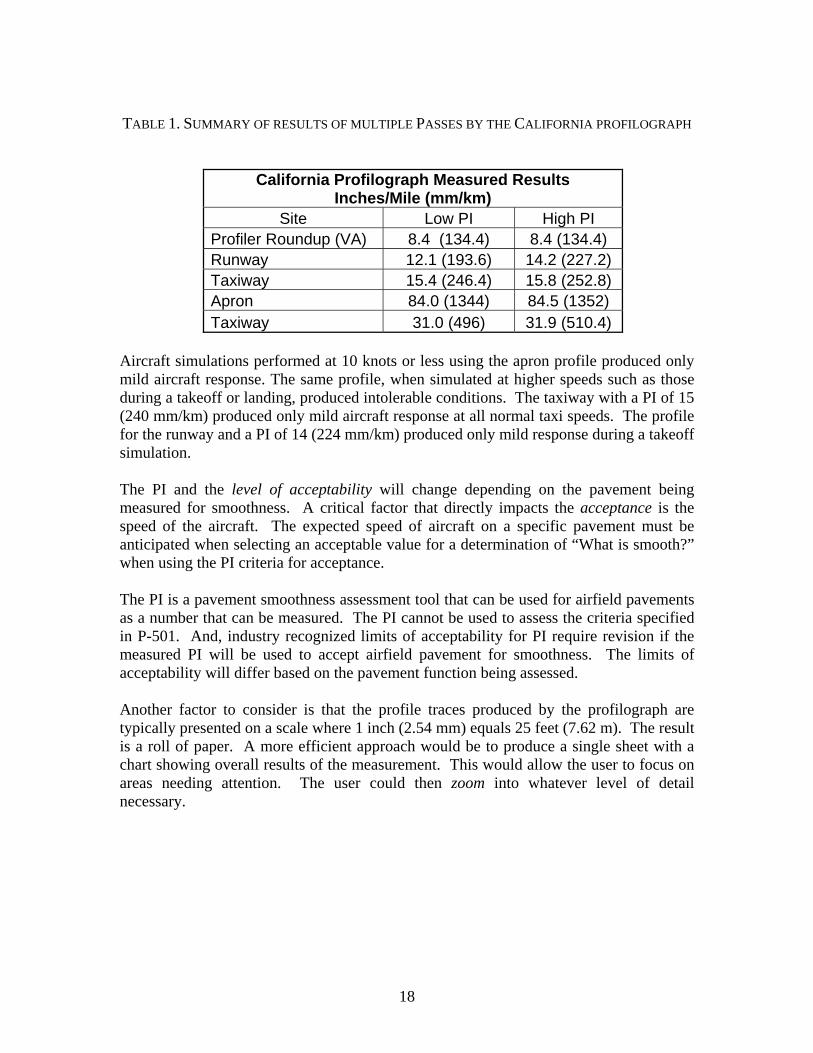
TABLE 1. SUMMARY OF RESULTS OF MULTIPLE PASSES BY THE CALIFORNIA PROFILOGRAPH
California Profilograph Measured Results
Inches/Mile (mm/km) Site Low PI High PI Profiler Roundup (VA) 8.4 (134.4) 8.4 (134.4) Runway 12.1 (193.6) 14.2 (227.2) Taxiway 15.4 (246.4) 15.8 (252.8) Apron 84.0 (1344) 84.5 (1352) Taxiway 31.0 (496) 31.9 (510.4)
Aircraft simulations performed at 10 knots or less using the apron profile produced only mild aircraft response. The same profile, when simulated at higher speeds such as those during a takeoff or landing, produced intolerable conditions. The taxiway with a PI of 15 (240 mm/km) produced only mild aircraft response at all normal taxi speeds. The profile for the runway and a PI of 14 (224 mm/km) produced only mild response during a takeoff simulation. The PI and the level of acceptability will change depending on the pavement being measured for smoothness. A critical factor that directly impacts the acceptance is the speed of the aircraft. The expected speed of aircraft on a specific pavement must be anticipated when selecting an acceptable value for a determination of “What is smooth?” when using the PI criteria for acceptance. The PI is a pavement smoothness assessment tool that can be used for airfield pavements as a number that can be measured. The PI cannot be used to assess the criteria specified in P-501. And, industry recognized limits of acceptability for PI require revision if the measured PI will be used to accept airfield pavement for smoothness. The limits of acceptability will differ based on the pavement function being assessed. Another factor to consider is that the profile traces produced by the profilograph are typically presented on a scale where 1 inch (2.54 mm) equals 25 feet (7.62 m). The result is a roll of paper. A more efficient approach would be to produce a single sheet with a chart showing overall results of the measurement. This would allow the user to focus on areas needing attention. The user could then zoom into whatever level of detail necessary.
19
FIGURE 11. CALIFORNIA PROFILOGRAPH VS. ROLLING STRAIGHTEDGE
5 RESULTS OF THE PROFILER EVALUATION Three capabilities of each device were used in evaluating the various off-the-shelf profilers: (1) can the device duplicate the elevation profile, (2) will the data produced by the device emulate the 16-foot (4.88 m) straightedge (using the Straightedge Smoothness Index (SSI) method) and (3) other factors worthy of comment.
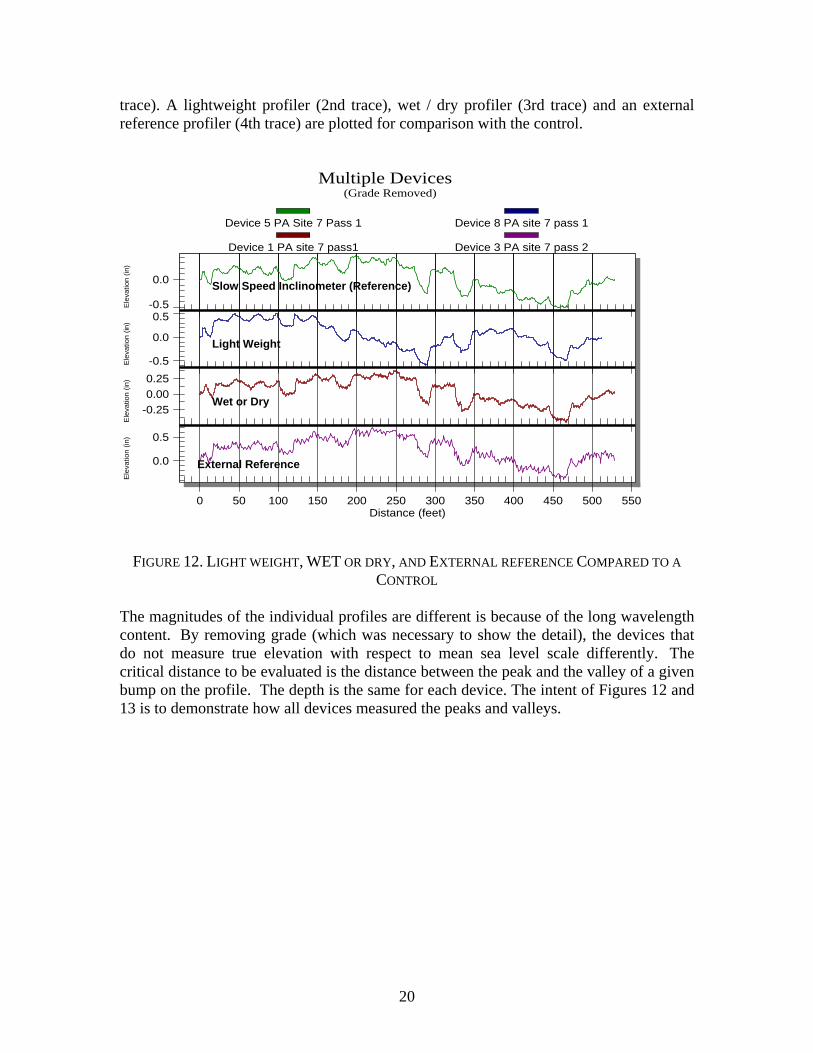
5.1 DUPLICATION OF THE ELEVATION PROFILE Figure 12 represents the plot of a profile, measured by different devices, at Site 1. A static inclinometer augmented with rod and level survey was used as the control (top
20
trace). A lightweight profiler (2nd trace), wet / dry profiler (3rd trace) and an external reference profiler (4th trace) are plotted for comparison with the control.
FIGURE 12. LIGHT WEIGHT, WET OR DRY, AND EXTERNAL REFERENCE COMPARED TO A
CONTROL The magnitudes of the individual profiles are different is because of the long wavelength content. By removing grade (which was necessary to show the detail), the devices that do not measure true elevation with respect to mean sea level scale differently. The critical distance to be evaluated is the distance between the peak and the valley of a given bump on the profile. The depth is the same for each device. The intent of Figures 12 and 13 is to demonstrate how all devices measured the peaks and valleys.
-0.5
0.0
-0.5
0.0
0.5
-0.250.000.25
0.0
0.5
0 50 100 150 200 250 300 350 400 450 500 550
Multiple Devices (Grade Removed)
Ele
vatio
n (in
)E
leva
tion
(in)
Ele
vatio
n (in
)E
leva
tion
(in)
Distance (feet)
Device 5 PA Site 7 Pass 1 Device 8 PA site 7 pass 1
Device 1 PA site 7 pass1 Device 3 PA site 7 pass 2
Slow Speed Inclinometer (Reference)
External Reference
Wet or Dry
Light Weight
21
-0.5
0.0
-0.5
0.0
-1.0-0.5
0.0
-0.5
0.0
0.5
0 50 100 150 200 250 300 350 400 450 500 550
Multiple Lines of Survey(Grade Removed)
Ele
vation (
in)
Ele
vation (
in)
Ele
vation (
in)
Ele
vation (
in)
Distance (feet)
Site 7 Device 5 Average Profile Device 13 PA site 7 pass 2
FAA LS Site 7 Pass 1 FAA HS Site 7 Pass 1
Slow Speed Inclinometer (Reference Profile)
Walking Speed Inclinometer
FAA Inertial Profiler (High Speed Mode)
FAA Inertial Profiler (Slow Speed Mode)
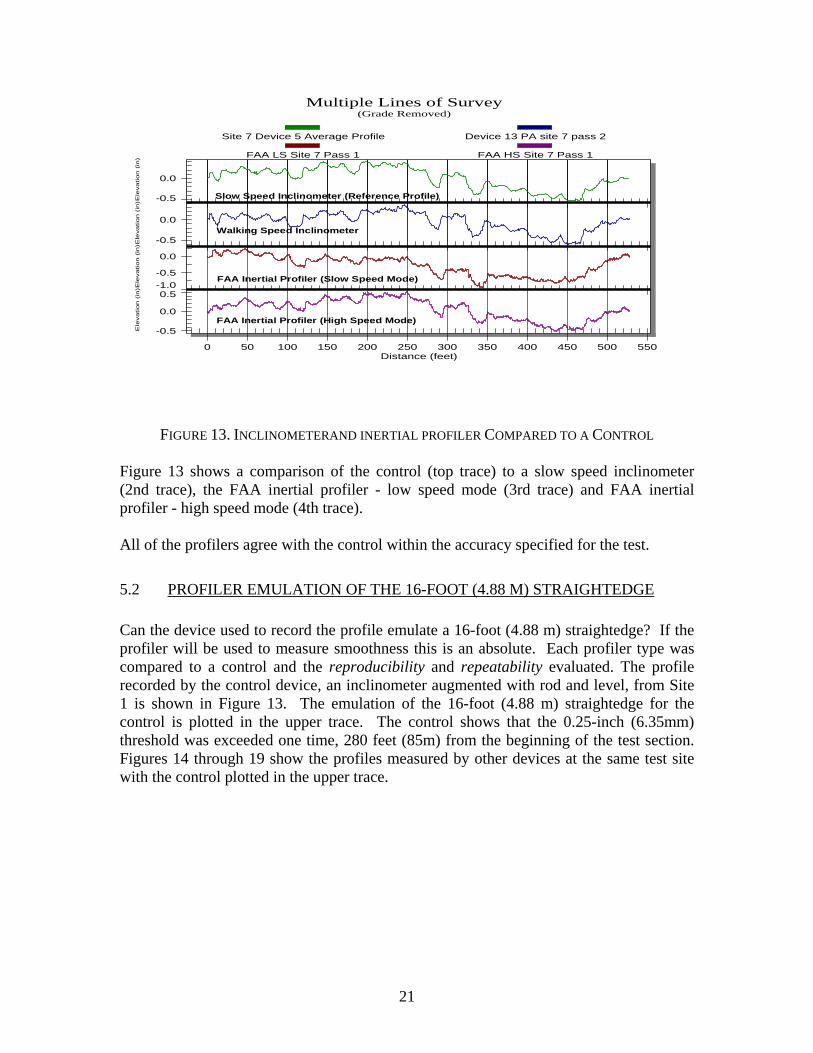
FIGURE 13. INCLINOMETERAND INERTIAL PROFILER COMPARED TO A CONTROL Figure 13 shows a comparison of the control (top trace) to a slow speed inclinometer (2nd trace), the FAA inertial profiler - low speed mode (3rd trace) and FAA inertial profiler - high speed mode (4th trace). All of the profilers agree with the control within the accuracy specified for the test.
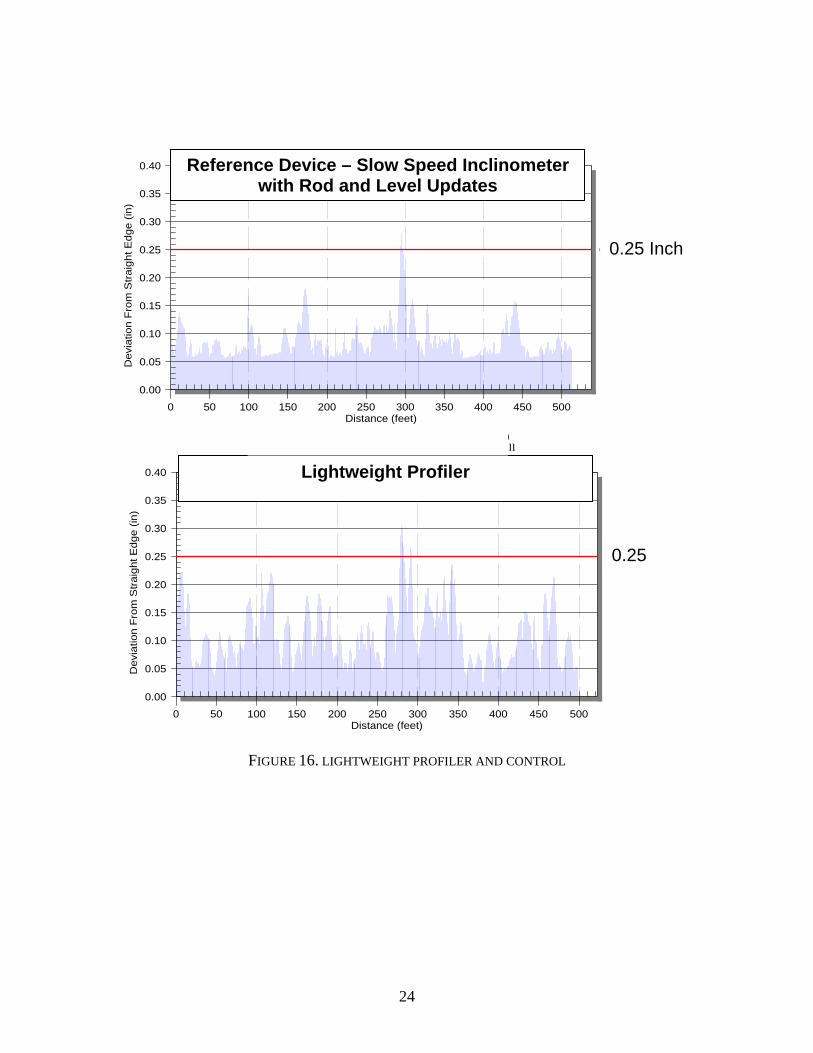
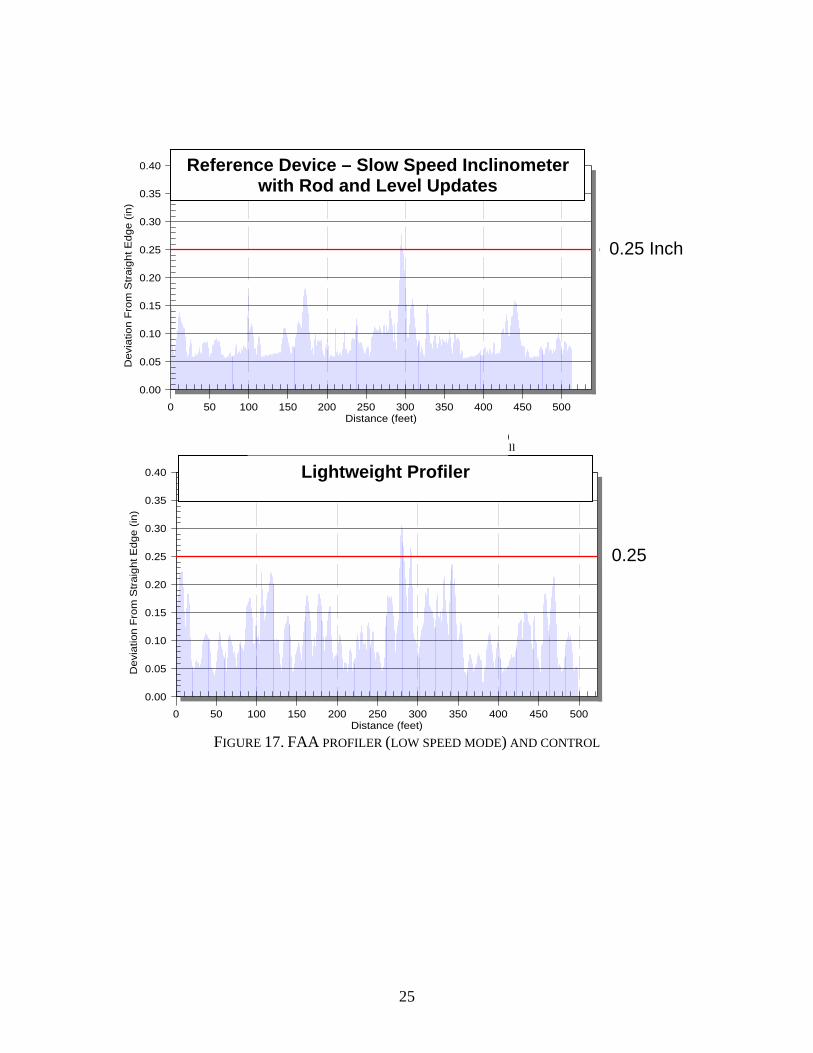
5.2 PROFILER EMULATION OF THE 16-FOOT (4.88 M) STRAIGHTEDGE Can the device used to record the profile emulate a 16-foot (4.88 m) straightedge? If the profiler will be used to measure smoothness this is an absolute. Each profiler type was compared to a control and the reproducibility and repeatability evaluated. The profile recorded by the control device, an inclinometer augmented with rod and level, from Site 1 is shown in Figure 13. The emulation of the 16-foot (4.88 m) straightedge for the control is plotted in the upper trace. The control shows that the 0.25-inch (6.35mm) threshold was exceeded one time, 280 feet (85m) from the beginning of the test section. Figures 14 through 19 show the profiles measured by other devices at the same test site with the control plotted in the upper trace.

22
FIGURE 14. SLOW SPEED INCLINOMETER WITH AND WITHOUT ROD & LEVEL UPDATES
0.00
0.05
0.10
0.15
0.20
0.25
0.30
0.35
0.40
0 50 100 150 200 250 300 350 400 450 500
0.25
0.0 0.0 2.4 0.0 0.0
Starting Point = 0 (ft) Threshold Value = 0.25 (in)Percent Exceeded Threshold (0.25 in) = 0.46% Overall
Dev
iatio
n Fr
om S
traig
ht E
dge
(in)
Distance (feet)
Slow Speed Inclinometer Without Rod & Level Updates
0.25 Inch
0.00
0.05
0.10
0.15
0.20
0.25
0.30
0.35
0.40
0 50 100 150 200 250 300 350 400 450 500
0.25
0.0 0.0 2.4 0.0 0.0
Starting Point = 0 (ft) Threshold Value = 0.25 (in)Percent Exceeded Threshold (0.25 in) = 0.46% Overall
Dev
iatio
n Fr
om S
traig
ht E
dge
(in)
Distance (feet)
0.25 Inch
Reference Device – Slow Speed Inclinometer with Rod and Level Updates

23
FIGURE 15. WALKING SPEED INCLINOMETER AND CONTROL
0.00
0.05
0.10
0.15
0.20
0.25
0.30
0.35
0.40
0 50 100 150 200 250 300 350 400 450 500
0.25
3.3 0.0 7.4 0.0 0.0
Starting Point = 0 (ft) Threshold Value = 0.25 (in)Percent Exceeded Threshold (0.25 in) = 2.08% Overall
Dev
iatio
n Fr
om S
traig
ht E
dge
(in)
Distance (feet)
0.00
0.05
0.10
0.15
0.20
0.25
0.30
0.35
0.40
0 50 100 150 200 250 300 350 400 450 500
0.25
0.0 0.0 2.4 0.0 0.0
Starting Point = 0 (ft) Threshold Value = 0.25 (in)Percent Exceeded Threshold (0.25 in) = 0.46% Overall
Dev
iatio
n Fr
om S
traig
ht E
dge
(in)
Distance (feet)
0.25 Inch
Reference Device – Slow Speed Inclinometer with Rod and Level Updates
Walking Speed Inclinometer
0.25 Inch
24
FIGURE 16. LIGHTWEIGHT PROFILER AND CONTROL
0.00
0.05
0.10
0.15
0.20
0.25
0.30
0.35
0.40
0 50 100 150 200 250 300 350 400 450 500
0.25
0.0 0.0 4.8 0.0 0.0
Starting Point = 0 (ft) Threshold Value = 0.25 (in)Percent Exceeded Threshold (0.25 in) = 0.96% Overall
Dev
iatio
n Fr
om S
traig
ht E
dge
(in)
Distance (feet)
0.00
0.05
0.10
0.15
0.20
0.25
0.30
0.35
0.40
0 50 100 150 200 250 300 350 400 450 500
0.25
0.0 0.0 2.4 0.0 0.0
Starting Point = 0 (ft) Threshold Value = 0.25 (in)Percent Exceeded Threshold (0.25 in) = 0.46% Overall
Dev
iatio
n Fr
om S
traig
ht E
dge
(in)
Distance (feet)
0.25 Inch
Reference Device – Slow Speed Inclinometer with Rod and Level Updates
Lightweight Profiler
0.25
25
FIGURE 17. FAA PROFILER (LOW SPEED MODE) AND CONTROL
0.00
0.05
0.10
0.15
0.20
0.25
0.30
0.35
0.40
0 50 100 150 200 250 300 350 400 450 500
0.25
0.0 0.0 4.8 0.0 0.0
Starting Point = 0 (ft) Threshold Value = 0.25 (in)Percent Exceeded Threshold (0.25 in) = 0.96% Overall
Dev
iatio
n Fr
om S
traig
ht E
dge
(in)
Distance (feet)
0.00
0.05
0.10
0.15
0.20
0.25
0.30
0.35
0.40
0 50 100 150 200 250 300 350 400 450 500
0.25
0.0 0.0 2.4 0.0 0.0
Starting Point = 0 (ft) Threshold Value = 0.25 (in)Percent Exceeded Threshold (0.25 in) = 0.46% Overall
Dev
iatio
n Fr
om S
traig
ht E
dge
(in)
Distance (feet)
0.25 Inch
Reference Device – Slow Speed Inclinometer with Rod and Level Updates
Lightweight Profiler
0.25

26
FIGURE 18. FAA PROFILER (HIGH SPEED MODE) AND CONTROL
0.00
0.05
0.10
0.15
0.20
0.25
0.30
0.35
0.40
0 50 100 150 200 250 300 350 400 450 500
0.25
0.0 0.0 2.4 0.0 0.0
Starting Point = 0 (ft) Threshold Value = 0.25 (in)Percent Exceeded Threshold (0.25 in) = 0.46% Overall
Dev
iatio
n Fr
om S
traig
ht E
dge
(in)
Distance (feet)
0.25
Reference Device – Slow Speed Inclinometer with Rod and Level Updates
0.00
0.05
0.10
0.15
0.20
0.25
0.30
0.35
0.40
0 50 100 150 200 250 300 350 400 450 500
0.25
0.0 0.0 3.8 0.0 0.0
Starting Point = 0 (ft) Threshold Value = 0.25 (in)Percent Exceeded Threshold (0.25 in) = 0.74% Overall
Dev
iatio
n Fr
om S
traig
ht E
dge
(in)
Distance (feet)
0.25
FAA Inertial Profiler, High Speed Mode

27
FIGURE 19. WET OR DRY PROFILER AND CONTROL
0.00
0.05
0.10
0.15
0.20
0.25
0.30
0.35
0.40
0 50 100 150 200 250 300 350 400 450 500
0.25
0.0 0.0 2.4 0.0 0.0
Starting Point = 0 (ft) Threshold Value = 0.25 (in)Percent Exceeded Threshold (0.25 in) = 0.46% Overall
Dev
iatio
n Fr
om S
traig
ht E
dge
(in)
Distance (feet)
0.25 Inch
Reference Device – Slow Speed Inclinometer with Rod and Level Updates
0.00
0.05
0.10
0.15
0.20
0.25
0.30
0.35
0.40
0 50 100 150 200 250 300 350 400 450 500
0.25
0.0 0.0 1.0 0.0 0.0
Starting Point = 0 (ft) Threshold Value = 0.25 (in)Percent Exceeded Threshold (0.25 in) = 0.20% Overall
Dev
iatio
n Fr
om S
traig
ht E
dge
(in)
Distance (feet)
0.25 Inch
Wet or Dry Profiler
28
0.00
0.05
0.10
0.15
0.20
0.25
0.30
0.35
0.40
0 50 100 150 200 250 300 350 400 450 500
0.25
0.0 0.0 2.4 0.0 0.0
Starting Point = 0 (ft) Threshold Value = 0.25 (in)Percent Exceeded Threshold (0.25 in) = 0.46% Overall
Dev
iatio
n Fr
om S
traig
ht E
dge
(in)
Distance (feet)
.25 Inch
Reference Device – Slow Speed Inclinometer with Rod and Level Updates
0.00
0.05
0.10
0.15
0.20
0.25
0.30
0.35
0.40
0 50 100 150 200 250 300 350 400 450 500
0.25
0.0 0.0 6.0 5.0 0.0
Starting Point = 0 (ft) Threshold Value = 0.25 (in)Percent Exceeded Threshold (0.25 in) = 2.14% Overall
Dev
iatio
n Fr
om S
traig
ht E
dge
(in)
Distance (feet)
0.25 Inch
Reference Device – Slow Speed Inclinometer with Rod and Level Updates
0.25 Inch
Reference Device – Slow Speed Inclinometer with Rod and Level Updates
0.25 Inch
External Reference Profiler
FIGURE 20. EXTERNAL REFERENCE PROFILER AND CONTROL
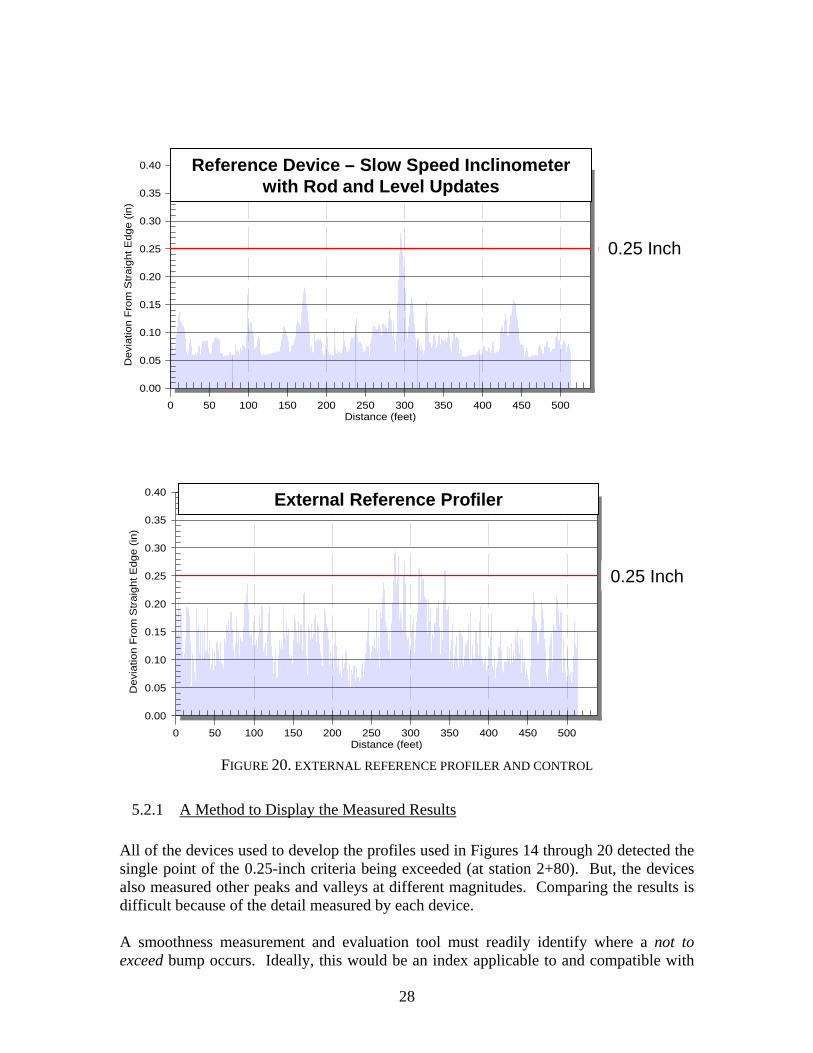
5.2.1 A Method to Display the Measured Results All of the devices used to develop the profiles used in Figures 14 through 20 detected the single point of the 0.25-inch criteria being exceeded (at station 2+80). But, the devices also measured other peaks and valleys at different magnitudes. Comparing the results is difficult because of the detail measured by each device. A smoothness measurement and evaluation tool must readily identify where a not to exceed bump occurs. Ideally, this would be an index applicable to and compatible with
29
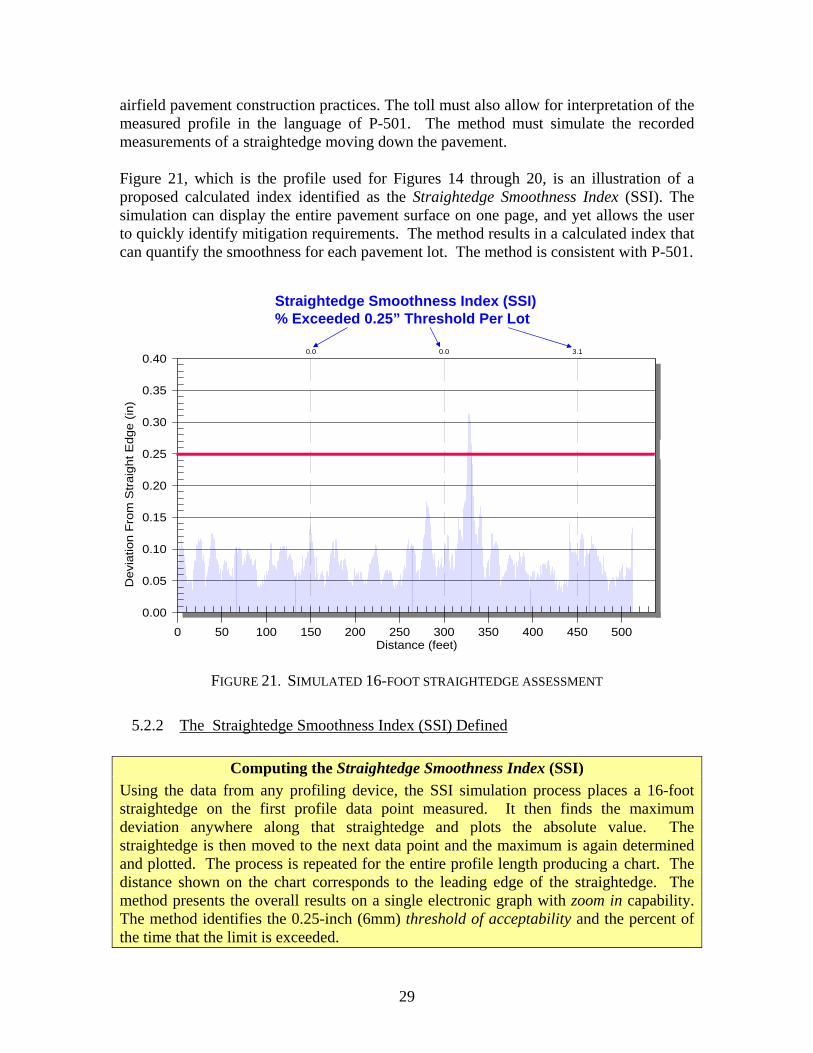
airfield pavement construction practices. The toll must also allow for interpretation of the measured profile in the language of P-501. The method must simulate the recorded measurements of a straightedge moving down the pavement. Figure 21, which is the profile used for Figures 14 through 20, is an illustration of a proposed calculated index identified as the Straightedge Smoothness Index (SSI). The simulation can display the entire pavement surface on one page, and yet allows the user to quickly identify mitigation requirements. The method results in a calculated index that can quantify the smoothness for each pavement lot. The method is consistent with P-501.
0.00
0.05
0.10
0.15
0.20
0.25
0.30
0.35
0.40
0 50 100 150 200 250 300 350 400 450 500
0.25
0.0 0.0 3.1
Starting Point = 0 (ft) Threshold Value = 0.25 (in)Percent Exceeded Threshold (0.25 in) = 0.90% Overall
Dev
iatio
n Fr
om S
traig
ht E
dge
(in)
Distance (feet)
Straightedge Smoothness Index (SSI)% Exceeded 0.25” Threshold Per Lot
FIGURE 21. SIMULATED 16-FOOT STRAIGHTEDGE ASSESSMENT
5.2.2 The Straightedge Smoothness Index (SSI) Defined
Computing the Straightedge Smoothness Index (SSI) Using the data from any profiling device, the SSI simulation process places a 16-foot straightedge on the first profile data point measured. It then finds the maximum deviation anywhere along that straightedge and plots the absolute value. The straightedge is then moved to the next data point and the maximum is again determined and plotted. The process is repeated for the entire profile length producing a chart. The distance shown on the chart corresponds to the leading edge of the straightedge. The method presents the overall results on a single electronic graph with zoom in capability. The method identifies the 0.25-inch (6mm) threshold of acceptability and the percent of the time that the limit is exceeded.
30
The method used divides the pavement into lots and quantifies each lot with a Straightedge Smoothness Index (SSI). The SSI concept reflects the percentage of occurrences that the threshold value is exceeded per lot. Appendix A includes a technique developed by APR Consultants for calculating the SSI. A similar calculation can be accomplished using the program PROFAA developed by the FAA Hughes Technical Center, Atlantic City, NJ. PROFFA will compute the SSI.
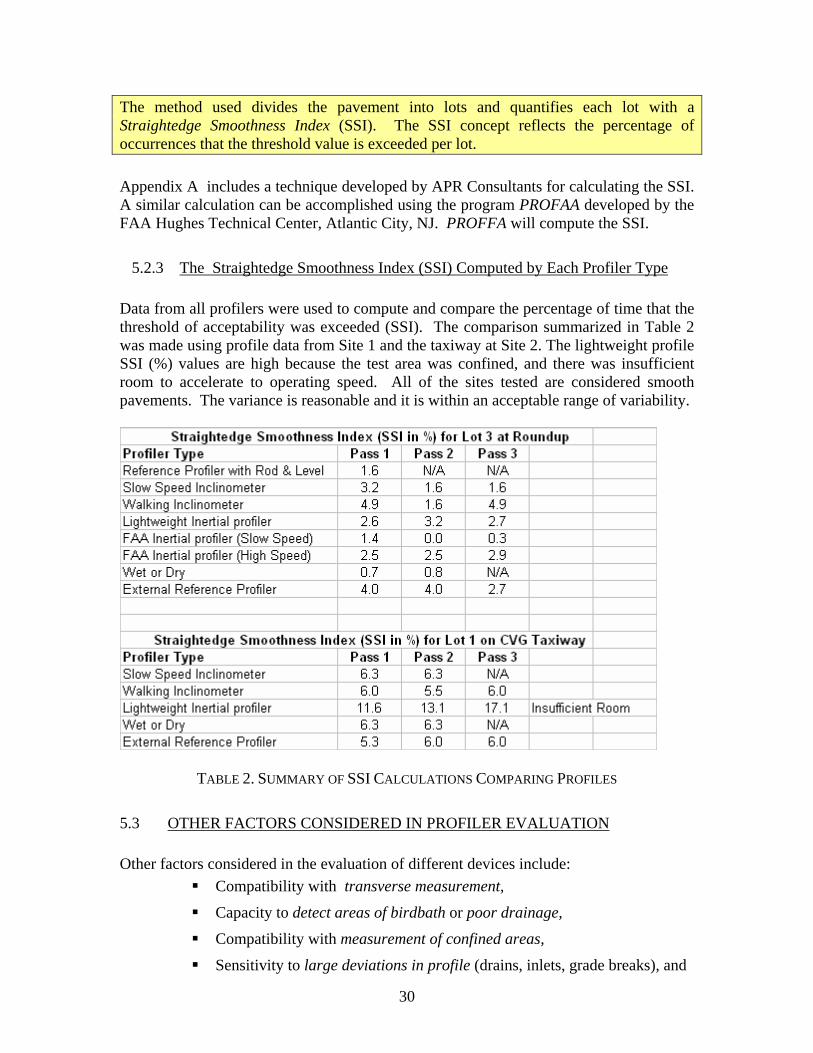
5.2.3 The Straightedge Smoothness Index (SSI) Computed by Each Profiler Type Data from all profilers were used to compute and compare the percentage of time that the threshold of acceptability was exceeded (SSI). The comparison summarized in Table 2 was made using profile data from Site 1 and the taxiway at Site 2. The lightweight profile SSI (%) values are high because the test area was confined, and there was insufficient room to accelerate to operating speed. All of the sites tested are considered smooth pavements. The variance is reasonable and it is within an acceptable range of variability.
TABLE 2. SUMMARY OF SSI CALCULATIONS COMPARING PROFILES
5.3 OTHER FACTORS CONSIDERED IN PROFILER EVALUATION Other factors considered in the evaluation of different devices include:
Compatibility with transverse measurement,
Capacity to detect areas of birdbath or poor drainage,
Compatibility with measurement of confined areas,
Sensitivity to large deviations in profile (drains, inlets, grade breaks), and
31
Variability when computing the SSI. The devices evaluated at Site 2 for the other factors included a lightweight profiler, a slow speed inclinometer, a walking inclinometer, an external reference profiler, and the wet / dry profiler.
5.3.1 Transverse Measurements Excluding the lightweight profiler, all of the devices tested have the capability to conduct transverse measurements. The primary reason for conducting transverse measurements is for drainage and not specifically smoothness. To evaluate drainage, the measured profile must be based upon mean sea level elevations. The devices that measure relative profile, i.e., high or low speed inertial profilers, profilographs and the physical straightedge, will not detect bird bath conditions. The straightedge will detect vertical misalignment at joints where runoff water will be trapped unless there is a longitudinal slope.
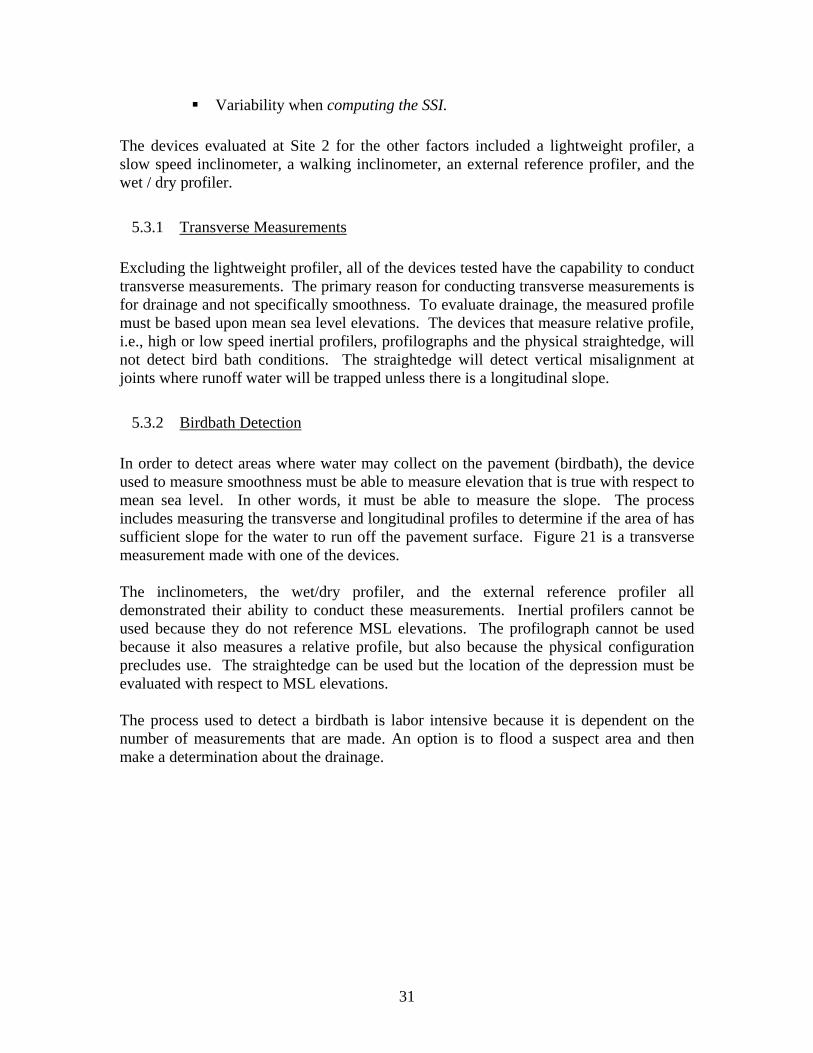
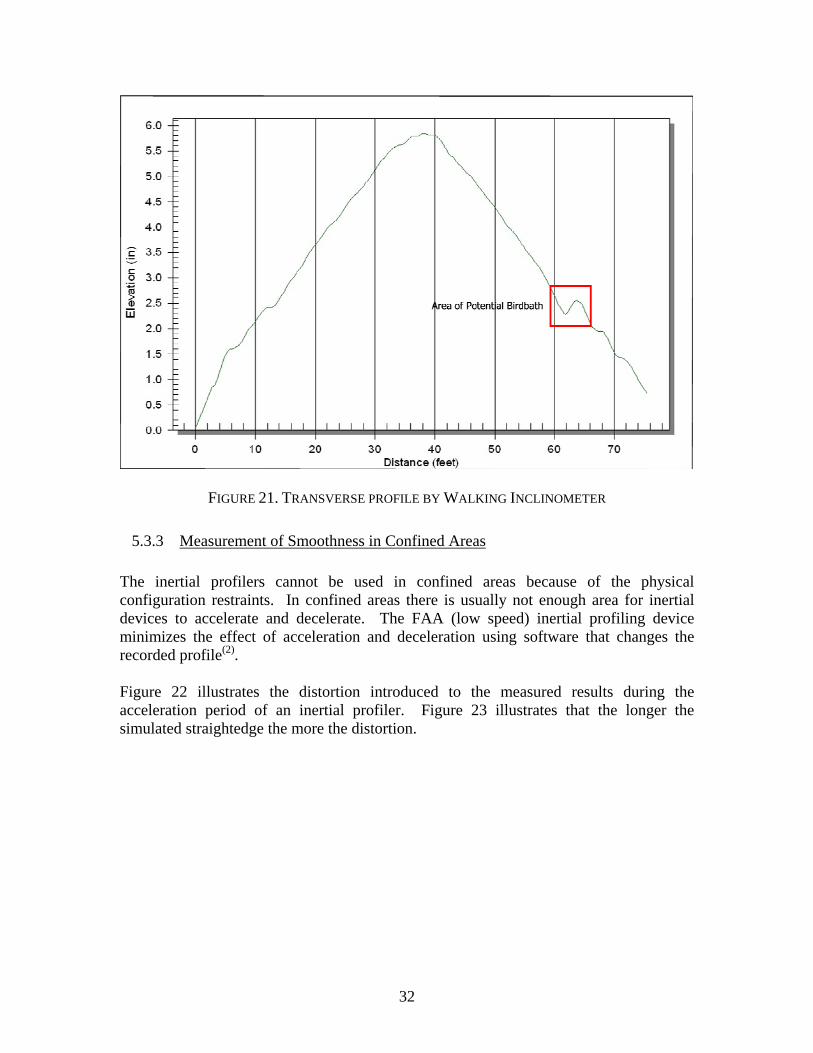
5.3.2 Birdbath Detection In order to detect areas where water may collect on the pavement (birdbath), the device used to measure smoothness must be able to measure elevation that is true with respect to mean sea level. In other words, it must be able to measure the slope. The process includes measuring the transverse and longitudinal profiles to determine if the area of has sufficient slope for the water to run off the pavement surface. Figure 21 is a transverse measurement made with one of the devices. The inclinometers, the wet/dry profiler, and the external reference profiler all demonstrated their ability to conduct these measurements. Inertial profilers cannot be used because they do not reference MSL elevations. The profilograph cannot be used because it also measures a relative profile, but also because the physical configuration precludes use. The straightedge can be used but the location of the depression must be evaluated with respect to MSL elevations. The process used to detect a birdbath is labor intensive because it is dependent on the number of measurements that are made. An option is to flood a suspect area and then make a determination about the drainage.
32
FIGURE 21. TRANSVERSE PROFILE BY WALKING INCLINOMETER
5.3.3 Measurement of Smoothness in Confined Areas The inertial profilers cannot be used in confined areas because of the physical configuration restraints. In confined areas there is usually not enough area for inertial devices to accelerate and decelerate. The FAA (low speed) inertial profiling device minimizes the effect of acceleration and deceleration using software that changes the recorded profile(2). Figure 22 illustrates the distortion introduced to the measured results during the acceleration period of an inertial profiler. Figure 23 illustrates that the longer the simulated straightedge the more the distortion.
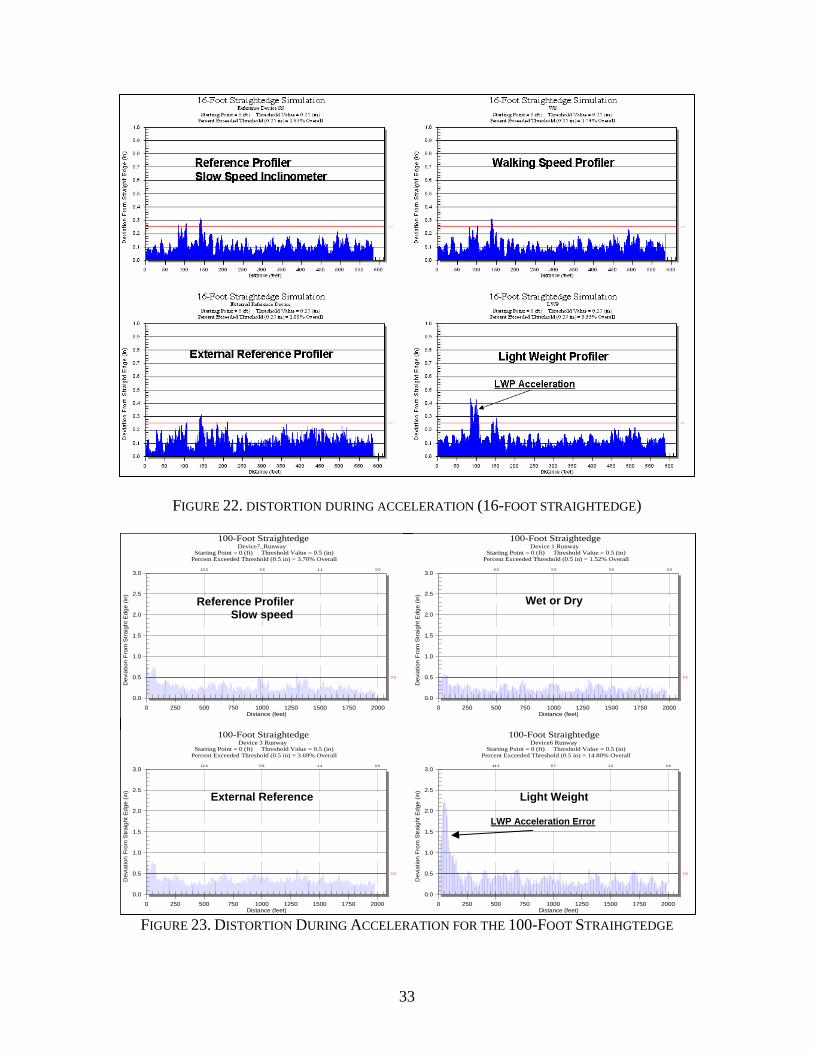
33
FIGURE 22. DISTORTION DURING ACCELERATION (16-FOOT STRAIGHTEDGE)
FIGURE 23. DISTORTION DURING ACCELERATION FOR THE 100-FOOT STRAIHGTEDGE
0.0
0.5
1.0
1.5
2.0
2.5
3.0
0 250 500 750 1000 1250 1500 1750 2000
0.5
13.0 0.5 1.1 0.0
100-Foot StraightedgeDevice7_Runway
Starting Point = 0 (ft) Threshold Value = 0.5 (in)Percent Exceeded Threshold (0.5 in) = 3.70% Overall
Dev
iatio
n Fr
om S
traig
ht E
dge
(in)
Distance (feet)
Reference Profiler Slow speed
0.0
0.5
1.0
1.5
2.0
2.5
3.0
0 250 500 750 1000 1250 1500 1750 2000
0.5
6.0 0.0 0.0 0.0
100-Foot StraightedgeDevice 1 Runway
Starting Point = 0 (ft) Threshold Value = 0.5 (in)Percent Exceeded Threshold (0.5 in) = 1.52% Overall
Dev
iatio
n Fr
om S
traig
ht E
dge
(in)
Distance (feet)
Wet or Dry
0.0
0.5
1.0
1.5
2.0
2.5
3.0
0 250 500 750 1000 1250 1500 1750 2000
0.5
12.4 0.8 1.4 0.0
100-Foot StraightedgeDevice 3 Runway
Starting Point = 0 (ft) Threshold Value = 0.5 (in)Percent Exceeded Threshold (0.5 in) = 3.69% Overall
Dev
iatio
n Fr
om S
traig
ht E
dge
(in)
Distance (feet)
External Reference
0.0
0.5
1.0
1.5
2.0
2.5
3.0
0 250 500 750 1000 1250 1500 1750 2000
0.5
44.3 9.7 1.2 3.8
100-Foot Straightedge Device6 Runway
Starting Point = 0 (ft) Threshold Value = 0.5 (in)Percent Exceeded Threshold (0.5 in) = 14.80% Overall
Dev
iatio
n Fr
om S
traig
ht E
dge
(in)
Distance (feet)
LWP Acceleration Error
Light Weight
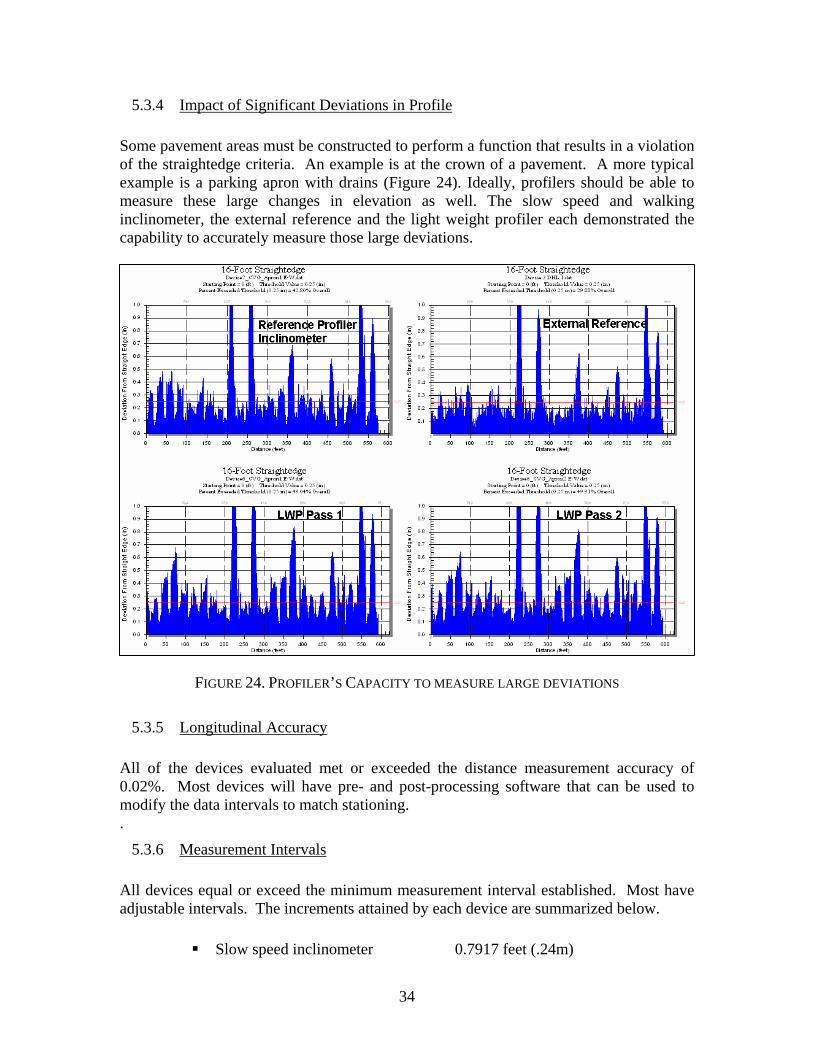
34
5.3.4 Impact of Significant Deviations in Profile Some pavement areas must be constructed to perform a function that results in a violation of the straightedge criteria. An example is at the crown of a pavement. A more typical example is a parking apron with drains (Figure 24). Ideally, profilers should be able to measure these large changes in elevation as well. The slow speed and walking inclinometer, the external reference and the light weight profiler each demonstrated the capability to accurately measure those large deviations.
FIGURE 24. PROFILER’S CAPACITY TO MEASURE LARGE DEVIATIONS
5.3.5 Longitudinal Accuracy All of the devices evaluated met or exceeded the distance measurement accuracy of 0.02%. Most devices will have pre- and post-processing software that can be used to modify the data intervals to match stationing. .
5.3.6 Measurement Intervals All devices equal or exceed the minimum measurement interval established. Most have adjustable intervals. The increments attained by each device are summarized below.
Slow speed inclinometer 0.7917 feet (.24m)
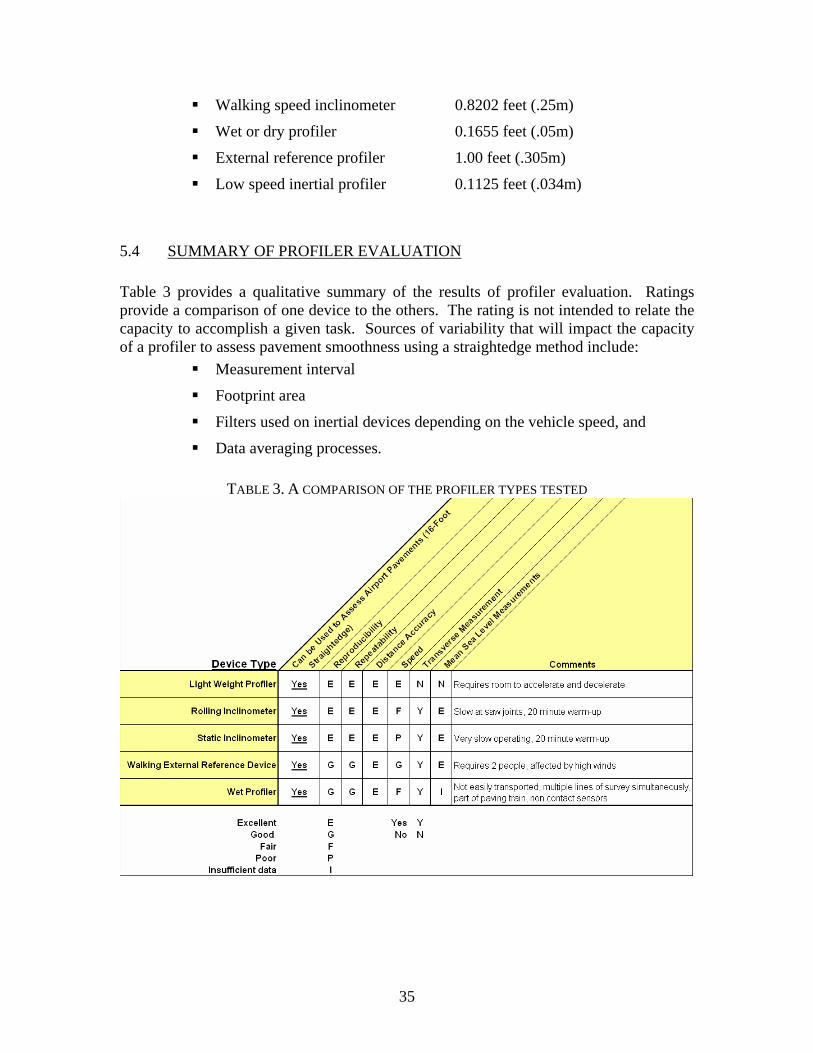
35
Walking speed inclinometer 0.8202 feet (.25m)
Wet or dry profiler 0.1655 feet (.05m)
External reference profiler 1.00 feet (.305m)
Low speed inertial profiler 0.1125 feet (.034m) 5.4 SUMMARY OF PROFILER EVALUATION Table 3 provides a qualitative summary of the results of profiler evaluation. Ratings provide a comparison of one device to the others. The rating is not intended to relate the capacity to accomplish a given task. Sources of variability that will impact the capacity of a profiler to assess pavement smoothness using a straightedge method include:
Measurement interval
Footprint area
Filters used on inertial devices depending on the vehicle speed, and
Data averaging processes.
TABLE 3. A COMPARISON OF THE PROFILER TYPES TESTED
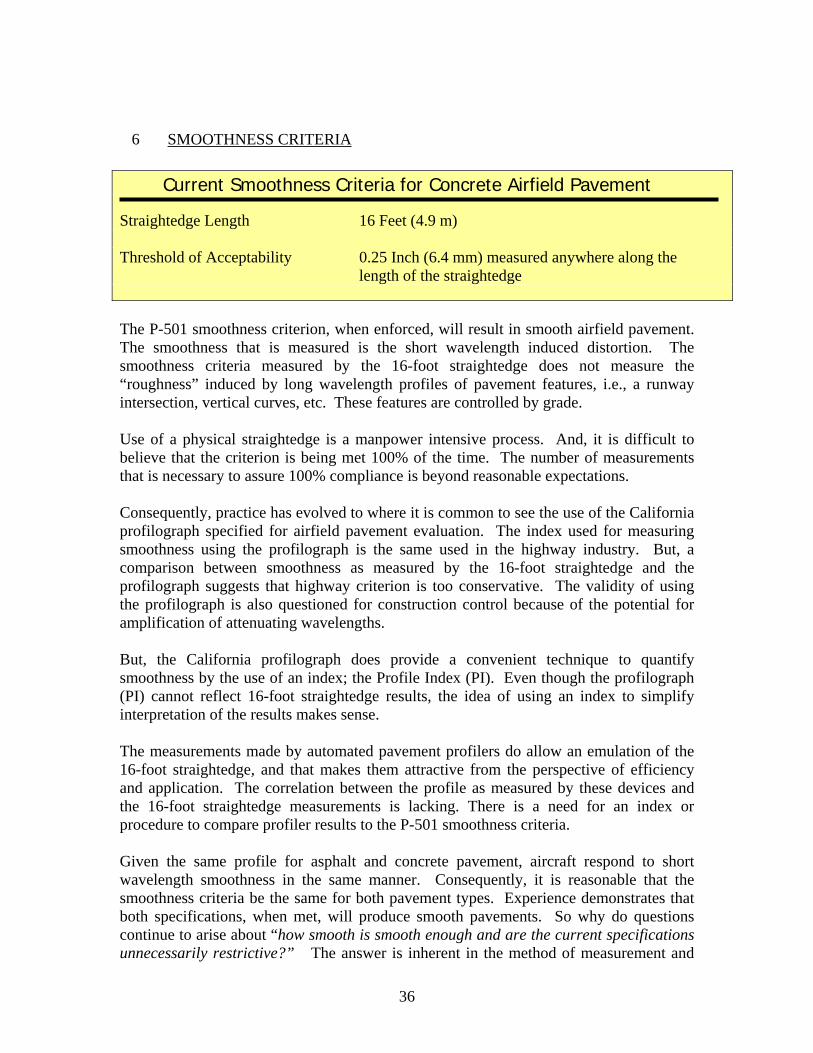
36
6 SMOOTHNESS CRITERIA
Current Smoothness Criteria for Concrete Airfield Pavement
Straightedge Length 16 Feet (4.9 m) Threshold of Acceptability 0.25 Inch (6.4 mm) measured anywhere along the length of the straightedge The P-501 smoothness criterion, when enforced, will result in smooth airfield pavement. The smoothness that is measured is the short wavelength induced distortion. The smoothness criteria measured by the 16-foot straightedge does not measure the “roughness” induced by long wavelength profiles of pavement features, i.e., a runway intersection, vertical curves, etc. These features are controlled by grade. Use of a physical straightedge is a manpower intensive process. And, it is difficult to believe that the criterion is being met 100% of the time. The number of measurements that is necessary to assure 100% compliance is beyond reasonable expectations. Consequently, practice has evolved to where it is common to see the use of the California profilograph specified for airfield pavement evaluation. The index used for measuring smoothness using the profilograph is the same used in the highway industry. But, a comparison between smoothness as measured by the 16-foot straightedge and the profilograph suggests that highway criterion is too conservative. The validity of using the profilograph is also questioned for construction control because of the potential for amplification of attenuating wavelengths. But, the California profilograph does provide a convenient technique to quantify smoothness by the use of an index; the Profile Index (PI). Even though the profilograph (PI) cannot reflect 16-foot straightedge results, the idea of using an index to simplify interpretation of the results makes sense. The measurements made by automated pavement profilers do allow an emulation of the 16-foot straightedge, and that makes them attractive from the perspective of efficiency and application. The correlation between the profile as measured by these devices and the 16-foot straightedge measurements is lacking. There is a need for an index or procedure to compare profiler results to the P-501 smoothness criteria. Given the same profile for asphalt and concrete pavement, aircraft respond to short wavelength smoothness in the same manner. Consequently, it is reasonable that the smoothness criteria be the same for both pavement types. Experience demonstrates that both specifications, when met, will produce smooth pavements. So why do questions continue to arise about “how smooth is smooth enough and are the current specifications unnecessarily restrictive?” The answer is inherent in the method of measurement and
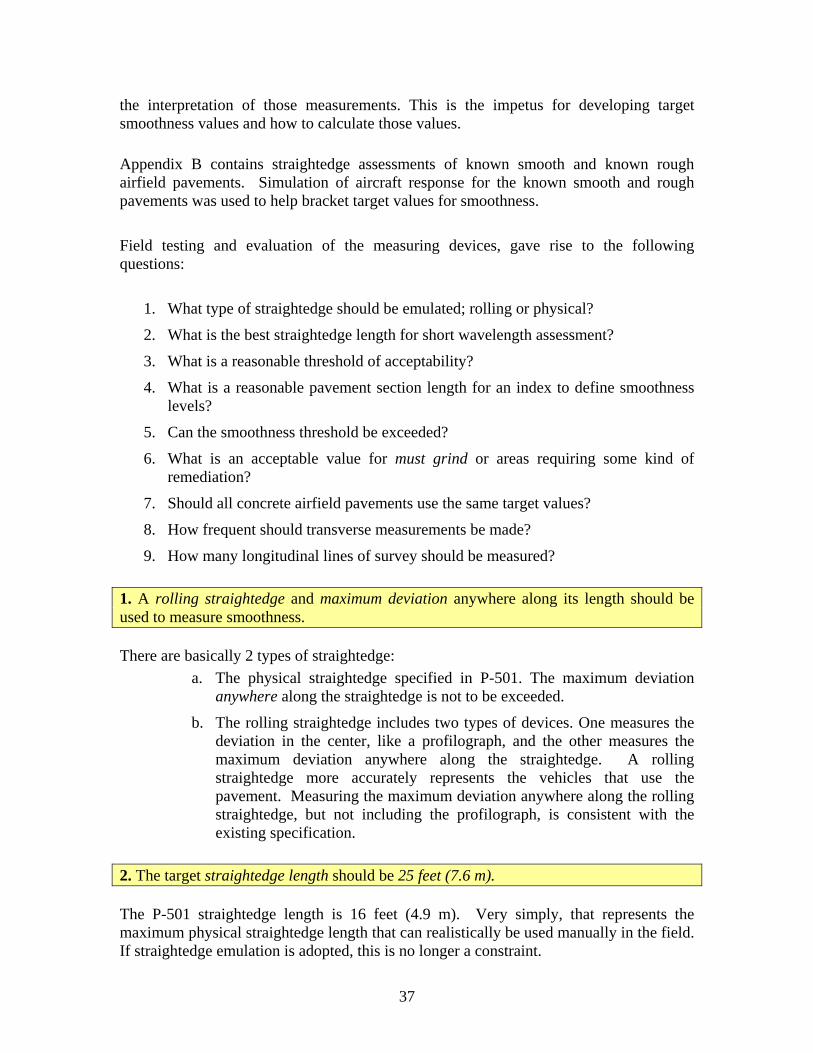
37
the interpretation of those measurements. This is the impetus for developing target smoothness values and how to calculate those values. Appendix B contains straightedge assessments of known smooth and known rough airfield pavements. Simulation of aircraft response for the known smooth and rough pavements was used to help bracket target values for smoothness. Field testing and evaluation of the measuring devices, gave rise to the following questions:
1. What type of straightedge should be emulated; rolling or physical?
2. What is the best straightedge length for short wavelength assessment?
3. What is a reasonable threshold of acceptability?
4. What is a reasonable pavement section length for an index to define smoothness levels?
5. Can the smoothness threshold be exceeded?
6. What is an acceptable value for must grind or areas requiring some kind of remediation?
7. Should all concrete airfield pavements use the same target values?
8. How frequent should transverse measurements be made?
9. How many longitudinal lines of survey should be measured? 1. A rolling straightedge and maximum deviation anywhere along its length should be used to measure smoothness. There are basically 2 types of straightedge:
a. The physical straightedge specified in P-501. The maximum deviation anywhere along the straightedge is not to be exceeded.
b. The rolling straightedge includes two types of devices. One measures the deviation in the center, like a profilograph, and the other measures the maximum deviation anywhere along the straightedge. A rolling straightedge more accurately represents the vehicles that use the pavement. Measuring the maximum deviation anywhere along the rolling straightedge, but not including the profilograph, is consistent with the existing specification.
2. The target straightedge length should be 25 feet (7.6 m). The P-501 straightedge length is 16 feet (4.9 m). Very simply, that represents the maximum physical straightedge length that can realistically be used manually in the field. If straightedge emulation is adopted, this is no longer a constraint.
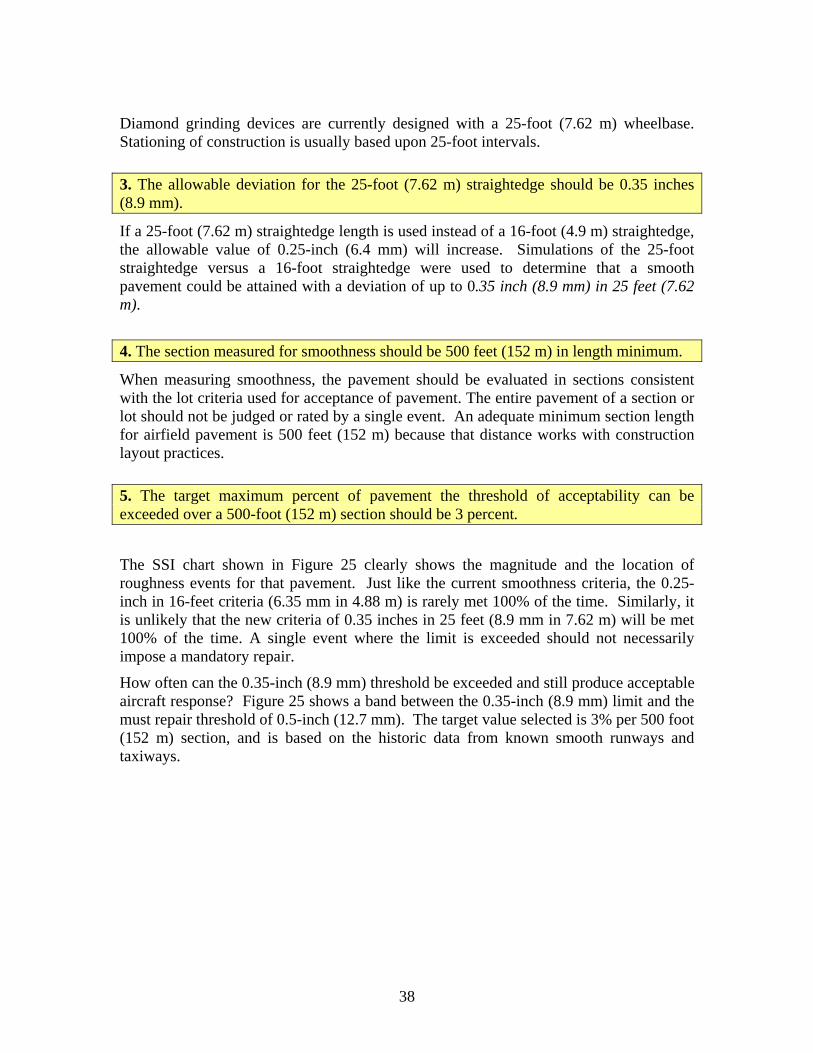
38
Diamond grinding devices are currently designed with a 25-foot (7.62 m) wheelbase. Stationing of construction is usually based upon 25-foot intervals. 3. The allowable deviation for the 25-foot (7.62 m) straightedge should be 0.35 inches (8.9 mm).
If a 25-foot (7.62 m) straightedge length is used instead of a 16-foot (4.9 m) straightedge, the allowable value of 0.25-inch (6.4 mm) will increase. Simulations of the 25-foot straightedge versus a 16-foot straightedge were used to determine that a smooth pavement could be attained with a deviation of up to 0.35 inch (8.9 mm) in 25 feet (7.62 m).
4. The section measured for smoothness should be 500 feet (152 m) in length minimum.
When measuring smoothness, the pavement should be evaluated in sections consistent with the lot criteria used for acceptance of pavement. The entire pavement of a section or lot should not be judged or rated by a single event. An adequate minimum section length for airfield pavement is 500 feet (152 m) because that distance works with construction layout practices.
5. The target maximum percent of pavement the threshold of acceptability can be exceeded over a 500-foot (152 m) section should be 3 percent.
The SSI chart shown in Figure 25 clearly shows the magnitude and the location of roughness events for that pavement. Just like the current smoothness criteria, the 0.25-inch in 16-feet criteria (6.35 mm in 4.88 m) is rarely met 100% of the time. Similarly, it is unlikely that the new criteria of 0.35 inches in 25 feet (8.9 mm in 7.62 m) will be met 100% of the time. A single event where the limit is exceeded should not necessarily impose a mandatory repair.
How often can the 0.35-inch (8.9 mm) threshold be exceeded and still produce acceptable aircraft response? Figure 25 shows a band between the 0.35-inch (8.9 mm) limit and the must repair threshold of 0.5-inch (12.7 mm). The target value selected is 3% per 500 foot (152 m) section, and is based on the historic data from known smooth runways and taxiways.

39
Threshold of acceptability
0.0
0.1
0.2
0.3
0.4
0.5
0.6
0.7
0.8
0.9
1.0
0 50 100 150 200 250 300 350 400 450 500
0.25
0.0 0.0 4.5 0.0 0.0
16-Foot Straightedge EmulationRunway 24R; Station 0+00 is at Painted Threshold
Starting Point = 0 (ft) Threshold Value = 0.25 (in)Percent Exceeded Threshold (0.25 in) = 0.88% Overall
Devi
atio
n F
rom
Str
aig
ht E
dge (
in)
Distance (feet)
Threshold of Acceptability
Must Repair
Straightedge Smoothness Index (SSI)
0.0 0.0 0.4 0.0 0.0
0.35
0.50
SSI Per Section (%)
.08% Overall SSI
Band of Allowable SSI (Must Not Exceed 3%)
FIGURE 25. STRAIGHTEDGE SMOOTHNESS INDEX (SSI) CHART
6. The recommended target value using the 25-foot (7.62 m) rolling straightedge for a must grind should be 0.5-inch (1.27 cm) for the keel section, and 0.75-inch (1.9 cm) for the outer lanes of a runway, and the outer lanes of a taxiway or apron.
The concept of must grind is common in the paving industry because of the use of profilographs. A must grind defines a level of unevenness where adjustment of the constructed profile is required. The profile data from smooth and rough pavements was utilized to establish a target must grind or must repair value. Viewing the actual profile in conjunction with a straightedge deviation plot helps in making decisions regarding remediation.
7. The target smoothness values should be the same for all airfield pavements. However, the must repair target value should be adjusted for certain pavements; i.e. outer lanes of taxiways and runways verses keel sections. Roughness (or smoothness outside the criteria defined herein) on an outer lane of a runway or taxiway is less likely to be problematic than the same roughness on the keel section of the same pavement. In addition, aircraft response will be different on a taxiway or parking apron than it will on a runway for several reasons:
The aircraft velocity is relatively low on a taxiway, and for the same amplitude bump, will generate different aircraft response. However,

40
lower-constant speeds have a higher probability of tuning the aircraft response to repeated bumps such as joints on concrete pavements.
There is less likelihood that the aircraft will wander off of the centerline of a taxiway or taxilane. Wandering off of the keel section of a runway is more likely to occur during landing, particularly during strong crosswind conditions or on runways contaminated with snow, ice, slush or water.
Low levels of roughness are more likely to be perceived by the pilot and passengers during taxi than during takeoff or landing. During takeoff and landing operations, large forces such as thrust, reverse thrust, braking and engine noise will have the tendency to overpower human perception of low-level pavement unevenness.
Adjustment to the must repair threshold of the pavement must allow for positive drainage for the pavement being evaluated.
8. The target interval recommended for transverse measurements is 500-foot (152 m) or whenever birdbath areas are suspected. More transverse measurements should be made in areas where warped pavement design is used. Transverse measurements are required to ensure proper drainage. When evaluating drainage, the transverse measurement must be interpreted to include the profile. A low spot on the transverse measurement may have positive drainage because of the longitudinal profile. 9. It is recommended that two lines of survey per paving lane in the direction of paving be used for smoothness measurements. Currently, many agencies specify the use of the California profilograph for smoothness assessment using two longitudinal lines of survey per paving lane. With automated profilers it is also practical to measure two lines of survey for smoothness using straightedge criteria as well. Table 4 provides a summary of the target smoothness parameters recommended. The target values are just that, targets. They are recommended based upon an analysis of empirical pavement profile data. Appendix B includes some of the empirical data and 25-foot SSI charts used in making determinations of quantitative data.
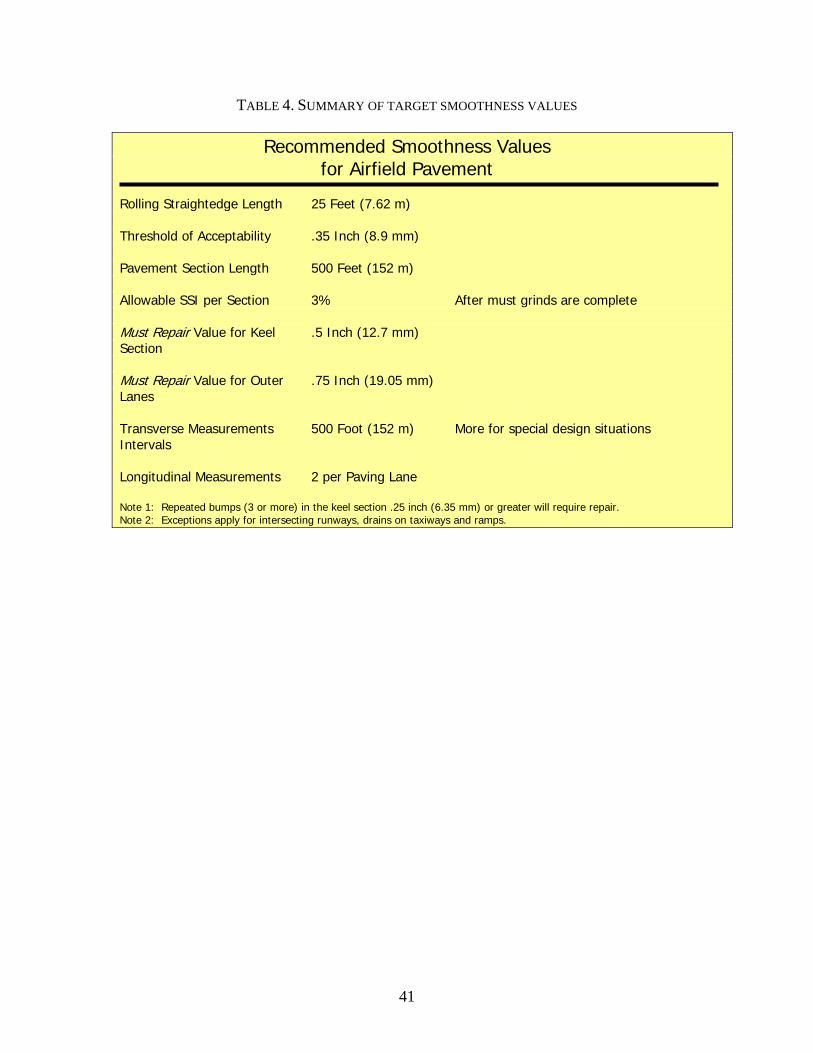
41
TABLE 4. SUMMARY OF TARGET SMOOTHNESS VALUES
Recommended Smoothness Values for Airfield Pavement
Rolling Straightedge Length 25 Feet (7.62 m) Threshold of Acceptability .35 Inch (8.9 mm) Pavement Section Length 500 Feet (152 m) Allowable SSI per Section 3% After must grinds are complete Must Repair Value for Keel .5 Inch (12.7 mm) Section Must Repair Value for Outer .75 Inch (19.05 mm) Lanes Transverse Measurements 500 Foot (152 m) More for special design situations Intervals Longitudinal Measurements 2 per Paving Lane Note 1: Repeated bumps (3 or more) in the keel section .25 inch (6.35 mm) or greater will require repair. Note 2: Exceptions apply for intersecting runways, drains on taxiways and ramps.
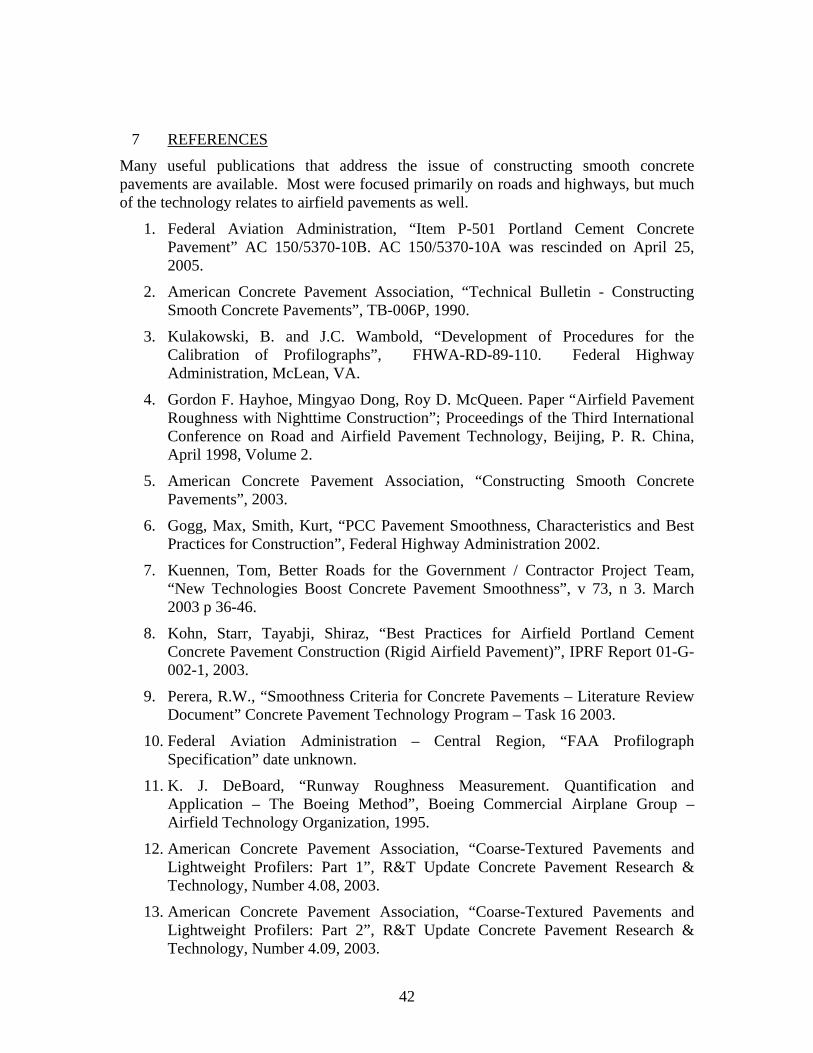
42
7 REFERENCES
Many useful publications that address the issue of constructing smooth concrete pavements are available. Most were focused primarily on roads and highways, but much of the technology relates to airfield pavements as well.
1. Federal Aviation Administration, “Item P-501 Portland Cement Concrete Pavement” AC 150/5370-10B. AC 150/5370-10A was rescinded on April 25, 2005.
2. American Concrete Pavement Association, “Technical Bulletin - Constructing Smooth Concrete Pavements”, TB-006P, 1990.
3. Kulakowski, B. and J.C. Wambold, “Development of Procedures for the Calibration of Profilographs”, FHWA-RD-89-110. Federal Highway Administration, McLean, VA.
4. Gordon F. Hayhoe, Mingyao Dong, Roy D. McQueen. Paper “Airfield Pavement Roughness with Nighttime Construction”; Proceedings of the Third International Conference on Road and Airfield Pavement Technology, Beijing, P. R. China, April 1998, Volume 2.
5. American Concrete Pavement Association, “Constructing Smooth Concrete Pavements”, 2003.
6. Gogg, Max, Smith, Kurt, “PCC Pavement Smoothness, Characteristics and Best Practices for Construction”, Federal Highway Administration 2002.
7. Kuennen, Tom, Better Roads for the Government / Contractor Project Team, “New Technologies Boost Concrete Pavement Smoothness”, v 73, n 3. March 2003 p 36-46.
8. Kohn, Starr, Tayabji, Shiraz, “Best Practices for Airfield Portland Cement Concrete Pavement Construction (Rigid Airfield Pavement)”, IPRF Report 01-G-002-1, 2003.
9. Perera, R.W., “Smoothness Criteria for Concrete Pavements – Literature Review Document” Concrete Pavement Technology Program – Task 16 2003.
10. Federal Aviation Administration – Central Region, “FAA Profilograph Specification” date unknown.
11. K. J. DeBoard, “Runway Roughness Measurement. Quantification and Application – The Boeing Method”, Boeing Commercial Airplane Group – Airfield Technology Organization, 1995.
12. American Concrete Pavement Association, “Coarse-Textured Pavements and Lightweight Profilers: Part 1”, R&T Update Concrete Pavement Research & Technology, Number 4.08, 2003.
13. American Concrete Pavement Association, “Coarse-Textured Pavements and Lightweight Profilers: Part 2”, R&T Update Concrete Pavement Research & Technology, Number 4.09, 2003.
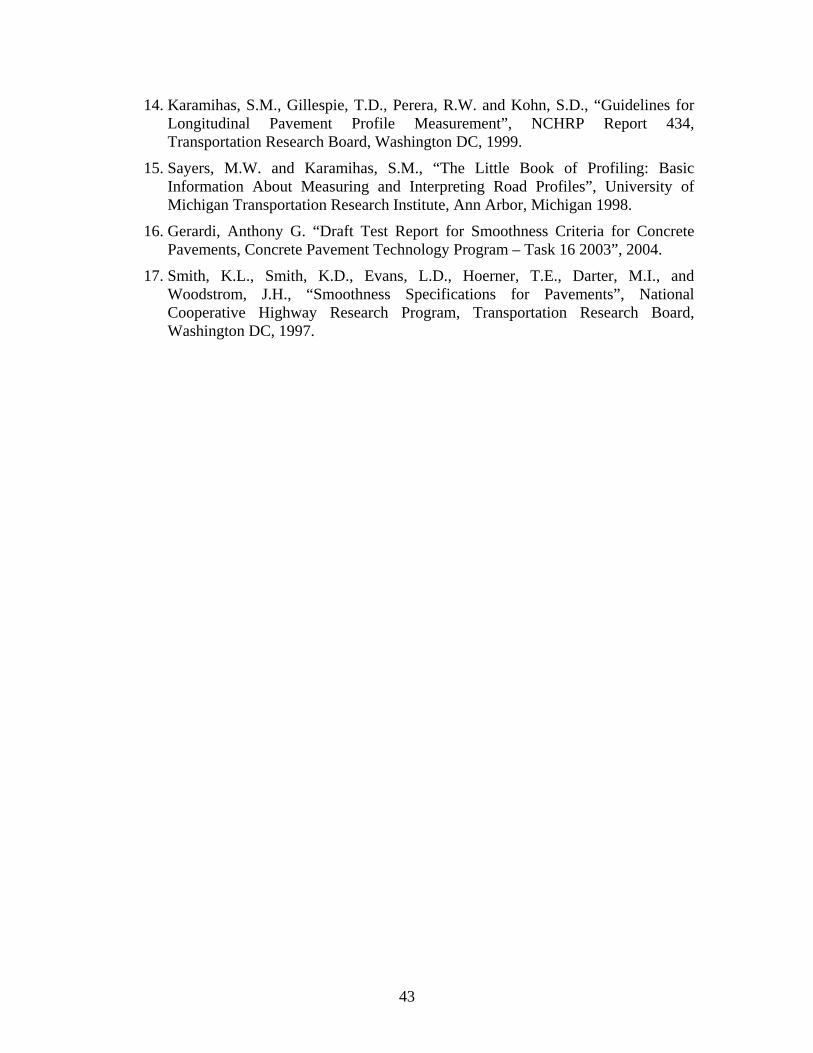
43
14. Karamihas, S.M., Gillespie, T.D., Perera, R.W. and Kohn, S.D., “Guidelines for Longitudinal Pavement Profile Measurement”, NCHRP Report 434, Transportation Research Board, Washington DC, 1999.
15. Sayers, M.W. and Karamihas, S.M., “The Little Book of Profiling: Basic Information About Measuring and Interpreting Road Profiles”, University of Michigan Transportation Research Institute, Ann Arbor, Michigan 1998.
16. Gerardi, Anthony G. “Draft Test Report for Smoothness Criteria for Concrete Pavements, Concrete Pavement Technology Program – Task 16 2003”, 2004.
17. Smith, K.L., Smith, K.D., Evans, L.D., Hoerner, T.E., Darter, M.I., and Woodstrom, J.H., “Smoothness Specifications for Pavements”, National Cooperative Highway Research Program, Transportation Research Board, Washington DC, 1997.
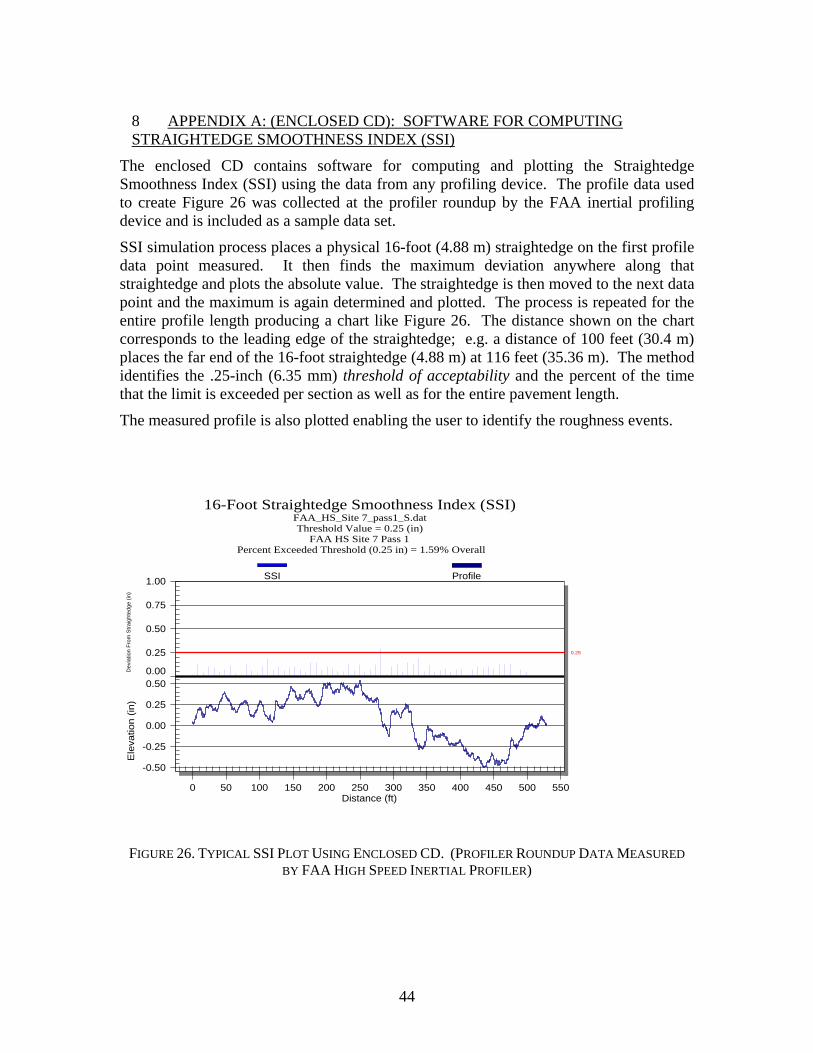
44
8 APPENDIX A: (ENCLOSED CD): SOFTWARE FOR COMPUTING STRAIGHTEDGE SMOOTHNESS INDEX (SSI)
The enclosed CD contains software for computing and plotting the Straightedge Smoothness Index (SSI) using the data from any profiling device. The profile data used to create Figure 26 was collected at the profiler roundup by the FAA inertial profiling device and is included as a sample data set.
SSI simulation process places a physical 16-foot (4.88 m) straightedge on the first profile data point measured. It then finds the maximum deviation anywhere along that straightedge and plots the absolute value. The straightedge is then moved to the next data point and the maximum is again determined and plotted. The process is repeated for the entire profile length producing a chart like Figure 26. The distance shown on the chart corresponds to the leading edge of the straightedge; e.g. a distance of 100 feet (30.4 m) places the far end of the 16-foot straightedge (4.88 m) at 116 feet (35.36 m). The method identifies the .25-inch (6.35 mm) threshold of acceptability and the percent of the time that the limit is exceeded per section as well as for the entire pavement length.
The measured profile is also plotted enabling the user to identify the roughness events.
0.00
0.25
0.50
0.75
1.00
-0.50
-0.25
0.00
0.25
0.50
0 50 100 150 200 250 300 350 400 450 500 550
0.25
16-Foot Straightedge Smoothness Index (SSI)FAA_HS_Site 7_pass1_S.datThreshold Value = 0.25 (in)
FAA HS Site 7 Pass 1Percent Exceeded Threshold (0.25 in) = 1.59% Overall
Dev
iatio
n Fr
om S
traig
hted
ge (i
n)E
leva
tion
(in)
Distance (ft)
SSI Profile
FIGURE 26. TYPICAL SSI PLOT USING ENCLOSED CD. (PROFILER ROUNDUP DATA MEASURED
BY FAA HIGH SPEED INERTIAL PROFILER)
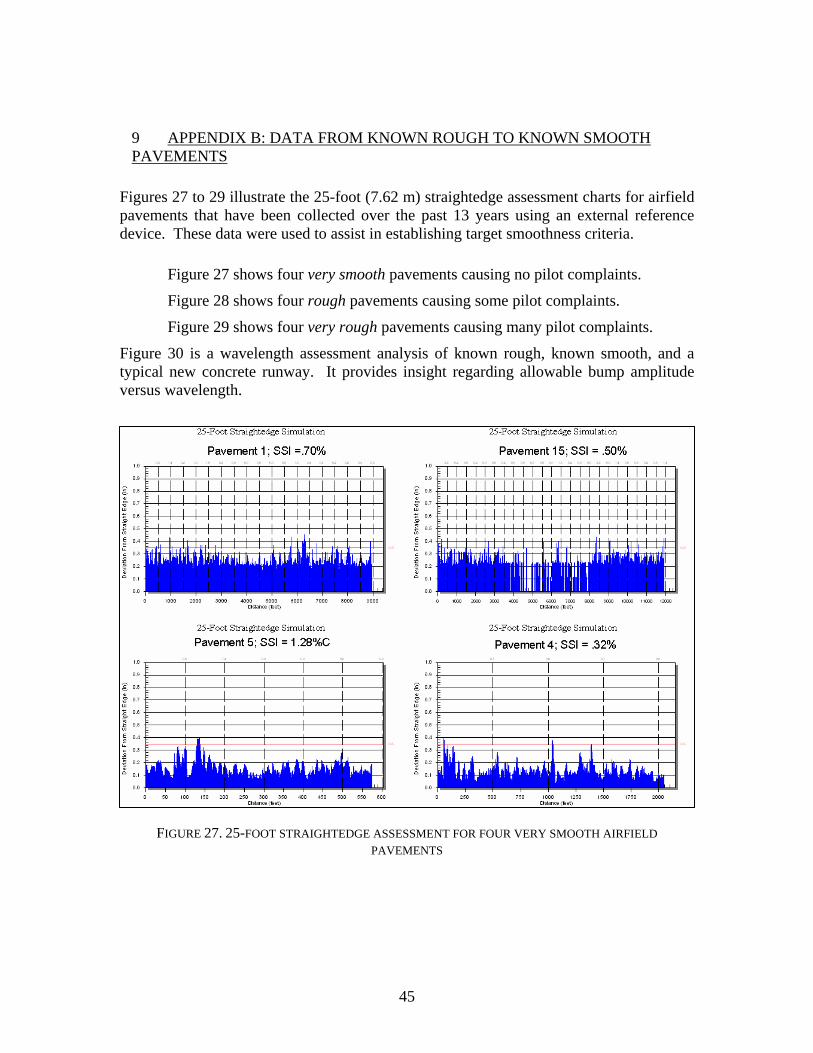
45
9 APPENDIX B: DATA FROM KNOWN ROUGH TO KNOWN SMOOTH PAVEMENTS
Figures 27 to 29 illustrate the 25-foot (7.62 m) straightedge assessment charts for airfield pavements that have been collected over the past 13 years using an external reference device. These data were used to assist in establishing target smoothness criteria.
Figure 27 shows four very smooth pavements causing no pilot complaints.
Figure 28 shows four rough pavements causing some pilot complaints.
Figure 29 shows four very rough pavements causing many pilot complaints.
Figure 30 is a wavelength assessment analysis of known rough, known smooth, and a typical new concrete runway. It provides insight regarding allowable bump amplitude versus wavelength.
FIGURE 27. 25-FOOT STRAIGHTEDGE ASSESSMENT FOR FOUR VERY SMOOTH AIRFIELD
PAVEMENTS
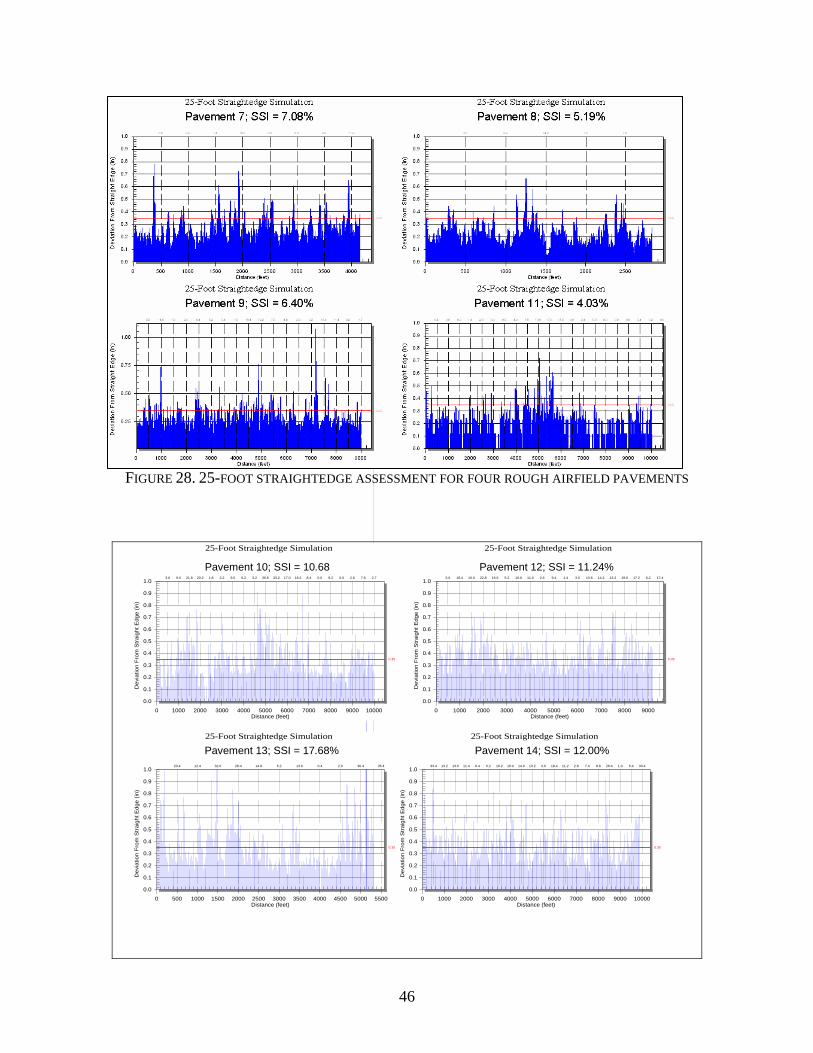
46
FIGURE 28. 25-FOOT STRAIGHTEDGE ASSESSMENT FOR FOUR ROUGH AIRFIELD PAVEMENTS
0.0
0.1
0.2
0.3
0.4
0.5
0.6
0.7
0.8
0.9
1.0
0 1000 2000 3000 4000 5000 6000 7000 8000 9000
0.35
5.6 18.4 10.0 22.8 16.6 5.2 10.6 11.0 2.6 9.4 1.4 3.0 13.6 14.2 13.2 19.6 17.2 6.2 17.4
25-Foot Straightedge SimulationDFW31L_CL_DP.dat
Starting Point = 0 (ft) Threshold Value = 0.35 (in)Percent Exceeded Threshold (0.35 in) = 11.28% Overall
Dev
iatio
n Fr
om S
trai
ght E
dge
(in)
Distance (feet)
Pavement 12; SSI = 11.24%
0.0
0.1
0.2
0.3
0.4
0.5
0.6
0.7
0.8
0.9
1.0
0 500 1000 1500 2000 2500 3000 3500 4000 4500 5000 5500
0.35
20.4 12.4 32.0 28.4 14.8 5.2 13.6 0.4 2.0 36.4 35.4
25-Foot Straightedge SimulationMid04L_cl_dp.dat
Starting Point = 0 (ft) Threshold Value = 0.35 (in)Percent Exceeded Threshold (0.35 in) = 17.68% Overall
Dev
iatio
n Fr
om S
trai
ght E
dge
(in)
Distance (feet)
0.0
0.1
0.2
0.3
0.4
0.5
0.6
0.7
0.8
0.9
1.0
0 1000 2000 3000 4000 5000 6000 7000 8000 9000 10000
0.35
33.4 13.2 13.0 11.4 6.4 5.2 10.2 10.0 14.0 13.2 3.0 18.4 11.2 2.8 7.4 8.8 26.4 1.0 5.4 30.4
25-Foot Straightedge SimulationGOA Runway 29-11 CL.dat
Starting Point = 0 (ft) Threshold Value = 0.35 (in)Percent Exceeded Threshold (0.35 in) = 12.00% Overall
Dev
iatio
n Fr
om S
trai
ght E
dge
(in)
Distance (feet)
Pavement 13; SSI = 17.68% Pavement 14; SSI = 12.00%
0.0
0.1
0.2
0.3
0.4
0.5
0.6
0.7
0.8
0.9
1.0
0 1000 2000 3000 4000 5000 6000 7000 8000 9000 10000
0.35
3.6 9.6 21.8 20.2 1.8 2.2 9.0 6.2 3.2 36.6 33.2 17.0 18.2 8.4 0.0 9.2 0.0 2.6 7.6 2.7
25-Foot Straightedge Simulationcun 12 cl.dat
Starting Point = 0 (ft) Threshold Value = 0.35 (in)Percent Exceeded Threshold (0.35 in) = 10.68% Overall
Dev
iatio
n Fr
om S
trai
ght E
dge
(in)
Distance (feet)
Pavement 10; SSI = 10.68
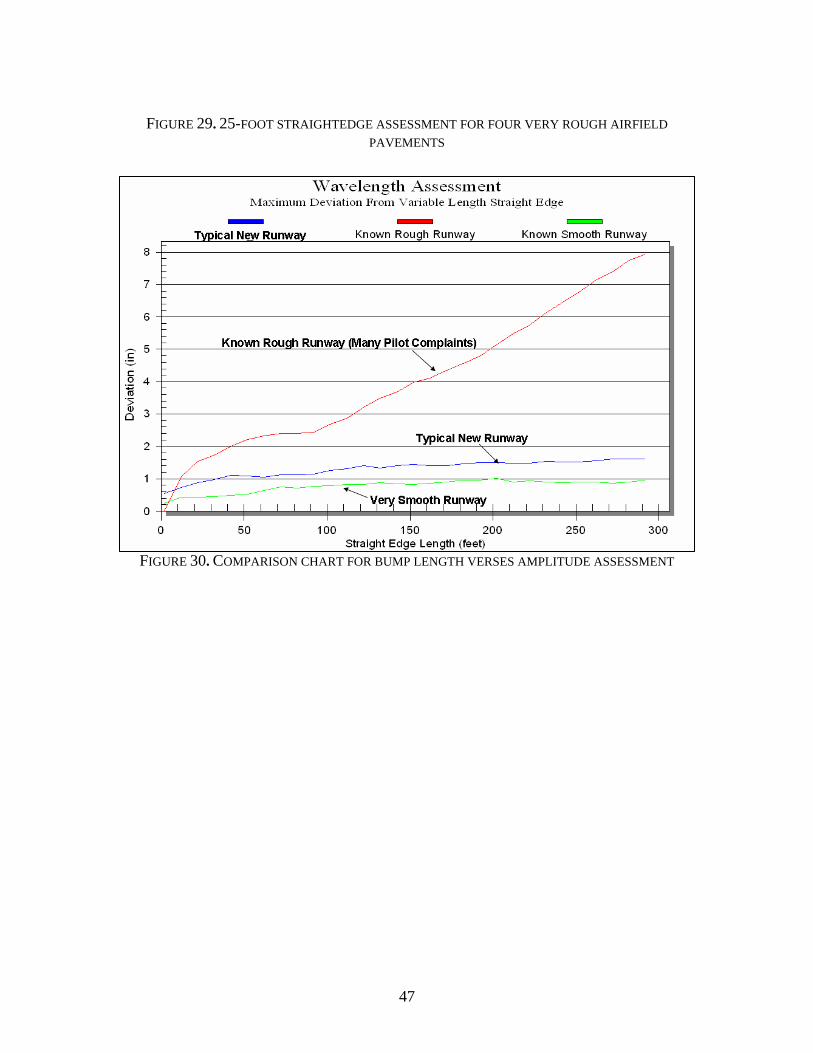
47
FIGURE 29. 25-FOOT STRAIGHTEDGE ASSESSMENT FOR FOUR VERY ROUGH AIRFIELD
PAVEMENTS
FIGURE 30. COMPARISON CHART FOR BUMP LENGTH VERSES AMPLITUDE ASSESSMENT
48
10 APPENDIX C: - CONSTRUCTING SMOOTH CONCRETE PAVEMENTS This section is not intended to be a comprehensive summary on all factors affecting smoothness; however, known practices that work, and those that do not, are identified. Specific facets of the construction process that are directly related to initial pavement smoothness are identified.
There are two principal groups of factors for the construction process that play key roles in the initial smoothness of the constructed pavement: (1) the design and specification, and (2) the construction.
10.1 DESIGN AND SPECIFICATION FACTORS
Factors influencing smoothness include:
Smoothness specification; (smooth pavements begin during the design)
Base, subbase and track line considerations
Interface with other pavements
Grade and staking considerations
Concrete mix design
10.1.1 Smoothness Specifications When considering all the various aspects of constructing a smooth airfield pavement, the first consideration should be the smoothness specification that the pavement is to meet. The specification provides the target smoothness the contractor is to achieve once the pavement is completed. If FAA funding is involved in constructing the pavement, it requires the use of (P-501) AC 150/5370 – 10B, or an approved waiver of criteria to accept new pavement. Specifically, AC 150/5370 – 10B, Item P-501 states that a concrete runway “shall be tested with a 16-foot (4.88 m) straightedge or other specified device as soon as the concrete has hardened sufficiently. Surface smoothness deviations shall not exceed 0.25-inch (6.35 mm) from a 16-foot (4.88 m) straightedge placed in any direction, including placement along and spanning any pavement joint.” The specification continues “vertical deviation from established grade shall not exceed plus or minus 0.04-foot (12.7 mm) at any point” (1). The 16-foot (4.88 m) straightedge is the official standard method used to assess the pavement’s initial smoothness. This is on a lot basis and is not applicable to a pavement feature However, the use of a California profilograph is allowed by the FAA on a case-by-case basis. When using the profilograph, two passes will be made on each paving lane 20 feet wide (6 m) or wider. Each pass will be made six feet (2 m) left and right from the center of each paving lane. These two surveys will then be averaged to derive the profile index (PI) for that paving lane. For paving lanes that are less than 20 feet (6 m) across, one pass by a profilograph is sufficient for generating the PI of that lane (10).
49
10.1.2 Base, Subbase and Track Line Considerations The subbase (the first layer below the pavement surface) substantially influences the initial smoothness of the final pavement. Growing industry sentiment calls for the subbase to be optimized for smoothness. Typically, automated fine-grading equipment can be used to optimize smoothness; “e.g. trimmed”. Furthermore, the final elevations of the trimmed subbase can then be compared to the design elevations to ensure the intended grade is actually achieved. The project owner should specify what level of smoothness is acceptable at this stage of construction realizing that the remaining pavement will be placed on the subbase. Additionally, the subbase should extend beyond the paving lanes by about 3.2 feet (1 meter). This provides assurance that the paver track lines are smooth and will support the weight and tractive forces of the paver without deformation. This practice promotes smooth pavements by minimizing continual automatic adjustments by the paver to maintain the specified grade (5, 6).
10.1.3 Integration with Other Pavements Interfacing two pavements creates challenges in achieving smoothness. Usually the transverse crown of one pavement will not be compatible with the profile and slope of the interface pavement. These crowns must be warped, by design, to minimize the roughness. The goal is to meet watershed requirements while minimizing adverse impact on aircraft response. A number of factors are involved. The aircraft speed of encounter is a prime concern. If a crown is encountered on a taxiway at 20 knots, the dynamic effect may be completely benign. If the crown is located on a runway where it will be encountered at high speed, the aircraft response could be significant. There is little guidance available to the designer that addresses this runway/aircraft interaction issue. The Boeing Curve (11), as seen in Figure 31, is a wavelength versus amplitude matrix identifying what dimensions are acceptable, excessive and unacceptable. Aircraft velocity is not considered in the Boeing curve. The designer should refer to a consultant for guidance in evaluating a potential design for warped panels. It is also probable that straightedge criterion may be violated, by design, for the purpose of maintaining an adequate warp in the pavement surface.
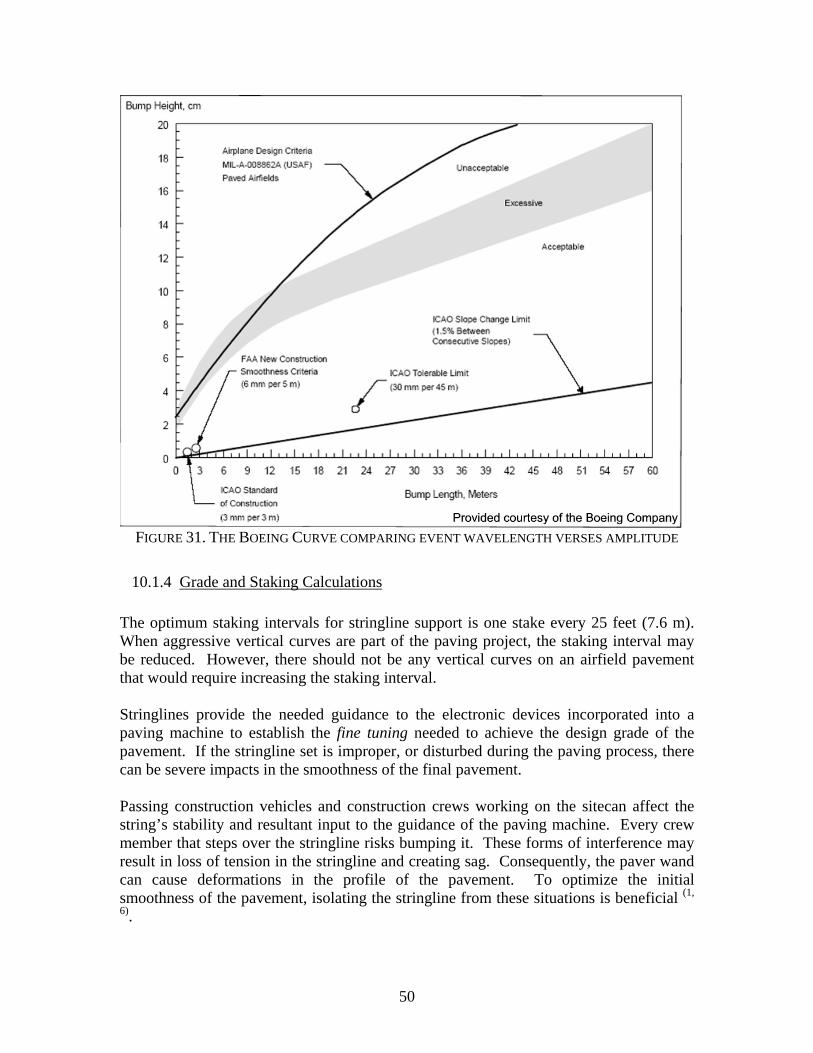
50
FIGURE 31. THE BOEING CURVE COMPARING EVENT WAVELENGTH VERSES AMPLITUDE
10.1.4 Grade and Staking Calculations The optimum staking intervals for stringline support is one stake every 25 feet (7.6 m). When aggressive vertical curves are part of the paving project, the staking interval may be reduced. However, there should not be any vertical curves on an airfield pavement that would require increasing the staking interval. Stringlines provide the needed guidance to the electronic devices incorporated into a paving machine to establish the fine tuning needed to achieve the design grade of the pavement. If the stringline set is improper, or disturbed during the paving process, there can be severe impacts in the smoothness of the final pavement. Passing construction vehicles and construction crews working on the sitecan affect the string’s stability and resultant input to the guidance of the paving machine. Every crew member that steps over the stringline risks bumping it. These forms of interference may result in loss of tension in the stringline and creating sag. Consequently, the paver wand can cause deformations in the profile of the pavement. To optimize the initial smoothness of the pavement, isolating the stringline from these situations is beneficial (1,
6).
51
A new generation of technology could replace the stringline altogether. Hyper-smooth concrete is being achieved by using robotic total stations to guide the horizontal and vertical alignment of the paver. This is done in conjunction with the elevation design data (generated with AutoCAD) coupled with 3-D digitized terrain data fed into the paver allowing for a super smooth concrete pavement. This system specifies control within 0.11 inch (3 mm) of plan elevations. The process also saves time and manpower (7).
10.1.5 Embedded Items Embedded items include blockouts, for light cans and utility cases, and reinforcement structures. The integration of both types of items can affect the initial smoothness of the completed pavement. In both cases, workability of the concrete mix determines the smoothness of the completed product. Light cans, and other utility structures at the pavement’s surface, using “block-out” construction requires handwork, vibration and finishing, to ensure that the item is fully encased in the concrete. This disruption in the paving process affects the pavement smoothness. Embedded steel in the form of dowel baskets or temperature steel will create problems with the pavement smoothness. There are three types of smoothness issues associated with the use of embedded steel (2, 5):
Lack of Consolidation: If the concrete mix is not uniformly consolidated within the dowel basket, surface roughness can be created as the concrete settles within the basket. Angling the vibrators is a preferred solution
Reinforcement Ripples: Vibration equipment can contact the embedded steel, or when the embedment forms a “dam,” ripples in the pavement surface can be created. This anomaly can occur to both transverse and longitudinal embedment.
Spring Back: This occurs when the dowel basket assembly deflects and rebounds after the paver passes and the extrusion pressure is released. It results in a slight bump in the pavement surface slightly ahead of the basket assembly.
The designer and the contractor must consider which type of embedment method is best for their paving project. Adequate consolidation of the mix as well as proper placement of the steel are important considerations in avoiding unwanted surface profile characteristics.
10.1.6 Concrete Mixture Thought must go into the entire paving process. The concrete much arrive at the site of placement in optimum condition and ready to be placed and finished. Excessive vibration during transport or placing can cause segregation of materials (5). If the mixture is not well proportioned, it may have difficult workability during the paving process and
52
require excess handwork. Ultimately, excess handwork and materials segregation increases the probability of problem surface characteristics (5).
10.2 CONSTRUCTION FACTORS There are eight construction steps that directly impact the initial smoothness of the finished pavement (2, 5).
1. Educating and motivating the crew
2. Preparing the grade
3. Setting up fixed forms
4. Setting and maintaining the stringline
5. Producing consistent concrete
6. Delivering concrete
7. Operating the paving machine
8. Finishing the surface and headers
10.2.1 Educating and Motivating the Work Crew Training the crew that is placing the pavement is important to achieving initial pavement smoothness. The crew must have the ability and the knowledge to recognize when the process is breaking down and resulting in poor pavement quality. They must recognize the signs of poor pavement and realize the cause of the error.
Stringline crews must monitor the stringline for adequate tension and alignment.
The paver operator must continually monitor and adjust the paver to assure that the pavement mix is adequately formed into a uniform ribbon of pavement.
Finishers must recognize potential problems in the final pavement finish such as moisture content, surface voids, segregation or ripple deformation due to reinforcement.
Once a problem has been realized by one of the construction crew, the problem must be clearly communicated to the production foreman in an effort to correct the problem (5, 6). Motivation is also an important component to a smooth and acceptable pavement. The pavement’s smoothness is one of the most effective ways to identify the success of the project. Instilling a sense of ownership and pride among the production crew can help motivate the crew to do what it takes to achieve a quality product. Sharing monetary rewards with production crews also provides incentives and motivation for the crew to
53
construct smooth pavements. Innovative methods such as providing daily feedback to the crew on the pavement’s smoothness has led to award winning smooth pavements (5, 6).
10.2.2 Preparing the Grade The Best Practices Manual for PCC Construction (8) defines the terms subbase and base. “The layer immediately below the slab is referred to as the base. The layer between the base and the subgrade is referred to as subbase”. Constructing a smooth and stable base and subbase will greatly contribute to the initial smoothness of the completed pavement. The subgrade should have an in-place California Bearing Ratio (CBR) value of six or more to support the construction traffic traversing it during the construction process (6). It is important to ensure that this material is adequately compacted (8). The subbase is the first lift in the pavement cross-section to influence pavement smoothness. The subbase is where it all starts. Factors from choosing the right aggregate to ensuring adequate compaction play roles in achieving desired initial smoothness (5, 6). It is advantageous to check grade and make corrections prior to proceeding to the next stage of construction. Corrections at the subbase stage are more efficient than at the base stage, and corrections at the base stage are more efficient than on the final surface. In addition, constructing for smoothness at each stage provides a superior platform for the next stage. Similarly, it is important to insure that the track lines are stable and are at proper grade. Minimizing the number of paver elevation adjustments will improve the final pavement’s initial smoothness (5, 6).
10.2.3 Setting Up Fixed Forms Fixed-form paving is usually not a technique used for major airfield paving projects. This type of paving is limited to work such as paving fillets or connecting slip-form paving lanes. However, when this is done, it is important that clean and sturdy side forms be used for this process with adequate subbase support allowing the forms to sit on smoothly graded material (5).
10.2.4 Setting Up and Maintaining a Stringline Serving as the primary guidance system for the paver, the stringline establishes the final grade of the pavement. It is vitally important that the stringline be closely monitored during the paving process to ensure that it is adequately taut and properly aligned. Each component of the stringline; stringline material, stakes, staking interval, splices and repositioning frequency may have an effect on the initial smoothness of the pavement(5).
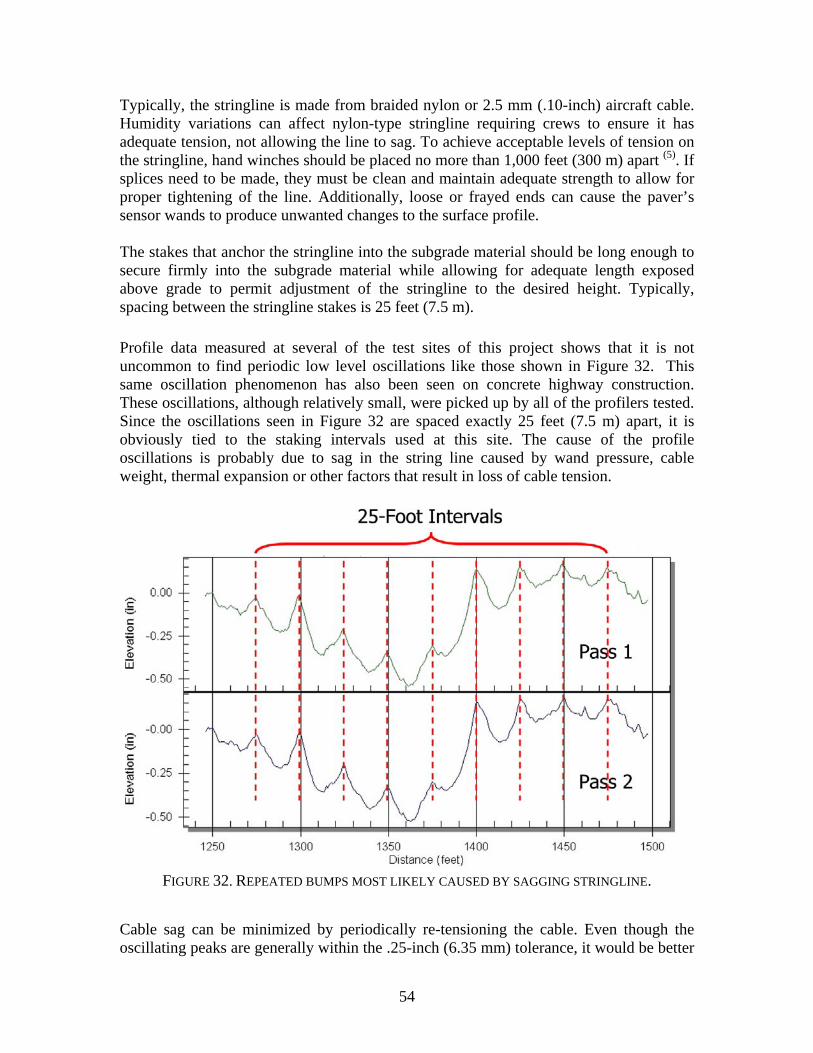
54
Typically, the stringline is made from braided nylon or 2.5 mm (.10-inch) aircraft cable. Humidity variations can affect nylon-type stringline requiring crews to ensure it has adequate tension, not allowing the line to sag. To achieve acceptable levels of tension on the stringline, hand winches should be placed no more than 1,000 feet (300 m) apart (5). If splices need to be made, they must be clean and maintain adequate strength to allow for proper tightening of the line. Additionally, loose or frayed ends can cause the paver’s sensor wands to produce unwanted changes to the surface profile. The stakes that anchor the stringline into the subgrade material should be long enough to secure firmly into the subgrade material while allowing for adequate length exposed above grade to permit adjustment of the stringline to the desired height. Typically, spacing between the stringline stakes is 25 feet (7.5 m). Profile data measured at several of the test sites of this project shows that it is not uncommon to find periodic low level oscillations like those shown in Figure 32. This same oscillation phenomenon has also been seen on concrete highway construction. These oscillations, although relatively small, were picked up by all of the profilers tested. Since the oscillations seen in Figure 32 are spaced exactly 25 feet (7.5 m) apart, it is obviously tied to the staking intervals used at this site. The cause of the profile oscillations is probably due to sag in the string line caused by wand pressure, cable weight, thermal expansion or other factors that result in loss of cable tension.
FIGURE 32. REPEATED BUMPS MOST LIKELY CAUSED BY SAGGING STRINGLINE.
Cable sag can be minimized by periodically re-tensioning the cable. Even though the oscillating peaks are generally within the .25-inch (6.35 mm) tolerance, it would be better
55
to minimize them because repetitive bumps and dips, even with relatively low amplitudes, can set up a rhythm in aircraft response resulting in poor ride quality.
10.2.5 Producing Consistent Concrete A principal player in the initial smoothness of the finished pavement is the uniformity of the pavement mix. Stakeholders should give careful thought to the mix design to ensure adequate consolidation and strength for its intended use. Good batch to batch consistency is essential in creating a smooth and effective pavement, and environmental conditions will likely change during the course of the construction. The mix must change with the environment to ensure proper curing and adequate evaporation. Studies have shown that ensuring proper moisture levels in the aggregate and mix plays a crucial role in the initial smoothness of the pavement (6). A PCC paving machine has a multitude of dynamic forces acting on it. The machines are very large and heavy. This mass is necessary to create a flat and smooth paved surface when working the stiff PCC mix. After the mix is placed in front of the paver, vibrators decrease the viscosity and aid the consolidation and workability of the mix. The auger, located at the front of the paving machine, strikes off the plastic mix at the appropriate grade. The mix is then channeled underneath the paver to the extrusion plate to complete the finished pavement as it exits the paver. If the viscosity of the mix were to change during the forming process, the acting forces of the paving machine would change. An increase in pavement stiffness could create a bump in the finished pavement.
10.2.6 Delivering the Mix Delivery of consistent material is necessary for the paving machine to operate at a consistent rate of forward motion. Inconsistent product delivery will lead to inconsistent paver speed, or could cause the paver to be stopped. The paving rate should be timed to match that of the production plant (8). It is important that the paving contractor have a carefully planned mix delivery system. If the delivery trucks arrive too quickly, they sit at the project site with the mix curing in the delivery trucks, reducing the workability of the mix. Slow and steady production has been found to produce the smoothest concrete pavements.
10.2.7 Operating the Paving Machine The paving machine’s principle purpose is to adequately consolidate the concrete mix, spread it out uniformly, feed the mix into the forms and then produce a smooth, uniform, properly shaped pavement as the paver moves forward. For this process to occur, the paver must be properly maintained (5). As a paver ages, the components may stick or wear and not move smoothly. This is particularly true with hydraulically actuated components.

56
10.2.8 Finishing the Surface and Headers Hand and mechanical finishing must be kept to a minimum. If longitudinal floating is the only method used to produce an acceptable pavement surface, there is probably a problem with the mix or the paving equipment. However, checking the surface using a nine to 18-foot (3 to 6 m) hand operated straightedge can help ensure that short wavelength roughness is minimized. Successful techniques using these straightedge floats involve overlapping by one half of the straightedge length with each successive pass (5). Headers need to be created at the end of each paving day or at the site of a pavement interruption such as a block-out. Headers are one of the most consistent contributors to concrete pavement roughness. One technique that often results in the construction of a bump is to place a wooden form to serve as the joint. A more successful means of ending the paving process is to use the cut-back method. This method calls for the paving operator to continue paving until the entire pavement is placed. The next day, a full-depth transverse saw cut is made at the point where the surface depression ends, exposing the last bit of properly placed concrete. Any concrete at the end of that run, which displays poor placement, will then be torn out to be replaced during the new paving day (5).
10.2.9 Feedback to the Paving Crew Measuring the profile wet, as part of the paving train for example, can provide immediate feedback to the paving crew so that corrections can be made if necessary.
Another feedback approach is that once the pavement is hard enough to walk on, measure the profile with any of the profile devices evaluated in this handbook. This would provide feedback to the paving crew for the next paving day.
Regardless of the method used, a plot of the profile and a Straightedge Smoothness Index (SSI) chart can provide clues as to the cause of any roughness allowing the paving contractor to make informed decisions regarding adjustments.
10.2.10 Construction with Constraints Very often pavement construction/rehabilitation must be done in active traffic environments in order to minimize the impact on traffic flow. At one test site on this project, the contractor was required to pave in short sections, sometimes 500 feet (152 m), other times 1,000 feet (304 m), in order to minimize the impact on traffic movement. This causes more pavement tie-ins and more start-stop operations, both of which are a potential source of roughness.
It is not uncommon for airfield pavement construction projects to be restricted to night operations, particularly at busy airfields. Operations at night generally do not improve the chances of producing a smooth pavement.
When paving over an existing surface, the final smoothness achieved can be influenced by the roughness of the existing surface. Ideally, preparation of the existing surface would include achieving the level of smoothness required for the base. In addition, the stability of the existing pavement should be determined and the findings incorporated into
57
the pavement design. Paving over an area that is known to settle because of an unstable base will result in similar performance of the new pavement with time and traffic. Airfields with proactive pavement management programs that have periodically measured their pavement profile and tracked changes in it, will have data to identify where settlement is occurring.
The stability and smoothness of the track line surface upon which the paving machine rides is important in achieving smoothness. Compaction of the track line is as vital as compaction of the subgrade and subbase. Measuring the profile of the track lines before the paving operation allows trimming corrections to be made. Consistent (parallel) profiles between right and left track lines will reduce the potential for birdbath between paving lanes by minimizing roll of the paving machine.
Maintaining the correct concrete consistency delivered to the spreader has a direct impact on smoothness. Concrete consistency is influenced by batch plant operations, travel time to the site, ambient temperature, humidity and other factors. Long and steady paving runs are more likely to have consistent concrete delivered to the site because the batch plant operator and paving crew have more time to adjust to the existing conditions. Minimizing paver start/stop operations will also contribute to overall smoothness. Again, longer paving runs will generally result in smoother pavements.
10.3 CONSTRUCTING SMOOTH AIRFIELD PAVEMENTS: FIELD EXPERIENCE
The following is a summary of comments obtained from stakeholders in the construction industry.
One of the most significant advances in airfield pavement smoothness was the migration from a nylon stringline to high tension aircraft cable. Contractors are aware that some cable sag may still occur with high tension aircraft cable, but the amount is small when compared to nylon. Maintaining sufficient tension is still a requirement.
A recent technological development was used in a trial case to replace stringlines for grade control to trim base courses. FAA AC 150/5370-10A, items P-152 “Excavating and Embankment, P-209 “Crushed Aggregate Base Course”, and P-307 “ Portland Cement Concrete Drainable Base” were placed and trimmed using a system of integrated electronic components that translate a Digital Terrain Model (DTM) of the pavement surfaces for use with Robotic Total Station units. The final 18-inch concrete pour was made using a conventional stringline. The DTM for a pavement surface is uploaded to a robotic data collector/controller, which is mounted on the paving/trimming equipment and interconnected to the control systems of the equipment. Using a total station instrument in an auto-tracking mode, combined with a robotic controller, the position and elevation of the equipment is continuously tracked through an encoded prism target and compared to the DTM. Deviations from the DTM are detected and corrective commands are transmitted to the machine control system via the interface with the robotic data collector/controller. Confirmation of the vertical and/or horizontal alignment on the finished surface is accomplished with a hand-held robotic collector/controller mounted to a survey rod that is equipped with an encoded prism target, which is tracked by the total station instrument. The DTM process shows promise and may eventually remove the need for a stringline.
58
Moisture control is the primary cause of birdbath problems. The best way to determine if you have birdbath areas is to flood the suspected area. Most birdbath issues occur where paving lanes join.
Starting and stopping the paver is a source of roughness. The smoothest pavements are achieved when the paving train can maintain a steady pace.
Smoothness assessment is important for two reasons:
1. To check after a paving day to use as feedback for the next day’s paving. (This should be up to the contactor.)
2. To insure that the final pavement meets the design specification. The contractor should have the option of making corrections before he turns it over for acceptance.
The only transverse issue that is important is drainage. Transverse measurements should be made when the pavement can be walked on. Again, the main reason is to make real-time corrections in the paving process if needed.