airborne lidar and aerosol studies over the adriatic sea: ii. aerosol volatility studies
TRANSCRIPT
d Aerosol Sci. %1.31, Suppl. 1, pp. $586-$587,2000
Pergamon
www.elsevier.com/locate/jaerosci
Session 7A -Atmospheric aerosols: optical properties I
AIRBORNE LIDAR AND AEROSOL STUDIES OVER THE ADRIATIC SEA: H. AEROSOL VOLATILITY STUDIES
S. NYEKI 1'2, K. ELEFTHERIADIS 3, U. BALTENSPERGER 1, I. COLBECK 2, M. FIEBIG 4, C. KIEMLE 4, M. LAZARIDIS 5, A. PETZOLD 4
Paul Scherrer Institute, 5232 Villigen PSI, Switzerland 2 University of Essex, Colchester, England,
3 INT-RP, N.C.S.R. "Demokritos", 15310 Athens, Greece 4 DLR, Oberpfaffenhofen, Germany, 5 NILU, Kjeller, Norway
KEYWORDS Lidar, MAP, MBL, volatility
During the recent Mesoscal e Alpine Programme (MAP) over the European Alps in September to October 1999, an airborne campaign was conducted over the northern Adriatic Sea in order to study the boundary layer (BL) structure and aerosol processes within it. By using an aerosol lidar to detect the altitude of various layers within the BL, aerosol measurements were then conducted at various heights ranging from - 40 - 2000 m asl. Interpretation of these results was aided by the dense network of meteorological measurements and mesoscale model results, which were available from MAP.
1 ~ 1~00
Z
,-e
1011
~ Plight Altitude / ~ x ~ F
lOO Z
0,1 I I I I I I [ I I 1 I I I 10 11.2 11.4 11.6 11.8 12 12.2 12,4 12.6 12.8 13 13.2 13.4 13,6 13.8 14
Time (LST; UTC+ 1)
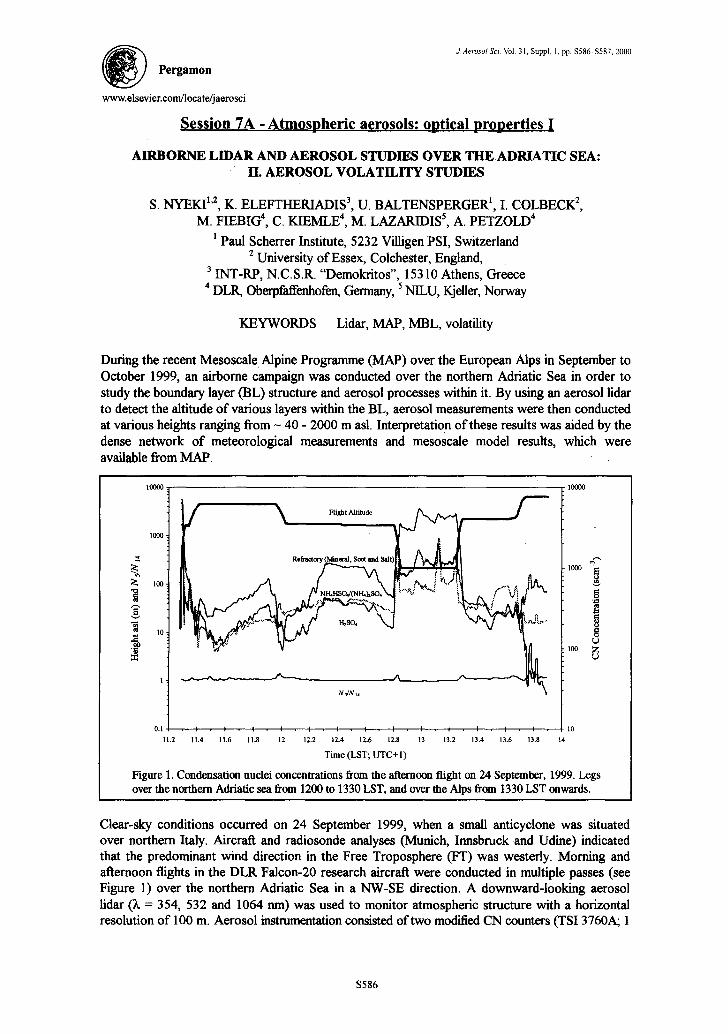
Figure 1. Condensation nuclei concentrations from the afternoon flight on 24 September, 1999. Legs over the northern Adriatic sea from 1200 to 1330 LST, and over the Alps from 1330 LST onwards.
Clear-sky conditions occurred on 24 September 1999, when a small anticyclone was situated over northern Italy. Aircratt and radiosonde analyses (Munich, Innsbruck and Udine) indicated that the predominant wind direction in the Free Troposphere (FT) was westerly. Morning and afternoon flights in the DLR Falcon-20 research aircraft were conducted in multiple passes (see Figure 1) over the northern Adriatic Sea in a NW-SE direction. A downward-looking aerosol lidar (Z, = 354, 532 and 1064 nm) was used to monitor atmospheric structure with a horizontal resolution of 100 m. Aerosol instrumentation consisted of two modified CN counters (TSI 3760A; 1
$586
Abstracts of the 2000 European Aerosol Conference $587
s resolution), with 50% cut-offdiameters set at d - 5 and 14 nm and a PMS spectrometer (PCASP- 100X) for the range d = 0.1 - 3.0 I, tm Two further CN counters (TSI 3760A; cut-offs d = 14 nm; 1 s resolution) were used with volatility tubes, a technique based on the different volatility characteristics of aerosols (Clarke, 1993). H2SO4 is evaporated in the temperature range T< 110- 120°C, and NI-I4HSO4/(NH4)2SO4 at T < 250-300°C, while the remaining aerosol or so-called refractory component is composed of sea-salt, black carbon (BC), and mineral dust. In this manner, the qualitative aerosol composition is obtained in real-time.
• ~ R e m l c l c m ;
/ "~ /
/
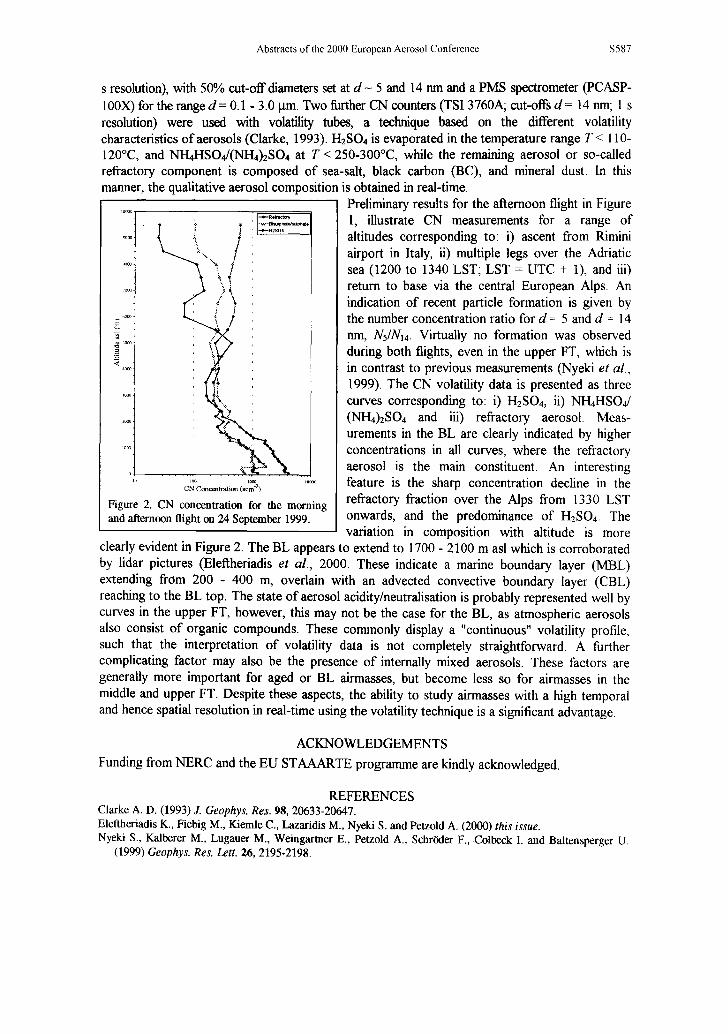
Figure 2. CN concentration for the morning and afternoon flight on 24 September 1999.
Preliminary results for the afternoon flight in Figure 1, illustrate CN measurements for a range of altitudes corresponding to: i) ascent from Rimini airport in Italy, ii) multiple legs over the Adriatic sea (1200 to 1340 LST; LST = UTC + 1), and iii) return to base via the central European Alps. An indication of recent particle formation is given by the number concentration ratio for d = 5 and d = 14 nm, NJN14. Virtually no formation was observed during both flights, even in the upper FT, which is in contrast to previous measurements (Nyeki et al., 1999). The CN volatility data is presented as three curves corresponding to: i) H2SO4, ii) NH4HSO4/ (NH4)2SO4 and iii) refractory aerosol. Meas- urements in the BL are clearly indicated by higher concentrations in all curves, where the refractory aerosol is the main constituent. An interesting feature is the sharp concentration decline in the refractory fraction over the Alps from 1330 LST onwards, and the predominance of H2SO4. The variation in composition with altitude is more
clearly evident in Figure 2. The BL appears to extend to 1700 - 2100 m asl which is corroborated by lidar pictures (Eleftheriadis et al., 2000. These indicate a marine boundary layer (MBL) extending from 200 - 400 m, overlain with an advected convective boundary layer (CBL) reaching to the BL top. The state of aerosol acidity/neutralisation is probably represented well by curves in the upper FT, however, this may not be the case for the BL, as atmospheric aerosols also consist of organic compounds. These commonly display a "continuous" volatility profile, such that the interpretation of volatility data is not completely straightforward. A further complicating factor may also be the presence of internally mixed aerosols. These factors are generally more important for aged or BL airmasses, but become less so for airmasses in the middle and upper FT. Despite these aspects, the ability to study airmasses with a high temporal and hence spatial resolution in real-time using the volatility technique is a significant advantage.
ACKNOWLEDGEMENTS
Funding from NERC and the EU STAAARTE programme are kindly acknowledged.
REFERENCES Clarke A. D. (1993) J. Geophys. Res. 98, 20633-20647. Eleftheriadis K., Fiebig M., Kiemle C., Lazaridis M., Nyeki S. and Petzold A. (2000) this issue. Nyeki S., Kalberer M., Luganer M., Weingartner E., Petzold A., Schrrder F., Colbeck I. and Baltensperger U.
(1999) Geophys. Res. Lett. 26, 2195-2198.