air pollution monitoring networksusa.or.kr/sites/default/files/resources/환경_2_air...
TRANSCRIPT
SMG Policies That Work
1
Air Pollution Monitoring Network
Prepared by: Jong In Dong, Won June Lee1
1. Policy Implementation Period
Since the Air Pollution Monitoring Network was first installed and operated in 1973, the
government and local government bodies have been operating monitoring networks. At the end
of 2014, the Ministry of Environment was operating 148 monitoring network stations while
local governments were operating a total of 506 stations in 97 cities and counties in the nation.
There were 11 types of air quality monitoring stations (city air quality monitoring station, road-
side air quality monitoring station, acid deposition monitoring station, background density
monitoring station, suburban air quality monitoring station, heavy metal monitoring station,
harmful material monitoring station, photochemical pollutant monitoring station, global
atmosphere monitoring station, and monitoring station of PM 2.5 and air pollution
concentration)2.
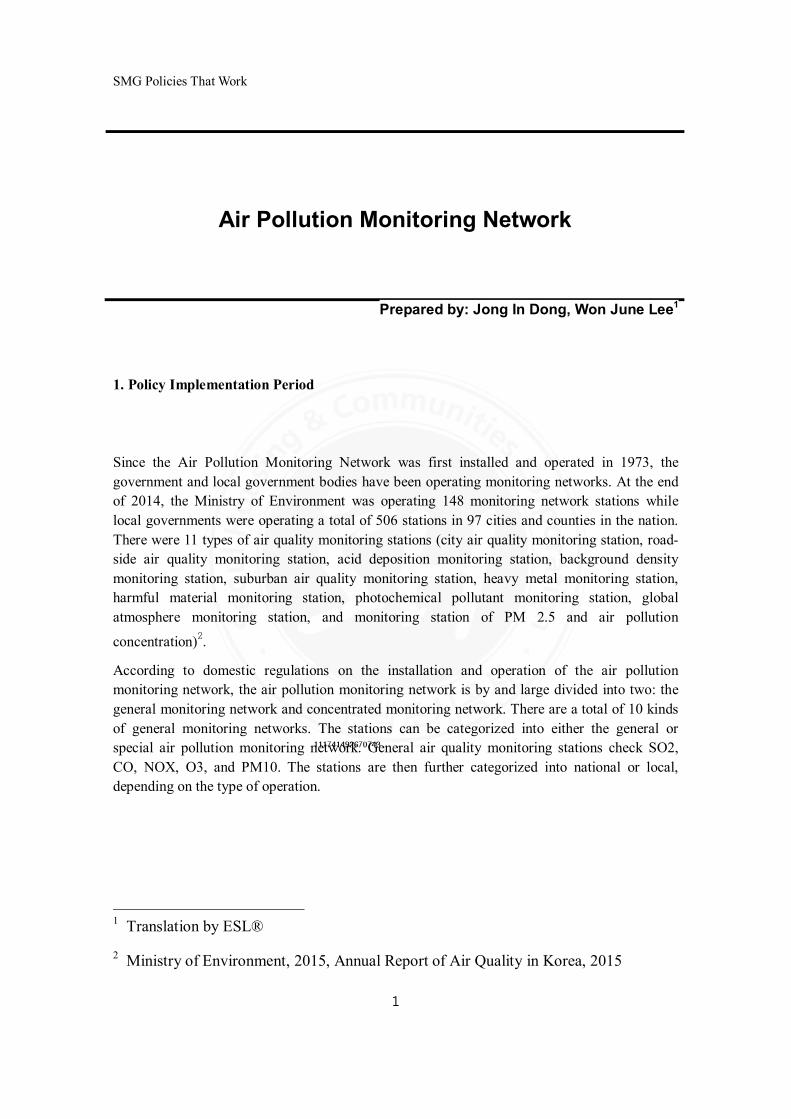
According to domestic regulations on the installation and operation of the air pollution
monitoring network, the air pollution monitoring network is by and large divided into two: the
general monitoring network and concentrated monitoring network. There are a total of 10 kinds
of general monitoring networks. The stations can be categorized into either the general or
special air pollution monitoring network. General air quality monitoring stations check SO2,
CO, NOX, O3, and PM10. The stations are then further categorized into national or local,
depending on the type of operation.
1 Translation by ESL®
2 Ministry of Environment, 2015, Annual Report of Air Quality in Korea, 2015
SMG Policies That Work
2
※ Operator:
National
Governme
nt
Local
Governm
ent
Figure 1: Categorization of Domestic Air Pollution Monitoring Network
*Source: Ministry of Environment, Air Pollution Monitoring Network Installation and Operation
Manual, 2011
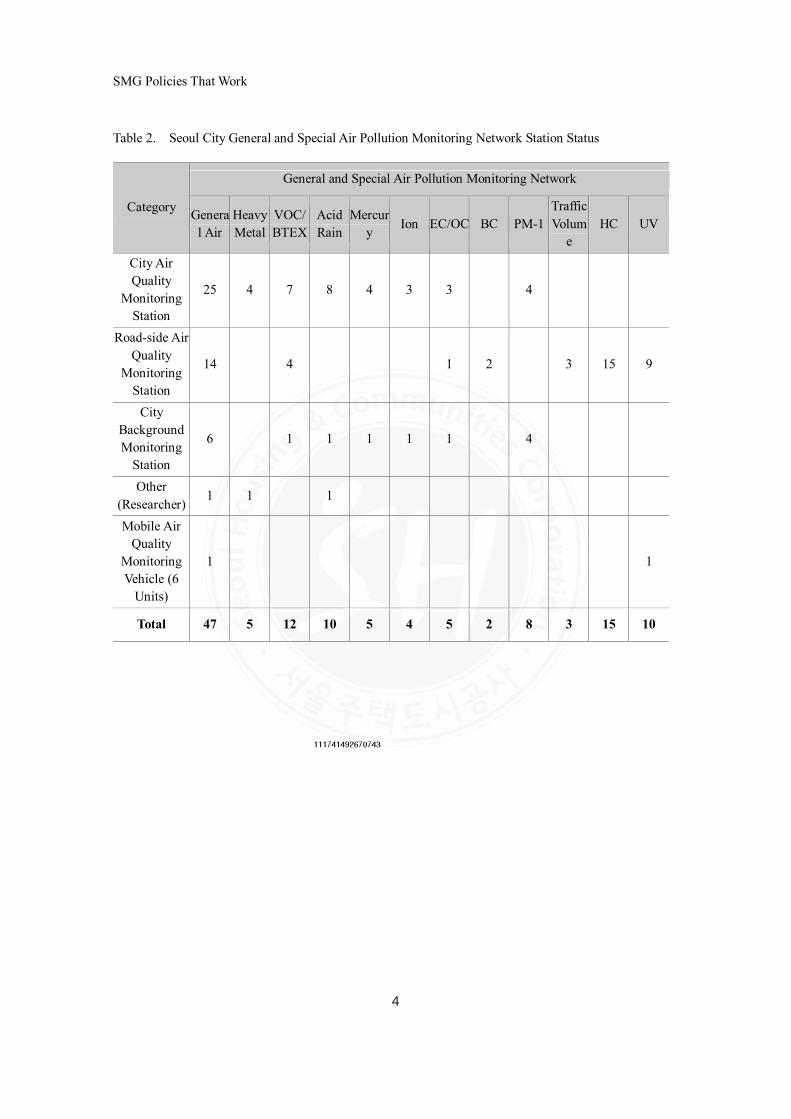
Seoul City began with 4 monitoring stations in 1973. Currently, there are 45 monitoring stations,
operating 65 air pollution monitoring networks. 25 districts are categorized into central,
northeast, northwest, southwest, southeast areas for air pollution analysis and management.
There is at least 1 or more monitoring network installed for operation for each district. Among
the 6 types of monitoring networks, the following monitoring stations have been recorded: 25
city, 14 road-side, 10 photochemical, 5 heavy-metal, 10 acid deposition and 1 visible distance
monitoring station. The listed order is according to the number of stations3.
Table 1. Seoul City Air Pollution Monitoring Network Operation (2015)
Category Total City Street-sidePhoto
chemical
Heavy
Metal
Acid
Deposition
Visible
Distance
Total 65 25 14 10 5 10 1
Source: Seoul City Air Management Department
3 Ministry of Environment, 2010, “2011~2015 Air Pollution Monitoring Network Operation Plan”
City A
ir
Stre
et-sid
e
Heavy M
eta
l
Suburb
an A
ir
Natio
nal B
ack
gro
und D
ensity
Harm
ful A
ir Pollu
tant
Photo
chem
ical
Acid
Depositio
n
Glo
bal A
tmosp
here
PM
2.5
Bakre
ongdo
Capita
l Regio
n
Centra
l Regio
n
South
ern
Regio
n
Jeju
Regio
n
Yeongnam
Regio
n
Capita
l Regio
n (W
est)
SMG Policies That Work
3
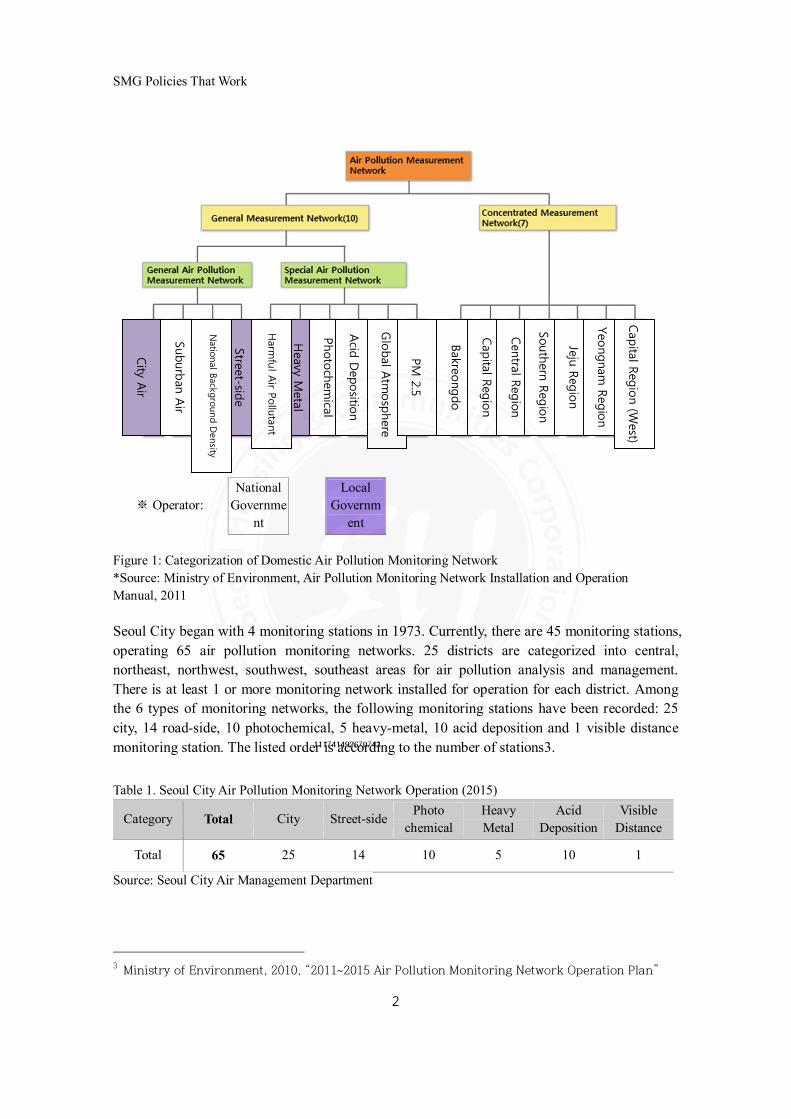
-Central :Jongro・Junggu・Yongsangu (3
Districts)
-Northeast :
Seongdong・Gwangjin・
Dongdaemun・Jungrang・
Seongbuk・
Gangbuk・Dobong・Nowongu (8
Districts)
-Northwest :Eunpyeong・Seodaemun・
Mapogu (3 Districts)
-
Northsouth :
Yangcheon・Gangseo・Guro・
Geumcheon・Yeongdeungpo・
Dongjak・Gwanakgu (7 Districts)
-Southeast :Seocho・Gangnam・Songpa・
Gangdonggu (4 Districts)
Figgure 2. Seoul Air Pollution Monitoring Network Distribution Status
Seoul's air pollution monitoring stations have been operated with the following number of
stations until 2008: 27 city monitoring networks, 2 clean zone, and 9 road-side networks. As
Seoul islargely affected by Seoul Metropolitan areas as well as China and the northwest
monsoon, the monitoring networks have been re-organized in order to better understand and
manage pollutants that travel long distances, the components, density and travel routes,
pollutant statistics in border areas, and road-side pollutant statistics. Seoul city currently has 25
stations, 1 for each district. The city also operates 6 background monitoring networks: Gwanak
Mountain station has been installed to measure pollutants that travel long distances, Namsan
station for that of high altitude, and Bukhansan station to understand the air quality of the clean
zone. Moreover, to manage the generational and changing statistics of pollutants from
automobiles, 12 stations have been installed on expressways. More stations have been installed
for exclusive median bus lanes and exclusive car lanes. There are a total of 14 road-side air
pollution monitoring stations being currently operated. Therefore, Seoul City is operating a total
of 45 stations (25 city stations, 6 background, 14 street-side) for the monitoring and
management of air pollution.4
4 Seoul City Air Management Department Material
SMG Policies That Work
4
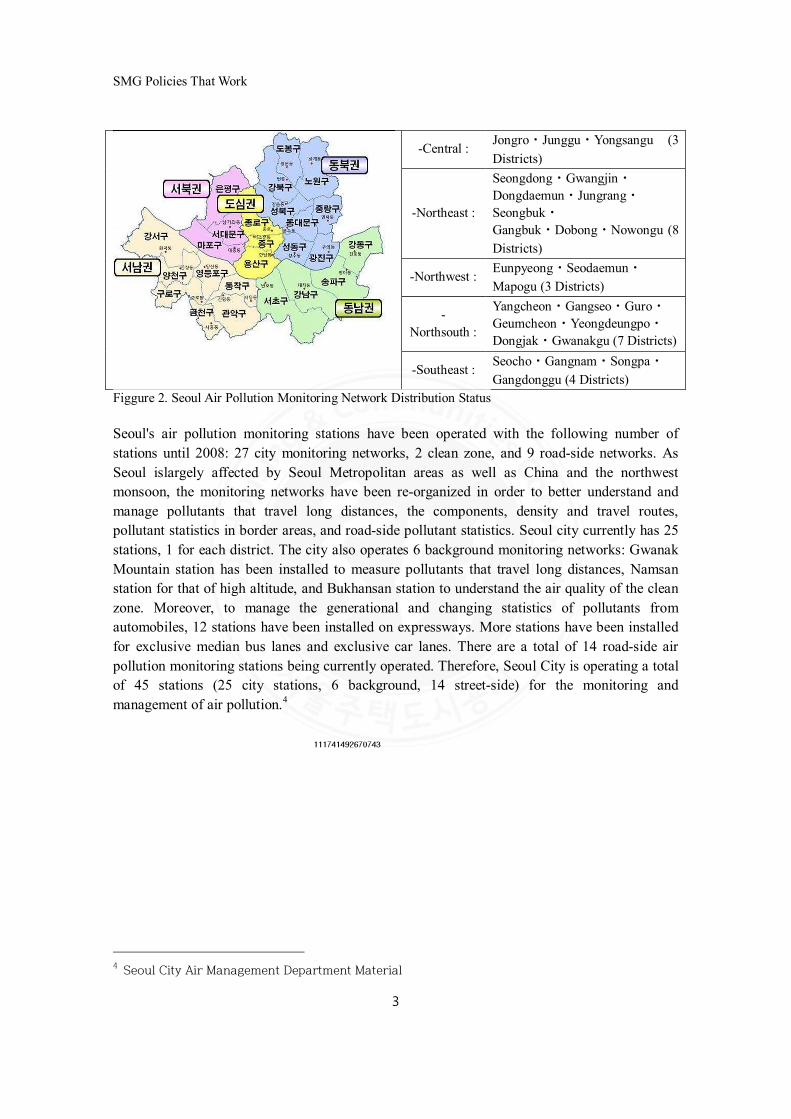
Table 2. Seoul City General and Special Air Pollution Monitoring Network Station Status
Category
General and Special Air Pollution Monitoring Network
Genera
l Air
Heavy
Metal
VOC/
BTEX
Acid
Rain
Mercur
yIon EC/OC BC PM-1
Traffic
Volum
e
HC UV
City Air
Quality
Monitoring
Station
25 4 7 8 4 3 3 4
Road-side Air
Quality
Monitoring
Station
14 4 1 2 3 15 9
City
Background
Monitoring
Station
6 1 1 1 1 1 4
Other
(Researcher)1 1 1
Mobile Air
Quality
Monitoring
Vehicle (6
Units)
1 1
Total 47 5 12 10 5 4 5 2 8 3 15 10
SMG Policies That Work
5
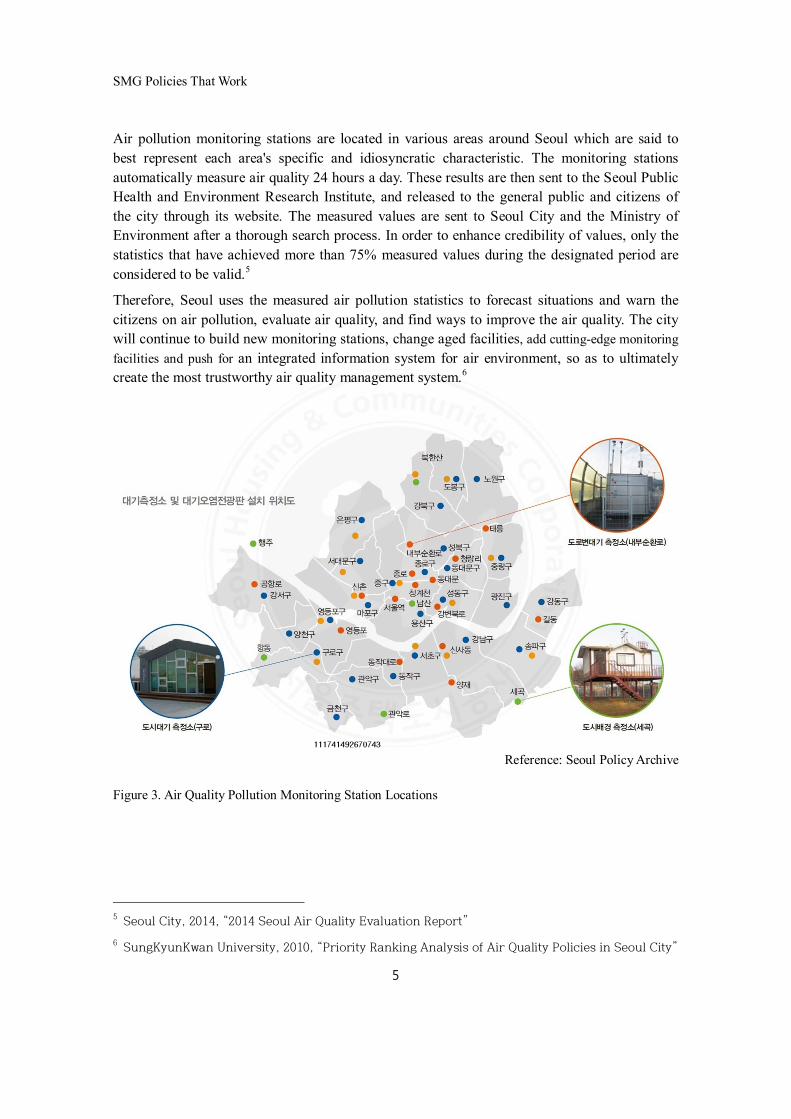
Air pollution monitoring stations are located in various areas around Seoul which are said to
best represent each area's specific and idiosyncratic characteristic. The monitoring stations
automatically measure air quality 24 hours a day. These results are then sent to the Seoul Public
Health and Environment Research Institute, and released to the general public and citizens of
the city through its website. The measured values are sent to Seoul City and the Ministry of
Environment after a thorough search process. In order to enhance credibility of values, only the
statistics that have achieved more than 75% measured values during the designated period are
considered to be valid.5
Therefore, Seoul uses the measured air pollution statistics to forecast situations and warn the
citizens on air pollution, evaluate air quality, and find ways to improve the air quality. The city
will continue to build new monitoring stations, change aged facilities, add cutting-edge monitoring
facilities and push for an integrated information system for air environment, so as to ultimately
create the most trustworthy air quality management system.6
Reference: Seoul Policy Archive
Figure 3. Air Quality Pollution Monitoring Station Locations
5 Seoul City, 2014, “2014 Seoul Air Quality Evaluation Report”
6SungKyunKwan University, 2010, “Priority Ranking Analysis of Air Quality Policies in Seoul City”
SMG Policies That Work
6
2. Background Information
Korea has achieved and undergone periods of rapid industrialization and urbanization since
1960s and this has been reflected in the almost incomparable economic growth it has also
demonstrated. At the same time, the air quality of urban and industrial areas has deteriorated.
More specifically, urban areas which have recorded rapid growth in terms of population have
also seen increases in heating fuel consumption and automobile use; these have resulted in an
increasing volume of air pollutants generated. Moreover, the situation is worsening by the day.
Air pollution in Korean metropolises continued to deteriorate over time and finally reached a
point at which it couldn’t be overloooked; therefore, various actions were required to improve
such a situation. The Environmental Conservation Act was enacted in 1978, and the
Environmental Office was created in 1980. A number of actions and policies began to be
considered.
Seoul Metropolitan Government (SMG) also went forward to improve air quality by expanding
the provision of low sulfur fuel and other clean fuels, or by attaching purifiers to automobiles.
However, the density of 1st pollutants exceeded general air environment standards.
To check Seoul's air quality and analyze pollution, air quality had to be measured at several
locations at the same time. Therefore, SMG installed the automatic air quality pollution
monitoring network. The city started to measure air quality in real-time. An air pollution alert
system has been created to provide forecasts and warn the citizens so as to protect their health as
the air quality can have a considerable impact. Moreover, the measured air pollution statistics
are used in various ways, such as analyzing to evaluate air pollution prevention policies,
evaluations to understand whether the environmental standards have been met, providing
information for forecast models or air pollution trend analysis.7
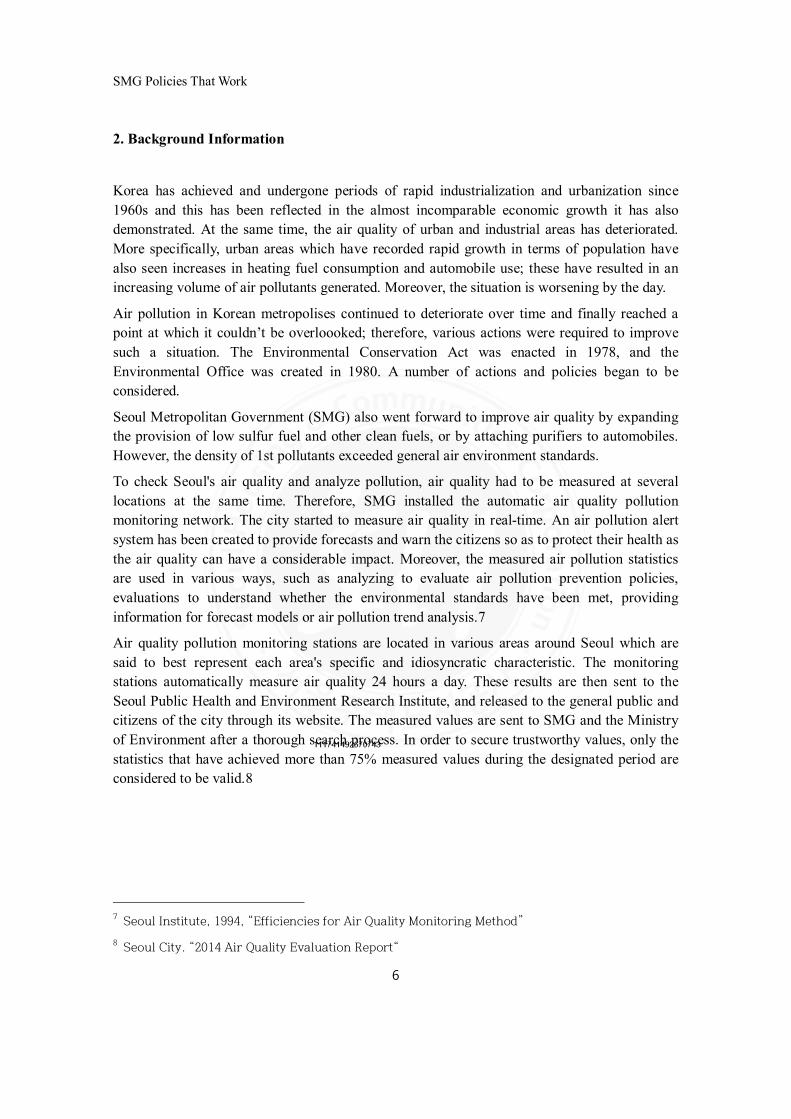
Air quality pollution monitoring stations are located in various areas around Seoul which are
said to best represent each area's specific and idiosyncratic characteristic. The monitoring
stations automatically measure air quality 24 hours a day. These results are then sent to the
Seoul Public Health and Environment Research Institute, and released to the general public and
citizens of the city through its website. The measured values are sent to SMG and the Ministry
of Environment after a thorough search process. In order to secure trustworthy values, only the
statistics that have achieved more than 75% measured values during the designated period are
considered to be valid.8
7 Seoul Institute, 1994, “Efficiencies for Air Quality Monitoring Method”
8Seoul City. “2014 Air Quality Evaluation Report“
SMG Policies That Work
7
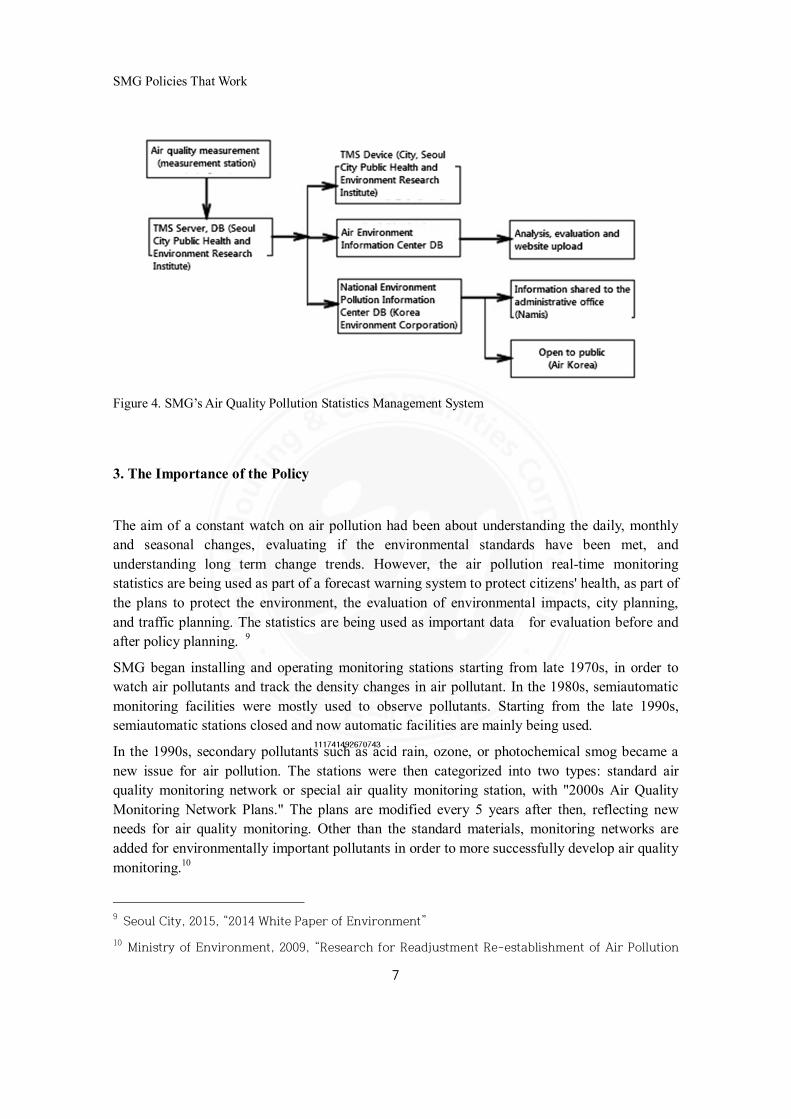
Figure 4. SMG’s Air Quality Pollution Statistics Management System
3. The Importance of the Policy
The aim of a constant watch on air pollution had been about understanding the daily, monthly
and seasonal changes, evaluating if the environmental standards have been met, and
understanding long term change trends. However, the air pollution real-time monitoring
statistics are being used as part of a forecast warning system to protect citizens' health, as part of
the plans to protect the environment, the evaluation of environmental impacts, city planning,
and traffic planning. The statistics are being used as important data for evaluation before and
after policy planning. 9
SMG began installing and operating monitoring stations starting from late 1970s, in order to
watch air pollutants and track the density changes in air pollutant. In the 1980s, semiautomatic
monitoring facilities were mostly used to observe pollutants. Starting from the late 1990s,
semiautomatic stations closed and now automatic facilities are mainly being used.
In the 1990s, secondary pollutants such as acid rain, ozone, or photochemical smog became a
new issue for air pollution. The stations were then categorized into two types: standard air
quality monitoring network or special air quality monitoring station, with "2000s Air Quality
Monitoring Network Plans." The plans are modified every 5 years after then, reflecting new
needs for air quality monitoring. Other than the standard materials, monitoring networks are
added for environmentally important pollutants in order to more successfully develop air quality
monitoring.10
9 Seoul City, 2015, “2014 White Paper of Environment”
10Ministry of Environment, 2009, “Research for Readjustment Re-establishment of Air Pollution
SMG Policies That Work
8
4. Policy Objectives11
Through "2011-2015 Air Quality Monitoring Network Operation Plan," SMG adjusted
operating system of the monitoring networks' according to the measured pollutants and size of
the stations. Thus, the overall management was able to become more systematic and efficient.
The major overall direction is to automatically operate general networks without human
resources so the general, special and comprehensive networks can be operated more efficiently.
For comprehensive stations, there must be multiple facilities placed in the same location, and
the facilities must be able to measure more than 2 pollutants.
Air pollutant concentration monitoring stations are operated for the better understanding of the
air quality of the major areas, component analysis, and to find the causes of the pollutants. The
stations include in-depth monitoring and research functions.
Moreover, SMG is strengthening its management on harmful pollutants such as PM2.5 or
mercury. The networks have been expanded to include both density monitoring networks and
component monitoring networks for PM2.5. This is to secure base materials to help decide
policy directions and evaluate whether or not the material has reached environmental standards,
as PM2.5 was finally included as part of the environmental standard elements in 2015. Also,
previous pollutant monitoring elements have been adjusted to enable mercury monitoring, since
the material requires management and regulations. SMG has installed a total of 4 mercury
monitoring facilities in 2015. To strengthen harmful heavy metal monitoring, the city has
included fine dust in sampling collection at the heavy metal monitoring stations and added
arsenic and beryllium.
5. Relevance with Other Policies
SMG provides measured air pollution monitoring information to the citizens through various
media channels such as the Seoul Air Environment Information (http://cleanair.seoul.go.kr),
YTN weather or Mobile Seoul. This is to protect citizens' health and promote the awareness of
environmental preservation, taking the role of both promoting the city's policies and that of an
environmental watcher.12
Monitoring Network Plans”
11 Ministry of Environment, 2010, “2011-2015 Air Pollution Monitoring Network Operation Plan”
12Seoul City, 2015, “2014 White Paper of Environment”
SMG Policies That Work
9
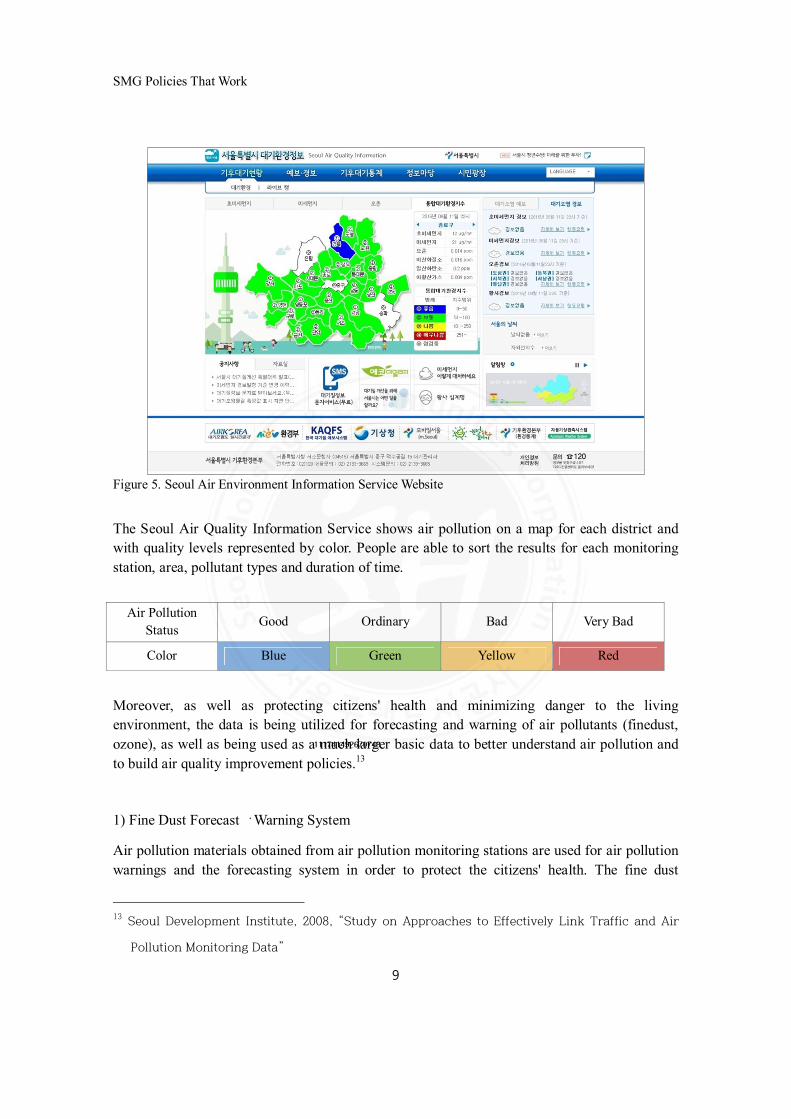
Figure 5. Seoul Air Environment Information Service Website
The Seoul Air Quality Information Service shows air pollution on a map for each district and
with quality levels represented by color. People are able to sort the results for each monitoring
station, area, pollutant types and duration of time.
Air Pollution
StatusGood Ordinary Bad Very Bad
Color Blue Green Yellow Red
Moreover, as well as protecting citizens' health and minimizing danger to the living
environment, the data is being utilized for forecasting and warning of air pollutants (finedust,
ozone), as well as being used as a much larger basic data to better understand air pollution and
to build air quality improvement policies.13
1) Fine Dust Forecast ・Warning System
Air pollution materials obtained from air pollution monitoring stations are used for air pollution
warnings and the forecasting system in order to protect the citizens' health. The fine dust
13 Seoul Development Institute, 2008, “Study on Approaches to Effectively Link Traffic and Air
Pollution Monitoring Data”
SMG Policies That Work
10
forecast is designed to inform the citizens when high density levels are expected. The warning is
to measure the statistics in real-time and notify the citizens quickly when air pollution reaches
serious levels. The system aims to protect the citizens, especially those with respiratory diseases,
children or elderly citizens that are more sensitive to air pollution.
The microdust forecast and warning system is based on the rapid increase of automobiles, and
the influx of high-density microdust from China. The system is to promote citizens'
participation by notifying them how to act at such times, and then recommend the use of public
transportation. Companies that emit such pollutants can also shorten their operation.
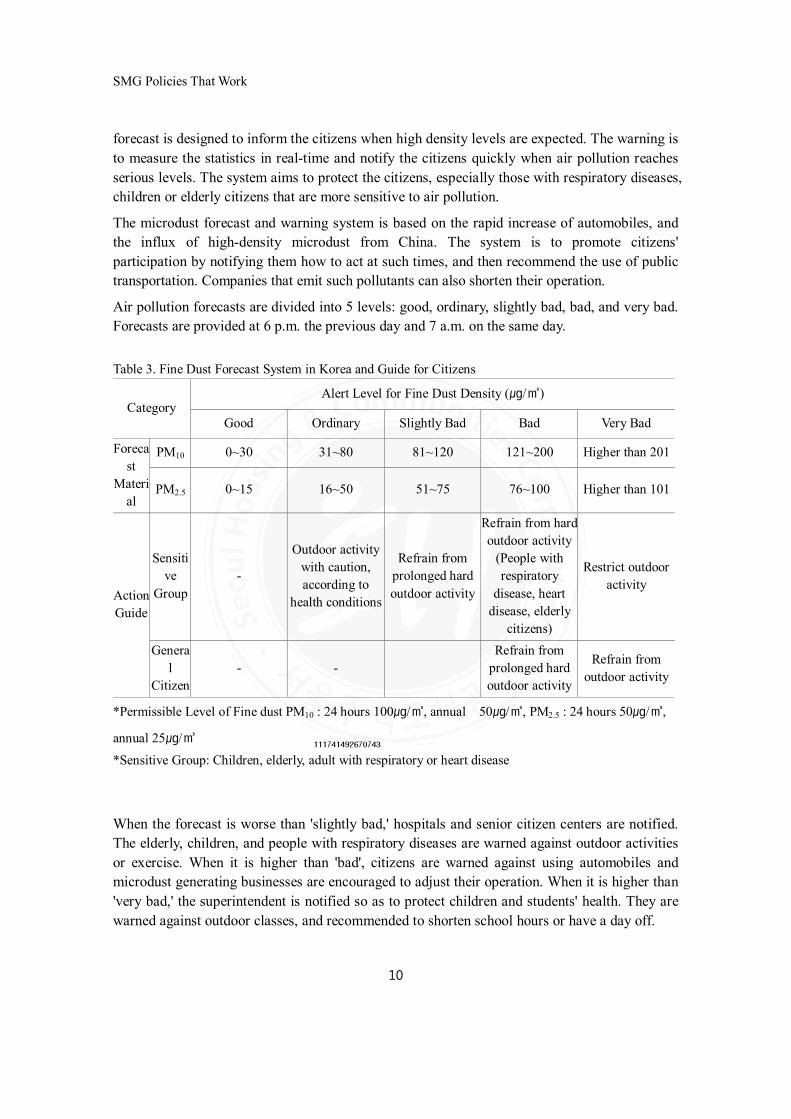
Air pollution forecasts are divided into 5 levels: good, ordinary, slightly bad, bad, and very bad.
Forecasts are provided at 6 p.m. the previous day and 7 a.m. on the same day.
Table 3. Fine Dust Forecast System in Korea and Guide for Citizens
CategoryAlert Level for Fine Dust Density (㎍/㎥)
Good Ordinary Slightly Bad Bad Very Bad
Foreca
st
Materi
al
PM10 0~30 31~80 81~120 121~200 Higher than 201
PM2.5 0~15 16~50 51~75 76~100 Higher than 101
Action
Guide
Sensiti
ve
Group
-
Outdoor activity
with caution,
according to
health conditions
Refrain from
prolonged hard
outdoor activity
Refrain from hard
outdoor activity
(People with
respiratory
disease, heart
disease, elderly
citizens)
Restrict outdoor
activity
Genera
l
Citizen
- -
Refrain from
prolonged hard
outdoor activity
Refrain from
outdoor activity
*Permissible Level of Fine dust PM10 : 24 hours 100㎍/㎥, annual 50㎍/㎥, PM2.5 : 24 hours 50㎍/㎥,
annual 25㎍/㎥
*Sensitive Group: Children, elderly, adult with respiratory or heart disease
When the forecast is worse than 'slightly bad,' hospitals and senior citizen centers are notified.
The elderly, children, and people with respiratory diseases are warned against outdoor activities
or exercise. When it is higher than 'bad', citizens are warned against using automobiles and
microdust generating businesses are encouraged to adjust their operation. When it is higher than
'very bad,' the superintendent is notified so as to protect children and students' health. They are
warned against outdoor classes, and recommended to shorten school hours or have a day off.
SMG Policies That Work
11
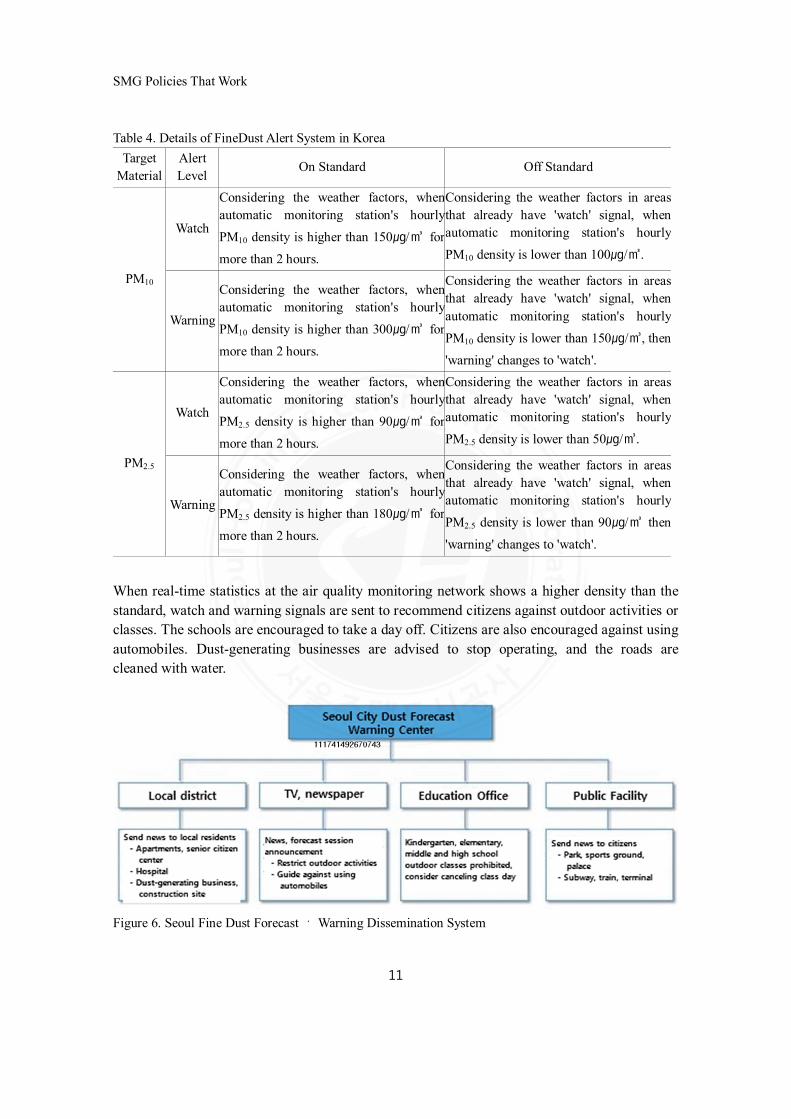
Table 4. Details of FineDust Alert System in Korea
Target
Material
Alert
LevelOn Standard Off Standard
PM10
Watch
Considering the weather factors, when
automatic monitoring station's hourly
PM10 density is higher than 150㎍/㎥ for
more than 2 hours.
Considering the weather factors in areas
that already have 'watch' signal, when
automatic monitoring station's hourly
PM10 density is lower than 100㎍/㎥.
Warning
Considering the weather factors, when
automatic monitoring station's hourly
PM10 density is higher than 300㎍/㎥ for
more than 2 hours.
Considering the weather factors in areas
that already have 'watch' signal, when
automatic monitoring station's hourly
PM10 density is lower than 150㎍/㎥, then
'warning' changes to 'watch'.
PM2.5
Watch
Considering the weather factors, when
automatic monitoring station's hourly
PM2.5 density is higher than 90㎍/㎥ for
more than 2 hours.
Considering the weather factors in areas
that already have 'watch' signal, when
automatic monitoring station's hourly
PM2.5 density is lower than 50㎍/㎥.
Warning
Considering the weather factors, when
automatic monitoring station's hourly
PM2.5 density is higher than 180㎍/㎥ for
more than 2 hours.
Considering the weather factors in areas
that already have 'watch' signal, when
automatic monitoring station's hourly
PM2.5 density is lower than 90㎍/㎥ then
'warning' changes to 'watch'.
When real-time statistics at the air quality monitoring network shows a higher density than the
standard, watch and warning signals are sent to recommend citizens against outdoor activities or
classes. The schools are encouraged to take a day off. Citizens are also encouraged against using
automobiles. Dust-generating businesses are advised to stop operating, and the roads are
cleaned with water.
Figure 6. Seoul Fine Dust Forecast ・ Warning Dissemination System
SMG Policies That Work
12
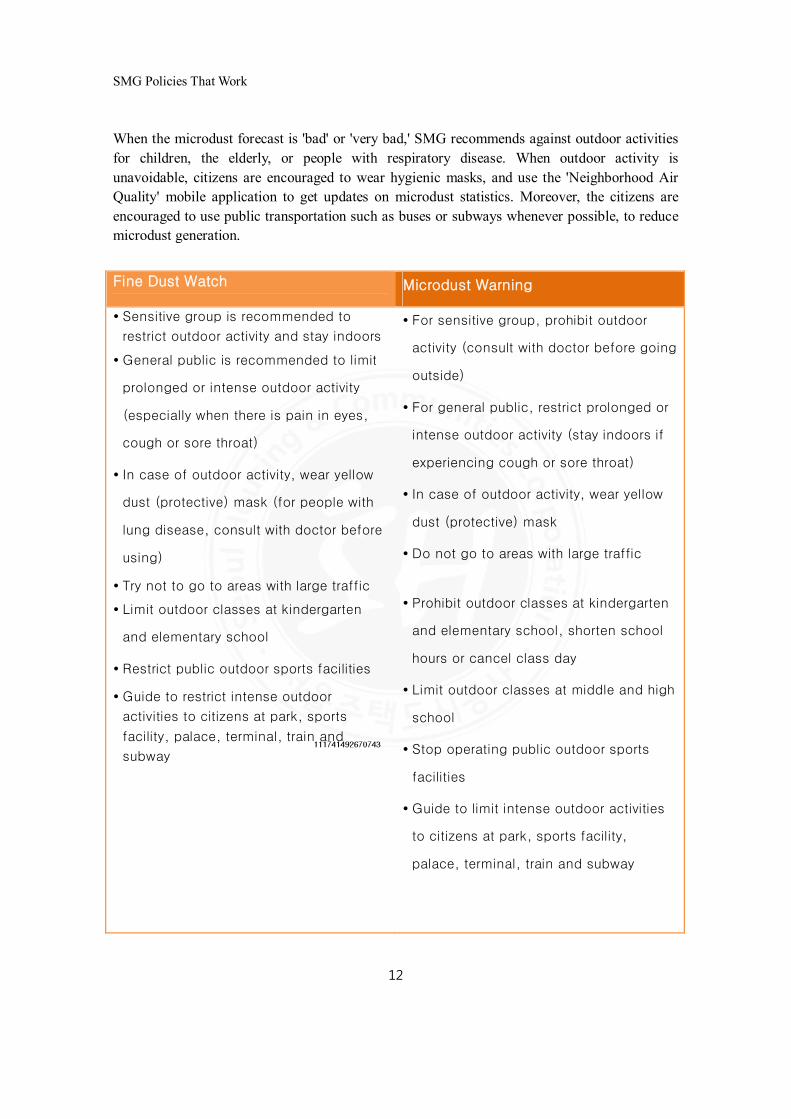
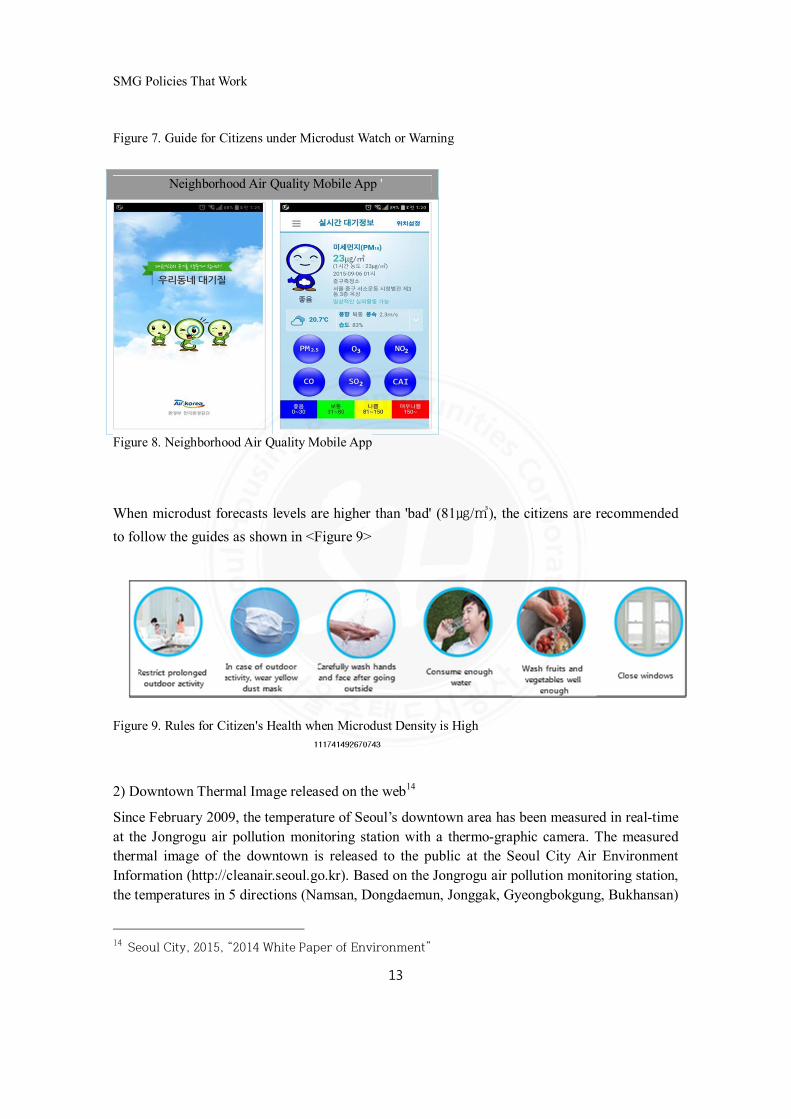
When the microdust forecast is 'bad' or 'very bad,' SMG recommends against outdoor activities
for children, the elderly, or people with respiratory disease. When outdoor activity is
unavoidable, citizens are encouraged to wear hygienic masks, and use the 'Neighborhood Air
Quality' mobile application to get updates on microdust statistics. Moreover, the citizens are
encouraged to use public transportation such as buses or subways whenever possible, to reduce
microdust generation.
Fine Dust Watch Microdust Warning
� Sensitive group is recommended to
restrict outdoor activity and stay indoors
� General public is recommended to limit
prolonged or intense outdoor activity
(especially when there is pain in eyes,
cough or sore throat)
� In case of outdoor activity, wear yellow
dust (protective) mask (for people with
lung disease, consult with doctor before
using)
� Try not to go to areas with large traffic
� Limit outdoor classes at kindergarten
and elementary school
� Restrict public outdoor sports facilities
� Guide to restrict intense outdoor
activities to citizens at park, sports
facility, palace, terminal, train and
subway
� For sensitive group, prohibit outdoor
activity (consult with doctor before going
outside)
� For general public, restrict prolonged or
intense outdoor activity (stay indoors if
experiencing cough or sore throat)
� In case of outdoor activity, wear yellow
dust (protective) mask
� Do not go to areas with large traffic
� Prohibit outdoor classes at kindergarten
and elementary school, shorten school
hours or cancel class day
� Limit outdoor classes at middle and high
school
� Stop operating public outdoor sports
facilities
� Guide to limit intense outdoor activities
to citizens at park, sports facility,
palace, terminal, train and subway
SMG Policies That Work
13
Figure 7. Guide for Citizens under Microdust Watch or Warning
Neighborhood Air Quality Mobile App '
Figure 8. Neighborhood Air Quality Mobile App
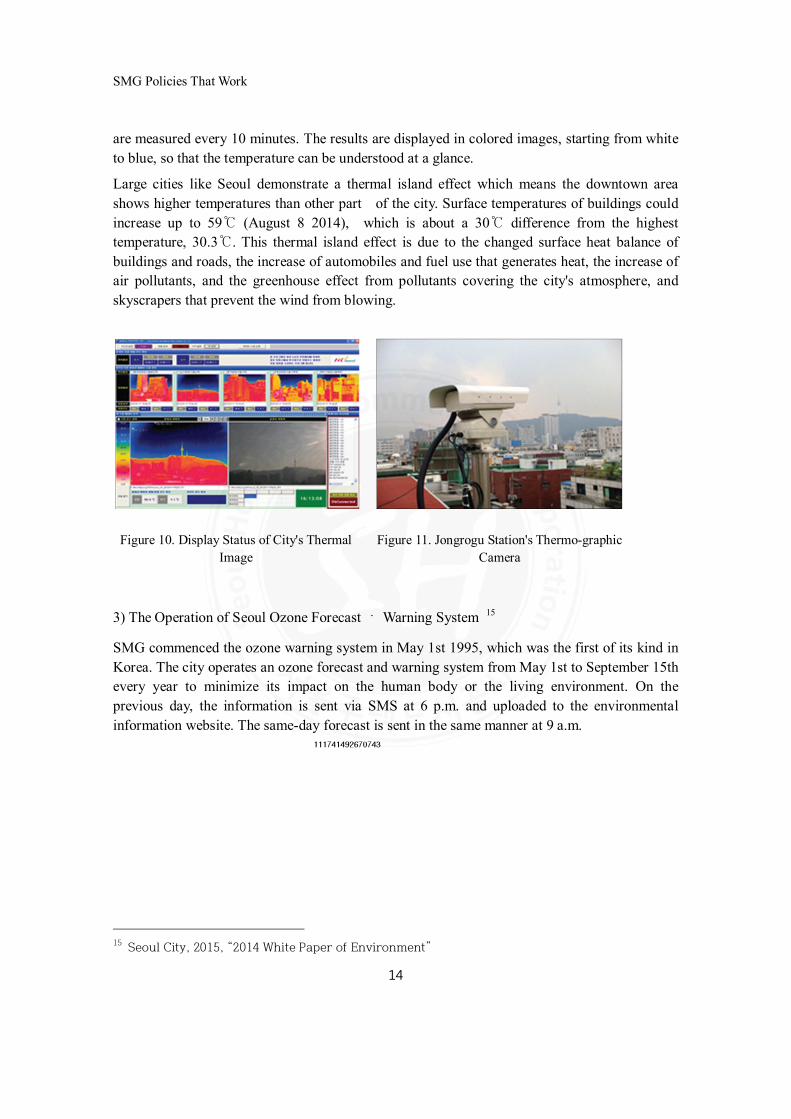
When microdust forecasts levels are higher than 'bad' (81㎍/㎥), the citizens are recommended
to follow the guides as shown in <Figure 9>
Figure 9. Rules for Citizen's Health when Microdust Density is High
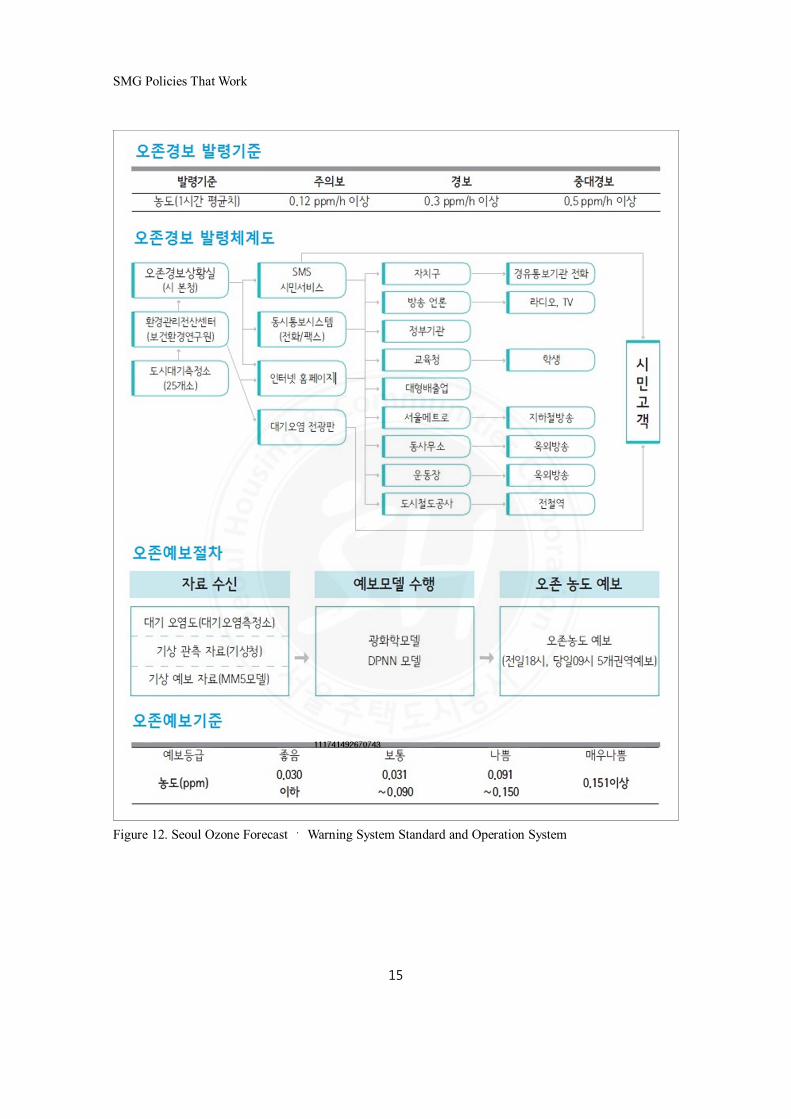
2) Downtown Thermal Image released on the web14
Since February 2009, the temperature of Seoul’s downtown area has been measured in real-time
at the Jongrogu air pollution monitoring station with a thermo-graphic camera. The measured
thermal image of the downtown is released to the public at the Seoul City Air Environment
Information (http://cleanair.seoul.go.kr). Based on the Jongrogu air pollution monitoring station,
the temperatures in 5 directions (Namsan, Dongdaemun, Jonggak, Gyeongbokgung, Bukhansan)
14
Seoul City, 2015, “2014 White Paper of Environment”
SMG Policies That Work
14
are measured every 10 minutes. The results are displayed in colored images, starting from white
to blue, so that the temperature can be understood at a glance.
Large cities like Seoul demonstrate a thermal island effect which means the downtown area
shows higher temperatures than other part of the city. Surface temperatures of buildings could
increase up to 59 (Aug℃ ust 8 2014), which is about a 30 difference from the highest ℃
temperature, 30.3 . This thermal island effect is due to the changed surface heat balance ℃ of
buildings and roads, the increase of automobiles and fuel use that generates heat, the increase of
air pollutants, and the greenhouse effect from pollutants covering the city's atmosphere, and
skyscrapers that prevent the wind from blowing.
Figure 10. Display Status of City's Thermal
Image
Figure 11. Jongrogu Station's Thermo-graphic
Camera
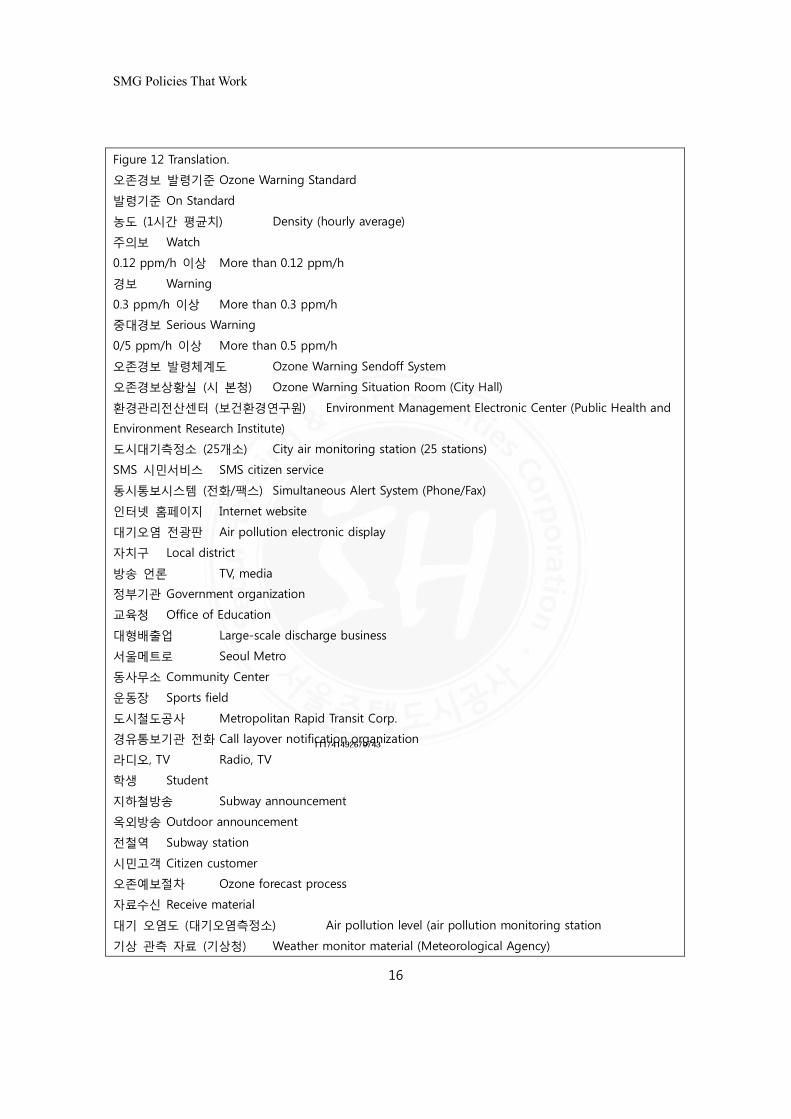
3) The Operation of Seoul Ozone Forecast ・ Warning System 15
SMG commenced the ozone warning system in May 1st 1995, which was the first of its kind in
Korea. The city operates an ozone forecast and warning system from May 1st to September 15th
every year to minimize its impact on the human body or the living environment. On the
previous day, the information is sent via SMS at 6 p.m. and uploaded to the environmental
information website. The same-day forecast is sent in the same manner at 9 a.m.
15
Seoul City, 2015, “2014 White Paper of Environment”
SMG Policies That Work
15
Figure 12. Seoul Ozone Forecast ・ Warning System Standard and Operation System
SMG Policies That Work
16
Figure 12 Translation.
오존경보 발령기준 Ozone Warning Standard
발령기준 On Standard
농도 (1시간 평균치) Density (hourly average)
주의보 Watch
0.12 ppm/h 이상 More than 0.12 ppm/h
경보 Warning
0.3 ppm/h 이상 More than 0.3 ppm/h
중대경보 Serious Warning
0/5 ppm/h 이상 More than 0.5 ppm/h
오존경보 발령체계도 Ozone Warning Sendoff System
오존경보상황실 (시 본청) Ozone Warning Situation Room (City Hall)
환경관리전산센터 (보건환경연구원) Environment Management Electronic Center (Public Health and
Environment Research Institute)
도시대기측정소 (25개소) City air monitoring station (25 stations)
SMS 시민서비스 SMS citizen service
동시통보시스템 (전화/팩스) Simultaneous Alert System (Phone/Fax)
인터넷 홈페이지 Internet website
대기오염 전광판 Air pollution electronic display
자치구 Local district
방송 언론 TV, media
정부기관 Government organization
교육청 Office of Education
대형배출업 Large-scale discharge business
서울메트로 Seoul Metro
동사무소 Community Center
운동장 Sports field
도시철도공사 Metropolitan Rapid Transit Corp.
경유통보기관 전화 Call layover notification organization
라디오, TV Radio, TV
학생 Student
지하철방송 Subway announcement
옥외방송 Outdoor announcement
전철역 Subway station
시민고객 Citizen customer
오존예보절차 Ozone forecast process
자료수신 Receive material
대기 오염도 (대기오염측정소) Air pollution level (air pollution monitoring station
기상 관측 자료 (기상청) Weather monitor material (Meteorological Agency)
SMG Policies That Work
17
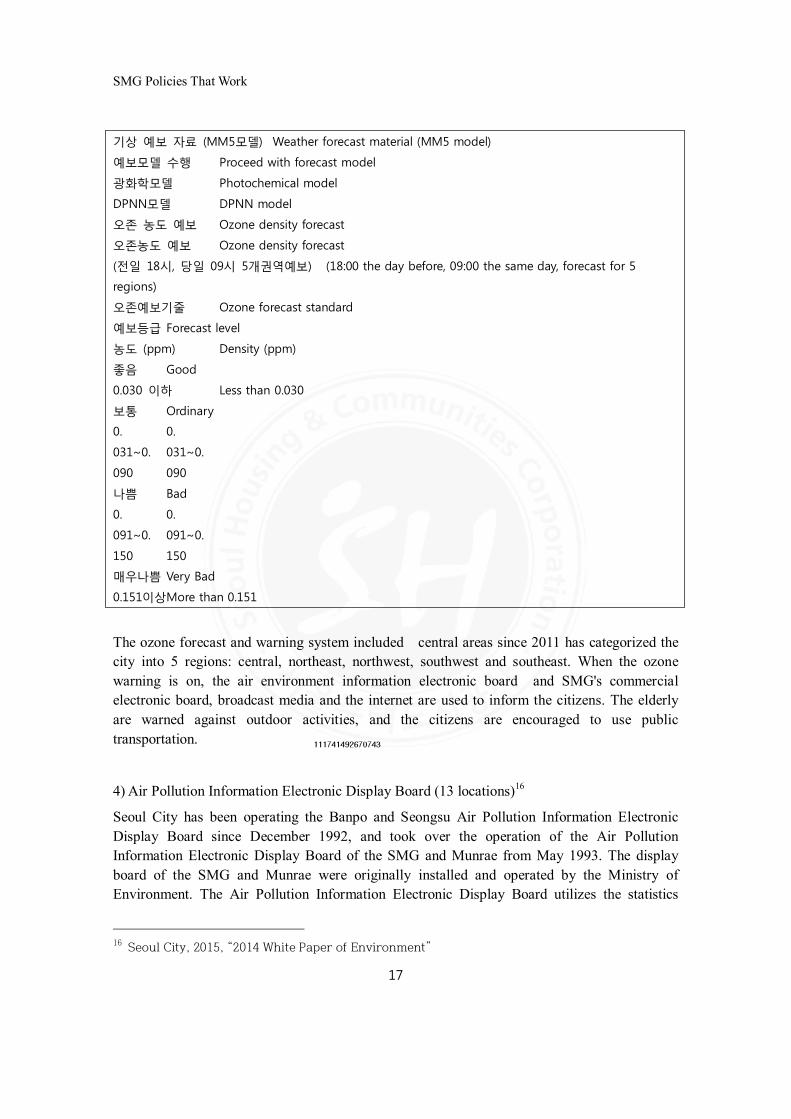
기상 예보 자료 (MM5모델) Weather forecast material (MM5 model)
예보모델 수행 Proceed with forecast model
광화학모델 Photochemical model
DPNN모델 DPNN model
오존 농도 예보 Ozone density forecast
오존농도 예보 Ozone density forecast
(전일 18시, 당일 09시 5개권역예보) (18:00 the day before, 09:00 the same day, forecast for 5
regions)
오존예보기줄 Ozone forecast standard
예보등급 Forecast level
농도 (ppm) Density (ppm)
좋음 Good
0.030 이하 Less than 0.030
보통 Ordinary
0. 0.
031~0. 031~0.
090 090
나쁨 Bad
0. 0.
091~0. 091~0.
150 150
매우나쁨 Very Bad
0.151이상More than 0.151
The ozone forecast and warning system included central areas since 2011 has categorized the
city into 5 regions: central, northeast, northwest, southwest and southeast. When the ozone
warning is on, the air environment information electronic board and SMG's commercial
electronic board, broadcast media and the internet are used to inform the citizens. The elderly
are warned against outdoor activities, and the citizens are encouraged to use public
transportation.
4) Air Pollution Information Electronic Display Board (13 locations)16
Seoul City has been operating the Banpo and Seongsu Air Pollution Information Electronic
Display Board since December 1992, and took over the operation of the Air Pollution
Information Electronic Display Board of the SMG and Munrae from May 1993. The display
board of the SMG and Munrae were originally installed and operated by the Ministry of
Environment. The Air Pollution Information Electronic Display Board utilizes the statistics
16
Seoul City, 2015, “2014 White Paper of Environment”
SMG Policies That Work
18
gained from automatic monitoring networks to display air quality information in various
numbers so as to protect the citizens and promote awareness about the environment. It also
promotes environmental policies and serves as environmental watcher.
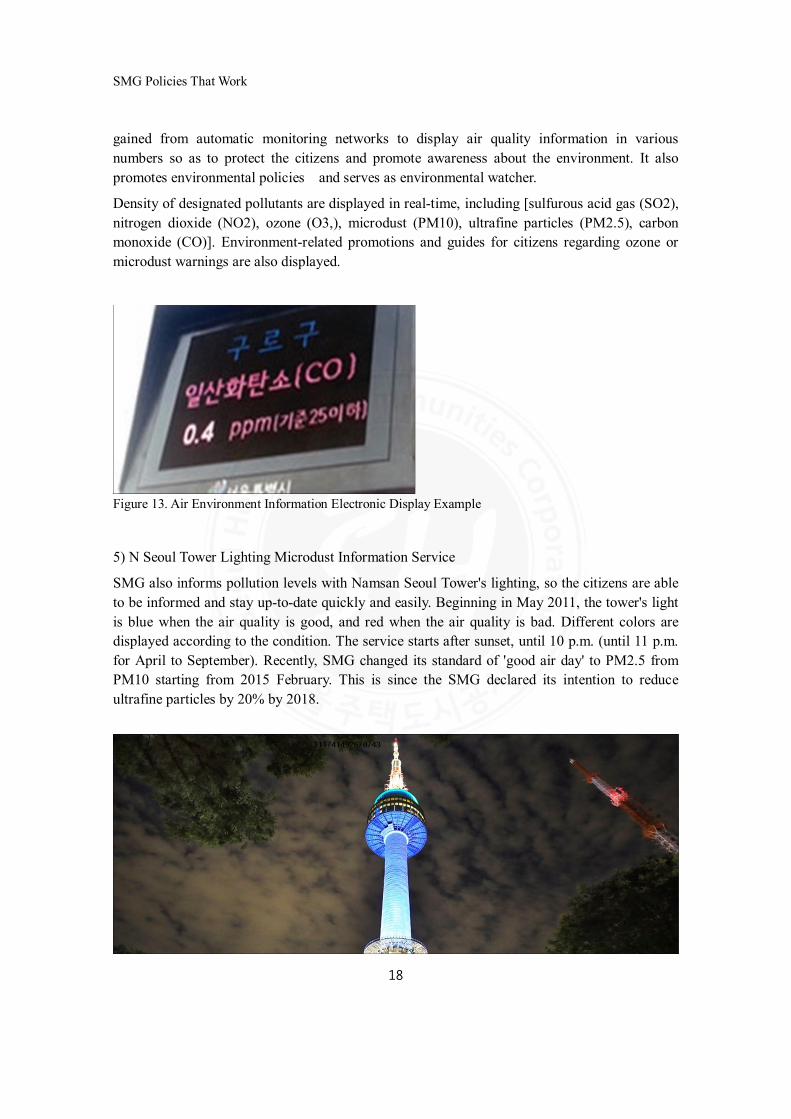
Density of designated pollutants are displayed in real-time, including [sulfurous acid gas (SO2),
nitrogen dioxide (NO2), ozone (O3,), microdust (PM10), ultrafine particles (PM2.5), carbon
monoxide (CO)]. Environment-related promotions and guides for citizens regarding ozone or
microdust warnings are also displayed.
Figure 13. Air Environment Information Electronic Display Example
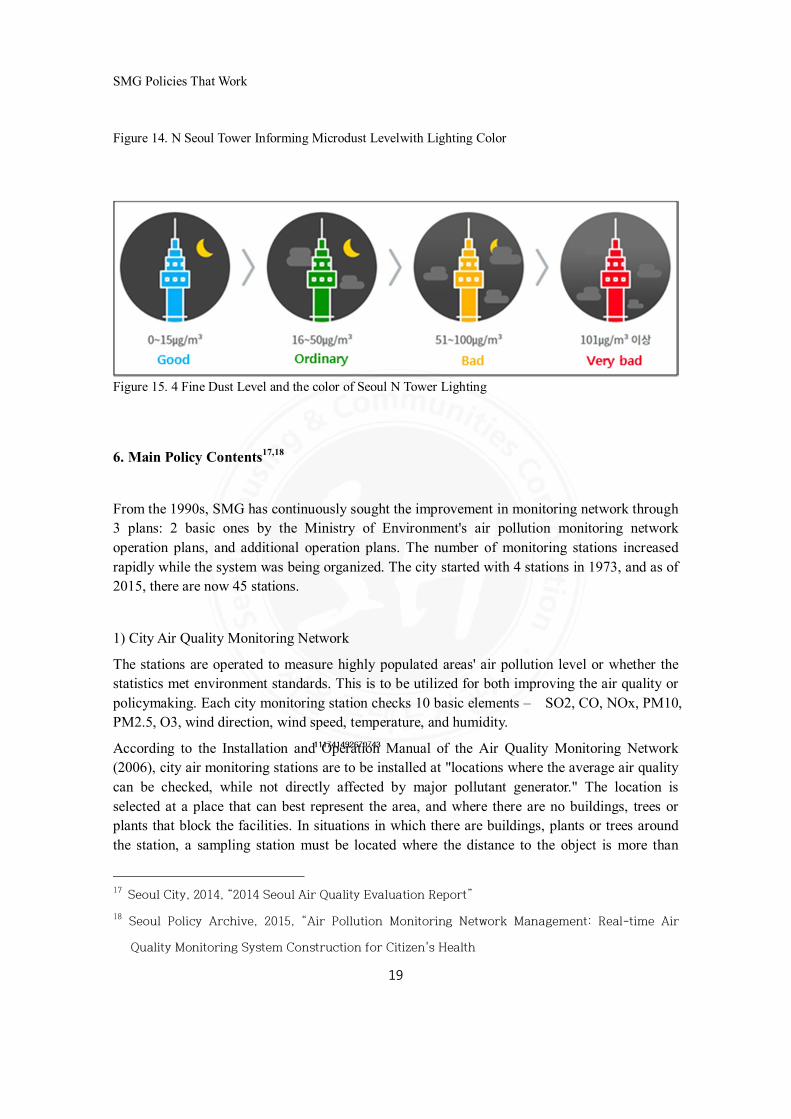
5) N Seoul Tower Lighting Microdust Information Service
SMG also informs pollution levels with Namsan Seoul Tower's lighting, so the citizens are able
to be informed and stay up-to-date quickly and easily. Beginning in May 2011, the tower's light
is blue when the air quality is good, and red when the air quality is bad. Different colors are
displayed according to the condition. The service starts after sunset, until 10 p.m. (until 11 p.m.
for April to September). Recently, SMG changed its standard of 'good air day' to PM2.5 from
PM10 starting from 2015 February. This is since the SMG declared its intention to reduce
ultrafine particles by 20% by 2018.
SMG Policies That Work
19
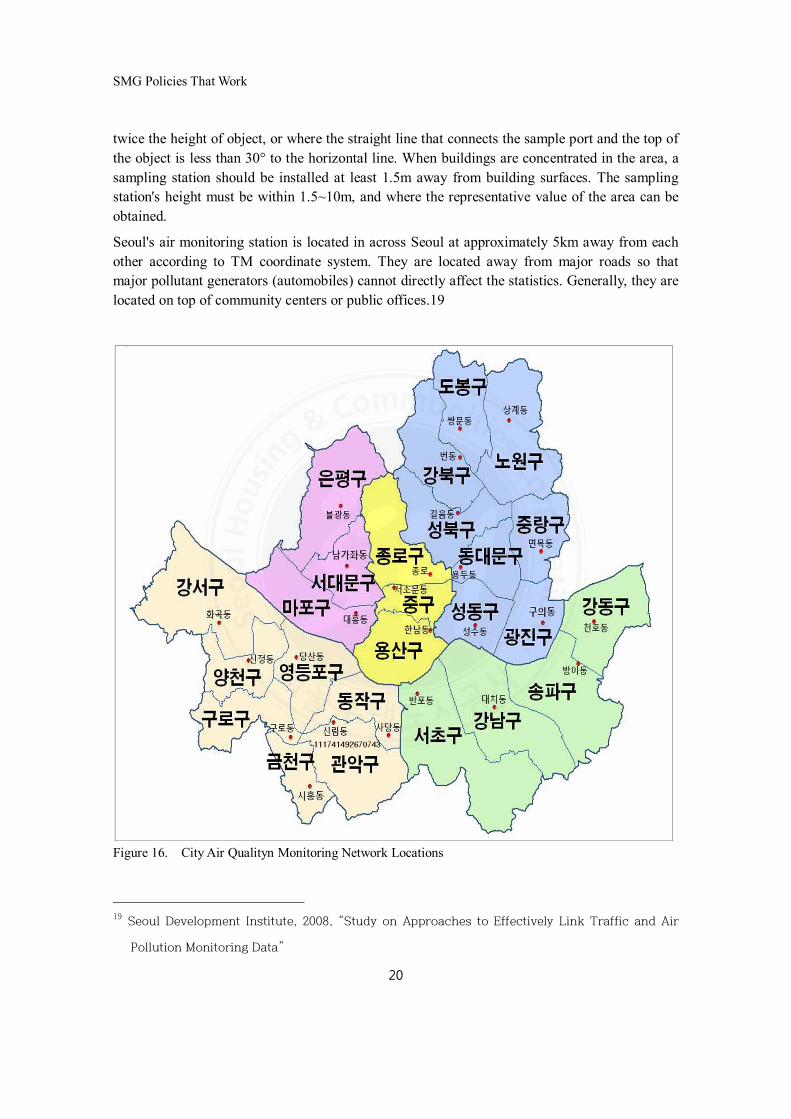
Figure 14. N Seoul Tower Informing Microdust Levelwith Lighting Color
Figure 15. 4 Fine Dust Level and the color of Seoul N Tower Lighting
6. Main Policy Contents17,18
From the 1990s, SMG has continuously sought the improvement in monitoring network through
3 plans: 2 basic ones by the Ministry of Environment's air pollution monitoring network
operation plans, and additional operation plans. The number of monitoring stations increased
rapidly while the system was being organized. The city started with 4 stations in 1973, and as of
2015, there are now 45 stations.
1) City Air Quality Monitoring Network
The stations are operated to measure highly populated areas' air pollution level or whether the
statistics met environment standards. This is to be utilized for both improving the air quality or
policymaking. Each city monitoring station checks 10 basic elements – SO2, CO, NOx, PM10,
PM2.5, O3, wind direction, wind speed, temperature, and humidity.
According to the Installation and Operation Manual of the Air Quality Monitoring Network
(2006), city air monitoring stations are to be installed at "locations where the average air quality
can be checked, while not directly affected by major pollutant generator." The location is
selected at a place that can best represent the area, and where there are no buildings, trees or
plants that block the facilities. In situations in which there are buildings, plants or trees around
the station, a sampling station must be located where the distance to the object is more than
17 Seoul City, 2014, “2014 Seoul Air Quality Evaluation Report”
18 Seoul Policy Archive, 2015, “Air Pollution Monitoring Network Management: Real-time Air
Quality Monitoring System Construction for Citizen's Health
SMG Policies That Work
20
twice the height of object, or where the straight line that connects the sample port and the top of
the object is less than 30° to the horizontal line. When buildings are concentrated in the area, a
sampling station should be installed at least 1.5m away from building surfaces. The sampling
station's height must be within 1.5~10m, and where the representative value of the area can be
obtained.
Seoul's air monitoring station is located in across Seoul at approximately 5km away from each
other according to TM coordinate system. They are located away from major roads so that
major pollutant generators (automobiles) cannot directly affect the statistics. Generally, they are
located on top of community centers or public offices.19
Figure 16. City Air Qualityn Monitoring Network Locations
19 Seoul Development Institute, 2008, “Study on Approaches to Effectively Link Traffic and Air
Pollution Monitoring Data”
SMG Policies That Work
21
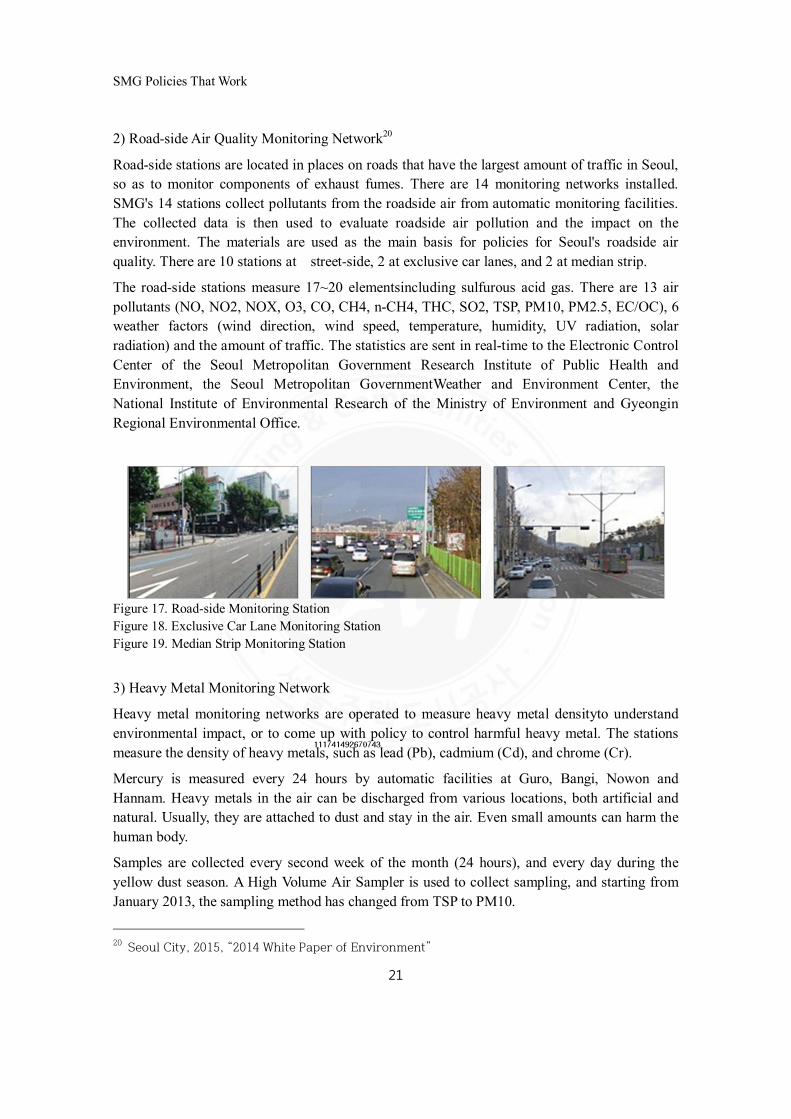
2) Road-side Air Quality Monitoring Network20
Road-side stations are located in places on roads that have the largest amount of traffic in Seoul,
so as to monitor components of exhaust fumes. There are 14 monitoring networks installed.
SMG's 14 stations collect pollutants from the roadside air from automatic monitoring facilities.
The collected data is then used to evaluate roadside air pollution and the impact on the
environment. The materials are used as the main basis for policies for Seoul's roadside air
quality. There are 10 stations at street-side, 2 at exclusive car lanes, and 2 at median strip.
The road-side stations measure 17~20 elementsincluding sulfurous acid gas. There are 13 air
pollutants (NO, NO2, NOX, O3, CO, CH4, n-CH4, THC, SO2, TSP, PM10, PM2.5, EC/OC), 6
weather factors (wind direction, wind speed, temperature, humidity, UV radiation, solar
radiation) and the amount of traffic. The statistics are sent in real-time to the Electronic Control
Center of the Seoul Metropolitan Government Research Institute of Public Health and
Environment, the Seoul Metropolitan GovernmentWeather and Environment Center, the
National Institute of Environmental Research of the Ministry of Environment and Gyeongin
Regional Environmental Office.
Figure 17. Road-side Monitoring Station
Figure 18. Exclusive Car Lane Monitoring Station
Figure 19. Median Strip Monitoring Station
3) Heavy Metal Monitoring Network
Heavy metal monitoring networks are operated to measure heavy metal densityto understand
environmental impact, or to come up with policy to control harmful heavy metal. The stations
measure the density of heavy metals, such as lead (Pb), cadmium (Cd), and chrome (Cr).
Mercury is measured every 24 hours by automatic facilities at Guro, Bangi, Nowon and
Hannam. Heavy metals in the air can be discharged from various locations, both artificial and
natural. Usually, they are attached to dust and stay in the air. Even small amounts can harm the
human body.
Samples are collected every second week of the month (24 hours), and every day during the
yellow dust season. A High Volume Air Sampler is used to collect sampling, and starting from
January 2013, the sampling method has changed from TSP to PM10.
20
Seoul City, 2015, “2014 White Paper of Environment”
SMG Policies That Work
22
During regular investigation, a total of 19 elements are measured: lead (Pb), cadmium (Cd),
chrome (Cr), copper (Cu), manganese (Mn), iron (Fe), nickel (Ni), arsenic (As), and beryllium
(Be). During the yellow dust season, aluminum (Al), calcium (Ca), magnecium (Mg) are added
to the regular list. Inductive coupling plasma emission spectroscopy is used as the analysis
method.
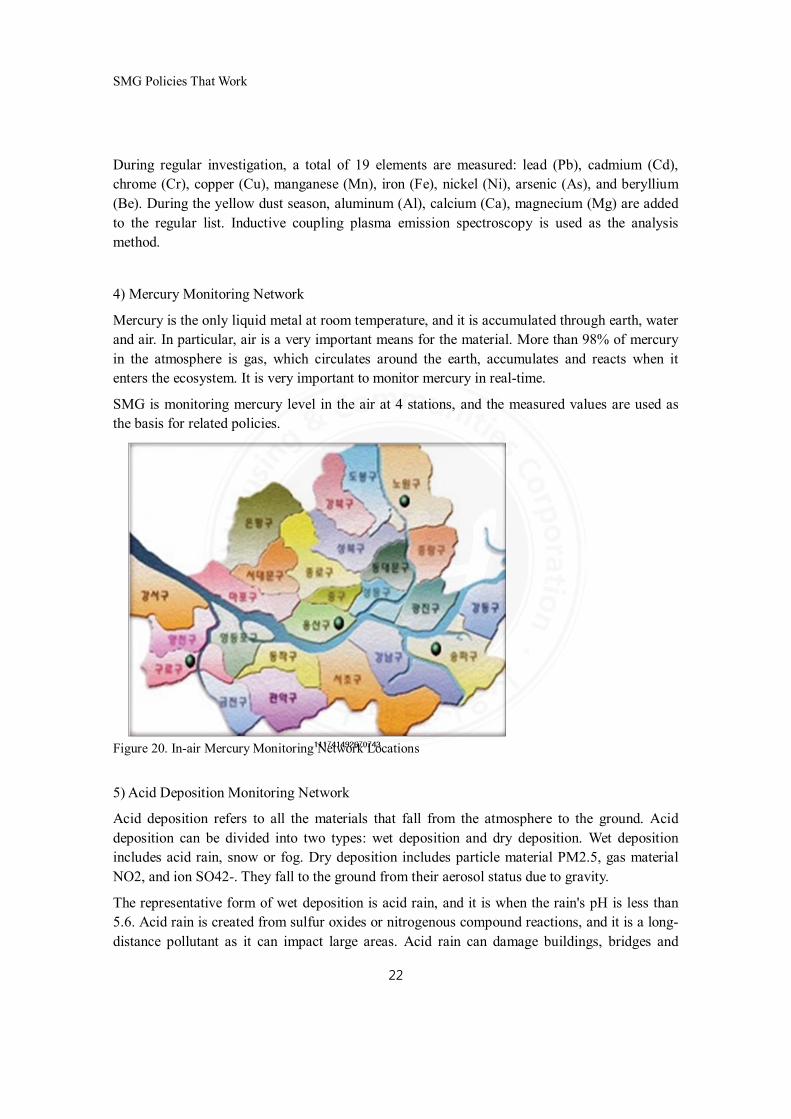
4) Mercury Monitoring Network
Mercury is the only liquid metal at room temperature, and it is accumulated through earth, water
and air. In particular, air is a very important means for the material. More than 98% of mercury
in the atmosphere is gas, which circulates around the earth, accumulates and reacts when it
enters the ecosystem. It is very important to monitor mercury in real-time.
SMG is monitoring mercury level in the air at 4 stations, and the measured values are used as
the basis for related policies.
Figure 20. In-air Mercury Monitoring Network Locations
5) Acid Deposition Monitoring Network
Acid deposition refers to all the materials that fall from the atmosphere to the ground. Acid
deposition can be divided into two types: wet deposition and dry deposition. Wet deposition
includes acid rain, snow or fog. Dry deposition includes particle material PM2.5, gas material
NO2, and ion SO42-. They fall to the ground from their aerosol status due to gravity.
The representative form of wet deposition is acid rain, and it is when the rain's pH is less than
5.6. Acid rain is created from sulfur oxides or nitrogenous compound reactions, and it is a long-
distance pollutant as it can impact large areas. Acid rain can damage buildings, bridges and
SMG Policies That Work
23
other important structures. And after prolonged exposure, children and elderly may suffer skin
conditions. It damages the ecosystem because the acid rain inhibits water absorption of
plantsand decomposition of organic materials, and pollutes the water.
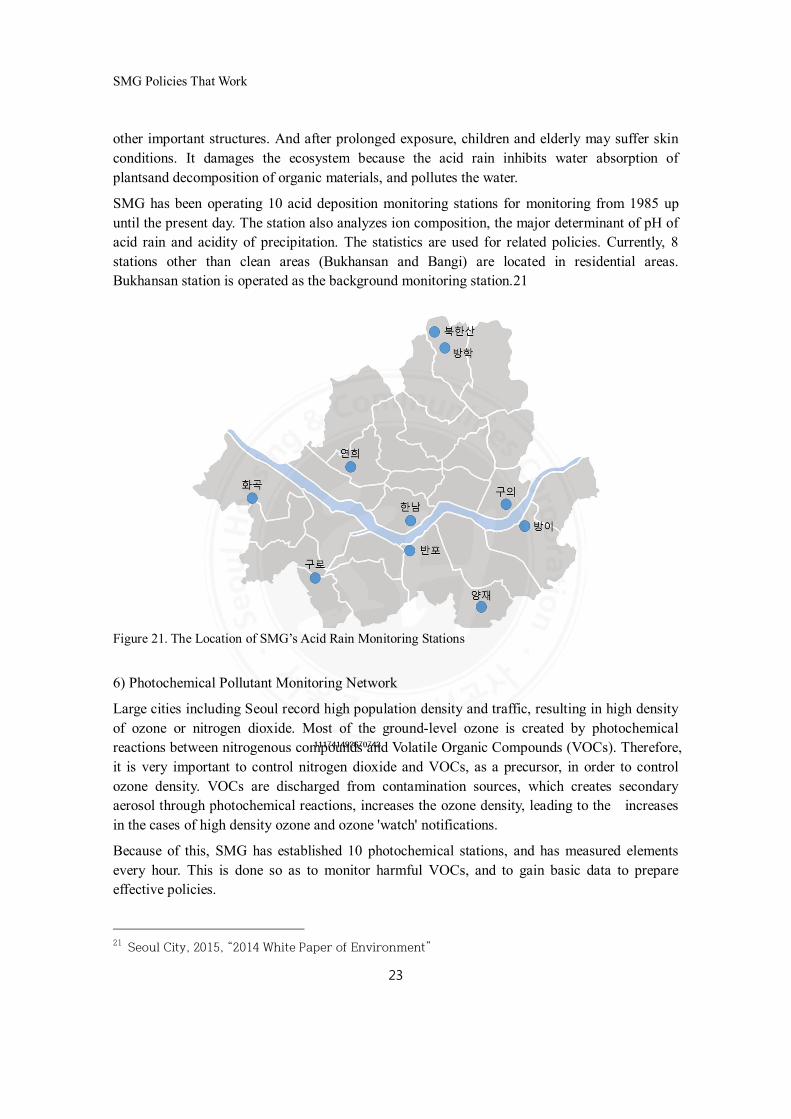
SMG has been operating 10 acid deposition monitoring stations for monitoring from 1985 up
until the present day. The station also analyzes ion composition, the major determinant of pH of
acid rain and acidity of precipitation. The statistics are used for related policies. Currently, 8
stations other than clean areas (Bukhansan and Bangi) are located in residential areas.
Bukhansan station is operated as the background monitoring station.21
Figure 21. The Location of SMG’s Acid Rain Monitoring Stations
6) Photochemical Pollutant Monitoring Network
Large cities including Seoul record high population density and traffic, resulting in high density
of ozone or nitrogen dioxide. Most of the ground-level ozone is created by photochemical
reactions between nitrogenous compounds and Volatile Organic Compounds (VOCs). Therefore,
it is very important to control nitrogen dioxide and VOCs, as a precursor, in order to control
ozone density. VOCs are discharged from contamination sources, which creates secondary
aerosol through photochemical reactions, increases the ozone density, leading to the increases
in the cases of high density ozone and ozone 'watch' notifications.
Because of this, SMG has established 10 photochemical stations, and has measured elements
every hour. This is done so as to monitor harmful VOCs, and to gain basic data to prepare
effective policies.
21
Seoul City, 2015, “2014 White Paper of Environment”
SMG Policies That Work
24
Currently there are 5 VOCs stations (Gangseo, Gwangjin, Guro, Jongro, Bukhansan) and 5
BTEX stations (Songpa, Jungrang, Dongjak, Haengju, Segok) for continuous monitoring.22
Figure 22. Seoul City's Photochemical Pollutant Monitoring Network
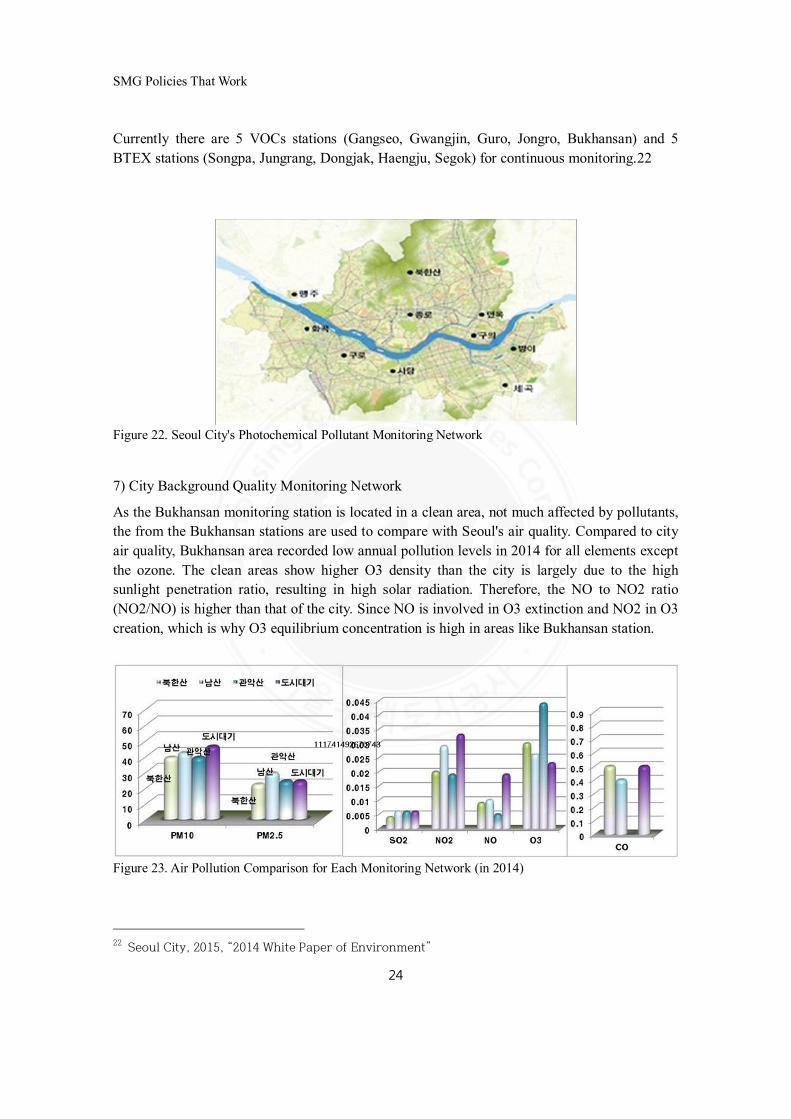
7) City Background Quality Monitoring Network
As the Bukhansan monitoring station is located in a clean area, not much affected by pollutants,
the from the Bukhansan stations are used to compare with Seoul's air quality. Compared to city
air quality, Bukhansan area recorded low annual pollution levels in 2014 for all elements except
the ozone. The clean areas show higher O3 density than the city is largely due to the high
sunlight penetration ratio, resulting in high solar radiation. Therefore, the NO to NO2 ratio
(NO2/NO) is higher than that of the city. Since NO is involved in O3 extinction and NO2 in O3
creation, which is why O3 equilibrium concentration is high in areas like Bukhansan station.
Figure 23. Air Pollution Comparison for Each Monitoring Network (in 2014)
22
Seoul City, 2015, “2014 White Paper of Environment”
SMG Policies That Work
25
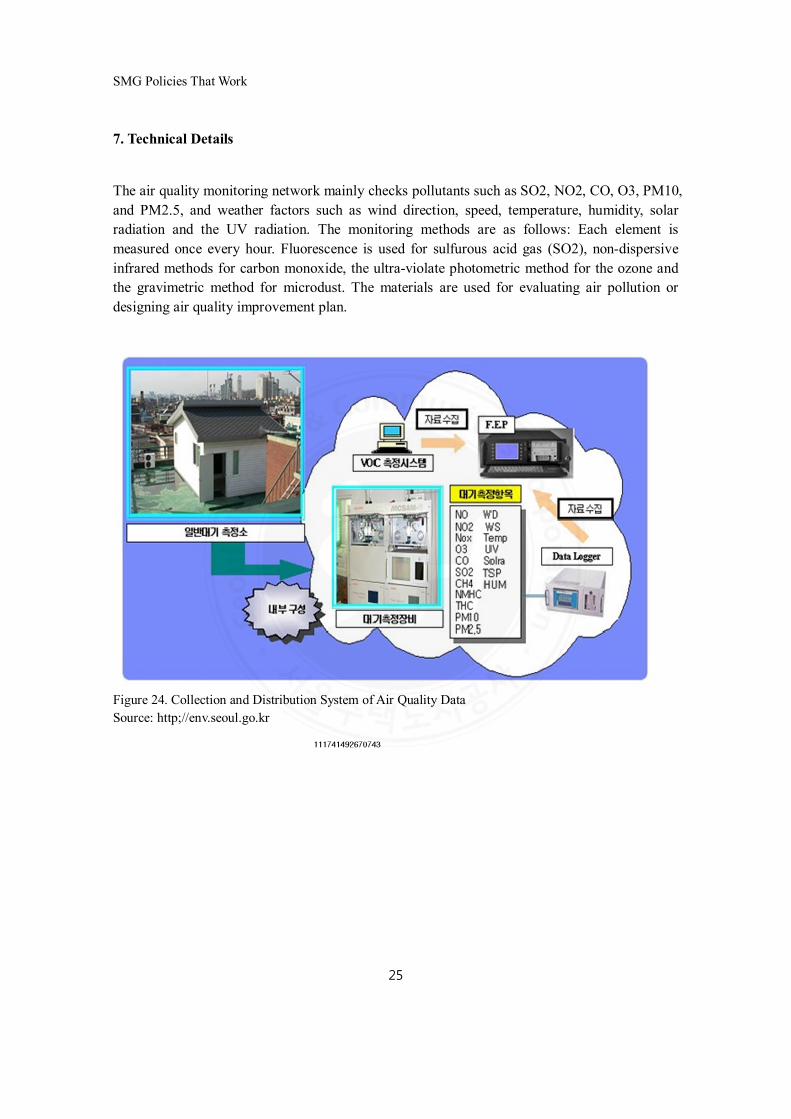
7. Technical Details
The air quality monitoring network mainly checks pollutants such as SO2, NO2, CO, O3, PM10,
and PM2.5, and weather factors such as wind direction, speed, temperature, humidity, solar
radiation and the UV radiation. The monitoring methods are as follows: Each element is
measured once every hour. Fluorescence is used for sulfurous acid gas (SO2), non-dispersive
infrared methods for carbon monoxide, the ultra-violate photometric method for the ozone and
the gravimetric method for microdust. The materials are used for evaluating air pollution or
designing air quality improvement plan.
Figure 24. Collection and Distribution System of Air Quality Data
Source: http;//env.seoul.go.kr
SMG Policies That Work
26
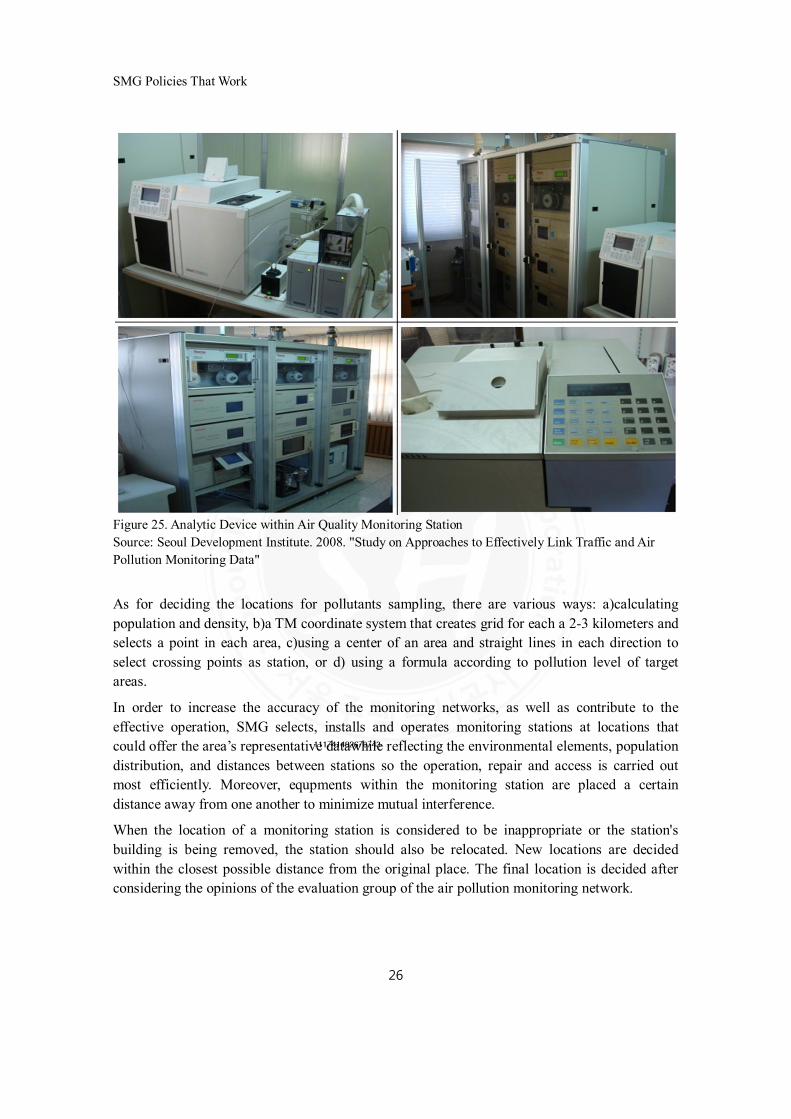
Figure 25. Analytic Device within Air Quality Monitoring Station
Source: Seoul Development Institute. 2008. "Study on Approaches to Effectively Link Traffic and Air
Pollution Monitoring Data"
As for deciding the locations for pollutants sampling, there are various ways: a)calculating
population and density, b)a TM coordinate system that creates grid for each a 2-3 kilometers and
selects a point in each area, c)using a center of an area and straight lines in each direction to
select crossing points as station, or d) using a formula according to pollution level of target
areas.
In order to increase the accuracy of the monitoring networks, as well as contribute to the
effective operation, SMG selects, installs and operates monitoring stations at locations that
could offer the area’s representative datawhile reflecting the environmental elements, population
distribution, and distances between stations so the operation, repair and access is carried out
most efficiently. Moreover, equpments within the monitoring station are placed a certain
distance away from one another to minimize mutual interference.
When the location of a monitoring station is considered to be inappropriate or the station's
building is being removed, the station should also be relocated. New locations are decided
within the closest possible distance from the original place. The final location is decided after
considering the opinions of the evaluation group of the air pollution monitoring network.
SMG Policies That Work
27
8. Policy Effects
SMG can secure basic data including cause analysis needed to come up with measure to
improve air quality and understand the trends of air quality elements such as microdust,
ultrafine particles or nitrogen dioxide, based on the constructed air quality monitoring system.
Based on the collected material, SMG protects citizens' health by forecasting or warning the
level or density of microdust, yellow dust and the ozone. Automatically collected data on air
pollution are uploaded and released in real-time on the website or its mobile applications of the
Air Environment Information. This is to improve the transparency of administration, and meet
the citizens' right to be informed.
SMG has been operating the microdust forecast and warning system since February 2005,
according to the Ordinance on the Microdust Forecast and Warning. Moreover, the city has also
been operating the ultrafine particle (PM2.5) warning system since October 2013, contributing
to the protection of citizens' health.
Fine dust forecasts in 2014 showed a high accuracy rate of 70.5%: 68.5% for for the forecast
made a day before, and 72.6% for the forecast made for the day. Microdust forecasts are
provided to related organizations such as local governments, police, the Office of Education,
and citizens who wish to receive the information via SMSs (text message). There were 2
microdust watches, 6 ultrafine particle watches, and 14 (preliminary) watches released in
201423.
9. Challenges and Solutions
Air pollution monitoring stations installed in Korea have contributed greatly to our
understanding of domestic air pollution, and the creation of air quality improvement plans.
SMG’s monitoring stations are installed in a more concentrated fashion compared to other areas,
and this is playing an important role in evaluating air pollution policies and preparing future
plans.
There are various challenges in terms of securing locations for air pollution monitoring
networks due to the characteristics of Seoul as metropolis. Since the stations are mainly
installed on top of public offices or schools, it is questionable whether the statistics truly and
accurately reflect the area's air quality. Some stations are blocked by large apartment complexes
or commercial buildings.
For this, alternative locations must be found, and mobile air monitoring vehicles can also
monitor air quality for certain durations and then the station can be moved after reliable results
are obtained from alternative locations.
23
Seoul City, 2015, “2014 White Paper of Environment”
SMG Policies That Work
28
Moreover, there have been efforts have been made to measure harmful carcinogenic pollutants,
albeit low density. Strenuous efforts are made to establish relevant policies and implement them
to secure various monitoring elements and to accurately evaluate the impact of the pollutants on
the citizen’s health and to enhance the reliability of the stations.