air force institute of · pdf fileair force institute of technology wright-patterson air force...
TRANSCRIPT
Evaluation Of The Single Keybit TemplateAttack
THESIS
Eric W. Garcia, Captain, USAF
AFIT/GE/ENG/11-11
DEPARTMENT OF THE AIR FORCEAIR UNIVERSITY
AIR FORCE INSTITUTE OF TECHNOLOGY
Wright-Patterson Air Force Base, Ohio
APPROVED FOR PUBLIC RELEASE; DISTRIBUTION UNLIMITED

The views expressed in this document are those of the author and do not reflect theofficial policy or position of the United States Air Force, the United States Departmentof Defense or the United States Government. This material is declared a work of theU.S. Government and is not subject to copyright protection in the United States.
AFIT/GE/ENG/11-11
EVALUATION OF THE SINGLE KEYBIT TEMPLATE ATTACK
THESIS
Presented to the Faculty
Department of Electrical and Computer Engineering
Graduate School of Engineering and Management
Air Force Institute of Technology
Air University
Air Education and Training Command
in Partial Fulfillment of the Requirements for the
Degree of Master of Science in Electrical Engineering
Eric W. Garcia, B.S.E.E.
Captain, USAF
March 2011
APPROVED FOR PUBLIC RELEASE; DISTRIBUTION UNLIMITED

AFIT/GE/ENG/11-11
EVALUATION OF THE SINGLE KEYBIT TEMPLATE ATTACK
Eric W. Garcia, B.S.E.E.Captain, USAF
Approved:
//signed// 1 March 2011
Dr. Rusty O. BaldwinThesis Advisor
Date
//signed// 1 March 2011
Dr. Michael A. TempleCommittee Member
Date
//signed// 1 March 2011
Maj. Michael J. Mendenhall, PhDCommittee Member
Date

AFIT/GE/ENG/11-11
Abstract
Side Channel leakage is a serious threat to secure devices. Cryptographic information
extraction is possible after examining any one of the various side channels, including
electromagnetic. This work contributes a new method to achieve such a purpose. The
Single Keybit Template Attack (SKTA) is introduced as a means to extract encryp-
tion keys from embedded processors and other integrated circuit devices performing
DES encryptions by passively monitoring and exploiting unintentional RF emissions.
Key extraction is accomplished by creating two templates for each bit value of the
key based on instantaneous amplitude responses as a device executes DES operations.
The resultant templates are input to a Maximum Likelihood processor for subsequent
template discrimination with RF emissions captured from a target device. Plaintext
and ciphertext are not necessary for SKTA to function. Using 8-bit microcontroller
devices and experimentally collected side channel signals, key extraction is possible
after examination of approximately 300 RF emission traces. After consideration of
SKTA’s capabilities, embedded processors using DES to process sensitive data war-
rants reconsideration.
iv

Table of Contents
Page
Abstract . . . . . . . . . . . . . . . . . . . . . . . . . . . . . . . . . . . . . . . . . . . . . . . . . . . . . . . . . . . . . . . iv
List of Figures . . . . . . . . . . . . . . . . . . . . . . . . . . . . . . . . . . . . . . . . . . . . . . . . . . . . . . . . . vii
List of Tables . . . . . . . . . . . . . . . . . . . . . . . . . . . . . . . . . . . . . . . . . . . . . . . . . . . . . . . . . . . ix
List of Abbreviations . . . . . . . . . . . . . . . . . . . . . . . . . . . . . . . . . . . . . . . . . . . . . . . . . . . . . x
I. Introduction . . . . . . . . . . . . . . . . . . . . . . . . . . . . . . . . . . . . . . . . . . . . . . . . . . . . . . . . 1
1.1 Background . . . . . . . . . . . . . . . . . . . . . . . . . . . . . . . . . . . . . . . . . . . . . . . . . . . . 11.2 Statement of Problem . . . . . . . . . . . . . . . . . . . . . . . . . . . . . . . . . . . . . . . . . . . . 11.3 Thesis Scope, Limitations and Assumptions . . . . . . . . . . . . . . . . . . . . . . . . . 21.4 Methodology Overview . . . . . . . . . . . . . . . . . . . . . . . . . . . . . . . . . . . . . . . . . . . 31.5 Thesis Chapters Overview . . . . . . . . . . . . . . . . . . . . . . . . . . . . . . . . . . . . . . . . 4
II. Background . . . . . . . . . . . . . . . . . . . . . . . . . . . . . . . . . . . . . . . . . . . . . . . . . . . . . . . . 5
2.1 Encryption Standards . . . . . . . . . . . . . . . . . . . . . . . . . . . . . . . . . . . . . . . . . . . . 52.1.1 Data Encryption Standard . . . . . . . . . . . . . . . . . . . . . . . . . . . . . . . . . . 52.1.2 Advanced Encryption Standard . . . . . . . . . . . . . . . . . . . . . . . . . . . . . 6
2.2 Hamming Distance Leakage Model . . . . . . . . . . . . . . . . . . . . . . . . . . . . . . . . . 82.3 Statistics Background . . . . . . . . . . . . . . . . . . . . . . . . . . . . . . . . . . . . . . . . . . . 13
2.3.1 Correlation . . . . . . . . . . . . . . . . . . . . . . . . . . . . . . . . . . . . . . . . . . . . . . 132.3.2 Baye’s Rule . . . . . . . . . . . . . . . . . . . . . . . . . . . . . . . . . . . . . . . . . . . . . . 15
2.4 Types of Side Channel Analysis . . . . . . . . . . . . . . . . . . . . . . . . . . . . . . . . . . 172.4.1 Simple Power and Electromagnetic Analysis . . . . . . . . . . . . . . . . . . 182.4.2 Differential Power and Electromagnetic Analysis . . . . . . . . . . . . . . 182.4.3 Template Analysis . . . . . . . . . . . . . . . . . . . . . . . . . . . . . . . . . . . . . . . . 19
2.5 Template Attack Techniques . . . . . . . . . . . . . . . . . . . . . . . . . . . . . . . . . . . . . 212.5.1 Single Keybit Template Attack . . . . . . . . . . . . . . . . . . . . . . . . . . . . . 212.5.2 Template Enhanced Differential Analysis . . . . . . . . . . . . . . . . . . . . 22
2.6 Summary . . . . . . . . . . . . . . . . . . . . . . . . . . . . . . . . . . . . . . . . . . . . . . . . . . . . . 23
III. Methodology . . . . . . . . . . . . . . . . . . . . . . . . . . . . . . . . . . . . . . . . . . . . . . . . . . . . . . 24
3.1 Problem Definition . . . . . . . . . . . . . . . . . . . . . . . . . . . . . . . . . . . . . . . . . . . . . 243.1.1 Goals . . . . . . . . . . . . . . . . . . . . . . . . . . . . . . . . . . . . . . . . . . . . . . . . . . . 243.1.2 Hypotheses . . . . . . . . . . . . . . . . . . . . . . . . . . . . . . . . . . . . . . . . . . . . . . 243.1.3 Approach . . . . . . . . . . . . . . . . . . . . . . . . . . . . . . . . . . . . . . . . . . . . . . . 25
3.2 System Boundaries . . . . . . . . . . . . . . . . . . . . . . . . . . . . . . . . . . . . . . . . . . . . . 263.3 System Services . . . . . . . . . . . . . . . . . . . . . . . . . . . . . . . . . . . . . . . . . . . . . . . . 273.4 Workload . . . . . . . . . . . . . . . . . . . . . . . . . . . . . . . . . . . . . . . . . . . . . . . . . . . . . 27
v

Page
3.5 Measures of Performance . . . . . . . . . . . . . . . . . . . . . . . . . . . . . . . . . . . . . . . . 273.6 System Parameters . . . . . . . . . . . . . . . . . . . . . . . . . . . . . . . . . . . . . . . . . . . . . 283.7 Factors . . . . . . . . . . . . . . . . . . . . . . . . . . . . . . . . . . . . . . . . . . . . . . . . . . . . . . . 303.8 Evaluation Technique . . . . . . . . . . . . . . . . . . . . . . . . . . . . . . . . . . . . . . . . . . . 313.9 Experimental Configuration . . . . . . . . . . . . . . . . . . . . . . . . . . . . . . . . . . . . . . 31
3.9.1 Experimental Setup . . . . . . . . . . . . . . . . . . . . . . . . . . . . . . . . . . . . . . . 323.9.2 Signal Collection . . . . . . . . . . . . . . . . . . . . . . . . . . . . . . . . . . . . . . . . . 333.9.3 Feature Extraction and Classification . . . . . . . . . . . . . . . . . . . . . . . 35
3.10 Experimental Design . . . . . . . . . . . . . . . . . . . . . . . . . . . . . . . . . . . . . . . . . . . . 353.11 Methodology Summary . . . . . . . . . . . . . . . . . . . . . . . . . . . . . . . . . . . . . . . . . . 35
IV. Results . . . . . . . . . . . . . . . . . . . . . . . . . . . . . . . . . . . . . . . . . . . . . . . . . . . . . . . . . . . 36
4.1 DES . . . . . . . . . . . . . . . . . . . . . . . . . . . . . . . . . . . . . . . . . . . . . . . . . . . . . . . . . . 364.1.1 Number of Observations . . . . . . . . . . . . . . . . . . . . . . . . . . . . . . . . . . . 364.1.2 Key Guessing Entropy . . . . . . . . . . . . . . . . . . . . . . . . . . . . . . . . . . . . 37
4.2 AES . . . . . . . . . . . . . . . . . . . . . . . . . . . . . . . . . . . . . . . . . . . . . . . . . . . . . . . . . . 384.2.1 Number of Observations . . . . . . . . . . . . . . . . . . . . . . . . . . . . . . . . . . . 384.2.2 Key Guessing Entropy . . . . . . . . . . . . . . . . . . . . . . . . . . . . . . . . . . . . 39
4.3 Summary . . . . . . . . . . . . . . . . . . . . . . . . . . . . . . . . . . . . . . . . . . . . . . . . . . . . . 40
V. Conclusion . . . . . . . . . . . . . . . . . . . . . . . . . . . . . . . . . . . . . . . . . . . . . . . . . . . . . . . . 41
5.1 Summary of Findings . . . . . . . . . . . . . . . . . . . . . . . . . . . . . . . . . . . . . . . . . . . 415.2 Limitations of Findings . . . . . . . . . . . . . . . . . . . . . . . . . . . . . . . . . . . . . . . . . 425.3 Suggested Follow-on Research . . . . . . . . . . . . . . . . . . . . . . . . . . . . . . . . . . . . 425.4 Summary . . . . . . . . . . . . . . . . . . . . . . . . . . . . . . . . . . . . . . . . . . . . . . . . . . . . . 43
A. Pilot Studies . . . . . . . . . . . . . . . . . . . . . . . . . . . . . . . . . . . . . . . . . . . . . . . . . . . . . . . 45
A.1 Signal Domain . . . . . . . . . . . . . . . . . . . . . . . . . . . . . . . . . . . . . . . . . . . . . . . . . 45A.2 Data Bandwidth . . . . . . . . . . . . . . . . . . . . . . . . . . . . . . . . . . . . . . . . . . . . . . . 46
Bibliography . . . . . . . . . . . . . . . . . . . . . . . . . . . . . . . . . . . . . . . . . . . . . . . . . . . . . . . . . . . 49Vita . . . . . . . . . . . . . . . . . . . . . . . . . . . . . . . . . . . . . . . . . . . . . . . . . . . . . . . . . . . . . . . . . . . 51
vi

List of Figures
Figure Page
1. 16-Round DES Encryption Algorithm . . . . . . . . . . . . . . . . . . . . . . . . . . . . . . 7
2. XORing of Permuted Plaintext E with Permuted RoundKey Kn Before Entry Into 8 S-boxes . . . . . . . . . . . . . . . . . . . . . . . . . . . . . . . . 8
3. AES Substitute Bytes Transformation . . . . . . . . . . . . . . . . . . . . . . . . . . . . . . 9
4. AES Shift Rows Transformation . . . . . . . . . . . . . . . . . . . . . . . . . . . . . . . . . . . 9
5. AES Mix Columns Transformation . . . . . . . . . . . . . . . . . . . . . . . . . . . . . . . . . 9
6. AES Add Round Key Transformation . . . . . . . . . . . . . . . . . . . . . . . . . . . . . 10
7. DES electromagnetic signal trace of 16 encryption rounds . . . . . . . . . . . . 10
8. AES electromagnetic signal trace of 10 encryption rounds . . . . . . . . . . . . 11
9. Visible Hamming distances of mean signal traces of onekeybit for values “0” and “1” . . . . . . . . . . . . . . . . . . . . . . . . . . . . . . . . . . . . 12
10. Visible Hamming distances of mean signal traces for6-bit S-box inputs “0” through “63” . . . . . . . . . . . . . . . . . . . . . . . . . . . . . . . 12
11. DES Correlation Between Signal Trace and Keybit . . . . . . . . . . . . . . . . . . 14
12. AES Correlation Between Signal Trace and Keybit . . . . . . . . . . . . . . . . . . 15
13. DES Correlation Between Signal Trace and S-box Input . . . . . . . . . . . . . . 16
14. AES Correlation Between Signal Trace and S-box Input . . . . . . . . . . . . . . 16
15. Evolution of key hypothesis probabilities as the numberof obseerved traces increases . . . . . . . . . . . . . . . . . . . . . . . . . . . . . . . . . . . . . 21
16. Key Extraction System . . . . . . . . . . . . . . . . . . . . . . . . . . . . . . . . . . . . . . . . . . 26
17. Key Extraction System Setup . . . . . . . . . . . . . . . . . . . . . . . . . . . . . . . . . . . . 32
18. DES: Number of target signal trace observations forSKTA and TEDA . . . . . . . . . . . . . . . . . . . . . . . . . . . . . . . . . . . . . . . . . . . . . . 37
19. DES: Key guessing entropy for SKTA and TEDA . . . . . . . . . . . . . . . . . . . 38
vii

Figure Page
20. AES: Number of target signal trace observations forSKTA and TEDA . . . . . . . . . . . . . . . . . . . . . . . . . . . . . . . . . . . . . . . . . . . . . . 39
21. AES: Key guessing entropy for SKTA and TEDA . . . . . . . . . . . . . . . . . . . 40
22. DES Template Classification Performance with Respectto Signal Domain . . . . . . . . . . . . . . . . . . . . . . . . . . . . . . . . . . . . . . . . . . . . . . . 46
23. AES Template Classification Performance with Respectto Signal Domain . . . . . . . . . . . . . . . . . . . . . . . . . . . . . . . . . . . . . . . . . . . . . . . 47
24. AES Template Classification Performance with Respectto Bandwidth . . . . . . . . . . . . . . . . . . . . . . . . . . . . . . . . . . . . . . . . . . . . . . . . . . 48
25. DES Template Classification Performance with Respectto Bandwidth . . . . . . . . . . . . . . . . . . . . . . . . . . . . . . . . . . . . . . . . . . . . . . . . . . 48
viii

List of Tables
Table Page
1. Factors and Levels of System Parameters . . . . . . . . . . . . . . . . . . . . . . . . . . 30
2. Number of Observations for DES . . . . . . . . . . . . . . . . . . . . . . . . . . . . . . . . . 36
3. Key Guessing Entropy for DES . . . . . . . . . . . . . . . . . . . . . . . . . . . . . . . . . . . 37
4. Number of Observations for AES . . . . . . . . . . . . . . . . . . . . . . . . . . . . . . . . . 39
5. Key Guessing Entropy for AES . . . . . . . . . . . . . . . . . . . . . . . . . . . . . . . . . . . 40
ix
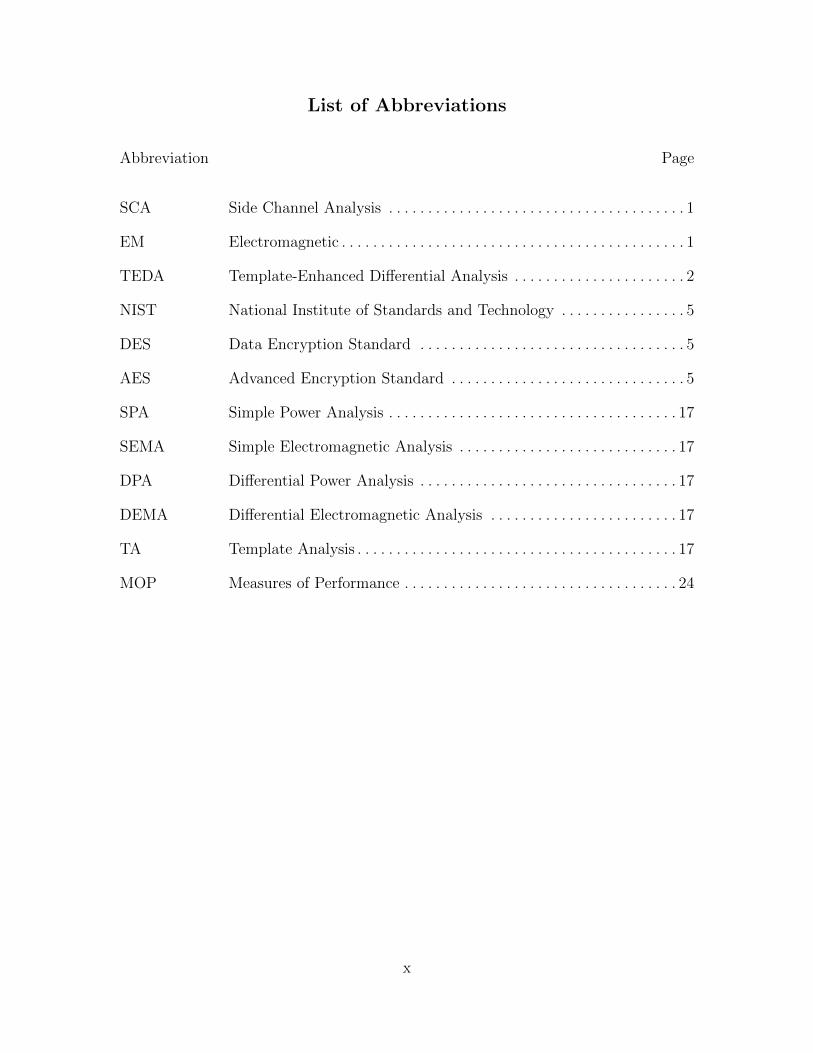
List of Abbreviations
Abbreviation Page
SCA Side Channel Analysis . . . . . . . . . . . . . . . . . . . . . . . . . . . . . . . . . . . . . . 1
EM Electromagnetic . . . . . . . . . . . . . . . . . . . . . . . . . . . . . . . . . . . . . . . . . . . . 1
TEDA Template-Enhanced Differential Analysis . . . . . . . . . . . . . . . . . . . . . . 2
NIST National Institute of Standards and Technology . . . . . . . . . . . . . . . . 5
DES Data Encryption Standard . . . . . . . . . . . . . . . . . . . . . . . . . . . . . . . . . . 5
AES Advanced Encryption Standard . . . . . . . . . . . . . . . . . . . . . . . . . . . . . . 5
SPA Simple Power Analysis . . . . . . . . . . . . . . . . . . . . . . . . . . . . . . . . . . . . . 17
SEMA Simple Electromagnetic Analysis . . . . . . . . . . . . . . . . . . . . . . . . . . . . 17
DPA Differential Power Analysis . . . . . . . . . . . . . . . . . . . . . . . . . . . . . . . . . 17
DEMA Differential Electromagnetic Analysis . . . . . . . . . . . . . . . . . . . . . . . . 17
TA Template Analysis . . . . . . . . . . . . . . . . . . . . . . . . . . . . . . . . . . . . . . . . . 17
MOP Measures of Performance . . . . . . . . . . . . . . . . . . . . . . . . . . . . . . . . . . . 24
x
EVALUATION OF THE SINGLE KEYBIT TEMPLATE ATTACK
I. Introduction
1.1 Background
Side Channel Analysis (SCA) is a technique that extracts information from digital
hardware. Unlike cryptanalysis, which targets mathematical weaknesses in encryp-
tion algorithms, SCA, when applied to a cryptographic system, targets unintended
electromagnetic (EM) emissions produced by the hardware implementation of an en-
cryption algorithm. Most often, the goal of analyzing information from cryptographic
systems is to extract the encryption key used during data encryption. Quickly char-
acterizing, analyzing and extracting information from the unintended EM emissions
of cryptographic systems is important in the intelligence community because many
methods used are time consuming and computationally intensive. Furthermore, with
respect to protection, such research can lead to better protections for DOD encryption
devices as well as improve techniques for exploiting adversary cryptographic devices.
1.2 Statement of Problem
Several SCA techniques can be found in the literature. They include techniques
that target single or multiple bits of cryptographic information and other techniques
that target algorithmic permutations of the desired cryptographic information. Tem-
plate attacks [CRR02] are a type of SCA that compares the unintended EM emissions
of a reference encryption device to emissions from a different but similar encryption
device. The concept of a SCA technique that creates templates for individual keybits
1

is postulated as an effective technique in [ARRS05]. This research effort indepen-
dently developes a comparable technique and names it the Single Keybit Template
Attack (SKTA). The SKTA extracts cryptographic information from an encryption
device by examining the hardware effects generated by the processing of a single key-
bit. This approach is different from other template attacks [CRR02, ARRS05] because
it focuses on a single keybit rather than multiple keybits and it directly targets the en-
cryption key instead of permutations of the key created by an encryption specific key
schedule. This research examines the SKTA, compares it to the most powerful tem-
plate attack, known as Template-Enhanced Differential Analysis (TEDA) [ARRS05],
and determines its effectiveness. Specifically, this research determines the amount
of information from an adversary device needed before the SKTA can extract the
encryption key.
1.3 Thesis Scope, Limitations and Assumptions
This research validates the effectiveness of the SKTA technique. Therefore, it uses
the same encryption device for characterization and classification of unintended EM
emissions. Follow-up research to determine its effectiveness when classifing emissions
from a different like-model device would be useful.
A limitation of this research lies in the uniqueness of the SKTA approach. Since
the SKTA targets single encryption keybits, direct comparisons to other techniques
are difficult. In any case, TEDA, a fundamentally different type of template attack,
was used as a baseline. TEDA differs from the SKTA in that it targets multiple
permuted representations of the keybits. However, the amount of collected data
required before a successful key extraction is a performance metric both techniques
have in common.
Another limitation is the use of a single class of encryption devices for generation
2

of EM emissions. The device under test is a 16-bit general-purpose microcontroller
programmed to perform encryption algorithms. Other device types, such as Field
Programmable Gate Arrays, smartcards and cellular phones, can further validate the
SKTA’s effectiveness. The performance trends seen with the microcontroller should
be similar to trends in other device types.
1.4 Methodology Overview
The methodology for examining the SKTA begins by characterizing a reference
cryptographic device performing encryption operations using random keys and ran-
dom data. While encryptions occur, an EM probe is placed within 1mm of the
device. The probe is connected to an oscilloscope that samples EM signals and saves
the data for later analysis. The oscilloscope is triggered and programmed to save
each encryption cycle in a unique data structure, which includes the EM signals, en-
cryption key, input and output data. This data structure is referred to as a signal
trace, the samples that comprise the signal are referred to as dimensions and the
collection of signal traces gathered during the characterization stage are the training
signals. Once the data is characterized, the classification stage begins by using the
same device to perform similar encryptions except the key is fixed for all encryptions.
Based on expectations developed from the characterization stage, the classification
stage attempts to determine the key. The collection of signals traces gathered during
the classification stage are the target signals traces. The minimum number of target
signal traces collected during the classification stage before a key can be successfully
extracted is recorded and compared to TEDA.
TEDA encryptions are performed on the same encryption device used for the
SKTA encryptions. TEDA also incorporates a characterization stage followed by
a classification stage. Therefore, it too will learn from emissions generated while
3
encrypting random keys with random data.
1.5 Thesis Chapters Overview
This chapter gives a brief overview of SCA, develops the problem statement, dis-
cusses experimental limitations and assumptions and introduces the experimental
methodology. Chapter 2 provides SCA background and related statistical concepts.
Chapter 3 presents the experimental methodology used to evaluate the SKTA. It
also explains key performance metrics used to evaluate and compare the SKTA with
TEDA. Chapter 4 presents the experimental results while Chapter 5 provides analysis
and conclusions based on the results.
4

II. Background
Side Channel Analysis background is provided in this chapter. Topics include en-
cryption standards, leakage models, correlation, classification theory, previous tem-
plate attacks and measures of performance.
2.1 Encryption Standards
In Chapter 1, inputs and outputs of encryption algorithms were described simply
as data. Now they are referred to with their proper names, plaintext and ciphertext.
Encryption converts data to an unintelligible form called ciphertext while decryption
converts the ciphertext back into its original form, called plaintext. Both encryption
and decryption are accomplished using a key and a suitable encryption algorithm.
Encryption algorithms for use with sensitive data are approved by the National
Institute of Standards and Technology (NIST). Two such standards are the Data
Encryption Standard (DES) and the Advanced Encryption Standard (AES). Both
standards are used to compare SKTA with TEDA and are described below. [NIS]
2.1.1 Data Encryption Standard.
DES is a federal information processing standard issued by NIST in 1977. [NIS77]
A DES key consists of 64 bits of which 56 bits are used directly by the encryption
algorithm. The other eight bits, not used by the algorithm, are for error detection
and correction. The eight error detecting bits are set to odd parity based on the key
bytes. DES encrypts 64 bits of data for each encryption cycle. As shown in Figure
1, DES incorporates a unique round key, Kn, to encrypt data during each of sixteen
encryption rounds. Where n ∈ {1, ..., N} and N is the number of encryption rounds.
Round keys are derived from the encryption key using a key permutation schedule
5

based on 48 bits of the encryption key. Therefore, any technique attempting to extract
the encryption key must analyze two consecutive rounds, as the next round will use
the remaining eight bits. Also shown in Figure 1, are two permutation functions
labeled “initial permuatation” and “inverse initial permuation”. Both permuations
reorder input bits before passing them to the next stage of encryption. Boxes labled
L0...L15 and R0...R16 are the left or right halves of the bits from the stages that
precede them, respectively. The operation of each circled “f” functions is shown in
Figure 2. Figure 2 shows the combining of permuted key bits, depicted as K, with
permuted plaintext bits, depicted as E. E “expands” 32 bits into 48 bits by repeating
16 of the bits. E and K are combined using the XOR function and input into look-up
tables known as S-boxes. The eight 6-bit S-box inputs are the target for TEDA. DES
was withdrawn as a federal information processing standard on 19 May 2005 after it
was discovered a brute force attack could compromise it within a few hours [NIS].
2.1.2 Advanced Encryption Standard.
The successor of DES, the Advanced Encryption Standard was issued by NIST in
2001 [NIS01]. The AES algorithm is a symmetric block cipher that incorporates the
Rijndael (pronounced Rhine-doll) encryption algorithm and has cryptographic keys
sizes of 128 (“AES-128”), 192 (“AES-192”), and 256 (“AES-256”) bits. AES encrypts
and decrypts data in blocks of 128 bits arranged in a 4x4 array of bytes. This array
is called the state.
Figures 3 through 6 show the four data transformations used to encrypt data. The
SubBytes transformation, Figure 3, uses S-boxes for non-linear byte substitutions and
operates independently on each byte of the state. In the ShiftRows transformation,
Figure 4, the bytes in the last three rows of the state are cyclically shifted over accord-
ing to row index. The MixColumns transformation, Figure 5, operates on the state
6

Figure 1. 16-Round DES Encryption Algorithm [NIS77]
column-by-column, treating each column as a four-term polynomial and multiplies
it with another fixed polynomial. The state is then replaced by the resultant. In
the AddRoundKey transformation, Figure 6, a round key is combined with the state
using bitwise XOR operation.
The first round of encryption only performs the AddRoundKey transformation and
last round only performs the SubBytes, ShiftRows and AddRoundKey transformations.
The middle rounds perform all four transformations. AES uses a unique round key
to encrypt data during ten, twelve or fourteen rounds of encryption, depending on
key length. Round keys are derived using a key permutation schedule and are derived
from all bits of the encryption key [DR98] .
7

Figure 2. XORing of Permuted Plaintext E with Permuted Round Key Kn BeforeEntry Into 8 S-boxes [NIS77]
2.2 Hamming Distance Leakage Model
SCA uses leakage models to characterize the EM emissions generated by crypto-
graphic devices since the power consumed by a microprocessor is proportional to its
EM emissions and is therefore a good indicator of the data being processed [KJJ99].
Sample EM signal traces for DES and AES, collected by an EM probe, are provided
in Figures 7 and 8. The amplitudes in the EM signals are directly proportional to
the power consumption of the device [KJJ99]. Note the repetitive structure in the
signal traces. The repetitions are equal to the number of encryption rounds in the
respective algorithms.
8

Figure 3. AES Substitute Bytes Transformation [NIS01]
Figure 4. AES Shift Rows Transformation [NIS01]
Figure 5. AES Mix Columns Transformation [NIS01]
9

Figure 6. AES Add Round Key Transformation [NIS01]
Figure 7. DES electromagnetic signal trace of 16 encryption rounds
The best and most often used leakage model in SCA is the Hamming Distance
leakage model [MOP07] and is used to evaluate SKTA and TEDA is the Hamming
Distance model. The Hamming Distance, HD, is the difference in logic-high bits
10

Figure 8. AES electromagnetic signal trace of 10 encryption rounds
between two binary data words. Closely related to the Hamming Distance model
is the Hamming Weight model. The Hamming Weight, HW, of a binary data word
is the number of logic-high bits in that data word. For example, data vectors A =
[00001111] and B = [00000011] have Hamming Weights of four and two respectively.
The Hamming Distance between the vectors is two.
As the Hamming Distance between two binary data words increases, the differ-
ence in power consumption used to process both words differs linearly as well. This
difference in power consumption is evident in the EM signal traces in Figure 9 and
10. Figure 9 displays the visible Hamming Distance between two traces which are
the means of several thousands of signal traces with Hamming Weights of “0” and
“1”. In this case, the two Hamming Weights represent the two possible values for
a bit, which is the target used in the SKTA experiments. Figure 10 displays the
visible Hamming Distances between the means of several thousands of signal traces
11

corresponding to the 64 possible values for a 6-bit S-box input which is the target for
the TEDA experiments.
Figure 9. Visible Hamming distances of mean signal traces of one keybit for values “0”and “1”
Figure 10. Visible Hamming distances of mean signal traces for 6-bit S-box inputs “0”through “63”
12
2.3 Statistics Background
Once the leakage model is selected, statistical techniques likes Pearson’s correla-
tion coefficient and Baye’s rule to facilitate the template attack. Pearson’s correlation
coefficient finds dimensions in the signal trace that are “worthy” of further analysis.
By only focusing on the worthy points, the number of dimensions needed to pro-
cess is drastically reduced. Baye’s rule allows previous classification decisions to be
updated with new knowledge, thus improving the probability of an overall correct
classification. Both concepts are discussed below.
2.3.1 Correlation.
When analyzing EM signal traces for DES and AES, shown in Figures 7 and 8
respectively, the amount of data to process is important. One technique to reduce the
computational processing burden is to only process the dimensions along the signal
trace that are correlated to keybit values for the SKTA or to S-box input values for
TEDA. Pearson’s correlation coefficient,
ρXY =Cov(X,Y)√
(V arX)(V arY)(1)
produces a dimensionless quantity that lies between 1 and -1 which measures the
linear relationship between two random variables, X and Y. A coefficient near 1 or
-1 indicates a strong linear relationship while a coefficient near zero indicates a very
weak relationship.
When a keybit or S-box input is correlated with the DES and AES signal traces,
a vector of correlation coefficients for each dimension is generated. The correlation
coefficients, from Figures 7 and 8 are plotted in Figures 11 through 14.
Figure 11 shows the correlation between DES signal traces and one encryption
13

keybit using SKTA. Note that there are 13 peaks which correspond to the number of
instances the particular keybit is accessed in the DES encryption algorithm. There
are also 75,000 dimensions in the trace. Using Pearson’s correlation coefficient as a
filter, the template classification process need only analyze the 13 dimensions were the
peaks are noticeably above the noise floor and ignore the remaining 74,987 dimensions.
Figure 12 is a similar plot for the AES algorithm. There are only three peaks along
the entire AES signal trace correlated to the particular keybit. Obviously, processing
only three dimensions is trivial in terms of computer processing time. However, Figure
12 also indicates most of the trace has very little correlation to the keybit.
Figure 11. DES Correlation Between Signal Trace and Keybit
For TEDA, Figure 13 is the correlation between DES signal traces and the 6-
bit S-box input. In this example, an S-box from the first round of encryption is
targeted. So the high correlation peaks predominate towards the beginning of the
trace. Note how the peak correlation coefficients between signal traces and S-boxes
14

Figure 12. AES Correlation Between Signal Trace and Keybit
is approximately 0.6 in Figure 13 and approximately 0.2 for signal traces and keybits
in Figure 11. This indicates better template classification results will be achieved
when attacking S-box inputs. Figure 14 is the correlation between AES signal traces
and the 8-bit S-box inputs. With a peak correlation coefficient of approximately 0.6,
compared to 0.2 in Figure 12, better template classification performance is expected
when attacking S-box inputs.
2.3.2 Baye’s Rule.
Classification of target signal traces employs Bayesian decision theory, also known
as Baye’s rule, because it is optimal for the minimization of classification error prob-
ability [TK09]. Baye’s rule incorporates prior knowledge along with a given set of
current observations to make statistical inferences, which are given as posterior prob-
abilities. The prior knowledge, or prior probabilities, could come from observational
data, previous comparable experiments or from engineering knowledge [Cor06]. For
15

Figure 13. DES Correlation Between Signal Trace and S-box Input
Figure 14. AES Correlation Between Signal Trace and S-box Input
16

SKTA, the initial prior probabilities are the probability of observing the two possible
values for one keybit, both 0.5. For TEDA, when evaluating DES, the initial prior
probabilities for the 6-bit S-box inputs are 1/26 = 0.0156. For AES, the initial prior
probabilities for the 8-bit S-box inputs are 1/28 = 0.00391.
Given multiple target signals traces from the encryption device, Baye’s rule can
be applied iteratively to improve the overall classification success. After each new
target signal trace is classified, the prior probabilities are updated to equal the pos-
terior probabilities provided by that classification. That is, the posterior probability
becomes the prior probability for the next classification. As more observations are
made, a more confident decision can be made about the trends occurring in the clas-
sification’s posterior probabilities. As expected, achieving a higher level of confidence
requires more observations.
The general formula for Baye’s Theorem is
P (A|B) =P (B|A)P (A)
P (B)(2)
where P (A|B) is the posterior probability, P(A) is the prior probability of A which is
independent of B, the likelihood or P (B|A) is the conditional probability of B given
A, and P(B) is the prior probability of B [Kay98].
2.4 Types of Side Channel Analysis
There are several variants of SCA, including Simple Power Analysis (SPA), Simple
Electromagnetic Analysis (SEMA), Differential Power Analysis (DPA), Differential
Electromagnetic Analysis (DEMA) and Template Analysis (TA).
17
2.4.1 Simple Power and Electromagnetic Analysis.
SPA is a visual analysis of power-based signal traces collected via a current probe
in series with the microprocessor power line while performing an encryption operation.
This “simple” inspection visually looks for characteristic patterns in the signal traces
that represent key dependent operations such as branch or jump instructions. Once
these patterns are found, the key value can simply be “read” from the signal traces.
In general, only one or a small number of traces are collected. The same methodology
is true of SEMA except that EM traces are analyzed instead of power consumption
traces. These EM traces are typically collected with a near-field EM probe or antenna.
SEMA has a distinct advantage over SPA because EM signals can be collected without
physically contacting the microprocessor [MOP07].
2.4.2 Differential Power and Electromagnetic Analysis.
DPA [KJJ99] and DEMA [QS01] are analogous to SPA and SEMA with respect
to signal collection techniques. However, DPA and DEMA represent a more powerful
statistical approach to SCA. In differential analysis, whether on power or EM traces,
hypotheses on intermediate values, such as S-box inputs, of an encryption algorithm
are correlated with the instantaneous power consumption seen in the target signal
traces. In differential analysis, the plaintext or ciphertext is required to develop the
hypotheses needed to perform correlation. DPA and DEMA attacks are focused on
the first or last rounds of encryption because the unpermuted plaintext and ciphertext
are accessible, respectively. DPA and DEMA generally train with a large amount of
traces varying from several thousand to a million or more.
18

2.4.3 Template Analysis.
Template Analysis [CRR02], or template attacks, is a two-stage side-channel at-
tack performed using a reference device that is identical or nearly identical to a target
device. The first stage, known as the characterization or profiling stage, characterizes
the EM signal traces of the reference device by creating a template for the operations
or data values of interest. Several thousand signal traces are used to create each
template, which consists of a mean trace, and a probability density of the noise. The
distribution of the noise is assumed to be key-dependent. Thus, the profiling stage
creates covariance matrices for each operation or data values of interest. In the next
stage, known as the classification stage, a target signal trace acquired from an en-
cryption device is iteratively compared to the templates to find which templates best
match the target signal trace. Selecting templates that best match the target trace
can lead to the discovery of the entire encryption key or to a reduced set of possible
keys.
2.4.3.1 Template Construction.
In the characterization/profiling stage, a large number of signal traces, t, collected
from the reference encryption device are used to build a template database. In the
original template work [CRR02], a template T(µ̂i, Σ̂i) is comprised of the following
estimators
µ̂i =1
k
k∑j=1
ti,j (3)
and
Σ̂i =1
k − 1
k∑j=1
(ti,j − µ̂i)(ti,j − µ̂i)T (4)
where µ̂i is the mean trace for the operation or data value(s) of interest, Σ̂i is the
corresponding noise covariance matrix, where i is the uniquely created template where
19

i ∈ {1, ..., n}, n is the total number of templates, j is the index to all training traces,
j ∈ {1, ..., k}, and k is the number of training traces [CRR02, HTM09].
2.4.3.2 Template Classification.
In the template classification stage, individual target signal traces are compared to
the templates. If necessary, the target signal trace is first be preprocessed in the same
manner that the template generation traces were processed. For each of the possible
templates, the probability of the signal trace corresponding to a given template is
calculated using
P (t|h) =1√
(2π)n det(Σ̂i)· e−
12
(µ̂i−t) Σ̂−1i (µ̂i−t)T (5)
where t is the target trace and h is the keybit hypothesis associated with a specific
template T(µ̂i, Σ̂i).
These probabilities measure how well the templates correspond to the target signal
trace. The template with the highest resulting probability is the most likely candi-
date. Because each template is associated with a keybit hypothesis or S-box input
hypothesis, it is possible to derive the key used in the target encryption device.
If multiple adversary traces are available, then Baye’s rule
P (hj|t) =P (t|hj) · P (hj)
ΣKl=1 (P (t|hl) · (hl))
(6)
where P (hj|t) is the probability of a keybit hypothesis given a trace t which is de-
pendent upon the prior probability p(hl) and the probability p(ti|hl) of (5) can be
iteratively applied for each target trace to increase the confidence in the template
selected using (5) [Kay98, OM07].
Figure 15 demonstrates an iterative use of Baye’s Rule. Note that with fewer
20

observed target signal traces, several key hypotheses are possible classification can-
didates. As the number of observed traces increases, one key hypothesis candidate,
shown in blue, converges to a probability of one while all others converge to zero.
Figure 15. Evolution of key hypothesis probabilities as the number of obseerved tracesincreases
2.5 Template Attack Techniques
Both SKTA and TEDA use the same template creation/classification techniques
explained in Sections 2.4.3.1 and 2.4.3.2; their differences are described below.
2.5.1 Single Keybit Template Attack.
SKTA is a unique template attack technique that creates two templates for every
encryption keybit, 112 and 256 templates for DES and AES respectively. It associates
one or more target signal traces to the templates to extract the encryption key. SKTA
21

is similar to traditional template attacks with three notable exceptions. First, SKTA
directly targets the encryption key instead of algorithmic permutations the encryption
key. Second, SKTA creates templates from single keybits rather than multiple keybits.
Third, SKTA does not require any cryptographic knowledge about the target signal
traces, such as the plaintext or ciphertext used in the creation of the target signal
traces.
The third difference provides a significant advantage over TEDA. Since TEDA
requires plaintext or ciphertext knowledge about each trace, each trace must be eval-
uated seperately. For SKTA, no plaintext or ciphertext knowledge is required. This
allows target traces to be averaged together before classification. Obviously, as more
target traces are averaged together the true mean of target signal trace develops.
Once the true mean of the signal trace is classified, adding more target signal traces
to the true mean will not improve classification results.
2.5.2 Template Enhanced Differential Analysis.
TEDA combines template attacks with traditional differential analysis techniques.
It is capable of targeting S-box inputs or outputs while using either Hamming Distance
or Hamming Weight leakage models. If targeting the inputs for one S-box, TEDA
creates templates for every possible input value, which for DES and AES is 64 and
256 templates, respectively. Since DES has eight 6-bit S-boxes per encryption round
and two consecutive rounds use all keybits, 1,024 templates are required for analysis.
AES has 16 8-bit S-boxes and uses all keybits in the first encryption round. Therefore,
4,096 templates are required for analysis. In addition, all forms of differential analysis,
including TEDA, require cryptographic knowledge about the target signal traces to
function, in this case, the plaintext or ciphertext associated with each target signal
trace.
22

2.6 Summary
This chapter describes background about SCA techniques. Leakage models are
explained and justified. Correlation and Baye’s rule were described. In addition,
the statistical basis of template creation and classification were provided. Finally,
previous fundamental SCA techniques are highlighted including template attacks that
are the basis of the two template attack techniques evaluated in this research. Chapter
3 describes the experimental methodology used to evaluate and compare the SKTA
with TEDA.
23
III. Methodology
3.1 Problem Definition
3.1.1 Goals.
The goal of this research is to determine the effectiveness and the best usage
scenario of SKTA as a stand-alone encryption key extraction method. This goal can
be expressed in more detail with the following four investigative questions:
1. Is the Single Keybit Template Attack (SKTA) effective?
2. Under what configuration(s) is SKTA most effective?
3. For specific measures of performance, how effective is SKTA compared to Tem-
plate Enhanced Differential Analysis (TEDA)?
4. Under what conditions and scenarios is SKTA preferred over TEDA?
3.1.2 Hypotheses.
The determination of SKTA’s effectiveness is based on examining several config-
urations. When applicable, configurations for both template attack techniques are
implemented using a PIC microcontroller, the Advanced Encryption Standard (AES)
or Data Encryption Standard (DES), in time, frequency or wavelet domains and with
several data bandwidths. For all experimental configurations, the number of tar-
get device observations and key guessing entropy measure the performance of both
template attack techniques. These measures of performance (MOP) are described in
section 3.5.
Based on the above experimental configurations, prior research in template attack
techniques, the measures of performance and previous experiments, the following
hypotheses are formulated:
24

• When evaluating the DES algorithm, SKTA should require fewer target signal
traces to extract a key and have a higher key guessing entropy percentage be-
cause more correlation peaks are available to SKTA than to TEDA (see Figures
11 vs. 13). The DES algorithm operates on encryption keybits 12-15 times
during each encryption cycle whereas the S-box inputs, required by TEDA, are
only accessed once.
• When evaluating the AES algorithm, SKTA should require more target signal
traces to extract a key and have a lower key guessing entropy percentage than
TEDA because AES generates fewer correlation points for SKTA to examine.
Additionally, the correlation coefficients for the peaks are lower for a keybit
attack than for an S-box attack. TEDA overcomes these drawbacks by using the
plaintext associated with each target signal trace to extract a key (cf. Figures
12 and 14).
Validating the above hypotheses is sufficient to answer the four investigative ques-
tions and the research goal.
3.1.3 Approach.
To determine SKTA’s effectiveness and prove or disprove the hypotheses, sev-
eral replications of device EM signal acquisitions are collected for four experimental
configurations. Each experiment has two measures of performance. Overall, four
experiments and eight measurements are required for a full factorial research effort
with only one replication.
To avoid sporadic use of collection equipment, five replications of EM signal traces,
representing training and target sets, are collected for DES and AES encryptions.
Once collected, the two types of signal traces, representing DES and AES, are evalu-
ated with SKTA and TEDA.
25

Finally, MOPS are collected and evaluated to ensure an appropriate amount of
replications are collected.
3.2 System Boundaries
The System Under Test (SUT), graphically depicted in Figure 16, is the Key
Extraction System (KES) which is comprised of the Component Under Test (CUT),
an encryption device, data collection system and the data analysis computer station.
The CUT is the two template attack techniques discussed earlier.
Figure 16. Key Extraction System
This research is limited to the encryption device available. However, 16-bit
general-purpose microcontroller devices are highly representative of devices commonly
used in data encryption. Data bandwidth is limited by the amount of memory and
processing capacity in the data analysis computer station. However, the data analysis
computer station is capable of processing any data bandwidth commonly seen in SCA
26

literature, in a reasonable amount of time.
3.3 System Services
The Key Extraction System provides two services. The first service is the ex-
traction of the encryption key from the target signal traces captured by the system.
The second service is the creation of multiple reusable templates that are capable of
extracting keys from traces collected from encryption devices similar to the device
used to create the templates.
3.4 Workload
The Key Extraction System has two workload parameters: the amount of training
signal traces and number of target signal traces. The number of training signal traces
is fixed at 100,000 for all experiments. The number of target signal traces is increased
until a key is extracted or the performance of the template classifier ceases to improve.
3.5 Measures of Performance
Performance of SKTA and TEDA is evaluated using two measures of performance:
the number of required target device observations and key guessing entropy. Each
metric is described below.
• The number of target device observations is the number of signal traces the tem-
plate classifier requires to produce a classification with a posterior probability
of one. The maximum number of observations needed for each keybit classi-
fication in SKTA, or each S-Box input classification in TEDA, is used as the
overall result for the performance metric. Requiring fewer target signal traces
to extract a key is more desirable.
27

• Key guessing entropy [FXSY09] is the percentage of correct keybits extracted by
the template attack. A percentage is used because DES and AES have different
key lengths. Having a higher key guessing entropy percentage means more
keybits are extracted and is therefore better than having a lower key guessing
entropy percentage.
Calculating the key guessing entropy begins with sorting the keybit posterior
probabilities provided by the template classifier. Starting from the lowest prob-
ability, iterate each succesive keybit until the correct key is discovered. To
determine if the correct key is discovered in a real-world scenario, a plaintext-
ciphertext pair is required to test the key. For these experiments, the key is
known apriori. To generate the key quessing entropy percentage, (7), the num-
ber of keybits iterated, REQKI , until the correct key is found is subtracted from
the total number of keybits, NK , and divided by the total number of keybits.
GuessingEntropyPercent =NK −REQKI
NK
(7)
3.6 System Parameters
The following are the system parameters for the Key Extraction System.
• Encryption Algorithm - An encryption algorithm converts data to an un-
intelligible form called ciphertext while decrypting the ciphertext converts the
data back into its original form, called plaintext. Both encryption and de-
cryption are accomplished using a key and a suitable encryption algorithm. An
encryption algorithm is required to test each template attack’s ability to extract
a key.
• Signal Domain - The signal domain is the manner in which data is repre-
28

sented. Switching between domains requires the use of an appropriate trans-
form. Transforming to different domains can alter the way in which data is
represented and can also change what information is presented. Varying signal
domains tests a template attacks ability to extract keys from different represen-
tations of data. A pilot study determined the wavelet domain provides optimal
results when considering performance and computational workload. Details of
this pilot study are provided in Appendix A.1.
• Signal Bandwidth - The signal bandwidth indicates the amount of informa-
tion gathered for each signal trace during collection. Determining a sufficient
bandwidth required for the template attacks can lead to more efficient data anal-
ysis and less workload for the data analysis computer station. Another pilot
study determined a bandwidth in the range of 200 - 500 MHz provides optimal
results when considering performance and computational workload. Details of
this pilot study are provided in Appendix A.2.
• Component Clock Frequency - The encryption device is operated at a typi-
cal system clock frequency and does not vary during experimentation. Although
it is possible to vary clock frequencies, the data collection system imposes an
upper bound on the clock frequency to avoid signal aliasing. Once the clock
frequency in a target signal trace is determined, the clock frequency of the
reference encryption device and the signal processing parameters of the data
collection system are set accordingly.
• Operation State - Possible operation states include the transition-state and
steady-state. When the encryption device is first powered on, it begins opera-
tion in the transition state. The transition-state is characterized by a relatively
large change in device temperature while computations occur. According to
29

preliminary measurements of the encryption device, the transition-state typi-
cally lasts 10-15 minutes before the device transitions into the steady-state. The
steady-state is characterized by relatively small changes in device temperature
during operation. For all experiments, the steady-state of operation is used to
generate results with higher precision.
• Lab Environment - The lab environment is in an office-like environment which
contains RF-based test equipment. To ensure low contamination of the data,
experiments are conducted when RF equipment is off and cell phones are not
within five feet of the encryption device.
3.7 Factors
The following tables list the experimental factors and levels that are further dis-
cussed below.
Table 1. Factors and Levels of System Parameters
Encryption Algortihm Template Attack
DES SKTA
AES TEDA
• Encryption Algorithm - The encryption algorithms are DES and AES-128.
These two algorithms are chosen because both are or have been the standard
approved by NIST to encrypt sensitive data. Triple-DES [NIS99], AES-192
and AES-256 were not considered because they are essentially enhancements
of DES and AES-128 and do not represent a fundamentally different type of
encryption scheme. A significant difference between DES and AES is that the
DES key is accessed during all 16 rounds of encryption while the AES key is
30
only accessed in the first round. The remaining rounds of AES encryption use
permuted representations of the key that removes any correlation between that
round’s key and the original key. AES is expected to have worse template attack
performance compared to DES because the original keybits are only accessed
once while the DES keybits are accessed 12-16 times throughout the encryption.
• Template Attack - The template attacks are the Single Keybit Template
Attack and Template Enhanced Differential Analysis. Both template attacks
are evaluated with DES and AES. TEDA was chosen as the only template
attack to compare against SKTA because it is the most powerful template attack
technique [OM07, RO04].
3.8 Evaluation Technique
Direct measurement of the encryption device is the evaluation technique for this
research. Analytical models are not feasible due to a lack of accessibility to proprietary
SPICE models. Simulations are also not applicable because they only create signal
traces generated with fixed key and random plaintext. Both SKTA and TEDA experi-
ments require signal traces generated from random keys and random plaintext. There-
fore, the best validation method is to compare experimental results with results using
similar configurations in other template attack research [ARRS05, CRR02, HTM09].
Results are not expected to be identical because devices, bit-widths and signal col-
lection techniques vary amongst researchers. However, performance trends should be
consistent.
3.9 Experimental Configuration
A description of the Key Extraction System setup, see Figure 17, and analysis
methodology used herein is provided below - including setup of the device under test
31

and signal collection.
Figure 17. Key Extraction System Setup
3.9.1 Experimental Setup.
For all experiments, unintentional EM emissions of a 16-bit PIC microcontroller
(PIC24FJ48GA002) manufactured by Microchip Technology, Inc. is evaluated [MTI10].
The PIC device is representative of the low cost microcontrollers used in a variety of
real-world commercial security applications such as garage door openers and remote
keyless entry systems [PEK+09] and is easy to obtain through normal commercial
channels.
For device control and measurement, the microcontroller is mounted on a Mi-
crochip 16-bit 28-pin Starter Development Board [MTI08]. The circuit board is fixed
in place on a measurement table using a custom fitted jig to minimize any lateral
32

movement of the device during or between collections. The board was chosen for
its clean layout which includes only a small number of on-board components, thus
providing a relatively low-noise environment for collection. Where possible, on-board
peripherals (LEDs and potentiometer) are disconnected via jumpers to further reduce
any RF noise induced by their operation. The circuit board is powered from a stan-
dard lab DC power supply (Agilent E3631A) to reduce effects of any uncontrolled
supply voltage fluctuations.
An on-board PIC18 microcontroller, used to control the USB port for emulation
of an RS232 serial interface, could not be disabled. This second microcontroller
was active during all collections and is physically located less than an inch from the
primary microcontroller of interest.
The development board provides an external 7.37 MHz crystal oscillator signal
to the microcontroller. The microcontroller is configured with the on-board clocking
system to generate an internal operating frequency of fOSC = 29.48 MHz from this
signal [MTI10].
3.9.2 Signal Collection.
Unintentional EM emissions from the microcontroller are collected using a near-
field probe (1 GHz bandwidth) connected to a Lecroy 104-Xi-A oscilloscope as shown
in Figure 17. The probe acts as an antenna to receive the unintentional emissions
from the device under test, and does not directly contact the chip. The oscilloscope
has a maximum input bandwidth of WI = 1 GHz and a maximum sample rate of
fS = 10 GSa/sec. All data presented here is collected at a sample rate of fS = 500
MSa/sec and a bandwidth of WC = 200 MHz.
The near-field probe is mounted on a computer-controlled motorized XYZ table for
consistent placement of the probe relative to the device under test. The initial probe
33

position was established by performing a two-dimensional scan of the surface of the
microcontroller as it repeatedly executed a sequence of encryption operations. The
results of the scan were processed with a bandpass filter and analyzed to determine the
location of maximal EM energy in the band corresponding to the known internal clock
frequency of fOSC = 29.48 MHz. The probe and relative device positions remained
fixed for all collections.
To improve collection efficiency and reduce required postprocessing for signal
alignment, the microcontroller is controlled by a data analysis station (PC) over
an RS-232 serial interface. The microcontroller repeatedly performs encryptions on
data recieved via the RS-232 serial interface. At the start of the encryption sequence,
the microcontroller asserts a trigger signal on one of its general purpose input/out-
put (GPIO) pins. The oscilloscope is configured to collect the EM signal for a fixed
time interval each time the trigger is asserted. This enables precise identification and
alignment of the individually collected signal traces without the need for extensive
post-processing. Although a trigger signal is used for experimental efficiency, the
signals observed have several obvious amplitude-response features that would allow
for similar results through automated post-processing and alignment without the aid
of a trigger signal.
Initial experiments showed that the unintentional EM emissions exhibit some
temperature-dependency as the microcontroller warms up to its normal operating
temperature. To compensate for this effect, the device is operated for 10 minutes
to allow temperature stabilization before collecting data. After the initial warm-up
period, training and target signal traces are collected. No attempt was made to iso-
late the data collection system from background environmental noise – all collections
are performed in an office building environment with numerous co-located PCs and
wireless devices.
34

3.9.3 Feature Extraction and Classification.
Once training and target signal traces are collected, identification of important
amplitude-response features is accomplished with the correlation technique described
in Section 2.3.1. This is followed by template construction and classification described
in Sections 2.4.3.1 and 2.4.3.2. MATLAB’s [TM10] “corr” and “classify” functions
are used to implement the correlation and classification techniques.
3.10 Experimental Design
For two encryption algorithms and two template attack techniques, four experi-
mental configurations are evaluated. With only four experiments, experimental re-
duction techniques are not necessary. Also, based on low variability in previous
experiments, no more than five replications are expected to make conclusions with
90% confidence.
3.11 Methodology Summary
This chapter describes the methodology to determine the effectiveness of the Single
Keybit Template Attack. The system under test and component under test were
defined as well as the system parameters, factors, levels and workloads that affect
performance. Measures of performance were explained and justified while system
services were described. The experimental technique and design were also discussed.
Chapter 4 contains the results of these experiments that lead to data analysis and
conclusions in Chapter 5.
35
IV. Results
This chapter contains results and provides evaluations for the four measurements
of performance described in Section 3.5.
4.1 DES
SKTA and TEDA are trained with signal traces collected while the encryption
device performs DES encryptions. After the training, the number of observed target
signal traces needed before the encryption key can be extracted is displayed in Figure
18. The key guessing entropy, which is the percentage of correct keybits discovered
by each template attack, is displayed in Figure 19.
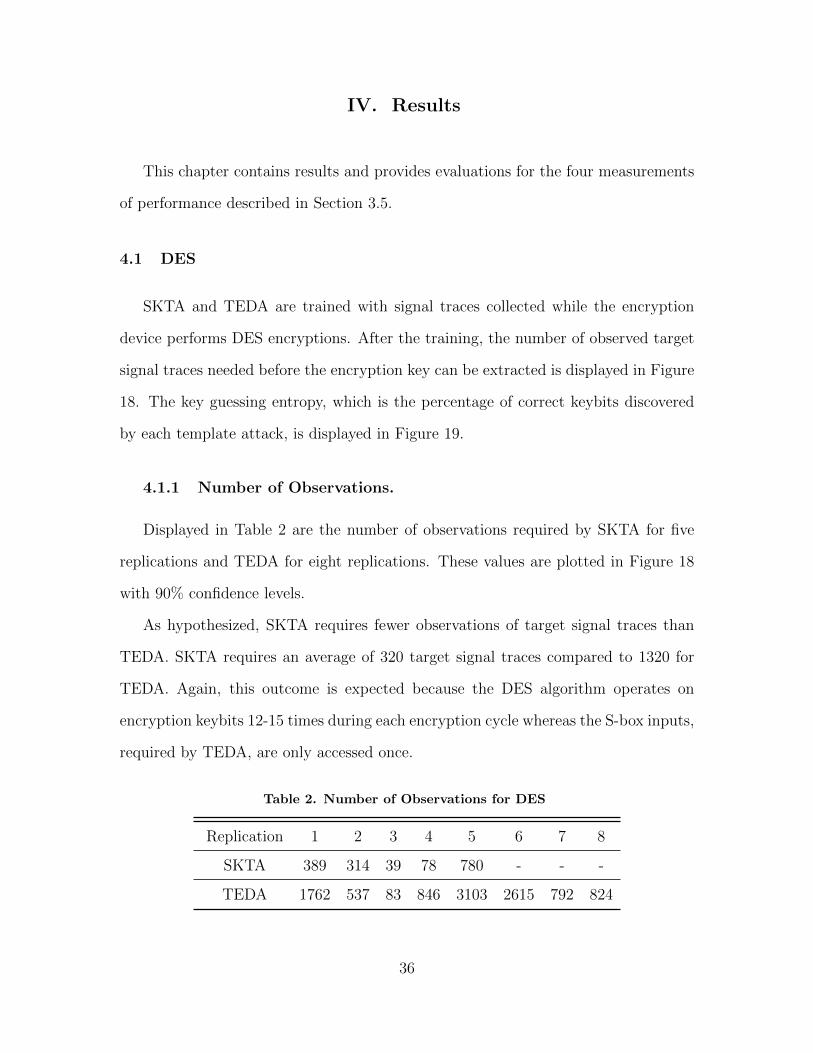
4.1.1 Number of Observations.
Displayed in Table 2 are the number of observations required by SKTA for five
replications and TEDA for eight replications. These values are plotted in Figure 18
with 90% confidence levels.
As hypothesized, SKTA requires fewer observations of target signal traces than
TEDA. SKTA requires an average of 320 target signal traces compared to 1320 for
TEDA. Again, this outcome is expected because the DES algorithm operates on
encryption keybits 12-15 times during each encryption cycle whereas the S-box inputs,
required by TEDA, are only accessed once.
Table 2. Number of Observations for DES
Replication 1 2 3 4 5 6 7 8
SKTA 389 314 39 78 780 - - -
TEDA 1762 537 83 846 3103 2615 792 824
36

Figure 18. DES: Number of target signal trace observations for SKTA and TEDA
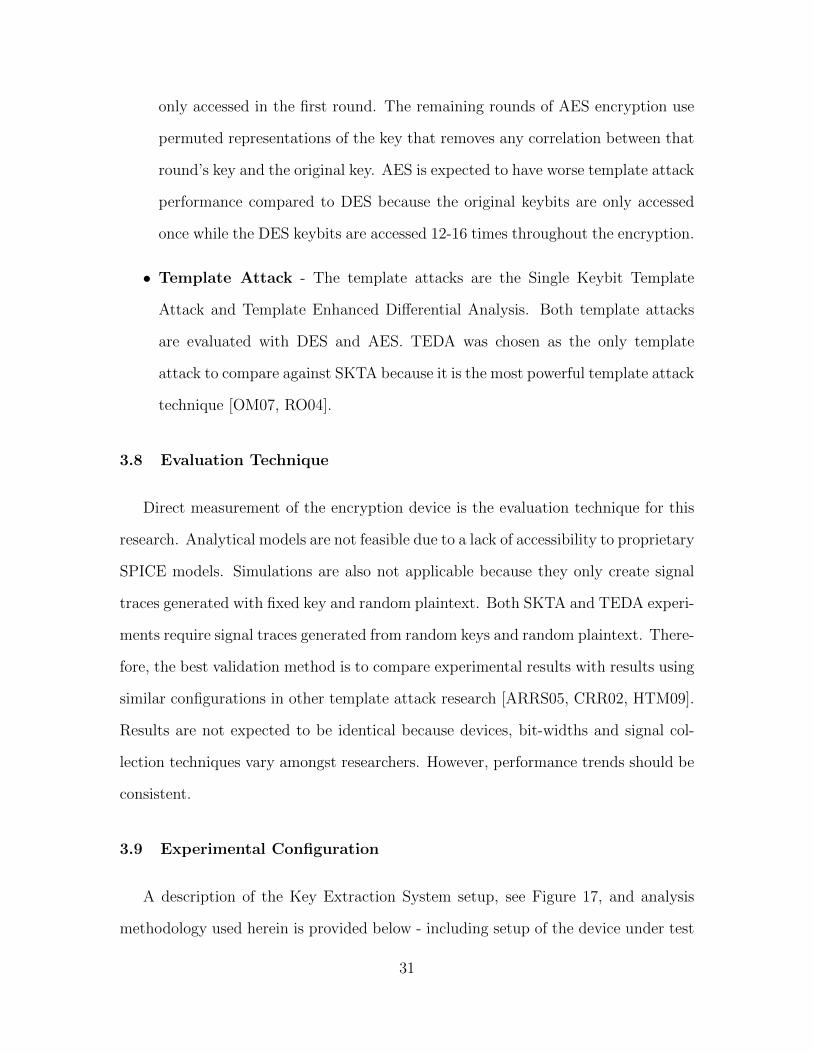
4.1.2 Key Guessing Entropy.
Displayed in Table 3 are the key guessing entropy percentages produced by SKTA
for five replications and TEDA for eight replications. As seen in Figure 19, TEDA
produced a higher key guessing entropy percentage than SKTA. TEDA discovered
100% of the keybits for each of its eight replications while SKTA averaged 89.29%
for its five replications. However, only extracting 89.29% of the DES keybits leaves a
remaining six unknown keybits which can be trivially iterated through.
Table 3. Key Guessing Entropy for DES
Replication 1 2 3 4 5 6 7 8
SKTA 91.07 85.71 80.36 98.21 91.07 - - -
TEDA 100 100 100 100 100 100 100 100
37
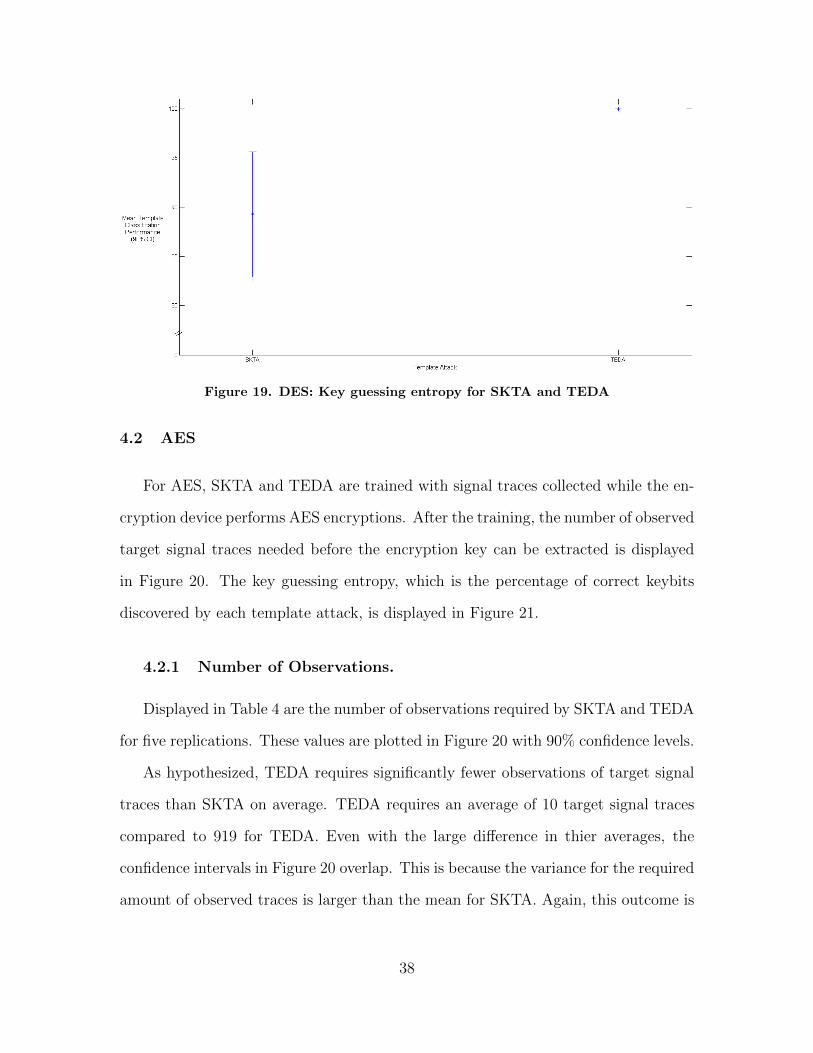
Figure 19. DES: Key guessing entropy for SKTA and TEDA
4.2 AES
For AES, SKTA and TEDA are trained with signal traces collected while the en-
cryption device performs AES encryptions. After the training, the number of observed
target signal traces needed before the encryption key can be extracted is displayed
in Figure 20. The key guessing entropy, which is the percentage of correct keybits
discovered by each template attack, is displayed in Figure 21.
4.2.1 Number of Observations.
Displayed in Table 4 are the number of observations required by SKTA and TEDA
for five replications. These values are plotted in Figure 20 with 90% confidence levels.
As hypothesized, TEDA requires significantly fewer observations of target signal
traces than SKTA on average. TEDA requires an average of 10 target signal traces
compared to 919 for TEDA. Even with the large difference in thier averages, the
confidence intervals in Figure 20 overlap. This is because the variance for the required
amount of observed traces is larger than the mean for SKTA. Again, this outcome is
38
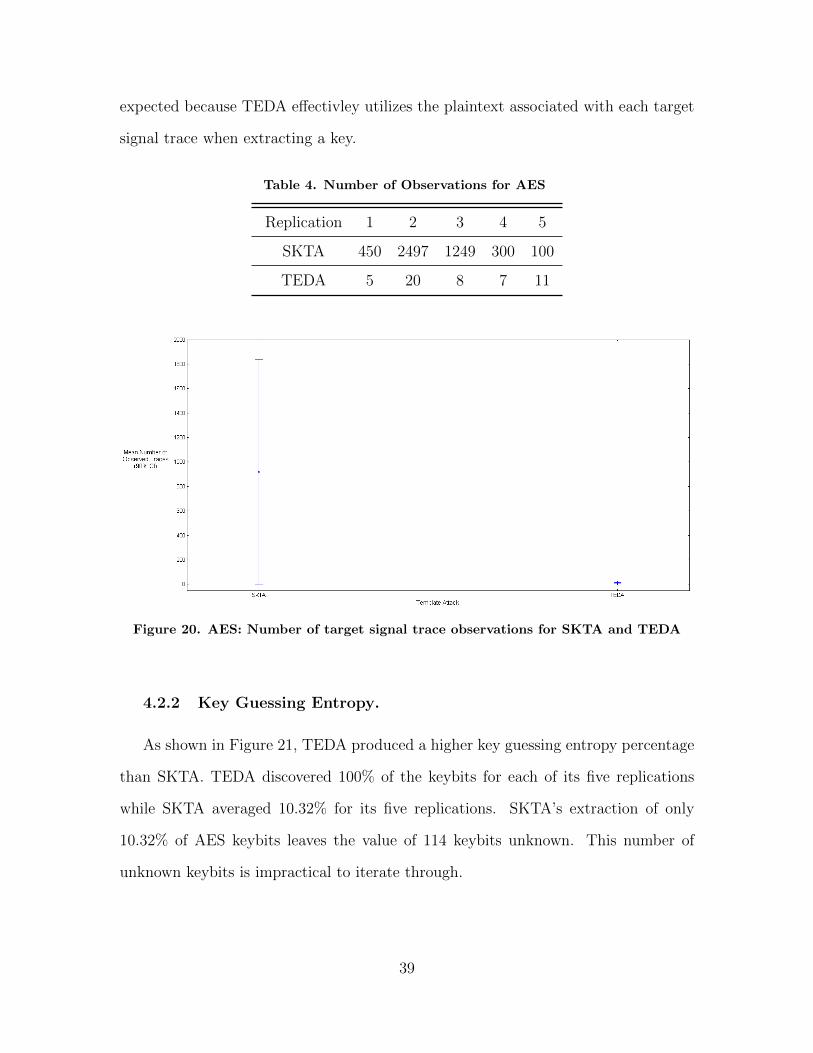
expected because TEDA effectivley utilizes the plaintext associated with each target
signal trace when extracting a key.
Table 4. Number of Observations for AES
Replication 1 2 3 4 5
SKTA 450 2497 1249 300 100
TEDA 5 20 8 7 11
Figure 20. AES: Number of target signal trace observations for SKTA and TEDA
4.2.2 Key Guessing Entropy.
As shown in Figure 21, TEDA produced a higher key guessing entropy percentage
than SKTA. TEDA discovered 100% of the keybits for each of its five replications
while SKTA averaged 10.32% for its five replications. SKTA’s extraction of only
10.32% of AES keybits leaves the value of 114 keybits unknown. This number of
unknown keybits is impractical to iterate through.
39

Table 5. Key Guessing Entropy for AES
Replication 1 2 3 4 5
SKTA 9.38 11.72 13.28 5.47 15.01
TEDA 100 100 100 100 100
Figure 21. AES: Key guessing entropy for SKTA and TEDA
4.3 Summary
This chapter contains results for the four measures of performance collected for
this research effort. Chapter 5 provides an analysis and summary of the results
presented in Chapter 4. It also gives suggestions for follow-on research.
40

V. Conclusion
This chapter provides an analysis and summary of results presented in Chapter 4.
It also discusses limitations of the findings and describes the challenges encountered
in this research. Also given are suggestions for follow-on research.
5.1 Summary of Findings
Chapter 3 introduced four investigative questions which encompass the goals of
this research. The investigative questions are reproduced below and a summary re-
sponse for each provided based on results in Chapter 4.
1. Is the Single Keybit Template Attack (SKTA) effective?
According to the results, SKTA is only effective for DES. Further research is
needed to determine why it is not effective for AES even though the keybit
correlations are higher than the DES keybit correlations. One reason may be
because bits being processed at the same time as the targeted keybit may exert
a constant power influence during AES encryptions while thier power influence
is averaged out during DES encryptions.
2. Under what configuration(s) is SKTA most effective?
This research can only claim that DES is effective under the experimental con-
figuration described in Chapter 3. This configuration included the use of a
16-bit general purpose microcontroller running a typical DES algorthim. This
configuration was used to analyze signal trace data with a bandwidth of 200
MHz. Experimental performance using other bandwidths is provided in Ap-
pendix A.A.2. Signal traces were converted to the wavelet domain for training
and classification. Further experimental results regarding performance with
respect to the signal domain are in Appendix A.A.1.
41

3. For specific measures of performance, how effective is SKTA compared to TEDA?
For DES, SKTA extracted the encryption key with 312% fewer target traces
than TEDA. With respect to key guessing entropy, both template attacks are
essentially identical. For AES, SKTA was not effective. Using SKTA, with
AES, does not increase the key quessing entopy percentage enough to make the
attack practical.
4. Under what conditions and scenarios is SKTA preferred over TEDA?
SKTA is prefered over TEDA if the target signal traces are DES-based or the
signal traces are acquired without the acompanying plaintext. Also, if the
plaintexts for the target signal traces are not available, then SKTA is the only
option. For AES, SKTA is not preferred because it can only target keybits
which is apparently not enough information to extract the key.
5.2 Limitations of Findings
All experiments are performed on a general-purpose microcontroller. However, all
trends in these results should concur with observable trends using other device types.
5.3 Suggested Follow-on Research
Why SKTA is not effective against AES is an open question. One possible reason
for its ineffectiveness may be due to the influence of other keybits that are processed
during the targeted keybit processing. Therefore, an evaluation of SKTA which re-
moves the effects of non-targeted keybits is warranted. The analysis of other device
types such as FPGAs, smartcards and cellular phones could also provide further in-
sight into SKTA effectiveness. In addition, encryption schemes which contain SCA
specific countermeasures could be evaluated. Finally, the development of an AES-
42

based encryption scheme which processes more than eight bits at a time might prove
more challenging to many SCA techniques.
5.4 Summary
This research is the first to evaluate SKTA and has determined that SKTA is more
effective than TEDA for DES-based signal traces. It also determined that for AES-
based signal traces, with accompanying plaintext or ciphertext, TEDA is the preferred
choice. Chapter 5 also provides the research limitations and several suggestions for
follow-on research.
43

Appendices
44

Appendix A. Pilot Studies
This appendix provides experimental results and evaluations for two pilot studies
regarding signal domains and data bandwidths.
A.1 Signal Domain
The first pilot study determines the SKTA’s effectiveness across three signal do-
mains: time, frequency and wavelet. This signal domain pilot study is motivated by
previous experiments that indicate enhanced template classification performance in
the wavelet domain. The rationale for choosing the signal domain for a pilot study, in-
stead of as another experimental factor, is driven by the large amount of computation
to move from one domain to another.
Transforming from the time domain to the wavelet or frequency domain reduces
the number of dimensions in each signal trace by one-half. Needless to say, reducing
the amount of data to process while maintaining similar template classification results
is a great time and computational benefit.
The measure of performance for this pilot study is the template classification
success rate and is measured as a percentage. This metric is a measure of how
accurately the template classifier can train itself to distinguish between two templates
where the targeted keybit used to build each template is either a “1” or “0”. To train
the classifier, it is provided training signal traces collected while an encryption device
performs encryptions using random keys and random plaintexts for each encryption.
After the data is collected, it is classified using a certain percentage of the traces
for training the classifier while the remaining traces are used to test the classifier.
The percentage of traces used for training and testing is determined by the k-fold
value. The k-fold value is used to partition the data into k equally sized subgroups;
k-1 subgroups train the classifier and the remaining subgroup tests the classifier.
45

This process is repeated k times and ensures all traces are used to train and test the
classifier. The accuracy of each of the k classifications is averaged and used to rate
the overall classification accuracy and is calculated using sufficient k-fold iterations
to provide a resolution of .01%.
Figures 22 and 23 display the template classification performance for the DES and
AES encryption algorithms. In both cases, the wavelet domain has a slightly higher
performance than the time domain while the frequency domain places a distant third.
If the wavelet domain’s performance was equal to that of the time domain, then the
wavelet domain would still have been chosen because it has half the dimensions as
the time domain. Based on the results from this pilot study, the wavelet domain is
chosen as the signal domain for experiments described in Chapters 3 and 4.
Figure 22. DES Template Classification Performance with Respect to Signal Domain
A.2 Data Bandwidth
The second pilot study is focused on the bandwidth of the data collected. In cur-
rent literature, bandwidth varies between 125 MHz to 1 GHz or higher. This study
46

Figure 23. AES Template Classification Performance with Respect to Signal Domain
examines bandwidths of 250 MHz, 500 MHz and 1 GHz. The rationale for studying
data bandwidth is based on previous experimental results that indicate a positive
linear relationship between bandwidth and template attack performance. This pilot
study uses SKTA on discrete bandwidths and the same measure of performance de-
scribed in the first pilot study. Results for AES and DES are displayed in Figures
24 and 25. Both figures show the same trend in performance as bandwidth increases
from 250 MHz to 1 GHz. Surprisingly, the performance increases as bandwidth de-
creases. Therefore, for DES, multiple other bandwidths are also evaluated. Figure 25,
indicates a bandwidth in the range of 200 MHz to 500 MHz should provide the best
performance with respect to the discrete bandwidths evaluated. Therefore, based on
these results and technical conveniences of the collection equipment, a bandwidth of
200 MHz is chosen for all experiments discussed in Chapters 3 and 4.
47

Figure 24. AES Template Classification Performance with Respect to Bandwidth
Figure 25. DES Template Classification Performance with Respect to Bandwidth
48

Bibliography
[ARRS05] Daks Agrawal, Josyula R. Rao, Pankaj Rohatgi, and Kai Schramm. Tem-plates as Master Keys. In CHES, volume 3659 of Lecture Notes in Com-puter Science, pages 15–29, 2005.
[Cor06] ReliaSoft Corporation. Reference for weibull 7, 2006. http:
//www.weibull.com/LifeDataWeb/lifedataweb.htm#statistical_
background.htm.
[CRR02] Suresh Chari, Josyula R. Rao, and Pankaj Rohatgi. Template Attacks.In CHES ’02: Revised Papers from the 4th International Workshop onCryptographic Hardware and Embedded Systems, pages 13–28, 2002.
[DR98] Joan Daemen and Vincent Rijmen. Aes Proposal: Rijndael, September1998.
[FXSY09] Tal Malkin Francois-Xavier Standaert and Moti Yung. A Unified Frame-work for the Analysis of Side-Channel Key Recovery Attacks. 2009.
[HTM09] Neil Hanley, Michael Tunstall, and William P. Marnane. Unknown Plain-text Template Attacks. In Workshop on Information Security ApplicationsWISA 2009, pages 148–162, December 2009.
[Kay98] S. M. Kay. Fundamentals of Statistical Signal Processing: Detection The-ory. Prentice Hall, 1998. ISBN-13: 978-0135041352.
[KJJ99] Paul C. Kocher, Joshua Jaffe, and Benjamin Jun. Differential Power Anal-ysis. In CRYPTO ’99: Proceedings of the 19th Annual International Cryp-tology Conference on Advances in Cryptology, pages 388–397, 1999.
[MOP07] Stefan Mangard, Elisabeth Oswald, and Thomas Popp. Power AnalysisAttacks: Revealing the Secrets of Smart Cards. Springer-Verlag New York,Inc., 2007.
[MTI08] Microchip Technology Inc. 16-bit 28-pin Starter Development Board UsersGuide, 2008. http://ww1.microchip.com/downloads/en/DeviceDoc/
51656B.pdf.
[MTI10] Microchip Technology Inc. Pic24f Family Reference Manual, 2010.http://www.microchip.com/wwwproducts/Devices.aspx?dDocName=
en520626.
[NIS] National Institute for Standards and Technology. http://www.nist.gov.
[NIS77] Data Encryption Standard (FIPS PUB 46-1). National Institute forStandards and Technology, January 1977. http://www.itl.nist.gov/
fipspubs/fip46-2.htm.
49

[NIS99] Triple DES (FIPS PUB 46-3). National Institute for Standards and Tech-nology, October 1999. http://csrc.nist.gov/publications/fips/
fips46-3/fips46-3.pdf.
[NIS01] Advanced Encryption Standard (FIPS PUB-197). National Institute forStandards and Technology, November 2001. http://csrc.nist.gov/
publications/fips/fips197/fips-197.pdf.
[OM07] Elisabeth Oswald and S. Mangard. Template Attacks on Masking - Resis-tance is futile. In CT-RSA, pages 243–256, August 2007.
[PEK+09] Christof Paar, Thomas Eisenbarth, Markus Kasper, Timo Kasper, andAmir Moradi. Keeloq and Side-Channel Analysis-Evolution of an Attack.In Proceedings of the 2009 Workshop on Fault Diagnosis and Tolerance inCryptography, FDTC ’09, pages 65–69. IEEE Computer Society, 2009.
[QS01] Jean-Jacques Quisquater and David Samyde. Electromagnetic Analysis(ema): Measures and Counter-Measures for Smart Cards. In E-SMART’01: Proceedings of the International Conference on Research in SmartCards, pages 200–210, 2001.
[RO04] Christian Rechberger and Elisabeth Oswald. Practical Template Attacks.In WISA, volume 3325 of Lecture Notes in Computer Science, pages 440–456, 2004.
[TK09] Sergios Theodoridis and Konstantinos Koutroumbas. Pattern Recognition.Academic Press, 2009. fourth edition.
[TM10] The MathWorks. http://www.mathworks.com/products/matlab/, 2010.Ver. R2010b.
50
Vita
Capt Eric Garcia was born in Houston, Texas. After graduating from North ShoreHigh School, he studied Electrical Engineering at the University of Texas at SanAntonio. He graduated with his Bachelor’s Degree in Electrical Engineering in Mayof 2003. Capt Garcia commissioned into the United States Air Force in September of2005 through Officer Training School (OTS) at Maxwell AFB, Montgomery, Alabama.Following OTS, he was assigned to the Air Force Flight Test Center (AFFTC) wherehe worked for the Airborne Laser and Global Hawk flight test programs. Followinghis assignment to AFFTC, he entered graduate school at the Air Force Instituteof Technology (AFIT) in June of 2009 and he is currently completing his Master’sDegree. His follow-on assignment is to the Sensors Directorate of the Air ForceResearch Laboratory (AFRL/RY) at Wright-Patterson AFB, Ohio.
51

REPORT DOCUMENTATION PAGE Form ApprovedOMB No. 0704–0188
The public reporting burden for this collection of information is estimated to average 1 hour per response, including the time for reviewing instructions, searching existing data sources, gathering andmaintaining the data needed, and completing and reviewing the collection of information. Send comments regarding this burden estimate or any other aspect of this collection of information, includingsuggestions for reducing this burden to Department of Defense, Washington Headquarters Services, Directorate for Information Operations and Reports (0704–0188), 1215 Jefferson Davis Highway,Suite 1204, Arlington, VA 22202–4302. Respondents should be aware that notwithstanding any other provision of law, no person shall be subject to any penalty for failing to comply with a collectionof information if it does not display a currently valid OMB control number. PLEASE DO NOT RETURN YOUR FORM TO THE ABOVE ADDRESS.
1. REPORT DATE (DD–MM–YYYY) 2. REPORT TYPE 3. DATES COVERED (From — To)
4. TITLE AND SUBTITLE 5a. CONTRACT NUMBER
5b. GRANT NUMBER
5c. PROGRAM ELEMENT NUMBER
5d. PROJECT NUMBER
5e. TASK NUMBER
5f. WORK UNIT NUMBER
6. AUTHOR(S)
7. PERFORMING ORGANIZATION NAME(S) AND ADDRESS(ES) 8. PERFORMING ORGANIZATION REPORTNUMBER
9. SPONSORING / MONITORING AGENCY NAME(S) AND ADDRESS(ES) 10. SPONSOR/MONITOR’S ACRONYM(S)
11. SPONSOR/MONITOR’S REPORTNUMBER(S)
12. DISTRIBUTION / AVAILABILITY STATEMENT
13. SUPPLEMENTARY NOTES
14. ABSTRACT
15. SUBJECT TERMS
16. SECURITY CLASSIFICATION OF:
a. REPORT b. ABSTRACT c. THIS PAGE
17. LIMITATION OFABSTRACT
18. NUMBEROFPAGES
19a. NAME OF RESPONSIBLE PERSON
19b. TELEPHONE NUMBER (include area code)
Standard Form 298 (Rev. 8–98)Prescribed by ANSI Std. Z39.18
24–03–2011 Master’s Thesis Jun 2009 — Mar 2011
Evaluation Of The Single Keybit Template Attack
Eric W. Garcia, Capt, USAF
Air Force Institute of TechnologyGraduate School of Engineering and Management (AFIT/EN)2950 Hobson WayWPAFB OH 45433-7765
AFIT/GE/ENG/11-11
Mr. Dave Lehr, Military Intelligence Program (MIP) Investment ManagerD/Chief - Technical Integration Division (S33P2) Rm: 2B5060ISR Portfolio Management Office (S33P), Data Acquisitions (S3)National Security Agency / Central Security Service (NSA/CSS)9800 Savage Rd., Fort Meade, MD 20755E-mail: [email protected], Comm: 240-373-2548
APPROVED FOR PUBLICE RELEASE; DISTRIBUTION UNLIMITED. This material is declared a work of the U.S.Government and is not subject to copyright protection in the United States.
Side Channel leakage is a serious threat to secure devices. Cryptographic information extraction is possible afterexamining any one of the various side channels, including electromagnetic. This work contributes a new method toachieve such a purpose. The Single Keybit Template Attack (SKTA) is introduced as a means to extract encryption keysfrom embedded processors and other integrated circuit devices performing DES encryptions by passively monitoring andexploiting unintentional RF emissions. Key extraction is accomplished by creating two templates for each bit value of thekey based on instantaneous amplitude responses as a device executes DES operations. The resultant templates are inputto a Maximum Likelihood processor for subsequent template discrimination with RF emissions captured from a targetdevice. Plaintext and ciphertext are not necessary for SKTA to function. Using 8-bit microcontroller devices andexperimentally collected side channel signals, key extraction is possible after examination of approximately 300 RFemission traces. After consideration of SKTA’s capabilities, embedded processors using DES to process sensitive datawarrants reconsideration.
Template Analysis, Template Attack, Side-Channel Analysis, Side-Channel Attack, Keybit
U U U U U 63
Dr. Rusty O. Baldwin, ENG
(937) 785-3636 x4445; [email protected]