agricultural and policy development in china agricultural and policy development in china dr. ke...
Post on 19-Dec-2015
213 views
TRANSCRIPT
Agricultural and Policy Agricultural and Policy Development in ChinaDevelopment in China
Dr. Ke BingshengDirector-General
Research Center for Rural Economy, Ministry of Agriculture
OutlineOutline
Basic data and facts on agricultural Basic data and facts on agricultural sector in Chinasector in China
Achievements since reform eraAchievements since reform era
Major current concernsMajor current concerns
New orientation of agricultural policy in New orientation of agricultural policy in ChinaChina
Basic data and facts on Basic data and facts on agricultural sector in Chinaagricultural sector in China
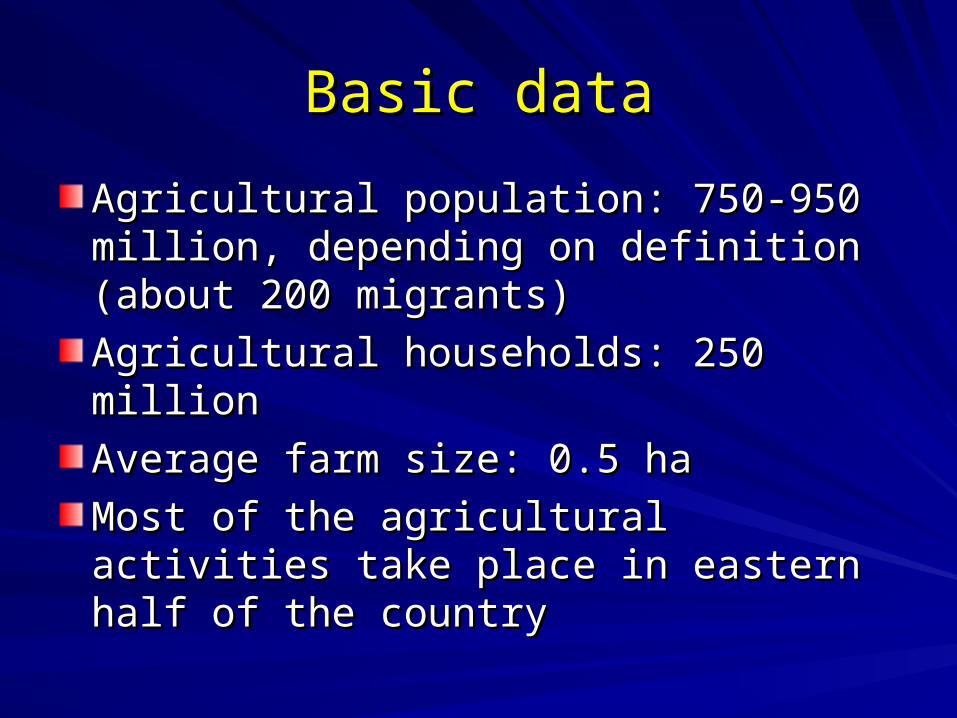
Basic dataBasic data
Agricultural population: 750-950 million, Agricultural population: 750-950 million, depending on definition (about 200 depending on definition (about 200 migrants)migrants)
Agricultural households: 250 millionAgricultural households: 250 million
Average farm size: 0.5 haAverage farm size: 0.5 ha
Most of the agricultural activities take Most of the agricultural activities take place in eastern half of the countryplace in eastern half of the country
Population distribution in ChinaPopulation distribution in China
Grain Production in ChinaGrain Production in China
Meat production in ChinaMeat production in China
Cotton Production in ChinaCotton Production in China

Sugar crop production in ChinaSugar crop production in China
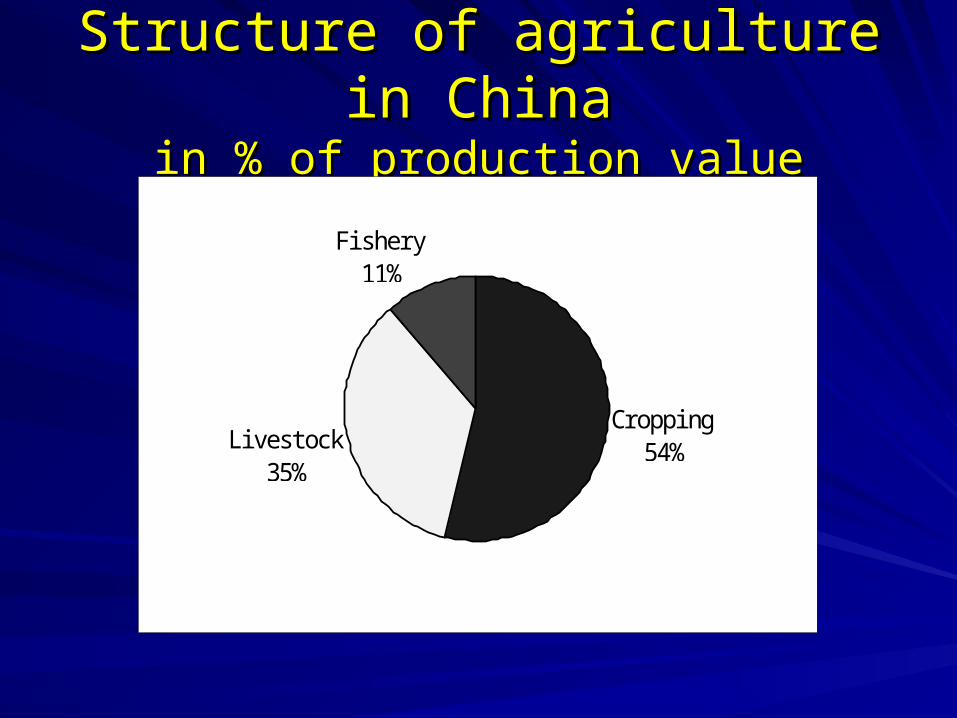
Structure of agriculture in ChinaStructure of agriculture in Chinain % of production valuein % of production value
Croppi ng54%Li vestock
35%
Fi shery11%
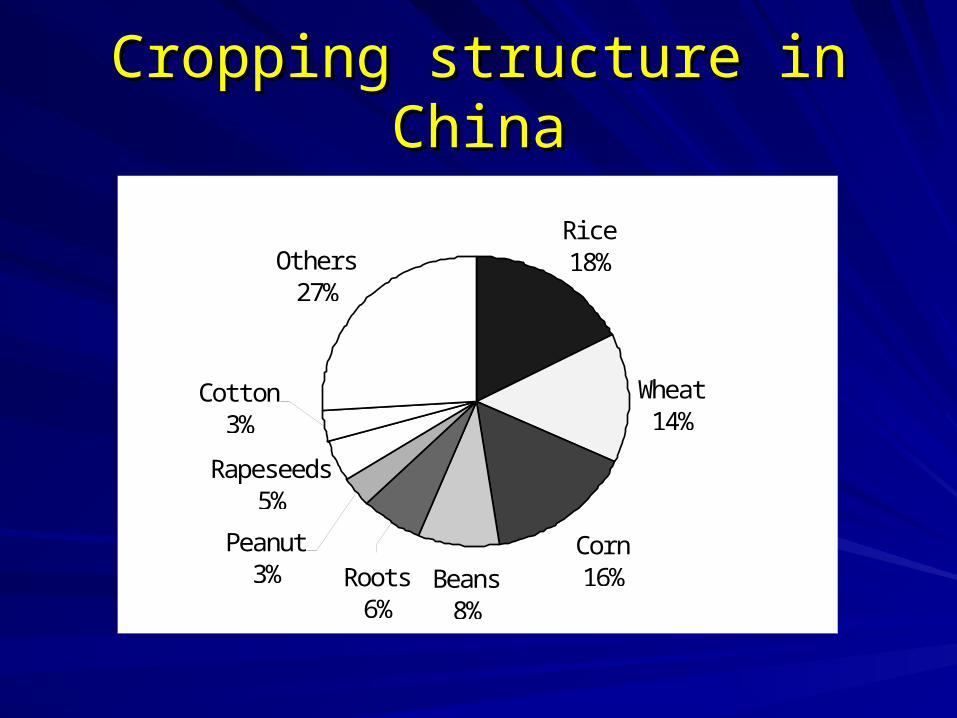
Cropping structure in ChinaCropping structure in China
Ri ce18%
Wheat14%
Corn16%
Rapeseeds5%
Others27%
Peanut3%
Cotton3%
Roots6%
Beans8%
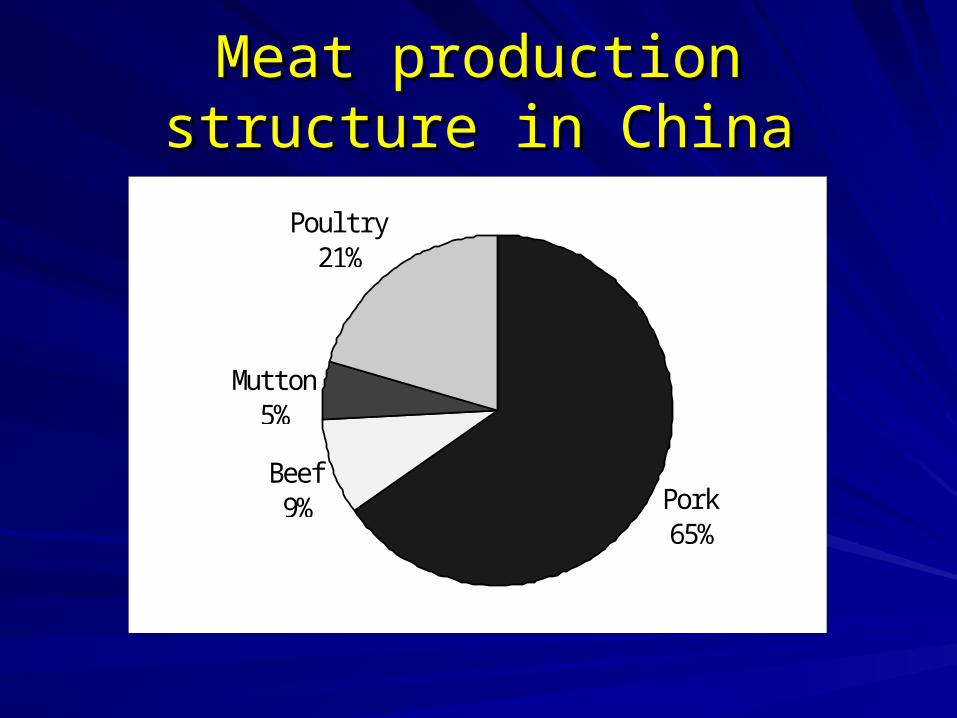
Meat production structure in Meat production structure in ChinaChina
Pork65%
Beef9%
Mutton5%
Poul try21%
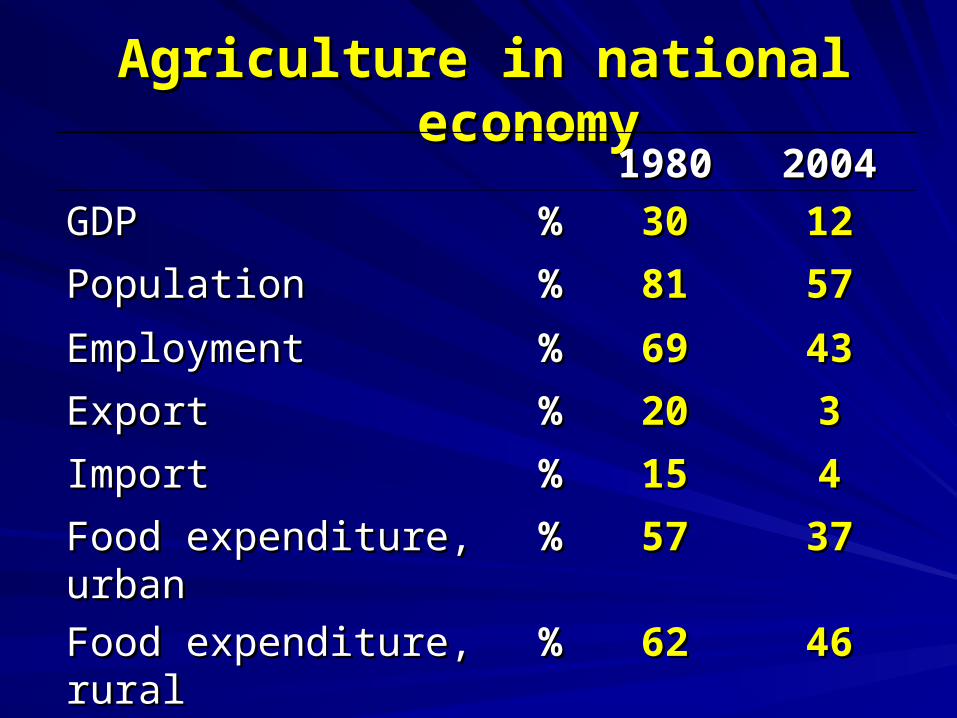
Agriculture in national economyAgriculture in national economy 19801980 20042004
GDPGDP %% 3030 1212
Population Population %% 8181 5757
EmploymentEmployment %% 6969 4343
ExportExport %% 2020 33
ImportImport %% 1515 44
Food expenditure, urbanFood expenditure, urban %% 5757 3737
Food expenditure, ruralFood expenditure, rural %% 6262 4646

Achievements since reform Achievements since reform eraera

Development 1978-2005Development 1978-2005
Grain production growth: 1.4% on average per Grain production growth: 1.4% on average per year year Meat production: 8.56-77.43 million tons, Meat production: 8.56-77.43 million tons, increased by 8 timesincreased by 8 timesFishery production: 4.65-51.06 million tons, Fishery production: 4.65-51.06 million tons, increased by 10 timesincreased by 10 timesFarmers’ income: 134-3255 RBM, 7% annually Farmers’ income: 134-3255 RBM, 7% annually in real termin real term– Color TV sets: 84%– Mobile phone: 50%
Farmers’ rights: free decision in agricultural Farmers’ rights: free decision in agricultural production, marketing and non-farm and non-production, marketing and non-farm and non-rural job seeking rural job seeking

Major current concernsMajor current concerns
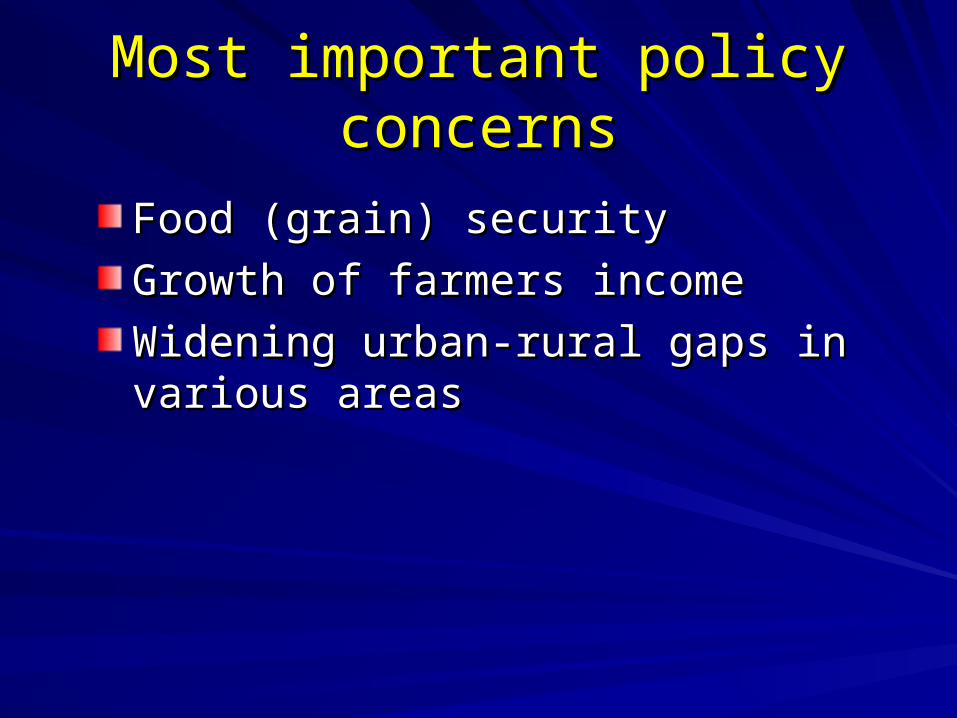
Most important policy concernsMost important policy concerns
Food (grain) securityFood (grain) security
Growth of farmers incomeGrowth of farmers income
Widening urban-rural gaps in various Widening urban-rural gaps in various areasareas
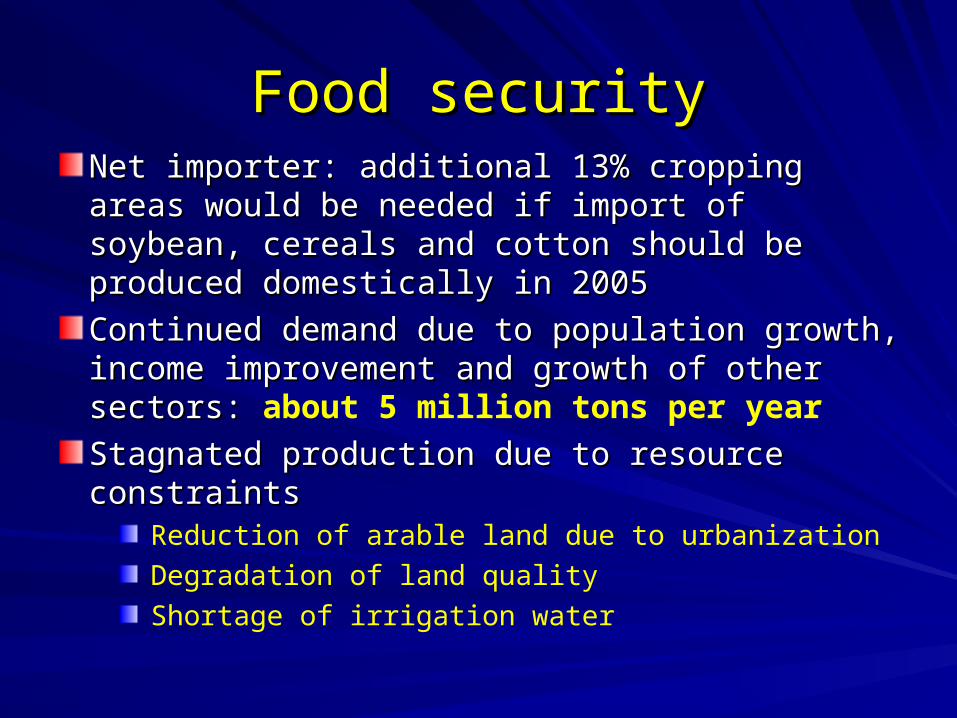
Food securityFood securityNet importer: additional 13% cropping areas Net importer: additional 13% cropping areas would be needed if import of soybean, cereals would be needed if import of soybean, cereals and cotton should be produced domestically in and cotton should be produced domestically in 2005 2005
Continued demand due to population growth, Continued demand due to population growth, income improvement and growth of other income improvement and growth of other sectors: sectors: about 5 million tons per year
Stagnated production due to resource constraintsStagnated production due to resource constraintsReduction of arable land due to urbanization
Degradation of land quality
Shortage of irrigation water
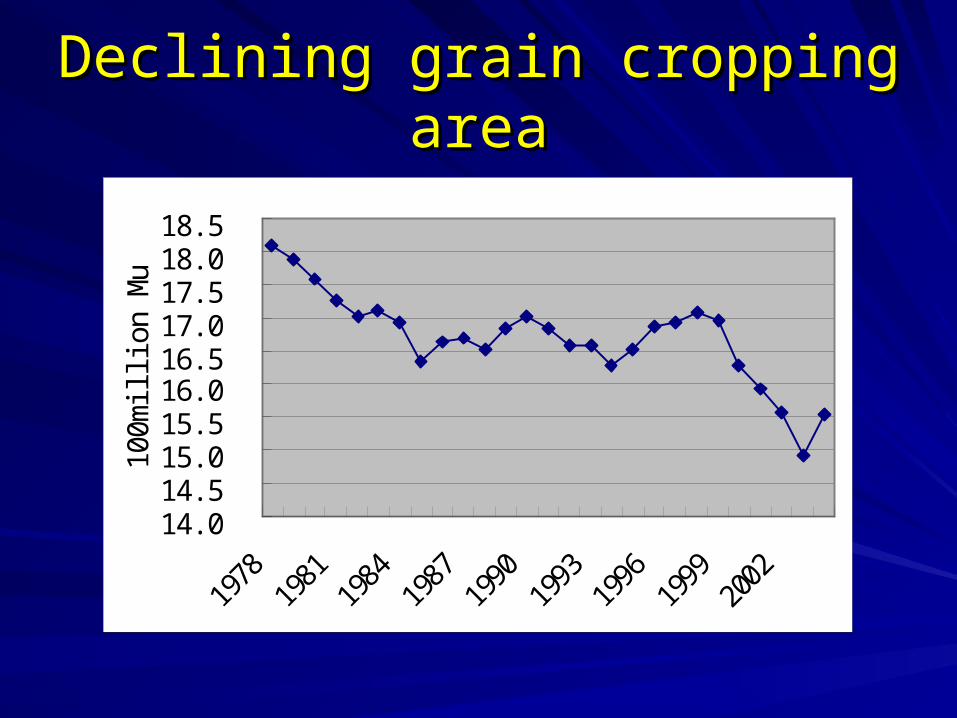
Declining grain cropping areaDeclining grain cropping area
14. 014. 515. 015. 516. 016. 517. 017. 518. 018. 5
1978
1981
1984
1987
1990
1993
1996
1999
2002
100m
illi
on M
u
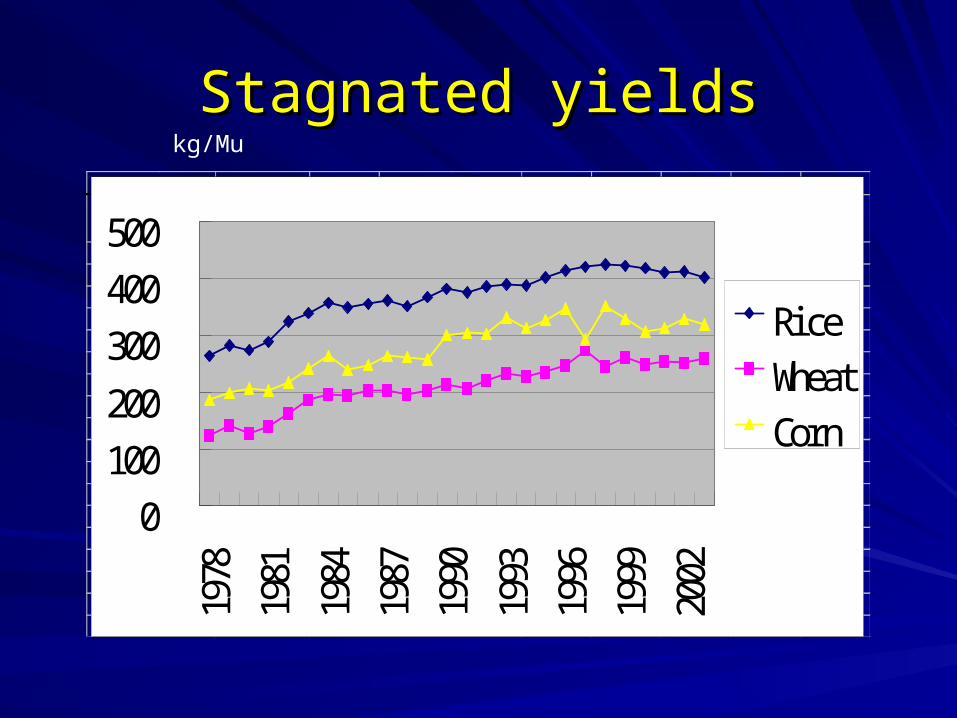
Stagnated yieldsStagnated yieldskg/Mu
: /单位 吨 公顷 : /单位 吨 公顷
粮食 粮食3 Rice Wheat Corn 油料 棉花 甘蔗
1978 1978 168 197 1978 265 123 187 56 30 25641979 1979 186 213 1979 283 142 199 61 33 28011980 1980 182 207 1980 275 128 208 65 37 31741981 1981 188 216 1981 288 140 203 74 38 35901982 1982 208 243 1982 326 163 218 84 41 37651983 1983 226 262 1983 340 187 242 84 51 31741984 1984 241 278 1984 358 198 264 91 60 36191985 1985 232 269 1985 350 196 240 89 54 35611986 1986 235 274 1986 356 203 247 86 55 35241987 1987 242 281 1987 361 203 263 91 58 36761988 1988 239 275 1988 352 198 262 83 50 35401989 1989 242 281 1989 367 203 259 82 49 33921990 1990 262 301 1990 382 213 302 99 54 38071991 1991 258 297 1991 376 207 305 95 58 38891992 1992 267 305 1992 387 222 302 95 44 39061993 1993 275 317 1993 390 235 331 108 50 39331994 1994 273 311 1994 389 228 313 110 52 38431995 1995 283 323 1995 402 236 328 115 59 3877
0100200
30040050019
78
1981
1984
1987
1990
1993
1996
1999
2002
Ri ceWheatCorn

Declined grain productionDeclined grain production 100million tons
2. 02. 53. 03. 54. 04. 55. 05. 5
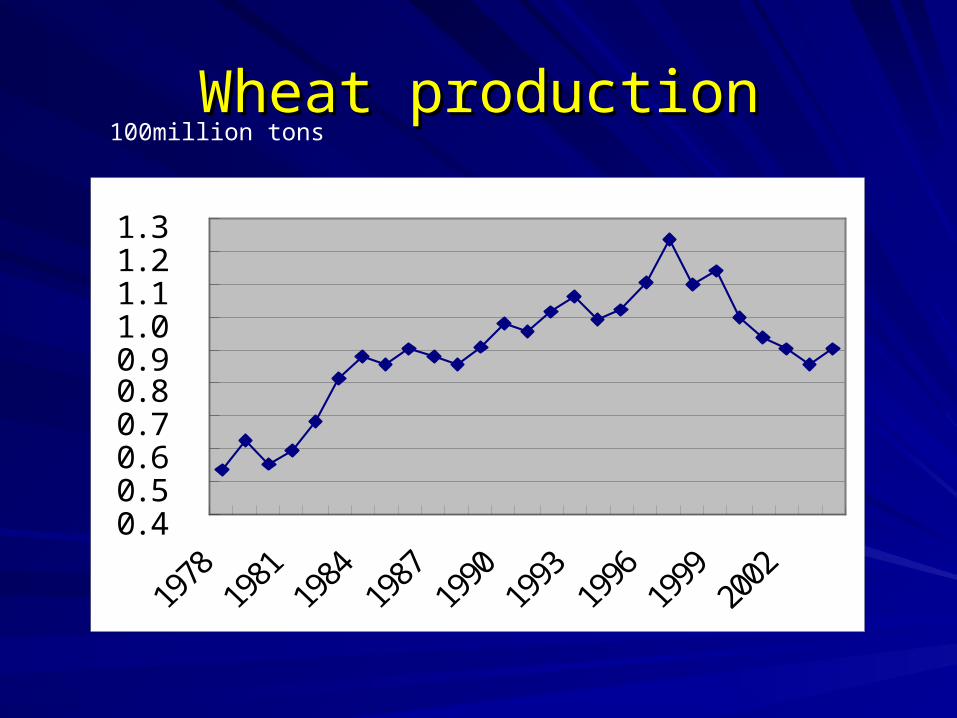
Wheat productionWheat production100million tons
0. 40. 50. 60. 70. 80. 91. 01. 11. 21. 3
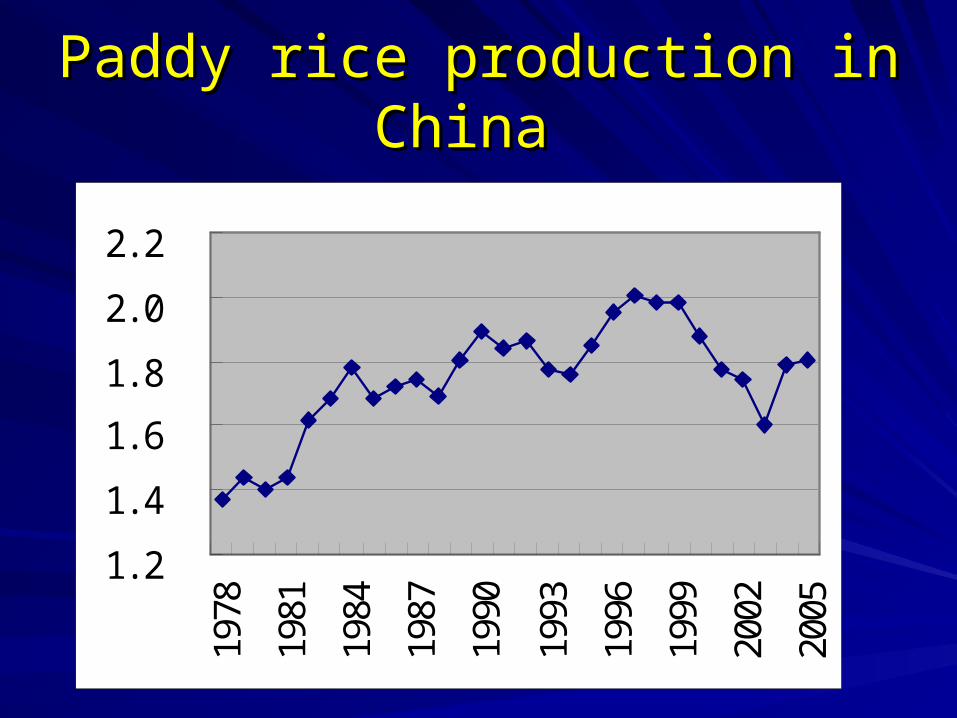
Paddy rice production in ChinaPaddy rice production in China
1. 2
1. 4
1. 6
1. 8
2. 0
2. 219
78
1981
1984
1987
1990
1993
1996
1999
2002
2005
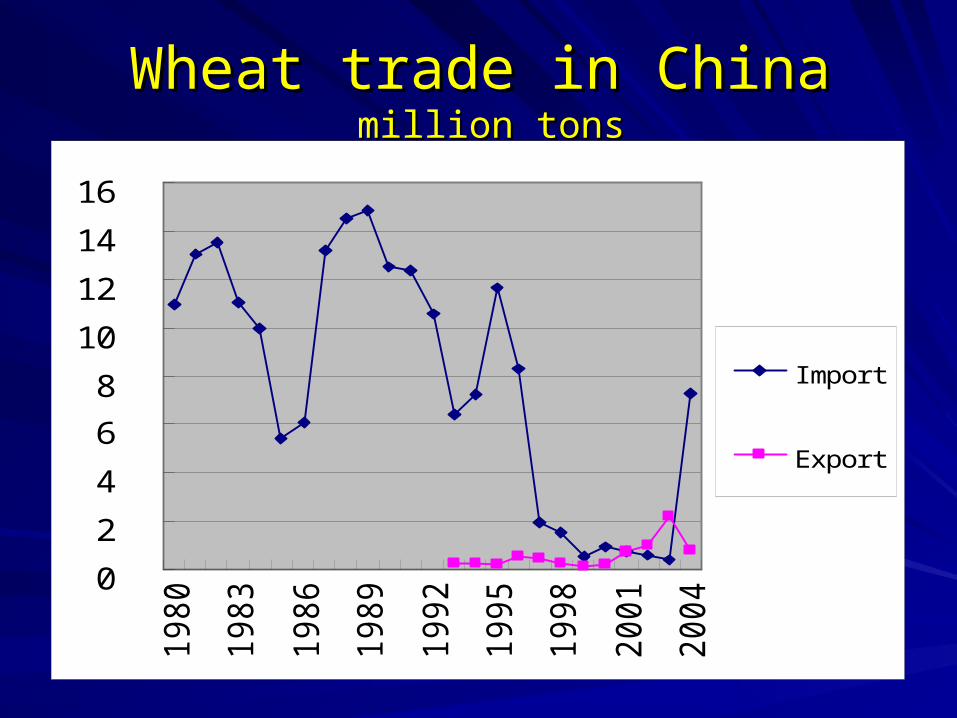
Wheat trade in ChinaWheat trade in China million tons million tons
0
2
4
6
8
10
12
14
161980
1983
1986
1989
1992
1995
1998
2001
2004
I mpor t
Expor t
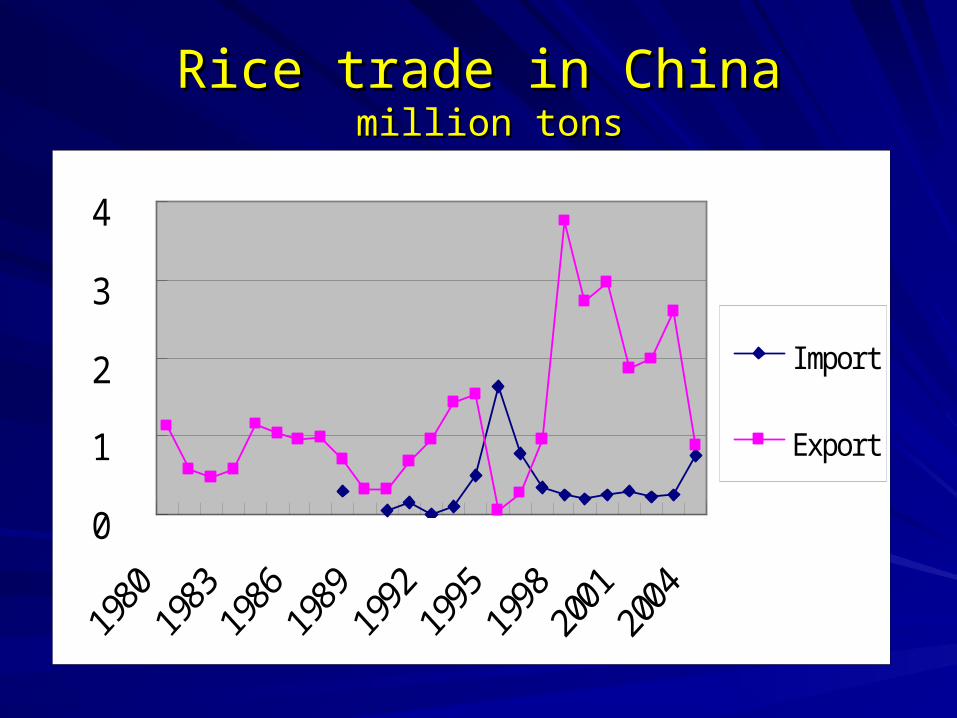
Rice trade in ChinaRice trade in China million tons million tons
0
1
2
3
4
I mport
Export
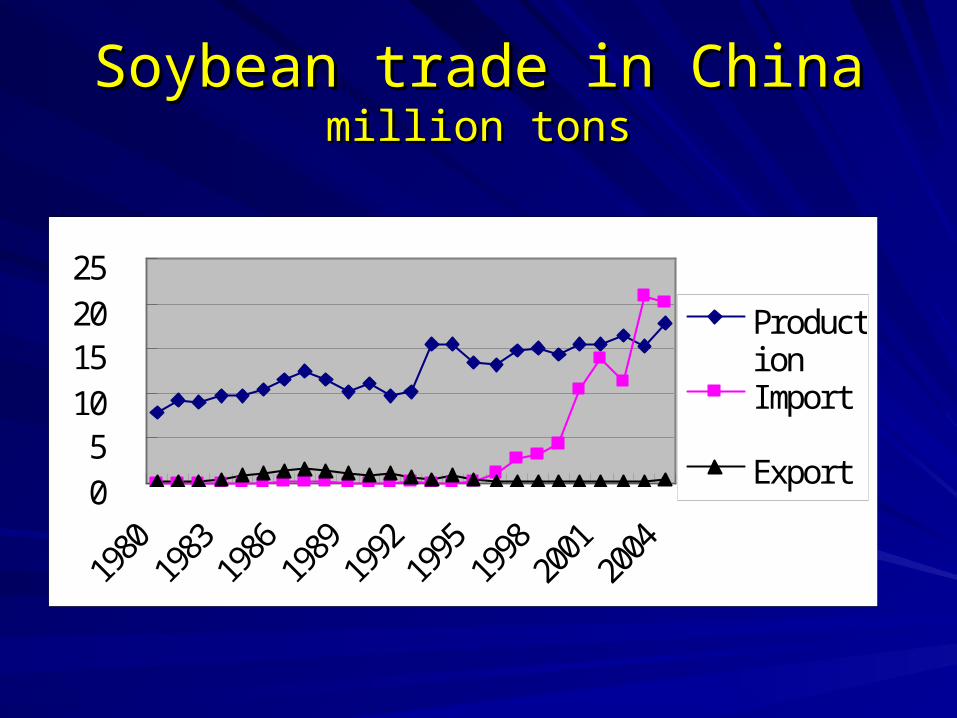
Soybean trade in ChinaSoybean trade in Chinamillion tonsmillion tons
05
10152025
1980
1983
1986
1989
1992
1995
1998
2001
2004
Producti onI mport
Export
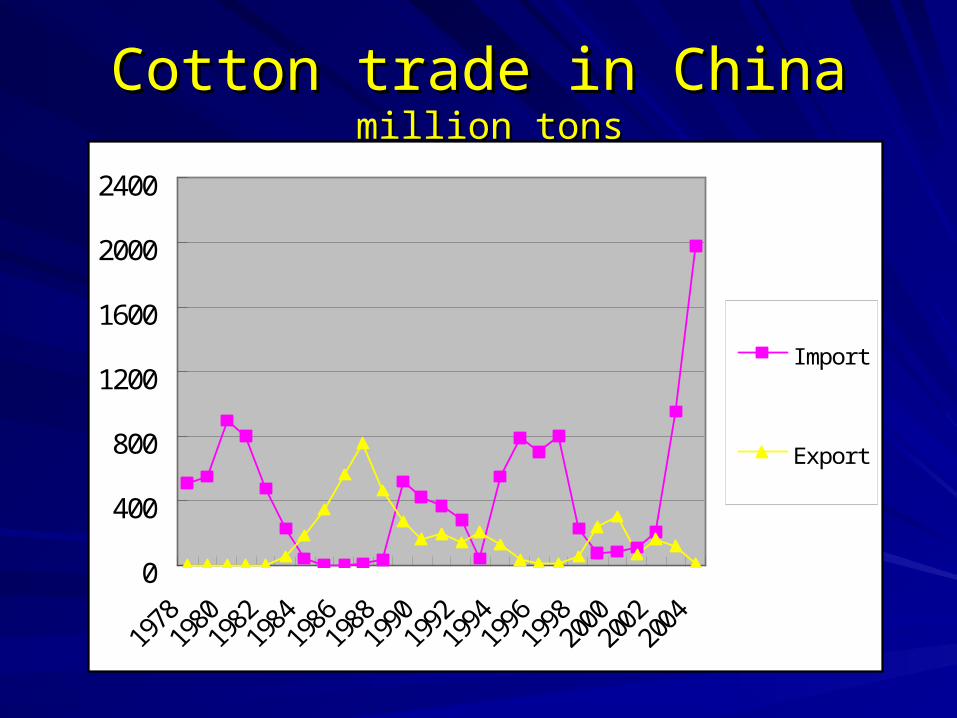
Cotton trade in ChinaCotton trade in China million tons million tons
0
400
800
1200
1600
2000
2400
I mport
Export
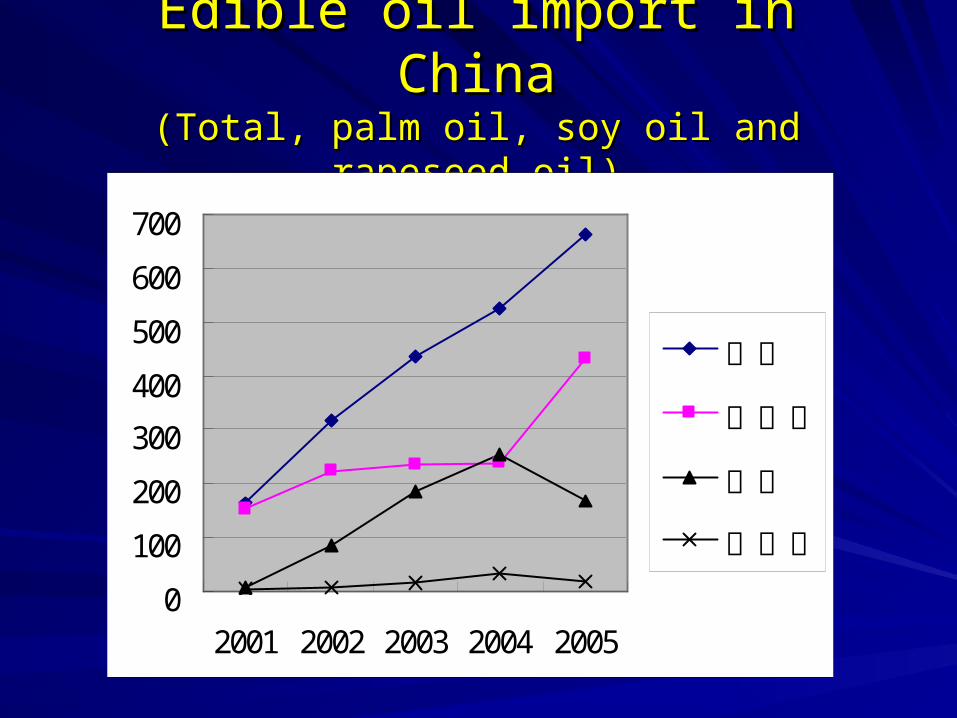
Edible oil import in ChinaEdible oil import in China(Total, palm oil, soy oil and rapeseed oil)(Total, palm oil, soy oil and rapeseed oil)
0
100
200
300
400
500
600
700
2001 2002 2003 2004 2005
总计
棕榈油
豆油
菜籽油
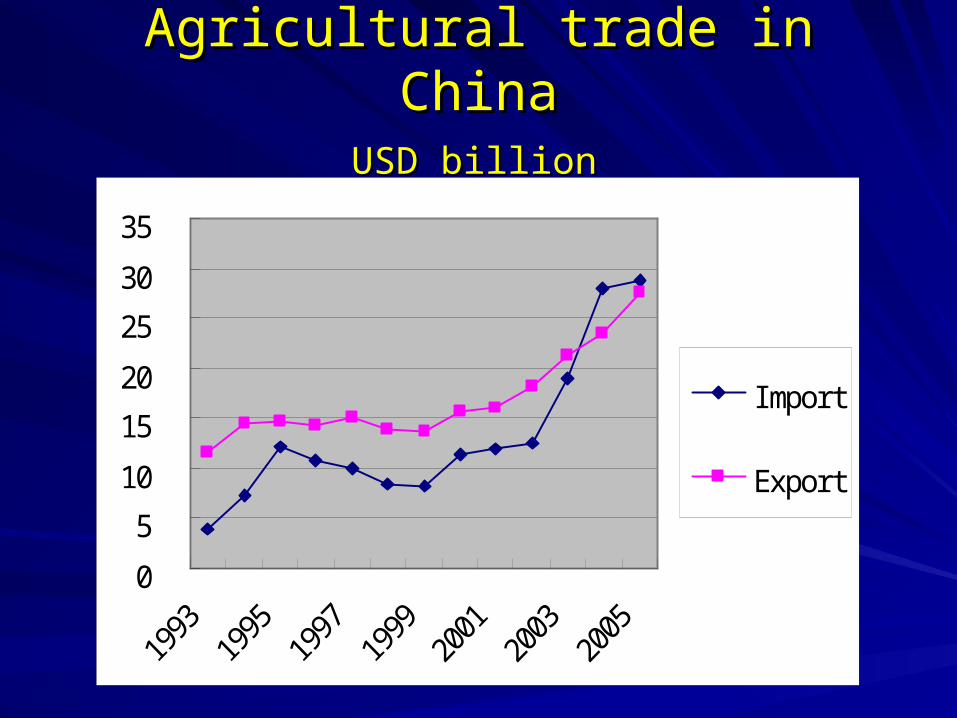
Agricultural trade in ChinaAgricultural trade in China USD billion USD billion
0
5
10
15
20
25
30
35
I mport
Export
Income issuesIncome issues
Widening urban-rural gapWidening urban-rural gap
Large regional disparityLarge regional disparity
Poverty and low income populationPoverty and low income population
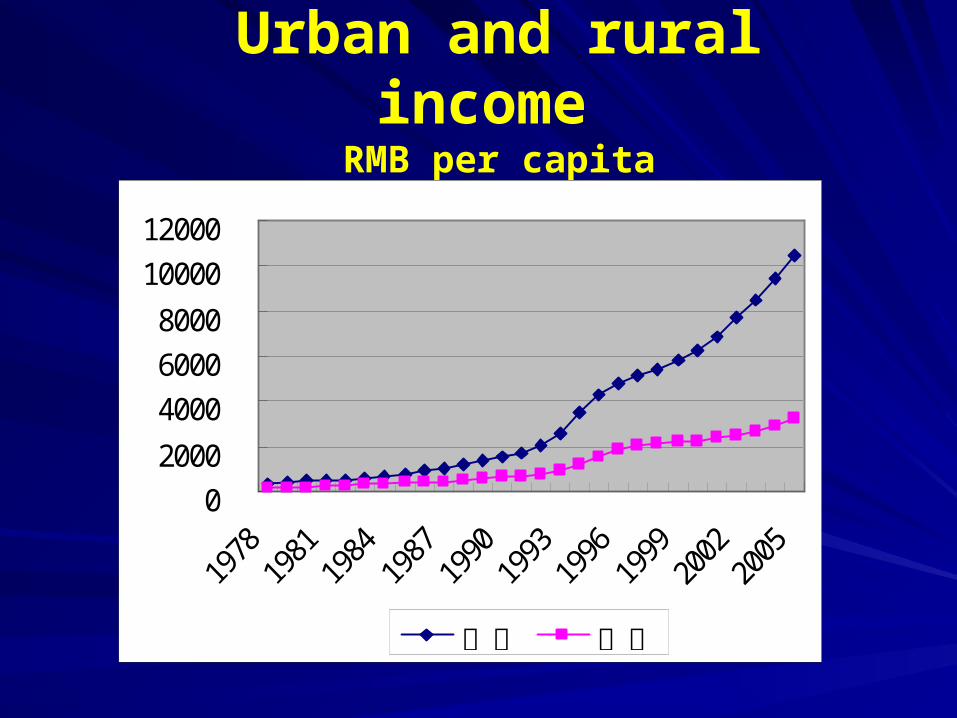
Urban and rural income RMB per capita
02000
400060008000
1000012000
城镇 农村
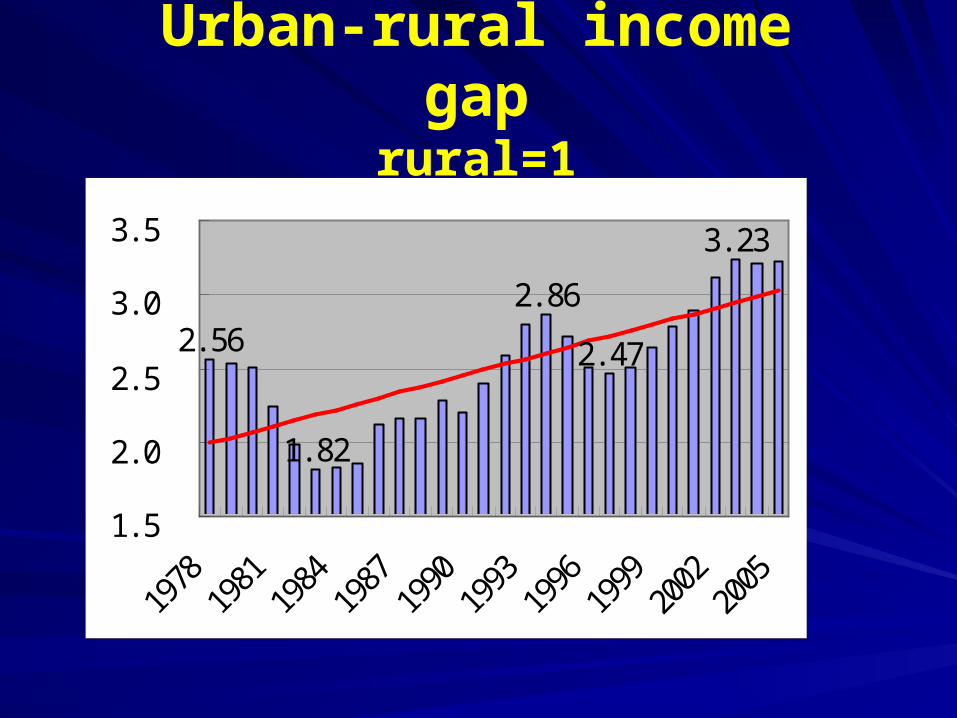
Urban-rural income gaprural=1
2. 562. 86
2. 47
3. 23
1. 82
1. 5
2. 0
2. 5
3. 0
3. 5
1978
1981
1984
1987
1990
1993
1996
1999
2002
2005
Regional Income DisparityRegional Income Disparity
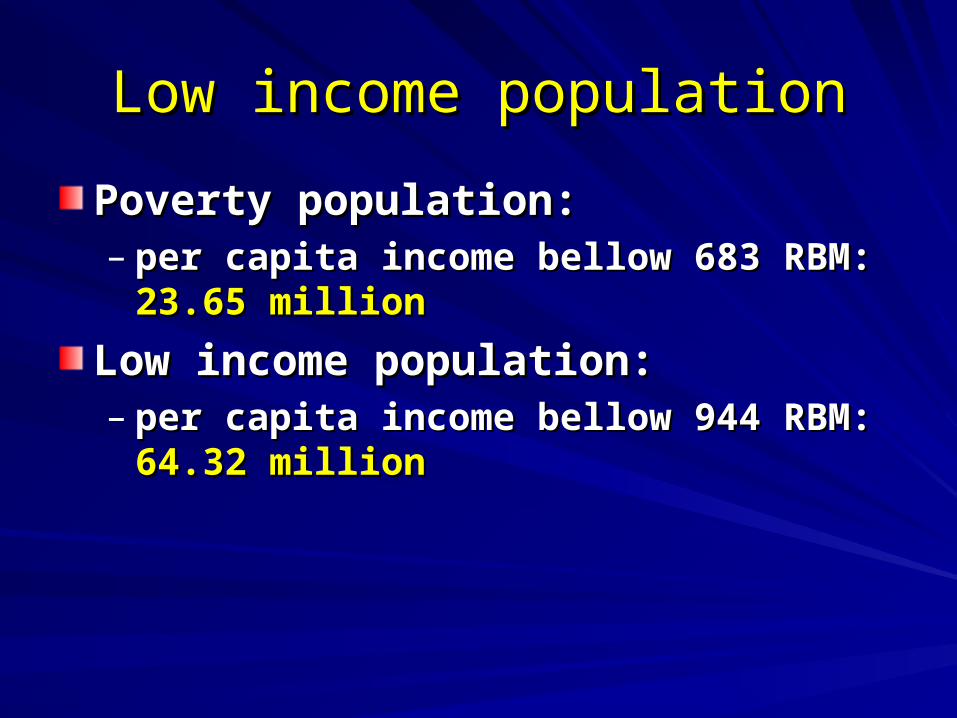
Low income populationLow income population
Poverty population: Poverty population: – per capita income bellow 683 RBM: per capita income bellow 683 RBM: 23.65 23.65
millionmillion
Low income population: Low income population: – per capita income bellow 944 RBM: per capita income bellow 944 RBM: 64.32 64.32
millionmillion
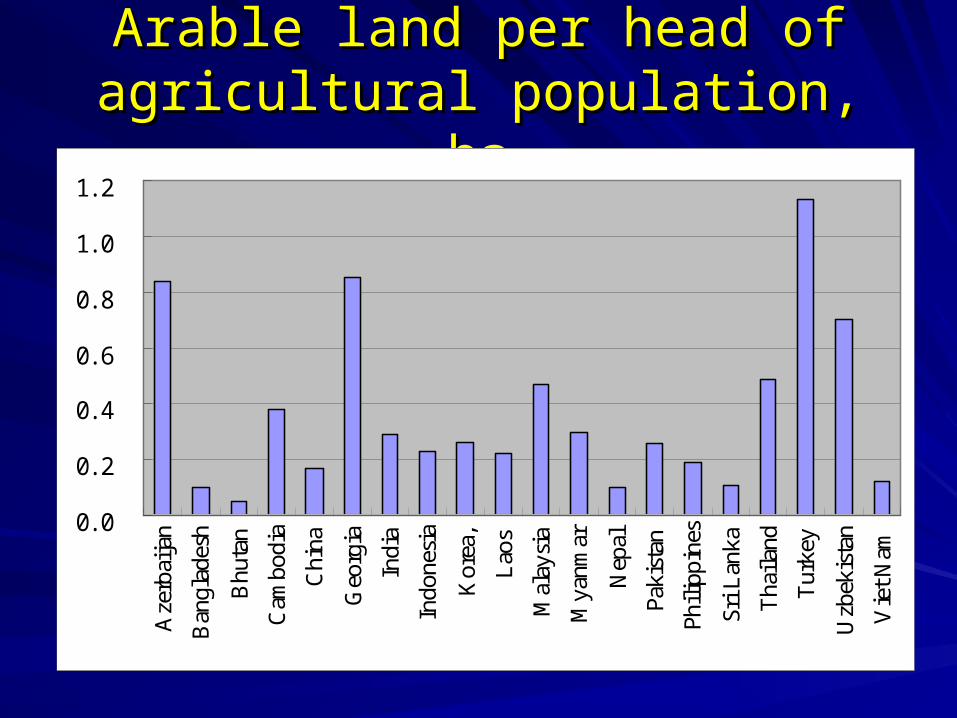
Arable land per head of agricultural Arable land per head of agricultural population, hapopulation, ha
0. 0
0. 2
0. 4
0. 6
0. 8
1. 0
1. 2 A
zerb
aija
n
Ban
glad
esh
Bhu
tan
Cam
bodi
a
Chi
na
Geo
rgia
Ind
ia
Ind
ones
ia
Kor
ea,
Lao
s
Mal
aysi
a
Mya
nmar
Nep
al
Pak
ista
n
Phi
lippi
nes
Sri
Lan
ka
Tha
iland
Tur
key
Uzb
ekis
tan
Vie
t Nam

Arable land per head of agricultural Arable land per head of agricultural population, hapopulation, ha
0. 0
10. 0
20. 0
30. 0
40. 0
50. 0
60. 0
Arge
ntin
a
Br
azil USA
Ca
nada
Au
stra
lia
Hu
ngar
y
S
Afri
ca

Development of agriculture’s share Development of agriculture’s share in Chinain China
0
10
20
30
40
50
60
70
80
GDP Empl oyment
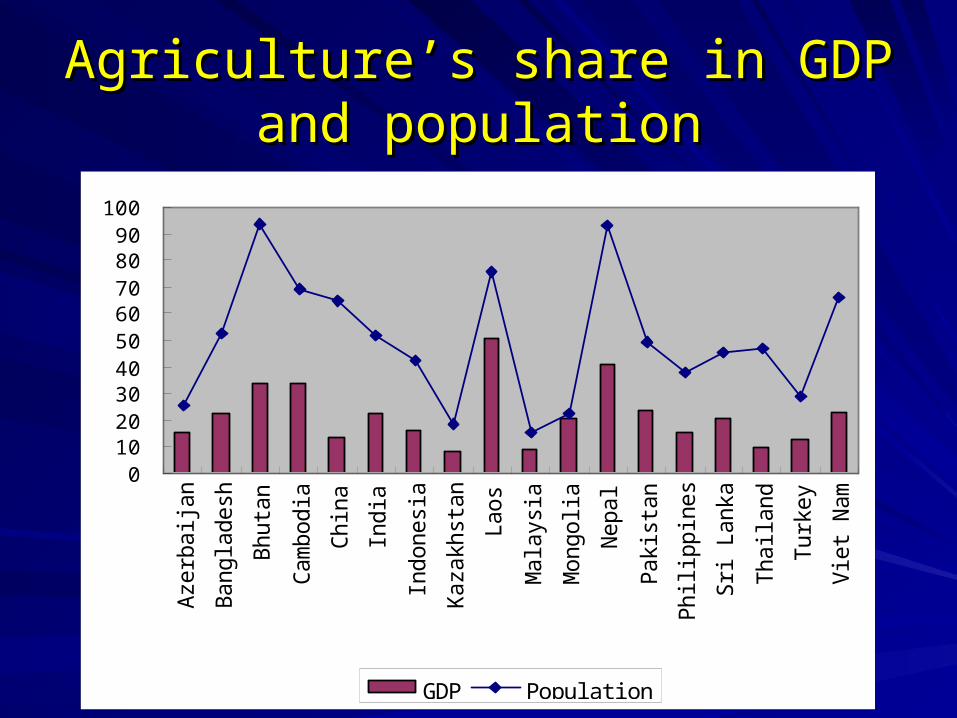
Agriculture’s share in GDP and Agriculture’s share in GDP and populationpopulation
0102030405060708090
100
Azer
baij
an
Ba
ngla
desh
Bh
utan
Ca
mbod
ia
Ch
ina
In
dia
In
done
sia
Ka
zakh
stan
La
os
Ma
lays
ia
Mo
ngol
ia
Ne
pal
Pa
kist
an
Ph
ilip
pine
s
Sr
i La
nka
Th
aila
nd
Tu
rkey
Vi
et N
am
GDP Popul at i on
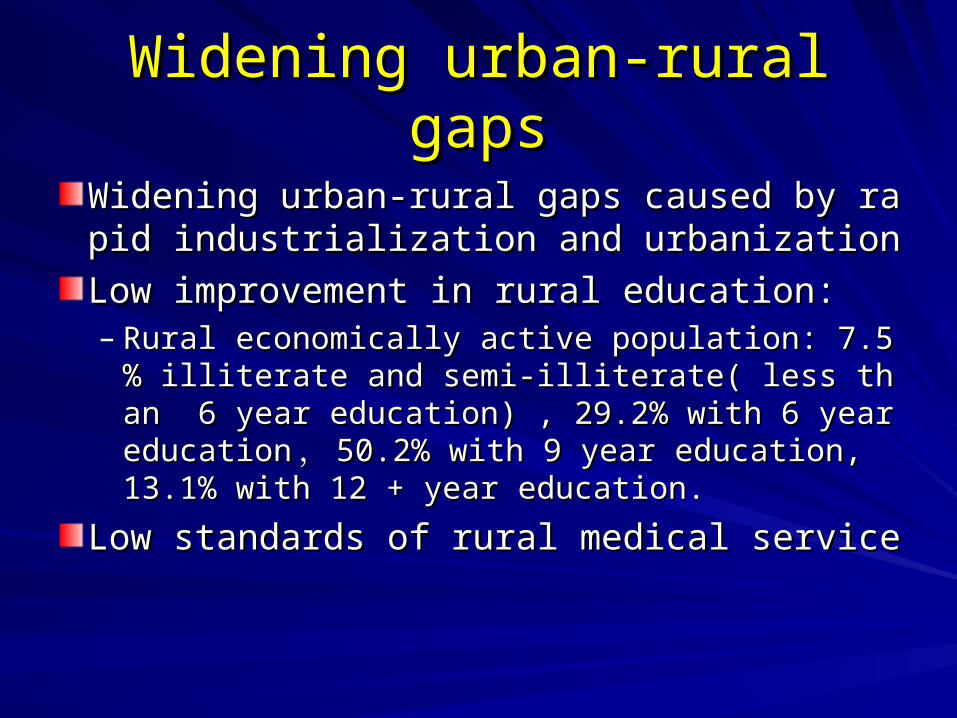
Widening urban-rural gapsWidening urban-rural gaps
Widening urban-rural gaps caused by rapiWidening urban-rural gaps caused by rapid industrialization and urbanizationd industrialization and urbanization
Low improvement in rural education:Low improvement in rural education:– Rural economically active population: 7.5% illitRural economically active population: 7.5% illit
erate and semi-illiterate( less than 6 year eduerate and semi-illiterate( less than 6 year education) , 29.2% with 6 year educationcation) , 29.2% with 6 year education ,, 50.250.2% with 9 year education, 13.1% with 12 + yea% with 9 year education, 13.1% with 12 + year education.r education.
Low standards of rural medical serviceLow standards of rural medical service
New orientation of New orientation of agricultural policy in Chinaagricultural policy in China
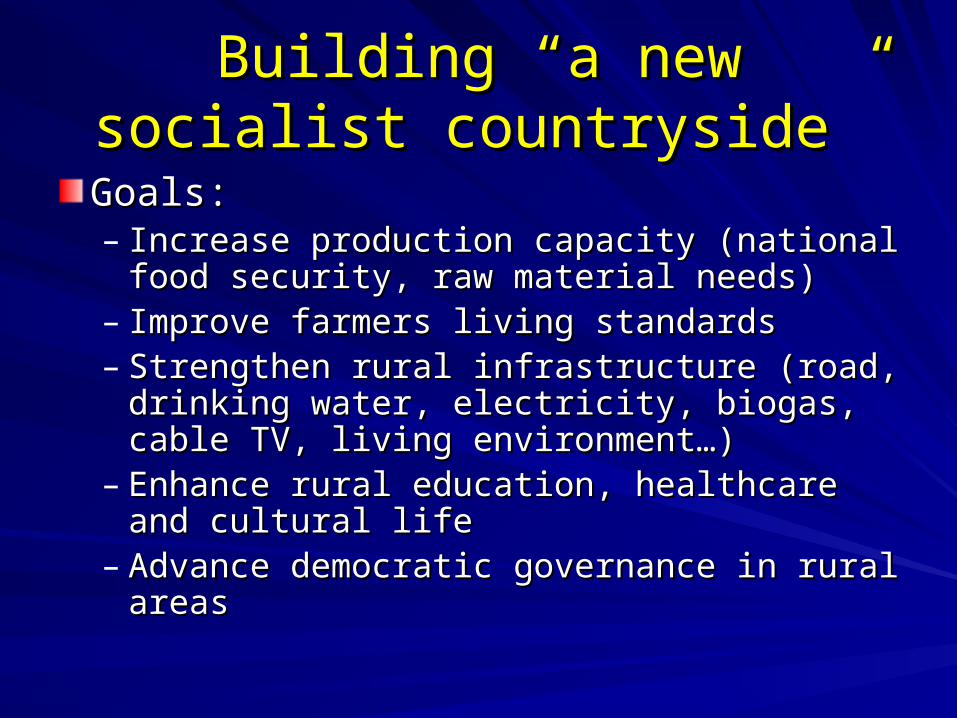
Building “a new socialist Building “a new socialist countryside”countryside”
Goals:Goals:– Increase production capacity (national food Increase production capacity (national food
security, raw material needs)security, raw material needs)– Improve farmers living standardsImprove farmers living standards– Strengthen rural infrastructure (road, drinking Strengthen rural infrastructure (road, drinking
water, electricity, biogas, cable TV, living water, electricity, biogas, cable TV, living environment…)environment…)
– Enhance rural education, healthcare and Enhance rural education, healthcare and cultural lifecultural life
– Advance democratic governance in rural areas Advance democratic governance in rural areas

New measuresNew measures
Deepening comprehensive reformsDeepening comprehensive reforms
Shift the focus of governmental Shift the focus of governmental expenditure to rural areas: a higher share, expenditure to rural areas: a higher share, especially in the budget of central especially in the budget of central governmentgovernment
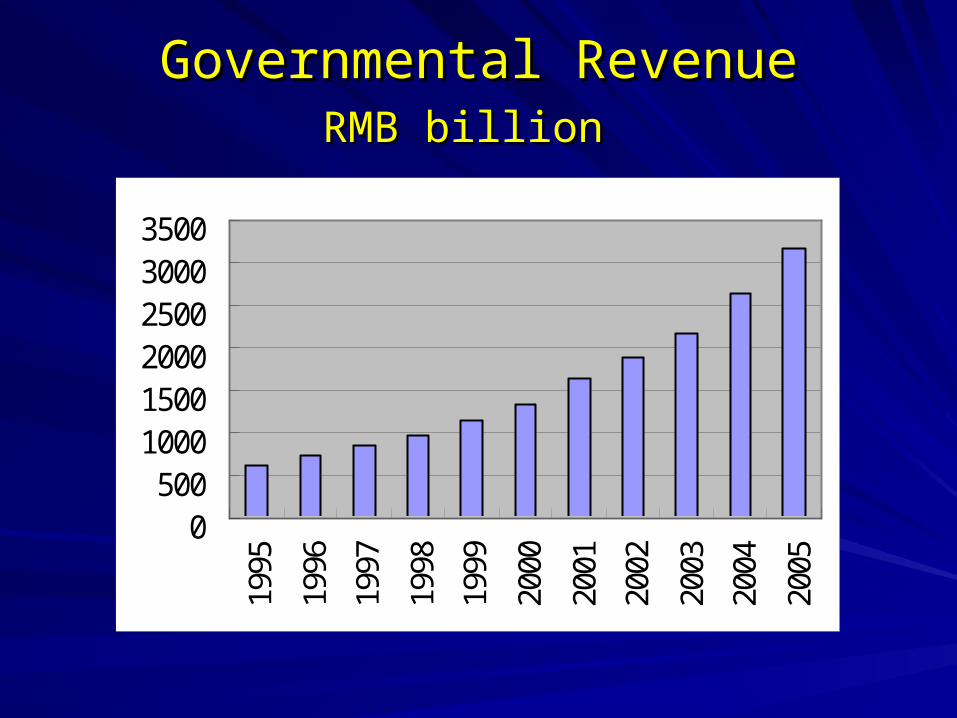
Governmental RevenueGovernmental RevenueRMB billionRMB billion
0500
100015002000250030003500
1995
1996
1997
1998
1999
2000
2001
2002
2003
2004
2005

Governmental expenditure on Governmental expenditure on agriculture and rural areasagriculture and rural areas
050
100150200250300350
1995
1996
1997
1998
1999
2000
2001
2002
2003
2004
2005

Agricultural support in comparisonAgricultural support in comparison
EUEU USAUSA JapaJapan n
S. S. KoreKore
aaBrazilBrazil ChinChin
aa
Per capita Per capita GDPGDP USDUSD 26702670
0036203620
0033703370
0012701270
0028002800 17001700
Agricultural Agricultural supportsupport
USD USD billiobillio
nn
1039.1039.11
382.1382.1 282.282.55
76.676.6 22.822.8 180180
in % of in % of agricultural agricultural outputoutput
%% 34.134.1 19.319.3 37.437.4 22.222.2 5.15.1 6.46.4
Support per Support per capita of capita of Agricultural Agricultural populationpopulation
USD/USD/headhead 65256525 61816181 59205920 17701770 1818 2424
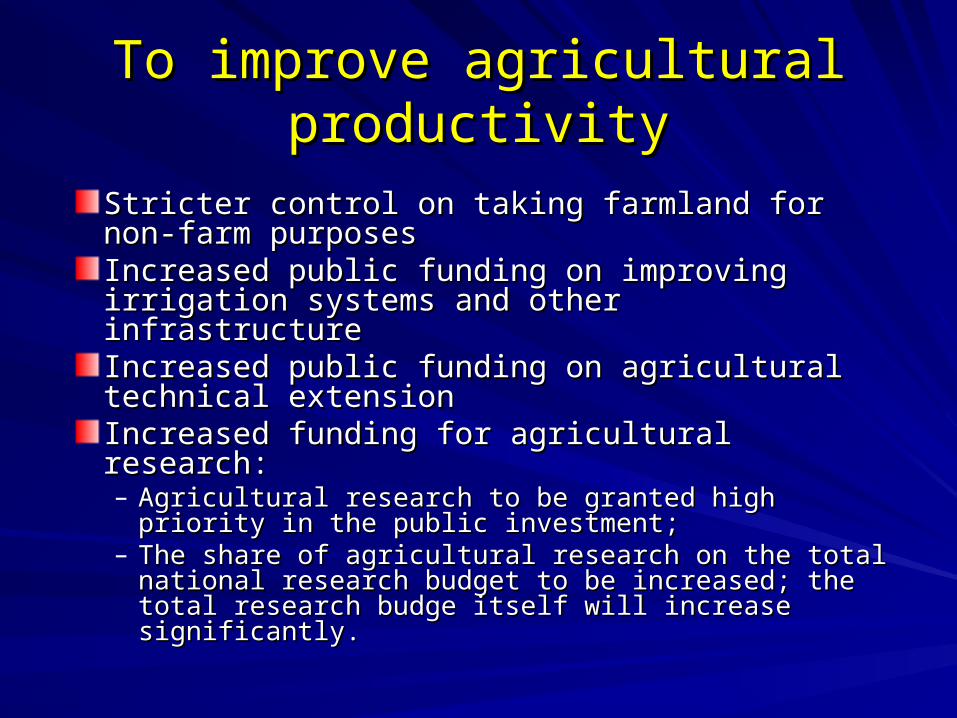
To improve agricultural productivityTo improve agricultural productivity
Stricter control on taking farmland for non-farm Stricter control on taking farmland for non-farm purposespurposesIncreased public funding on improving irrigation Increased public funding on improving irrigation systems and other infrastructure systems and other infrastructure Increased public funding on agricultural Increased public funding on agricultural technical extensiontechnical extensionIncreased funding for agricultural research:Increased funding for agricultural research:– Agricultural research to be granted high priority in Agricultural research to be granted high priority in
the public investment;the public investment;– The share of agricultural research on the total The share of agricultural research on the total
national research budget to be increased; the total national research budget to be increased; the total research budge itself will increase significantly.research budge itself will increase significantly.
To increase farmers’ income
Increasing agricultural income:Increasing agricultural income:– Reducing costReducing cost– Increase productionIncrease production– Stabilizing pricesStabilizing prices– RestructuringRestructuring
promoting off-farm employment in and out of promoting off-farm employment in and out of rural areasrural areas– Better policy framework for rural workers in citiesBetter policy framework for rural workers in cities
Direct subsidyDirect subsidy
To improve rural infrastructureTo improve rural infrastructure
Public investment in rural road, drinking Public investment in rural road, drinking water etc.water etc.
Village renovation:Village renovation:– To and in village roadTo and in village road– Draining systemDraining system– New toilets New toilets – Garbage collection and disposalGarbage collection and disposal– New housing (design and blueprints) New housing (design and blueprints)
To enhance rural education, To enhance rural education, health care and social securityhealth care and social securityMore support to implementing 9 year basic More support to implementing 9 year basic education:education: – Tuition free Tuition free – Free textbook and subsidy to boarding feesFree textbook and subsidy to boarding fees– Improving teaching facilities and teachers salaryImproving teaching facilities and teachers salary
More support to rural health careMore support to rural health care::– New medical insurance system for serious illnessNew medical insurance system for serious illness– More investment in rural hospitalsMore investment in rural hospitals
Social security:Social security:– More money for poverty reduction More money for poverty reduction – Pilot projects for rural pensionPilot projects for rural pension