agribusiness management of physalis peruviana … · a fruit that originated in the amazon,...
TRANSCRIPT
691
Bulgarian Journal of Agricultural Science, 22 (No 5) 2016, 691–704Agricultural Academy
AGRIBUSINESS MANAGEMENT OF PHYSALIS PERUVIANA L. FRUIT IN BRAZIL
L. BENDLIN1, C. O. SENFF1,2, C. KUDLAWICZ-FRANCO2, A. SOUZA2, C. P. DA VEIGA*2,3 and L. C. DUCLÓS2
1 Universidade do Contestado – UnC, Zip Code 89300-000, Mafra, SC, Brazil2 Pontifi cal Catholic University of Paraná – PUCPR, 1155, Prado Velho - Zip Code: 80215-901, Curitiba, PR, Brazil
3 Federal University of Paraná – UFPR, Zip Code: 80.210-170, Curitiba, PR, Brazil
Abstract
BENDLIN, L., C. O. SENFF, C. KUDLAWICZ-FRANCO, A. SOUZA, C. P. DA VEIGA and L. C. DUCLÓS, 2016. Agribusiness management of Physalis peruviana L. fruit in Brazil. Bulg. J. Agric. Sci., 22: 691–704
A fruit that originated in the Amazon, varieties of Physalis Peruviana L. are cultivated in America, Europe and Asia. It is considered an exotic fruit, belonging to the Solanaceae family, like tomatoes, potatoes, bell pepper and peppers. Thus, the objective of this article is to analyse the production costs, return and agribusiness risk in the plantation of one hectare of Physalis Peruviana L. fruit on the North Plateau of Santa Catarina State, Brazil. It is applied and descriptive research and a study case. For the analysis a cash fl ow was built for a ten-year horizon, with details of necessary investments to begin production, operational costs, profi tability and the risks of cultivation. For a medium/high return, the option was a MARR of 7% per year. The results suggest a return (ARRI) of 5.32% per year, a NPV of R$ 484 556 and an IRR of 96.89%, validated by the average Crystal Ball value, where all the information necessary to aid decision-making was presented. The results indicate that the investment is profi table, as there will be a return in less than a year. Therefore, this fruit is a good option for cultivation.
Key words: agribusiness and fruits, Physalis, multi-index methodology
*Corresponding author: [email protected]
Introduction
For a long time, agriculture has played a highly impor-tant role in the global economy scenario. It was one of the fi rst economic activities to be developed. Brazil is a country naturally suited to agribusiness, due to its diverse character-istics such as favourable weather, soil and luminosity. With its eight million, fi ve hundred thousand square kilometres, Brazil is the largest country in South America and the fi fth of the world, with a potential to expand its agricultural capacity without harming the environment. (Gomes, 2007; Kureski, et al., 2015; Bueno et al., 2015).
Based on the literature, according Gomes (2007, p.29), Brazil is a continental country wide of 8 511 965 km², almost twice as large as Western Europe. It is already the second larg-
est producer of fruit, and there is great potential for growth. On Brazilian soil, all the fruits of hot, humid, semiarid, temperate and cold-temperate climates can be and are cultivated. All of these fruits have a high economic value (Gomes, 2007). With an annual production of approximately forty million tons and approximately two and a half million hectares of cultivated land, Brazil is third in the global ranking of fruit producers, be-hind only India and China. The fruit is produced in all regions of the country, but there is considerable regional specializa-tion because of the weather. The Northeast and North produce more tropical fruit, while the Southeast and South specialize in fruit grown in temperate and subtropical climates (Anuário Brasileiro De Fruticultura, 2010; Rocha et al., 2015).
Fruticulture is important from a social and economic viewpoint because it means work for families, with a good
692 L. Bendlin, C. O. Senff, C. Kudlawicz-Franco, A. Souza, C. P. Da Veiga and L. C. Duclós
income paid per hectare. It also provides income for small property owners. On the other hand, unlike other companies that earn revenue every month, in agriculture, revenue is only earned at harvest time or afterwards, as agriculture is seasonal (Valandro et al., 2011).
Among the fruit currently produced, Physalis is one of the major exotic fruits, known in Brazil by many names, such as camapum, joá-de-capote, saco-de-bode, bate testa and mata-fome. The fruit is of Colombian origin and variet-ies of it are grown in America, Europe and Asia. In Brazil, the native variety, Physalis Angulata, is planted. The Physa-lis adapts easily in terms of weather and soil, the ideal soil being sandy or silica sandy. Considered a quick cycle and rustic fruit, it can be planted at any time of the year, and adapts well to the hot weather. It can tolerate a cold environ-ment, but is frost-tender (Muniz et al., 2010).
The Physalis is sweet and contains high level of vita-mins A and C, phosphor and iron, in addition to fl avonoids, carotenoids and functional bioactive compounds (Chaves, 2006). Tomassini et al. (2000) affi rm that some species are considered medicinal in many countries of America, Africa and Asia, highlighting the presence of withasteroids, nican-drenoma, withanolides and neofi salinas. Despite the limited knowledge of the culture, it is believed to be an excellent alternative for the small and medium farmer due to its physi-cal characteristics and marketing, as highlighted by Muniz et al. (2010).
The objective of this article is analyse the production costs of Physalis Peruviana L. fruit, verifying the expecta-tions of return and the risks of agricultural activity in the region of the North Plateau in Santa Catarina State, Bra-zil, based on a case study of a small farmer in the town of Itaiópolis.
This work is important in its contribution to small farmers who wish to begin cultivating this fruit or diversify their pro-duction and gain a new source of income. Another important factor highlighted in this study is the cost relation, risk and return on this rural activity, as it identifi es the costs and the
control of this production to aid a better evaluation and results.
Materials and Methods
This section discusses the contextualization of the devel-oped project and the tools used for the calculation of risk and return indicators, as well as the Monte Carlo methodology in Crystal Ball software, in addition to how the work is structured.
Agribusiness and fruitAgribusiness is related to the agricultural or livestock
production chain from the economic viewpoint of small, me-dium or large farmers. The industrial and commercial sec-tors supply the input for rural production, such as fertilizers and defensives. Agribusiness is of great importance to Brazil in economic and social terms, as it generates wealth for the country in the same measure that it generates income dis-tribution and, above all, creates jobs (Santos and Catapan, 2014, p.11).
In the agribusiness production chain, it is common to imagine that the process starts with the farmer and ends in the market, but even the farmer is a consumer (Moreira et al., 2016a; Moreira et al., 2016). Some Brazilian economic sectors have gained credibility and a potential for growth (Veiga et al., 2014). The soil, weather, water and terrain, for example, are unique characteristics that are favourable to the country and allow it to remain a step ahead of other nations in terms of agribusiness.
In the agribusiness production process, there is a com-monly accepted description of the structure in three stages: (i) before gate, (ii) inside gate, and (iii) post-gate. The struc-ture defi nitions of agribusiness are presented in Table 1.
FruitsFruit is rich in vitamins and minerals. Orchards grow
constantly and produce a wide variety of the best fruit for daily consumption. There are many advantages to growing fruit. It is easy cultivating fruit trees, especially the most rus-
Table 1Agribusiness structure defi nitionBefore gate This segment is composed of inputs, suppliers and necessary services for agricultural and livestock production,
such as machines, implements, defensives, fertilizers, correctives, seeds, water and energy.Inside gate Segment constituted by agriculture and livestock since the beginning of the activity for input preparation, such as
soil, seeds, fertilizers, plantation and the acquisition of agricultural and livestock products for the industrialization process.
Post-gate After the harvest, the agricultural and livestock products are sent directly to the fi nal consumer or processing in-dustry. The products for the fi nal consumer are sold in bulk, or in only a simple package, like a crate of fruit, roots, grains and diverse vegetables.
Source: Adapted from Araújo (2007, p. 35)
693Agribusiness Management of Physalis peruviana L. Fruit in Brazil
tic and tropical ones that produce good fruit (Gomes, 2007, p. 31). The reproduction of fruit plants occurs as follows, according to Gomes (2007, p. 39):
They form sexually and asexually. Sexual reproduction occurs by means of seeds. Reproduction by means of seeds has the following purposes: a) to prepare rootstocks or hors-es b) to create new varieties of fruit plant, and c) to form seedlings of species that endure, conserving their character-istics through multiplication. The trees that produce seeds are selected. They have to be healthy, hardy, and produce a high yield of fruit.
The weather is fundamental to the reproduction and growth of fruit trees. For each fruit, there is a kind of weather
recommended for its better reproduction, with some thriving better in hot weather and others in cold weather. Further-more, the fruit has to adapt to different kinds of weather. Ac-cording Gomes (2007, p. 35):
Every fruit plant has its own climate demands. One pre-fers hot and humid weather all year round, such as the banana tree. Others prefer hot and humid, but with a dry season for a season of vegetative rest. The leaves fall partially or totally. With the rain, new leaves sprout, followed by the fl owering and the fruiting, well fed and healthy. How tasty the fruit is which ripens in the bright hot sunshine!
Frost does considerable damage to tropical fruit plants. Extemporaneous frosts and blizzards can affect fl owering and destroy the harvest. High winds sometimes cause con-siderable damage to fruit plants (Gomes 2007, p.36). Almost all temperate weather fruits are grown on trees or bushes, but they do not develop properly in tropical regions with hot weather, as they require some days of low temperatures.
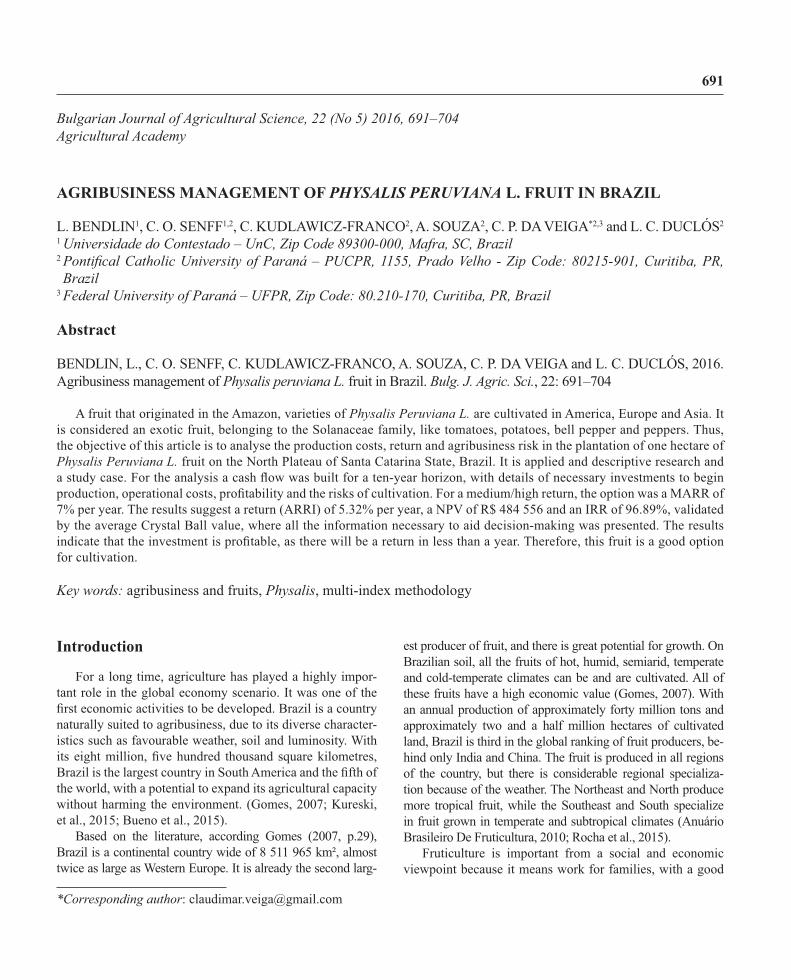
Physalis – fruit and steps for plantingThe Physalis (see Figure 1) is considered an exotic fruit,
belonging to the Solanaceae family, like tomatoes, potatoes, bell pepper and pepper. The plant originated in the Amazon, and varieties of Physalis are cultivated in America, Europe and Asia. It is a shrubby plant and can reach a height of up to two meters. The fruit is delicate, small and round, with co-louring ranging from yellow to orange, enclosed in a thin dry leaf in the shape of a balloon. With sweet, slightly acid, taste the Physalis is consumed in natura. It is also an ingredient
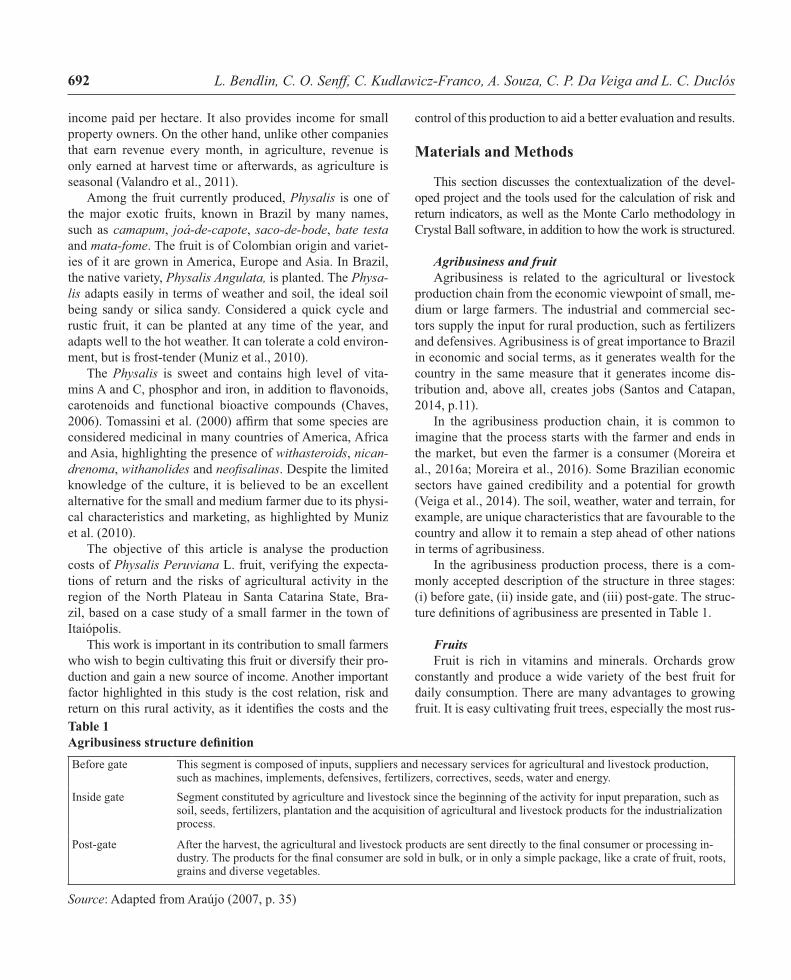
Fig. 2. Seedling PlantationSource: Muniz, 2011
Fig. 1. Physalis Peruviana L.Source: Revista Globo Rural, 2010
694 L. Bendlin, C. O. Senff, C. Kudlawicz-Franco, A. Souza, C. P. Da Veiga and L. C. Duclós
for sauces, jam, sweets, jelly, ice cream, liquor and other des-serts. The leaves, fruit and roots are used in popular medicine to combat diabetes, chronic rheumatism and skin, bladder and liver diseases (Matos, 2000; Mazorra et al., 2006).
It is rich in vitamins A and C, phosphorous and iron, al-kaloids and fl avonoids. It is used as an effective medicine to purify the blood, strengthen the immune system, relieve a sore throat and lower the cholesterol level. The fruit can also be used as an appetizer in wine tasting.
Its production consists of many stages, according to the description in Table 2.
The spacing between the plants (see Figure 2) is one of the important items in the group of cultivation techniques. It can interfere in the plants’ cycle, disease control and the quality and quantity of harvested fruits. The spacing used should be two meters between the cultivation lines and eighty centimetres between the seedlings. For the Physalis culture, the most important nutrients are potassium, calcium and boron. The potassium is responsible for the fl owering and growth of the fruit. It must be applied before fl owering. The calcium is very important to the formation of tissues and chalice. The boron is the most demanded micronutrient by
Table 2Production phases Soil Prepare The selection and preparation of the soil and the conduction system are important factors that affect productivity. Before
planting, a soil analysis is recommended. This should be prepared following the same recommendations as for tomato cultivation. The best soils are sandy or silica with a PH between 5.5 and 6. The substrate used for seed is composed by a homogeneous mix of two parts soil, one part sand, and highly decomposed organic matter. The substrate must be disinfected through solarisation, which is a hydrothermal process that allows the use of solar energy, causing the death of pathogen organisms that can contain substrate components until an almost sterile mix is obtained. The technique involves the sealing of wet substrate, placed in beds at a height of twenty centimetres in six plastic bags to capture solar energy and increase the temperature. The solarisation period varies from thirty to forty-fi ve days, depending on weather conditions. The greater the solar radiation, the shorter the solarisation time.
Plantation and transplant
The plant can be planted (see Picture 2) at any time of year with the proper preparations and soil correction. However, the seed sowing and transplant period must allow the cultivation at the most favourable period, in terms of water sup-ply, heat and luminosity for the growth and development of the plant. This ensures a lower risk to farmers and fi nancial agents who invest in new cultures.The sowing is done in polystyrene trays with 129 cells in plastic cups with three hundred millilitres or polyethylene bags of 13x13 centimetres, with substrate for vegetables, using one seed per cell, plastic cup or bag. Germination takes around twenty days. When the plants measure twenty or thirty centimetres, they can be planted preferably in sunny places protected from the wind.
Source: Gomes, 2007
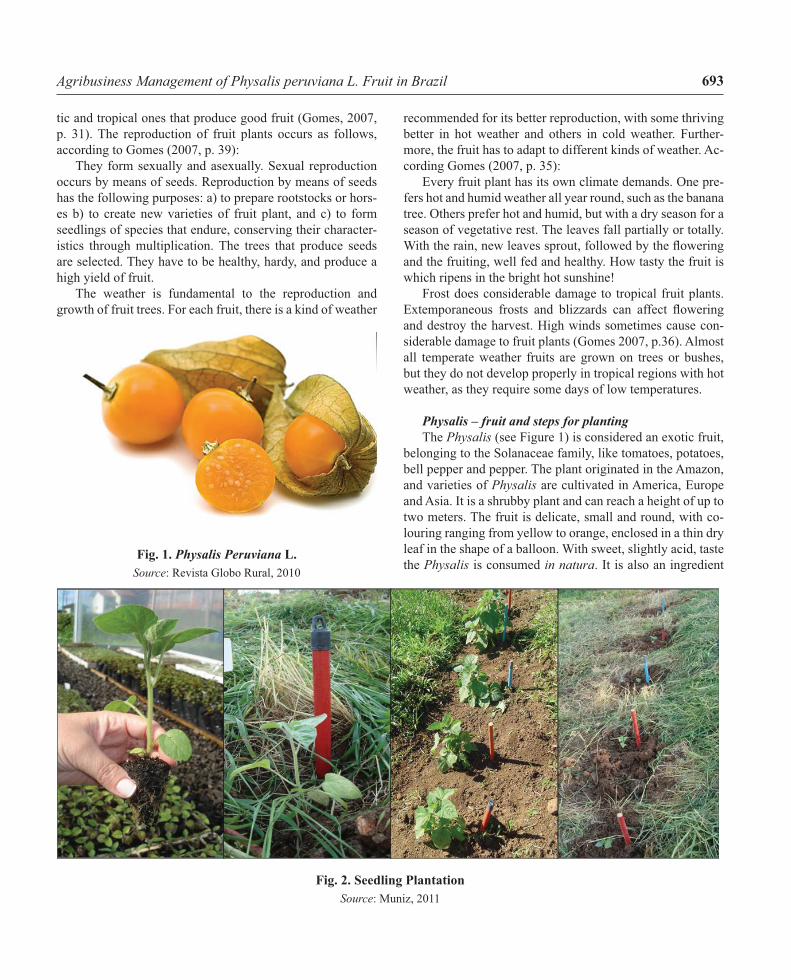
Fig. 3. LashingsSource: Muniz, 2011
695Agribusiness Management of Physalis peruviana L. Fruit in Brazil
the plants and its defi ciency reduces the content of soluble solids from the fruit.
Following growth, when the plants measure around eighty centimetres, they must be supported by a tutor and lashings (see Figure 3) because of the weight the fruits achieve when they are growing. The plants must be support-ed by a simple line with a fi xed galvanized iron of one me-ter and twenty-fi ve centimetres over the ground with sticks spaced ten meters from each other. At the centre, there is a bamboo or wooden stick with approximately two metres of height for the plants to be tied until the end of production. If this lashing is not done, branches can break and damage the quality of the fruit. Places with too much wind are not suit-able for this plant.
There are many kinds of lashings. For this cultivation, it depends on the region, but the most commonly used would be V-shaped, allowing greater availability of light, aiding cultivation and pruning. Table 3 describes the three main stages of fruit culture in detail.
The decomposition of the fruit must be done manually with scissors to cut the peduncle in an upward movement to release the fruit easily. The scissors must be clean and sharp and immersed in a solution containing water and agricultural iodine before passing to the next plant.
Rural and agricultural accounting Rural accounting analyses many parts of general ac-
counting, which will be used for rural companies, studying rural patrimony. Rural companies exploit the productive ca-pacity of the soil by using the land for livestock, fruit and the transformation of determined agricultural products. Every product related to food consumed by people on a daily basis is linked to agricultural activity. Rural activities are classi-fi ed as: (i) Agricultural Activity – Vegetable Production; (ii) Agroindustry Activity – Rural Companies (product transfor-mation); (iii) Zootechnical Activity – Livestock. Agricultural accounting is different from accounting in a company with monthly revenues. Agricultural accounting obtains revenues only during or after the harvest (Marion, 2014).
[...] In agricultural activity, however, the revenue is nor-mally concentrated during or after harvest. Unlike other ac-tivities, whose commercialization is distributed during the 12 months of the year, agricultural production is essentially seasonal and is concentrated in a determined period that might be some days of a month of the year. (Marion, 2014, p.04).
Table 3 The three stages of cultivationPruning Pruning in the physalis cultivation is one of the most recommended practices for the culture. There are three kinds of
pruning: maintenance pruning, production pruning and periodic sprout. The pruning greatly infl uences the fruit size and makes the handling, cultivation and harvest of the fruit easier. There is formation, fruitifi cation and cleaning pruning. Some fruit trees require a great deal of formation and fruitifi cation pruning. […] this is also the case with cleaning prun-ing, which is a common need in good orchards. (Gomes 2007 p. 64)
Main Plagues in the Culture
Unfortunately, the orchard is exposed to plagues and pests. The intensity varies according to the species and individual plant (Gomes, 2007 p. 67). In the Physalis culture, there are wide varieties of plagues that attack diverse fruit organs during the reproduction cycle. They are: Epitrixsp (smoke fl ea) Aphissp, Edessarufomarginata (bug), Phthiapicta and Manduca Sexta Paphus. Currently there are few insecticides to combat these plagues. Thus, the best way to combat them is careful handling of the culture and caring for the fruit.
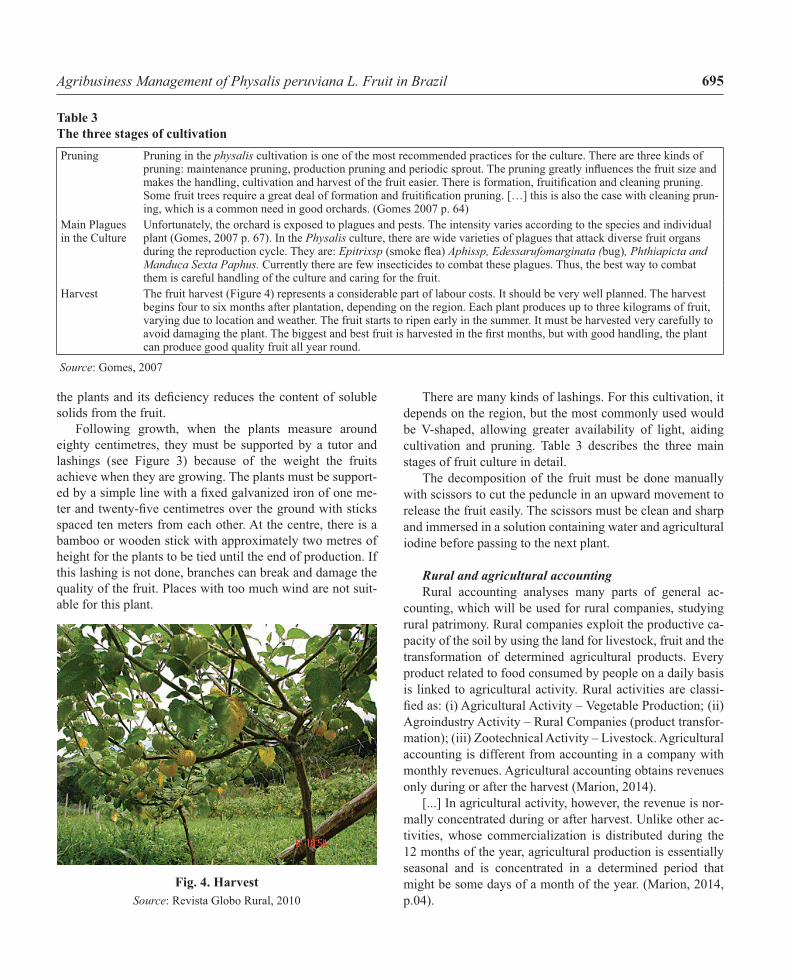
Harvest The fruit harvest (Figure 4) represents a considerable part of labour costs. It should be very well planned. The harvest begins four to six months after plantation, depending on the region. Each plant produces up to three kilograms of fruit, varying due to location and weather. The fruit starts to ripen early in the summer. It must be harvested very carefully to avoid damaging the plant. The biggest and best fruit is harvested in the fi rst months, but with good handling, the plant can produce good quality fruit all year round.
Source: Gomes, 2007
Fig. 4. HarvestSource: Revista Globo Rural, 2010
696 L. Bendlin, C. O. Senff, C. Kudlawicz-Franco, A. Souza, C. P. Da Veiga and L. C. Duclós
At the end of the harvest, the agricultural year closes. This is concentrated in the period that the crop is planted, harvest-ed, and traded to obtain revenue. When a determined activity includes many cultures, it would be confusing to stipulate an agricultural year. Thus, the accounting closes the year based on the culture with the highest fi nancial return. In agriculture, there are two kinds of culture formation: (i) Temporary Cul-ture and (ii) Permanent Culture (Marion, 2014).
Agricultural accounting is different because its adminis-trative expenses of selling and fi nance do not compound the expenditure on culture formation, but are considered directly as period expenses (Marion, 2014, p.20). After planting, the concern is with the fi rst harvest, or with the fi rst production, with its accounting and cost verifi cation. The harvest is char-acterized as stock in processing, a production in process to be sold. The permanent culture depreciation is also added to the harvest cost, with the annual quota compatible with the lifetime of each culture being considered.
“[...] All the permanent culture which produces fruits (biological actives) will be the target of depreciation. On the other hand, the producer tree is not extracted from the soil; the fi nal product is the fruit and not the tree per se. The tree is maintained intact.” (Marion, 2014, p. 57). The deprecia-tion is normally the main item for the calculation of costs in the harvest that will be begun after the fi rst production or harvest. While the harvest is in process, it will not suffer de-preciation. One of the diffi culties for calculating plantation or harvest costs is obtaining the exact value of agricultural equipment and replacement parts, as they are not used con-secutively throughout the whole year. For the depreciation calculation, the best method would be the rate per worked hours. “Normally, a mistake has been made in calculating the annual rate of depreciation, with tax criteria, appropriating the year’s depreciation among the many cultures.” (Marion, 2014, p. 58). In this way, it would be better to do the depre-ciation per hour, estimating a number of hours the equip-ment is worked, instead of the number of lifetime years of
the equipment. In this regard, it is observed that tractors have a life of approximately 8 000 work hours, while for track-type tractors it is approximately 9 000 work hours. For this purpose, it is assumed that after this number of work hours the residual value of this equipment is negligible.
Costs in the agriculture sectorAs in any enterprise, in the agricultural sector the cost
system has a wide range of well-defi ned objectives that re-fl ect its importance to the management. This is especially true of agribusiness, where the time spaces between produc-tion and sales, i.e., between costs and revenues, are not as simple as other kinds of business, requiring special tech-niques for presenting not only costs, but also the economic results of the enterprise. The costs are based on fi xed costs, variable costs, direct and indirect costs, the cost of services provided and determination of income. For income evalua-tion in the agricultural sector, it is necessary to be familiar with some of the concepts that are used.
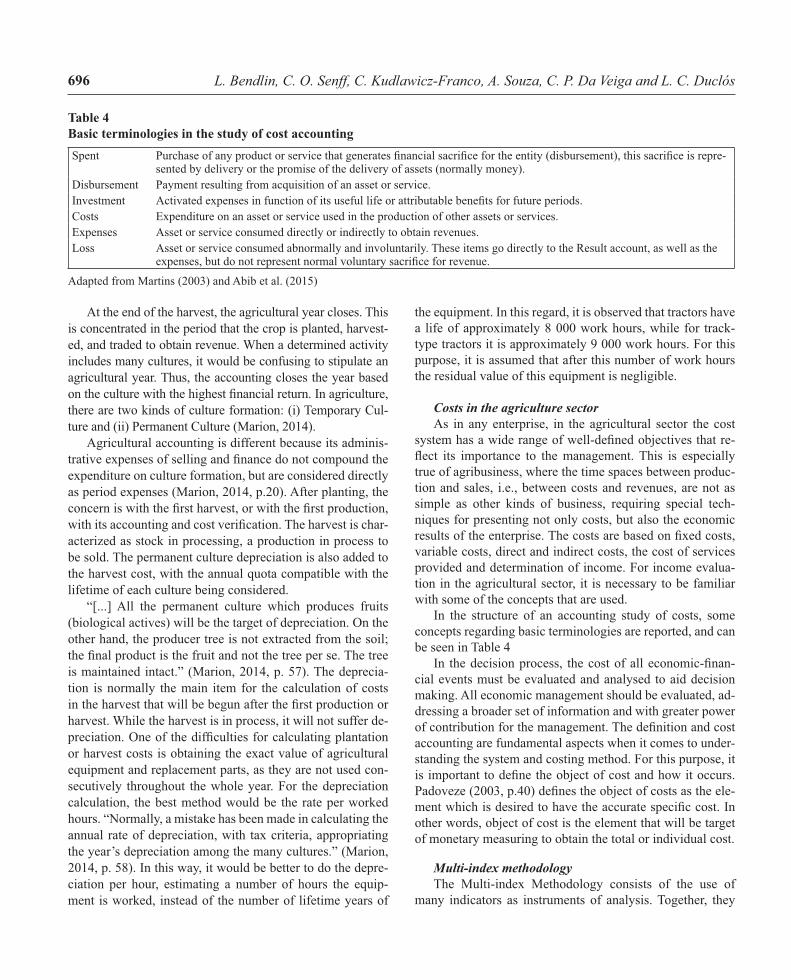
In the structure of an accounting study of costs, some concepts regarding basic terminologies are reported, and can be seen in Table 4
In the decision process, the cost of all economic-fi nan-cial events must be evaluated and analysed to aid decision making. All economic management should be evaluated, ad-dressing a broader set of information and with greater power of contribution for the management. The defi nition and cost accounting are fundamental aspects when it comes to under-standing the system and costing method. For this purpose, it is important to defi ne the object of cost and how it occurs. Padoveze (2003, p.40) defi nes the object of costs as the ele-ment which is desired to have the accurate specifi c cost. In other words, object of cost is the element that will be target of monetary measuring to obtain the total or individual cost.
Multi-index methodologyThe Multi-index Methodology consists of the use of
many indicators as instruments of analysis. Together, they
Table 4 Basic terminologies in the study of cost accountingSpent Purchase of any product or service that generates fi nancial sacrifi ce for the entity (disbursement), this sacrifi ce is repre-
sented by delivery or the promise of the delivery of assets (normally money).Disbursement Payment resulting from acquisition of an asset or service.Investment Activated expenses in function of its useful life or attributable benefi ts for future periods.Costs Expenditure on an asset or service used in the production of other assets or services.Expenses Asset or service consumed directly or indirectly to obtain revenues.Loss Asset or service consumed abnormally and involuntarily. These items go directly to the Result account, as well as the
expenses, but do not represent normal voluntary sacrifi ce for revenue.Adapted from Martins (2003) and Abib et al. (2015)
697Agribusiness Management of Physalis peruviana L. Fruit in Brazil
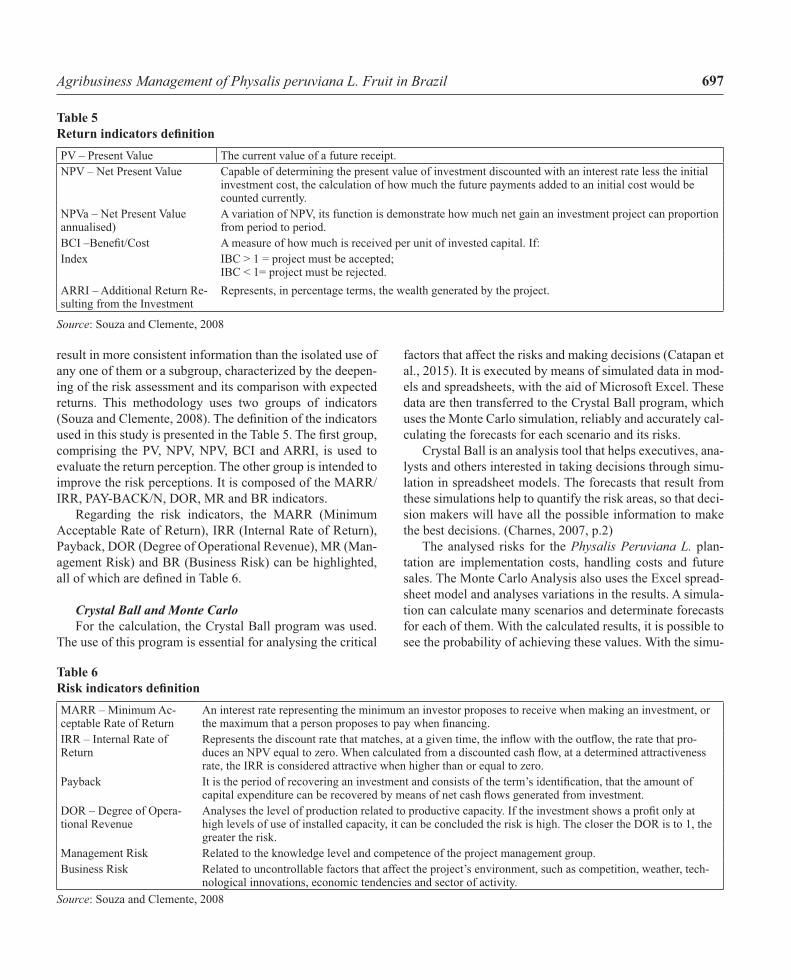
result in more consistent information than the isolated use of any one of them or a subgroup, characterized by the deepen-ing of the risk assessment and its comparison with expected returns. This methodology uses two groups of indicators (Souza and Clemente, 2008). The defi nition of the indicators used in this study is presented in the Table 5. The fi rst group, comprising the PV, NPV, NPV, BCI and ARRI, is used to evaluate the return perception. The other group is intended to improve the risk perceptions. It is composed of the MARR/IRR, PAY-BACK/N, DOR, MR and BR indicators.
Regarding the risk indicators, the MARR (Minimum Acceptable Rate of Return), IRR (Internal Rate of Return), Payback, DOR (Degree of Operational Revenue), MR (Man-agement Risk) and BR (Business Risk) can be highlighted, all of which are defi ned in Table 6.
Crystal Ball and Monte CarloFor the calculation, the Crystal Ball program was used.
The use of this program is essential for analysing the critical
factors that affect the risks and making decisions (Catapan et al., 2015). It is executed by means of simulated data in mod-els and spreadsheets, with the aid of Microsoft Excel. These data are then transferred to the Crystal Ball program, which uses the Monte Carlo simulation, reliably and accurately cal-culating the forecasts for each scenario and its risks.
Crystal Ball is an analysis tool that helps executives, ana-lysts and others interested in taking decisions through simu-lation in spreadsheet models. The forecasts that result from these simulations help to quantify the risk areas, so that deci-sion makers will have all the possible information to make the best decisions. (Charnes, 2007, p.2)
The analysed risks for the Physalis Peruviana L. plan-tation are implementation costs, handling costs and future sales. The Monte Carlo Analysis also uses the Excel spread-sheet model and analyses variations in the results. A simula-tion can calculate many scenarios and determinate forecasts for each of them. With the calculated results, it is possible to see the probability of achieving these values. With the simu-
Table 5 Return indicators defi nition PV – Present Value The current value of a future receipt.NPV – Net Present Value Capable of determining the present value of investment discounted with an interest rate less the initial
investment cost, the calculation of how much the future payments added to an initial cost would be counted currently.
NPVa – Net Present Value annualised)
A variation of NPV, its function is demonstrate how much net gain an investment project can proportion from period to period.
BCI –Benefi t/Cost A measure of how much is received per unit of invested capital. If: Index IBC > 1 = project must be accepted;
IBC < 1= project must be rejected.ARRI – Additional Return Re-sulting from the Investment
Represents, in percentage terms, the wealth generated by the project.
Source: Souza and Clemente, 2008
Table 6 Risk indicators defi nitionMARR – Minimum Ac-ceptable Rate of Return
An interest rate representing the minimum an investor proposes to receive when making an investment, or the maximum that a person proposes to pay when fi nancing.
IRR – Internal Rate of Return
Represents the discount rate that matches, at a given time, the infl ow with the outfl ow, the rate that pro-duces an NPV equal to zero. When calculated from a discounted cash fl ow, at a determined attractiveness rate, the IRR is considered attractive when higher than or equal to zero.
Payback It is the period of recovering an investment and consists of the term’s identifi cation, that the amount of capital expenditure can be recovered by means of net cash fl ows generated from investment.
DOR – Degree of Opera-tional Revenue
Analyses the level of production related to productive capacity. If the investment shows a profi t only at high levels of use of installed capacity, it can be concluded the risk is high. The closer the DOR is to 1, the greater the risk.
Management Risk Related to the knowledge level and competence of the project management group.Business Risk Related to uncontrollable factors that affect the project’s environment, such as competition, weather, tech-
nological innovations, economic tendencies and sector of activity.Source: Souza and Clemente, 2008
698 L. Bendlin, C. O. Senff, C. Kudlawicz-Franco, A. Souza, C. P. Da Veiga and L. C. Duclós
lation, it is possible to obtain results in the forecast’s graph-ics and the probability of achieving these results.
The analysis of a risk spreadsheet uses both the model in a spreadsheet and a simulation to analyse the effects of the variations of entrance in the modelled results system. One kind of simulation on a spreadsheet is the Monte Carlo Simulation, which generates random values for uncertain variables repeatedly and then simulates the model. (Charnes, 2007, p.6)
Research Methodology
Nature and kind of researchThe subject was chosen with the objective of verify-
ing whether the agricultural producer will obtain a profi t-able return on his/her plantation. [...] “The main objective of descriptive research is to describe characteristics of a specifi c population, phenomenon or the establishment of a relationship between the variables. One of its most sig-nifi cant characteristics is the bad use of standardized data collection techniques”. (Beuren, 2008, p. 81). The fi nal phase of the methodology constitutes the verifi cation and application of the proposed approach of the general objec-tive in this project. This research involves a case study where production costs and return on investment will be examined.
Regarding the data analysis, it is a quantitative study, as it uses statistical information and instruments. The use of this research typology is relevant in that it uses statistical instru-ments from the data collection to the analysis and treatment. (Beuren, 2008 p. 93).
Data collection, treatment and analysisThe data were collected through observations, a method
that consists of seeing, hearing and examining the phenom-enon in question (Beuren, 2008) of a one hectare plantation of Physalis Peruviana L. and its maintenance, located in a small rural property in the region of Itaiópolis, in Santa Ca-tarina State. By means of documental research (incoming or outgoing receipts, personal statements and spontaneous ob-servation, information was collected on the fruit production and commercialization, including purchase and sale prices, the prices of inputs, fertilizers and everything else related to production. For the data collection, the costs related to one hectare of production on a small rural property were anal-ysed.
For the effects of property costs analysis, Excel spread-sheets were prepared with the investment, fi xed costs, vari-ables and expenses. For data analysis and interpretation, the costs were organized, classifi ed into categories. The results were interpreted and analysed. When the data analysis was concluded, the economic return and the risks were calculat-ed. The costs were analysed based on the literature, and the results analysed based on the Multi-index Methodology and by means of the Crystal Ball program.
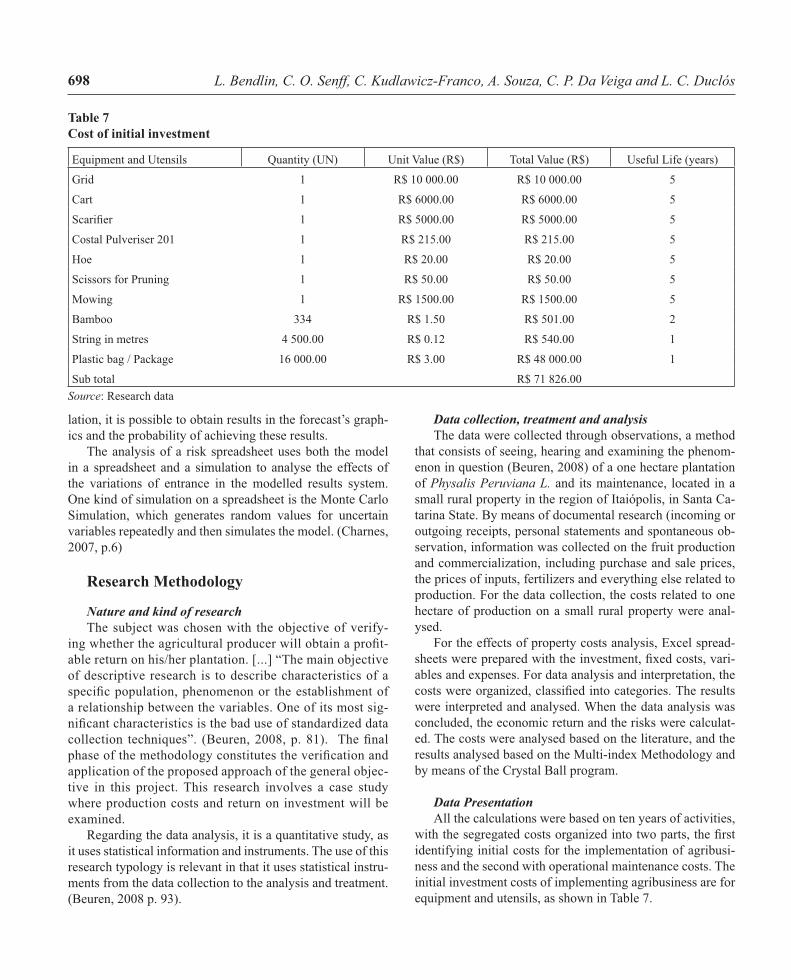
Data PresentationAll the calculations were based on ten years of activities,
with the segregated costs organized into two parts, the fi rst identifying initial costs for the implementation of agribusi-ness and the second with operational maintenance costs. The initial investment costs of implementing agribusiness are for equipment and utensils, as shown in Table 7.
Table 7Cost of initial investment
Equipment and Utensils Quantity (UN) Unit Value (R$) Total Value (R$) Useful Life (years)
Grid 1 R$ 10 000.00 R$ 10 000.00 5
Cart 1 R$ 6000.00 R$ 6000.00 5
Scarifi er 1 R$ 5000.00 R$ 5000.00 5
Costal Pulveriser 201 1 R$ 215.00 R$ 215.00 5
Hoe 1 R$ 20.00 R$ 20.00 5
Scissors for Pruning 1 R$ 50.00 R$ 50.00 5
Mowing 1 R$ 1500.00 R$ 1500.00 5
Bamboo 334 R$ 1.50 R$ 501.00 2
String in metres 4 500.00 R$ 0.12 R$ 540.00 1
Plastic bag / Package 16 000.00 R$ 3.00 R$ 48 000.00 1
Sub total R$ 71 826.00Source: Research data
699Agribusiness Management of Physalis peruviana L. Fruit in Brazil
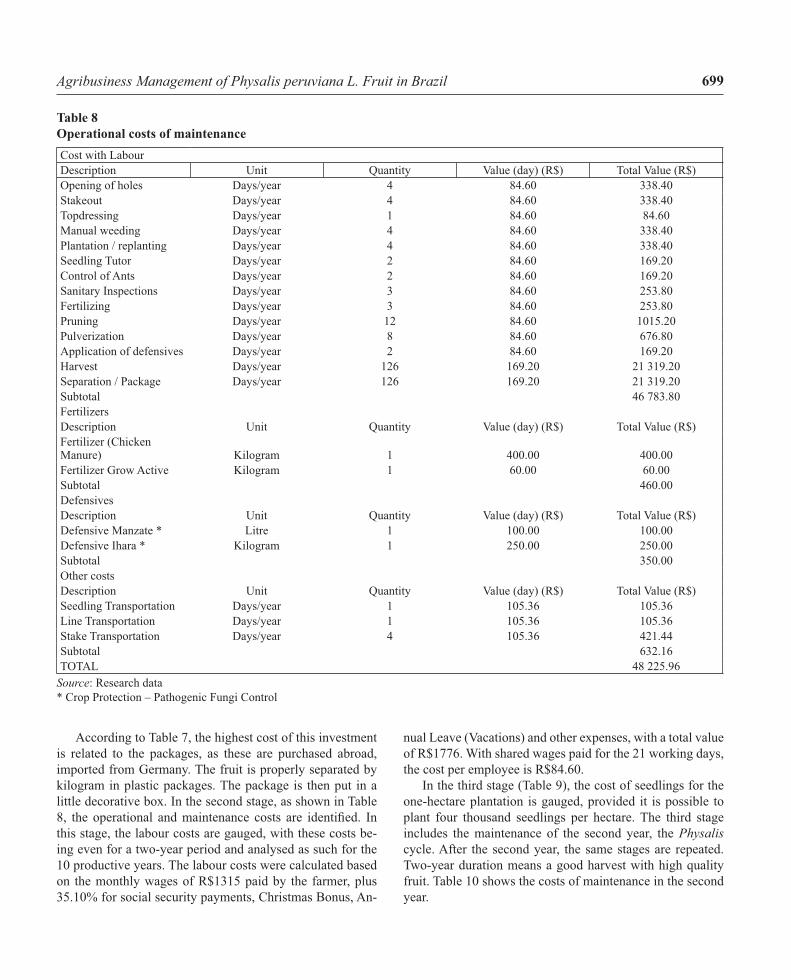
According to Table 7, the highest cost of this investment is related to the packages, as these are purchased abroad, imported from Germany. The fruit is properly separated by kilogram in plastic packages. The package is then put in a little decorative box. In the second stage, as shown in Table 8, the operational and maintenance costs are identifi ed. In this stage, the labour costs are gauged, with these costs be-ing even for a two-year period and analysed as such for the 10 productive years. The labour costs were calculated based on the monthly wages of R$1315 paid by the farmer, plus 35.10% for social security payments, Christmas Bonus, An-
nual Leave (Vacations) and other expenses, with a total value of R$1776. With shared wages paid for the 21 working days, the cost per employee is R$84.60.
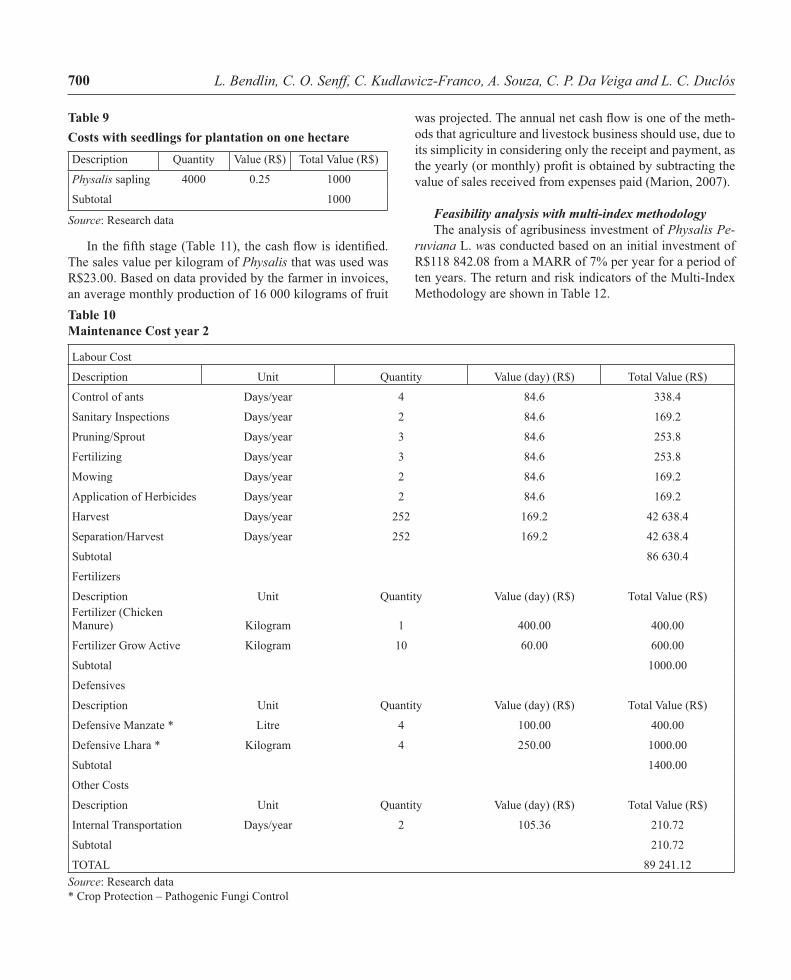
In the third stage (Table 9), the cost of seedlings for the one-hectare plantation is gauged, provided it is possible to plant four thousand seedlings per hectare. The third stage includes the maintenance of the second year, the Physalis cycle. After the second year, the same stages are repeated. Two-year duration means a good harvest with high quality fruit. Table 10 shows the costs of maintenance in the second year.
Table 8Operational costs of maintenanceCost with LabourDescription Unit Quantity Value (day) (R$) Total Value (R$)Opening of holes Days/year 4 84.60 338.40Stakeout Days/year 4 84.60 338.40Topdressing Days/year 1 84.60 84.60Manual weeding Days/year 4 84.60 338.40Plantation / replanting Days/year 4 84.60 338.40Seedling Tutor Days/year 2 84.60 169.20Control of Ants Days/year 2 84.60 169.20Sanitary Inspections Days/year 3 84.60 253.80Fertilizing Days/year 3 84.60 253.80Pruning Days/year 12 84.60 1015.20Pulverization Days/year 8 84.60 676.80Application of defensives Days/year 2 84.60 169.20Harvest Days/year 126 169.20 21 319.20Separation / Package Days/year 126 169.20 21 319.20Subtotal 46 783.80FertilizersDescription Unit Quantity Value (day) (R$) Total Value (R$)Fertilizer (Chicken Manure) Kilogram 1 400.00 400.00Fertilizer Grow Active Kilogram 1 60.00 60.00Subtotal 460.00DefensivesDescription Unit Quantity Value (day) (R$) Total Value (R$)Defensive Manzate * Litre 1 100.00 100.00Defensive Ihara * Kilogram 1 250.00 250.00Subtotal 350.00Other costsDescription Unit Quantity Value (day) (R$) Total Value (R$)Seedling Transportation Days/year 1 105.36 105.36Line Transportation Days/year 1 105.36 105.36Stake Transportation Days/year 4 105.36 421.44Subtotal 632.16TOTAL 48 225.96
Source: Research data* Crop Protection – Pathogenic Fungi Control
700 L. Bendlin, C. O. Senff, C. Kudlawicz-Franco, A. Souza, C. P. Da Veiga and L. C. Duclós
In the fi fth stage (Table 11), the cash fl ow is identifi ed. The sales value per kilogram of Physalis that was used was R$23.00. Based on data provided by the farmer in invoices, an average monthly production of 16 000 kilograms of fruit
was projected. The annual net cash fl ow is one of the meth-ods that agriculture and livestock business should use, due to its simplicity in considering only the receipt and payment, as the yearly (or monthly) profi t is obtained by subtracting the value of sales received from expenses paid (Marion, 2007).
Feasibility analysis with multi-index methodologyThe analysis of agribusiness investment of Physalis Pe-
ruviana L. was conducted based on an initial investment of R$118 842.08 from a MARR of 7% per year for a period of ten years. The return and risk indicators of the Multi-Index Methodology are shown in Table 12.
Table 9Costs with seedlings for plantation on one hectareDescription Quantity Value (R$) Total Value (R$)
Physalis sapling 4000 0.25 1000
Subtotal 1000
Source: Research data
Table 10Maintenance Cost year 2
Labour Cost
Description Unit Quantity Value (day) (R$) Total Value (R$)
Control of ants Days/year 4 84.6 338.4
Sanitary Inspections Days/year 2 84.6 169.2
Pruning/Sprout Days/year 3 84.6 253.8
Fertilizing Days/year 3 84.6 253.8
Mowing Days/year 2 84.6 169.2
Application of Herbicides Days/year 2 84.6 169.2
Harvest Days/year 252 169.2 42 638.4
Separation/Harvest Days/year 252 169.2 42 638.4
Subtotal 86 630.4
Fertilizers
Description Unit Quantity Value (day) (R$) Total Value (R$)Fertilizer (Chicken Manure) Kilogram 1 400.00 400.00
Fertilizer Grow Active Kilogram 10 60.00 600.00
Subtotal 1000.00
Defensives
Description Unit Quantity Value (day) (R$) Total Value (R$)
Defensive Manzate * Litre 4 100.00 400.00
Defensive Lhara * Kilogram 4 250.00 1000.00
Subtotal 1400.00
Other Costs
Description Unit Quantity Value (day) (R$) Total Value (R$)
Internal Transportation Days/year 2 105.36 210.72
Subtotal 210.72
TOTAL 89 241.12Source: Research data* Crop Protection – Pathogenic Fungi Control
701Agribusiness Management of Physalis peruviana L. Fruit in Brazil
Regarding the return indicators, in opting for an agricul-tural investment, from a MARR of 7% per year, the expecta-tion that the investment will be recovered is confi rmed, for the Present Value of R$713 038.00, with the generation of a Net Present Value of R$484 585. It shows that in choos-ing this investment, the investor can recover what he/she would have earned if the capital had been applied in the fi -nancial market at 8% per year and there would still remain, in today’s monetary values, the sum of R$484 585. In other
words, the Net Present Value annualized, distributed in an-nual equivalent values, is R$68 988.
The BCI (Benefi t/Cost Index) is an indicator that measures the return expectation for each unit of immobilized capital in Physalis plantation exploration, and it is expected that R$1.68 will be obtained for every R$1.00 invested. It is important to ob-serve that it is a return beyond that one which would be if this R$ 1.00 had been invested in MARR (7% per year) for ten years. The ARRI (Additional Return Resulting from the Investment) associated with Physalis exploration is estimated at 5.32% per year, more than that would have been obtained if the capital had been invested in the fi nancial market at 7% per year. Con-cerning the risk indicators, the IRR (Internal Rate of Return) was found to be 96.93%. As concerning the Management Risk associated with the farmer’s experience and knowledge of the production process and commercialization, it can be considered at R$0.50 due to the availability of public or private technical
Table 11Net cash fl ow demonstrationCash Flow
Year Investment (R$) Gross Income (R$)
Cash Flow (R$)
0 (118,842.08) - (118 842.08)
1 (3,174.00) 138 .000.00 134 826.00
2 (94,531.12) 230 000.00 135 468.88
3 (118,842.08) 138 000.00 19 157.92
4 (94,531.12) 230 000.00 135 468.88
5 (118,842.08) 138 000.00 19 157.92
6 (94,531.12) 230 000.00 135 468.88
7 (118,842.08) 138 000.00 19 157.92
8 (94,531.12) 230 000.00 135 468.88
9 (118,842.08) 138 000.00 19 157.92
10 (94,531.12) 230 000.00 135 468.88
Source: Research data
Table 12Indicators of risk and return multi index methodology
RET
UR
N
NET PRESENT VALUE R$ 484 585.00NET PRESENT VALUE ANNUALISED R$ 68 988.00BENEFIT/COST INDEX (BCI) 1.68ARRI/YEAR 5.32%
RIS
K
INTERNAL RATE OF RETURN (IRR) 96.93%
INDEX MARR/IRR 7.22
MANAGEMENT RISK 0.50
BUSINESS RISK 0.50Source: Research data
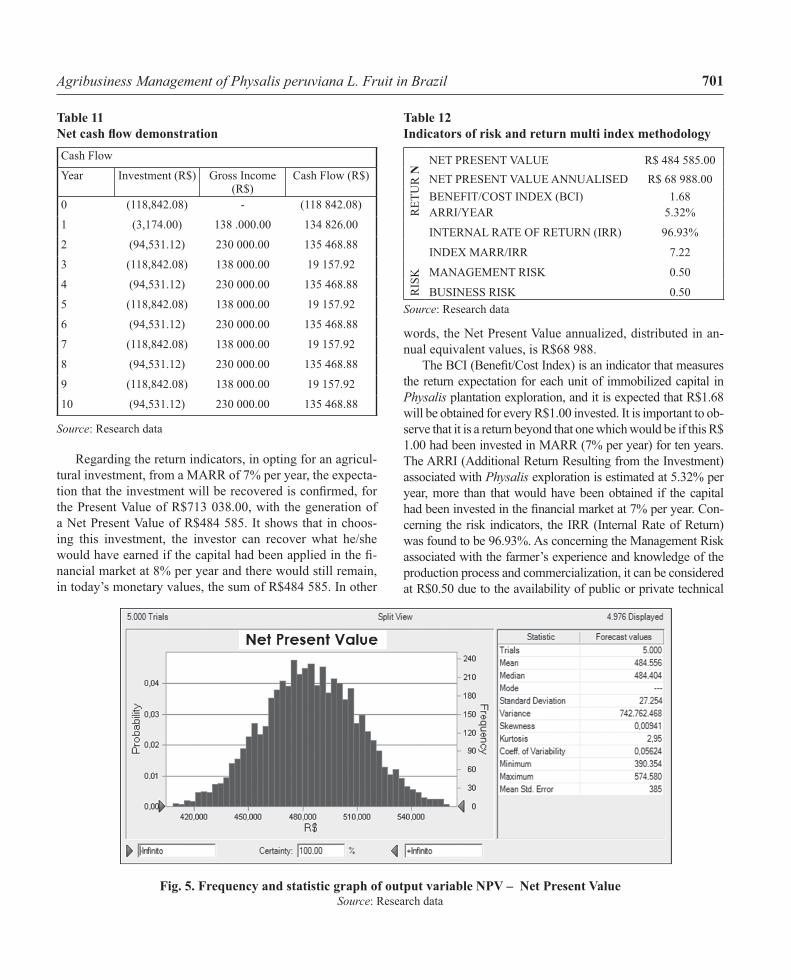
Fig. 5. Frequency and statistic graph of output variable NPV – Net Present ValueSource: Research data
702 L. Bendlin, C. O. Senff, C. Kudlawicz-Franco, A. Souza, C. P. Da Veiga and L. C. Duclós
guidance in the sector. As for the Business Risk, it can also be considered at R$0.50 as it is mainly related to the weather and market. The weather affects the quality of the fruit.
Feasibility analysis with the Monte Carlo SimulationFor the Physalis production simulation sales in kilograms
and the sales price set by the agricultural producer were con-sidered. For forecast variables, the NPV, IRR and ARRI were selected. The number of repetitions considered for the executed result was fi ve thousand. After the simulation, the frequency graphs were obtained with minimum, medium and
maximum values of variables, the median, variance and stan-dard deviation and other information. Figure 5 shows that the average for NPV is R$484 556, lower than, albeit close to, the value found in the Multi-Index. The minimum value was R$390 354 and the maximum R$574 580.
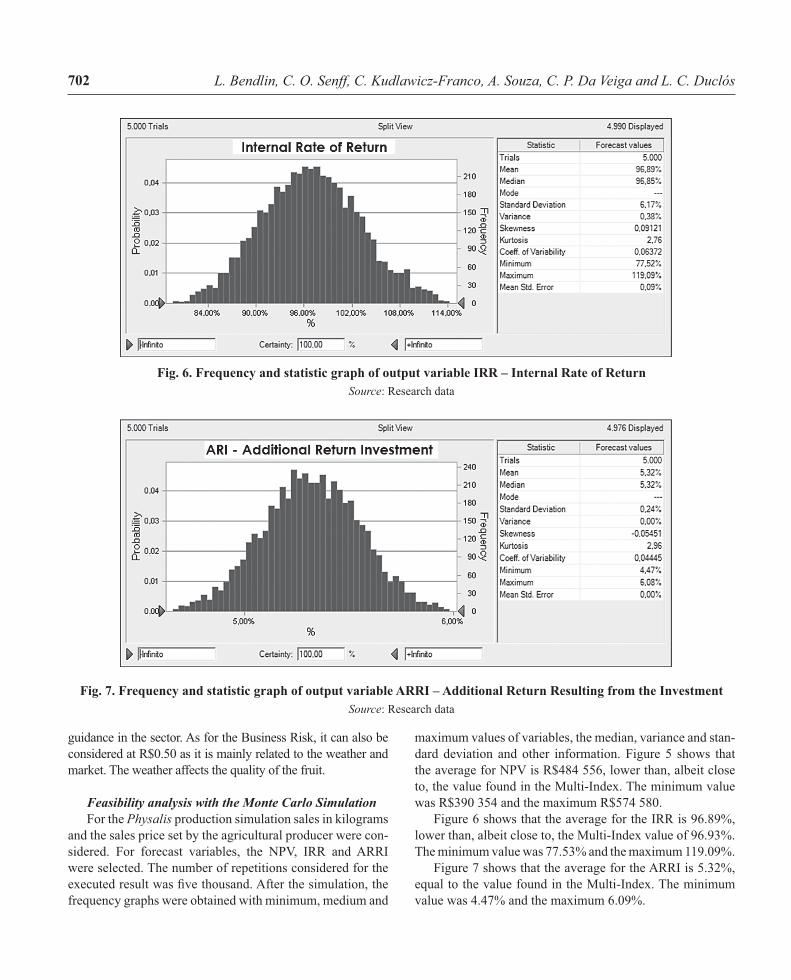
Figure 6 shows that the average for the IRR is 96.89%, lower than, albeit close to, the Multi-Index value of 96.93%. The minimum value was 77.53% and the maximum 119.09%.
Figure 7 shows that the average for the ARRI is 5.32%, equal to the value found in the Multi-Index. The minimum value was 4.47% and the maximum 6.09%.
Fig. 6. Frequency and statistic graph of output variable IRR – Internal Rate of ReturnSource: Research data
Fig. 7 . Frequency and statistic graph of output variable ARRI – Additional Return Resulting from the InvestmentSource: Research data
703Agribusiness Management of Physalis peruviana L. Fruit in Brazil
Final Considerations
The objective of this article was to analyse the produc-tion costs, return and risk of agribusiness in the plantation of one hectare of Physalis Peruviana L. fruit in the North Pla-teau region of Santa Catarina State, Brazil. From the value invested in the identifi ed costs, as well as the indexes found, taking into consideration the characteristics of this agribusi-ness, the results indicate that the investment is profi table with a medium/high return, as the payback be in less than a year. Therefore, this is a good option of fruit for cultivation.
The contribution of the study to the literature and prac-tical application, analysing the return on the Physalis agri-business, is that the investment in agriculture for this kind of plantation is profi table, with an excellent investment in-dicator. As it is an exotic fruit and is not widely cultivated in many regions of the world, its price is higher, allowing farmers to earn a profi t that is above the average in the sec-tor. According to the main results of this analysis, with the sales from the harvest in the fi rst year, the investment costs will be covered.
By means of the Crystal Ball analysis tool, from the en-trance variables as uncertain variables or the entrance vari-ables for the simulation of the quantity of fruit in kilograms and the sales price, the forecast variables NPV, IRR and ARRI show that the probability of the calculated values is medium/high. This is proved by proximity values, confi rmed by the percentage of certainty between the minimum val-ues and the average of each forecast variable. Analysing the agribusiness feasibility indicators of Physalis Peruviana L. in one hectare, medium/high profi tability was forecast, con-fi rmed by the ARRI, estimated at 5.32% per year. A return estimated by the IRR of 96.93% was found, confi rmed by the Crystal Ball. Based on the research results, the fi nancial risk verifi ed in this kind of agribusiness is low, as demonstrated by the MARR/IRR index, estimated at 7.22%.
The fi ndings of this study, their interpretation and sug-gestions for practical implications should be considered in the context of the limitations of this work. The study ana-lysed only a small segment in the agricultural sector, in a single case, with temporal limitations. The same procedure used here can be applied to other agribusiness sectors and different regions of the country at different times. The study discusses a complex issue and this work was not intended to be exhaustive. Despite these limitations, the fi nancial in-dexes should not be discarded as a statistical indicator that helps farmers make decisions, as they provide information that cannot be detected by a qualitative analysis and the ex-periences of experts in the fi eld. As future research, a Multi-
Index Methodology analysis of the agribusiness in question is suggested (Rego et al., 2015) in addition to a Monte Carlo Simulation (Catapan et al., 2015) in other agribusiness seg-ments.
Acknowledgements The authors would like to thank the anonymous review-
ers of the Bulgarian Journal of Agricultural Science for their signifi can t contribution to the fi nal version of this article.
References
Abib, M., E. A. Catapan., A. Catapan., D. C. Catapan and C. P. Veiga, 2015. Análise das demonstrações contábeis como etapa preliminar para elaboração do planejamento de curto, médio e longo prazo no brasil: um estudo de caso na Votorantim Cimen-tos. Espacios, 36: 1–4.
Anuário Brasileiro de Fruticultura, 2010. Santa Cruz do Sul, Editora Gazeta, 129 pp.
Beuren, I. M, 2008. Como Elaborar Trabalhos Monográfi cos em Contabilidade. 3a ed., Atlas, São Paulo.
Bueno, P. V., D. T. Rocha., C. P. Veiga and L. C. Duclós, 2015, Pós-Graduação strictu sensu no Brazil: Análise de uma Univer-sidade Privada. Espacios (Caracas), 35: E-4.
Catapan, A., A. Souza., D. C. Catapan and J. H. Harzer, 2015. Electric energy production from swine deject: analysis of fi nan-cial feasibility with the use of Monte Carlo simulation for the implantation of Bio-digester. Bulg. J. Agric. Sci., 21: 257–260.
Charnes, J., 2007. Financial Modeling with Cristal Ball and Excel + Companion web site, Wiley Finance.
Chaves, A. C, 2006. Propagação e avaliação fenológica de Physalis sp. na região de Pelotas, RS. 2006. 65f. Tese (Doutorado), Uni-versidade Federal de Pelotas, Pelotas.
Ciscato, C., V. Barden., A. V. Castoldi., W. A. Freitas., C. P. Vei-ga and L. C. Duclós, 2016. Mapa Estratégico: Uma Pesquisa-Ação para a melhoria do fl uxo de caixa em uma indústria têxtil no sul do Brasil. Espacios, 37: 6.
Fisconet, 2016. Recovered 08/05/2016.http://www.fi sconet.com.br/user/agenda/divisao_4_tabelas_práti-
cas/contabilidade_01_depreciação_bens_ativo_imobolizado.htm
Gomes, P, 2007. Fruticultura Brasileira. 13 edição, São Paulo.Kureski, R., V. M. Moreira., C. P. Veiga and J. R. Aquino, 2015.
Agribusiness gross domestic product (GDP) in the Brazilian region of paraná and, the economic development of its agricul-tural cooperatives. African Journal of Agricultural Research, 10: 4384–4394.
Marion, J. C., 2014. Contabilidade Rural. 14a ed., Atlas, São Paulo.Martins, E., 2003. Contabilidade de Custos. 9a ed., Atlas, São
Paulo.Matos, F. J. A., 2000. Plantas medicinais: guia de seleção e em-
prego de plantas usadas em fi toterapia no Nordeste do Brasil. 2 ed., Universidade Federal do Ceará, Fortaleza, p. 346.
Mazorra, M. F., A. P. Quintana., D. Miranda, G. Fischer and M. C. Valencia, 2006. Aspectos anatómicos de la formación y cre-
704 L. Bendlin, C. O. Senff, C. Kudlawicz-Franco, A. Souza, C. P. Da Veiga and L. C. Duclós
cimiento del fruto de uchuva Physalis peruviana (Solanaceae). Acta Biológica Colombiana, Bogotá, 11 (1): 69–81.
Moreira, V. R., A. Freier and C. P. Veiga, 2016a. A review of con-cepts, strategies and techniques management of market risks in agriculture and cooperatives. International Business Manage-ment, 10: 739–750.
DOI: 10.3923/ibm.2016.739.750Moreira, V. R., R. Kureski and C. P Veiga. 2016b. Assessment of
the economic structure of Brazilian agribusiness. The Scientifi c World Journal, 2016: 1–10.
DOI: 10.1155/2016/7517806Muniz, J, 2011. Sistemas de condução e espaçamentos para o culti-
vo de physalis (Physalis peruviana L.) no planalto catarinense. Dissertação (mestrado), Centro de Ciências Agroveterinárias, Universidade do Estado de Santa Catarina, Lages.
Muniz, J., A. A. Kretzschar and L. Rufato, 2010. Cultivo de Phy-salis peruviana L.: uma nova alternativa para pequenos produ-tores. Jornal da Fruta, Lages, Ano XVIII, 228: 22.
Padoveze, C. L., 2003. Curso Básico Gerencial de Custos. Thomn-son, São Paulo.
Portal do Agronegócio, 2014. Recovered 08/09/2014.http://www.portaldoagronegocio.com.br/artigo/fruticultura-
brasileira-em-analisRego, T. F., A. M. M. Correia., J. A. R. Araujo, J. C. Gurgel and
A. Souza, 2015. Expectativas de retorno e riscos percebidos no agronegócio corante natural de caju. Custos e @gronegócio Online, 11: 370-400.
Revista Globo Rural, 2014. Recovered 08/09/2014. Revistaglo-borural.globo.com/GloboRural/0,6993,EEC1711098-4529,00.html
Rocha, C., A. S. Zembo., C. P. Veiga., L. C. Duclós., C. O. Quan-dt and A. A. Ferraresi, 2015. Knowledge processes and or-ganizational change: a case study in a non-profi t organization. Australian Journal of Basic and Applied Sciences, 9: 292–303.
Santos, D. F., R. C. Santos and A. Catapan, 2014. Administração do Agronegócio no Brasil. 1st ed., CRV, Curitiba.
Secretaria da Receita Federal, 2016. Recovered 05/21/2016.http://www.receita.fazenda.gov.br/pessoajuridica/dipj/2002/per-
gresp2002/pr357a370.htmSouza, A. and A. Clemente, 2008. Decisões Financeiras e Análise
de Investimentos. Atlas, São Paulo.Tomassini, T. C. B., N. S. Barbi., I. M. Ribeiro and D. C. D. Xavi-
er, 2000. Gênero Physalis – Uma revisão sobre vitaesteróides. Química Nova, São Paulo, 23 (1): 47–57.
Valandro, K., M. A. Peroni, N. Kiyota., A. P. S. Villwock and D. Simonetti, 2011. O Impacto das Estratégias de Diversi-fi cação da Renda dos Agricultores: um estudo numa comu-nidade rural. Synergismus Scyentifi ca, UTFPR, Pato Branco, 6 (1): 9.
Veiga, C. P., C. R. P. Veiga, A. Catapan., L. G. N. Veiga, H. T. Kato, U. Tortato and W. V. Silva, 2014. Assortment planning as a strategic tool in the South Region of the Brazilian Retail. International Business Management, 8: 172–182.
Doi: 10.3923/ibm.2014.172.182
Received July, 2, 2016; accepted for printing August, 29, 2016