agribusiness development - texas a&m universityafcerc.tamu.edu/publications/publication-pdfs/mrc...
TRANSCRIPT
RESEARCH REPORT lVRC 86-2
AGRIBUSINESS DEVELOPMENT DUVAL COlJNTY
PHASE I STUDY
----------~----'A'---DEPAR1MEI'....r OF AGRIOJLlURAL E(l)i\(M1CS IN CJX)PERATI ()N" WI 1H VCENfER ~ ECINMIC DEVEWH\.£NT L'NIVERSIT'{ OF TEXAS AT SA\; AN1Ul'HO
TEXAS A&M UNIVERSITY TEXAS AGRICULTURAL EXPERIMENT STATION TEXAS AGRICULTURAL EXTENSION SERVICE College Srallon. -exas
AGRIBUSINESS DEVELOPMENT DUVAL COUNTY, TEXAS
PHASE I STUDY
Prepared by Texas Agricultural Market Research Center
Task Force Comprised of
Texas Agricultural Experiment station Robert E. Branson
H.L. Goodwin John Heleman
Texas Agricultural Extension Service Gordon R. Powell
Robert B. Schwart, Jr. David B. Mellor
Fred D. Thornberry
Department of Agricultural Economics Texas A&M Univerity in cooperation with
Center for Economic Development Uuiversity of Texas at San Antonio
December 1986
THE TEXAS AGRICULTURAL MARKET RESEARCH AND DEVELOPMENT CENTER
An Education and Research Service of
The Texas Agricultural Experiment Station and
The Texas Agricultural Extension Service
The purpose of the Center to be of service to agricultural producers, groups and organizations, as well as processing and marketing firms in the solution of present and emerging market problems. Emphasis is given to research and educational activities designed to improve and expand the markets for food and fiber products related to Texas agriculture.
The Center staffed by a basic group of professional agricultural and marketing economists from both the Experiment station and Extension Service. In addition, support is provided by food technologists, statisticians and specialized consultants as determined by the requirements of individual projects.
Robert E. Branson Coordinator
- ii
Acknowledgements
s research was made possible by a grant from the Texas Department of Community Affairs. Judge Gilbert Uresti and the Duval County Commissioners Court were involved in the initiation of the study. The project was under contract with the Center for Economic Development, University of Texas at San Antonio. The Center is funded by a grant from the U.S. Economic Development Administration.
Appreciation is expressed for the cooperation of the Economic Development Office of Duval County and its staff members Alfredo Gonzales, Presc la Garza and Mary Lee Perez, who assisted in the agribusiness firms survey.
Thanks go also to Morrison Woods of the Center for Economic Development UT-SA, for his support in this project.
Finally credit is due to Janice Clark for her considerable efforts in preparing the report for printing with the assistance of other Department of Agricultural Economics staff members.
- 111
TABLE OF cnNTENTS
Page
Purpose of the study . . . . . . . . . . . . . 1 Eoonomio D9soription of Duval C01.Ulty . . . . . 1 The Economic D9veloprrent Analysis Plan . . . . 6 Alternative AgribusineSs System Opport1.IDities 20 Preliminary Fea.sibility Analysis of Milk ProceSSing in Duval C01.Ulty 21
The Market 22 Operating Costs . . . . . . . . . . . . 25 Employnent Impact . . . . . . . . . . . 26 Startup Costs . . . . . . . . . . . . . 29 Raw Milk Supplies aIXi Procu.reIOOIlt Costs 30 SUmming up Cost . . . . . . . . . . . . 33
Results of the Agribusiness Firms Survey . . 33 Kini or 'IY.J?e of Agribusiness Estahlishnent 35 Where Supply Purchase D3cisions are Made . 35 Geographio Location and 'I'yp3 of Supplier . 39 Trade Area Se:r'VOO. am Business Ex:pansiOIl Plans 45
Egg Production-Marketing . . . . . . . . . . . 47 Egg Production-Marketing Unit . . . . . . 53 Egg Marketing Strategy Requirenents . . . 53 Cost of a Production-Marketing Eco-System 54
Poultry Prcrluction-Marketing . . . . . . . . 55 Market Size and Strategy . . . . . . . . 55 Cost of Production-Marketing Eco-System . 56
'l'hE;! COlTlIIV3rcial utilization of Mesquite as a Revenue Source for Duval County . . . . 58 Type of Crop Growth . . . . . . 60 Number of Trees per Acre 60 Plant Growth cycle . . . . . . 61 Care and Managenent of the Crop 61 Harvesting . . . . . . . . . . 62
Horticultural La.rxiscape Plants . . . 66 The Production-Marketing Systems 66 Costs and Returns Estimate 67
Vegetable Production-Marketing 68 Costs of Prcrluction Entry 71 Marketing Fa.cilities . . 72
- iv
LIST OF TABLES
1
2
3
4
5
6
7
8
9
10
11
12
13
14
15
16
17
Agricultural Primary Incazre Sources Duval County 1980 and 1984 . . . . . . . . 3
Business Firms Summa.ry DuvaJ. County 1972 and 1982 . . . . . . . . . ..... 4
Emp10ynent by Business Category DuvaJ. County, First Quarter 1980 arrl 1986 . . . . 5
Age Distribution of DuvaJ. arrl Jim Wells County Population, 1985 . . . . . . 7
Incazre levels of DuvaJ. COunty ani Te:xa.s Households, 1985 . . . . . . . . . . 7
Population of DuvaJ. and Nearby Counties, 1970 to 1990 . . . . . . . . . . . . 13
Population of IndicatOO Cities-DuvaJ. County and Mjacent Counties ........ . 14
Estimatoo Market Size for Indicatoo Prcxiucts Duval County Primary Market. . . . . . 16
Prcxiuction Output Per U1.y to Equal Market I:emand-Se1ectOO Focxi Prcxiucts . . . . 17
Estimatoo Fluid Milk COn.sumption by Month and Year for Duval COunty Region, 1985 24
Range in Cost Per Gallon for Se1ectOO Account Items, All Fluid Milk Plants, Unitoo States, 1986 27
Costs of Op3rating a Typica.l Small to Me1ium Size Fluid Milk Processing Plant, Unitoo States, 1986. 28
Seasonal Index of caw Milk Prcxiuction .. 32
Location of Firms Surveyed by City. 1985. 32
Kinds of Firms Surveyed in Agribusiness Study for DuvaJ. County, 1986 .... 36
Location of Agribusiness Firm Ownership, DuvaJ. COunty Study, 1986 . . . . . . 37
Kind of Business Managenent, DuvaJ.. County Study, 1986 37
- v
LIST OF TABLES (Cont I d)
18 Where Prcrluct Procurerrent D3cisioIlS are Made, Duval County. 1986 . . . . . . 38
19 Geographio Sources of Purchased Supplies. Duval County Business Establisbnents, 1986 . . . . . 40
20 Geographio Sources of Purchased Supplies, Alice Business Establishments, 1986 ............... . 41
21 'I)rpe of Supplier to AgribusineSS Establishments, Duval County, 1986 . . . . . . . . . . . . . 43
22 Type of Supplier to Agribusiness Establishments. Alice, 1986 ............ . 44
23 Trade Area Servai. Duval COunty Agribusiness Establishments, 1986 . . .. . . . 46
24 Trade Area Servai, Alice Agribusiness Establishments, 1986 . . . . . . . 46
25 Number of Years in Business, Agribusiness Establisb.loonts, 1986 . . . . . . . . . 48
26 Plans for Business Expansion by AgribusineSS Establisb.loonts, 1986 . . . . . . . . . . 48
27 L:iInitations to Business Expansion, AgribusineSS Firms, 1986 . . . . . . . . . . . . . . . 49
28 Kind of Business Expansion Assistance Needed by Agribusiness Establishment, 1986 49
29 Top Ten States in Egg Prcrluction, U.S., 1985 . 52
30 County Areas In£ested with Mesquite and D:msity of Stands, 1973 . . . . . 59
31 Comparisons of Prices Between Mesquite Chips and Charooal, 1986 59
32 Mesquite Stand D:msity . . . . . . . . 63
33 Potential Revenne of Chip Manufacture on Duval County Land . . . . . . . . . 63
34 Annual Eoonomio Benefits of Mesquite Marketing for Duval County Marketing for DLlVal County . . . . . . . . . . . . . . .. 65
- vi -

LIST OF FIGURES
Figure ~e
1 Hens Pullets of Laying Age, Texas, 1980 . 51
2 Texas Commercial Broiler Prcx:luction, 1985 57
- vii

DUVAL COUNTY
AGRIBUSINESS ECONOMIC DEVELOPMENT
PHASE I RESEARCH REPORT
EXECUTIVE SUMMARY
Research Objective
The objective of this research was to provide an overview
analysis of the potential for increasing the economic base in
Duval county. The county previously has not been addressed by
such an analysis. In 1982, a retail trade study was made to
determine the presence of shopping out of the county by Duval
residents. The objective was to establish some indications of
what retail establishments were possibly needed and
recommendations were made for an audit of the existing
establishments to seek ways of increasing their marketing
skills versus outside competitors. Therefore the present
agribusiness study is a further commitment toward seeking the
means of improving the economy of Duval County through
expansion of its agribusiness potentials.
The Research Need
The instructions for this agribusiness analysis as
- V111
provided to the Texas Agricultural Market Research center at
Texas A&M University by the Economic Development Center,
university of Texas at San Antonio may be summarized as
follows.
1. Duval county is recognized as one of the less
developed areas of the state in terms of its record of
economic progress and the prevalence of a relatively high
rate of persistent unemployment. Conditions have been
worsened by the major economic recession, if not outright
depression, in the oil and gas industry and in agriculture
in Texas. These unfavorable developments reflect both
national and international difficulties in these two major
sectors of the overall economy.
2. In view of the economic conditions in Duval County
there is urgent need for the development of expansion of
agribusiness activity where promise of profitability
appears possible. To do so would add to personal and
business incomes in the County and, if properly directed,
should provide increased employment opportunities in the
area.
3. It was indicated that Duval County could qualify
for federal economic development aids for depressed areas.
The greatest need was centered in the central and southern
portions of the county, in the area in and adjacent to the
- IX
city of Benavidas.
4. The question posed was whether a potential existed
for the development of an agribusiness park, as contrasted
to a general industrial park, in the Benavidas area of
Duval County. However, any potential elsewhere in the
county should also be considered and addressed.
The Research Plan
several facets were developed by the Market Research
Center for the research plan.
1. Three field trips were made to Duval County and
the adjacent areas in order to obtain familiarity with the
general economy and the communities involved. In these,
discussions were held with the relevant government
representatives in the Economic Development Office, County
political representatives, the agricultural county agent,
and those in the local U.s. Department of Agriculture office
of the Agricultural Stabilization and Conservation service.
2. A further facet of the field trips was to contact
selected agricultural marketing firms in order to
determine what marketing channels were available to serve
the Duval county area. This involved primarily contacting
- x
firms in Jim Wells, Webb and Nueces counties, where
marketing firms are located in or near the cities of
Laredo, Alice and Corpus Christi. Further contacts were
made in Pearsal (Frio County) and in Uvalde (Uvalde
County) .
3. A review was made of the agricultural production
data for crops and livestock as reported by official
government sources. Present levels as well as trends in
production were evaluated.
4. An analysis was made of population and income
levels and the direction of movement in these in recent
years for Duval, Brooks, Jim Hogg, Jim Wells, Webb,
McMullen and Nueces counties. Data from the Bureau of
Economic Analysis of the U. S. Department of Commerce and
from the ~~~y.§y of ~~yi!:!9. f~~.§~ report of Sales and
Marketing Management were both reviewed.
5. Demand estimates for selected food products in
Duval County and the surrounding areas were prepared. In
these, consumer purchase rates as reported by the National
Consumer Expenditure Surveys of the Bureau of Labor
statistics and the Food Consumption studies of the U. S.
Department of Agriculture were utilized.
6. The expertise of personnel on the research task
- Xl
force for this study was utilized to evaluate several
alternative agribusiness enterprises as to their possible
potential in Duval county.
7. General cost budgets for several potential
agricultural crops were obtained and adapted to conditions
in Duval county.
8. Finally a special survey was made of the
principal agribusiness firms in Duval and Jim Wells
counties. The objective was to obtain a measurement of the
volume of agribusiness products moved through existing
operating firms.
Establishments were surveyed that belonged to the
following ten categories of business:
Fast food establishments
Restaurants
Institutional food services
Grain and feed dealers
Livestock auctions
Farm supply firms
Farm equipment dealers
Food super markets
Drive-in food markets
Food processing establishments
- xii
Research Conclusions
and Recommendations
** Development of any broadly based agribusiness park
in Duval County does not appear feasible, based upon the
findings of this Phase I study overview of the local
area resources, and the market demand that can be
brought to bear in the County.
** The above conclusion, however, does not mean
that Duval County is lacking economic development
opportunities. Several of these are outlined in the
following conclusions. Similarly some are highly
improbable.
** The potential for a small beef slaughter plant is
not favorable because of three negative factors.
1. The major part of the beef retail sales in the area are
through supermarket food stores.
2. Of the supermarket food stores in the immediate or
closely adjacent area, the dominant volume ones are
members of a major food chain. That means that highly
specific quality standards are used in buying dressed
beef. The major food chain in Alice, Texas markets
- X!ll
beef from grain fed cattle, U.S. Choice grade, probably
yield grade 3 or better.
3. Cattle sold from local ranchers are mostly stocker calves or
yearlings and not suited for a beef processing
plant in Duval County. These animals move on to heavy
pastures and to feedlots elsewhere in Texas before going
to a packing plant.
4. Cattle feeding is not generally present in the area.
Therefore slaughter weight fed cattle of 1,000 to 1,200
pounds are not available. Local auctions are markets
for stocker calves going back to ranches and mid-weight
feeder animals going to feed lots. These classes of
animals do not usually provide either competitively
priced beef or the quality needed.
5. The volume of fresh beef sold through retail market
outlets in San Diego, Freer, Benavidas and Alice (Jim
Wells County) is not sufficient to support an
efficient small beef slaughter plant.
** specialized canned, or frozen type, food processing plants
are out of the question. The production base for raw
material supply is not available in adequate supply to
support the large size plants necessary to be competitive
or efficient in present day markets.
- xiv
** Given the foregoing competitive status of Duval County,
it is necessary to consider the possibility of specialized
product processing and marketing that can be keyed to
existing agricultural resources and marketing channels.
Another alternative is have only selected very small,
custom processing facilities that can survive on
the small nearby market demand. Other opportunities than
those are worth consideration and would contribute to an
agribusiness park.
** Duval County presently has watermelon production that has
persisted over a number of years. The Phase I survey
suggests that there is a potential to expand production and
marketing of this product. Interviews with existing
produce marketing firms serving the areas indicate that an
increased supply from Duval County would be desirable.
Producers need assistance on marketing contracts.
Crop production budgets of Texas Agricultural
Extension Service relevant to South Texas indicate that
dryland watermelons can return, on an average over a period
of years, between $130 and $225 net profit per acre.
Irrigated land has the potential of returning $200 to $340
per acre. These figures assume a land return,
additionally, of $30 to $40 per acre. Prices can vary
considerably from year to year. Therefore finances should
be such that success depends not on a single year's
- xv
operations, but rather the average over a period of years.
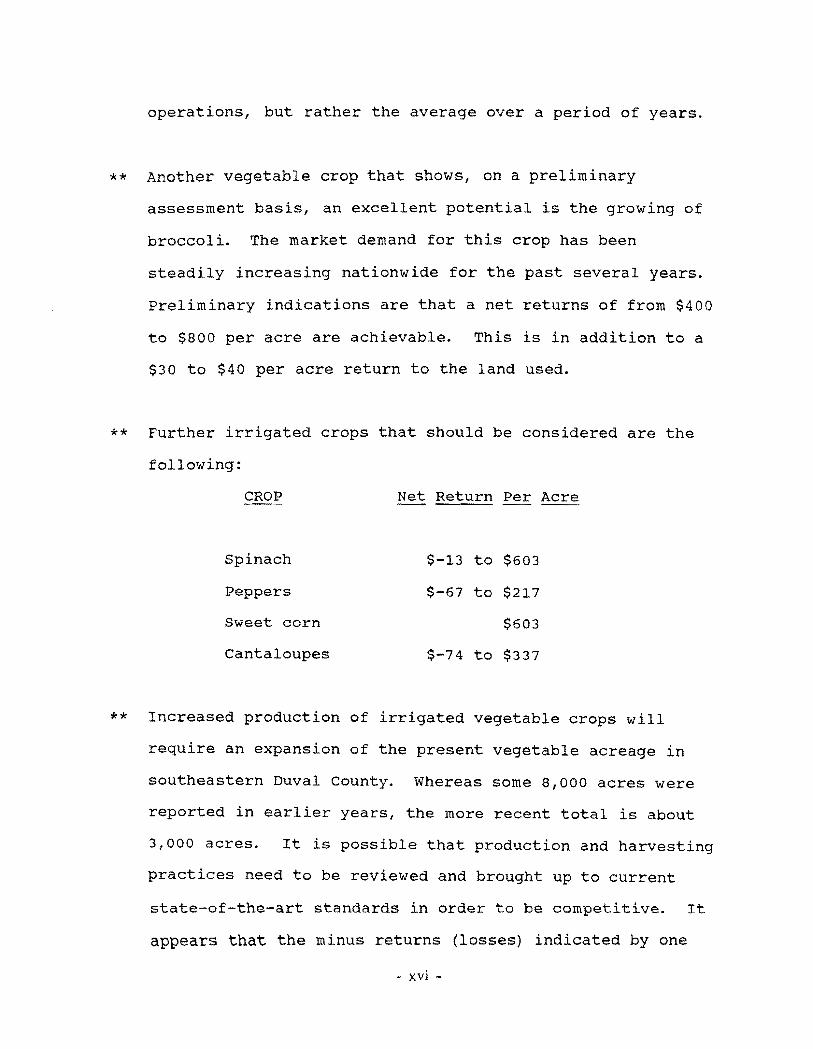
** Another vegetable crop that shows! on a preliminary
assessment basis, an excellent potential is the growing of
broccoli. The market demand for this crop has been
steadily increasing nationwide for the past several years.
Preliminary indications are that a net returns of from $400
to $BOO per acre are achievable. This is in addition to a
$30 to $40 per acre return to the land used.
** Further irrigated crops that should be considered are the
following:
CROP Net Return Per Acre
Spinach $-13 to $603
Peppers $-67 to $217
Sweet corn $603
cantaloupes $-74 to $337
** Increased production of irrigated vegetable crops will
require an expansion of the present vegetable acreage in
southeastern Duval County. Whereas some B,OOO acres were
reported in earlier years, the more recent total is about
3,000 acres. It is possible that production and harvesting
practices need to be reviewed and brought up to current
state-of-the-art standards in order to be competitive. It
appears that the minus returns (losses) indicated by one
- xvi
research source reflect the use of overly conservative
product prices. The upper levels were based on ten-year
price averages, using the latest U. S. Department of
Agriculture reports.
** Budgets for the above crops reflect as nearly, as possible,
currently reported operating costs. These have been
adjusted upward to reflect the cost of newly installed
irrigation systems. Contacts made with Texas Agricultural
Extension specialists and commercial equipment dealers
indicate that a new pivot irrigation system will cost
$60,000 to $80,000. These are designed to be ten inch
wells with eight inch pipe casings capable of irrigating a
quarter of a section of land, or 100 to 125 acres. The
cost of the systems were amortized over a ten year period.
** It is strongly cautioned that none of the above or
following preliminary findings are considered either
sufficiently accurate or complete enough to warrant their
use without a further detailed, in depth production
enterprise study and analysis, such as would be included in
a Phase Two economic feasibility development study.
** Initial estimates of demand for poultry (broilers) were not
favorable to any further consideration as a profitable
broiler production enterprise. However it was subsequently
determined that a broiler growing cooperative has a unit
- xvii
member near Kingsville, Texas. Processing occurs at a
plant outside the area which also serves other cooperative
members. This raises the possibility that a broiler
growing facility tied to that cooperative might be
considered for Duval county.
Market analysis does not show sufficient local or
nearby demand to justify a broiler processing plant. Such
plants are now relatively large scale operations that
require sufficient volume to warrant a full-time federal
inspection crew that inspects each bird and certifies its
food use safety.
Feeding rations are predominantly grain sorghum,
production of which occurs in Duval, and other feed
supplies would be available from Corpus Christi sources.
** An egg production facility has potential and should also be
evaluated. Though an optimum size operation is at least
250,000 hens, size is not as critical as in broiler
processing. The egg production facility would operate its
own washing, grading and packing plant on or near the
premises. The growing population of South Texas and the
more likely possibility of marketing to food chains makes
this worth consideration.
Establishment of a local area brand of fluid milk produced** by a comparatively small, fluid milk only, processing plant
offers another possibility for consideration in Duval
- xviii
county. The sales volume of the local area market, already
served by at least four brands, is not large enough to
support a plant, so market entry and product distribution
would have to be established over a mUlti-county area.
Advertising support would be a necessity in order to
establish and support market entry into Corpus Christi,
Kingsville and Laredo as well as in the local area.
possible sales to military bases in South Texas is another
option. This agribusiness possibility is based on the
current presence of some dairying in Duval County and the
success of similar based enterprises elsewhere in Texas.
** Ranchlands in this portion of the state abound with
mesquite trees, which are an obstacle to grass production
on rangeland. This agribusiness study has determined that
marketing channels are in place and available to harvest
mesquite for the charcoal cookery market nation-wide.
Contract arrangements are necessary between the harvesting
firm and local ranch owners. Future systems of mesquite
production and harvesting are presently being researched.
** Texas sage harvesting, culture and marketing is a
relatively recent development. This plant is a premium
priced item at landscape nurseries and plant retail
establishments. Originally thought not to be
transplantable, this now is not the case. Consideration
should be directed toward harvest of the abundant stock of
- xix
native sage plants in the Duval and nearby county areas. A
wholesale nursery or nursery supply business should be
given consideration for the business park.
Implications for an
Agribusiness Park
** Some of the foregoing agribusiness possibilities are not
well adapted to an agribusiness park concept. However,
several are. Based upon an analysis of the market data
generated in this Phase I study, the following park
location possibilities could be considered.
(1) Fruit and vegetable
packing shed and hydrocooler
(2) Mesquite harvest
assembly and shipping facility
(3) Egg grading and
packing facility
(4) Fluid milk processing plant
Except for the mesquite handling facility, these facilities
- xx
would be utilizing production primarily from the southeastern
section of Duval County. Because of the road network in the
county, development of the agribusiness park in or near
Benavidas or San Diego appears to be a feasible location.
Agribusiness Development
cautions and Problems
** None of the foregoing enterprises should be attempted
without a detailed feasibility study of whichever ones are
selected for further consideration. Detailed feasibility
studies are costly and should not be initiated until the
recommendations in this report are reviewed, discussed and
evaluated in terms of whether there are people, finances, and
sufficient business expertise that could be available, or
possibly obtainable, to assure the success of any of the
selected ventures.
** Capital requirements are sUbstantial for some of the
proposed agribusinesses. preliminary discussions would be
essential to ascertain what funding sources are available and
under what conditions and terms. Insufficient capital to see a
business through the initial years of business development is
one of the major causes of new business failures.
** Some of these marketing facilities are large users of
water and generate a sUbstantial amount of waste water
- XXI
requiring sewage plant treatment. These costly facilities must
be provided for the agribusiness park, or the city must have
such facilities already available.
Employment Impact
** Several economic development possibilities were eliminated
because the market research findings did not indicate
sufficient market potential for their success. Of the set of
possibilities discussed herein, most are more capital intensive
than labor intensive. Consequently the monetary flows
generated are low generators of local employment. Also some,
such as the vegetable (including watermelon) production and
marketing are seasonal in nature. It is strongly recommended
that opportunities for substantial employment be sought in the
manufacturing subcontracting businesses. Thus both
agribusiness and general manufacturing possibilities should be
pursued simultaneously.
- xxii
I
Duval County
Agribusiness Feasibility study
Purpose of the study
It has become increasingly evident that business and
economic development seldom spontaneously happens. Expansion
of the economic base of a city, county, or state, usually
results from intensive analysis, research, preplanning,
promotional and developmental effort. That effort preferably
starts with an audit of the basic resources of the target
area. A target area's resources consist not only of those on
the supply side but also those on the demand side. The purpose
of economic and market research, in these instances, is to
target any existing inefficiencies and missed opportunities in
the optimum coordination of the supply and demand of goods and
services.
The purpose of this particular study is to identify
economic development opportunities for Duval County and the
potential market area it can serve. This is a report for Phase
which is directed at identifying what are considered to be
principal economic development opportunity possibilities. Any
decision to undertake detailed feasibility studies of any of
the specific opportunities would be the task of Phase II, a
further project. Only Phase I was contracted for at this time.
Economic Description
of Duval County
Duval County is located in South Texas about midway between
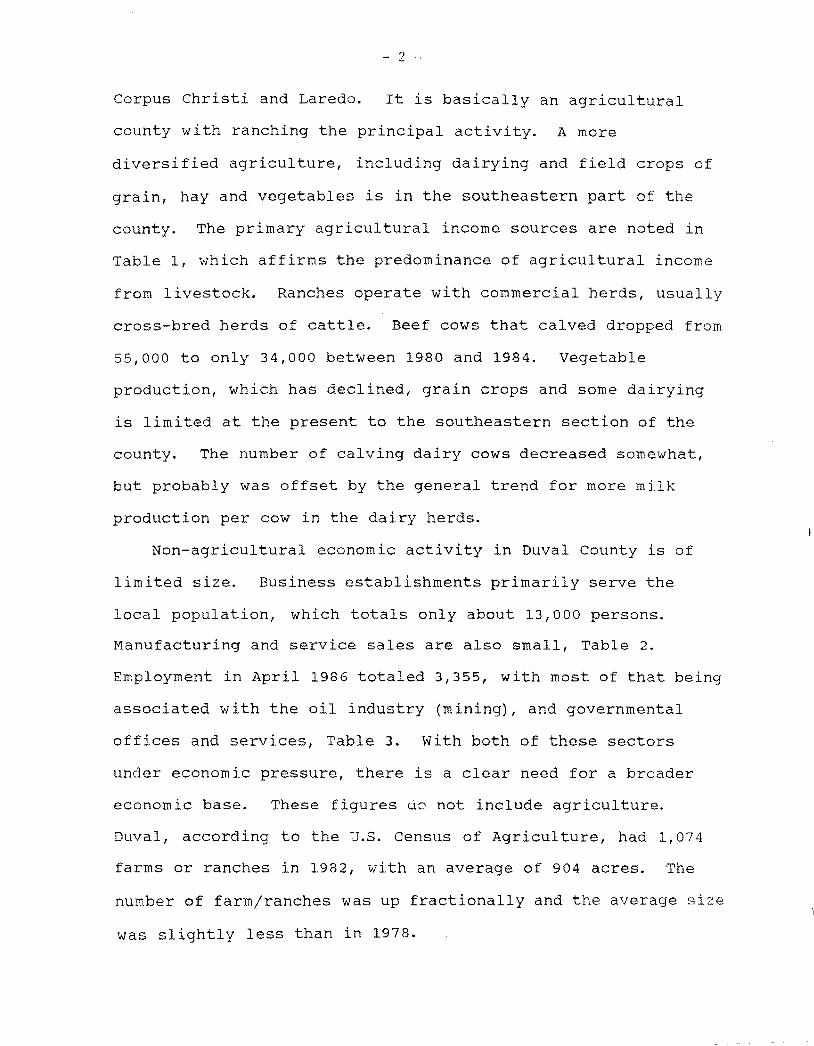
- 2
Corpus Christi and Laredo. It is basically an agricultural
county with ranching the principal activity. A more
diversified agriculture, including dairying and field crops of
grain, hay and vegetables is in the southeastern part of the
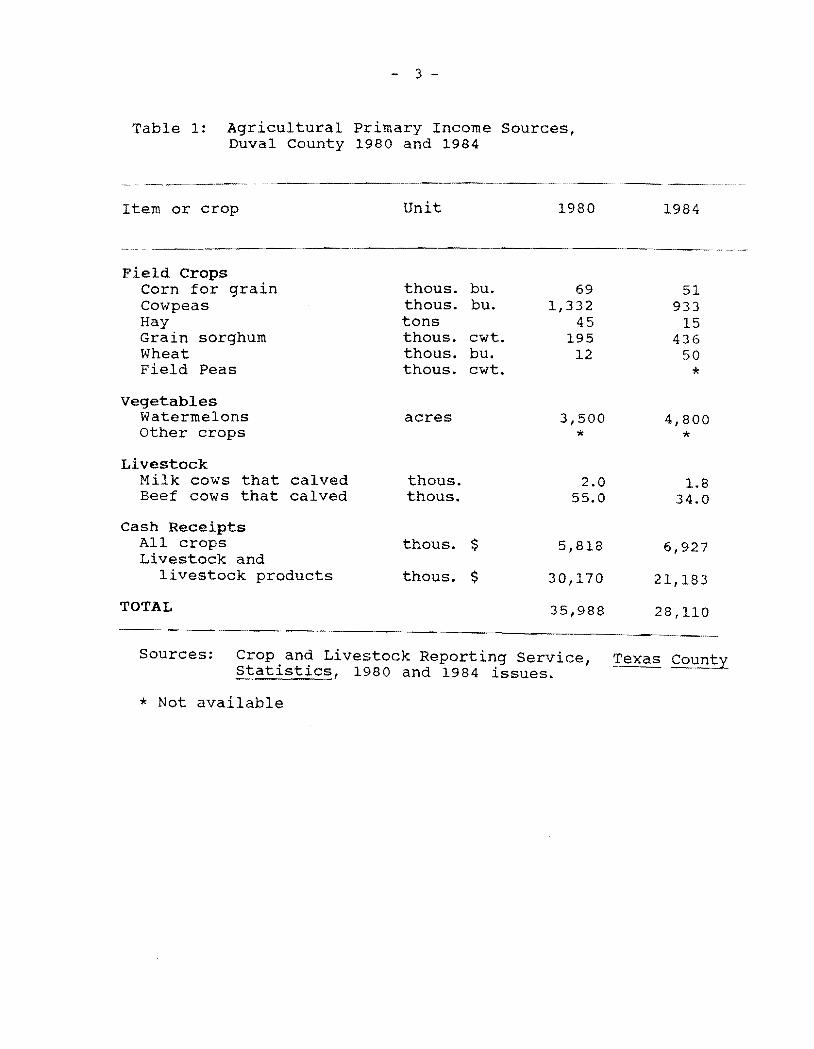
county. The primary agricultural income sources are noted in
Table 1, which affirms the predominance of agricultural income
from livestock. Ranches operate with commercial herds, usually
cross-bred herds of cattle. Beef cows that calved dropped from
55,000 to only 34,000 between 1980 and 1984. Vegetable
production, which has declined, grain crops and some dairying
is limited at the present to the southeastern section of the
county. The number of calving dairy cows decreased somewhat,
but probably was offset by the general trend for more milk
production per cow in the dairy herds.
Non-agricultural economic activity in Duval County is of
limited size. Business establishments primarily serve the
local population, which totals only about 13,000 persons.
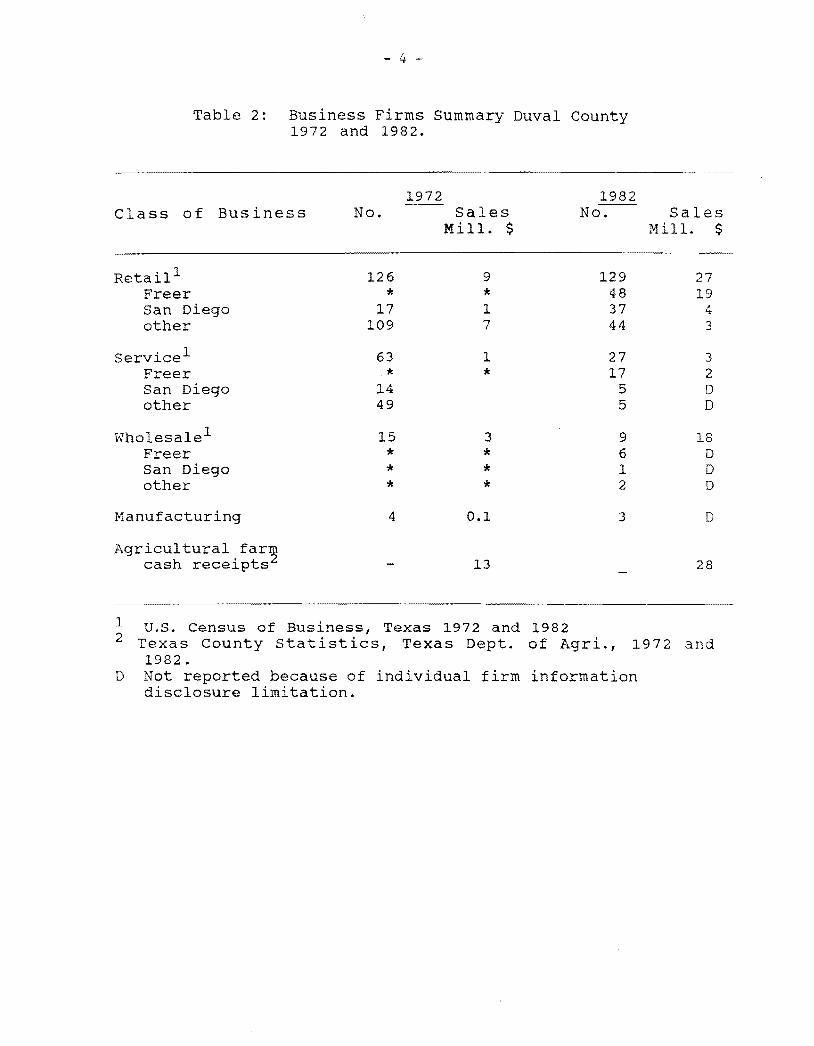
Manufacturing and service sales are also small, Table 2.
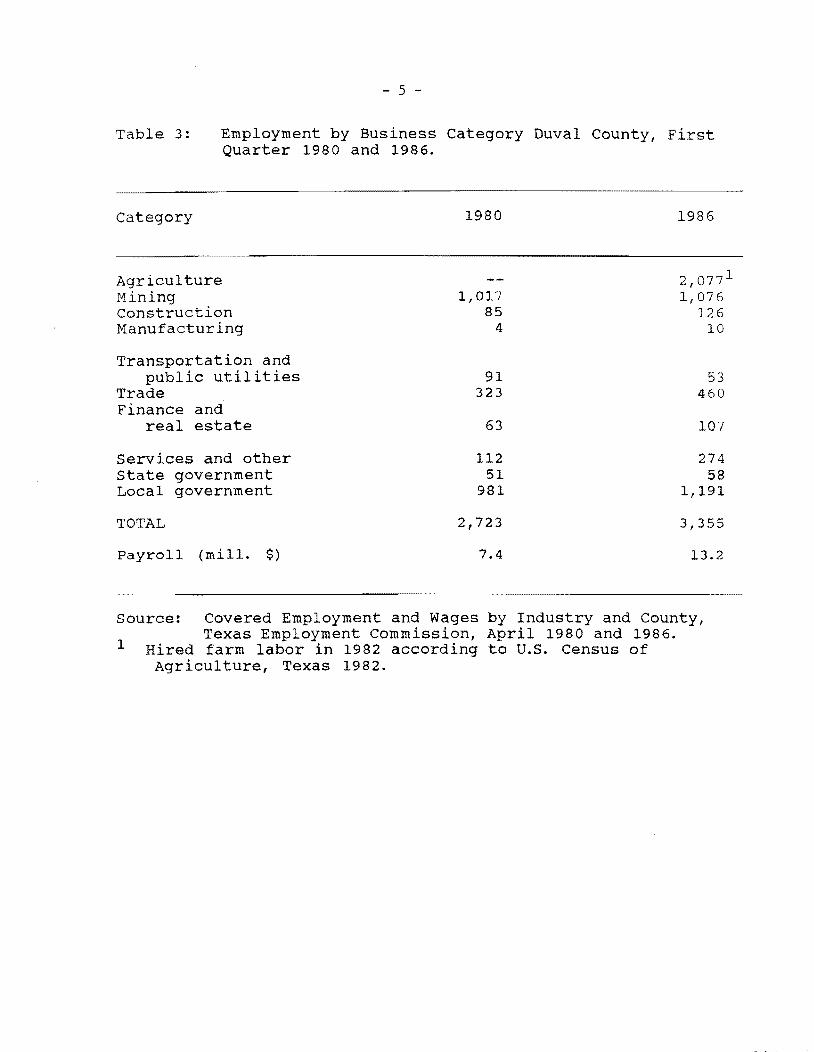
Employment in April 1986 totaled 3,355, with most of that being
associated with the oil industry (mining), and governmental
offices and services, Table 3. with both of these sectors
under economic pressure, there is a clear need for a broader
economic base. These figures ac not include agriculture.
Duval, according to the U.s. Census of Agriculture, had 1,074
farms or ranches in 1982, with an average of 904 acres. The
number of farm/ranches was up fractionally and the average size
was slightly less than in 1978.
3
Table 1: Agricultural Primary Income Sources, Duval county 1980 and 1984
Item or crop Unit 1980 1984
Field Crops Corn for grain Cowpeas Hay Grain sorghum Wheat Field Peas
thous. thous. tons thous. thous. thous.
bu. bu.
cwt. bu. cwt.
69 1,332
45 195
12
Vegetables Watermelons other crops
acres 3,500 *
Livestock Milk cows Beef cows
that calved that calved
thous. thous.
2.0 55.0
Cash Receipts All crops Livestock and
livestock products
thous.
thous.
$
$
5,818
30,170
TOTAL 35,988
51 933
15 436
50
*
4,800 *
1.8 34.0
6,927
21,183
28,110
Sources: Crop and Livestock Reporting Service, Texas Countystatistics, 1980 and 1984 issues.
* Not available
- 4
Table 2: Business Firms Summary Duval County 1972 and 1982.
1972 1982 Class of Business No. Sales No. Sales
Mill. $ Mill. $
Retail 1 126 9 129 27 Freer * * 48 19 San Diego 17 1 37 4 other 109 7 44 3
service1 63 1 27 3 Freer * * 17 2 San Diego 14 5 D other 49 5 D
Wholesale1 15 3 9 18 Freer * * 6 D San Diego * * 1 D other * * 2 D
Manufacturing 4 0.1 3 D
Agricultural far~ cash receipts 13 28
1 u.S. Census of Business, Texas 1972 and 1982 2 Texas County Statistics, Texas Dept. of Agri., 1972 and
1982. D Not reported because of individual firm information
disclosure limitation.
1
- 5
Table 3: Employment by Business Category Duval County, First Quarter 1980 and 1986.
category 1980 1986
Agriculture 2,077 1
Mining 1,017 1,076 Construction 85 126 Manufacturing 4 10
Transportation and public utilities 91 53
Trade 323 460 Finance and
real estate 63 107
Services and other 112 274 State government 51 58 Local government 981 1,191
TOTAL 2,723 3,355
Payroll (mill. $) 7.4 13.2
Source: Covered Employment and Wages by Industry and County, Texas Employment Commission, April 1980 and 1986.
Hired farm labor in 1982 according to U.S. Census of Agriculture, Texas 1982.
- 6
Most of the County is ranchland, which does not offer an
intensive labor use. Hired farm workers, reported in the 1982
Agricultural Census totaled 1,589, or an average of 1.5 persons
per farm/ranch that payroll was slightly over two million
dollars. That averages about $2,000 per year per farm/ranch.
Doubtless some of this is part-time, seasonal employment.
Unemployment in Duval County as of July 1986 totaled 1,067
persons according to the Texas Employment Commission, or 16
percent of the labor force. It is the hope of those interested
in the establishment of an agri-business park that such a
development would help provide relief from this high
unemployment situation. Agricultural prices have generally not
been favorable in recent years in comparison to production
costs. Therefore the Duval County agricultural and oil
resources are both operating in badly depressed markets.
Because of the lack of sufficient economic development and
employment opportunities, the population in Duval County
reflects a below average percentage of persons in the younger
age groups and a higher than average among older age levels
compared with state averages, Table 4. The adjacent Jim Wells
County has a more developed, balanced economy because of the
greater diversity of activity in Alice, its principal city.
The imbalance of the Duval ece .lCTI1Y is also reflected in more
households having lower incomes than the State as a whole,
Table 5.
The Economic Development Analysis Plan
This Phase I preliminary market and economic analysis is
- 7
Table 4: Age Distribution of Duval and Jim Wells County Population, 1985
Age Level Duval Jim Wells Texas
- percent of households
18-24 10.1 10.8 12.5
25-34 13.1 15.6 18.3
35-49 15.8 17.3 18.6
SUb-total 39.0 43.7 49.4
50 & over 28.4 23.4 22.5
Source: 1986 Survey of Buying Power, Sales and Marketing Management.
Tab1/? 5: Tnr.nmp T,pvpl s; of nuv~l county and Texas Households, 1985
Income Level Duval Texas
Thous. $ - percent of households -
10-19 23.0 22.7
20-34 23.3 26.3
35-49 12.0 16.4
50 & over 8.0 15.2
Source: 1986 Survey of Buying Power, Sales and Marketing Management.
- 8
designed as a three sector analysis. The three sectors are
identified as follows:
1. An overview of the size of the principal agribusiness
product markets in and near Duval County.
2. A survey of agribusiness firms in the area.
3. A search for new business concepts that appear to have
promise for fitting the resource and/or market base
in and near Duval County.
The procedure for the first sector involves basically
matching the population of the principal market areas and its
economic demographics with products purchase rates associated
with the relevant income levels in the repective markets.
Purchase rates of most consumer products are directly
responsive to household income levels. Purchase rates by
income level reported in the Bureau of Labor Statistics'
national Consu~er Expenditure Survey and in the Food
Consumption study of the u.s. Department of Agriculture were
used as the principal data sources. In this preliminary study,
only average household incomes were used for the respective
county or city markets. Development of estimates by individual
income classes at this stage is not warranted. That 1S
deferred to whatever specific feasibility studies may be made
for individual agribusiness er~~rprises, as a follow-up to this
study.
Household income data were obtained from several sources.
principal reliance was on the reports of individual County
income levels from the Bureau of Economic Analysis of the U.S.
- 9
Department of Commerce. BEA income estimates include both cash
and income in kind. Estimates on a county by county basis are
prepared by BEA on a year by year basis.
Decisions in this study also were required as to the
geographic markets to be considered as a sales outlet for any
expanded or new Duval agribusinesses. Relevant market areas
vary by kind of product, because the competitive environment
changes by product and/or product class. However, Duval
County's location clearly makes the primary intital market that
within Duval and its immediately adjacent counties. Analyses
therefore were directed mostly to the following set of
counties: Duval, Brooks, Jim Hogg, Jim Wells, Webb, and
McMullen. Secondary markets outside these counties are Corpus
Christi (Nueces County), Kingsville (Kleberg County) and San
Antonio in Bexar County. For some products, national markets
were considered to be relevant.
The field survey conducted under objective two was directed
primarily toward agribusiness firms within Duval County, and
those in the city of Alice (Jim Wells Co.). Alice, population
of about 20,000, is only ten miles from San Diego, the county
seat of Duval County. Firms selected for the survey were
identified through the current business directory listings
within relevant telephone directories.
A questionnaire was designed to obtain information
concerning the ?rincipal products purchased and/or sold by the
local establishments. Another purpose was to obtain additional
estimates of the size of the market for agricultural products,
10
as well as farm and ranch production inputs. Additionally,
attitudes were obtained with respect to what may be limiting
business volume expansion. The Market Research Center's
experience from previous studies is that internal or external
needs required to expand operations are often either not
available or clearly recognized by agribusiness managers.
Results of field survey questionnaires were coded and
computer entered, as well as being subjected to personal staff
evaluation and analysis.
Establishments surveyed were divided into the following
primary categories.
1. Retail supermarkets and general food stores.
2. Drive-in food markets.
3. Restaurants.
4. Fast food - American menu.
5. Fast food - Hispanic menu.
6. Food processors.
7. Farm supplies.
8. Farm equipment and repairs.
9. Grain, feed and seed dealers.
10. Livestock auctions.
11. Institutional food service.
All eligible businesses WBrc surveyed in Duval County,
which included those in San Diego, Freer and Benavidas. A
sample of the establishments was surveyed in Alice. A listing
of the eligible businesses in Al ice was prepared based on a
complete listing of firms under any related commercial category
- 11
listing in the 1986 directory. A probability sample of firms,
by category, was selected using a computerized random number
generator.
The main focus of the agribusiness firms survey was to
identify those marketing products that can feasibly be produced
and processed in Duval County. The field survey interviews
were designed and implemented under the direction of the Texas
Agricultural Market Research Center staff. Interviewing was
conducted by the staff and members of the Economic Development
Office of Duval County. A copy of the survey questionnaire
appears in the appendix of this report.
The categories of products or product lines considered were
as follows.
Food Category
1. Beef processing
2. Poultry processing
3. Egg processing
4. Bread processing
5. Ice cream processing
6. Fruit and vegetable packing house
7. Hispanic food processing
8. Milk processing
9. Vegetable processing, canned or frozen
10. Candy processing
11. Flour processing or milling
- 12
Non-Food category
1. Mesquite wood for barbecuing
2. Floriculture and landscape supplies shipping
facility
Farm Supply Category
1. Feed, seed and fertilizers
2. Farm and ranch equipment and repair
3. Farm and ranch supplies
The prospects for an agribusiness firm for most of these
products condidered is heavily dependent upon the size of the
local primary market. Insofar as Duval and the local counties
is concerned, it is important to consider population growth
trends. Presence of population growth makes ease of entry less
difficult since competition with existing firms over time would
be less of a problem.
From a product processing and marketing standpoint, the
population of all of the counties excluding Webb County and
Nueces County, does not represent a very significant market,
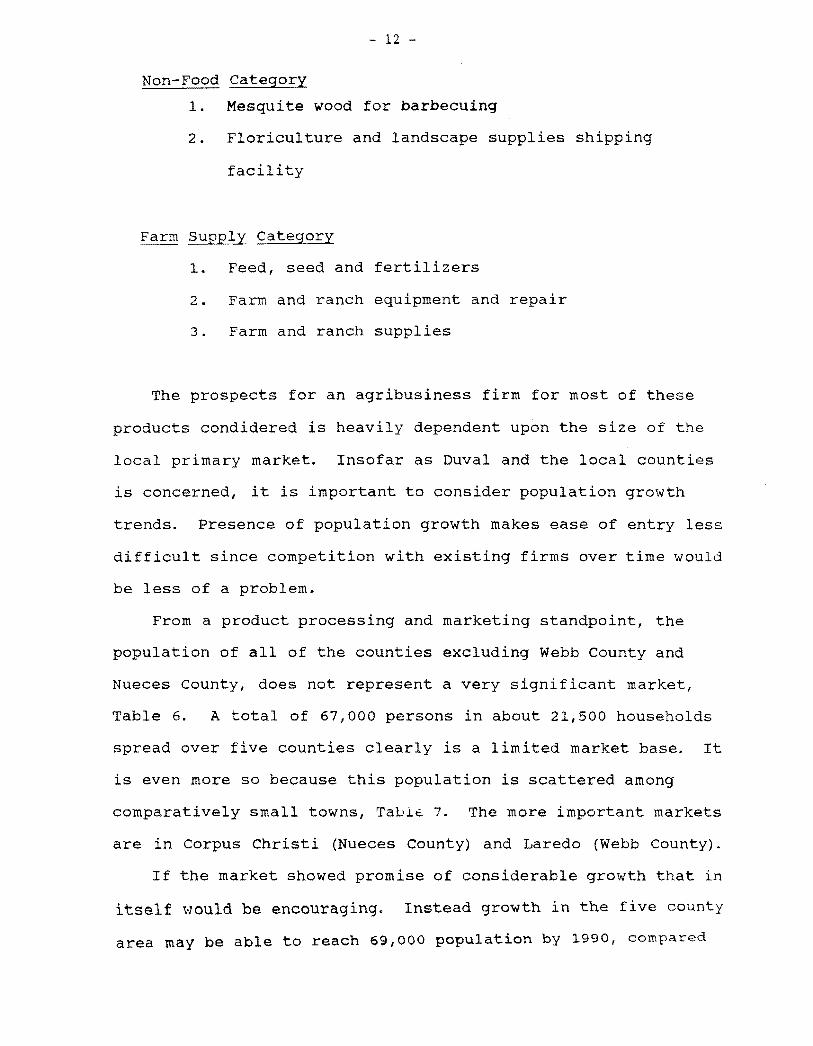
Table 6. A total of 67,000 persons in about 21,500 households
spread over five counties clearly is a limited market base. It
is even more so because this population is scattered among
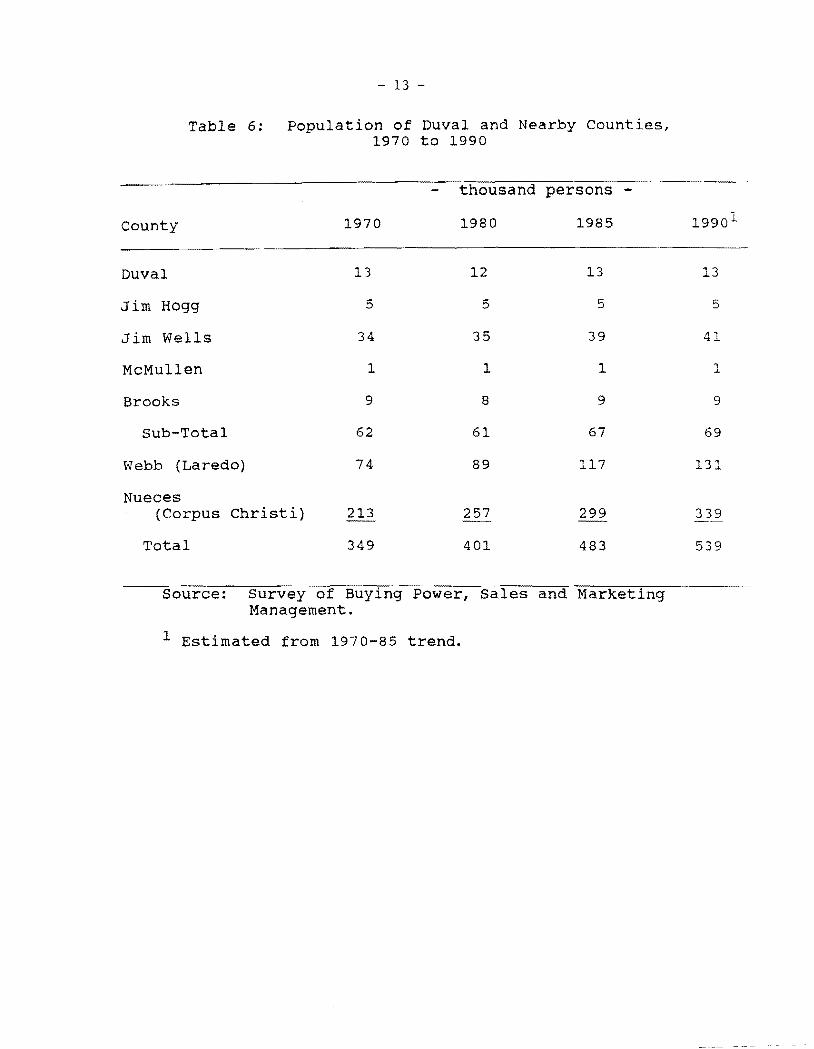
comparatively small towns, TaLl~ 7. The more important markets
are in Corpus Christi (Nueces County) and Laredo (Webb County).
If the market showed promise of considerable growth that in
itself would be encouraging. Instead growth in the five county
area may be able to reach 69,000 population by 1990, compared
- 13
Table 6: population of Duval and Nearby Counties, 1970 to 1990
persons
County 1970 1980 1985 1990 1
Duval
Jim Hogg
Jim Wells
McMullen
Brooks
Sub-Total
Webb (Laredo)
Nueces (Corpus Christi)
Total
13
5
34
1
9
62
74
213
349
12
5
35
1
8
61
89
257
401
13
5
39
1
9
67
117
299
483
13
5
41
1
9
69
131
339
539
Source: Survey of Buying Power, sales and Marketing Management.
1 Estimated from 1970-85 trend.
14 -
Table 7: Population of Indicated cities Duval County and Adjacent Counties
city 1970 1980
persons
San Diego 3.8 4.3
Freer 2.8 3.3
Benavidas 1.8 2.0
Alice 20.1 20.8
1Hebronville 4.6* 4.9
Premont 3.3 3.0
Sub-Total 36.4 38.3
Laredo 69.0 91.3
Corpus Christi 204.5 230.7
Kingsville 28.9 28.8
Total 338.9 38.91
rource: U.S. Census of Population, Prelim Reports North division, Jim Hogg County
* Estimate
- 15
to 62,000 twenty years earlier, Table 6. Clearly any potential
for agribusiness development in Duval County is strongly
dependent upon serving Laredo and Corpus Christi, cities that
have a good growth record.
In order to be reasonably conservative, it appears best to
simply use the current size of the Duval County market and
determine what agribusinesses have any prospect of success.
Taking into consideration the per capita consumption average of
the Western Region of the United states and adjusting these for
(1) local income levels, and (2) national trends in per capita
consumption, market size estimates by product were made.
The list of agribusinesses in the food, non-food and farm
supply categories were reviewed against the size of the five
county market. In all cases, the market proved to be far too
small to support a business that would be large enough to be
reasonably competitive. This is clearly evident from the
market demand estimates presented in Tables 8 and 9.
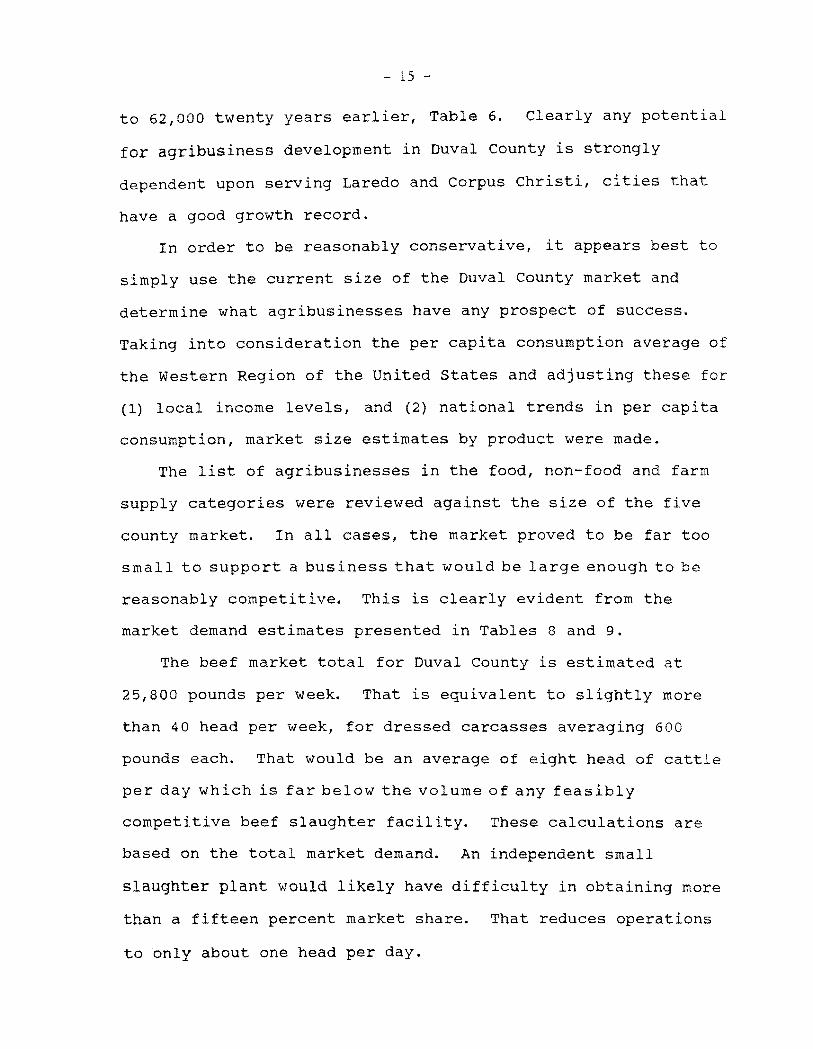
The beef market total for Duval County is estimated at
25,800 pounds per week. That is equivalent to slightly more
than 40 head per week, for dressed carcasses averaging 600
pounds each. That would be an average of eight head of cattle
per day which is far below the volume of any feasibly
competitive beef slaughter facility. These calculations are
based on the total market demand. An independent small
slaughter plant would likely have difficulty in obtaining more
than a fifteen percent market share. That reduces operations
to only about one head per day.
- 16 -
Table 8: Estimated Market Size For Indicated Products Duval County Primary Market
-
Product unit Total Market Duval 4-County1
----_._--_..._
Probable Market Share 4-County Area
% Quantity .. _._._..
Beef lbs. 25,800 124,800 15 18,720
Milk gals 10,700 57,200 15 8,580
Chicken lbs. 9,000 40,700 15 6,105
Eggs doz. 5,800 26,900 20 5,380
Bread Ibs. 7,800 39,600 10 3,900
Ice Cream gals. 1,100 5,200 20 1,000
Cornmeal lbs. 3,300 16,800 20 3,400
1 Duval, Brooke, Jim Hogg and Jim Wells
- 17
Table 9: Production Output Per Day to Equal Market Demand Slected Food Products
Product Duval Four county Market Total Market Share Per oay2
Beef lbs. 1Carcasses
Milk gal.
Chicken lbs. Birds
Eggs doz.
Bread lbs.
Ice Cream gals.
Cornmeal lbs. 5 lb bag
25,800 43
10,700
9,000 3,300
5,800
7,800
1,100
3,300 660
18,720 31 6
8,580 1,700
6,100 2,200 440
5,380 1,7703
3,900 780
1, 000 200
3,400 680 680 136
1. a . carcass 2. 5 day week 3. 7 day week
- 18
The above analysis clearly demonstrates why small markets,
population-wise, do not have their own food processing plants.
There simply is not enough product demand there to sustain
them. As a consequence, food processing plants generally must
serve multi-county, if not mUlti-state markets. Given that
requirement, plants are usually built to take advantages of
economies of scale so that any other competing plant cannot
have a lower cost per unit of product output.
What are known as economies of scale are inherent in the
nature of the equipment needed to do the food processing.
Economists sometimes illustrate this point with the example of
a steam boiler to provide steam for cooking or cleaning
operations. A medium size boiler can produce steam at a lower
cost per unit than a small one, simply because of physical
advantages of the larger one. For example, as you double size
you quadruple the capacity.
The next step is to consider market demand in a larger
area. The demand in Duval plus Brooks, Jim Hogg and Jim Wells
was examined as an alternative and will be referred to as the
Duval primary market. It is selected in order to determine
what market demand can be tapped without having to go into
either the Laredo (Webb County) or Corpus Christi (Nueces
County) markets. Results are ~lesented in Table 8. Beef total
demand increases to an estimated 124,800 pounds. Initially it
would be diff icul t to obtain more than a 15 percent share of
this larger market, which means the total would be about 18,000
pounds. As may be seen in Table 9, that is equal to only 31
- 19
head of cattle per week, or a kill of six head per day. This
can be feasible for the operation of a custom slaughter
facility where customers bring in cattle for dressing and cuts
prepared as they direct. Some retailing is feasible if a
butcher shop is operated on the premises. However, any beef
retailed has to be from carcasses that have been federally
inspected. That is accommodated by arranging the processing of
those animals all in one day and paying a federal inspector to
be there and approve the carcasses and the plant sanitation
operations. A federal inspectors transportation plus time on
the job must be paid for each inspection visit. An inspector
likely could be sent from Corpus Christi.
But the foregoing does not provide the kind of operation
that can be expected to wholesale meat to retailers. If any
employment impact is to be achieved, it must come from a
commercial size plant that is prepared to deliver product to
its customers.
Based on the foregoing preliminary market analysis, it is
evident that only a small, mostly custom, slaughter facility
could be considered in Duval County at this time. Only a
limited quantity could be wholesaled to retail stores,
restaurants or any general public customers. Even the
investment in this small facility would likely be between
$150,000 and $200,000. Investment in a plant to have a kill
rate of about 170 head per week can range between $350,000
and $500,000 (Farris).
Examination of the market share volume for the other
- 20
foods listed in Table 9, also discloses that the four-county
primary market is below minimum volume requirements for
support of a reasonable size processing plant. Again only a
custom service type of establishment might operate, that does
not have a sales force nor delivery costs.
ALTERNATIVE AGRIBUSINESS
SYSTEM OPPORTUNITIES
Because the primary market surrounding Duval County is
not large enough to support other than very small custom
service firms, it is necessary to look at alternative
possibilities. In other words, the question that arises is
whether new agribusiness eco-systems can be developed and
literally inplanted, as it were, in Duval County?
As noted at the outset of this report, the geographic
market required to sustain a competitive agribusiness plant
varies with the individual product. In considering eco
systems that can be implanted into Duval County, the market
area involved is either South Texas, Texas, the Southwest
Region or the U.S. market. The relevant one will be
indicated in the individual eG~-8ystem analysis.
The reason for using the term aco-system is because three
components are necessary to make the operation viable -- (1)
the raw material production base, (2) the processing facility
and (3) an available marketing channel system through which the
- 21
output can be profitably moved. With this concept in mind, a
somewhat detailed example is presented based on building a milk
production, processing and marketing system as a further
enlargement of the present dairying farms in Duval County.
Preliminary Feasibility
Analysis of Milk Processing
in Duval County
According to the 1984 Texas County statistics report from
the Texas Agricultural statistician's office in Austin, there
were about 2,000 dairy cows in Duval County in 1984. Milk
from these dairy herds is going primarily to the Rio Grande
Valley processing plants, according to reports from Duval
County. It is upon this base that it is suggested and
proposed that a dairy product production-processing-marketing
eco-system might be built.
It must be clearly understood that the following general
analysis is not in any way, a fully developed economic
feasibility study. Therefore no one should take this as a
signal to do any more than consider whether a final
feasibility study would be warranted.
The retail dairy product market is extremely competitive.
Fluid milk marketing can be easier to enter than for ice cream
or other produ:t sales. These other products require
considerably more market development in terms of (1)
establishing product characteristics that are acceptable to
- 22
consumers in the market, (2) maintaining product consistency in
the manufacturing processes and (3) in achieving brand
recognition in the market.
Because of the competitive nature of the dairy product
market probably the most logical kind of dairy processing plant
to consider is a fluid milk bottling plant. Such an operation
would produce a limited line of beverage milk products such as:
1. Homogenized whole milk
2. Low fat milk
3 . Skim milk
4. Buttermilk
5. Chocolate flavored milk product whether a whole milk
product or a low fat or skim product
As expertise and market share develop, it may be possible to
produce additional products such as half and half cream,
cottage cheese and ice cream. Some local fluid processing
plants buy aseptically packaged half and half products, sour
creams, coffee creamers, whipping cream and other fluid
specialty products from firms that specialize in aseptic
products. In addition these plants may buy packaged ice cream,
cheese or butter. This strategy allows the smaller milk
processor to offer clientele a full line of products without
investing the resources or acqLlring the expertise necessary
to produce these.
The Market:
There are approximately 612,000 people living in the
- 23
counties that are within 50 miles of Benevidas in Duval County.
No current data are available on fluid milk consumption in the
13-county area. However, using the 1977 USDA Consumer Survey
data, an estimate was made of total fluid (beverage) milk
consumption patterns, Table 10. Normally, consumption is
lighter in the summer months.
An inventory of milk processing capacity within a 150
mile radius of Duval Co. indicates a more than adequate
beverage milk supply to meet the 13-county area demand.
Furthermore, regional supermarket chains with stores in the
area will process their store label in their own plants and
bring it into the region. It is quite common for packaged milk
products to move as much as 400 miles from the point of
processing to a retail outlet. Often times the processed milk
is delivered to a central receiving warehouse owned by a chain
store. The chain then uses its own facilities and distribution
equipment to distribute the milk to its retail outlets.
Eight fluid milk processing plants are located within a
150 mile radius of Duval County. These plants process an
estimated combined total of from 5 million to 7 million
gallons of fluid milk per month. Much of this milk is
consumed in other areas of Texas. Some of this milk moves as
far north as Bryan, Texas. Much of this fluid milk moves
through supermarket chain stores. This milk is sold under
several brand n~mes. At least two are supermarket labels,
one is a local label, and at least two are national labels.
One national supermarket in the market area processes its own
- - - - - - - - - - - -
- 24
Table 10: Estimated Fluid Milk Consumption by Month and Year for Duval Co. and the thirteen county Region, 1985.
Month Duval Co. 13 Counties
January 46 2,120 February 46 2,120 March 43 2,000 April 43 2,001 May 44 2,024 June 39 1,786 July 4:2 1,929 August 4:3 2,001 September 43 2,001 October 4:6 2,120 November 45 2,048 December 43 1,977 Annual 524 24,126
..~-.-
- 25
brand label in Dallas. One of the other supermarket labels
sold in one of the locally controlled food stores 1S processed
in either San Antonio or Corpus Christi by one of the
national brand processors under contract. Another processor
in the area markets most of its fluid product through its own
convenience stores, hotels, restaurants, institutions, and
other mass food distribution outlets. A new processing plant
in the area would likely have to concentrate on marketing to
locally owned supermarkets and convenience stores. Entry
into the retail stores owned by either regional or national
chains may be difficult.
A review of processing plants in other areas of Texas
suggests that a local independent processor selling under its
own brand label can probably expect, at best, only about a 15
percent share of the market. A similar study in North
Carolina (Knutson) suggests a local processor can expect, at
the worst, 2 percent, and at best a 20 percent market share
An average of about 15 percent is obtained in its well
established markets. If a processing plant in Duval Co. were
to capture 15 percent of the market in the 13-county area, it
would be processing about 302,000 gallons a month. Allowing
for normal product waste output, this means a run of about
310,000 gallons a month,
Operating Costs '.
Current cost data indicate that the cost of operating
a milk processing plant does not change dramatically over a
- 26
wide range of capacities. The average cost per gallon over
all sizes of plants is about 33 cents per gallon, excluding
raw milk cost. The range in operating costs varies from a
minimum of 19 cents/gallon to a maximum of 52 cents/gallon.
For a typical small to medium size plant, the cost is about
35 cents. This does not include sales force or distribution
costs. Distribution costs would likely be about 11
cents/gallon, based on the assumption the average milk route
is 200 miles long and the truck has a capacity of 30,000
pounds of milk, excluding the weight of cartons and cases.
These costs do not include sales commissions or other sales
expenses, they only include truck and driver costs.
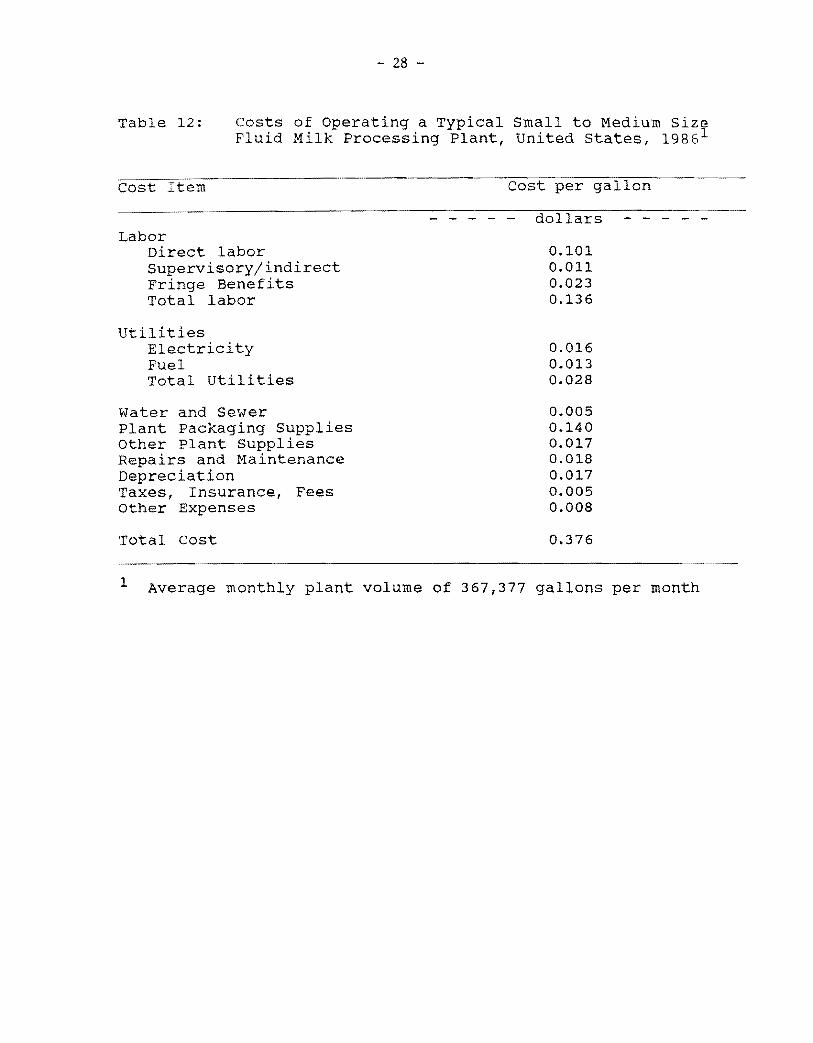
Although the costs in Table 12 are averages for the
United states, they have been varified as representative of
the costs of processing fluid milk in Texas.
Employment Impact
The typical small to medium processing plant illustrated
in the accompanying table would employ a total of 12 to 16
people. Plant and milk cooler operations would require about
8 or 9 people. A minimum of two supervisory personnel would
be required to operate the plant. The plant functions
include receiving and storing ra~ milk, clearifying,
separating, homoginizing, pasturizing, standardizing, and
filling, shipping case sort and storage, returned and damaged
product disposal, and clean up. In addition, the plant would
require an engineer and maintenance man, and quality control
- 27
Table 11: Range in Cost per Gallon for Selected Account Items, All Fluid Milk Plants, United States, 1986.
Cost Item Cost per gallon average minimum maximum
Labor Direct labor Supervisory/indirect Fringe Benefits Total labor
utilities Electricity Fuel Total utilities
Water and Sewer Plant Packaging Supplies other Plant Supplies Repairs and Maintenance Depreciation Taxes, Insurance, Fees Other Expenses
Total Other
Total Cost
0.083 0.015 0.025 0.123
0.014 0.014 0.028
0.004 0.122 0.012 0.015 0.018 0.004 0.004 0.179
0.330
0.052 0.001 0.011 0.064
0.006 0.004 0.010
0.0001 0.0979 0.0043 0.0060 0.0077 0.0002 0.0002 0.117
0.190
0.097 0.014 0.034 0.145
0.019 0.019 0.038
0.007 0.216 0.025 0.026 0.042 0.009 0.009 0.334
0.517
1
- 28
Table 12: Costs of Operating a Typical Small to Medium Size Fluid Milk Processing Plant, United states, 1986 1
Labor Direct labor Supervisory/indirect Fringe Benefits Total labor
Utilities Electricity Fuel Total utilities
Water and Sewer Plant Packaging Supplies Other Plant Supplies Repairs and Maintenance Depreciation Taxes, Insurance, Fees Other Expenses
Total Cost
0.101 0.011 0.023 0.136
0.016 0.013 0.028
0.005 0.140 0.017 0.018 0.017 0.005 0.008
0.376
Average monthly plant volume of 367,377 gallons per month
- 29
and laboratory personnel. At least two of the plant
operations people should be skilled in stainless steel
techniques, including welding. The cooler operation would
require three people to handle product in and out of the
cooler. Allowance must be made in personnel numbers to cover
vacations. In smaller plants, plant operating personnel are
trained to interchange among the various processing tasks
required in operating the plant. A minimum of two people
would be required to perform clerical and secretarial tasks
related to the milk processing operations. These personnel
totals do not include sales staff or distribution staff.
Labor costs associated with the processing operations
essentially become fixed because a processing machine
requires an operator whether or not milk is processed or the
machine is operated at capacity.
startup costs:
startup plant costs will vary, and it is very difficult
to get solid cost estimates when new construction is
involved. These estimates are based on conversations with
people who are familiar with milk processing but who have not
been associated with constructing and operating a new
facility. It is estimated that the cost of a typical small to
medium plant will vary from about 2.5 to 7.0 million dollars
for a plant wit~ a capacity of 380,000 gallons a month. The
plant would be constructed with 25% excess capacity. Costs are
calculated on the plant processing 310,000 gallons milk. Of
- 30
that total, the milk processing equipment required is estimated
to make up about 50% of the cost and the land, physical plant,
and mechanical equipment such as electrical hardware,
refrigeration, heating, air conditioning and other non-milk
related equipment would make up the other 50%.
Because of the nature of food processing, the processing
equipment is normally revamped or replaced on a regular
basis. According to conversations with processors, the
typical milk processing firm depreciates the plant building
over 30 years and mechanical and milk processing equipment
over 10 years. It is estimated that the depreciation costs
figure presented above will have to be increased about $.044
per gallon to cover the depreciation of the higher cost for
new construction and milk processing and mechanical
equipment. A minimum of 5 straight trucks equipped with
refrigerated bodies would be needed to deliver the daily
output of the plant. It is estimated that these trucks would
cost a total of $350,000. The depreciation on the trucks is
included in the cost of milk sales distribution.
Raw Milk ~lies and Procurement Costs
USDA estimates indicate there are about 2000 milk cows in
Duval Co. These cows produce a~~ut 92.9 gallons a month,
according to the USDA estimates. This level of production
per cow in the South Texas area suggests about 3300 cows
could meet the monthly milk needs of the plant. Seasonal
demand surges and seasonal production declines occur
- 31
together, Table 13. To compensate about 3500 cows would be
needed to meet plant needs during cow production slumps.
There are an estimated 2900 milk cows in Jim wells Co. Duval
and Jim Wells Counties together produce an estimated 5.4
million gallons a year. While these data indicate an ample
supply of raw milk available in the area, just one of the
existing plants within 60 miles of Duval Co. can process 81
percent of the production in the 15 county crop reporting
district containing Duval and Jim Wells Co.
Most of the milk processed in South Texas plants comes
from the north and central areas of Texas. Much of the milk
produced in South Texas is marketed by producers through the
two producer cooperatives in the area. The remaining
producers market directly to processors. competition between
cooperative and independents for producer milk is strong in
the region. While a new entrant in this market could buy
milk directly from non-cooperative affiliated producers, it
will likely purchase its milk from a cooperative. The
cooperative can offer balancing services and may prove
attractive as a shield against direct competition for raw
milk. Nevertheless, at current prices, raw milk from any
source will cost a minimum of $16.11 per cwt., about $1.387
per gallon. Since the processing plant will be selling all
of its finished product in the local area, it will be
regulated by Federal Milk Marketing Order 126. The Order
sets the minimum raw milk price the firm will pay. The
minimum order price in the area for raw milk for beverage use
- 32
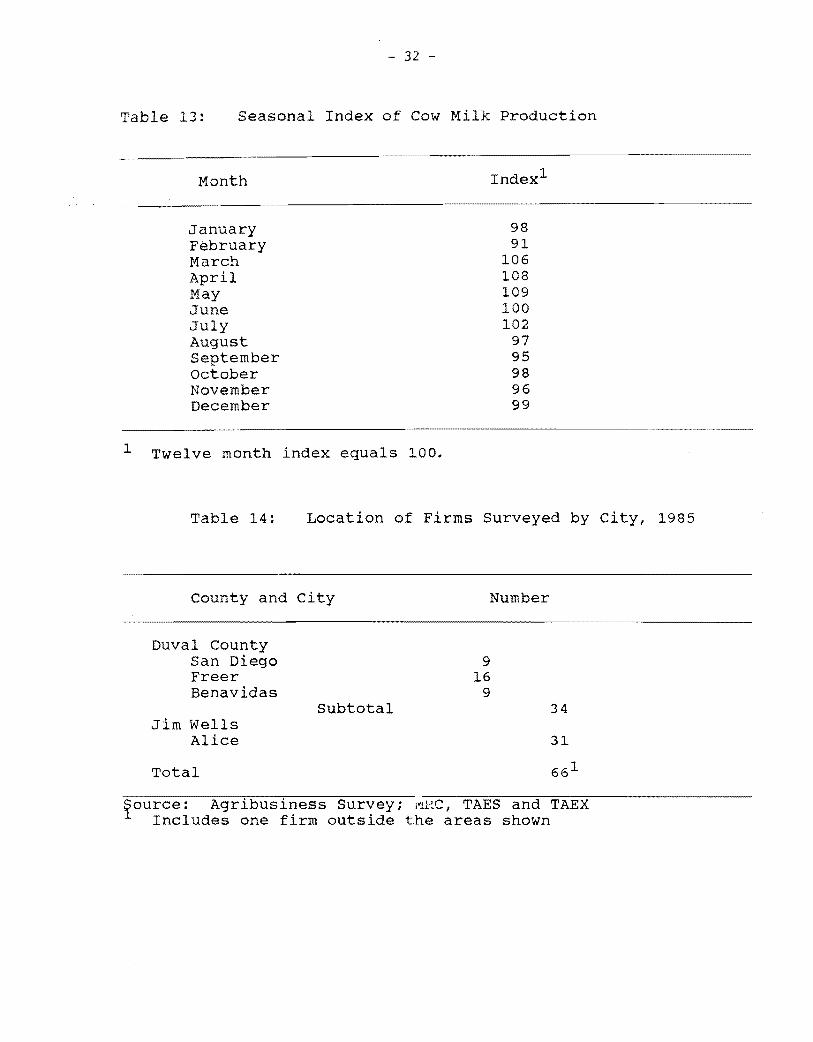
Table 13: Seasonal Index of Cow Milk Production
Month
January February March April May June July August September october November December
98 91
106 108 109 100 102
97 95 98 96 99
1 Twelve month index equals 100.
Table 14: Location of Firms Surveyed by City, 1985
County and City Number
Duval County San Diego Freer Benavidas
Jim Wells Alice
Subtotal
9 16
9 34
Total
fource: Agribusiness Survey; ·iVll~C, TAES and TAEX Includes one firm outside the areas shown
- 33
is $15.78. Competition for producer milk results in the
cooperative charging an additional 33 cents per cwt.
sul11ming 'Q£ Costs
Total costs, exluding sales force costs and commissions,
for the new firm are estimated to be from $1.87 to $2.06 per
gallon. The cost for the average small to medium plant is
estimated at $1.92 per gallon. These costs assume the plant
will attain a 15% market penetration. If this sales level is
not achieved the costs per gallon could range from $2.57 to
$4.25 with small to medium plant costs around $4.09.
Excessive product waste could also push costs up. These
costs can be considered wholesale breakeven prices.
Retailers must add their markup. Not only will the new firm
have to compete for raw milk by paying premiums, but it will
likely be forced to make price concessions to retailers. It
must be repeated these costs do not include sales force costs
and commissions.
RESULTS OF THE AGRIBUSINESS
FIRMS SURVEY
The reason for concluding that new or expanded
enterprises, or eco-systems, are needed if Duval County is to
be further developed arose from two facets of the study. One
was the examination of the kinds and sizes of the agricultural
- 34
production bases and the associated business enterprises, which
clearly revealed a very small base upon which to build further
economic development. Second was the results of the
agribusiness firms survey. Attention is now directed to the
latter and its implications regarding economic development.
The purpose of the survey was to obtain an up to date
reading as to the kinds of establishments operating presently
in Duval County and in Alice, which is a focal shopping point
in the area. As noted elsewhere, a copy of the questionnaire
appears in the appendix of this report.
An effort was made to survey all of the agribusiness
establishments in Duval County. These ,almost entirely, are
located in the cities of San Diego, Freer and Benavidas.
Partly because of the current depressed local business
climate, several of the establishments were uneasy about
participating in the survey, and therefore refused to
cooperate. Nonetheless, the relatively small number not
cooperating did not materially affect the survey results.
Because of the larger number of agribusiness
establishments in Alice, only a sample was taken of the more
common type businesses such as drive-in groceries and fast food
outlets. In Alice, as well, some refused to cooperate in the
survey. Again, refusals were comparatively small part of the,t
total. Therefore the survey results are considered valid.
Approximately eighty percent of all of the Duval County
agribusiness firms cooperated in the study.
In Alice, the sample coverage averaged about thirty percent of
- 35
all eligible businesses.
Thirty-four businesses were interviewed in Duval County
and 31 in Alice, making a total of 66 establishments, Table 14.
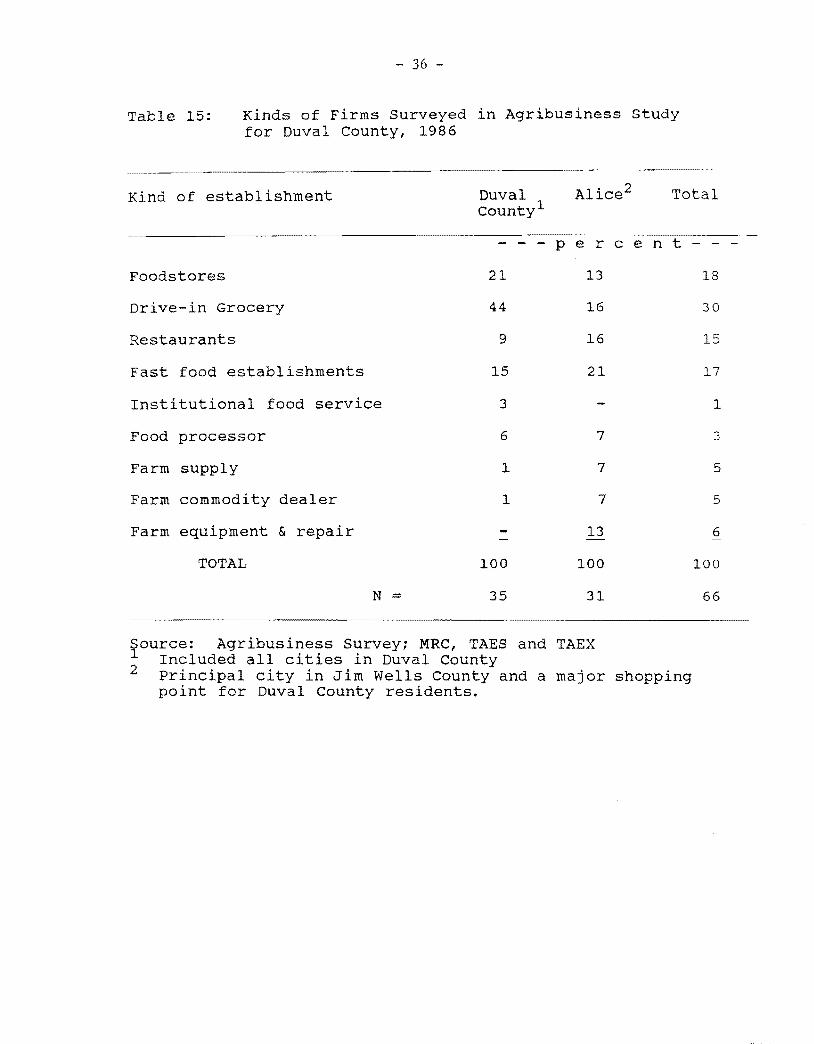
Kind or ~ of ~gribusiness Establish..~~!l.:t::
An indication of the kinds of business in the area is
shown in Table 15. Most of the activity concerns local
retailing operations. The institutional establishments are
local schools and their food service lunch rooms. Nursing
homes are in the same category although none participated in
the survey_
The food processor category included mostly local retail
bakery shops that made their own wares. No evidence was found
that they were endeavoring to expand beyond their own retailing
quantities, by selling wholesale to other outlets.
Farm supply firms were primarily feed and seed stores and
lumber yards marketing fencing and other miscellaneous farm
supplies. Equipment dealers were those selling and/or
servicing mostly tractors, trucks and trailers.
About three-fourths of the firms were locally owned.
outside ownership, in part, was related to franchise-type
businesses that are common for fast-food service businesses,
Table 16 and 17.
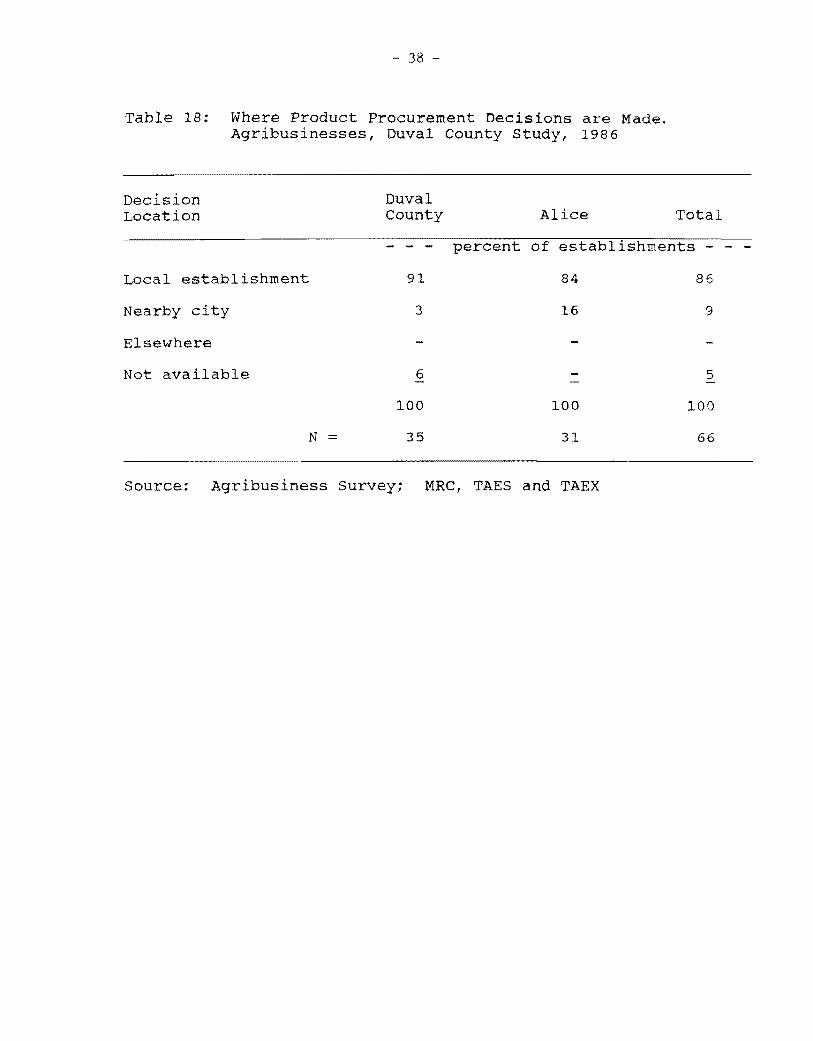
~here Supply Purchase Decisions are ~ade
Almost 90 percent of the purchase decisions regarding
ordering of sUfplies were said to be made by the manager of the
local business units. In the ordering of individual quantities
of products, this doubtless was true, Table 18. That,
- 36
Table 15: Kinds of Firms Surveyed in Agribusiness study for Duval County, 1986
TotalKind of establishment Duval county1
per c e n
Foodstores 21 13 18
Drive-in Grocery 44 16 30
Restaurants 9 16 15
Fast food establishments 15 21 17
Institutional food service 3 1
Food processor 6 7 3
Farm supply 1 7 5
Farm commodity dealer 1 7 5
Farm equipment & repair 13 6
TOTAL 100 100 100
N = 35 31 66
rource: Agribusiness Survey; MRC, TAES and TAEX Included all cit in Duval County
2 Principal city in Jim Wells County and a major shopping point for Duval County residents.

- - - -
- 37
Table 16: Location of Agribusiness Firm ownership, in Duval County, 1986.
Duval ownership County Alice Total
- - - percent of establishmentS-=-~--=-
Local 76 77 76
outside 21 23 21
N = 35 31 66
Source: Agribusiness Survey~ MRC, TAES and TAEX.
Table 17: Kind of Agri-Business Firm Management in Duval County, 1986.
Management Duval County Alice Total
Independent 88
Franchise Local 3 Outside 3
Chain Local 3 Outside
No reply 3
TOTAL 100
N = 35
percent of establishments-- -
61 73
13 8 10 6
6 5 10 5
3
100 100
31 66
Source: Agribusiness Survey: NRC, TAES and TAEX
- - - - - -
38
Table 18: Where Product Procurement Decisions are Made. Agribusinesses, Duval County study, 1986
Decision Duval Location County Alice Total
Local establishment 91 84 86
Nearby city 3 16 9
Elsewhere
Not available 6 5
100 100 100
N 35 31 66
Source: Agribusiness Survey; MRC, TAES and TAEX
- 39
however, should not be confused with the more important
decisions as to from whom supplies are ordered. Local
franchise fast-food shops, for example, reported that they
turned in their own orders. The source of supply in these
cases though is usually determined for them. This is important
because it means that the supply source has been pre-selected
for them based upon particular buying specifications and
pricing arranged by an outside central office. Such
arrangements are important because it means that some newly
developed local agribusiness processor or wholesaler faces
difficulties trying to make sales, and claiming thereby a share
of the total local market.
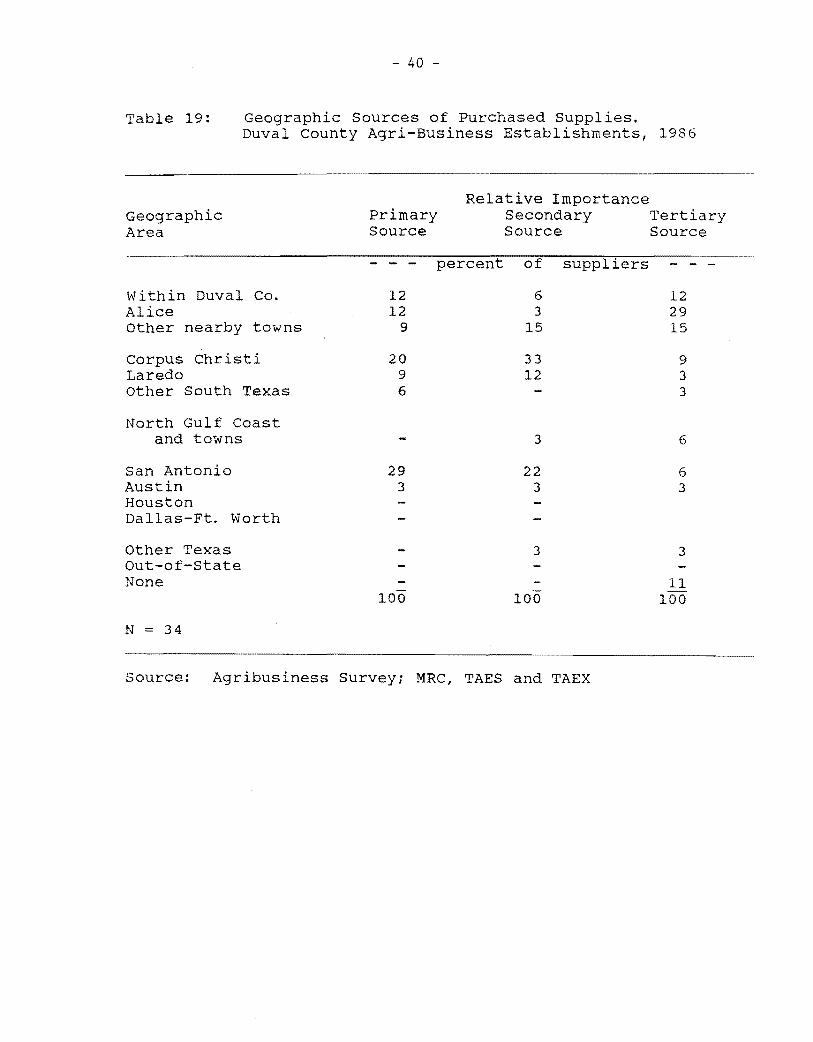
Geographic Location and ~ of Supplier
The foregoing problem is further underlined by the
consideration of the geographic sources from which supplies are
received. Corpus Christi, Laredo and San Antonio are
frequently mentioned sources, Tables 19 and 20. Suppliers in
those cities are mostly independent, sizable wholesalers.
Competition with these usually is not easy.
In those cases where local supply sources are indicated,
many are local salesmen for processor-distributor companies.
Good examples are bread, milk, and bottled drinks salesmen who
operate from a local office but represent a major food
processing firm with a processing plant and headquarters
elsewhere.
Added insight as to the structure of the marketing
channels serving Duval and Jim Wells counties is avaiable from
- - -
- 40
Table 19: Geographic Sources of Purchased Supplies. Duval County Agri-Business Establishments, 1986
Geographic Area
Within Duval Co. Alice Other nearby towns
corpus Christi Laredo other South Texas
North Gulf Coast and towns
San Antonio Austin Houston Dallas-Ft. Worth
Other Texas Out-of-State None
N 34
Relative Importance primary Secondary Source Source
- - percent of suppliers
12 6 12 3
9 15
20 33 9 12 6
3
29 22 3 3
3
100 100
Tertiary Source
12 29 15
9 3 3
6
6 3
3
11 00
Source: Agribusiness SurveYi MRC, TAES and TAEX

- 41
Table 20: Geographic Sources of Purchased Supplies Alice Agri-Business Establishments, 1986
Relative Importance Geographic Primary Secondary Tertiary Area Source Source Source
- - - percent of suppliers - -
Within Duval Co. 3 13 10 Alice 46 7 13 Other nearby towns 7 13
Corpus Christi 14 36 10 Laredo 3 7 7 Other South Texas 3 7
North Gulf Coast and towns
San Antonio 13 3 Austin 6 3 Houston 6 Dallas-Ft. Worth 3 7
6 3 17
100 100
N 31
Source: Agribusiness Survey; MRC, TAES and TAEX
- 42
a classification of the suppliers, Tables 21 and 22. Most of
the food products are moving through independent wholesalers
located in Corpus Christi or San Antonio. Such wholesalers
have a sUbstantial volume of business over a mUlti-county area.
The volume of products handled allows advantages in their
buying and selling prices compared to what could be achieved by
any small local distributor. For that reason local wholesalers
are not generally found. However, one small grocery wholesaler
is located in Alice. It offers a cash and barry service which
allows it to be more competitive with delivery service
wholesalers from San Antonio and Corpus Christi.
An excellent decision was made when the pair of local
supermarkets, Model Markets, were developed, one in San Diego
and another in Freer. Although these can not be fully
competitive with national food chain stores in Alice, they do
keep a significant amount of food retail sales within the
County. Both the internal appearance, maintenance of
equipment, and overall management of the Model Markets should
be kept at a high level to keep them as competitive as
possible.
The processor-distributor has already been discussed and
as the figures in Tables 21 and 22 show, this is an important
marketing channel to the area r :3 retail establishments. Those
supplies indicated from government channels are commodities
going to school cafeteria lunch and other feeding programs.
Retail food stores are supply sources for small restaurants
because wholesale quantities exceed their needs and would
- 43
Table 21: Type of Supplier to Agri-Business Establishments. Duval County, 1986
Relative Importance supplier Type Primary Secondary Tertiary
---~-----~~--'--------------p-e-r-c-e-n-:-t-of suppl iers
~<Jarehouse
Chain Affiliated chain Franchise
Independent wholesaler 85 12 3
Processor-distributor 9 70 9
Retail store 3 15 12
Government 3
Individuals
None 3 76
TOTAL 100 100 100
N = 34
Source; Agribusiness Survey: MRC, TAES and TAEX
- 44
Table 22: Type of supplier to Agri-Business Establishments. ice, 1986
Relative Importance Supplier Type Primary Secondary Tertiary
Warehouse Chain Affiliated chain Franchise
7
Independent wholesaler 55
Processor-distributor 23
Retail store
Government
Individuals 15
None
TOTAL 100
N 31
10
55
3
3
7
32
100
90
100
Source: Agribusiness Survey; MRC, TAES and TAEX
- 45
result only in spoilage.
Individual suppliers, is a category used for farmers,
ranchers and others who are marketing their products at local
establishments such as through livestock auctions and grain
dealers.
Trade Area Served and
Business Expansion Plans
outreach of the Duval County agribusiness firms very
seldom extends beyond the local county. Only ten percent of
the businesses indicated any outside customers, Table 23. The
same prevailed in Alice. This was as expected, but it points
to a key regarding the economic growth problem. Duval County
cannot achieve any decisive economic growth with its businesses
looking only inward to county area support. It must move
forward to finding a product or service that it can provide to
a much broader geographic market. Thus the search for
alternative enterprise eco-systems, in the judgement of the
Market Research Center, became an essential phase of this
study.
New endeavors to build the business base of the area is
implied by about a fourth of the businesses having started
within the last five years, Table 25. Unfortunately the result
is one of subdividing existing business VOlume, more than
creating any new sales volume from a larger market territory.
since expanded business territory is so important to
bringing more dollars into the local economy, an effort was
- 46
Table 23: Trade Area Served Duval County Agribusiness Establishments, 1986
Trade Area Percent of Establishments
Local city
Local city and nearby areas
Duval County
Duval Co. and nearby areas
South Texas
N = 34
61
21
9
6
3 100
Source: Agribusiness Survey; MRC, TAES and TAEX
Table 24: Trade Area Served Alice Agribusiness Establishments, 1986
Trade Area Percent of Establishments
Local city 32
Local city and nearby areas 58
Duval County
Duval Co. and nearby areas
South Texas 10 100
N = 31
Source: Agribusiness Survey; MRC, TAES and TAEX
- 47
made to test attitudes toward business development. Ninety
percent of the business establishment management personnel
interviewed reported no plans or thought being given to further
business development. All would like "more customers". Some
external force was supposed to provide them, Table 26.
Similarly, apparently little attention or thought had been
given as to what kind of factors were preventing further
development of their own business, Tables 27 and 28. Answering
"none", to the question of what type of expansion was needed,
really reflected the current no-expansion mode of thought.
The possibility of building an expanded market by existing
businesses should not be abandoned. Attainment of such a goal,
however, would be dependent upon the ability to find or develop
more aggressive business management. Meanwhile, the
establishment of new or larger agribusiness systems to serve a
larger market must be considered. possibilities for a milk
production-processing-marketing eco-system has already been
discussed. Five others also deserve consideration, so
attention is redirected to these.
Egg Production-Marketing
continued population growth in Texas requires increased
quantities of food products. Food supply increases must come
from more within-state production or larger imports. It must
not be forgotte, that Texas is one of the top three states in
population and therefore is a huge food market.
Some agricultural production-marketing eco-systems are
- 48
Table 25: Number of Years in Business, Agribusiness Establishments, 1986.
Years Percent of Establishments Duval County Alice
- percent of establishments
0-1 1 - 2 3 13 2 - 5 21 16 5 - 10 21 26 10 - 15 18 10 Over 15 29 35 No reply 8
Total 100 100 N= 34 31
Source: Agribusiness Survey, MRC, TAES and TAEX
Table 26: Plans for Business Expansion by Agribusiness Establishments, 1986
Plans Duval County Alice
- percent of establishments
Yes 3 7
Recently expanded 3 3
None 76 87
Economy to poor 12 3
No answer 6
Total 100 100
N= 34 31
Source: Agribusiness Survey, MRC, TAES and TAEX
- 49
Table 27: Limitations to Business Expansion, Agribusiness Firms, 1986
Limitations Duval Alice - percent of establishments
.-
None 3 7
Personal reasons 3
Not thought about 97 90
Total 100 100
N= 34 31
Source: Agribusiness Survey, MRC, TAES and TAEX
Table 28: Kind of Business Expansion Assistance Needed by Agribusiness Establishment, 1986
Kind Duval County Alice
percent of establishments
More customers 3 32
Higher oil prices 3
None 94 38
No reply 3 7
Total 100 100
N= 34 31
Source: Agribusiness Survey, MRC, TAES and TAEX
- 50
pre-ordained to specific locations because of the physical
environment necessary to production of the product, for example
citrus in the Texas Rio Grande Valley. Others have
considerable mobility. Among the latter are egg and chicken
broiler production. Because of this, production of these food
products has tended to migrate to areas having four attributes.
1. The desire and willingness to develop the expertise
required to achieve competitive production.
2. Available grain supplies at competitive prices.
3. Limited other agricultural production opportunities
that have an econ.':ic comparative advantage versus
that in other locations.
4. Competitive marketing cost access to major population
centers.
For the foregoing reasons egg production is primarily centered
in the following ten states, listed in order of total output,
Table 29.
Location of egg production in Texas with respect to the
leading counties is evident in Figure 1. The major county,
Gonzales, is east of San Antonio. None of the principal
counties is in south Texas. Location of an operation in Duval
County should be considered as a possibility.
Duval County offers chara;taristics that make it qualify
as a location. Grain sorghum is the present leading grain crop
in south Texas and it is also the main component of present
feeding rations. Besides, Corpus Christi is a significant port
for grain exports, drawing from a multi-state area. Another
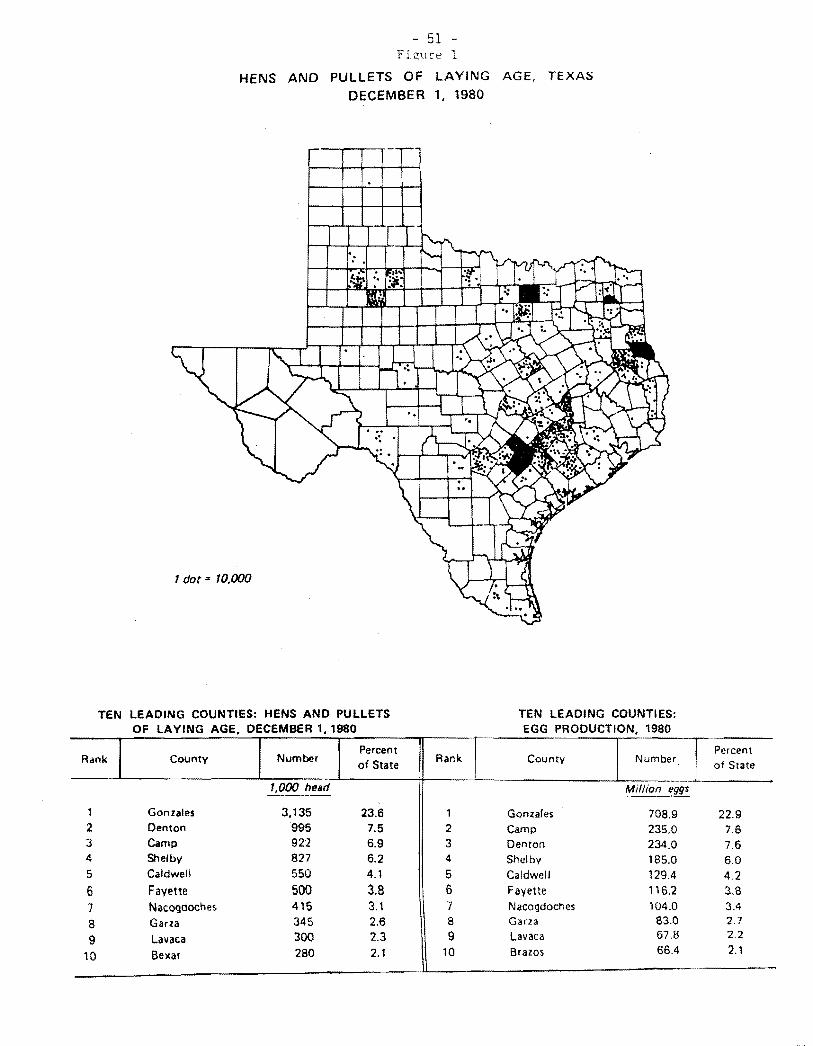
- 51 Figure 1
HENS AND PULLETS OF LAVING AGE, TEXAS
DECEMBER 1, 1980
1 dor" 10,000
TEN LEADING COUNTIES: HENS AND PULLETS TEN LEADING COUNTIES: OF LAYING AGE, DECEMBER " 1980 EGG PRODUCTION, 1980
Rank County Number Percent of State
Rank County Number Percent of State
1,000 head Million eggs ~----~~-
1 Gonzales 3,135 23.6 1 Gonzales 708.9 22.9 2 Denton 995 7.5 2 Camp 235.0 7.6 3 Camp 922 6.9 3 Denton 234.0 7.6 4 Shelby 827 6.2 4 Shelby 185.0 6.0 5 Caldwell 550 4.1 5 Caldwell 129.4 4.2 6 Fayette 500 3.8 6 Fayette 116.2 3.8 7 Nacogdoches 415 3.1 7 Nacogdoches 104.0 3.4
8 Garla 345 2.6 8 Garza 83.0 2.7
9 Lavaca 300 2.3 9 Lavaca 67.8 2.2
10 Bexar 280 2.1 10 Brazos 66.4 2.1
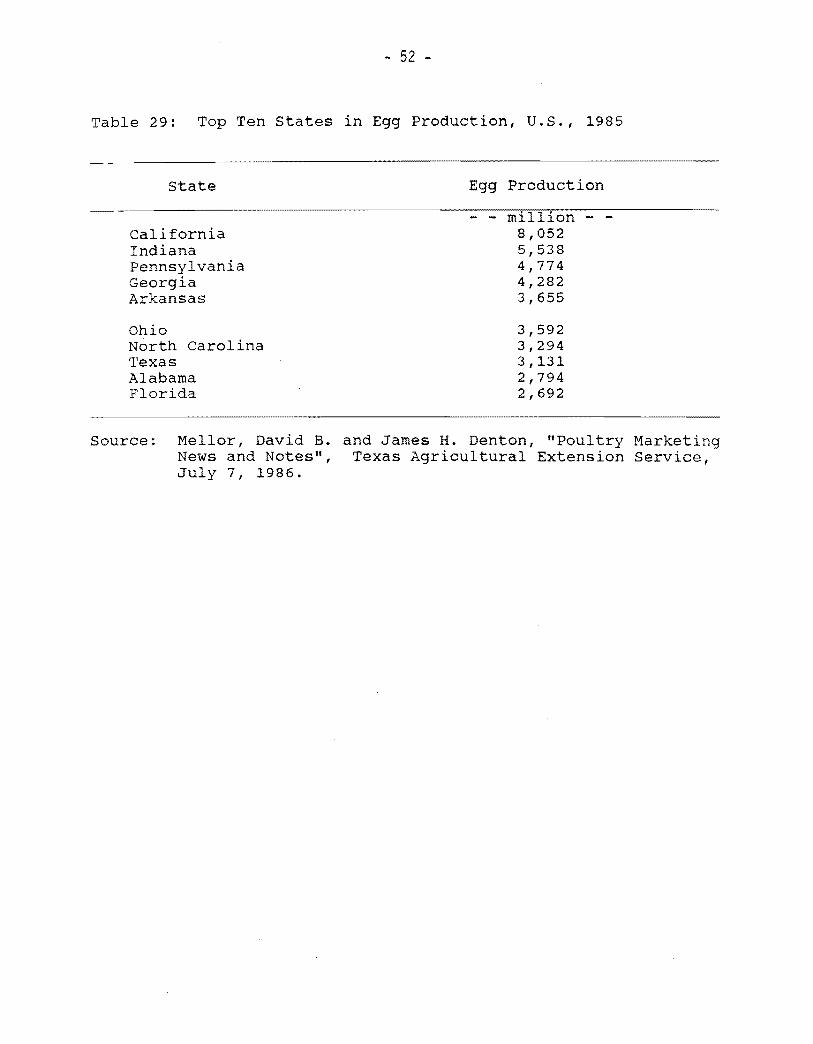
- 52
Table 29: Top Ten states in Egg Production, U.S., 1985
state Egg Production
California Indiana Pennsylvania Georgia Arkansas
Ohio North Carolina Texas Alabama Florida
8,052 5,538 4,774 4,282 3,655
3,592 3,294 3,131 2,794 2,692
Source: Mellor, David B. and James H. Denton, "Poultry Marketing News and Notes", Texas Agricultural Extension Service, July 7, 1986.
- 53
feed ration component, soybeans, is grown in South Texas.
Another characteristic of egg, as well as broiler
production, is that it tends to locate, as previously noted,
where other intensive agricultural alternatives are not
available. Location of the broiler production in East Texas
and the southwestern part of Arkansas is an example.
Thirdly, the markets of Corpus Christi, Laredo as well as
the MCAllen-Harlingen-Brownsville would be logical from Duval
County. All of these have shown substantial population growth.
~ Production-Marketing unit
About the minimum size production, operation for
reasonable cost efficiency, is based on 50,000 layers.
Production averages about 230 eggs per layer per year. Total
output would amount to 11.5 million eggs annually, or near 1
million dozen.
It would be necessary to have a washing, grading and
packaging facility associated with the production plant.
Either it could be located on the premises of the production
plant or in an agribusiness park in Benavidas or San Diego.
Freer would be an alternative but other agribusiness facilitie
that might be park located are likely to serve production in
the southeatern portion of the county near or below Benavidas.
~ Marketing strategy ~equirements
The egg market in the counties below San Antonio totals 23
million dozen per year. Therefore a market share of only 3 to
- 54
4 percent would have to be attained by the Duval plant.
strategy should include marketing through food chain stores.
Also contracts with government agencies, expecially military
bases in the area may be a possibility, particularly since the
plant is developed to serve a depressed income county economy.
A decision regarding brand name strategy will be a part of
the marketing mix. If possible, marketing under a chain
store's private brand would make consumer demand easier to
attain in terms of quickness and sales volume.
Inclusion of the San Antonio market would reduce the
required market share to 2 percent. Gonzales County the
leading production county will offer strong competition to
entry in that market.
Cost of a Production-Marketing Eco-System
A stair-step cage system is recommended for use in the
Duval County area. Open side walls are essential for good
ventilation in the warm South Texas climate. Cost of the egg
layer houses and equipment therein would be approximately $5.50
per bird. That makes a total facility cost of $275,000.
An egg washing, grading and packaging plant cost is
equivalent to near $1.00 per layer. Therefore the required
investment is about $50,000 for the plant only. Total
investment probably will be in the ranga of $350,000 to
$400,000. Land and service facilities to it would bring the
cost to the $500,000 to $600,000 level.
Assumed already available are the water and sewage
- 55
disposal services essential to this production-marketing
enterprise.
Poultry Production-Marketing
Broilers production-marketing is considered somewhat less
attractive than that for egg production. However, a broiler
grower firm is operating in the Central Gulf Coast area of
Texas that has its own processing plant. One of the production
units is near Kingsville, Texas. Since this production
marketing system is already in place, an opportunity may be
available to join with it by establishing a broiler grower
facility in Duval County.
The Nixon, Texas processing plant in an old and designed
for marketing ice-pack broilers. That market is limited
because the frozen chill pack type bird marketed by Holly
Farms, and others, now dominates the market.
Market Size and Strategy
For the market area in the counties south of San Antonio,
about 14 million broilers are sold per year. This estimate is
based on consumer purchases of about 0.8 pounds per person
per week. These figures are derived from the National Food
Consumption Study, USDA 1977-78. Only purchased quantities
were consider~d since only marketable quantities are of
concern.
A 50,000 broilers facility would have annual production of
- 56
approximately 300,000 broilers. Compared to the total market,
that would be only about a 2.0 percent market share
penetration. Inclusion of San Antonio brings the total market
to around 26,000,000 broilers, and makes the Duval output only
about 1.0 percent of the areas' demand.
Since the proposed production is so small in relation the
overall market, use of a specialized market outlet might be
considered. Contacts could be made with smaller super markets
or selected fast food establishments. The latter, however, are
usually designed to stock only frozen foods, so an ice-pack
form would be a handicap.
Cost of Production-M~rketing Eco-System
As for the other agribusiness systems discussed, entry
cost is appreciable. A minimum cost facility would be $3 to $5
per bird. Total cost calculates to as much as $250,000. Some
recent state-of-the-art, operations designed to grow 1,000,000
birds together with associated processing facilities, delivery
trucks and related costs amounted to between $12 and $13 per bird
production capacity.
An alternative to broilers is a starter-chick production
system. It could help supply the extensive broiler operations
already in Texas.
Present concentration of broilers production by county is
presented in Figure 2.
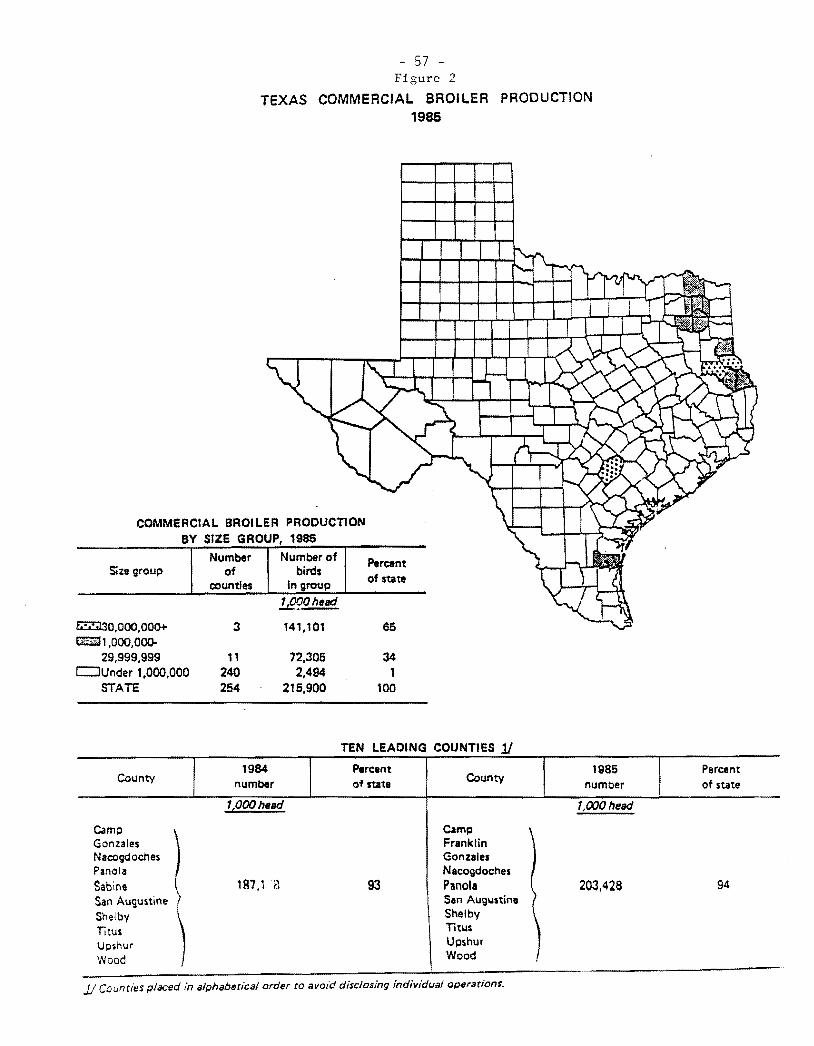
BROILER PRODUCTION 1985
Number Number of Percentof birds
counties In group of state
L9.'?!!.l!!.!!!.. 141,101 65
- 57 Figure 2
TeXAS COMMERCJAL BROILER PRODUCTION 1985
COMMERCIAL BY SIZE GROUP.
Size group
EZ5.l30,OOO,OOO+ 3 1"'+41,OOO,OQO.
29,999,999 11 72,305 34 CJUnder 1,000,000 240 2,494 1
STATE 254 215,900 100
TEN LEADING COUNTIES 11 1984 Percent 1985 Percent
County Countynumber of state number of state
I,OOOhesd'poohtlsd
Camp \ Camp \ Gonzales Franklin Nacogdoches Gonzales Panola Nacogdoches Sabine 187,' a 93 Panola 203,428 94 San Augustine San Augunine
Shelbv Shelbv
Titus TItus , Up$hur Upshur
Wood Wood
Jj Coumies placed in alphabetical order to avoid disclosing individual operations.
- 58
The Commercial utilization of Mesquite
as a Revenue Source for Duval County
Mesquite has been a rangeland nuisance to ranchers for
many years. This hardy perennial is a native plant which
requires very little moisture and tends to force out less hardy
trees and grasses. Millions of dollars are spent in Texas each
year on the mechanical and chemical eradication of this
seemingly useless tree.
Duval County has a considerable infestation of mesquite,
ranging from light to dense stands. Generally speaking, the
northern three-quarters of the county has light to moderate
stands of mesquite while the southern one-quarter has a dense
infestation of the plant, Table 30.
As previously mentioned, many millions of dollars are
spent each year on the elimination of mesquite. Recently
however, much thought has been focused on how to make this
rangeland pest commercially profitable. Many ideas have been
formulated and a few tried. These include using mesquite and
mesquite by-products for cattle roughage, fiberboard, and
parquet flooring. The most attractive alternative to date is
the use of mesquite chips for barbecue and outdoor cooking
purposes.
Americans have always enjoyed outdoor cooking and Texans
are no different. currently the barbecueing of chicken and
beef brisket, and the preparation of fajitas appear to be the
most popular outdoor cooking. And in increasing amounts people
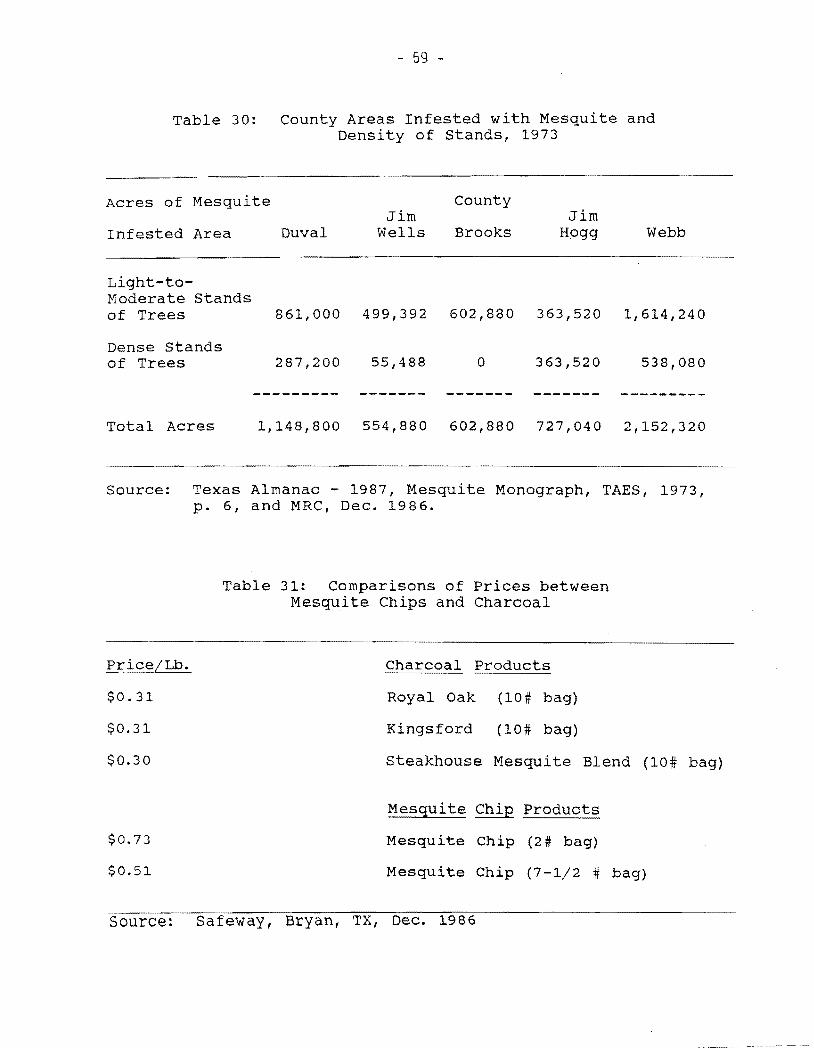
--------- ------- ------- ------- ---------
- 59
Table 30 : County Areas Infested with Mesquite and Density of Stands, 1973
--
Acres of Mesquite
Infested Area Duval Jim
Wells
County
Brooks Jim
Hogg Webb
Light-to-Moderate Stands of Trees 861,000 499,392 602,880 363,520 1,614,240
Dense Stands of Trees 287,200 55,488 0 363,520 538,080
Total Acres 1,148,800 554,880 602,880 727,040 2,152,320
Source: Texas Almanac - 1987, Mesquite Monograph, TAES, 1973, p. 6, and MRC, Dec. 1986.
Table 31: Comparisons of Prices between Mesquite Chips and Charcoal
Charcoal Products
$0.31 Royal Oak (10# bag)
$0.31 Kingsford (10# bag)
$0.30 Steakhouse Mesquite Blend (10# bag)
Mesquite Chip Products
$0.73 Mesquite Chip (2# bag)
$0.51 Mesquite Chip (7-1/2 # bag)
Source: Safeway, Bryan, TX, Dec. 1986
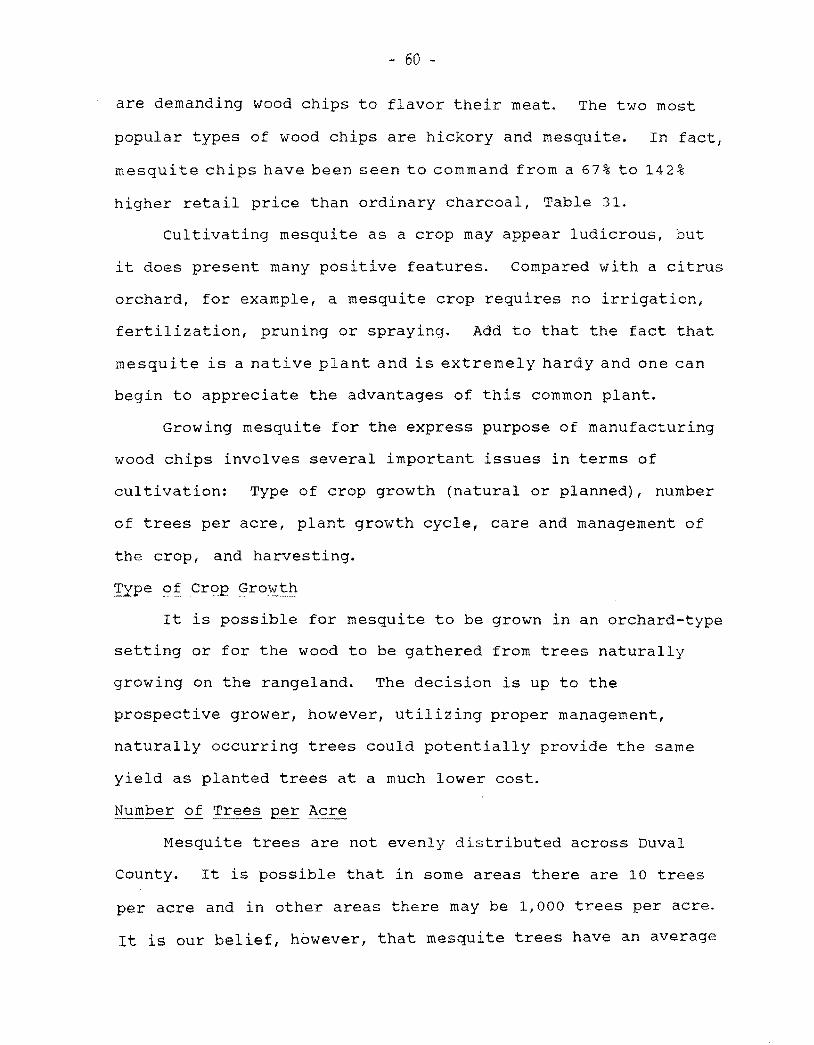
- 60
are demanding wood chips to flavor their meat. The two most
popular types of wood chips are hickory and mesquite. In fact,
mesqui te chips have been seen to command from a 67 % to 142%
higher retail price than ordinary charcoal, Table 31.
cultivating mesquite as a crop may appear ludicrous, but
it does present many positive features. Compared with a citrus
orchard, for example, a mesquite crop requires no irrigation,
fertilization, pruning or spraying. Add to that the fact that
mesqui te is a native plant and is extremely hardy and one can
begin to appreciate the advantages of this common plant.
Growing mesquite for the express purpose of manufacturing
wood chips involves several important issues in terms of
CUltivation: Type of crop growth (natural or planned), number
of trees per acre, plant growth cycle, care and management of
the crop, and harvesting.
~ of Crop Growth
It is possible for mesquite to be grown in an orchard-type
setting or for the wood to be gathered from trees naturally
growing on the rangeland. The decision is up to the
prospective grower, however, utilizing proper management,
naturally occurring trees could potentially provide the same
yield as planted trees at a much lower cost.
Nu~ber of Trees per Acre
Mesquite trees are not evenly distributed across Duval
County. It is possible that in some areas there are 10 trees
per acre and in other areas there may be 1,000 trees per acre.
It is our belief, however, that mesquite trees have an average
- 61
density in Duval county of from 150 to 500 trees per acre. If
one is to harvest the wood from mesquite trees, movement around
all the trees must be unrestricted. In short, the stands
cannot be so dense that harvesting is made extremely difficult
(i.e. extremely time consuming and therefore, expensive).
Likewise, one would desire as many trees as possible per acre
of land in order to maximize revenue. It is our opinion that a
density of 200 to 3 00 mesquite trees per acre is optimal, Table
32. This range is within the parameters given for average
county density and indicates the feasibility of harvesting
naturally growing mesquite.
Plant Gro~th cycle
The common mesquite tree reaches full maturity in three
years. And, if ever cut back, will once again have mature
stems. (i.e. 1" base diameter, 4 foot length) in approximately
three years. Therefore, it is our recommendation that a
particular area or "plot" of mesquite be harvested only once
every three years. This provides the twofold purpose of
allowing the plant to fully regenerate itself, and of keeping
an adequate amount of brush cover for wildlife at all times.
So, for example, if one had 3,000 acres dedicated to mesquite
cultivation, a particular 1,000 acre plot would be harvested
each year.
Care and Manageme~t of the Crop
Mesquite requires no special care. The only item that
should be monitored is the growth cycle. cutting non-mature
wood is a waste of both resources and of time, for the plant
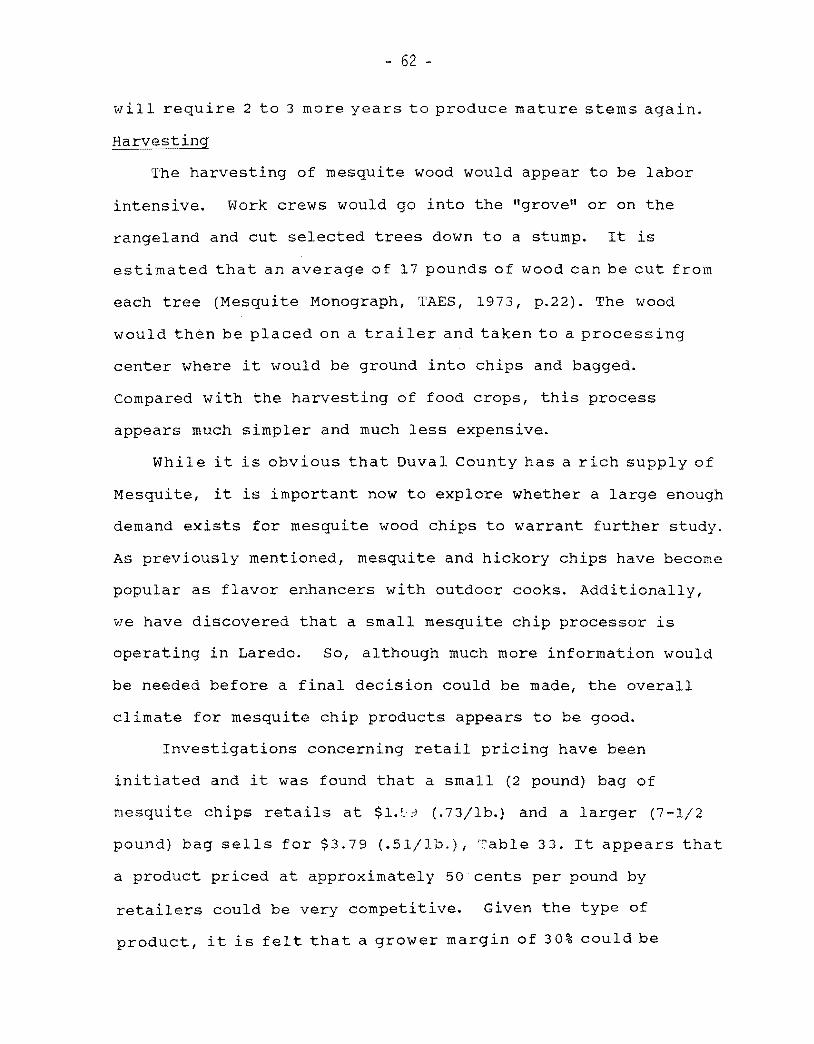
- 62
will require 2 to 3 more years to produce mature stems again.
Harvesting
The harvesting of mesquite wood would appear to be labor
intensive. Work crews would go into the "grove" or on the
rangeland and cut selected trees down to a stump. It is
estimated that an average of 17 pounds of wood can be cut from
each tree (Mesquite Monograph, TAES, 1973, p.22). The wood
would then be placed on a trailer and taken to a processing
center where it would be ground into chips and bagged.
compared with the harvesting of food crops, this process
appears much simpler and much less expensive.
While it is obvious that Duval County has a rich supply of
Mesquite, it is important now to explore whether a large enough
demand exists for mesquite wood chips to warrant further study.
As previously mentioned, mesquite and hickory chips have become
popular as flavor enhancers with outdoor cooks. Additionally,
we have discovered that a small mesquite chip processor is
operating in Laredo. So, although much more information would
be needed before a final decision could be made, the overall
climate for mesquite chip products appears to be good.
Investigations concerning retail pricing have been
initiated and it was found that a small (2 pound) bag of
mesquite chips retails at $1.:"9 (.73/lb.) and a larger (7-1/2
pound) bag sells for $3.79 (.51/1b,), ",able 33. It appears that
a product priced at approximately 50 cents per pound by
retailers could be very competitive. Given the type of
product, it is felt that a grower margin of 30% could be
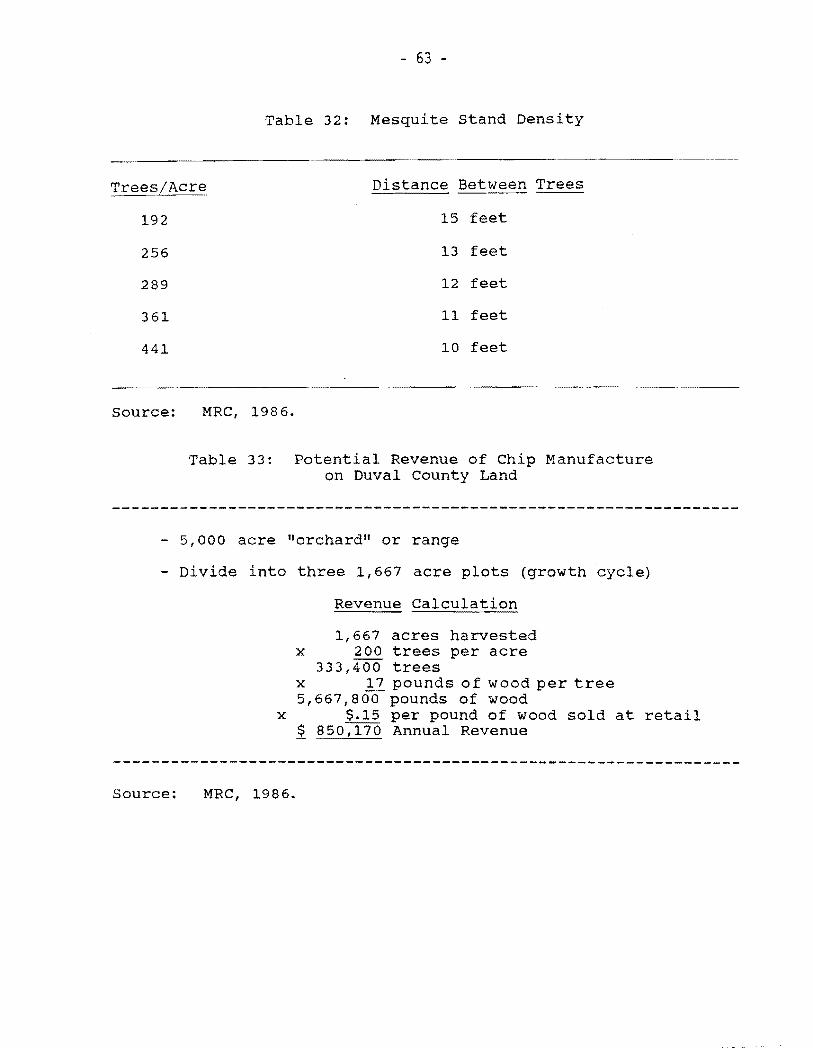
- 63
Table 32: Mesquite Stand Density
TreesLAcre Distance Between Trees----192 15 feet
256 13 feet
289 12 feet
361 11 feet
441 10 feet
Source: MRC, 1986.
Table 33: Potential Revenue of Chip Manufacture on Duval County Land
- 5,000 acre "orchard" or range
- Divide into three 1,667 acre plots (growth cycle)
Revenue Calculation
1,667 acres harvested x 200 trees per acre
333 , 400 trees x 17 pounds of wood per tree 5,667,800- pounds of wood
x $.15 per pound of wood sold at retail ~ 850~ Annual Revenue
Source: MRC, 1986.
- 64
expected. Thus, for every pound of chips sold in retail
stores, Duval County growers would receive 15 cents.
Distribution of the chips would be as follows: grower to
processor to wholesaler/distributor to retailer. A processing
center for all wood could be located in Duval County. This
facility would grind the stems and branches into chips, oven
dry the chips, and package them into bags for shipping. It is
estimated that this facility would also receive 15 cents to
cover harvesting and processing costs.
The economic impact of mesquite chip marketing is
potentially large for Duval County. A 5,000 acre parcel of
land can serve as an example of possible revenue generation,
Tables 33 and 34.
The revenue for a 5,000 acre parcel of land appears
encouraging, $850,000 annually at 15 cents per pound. Even at
5 cents per pound, the return is $283,000 or over $40 per acre.
Duval county has probably about 500,000 acres of range land
suitable for the harvesting of mesquite, estimating from U.S.
Census of Agriculture figures. Obviously, Duval County can
provide a large mesquite supply. Market size estimates have
not been calculated but need investigation.
It is estimated that at least 24 harvesters would be
required for every 1,667 acres c~ing cultivated. In addition,
personnel would be required to operate the processing plant, to
run a business office, and to provide managerial expertise.
Harvesting equipment would be required (i.e. pruners, chain
saws, etc.), and trucks and trailers. And of course a
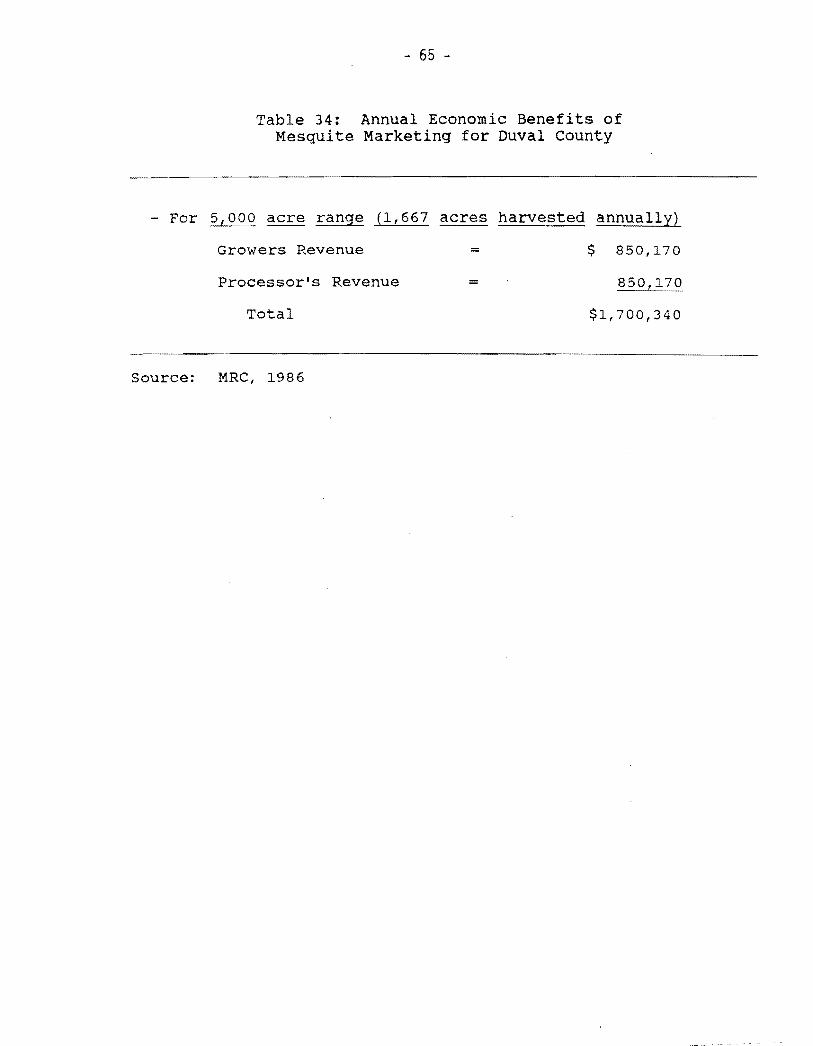
- 65
Table 34: Annual Economic Benefits of Mesquite Marketing for Duval County
- For 5,00~ acre range (1,667 acres harvested annually)
Growers Revenue = $ 850,170
Processor's Revenue = 850,170
Total $1,700,340
Source: MRC, 1986
- 66
processing/packaging center would have to be constructed.
Long-term assets such as trucks, trailers, and processing
equipment could be amortized over several years.
On the whole, harvesting and marketing mesquite products
not only appears feasible, and may warrant further
investigation.
Horticultural Landscape Plants
The Production-Marketing System
Duval and surrounding counties have one of the most
saleable products of today in the wholesale or retail nursery
business in the plant Seneca (Texas Sage). Bountiful supplies
are allover the counties just as is mesquite. As far as
ranching cattle is concerned this plant's removal for sale would
be beneficial to both the grazing land for livestock and the
economy of the area. The Texas Sage is used extensively in
landscaping in shopping malls, industrial sites, schools and
particularly homes.
These plants take years to grow to a landscape size under
present native conditions but grow twice as fast with good
cultural practices. The plant hu3 a small fibrous root system
that lends itself to removal and potting in gallon, 2 gallon, 5
gallon, and larger containers, depending upon the size needed,
and cost allocated for landscaping a particular area.
Most nurseries now propagate from plants by cuttings in
- 67
small pots and then removing them to larger pots. The Duval
county group should definitely check-out the possibility of
supplying wholesale nurseries with ball & burlap Texas Sage
plants.
Another local native plant, in Duval and surrounding
counties, that is in high demand for landscaping is Mountain
Laurel. Mountain Laurel grows extremely slow and older more
mature plants are transplanted from the wild to supply
wholesale and retail nurseries for consumer use in landscaping.
Digging, potting and selling these two plants should be
investigated as a possibility of an income producing commodity
for Duval County. Future study should be done to determine
cost and acceptance by wholesale & retail trade.
costs and Returns Estimate
Since these plants are growing in the wild on ranchland,
no direct production cost is involved. Most, if not all
research regarding these plants at the Texas Agricultural
Experiment Station has been directed toward plant eradication
costs. Johnson grass and sunflowers in previous decades
likewise were considered to be a nuisance rather than a
potential agricultural crop.
Only rough, preliminary estimates are possible regarding
revenues from Texas Sage. At retail, this plant is priced at
about $5,00 for small plants, $8.50 for medium sizes, and
$17.00 for large ones. A three year growth cycle is assumed on
- 68
the range pasture land. This is not fully documented, but is
an assumption only at this point.
If plants are sold in the following sizes and at the
indicated prices, the gross retail value is $3,050 per acre.
Per acre estimates:
100 small plants X $5 = $ 500
100 medium plants X $8.50 = 850
100 large plants X $17 = 1700
Total $3050
A three year cycle means that the above return would be
possible for three acres -- one harvested and two in re-growing
stages. If only 20 percent of the retail price accesses to the
land owner, that is a return of $203 per acre per year.
Obviously only the total acreage equivalent to market demand
could be in the production-marketing system. Since demand
figures are not presently available to the Market Research
Center, such information would need to come from a more
detailed feasibility analysis.
A wholesale nursery facility would have to be constructed
to accommodate the marketing effort. That facility is another
possible candidate for an agribusiness pack concept, or it
could be a free-standing opera~i0n.
Vegetable Production-Marketing
Duval County already has vegetable production in its
flatter, plains area southeastern section. Watermelon is
- 69
perhaps the leading crop. At one time about 8,000 acres was
irrigated and largely devoted to vegetables uses in the
county. Presently, the agricultural statistics for the county
indicate only about 3,000 acres.
Investigation of the agricultural crop marketing
structure, by the Market Research Center staff, determined that
marketing channels are already in place to accommodate larger
supplies of watermelons and fresh vegetables. Vegetable
packer-shippers are located in Laredo and were interviewed
regarding their ability to expand their business. A watermelon
shipper is located in Pearsall (Frio County), that already
contracts for melons from Duval.
Furthermore a hydro-cooler and packing house grading
equipment already are locally available and under utilized.
These are now being used to market peaches from a commercial
orchard in the southeastern part of Duval.
Crops evaluated for Duval County include the following
ones. Shown with each is the estimated potential return per
acre. Prices are based on the most recent ten-year average for
which data were available.
Crop and yield Price Net return/acre
Spinach, fresh market
400 bu/acre $5.75/bu $96
onions
450 bags/acre $5.00/bag $82
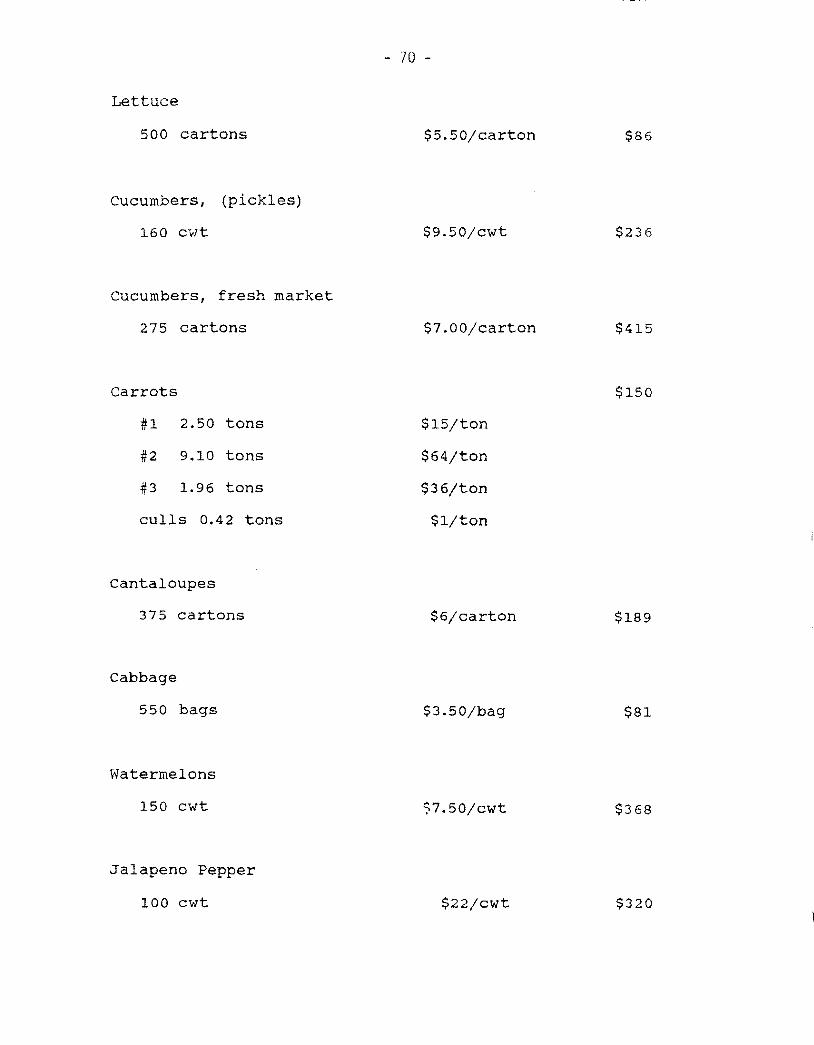
- 70
Lettuce
500 cartons $5.50/carton $86
Cucumbers, (pickles)
160 c",lt $9.5D/cwt $236
Cucumbers, fresh market
275 cartons $7.DO/carton $415
Carrots $150
#1 2.50 tons $15/ton
#2 9.10 tons $64/ton
#3 1.96 tons $36/ton
culls 0.42 tons $l/ton
Cantaloupes
375 cartons $6/carton $189
Cabbage
550 bags $3.50/bag $81
Watermelons
150 cwt S7.50/cwt $368
Jalapeno Pepper
100 cwt $22/cwt $320
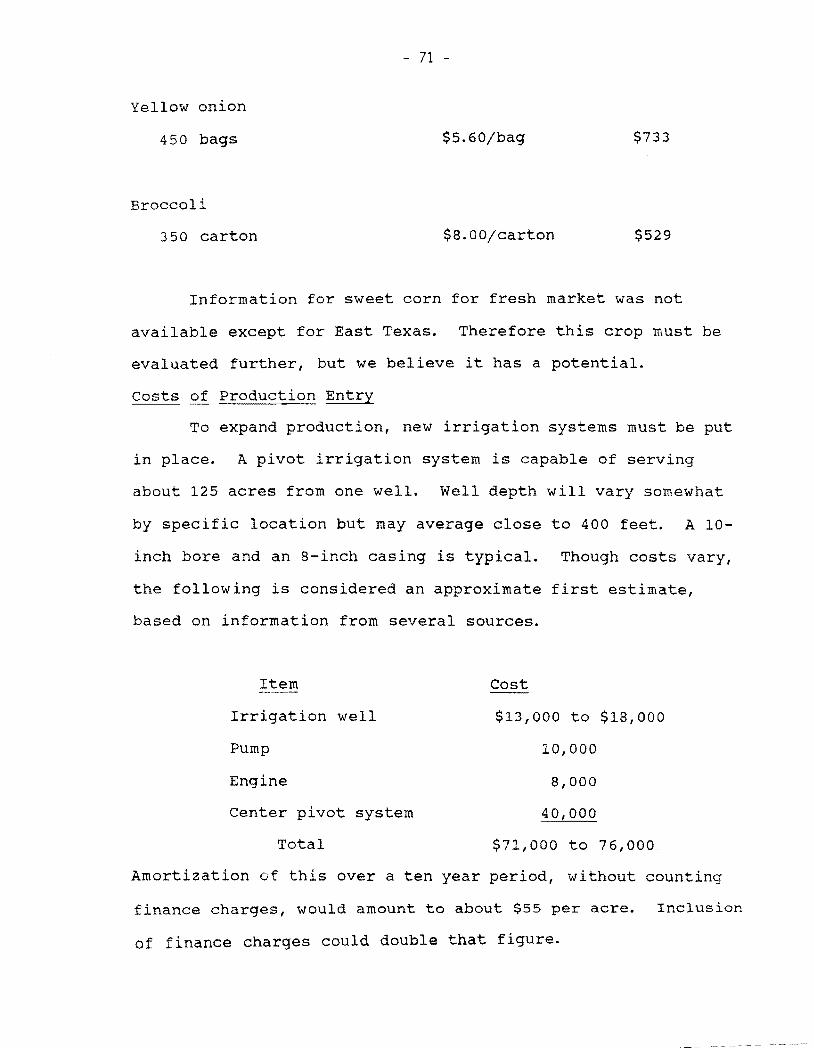
- 71
Yellow onion
450 bags $5.60/bag $733
Broccoli
350 carton $8.00/carton $529
Information for sweet corn for fresh market was not
available except for East Texas. Therefore this crop must be
evaluated further, but we believe it has a potential.
Costs of Production Entry
To expand production, new irrigation systems must be put
in place. A pivot irrigation system is capable of serving
about 125 acres from one well. Well depth will vary somewhat
by specific location but may average close to 400 feet. A 10
inch bore and an 8-inch casing is typical. Though costs vary,
the following is considered an approximate first estimate,
based on information from several sources.
Item Cost
Irrigation well $13,000 to $18,000
Pump 10,000
Engine 8,000
Center pivot system 40,000
Total $71,000 to 76,000
Amortization of this over a ten year period, without counting
finance charges, would amount to about $55 per acre. Inclusion
of finance charges could double that figure.
- 72
The significant point is that financing would have to be
available to establish this expanded production. Furthermore
the price avarages reflect high price and profit years as well
as low price and loss years. A preliminary appraisal suggests
that years of losses on crops may be as many as three out of
ten. Consequently financing arrangements must be such that
farmers are able to bridge those years.
A good strategy is to plant several crops per year. Under
this deversification, those making a profit can offset and
overcome those where unexpected low market prices occur.
Marketing Facilities
Development of expanded vegetable production will make it
advisable to have a washing, grading and packing facility. For
some crops the hydrocooling will be of significatn benefit to
marketing a quality pack. Such a packing and shipping
operation would be a candidate for an agri-business park
location.

APPENDIX A
Te:x:as Agricu.ltural Market Research arrl I:evelop:rent Center
D:lpa.rt:rrent of Agricu.ltural Economics l):l.te Texas N!M University
City
County
AGRIBUSINESS SURVEY
1 . BusineSS DaJI'e
2. Kin:i of business ( general cla.ssi£ication)
3. Address
Phone Number
4. Classification of business:
a. _.~ Commo:lity deaJ..er
b. Processor
d.
e.
__ Retailer
__ services
c. Wholesaler f. _ Other (specify)
5. Major lines of products
a.
b. .- ..
c.
Sales as % of total business YQ1'tlIre
19. ne:i. __ sml.
19. ne:i. __ sml .
19. __ ne:i. __ sml.
d. __ ne:i. __ sml.19.
__ sml.e. 19. nai.
f. __ ne:i. __ sml.19.
6. Is this business li::>ca.lly 0VlD.Ed: Yes No __ rx __
( If..1!.Q ) Residence of outside OW'Der
City State ______
Outside ~r's Il8.l:Ie or na.rre of the company
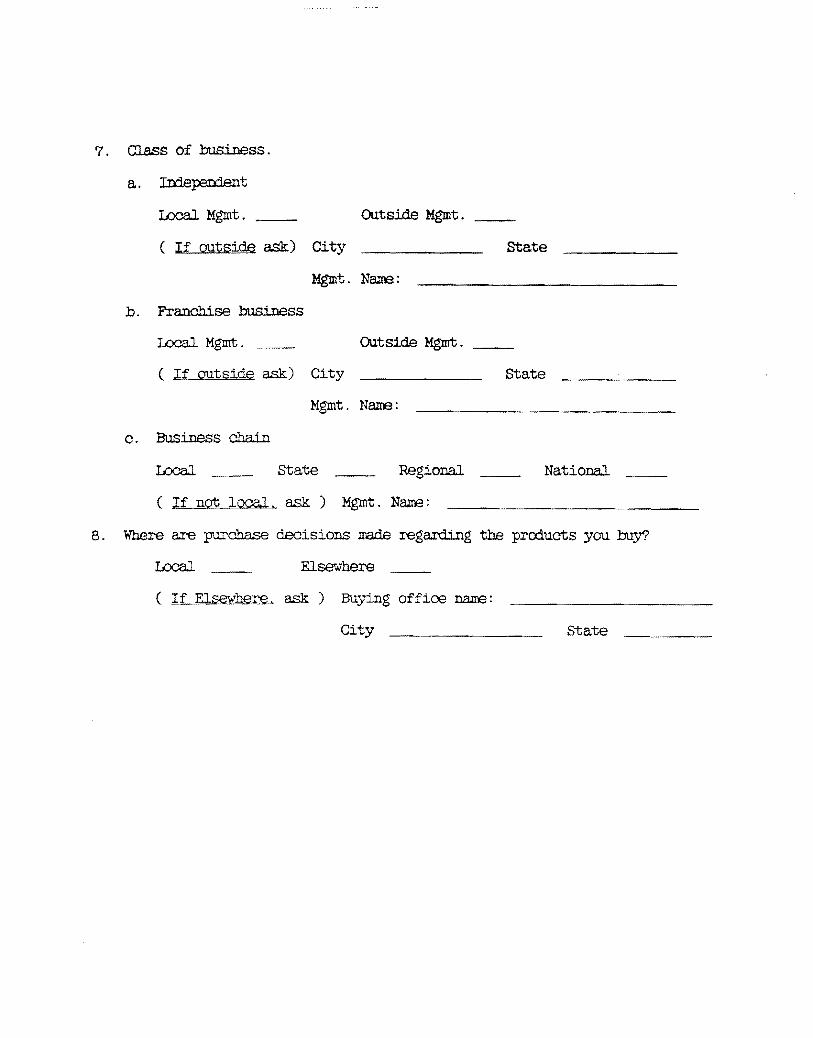
7. Class of business.
a. IIrlep:m::ient
100al MgIDt. Outside Mgmt. - ( If outside ask) City State
Mgmt. Nam9:
b. Franchise business
100al MgIDt. ~---
Outside Mgmt.
( If outside ask) City State
MgIDt. Nam9:
C. Business chain
100al - State Regional National -
( If nQt local. ask ) MgIDt. Nama:
8. Where are purchase decisions made rega.rcling the proiucts you buy?
I.ooa.l __ Elsewhere __
( If Elsewhere. ask) Buying offioo nama:
City State
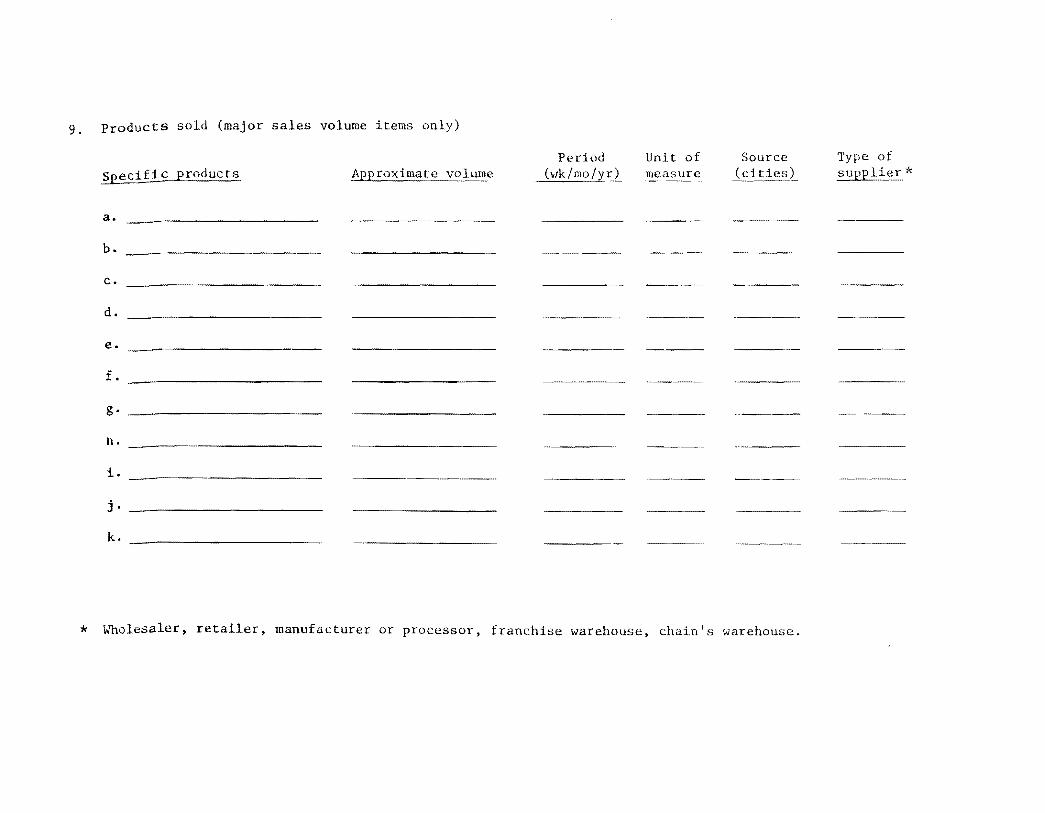
9. ProductS sold (major sales volume items only)
Period Unit of Source Type of Specific products Approximate volume . (vJk/mo/.'fJ~ measure cities) supplier *
a.
b.
c.
d.
e.
f. __----------------
g.
11.
1.
j.--------------
k.
* Wholesaler, retailer, manufacturer or processor, franchise warehouse, chain's warehouse.
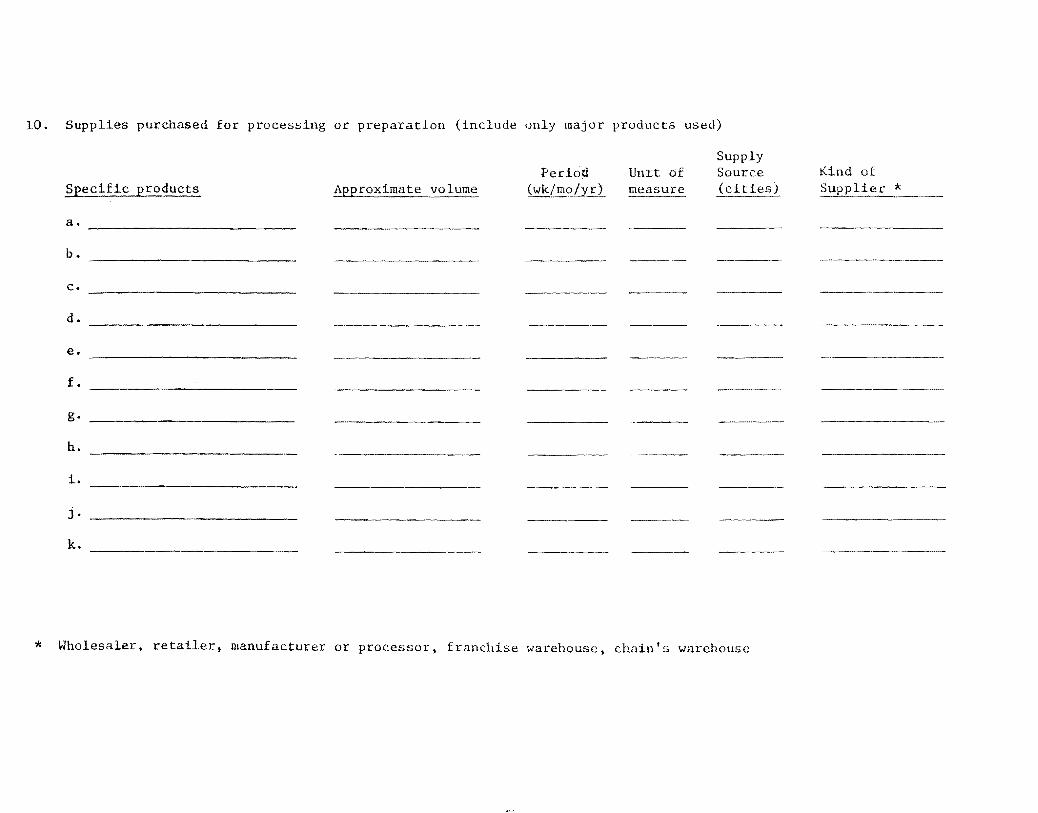
10. Supplies purchased for processing or preparation (include only major products used)
Supply Period UnIt of tZind of
Specific products Approximate volume (wk/mo/ill measure Supplier .,..
a.
b.
c.
d.
e.
f.
g.
h.
1.
j.
k.
* Wholesaler, retailer, manufacturer or processor, franchise warehouse, chain's warehouse
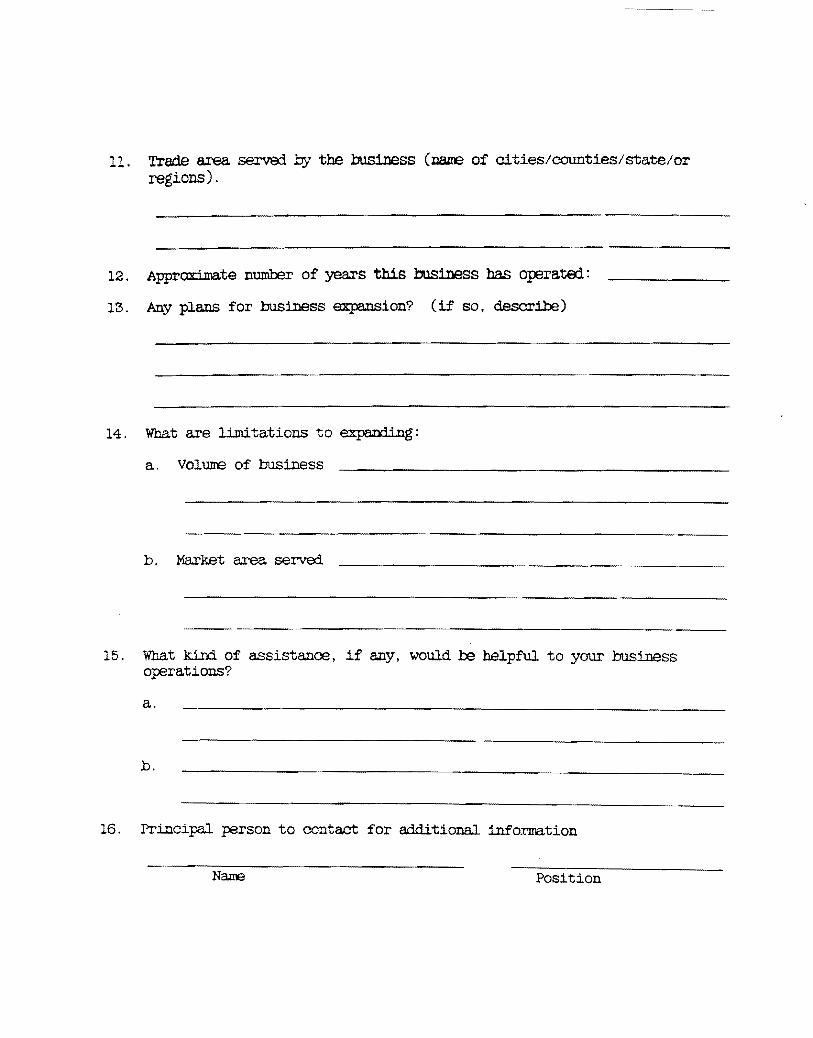
11. Trade area. serve:i by the business (D.all'e of clties/counties/state/or regions).
12. Approximate n1.lIIlOOr of years this business has operatai:
13. Any plans for business expansion? (if so, desoril:e)
14. What are limitations to expand.ing:
a. Volume of business
b. Market area serve:i
15. What kin:l of assistance, if any, would be helpful to your business operations?
a.
b.
16. Principal person to contact for additional information
Name Position