agrarian changes, poverty and scheduled castes...
TRANSCRIPT

Dr Ambedkar Institute Seminar27/03/04- RSD
1
AGRARIAN CHANGES, POVERTY AND SCHEDULED CASTES IN KARNATAKA
R. S. DESHPANDE *
1. Introduction
A casual look back at the changes in the development policy for weaker
sections in the country shows a meandering policy path towards their welfare. The
philosophy of development began from the idea of a village republic (through
community development) turning towards a heavy investment led industrial growth
followed by the redistributive resource policy (land reforms). On the heels was the
techno-centred green revolution supported by a pragmatic price policy. Realizing at
this point that in the process the miseries of bypassed regions and classes especially
those belonging to deprived Castes, increased substantially. As a response a shift in
approach was introduced through target group and area specific programmes. A
volley of welfare programmes were designed and implemented but probably with little
gains. The role of the State was becoming increasingly important through these
phases. Mid-course distortions were taken more as casual variations and the
corrective measures more akin to fire fighting than seeking a long-term solution. One
can locate two major inconsistencies in the development process. First, the
inducement as well as interventionist approaches for the development initiatives were
dominant for quite some time and favoured certain groups. The market differentiation
in terms of caste as well access were of high magnitude and the State had no option
but to intersect the market generated forces with strong interventions. Second, when
this approach was gaining weight and being consistently followed, the economic
bottlenecks (deficits, balance of payment, forex reserves etc.) forced the policy
pundits to turn back towards `market’ as the saviour. As a result, a strong unfounded
belief came to settle down that the economic forces operating in the market will
* Professor and Head, Agricultural Development and Rural Transformation Unit, Institute for Social and Economic
Change, Nagarabhavi, Bangalore-72, Paper presented at Dr. Ambedkar Institute of Social and economic Change, Mumbai- 27-28
th March 2004.

Dr Ambedkar Institute Seminar27/03/04- RSD
2
correct all distortions including social discrimination. This has to be viewed on the
background of the fact that a large section of the Indian rural workforce comes from
weaker sections and their share of productive resources as well as their market
participation is extremely weak.
The success of the market is often highlighted on the background of the
failure of the State. This argument however, does not hold in practice when we are
confronted with a large section of economically weak having little capacity to
participate in the market. In a theoretical situation, the State and Market are inter-
dependent and compliments of each other in the sense that if one fails the other may
not perform. This is because of the simple fact that the results of non-performance of
one, largely overlaps the determinants of the failure of the other. In this context, the
failure of either of these inflicts economic hardship on the deprived Castes as a social
group due to five important reasons. First, the group of deprived Castes as a social
stratum more or less matches with the weakest economic class. For centuries, they
were not provided even an opportunity to enhance their skills (occupational
immobility) and forcibly retained in the same occupations providing little economic
independence. Second, the political will as well as the bureaucratic mechanism
always favoured the higher castes. Unfortunately this was achieved through the
irrational social customs propounded by the higher castes in the form of rules
governed by the caste system. Therefore, even when the opportunities were
provided, a large number of the population belonging to the deprived Castes, could
not derive full benefits out of the opportunities. The lead-lag relationship between
development and the Social Deprivation was the major reason of the failure of the
policy. No doubt, in overall impact analysis we have some positive effects but there is
a plethora of evidence to suggest that the upper strata appropriates access to
resources. Third, it is a fact that the deprived castes are concentrated in rural areas
and have to be largely identified with the core group of poor. The mixed success of

Dr Ambedkar Institute Seminar27/03/04- RSD
3
the Poverty Alleviation Programmes affected this group adversely as the socially
influential poor garnered the benefits. As a result, inequality across the income strata
has changed unfavourably. Such a change causes higher welfare losses, in a
relative sense. Further, the investment on infrastructure in the regions with higher
concentration of deprived castes is much lower, thereby restricting the access to
infrastructure and its per capita availability to them. These bottlenecks in the State
policy are confounded by the prevailing interface of this group with the market.
Fourth, as an effect the market participation of the deprived Castes is also extremely
marginal. In this context three markets are particularly relevant to the poor viz. Land
market, Labour market (or resource markets in general) and Product market.
Deprived castes are severely constrained in responding to market signals both
because of their weak bargaining position (as consumers as well as producers) and
due to the inadequate information that they have about such signals. It can be easily
seen that their participation in all the three markets is constrained by the vantage
positions of the ‘others’ rather than their own weaknesses. Even when they
participate in the market they are not able to set a `reserve price’ for their labour nor
they are able to get remunerative prices for their products. Even as consumers, they
have weak bargaining power. Lastly, it is a bare fact that the group of deprived
castes is extremely weak in its asset position especially the productive assets .
Therefore, most of the members of this group depended on their labour, participating
as weak bargainers in the labour market. Even those who hold some assets like land
also find themselves in weak position to utilise the returns from such assets.
This paper attempts to argue that the welfare measures taken hitherto for the
Scheduled Castes and Scheduled Tribes have not dealt squarely with the major
discriminating factors namely, the productive assets in rural area. We consider
access to land as the major plank for argument. My attempt here is to view this in the
context of Karnataka. First, the concentration of Scheduled Castes across the

Dr Ambedkar Institute Seminar27/03/04- RSD
4
districts of Karnataka is attempted to bring to the fore that the usual hypothesis about
their concentration need a revisit. Second, we look into the deprivation of Scheduled
Castes in the context of land, as it is the basic factor of production in rural areas.
Third, we review the schemes operating in Karnataka and provide a view about their
anticipated impact on the aggregate welfare.
2. A Backdrop
Out of the total population of the country about 17 per cent belong to
Scheduled Castes and this proportion varies from less than 1 per cent in Arunachal
Pradesh to more than 30 per cent in Punjab (see table 1). Majority of them stay in
rural areas. In an across State analysis 21 to 71 per cent fall below poverty line
(Thorat, 1996). Analysis done at the Planning Commission indicates that the
proportion of population of Scheduled Castes falling below poverty line in rural areas
was 50.07 per cent during 1987-88 which has marginally declined to 48.11 per cent
by 1993-94, but this decline is much smaller compared to the reduction of in the non-
Scheduled Caste group. We have presented here a comparative picture of the
distribution of Scheduled Caste population across States, the proportion of Scheduled
Caste population below poverty line and the agricultural worker status. The
concentration of Scheduled Caste population in rural areas is highest in Punjab,
Haryana, Uttar Pradesh, West Bengal, and Tamil Nadu. Though poverty does not
have one to one correspondence with the proportion of population belonging to
Scheduled Castes, it is quite high in most of those States with only a few exceptions.
But interestingly the States with high proportion of Scheduled Caste population in
rural areas show smaller proportion of cultivators belonging to SC and higher
proportion of agricultural labour under this category. In other words the market
participation of this group in the labour market is much higher as compared to their
participation in product market as cultivator (Thorat, 1996).

Dr Ambedkar Institute Seminar27/03/04- RSD
5
Karnataka is known for its strong economic performance during 1990s.
Historically its performance has always been at about the average of the Indian
States on many indicators. Karnataka is a state with an area of 19 million ha (5.8% of
the area in the country) and population of about 55 million, about 70% of which live in
rural areas. During nineties, Karnataka’s average annual rate of economic growth
was about 6.6%, when that of the All-India average of 6.2% (1993-94 to 2001-02).
The secondary sector grew at about 5.6% per year, while the agricultural and allied
services sector grew at 1.0 % per year due to the continuous droughts of three
consecutive years. Karnataka has a large share of population belonging to Scheduled
Castes. The proportion of Scheduled Caste population has been increasing more
due to definitional changes than the demographic pattern. Even then Karnataka is
one of the states with high density of Scheduled Caste population.
Table 1: Distribution of Scheduled Caste Population Across States, Poverty and Agricultural Worker Status
State Per cent of Scheduled Caste Population (Rural) 1991
Per cent SC below Poverty line (1983-84) (Rural)
Per cent of Scheduled Caste (1991) (Rural)
Cultivators Agri. Labourers
Andhra Pradesh 13.9 51.0 8.4 32.4
Bihar 15.3 71.1 6.2 27.7
Gujarat 7.0 39.9 2.7 12.9
Haryana 21.6 27.9 4.0 58.4
Himachal Pradesh 25.9 23.5 27.6 43.1
Karnataka 18.2 54.1 12.3 30.8
Kerala 11.0 43.9 3.1 27.2
Madhya Pradesh 14.8 59.3 10.5 24.4
Maharashtra 11.5 55.9 4.9 20.1
Orissa 16.7 54.9 11.0 27.8
Punjab 31.9 21.8 4.0 71.9
Tamil Nadu 22.9 59.4 12.7 401
Uttar Pradesh 23.2 57.3 18.6 48.3
West Bengal 27.6 52.0 23.4 40.6
Sources: 1. Census of India 1991, Series I India, Paper 2 of 1993. 2. National Sample Survey 1983-84 Round

Dr Ambedkar Institute Seminar27/03/04- RSD
6
Recent estimates of statewide income poverty rates (headcount index)
suggest that these are declining in aggregate computations. In Karnataka, the
proportion of total poor declined, from about 33% in 1993/94 (Government of
Karnataka 1999)1 to about 20% in 1999/2000. Of more notable achievement, rural
poverty rates appear to have nearly halved from 30% in 1994/94 to 18% in
1999/2000. But despite this decline in overall poverty rates,
the large majority of the poor are in rural areas and located in the Scheduled Castes.
In 1999/2000, the total number of the poor in the State was 10 million, about 6 million
are in rural areas of which a large share belongs to Scheduled Castes. The extent of
rural poverty, based on 1993/94 figures, also varies extensively across districts,
ranging from about 57% in Bidar to about 7% in Dakshina Kannada (Figure 1).
1 Economic Survey 2003-04

Dr Ambedkar Institute Seminar27/03/04- RSD
7
A clear profile of poverty in Karnataka emerges from the above figure. Bidar,
Kolar, Dharwad, Gulbarga and Bellary are the districts that show concentration of
poor whereas, D Kannada, Hassan, Chikmagalur and U. Kannada do not have large
proportion of poor. Composition of Social groups in the State indicates that
Scheduled Castes in rural areas suffer great social depravation, greater than urban
areas.
In order to look into the hypothesis that the density of poor is higher in the
districts with higher concentration of Scheduled Caste population, we have presented
in table 2, poverty ratios along with the share of SC population across districts. It can
be seen from the table that even though one cannot establish one to one
correspondence between the two indicators, largely the districts with fairly high
concentration of Scheduled Caste population also have higher poverty ratios. (See
Figure 2).

Dr Ambedkar Institute Seminar27/03/04- RSD
8
Table 2: Poverty Ratios in Karnataka
District
1993-94
TOTAL RURAL
% below poverty line
%of SC population
% below poverty line
%of SC population
Bangalore 31.42 9.66 12.40 3.15
Bangalore rural 38.17 4.44 42.20 5.08
Belgaum 29.86 5.52 27.17 5.76
Bellary 44.5 4.95 43.75 4.99
Bidar 56.06 3.53 57.00 4.04
Bijapur 28.98 6.92 19.31 7.46
Chikmagalur 15.61 2.66 11.11 3.10
Chitradurga 39.00 5.87 40.11 6.34
Dakshina Kannada 8.91 2.39 6.68 2.49
Dharwad 49.75 5.56 47.46 5.15
Gulburga 45.76 8.29 45.81 8.90
Hassan 14.44 3.70 9.50 4.27
Kodagu 20.73 0.80 15.24 0.91
Kolar 48.45 7.73 47.93 8.07
Mandya 30.16 3.08 23.89 3.38
Mysore 28.94 8.11 26.64 8.51
Raichur 25.11 5.40 18.72 5.78
Shimoga 25.56 4.59 16.06 4.96
Tumkur 40.64 5.55 42.18 6.45
Uttara Kannada 24.97 1.25 20.10 1.20
State 33.16 100.0 29.88 100.0
Source: Govt of Karnataka, Directorate of Economics and Statistics, Bangalore.
Figure 2: Districtwise Percent of Scheduled Caste Population and Percent
below Poverty Line
0.00
10.00
20.00
30.00
40.00
50.00
60.00
Kod
agu
Utta
ra K
anna
da
Dak
shina
Kan
nada
Chikm
agal
ur
Man
dya
Bidar
Has
san
Ban
galore
rura
l
Shim
oga
Bellary
Raich
ur
Belga
um
Tumku
r
Dha
rwad
Chitra
durg
a
Bija
pur
Kolar
Mys
ore
Gul
burg
a
Ban
galore
%of SC population % below poverty line

Dr Ambedkar Institute Seminar27/03/04- RSD
9
In addition to this we looked into the other indicators of deprivation. The other
indicators of human deprivation are shown in the table 3 below. It is expected that the
poverty ratio will have a very high correlation with the other indicators of deprivation,
but that does not come out very clearly.
Table 3: Poverty and Other Indicators of Human Deprivation
District Life
expectancy
at birth
Adult
literacy rate
Combined
enrolment
ratio(Ist to
Xth class)
Bangalore 65.78 73.49 84.8
Bangalore Rural 66.69 42.38 79.8
Balgaum 65.08 47.17 73.6
Bellary 60.32 41.04 72.7
Bidar 63.74 38.18 70.3
Bijapur 62.76 48.61 68.4
Chikmagalur 64.62 55.66 79.4
Chitradurga 61.92 50.08 85.6
Dakshina Kannada 68.82 71.22 100.0
Dharwad 62.78 53.75 72.8
Gulbarga 63.98 33.83 58.6
Hassan 65.40 50.58 76.9
Kodagu 68.04 64.56 92.4
Kolar 62.87 43.58 82.1
Mandya 63.97 40.14 78.7
Mysore 63.25 41.93 69.0
Raichur 65.55 32.64 49.7
Shimoga 62.09 56.52 81.5
Tumkur 60.64 47.71 85.3
Uttara Kannada 66.96 62.41 84.8
STATE 62.07 50.94 77.0
Source: Govt of Karnataka, Directorate of Economics and Statistics, Bangalore
The correlation between the poverty ratio female literacy as well as IMR
(female) is 0.56, whereas, that with IMR (male) is 0.27. These macro indicators
however, do not bring out the micro reality. It is well known that the infant mortality is
quite high among poor and more so in the poor belonging to deprived castes. About
44% of children under three years were found to be underweight in 1998-99
(Economic Survey, 2004, P 323). Out of these 52.80% belong to Scheduled Castes
and 55.7% belong to Scheduled Tribes. The infant mortality rate (1998-99) was very
high at 85 for STs and 70 for SCs which is quite high compared to 56 for other social

Dr Ambedkar Institute Seminar27/03/04- RSD
10
groups. The illiteracy rate (1995/95) in rural areas at 54% is more than double
those in urban areas (23%) (NSSO, 1998). Literacy rates seem to have been strongly
but inversely related with the density of poor.(Figure 3)
Moreover, illiteracy rates among heads of poor households in rural areas in
1993/94 were 74% compared to 44% among heads of poor urban households
(Lanjouw 2000). Rural areas also had more limited access to basic services. About
87% of the rural population in 1993/94 did not have access to sanitation services (i.e.
latrines), compared to 28% of the urban population in 1993/94. Only 38% of the rural
population had access to tapped water compared to 85% of the urban population in
the same year. Rural households had to depend on handpumps (34%), wells (20%)
and tanks or ponds (8%) as a source of drinking water and among these Scheduled
Castes as a group are precariously placed.
Dr Ambedkar Institute Seminar27/03/04- RSD
11
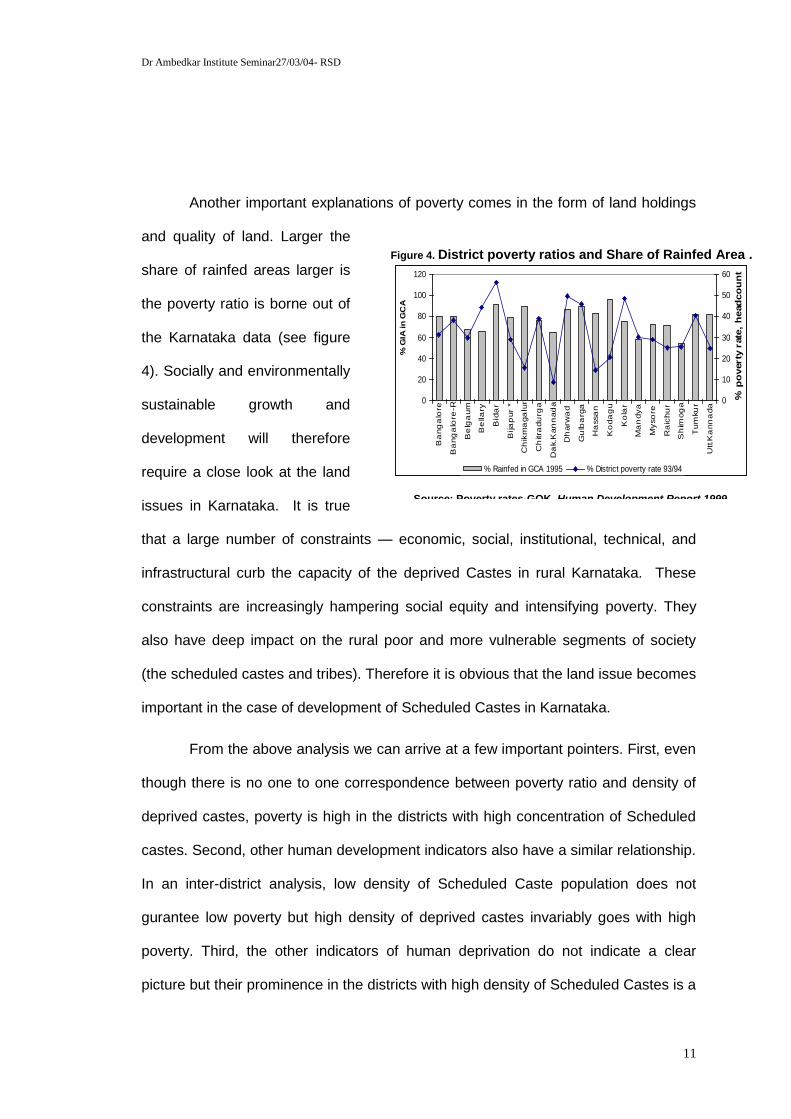
Another important explanations of poverty comes in the form of land holdings
and quality of land. Larger the
share of rainfed areas larger is
the poverty ratio is borne out of
the Karnataka data (see figure
4). Socially and environmentally
sustainable growth and
development will therefore
require a close look at the land
issues in Karnataka. It is true
that a large number of constraints — economic, social, institutional, technical, and
infrastructural curb the capacity of the deprived Castes in rural Karnataka. These
constraints are increasingly hampering social equity and intensifying poverty. They
also have deep impact on the rural poor and more vulnerable segments of society
(the scheduled castes and tribes). Therefore it is obvious that the land issue becomes
important in the case of development of Scheduled Castes in Karnataka.
From the above analysis we can arrive at a few important pointers. First, even
though there is no one to one correspondence between poverty ratio and density of
deprived castes, poverty is high in the districts with high concentration of Scheduled
castes. Second, other human development indicators also have a similar relationship.
In an inter-district analysis, low density of Scheduled Caste population does not
gurantee low poverty but high density of deprived castes invariably goes with high
poverty. Third, the other indicators of human deprivation do not indicate a clear
picture but their prominence in the districts with high density of Scheduled Castes is a
Figure 4. District poverty ratios and Share of Rainfed Area .
0
20
40
60
80
100
120
Ba
ng
alo
re
Ba
ng
alo
re-R
Be
lga
um
Be
lla
ry
Bid
ar
Bija
pur
*
Ch
ikm
aga
lur
Ch
itra
du
rga
Da
k.K
an
nad
a
Dh
arw
ad
Gu
lba
rga
Ha
ssa
n
Ko
da
gu
Ko
lar
Ma
ndya
Myso
re
Ra
ichu
r
Sh
imog
a
Tum
ku
r
Utt.K
ann
ada
% G
IA in
GC
A0
10
20
30
40
50
60
% p
overty
rate
, h
ead
co
un
t
% Rainfed in GCA 1995 % District poverty rate 93/94
Source: Poverty rates-GOK, Human Development Report 1999.

Dr Ambedkar Institute Seminar27/03/04- RSD
12
reality. Lastly, land as an important productive asset in its ownership as well as
quality explains the poverty and deprivation among the Scheduled Castes.
3. Land Issues and the Deprived Castes
One of the important aspects detailed in the earlier discussion is the nature
of the landholding among Scheduled Castes. In an earlier study, it was noted that
land holding of this group emerges as an important determinant in poverty alleviation
process (Kamble, 1995). Land has always been an important asset which indicates
not only the economic position but also serves as the closest proxy for social and
political strength. It further provides means of participation in the factor as also
product market. Even after the two phases of land reforms in the country, it is difficult
to state that the interests of the deprived Castes are well protected. We intend to
analyse here the changes in the structure of land holdings of Scheduled Castes as
against the overall changes in the agrarian structure during the last two decades.
Land as an asset not only indicates the access to the productive resource but also
relative position in market participation be it land, labour or product market. Our
intention here is limited only to test the hypothesis that the market participation of the
deprived Castes in the market is extremely negligible and declining. In the context of
current changes in economic policy these are detrimental to the welfare of the
deprived castes.
The density of Scheduled Caste population in Karnataka is certainly
undergoing a change but such change is occurring not due to demographic
components but due to other reasons (Yadav 2003). Migration is one of the
important determinants so also the changes in the list of Scheduled Castes.

Dr Ambedkar Institute Seminar27/03/04- RSD
13
Table 4: Percentage of Workers by Industrial Categories – Rural (Male) – 1961-1991
Category
Scheduled Castes Non Scheduled Castes
1961 1971 1981 1991 1961 1971 1981 1991
Cultivators 52.30 36.57 40.17 24.84 63.98 54.27 55.32 50.62
Agriculture Lab. 27.15 44.62 42.00 46.79 14,75 25.23 23.62
26.44
Agriculture 79.44 31.19 82.17 81.63 75.73 79.50 72.82 77.06.
Non-Agriculture 20.56 18.81 17.83 18.37
21.27 20.50 21.06 22.94
Source: Population Censuses Karnataka 1961, 1971, 1981, 1991.
Table 5(a) : Changes in Composition of Workforce Across Censuses: Scheduled Caste
(Per cent Change)
Category 1971-81 1981-91
Main Workers 30.91 21.60
Cultivator 43.81 5.47
Agri. Labour 23.22 35.45
Agriculture 32.49 20.79
Non-Agriculture 24.06 25.32
Table 5(b): Changes in Composition of Workforce Across Censuses: Other Social Groups
(Per cent Change)
Category 1971-81 1981-91
Main Workers 18.65 15.70
Cultivator 20.94 5.87
Agri. Labour 11.07 29.51
Agriculture 17.81 12.94
Non-Agriculture 21.92 26.03
The distribution of holdings across the size classes helps us to understand the
relative asset position of the cultivators belonging to Scheduled Castes. The
distribution of holding presented in Table 6 and Table 7, for the three censuses
(1980-81, 1990-91 and 1995-96) shows the proportion of cultivators belonging to
different size group of operational holding The general trend of the distribution of

Dr Ambedkar Institute Seminar27/03/04- RSD
14
holding is reflected even in the land distribution of Scheduled Castes. The number of
holdings under the group of marginal farmers is increasing and that under the size
group of large holdings is declining. But the increase in the number of marginal
farmers belonging to Scheduled Castes is much faster than in the other Social
Classes (growth rates of 0.51 and 0.42 per cent per annum). Another, most pertinent
observation from this table is the group of farmers belonging to the small size of
holding, belonging to Scheduled Castes, has declined, whereas, the Small size of
holding has shown an increase among the other social classes. This gets clearly
reflected in the average size of holding. The general trend in the average size of
holding across the size classes shows a reduction in the land held per cultivator. The
average size of holding of a cultivator belonging to Scheduled Castes was 1.71
hectares per cultivator which came down to 1.43 hectares recording a rate of decline
of 16 per cent as against only 8 percent decline in the other social groups. The
decline has come significantly from the highest two size classes of holdings (Table 8).
Table 6: Distribution of Operational Holdings According to Social Groups for
Size Classes
(In Per cent) Size
Class Scheduled Castes Other Social Groups Total
1985-86 1990-91 1995-96 1985-86 1990-91 1995-96 1985-86 1990-91 1995-96
Marginal 44.40 36.05 48.35 35.49 38.60 41.11 36.43 39.16 41.95
Small 30.00 31.50 31.32 25.74 26.76 26.93 26.29 27.46 27.44
Semi medium
17.20 16.46 15.25 21.50 20.49 19.90 21.04 20.12 19.35
Medium 7.20 5.80 4.67 13.90 11.68 10.19 13.13 11.01 9.55
Large 1.20 0.78 0.41 3.37 2.47 1.91 3.11 2.25 1.74
All Size 100.00 100.00 100.00 100.00 100.00 100.00 100.00 100.00 100.00
Source : Agricultural Census 1995-96, Part I, Govt. of Karnataka, Bangalore. Table 7: Distribution of Area under Operational Holdings According to Social
Groups for Size Classes ( Area in 000’ hectares)
Size class Schedule Caste Schedule Tribe Others Total
1990-91 1995-96 1990-91 1995-96 1990-91 1995-96 1990-91 1995-96
Marginal 147 (14.77)
179 (17.24)
52 (8.47)
66 (9.98)
873 (8.15)
1003 (18.54)
1072 (8.70)
1248 (17.56)

Dr Ambedkar Institute Seminar27/03/04- RSD
15
Small 291 (29.25)
328 (31.60)
125 (20.36)
149 (22.54)
1892 (17.66)
2003 (37.92)
2308 (18.73)
2480 (34.89)
Semi medium 280 (29.14)
292 (28.13)
172 (28.01)
196 (29.65)
2749 (25.66)
810 (14.97)
3201 (25.98)
1298 (18.26)
Medium 211 (21.21)
190 (18.30)
186 (30.29)
185 (27.99)
3373 (31.49)
115 (2.13)
3770 (30.60)
490 (6.89)
Large 66 (6.63)
49 (4.24)
79 (12.87)
65 (9.83)
1825 (17.04)
1479 (27.34)
1970 (15.99)
1593 (22.41)
All sizes 995 (100.00)
1038 (100.00)
614 (100.00)
661 (100.00)
10712 (100.00)
5410 (100.00)
12321 (100.00)
12109 (100.00)
Note : Figures within brackets are percentages to the column totals. Source : Agricultural Census 1995-96, Part I & II, Govt. of Karnataka, Bangalore.
One important observation from this data on distribution of land holdings
comes out prominently, viz., the cultivators belonging to Scheduled Castes have
extremely small market access (because only a small proportion of them belonging to
the holding sizes which can claim some sizeable marketable surplus) and further their
density in this group has reduced even during the shortest span of five years.
Furthermore their participation in the land lease market is also marginal and largely
with small fragments of land. Most of it is illegal as tenancy is not permitted in
Karnataka, but then the farmer belonging to weaker section is at the receiving end.
Table 8:Average Size of Holding According to Major Size – Classes
(In Hectares)
Sl. No.
Size/ Classes
Land holdings belonging to
Scheduled Castes Other Social Groups All Social Groups
1985-86
1990-91
1995-96
1985-86
1990-91
1995-96
1985-86
1990-91
1995-96
1. Marginal 0.51 0.51 0.51 0.48 0.47 0.47 0.48 0.47 0.48
2 Small 1.45 1.45 1.41 1.46 1.46 1.46 1.46 1.46 1.45
3 Semi-Medium
2.69 2.67 2.53 2.79 2.76 2.75 2.78 2.75 2.74
4. Medium 5.83 5.70 5.59 6.02 5.95 5.90 6.01 5.93 5.87
5 Large 14.17 13.20 16.33 15.43 15.21 15.08 15.46 15.15 15.03
6. All Size Classes
1.71 1.56 1.43 2.21 2.21 2.02 2.61 2.13 1.95
Notes: 1) Land holdings sizes are: Marginal – upto 1 hectare, Small –1.0 to 2.0
ha., Semi-Medium 2.0 ha., Medium – 4.0 to 10.0 ha., Large – Above 10 hectares 2) * Other Social Groups include all other social groups other than
Scheduled Castes and Scheduled Tribes.

Dr Ambedkar Institute Seminar27/03/04- RSD
16
Source: Agricultural Census, 1985-86, 1990-91 and 1995-96 Govt. of Karnataka,
Bangalore.
When we look at the proportion of irrigated area against the rainfed area, it is
easily discernible that irrigation has not helped to economically strengthen the
Scheduled Castes. According to 1995-96 Agricultural Census about 18 lakh holdings
out of the total 62 lakh holdings get the benefit of irrigation. There are 14.9 thousand
holdings belonging to Scheduled Castes that receive irrigation, whereas the `Other
Social Groups’ have 19.6 lakh holdings receiving irrigation. The total area under
irrigation is about 19 per cent but a large share of this is in the lower size classes
(48.0 per cent accounted by the marginal farmer group). The percentage of irrigated
area in the group of Scheduled Castes is 18 per cent. On an average, the irrigated
size of holding of Scheduled Caste group is about 0.82, whereas, the same for the
`other’ social groups is 1.14 hectares. Thus, even on the count of land augmentation
the group of Scheduled Caste cultivators does not seem to be on any strong ground.
Therefore, naturally the generation of marketable surplus from this group is likely to
be negligible and their participation in the agricultural commodity market is more in
the form of consumer than producer. Further, their participation in labour market is
quite strong in terms of numerical strength but not necessarily in terms of bargaining
power for wages. Though, there is no strong empirical evidence on this count, any
keen observer of the micro-level dynamics can even casually note this in the country
side.
Another way of looking at the participation of the Scheduled Caste group in
the agricultural commodity market as producer, is to ascertain their decision
behaviour in terms of crop combinations. This can be ascertained by looking into the

Dr Ambedkar Institute Seminar27/03/04- RSD
17
land allocation to the commercial crops by the group of Scheduled Castes. However,
any analysis in absolute terms may not give correct picture of their participation.
Table 9: Size Classwise Net Sown Area Irrigated and Unirrigated Belonging to Scheduled Castes: 1990-91 and 1995-96
(Per cent to NSA)
Sl. No.
Size/Class of Holding
Net Cropped Area
Irrigated Unirrigated
1990-91 1995-96 1990-91 1995-96
1. Marginal 20.61 28.73 79.39 71.27
2. Small 18.68 20.21 81.32 79.79
3. Semi-Medium 17.85 18.72 82.15 81.28
4. Medium 17.47 17.18 82.53 82.82
5. Large 14.94 12.87 85.06 87.13
6. All Classes 18.19 18.92 81.81 81.08
Notes: 1) Land holdings sizes are: Marginal – upto 1 hectare, Small –1.0 to 2.0
ha., Semi-Medium 2.0 ha., Medium – 4.0 to 10.0 ha., Large – Above 10 hectares
Source: Agricultural Census, 1995-96, Government of Karnataka, Bangalore.
Therefore, we resorted to get at the relative share of the group of Scheduled
Castes in the cropping pattern of commercial crops. For the purpose of our analysis
we have taken total oilseeds, cotton, total fibres and total non-feed crops. Sugarcane
was not considered here as it has very little share in the total gross cropped-area.
We have presented in Table 10 (a) the area allocated by the farmers
belonging to Scheduled Castes to the commercial crops (excluding sugarcane) as a
share of the total area allocated to these crops by all cultivators. Therefore, if the
area allocated to the market oriented crops is in the neighbourhood of this share we
can comfortably say that the cultivators belonging to Scheduled Caste would probably
have fair access to market (notwithstanding the facts about within market
discrimination). In other words, the share of commercial crops of about 10 per cent
gives opportunities to this group to participate in the market with equal opportunity.
But as can be seen from the table hardly 6 per cent of the total area allocated to non-

Dr Ambedkar Institute Seminar27/03/04- RSD
18
food crops comes from the farmers belonging to deprived Castes. This is certainly
quite lower than their due share It is necessary to note here that we have assumed
the major discriminating factors like access to technology, yield levels, prices
received by farmers as given. In fact, these variables operate more strongly in
distorting the market unfavourably for the deprived Castes. Thus, economic factors
alone may not explain the present position as well as future impact of NEP.
Table 10 (a): Percent Share of Area Allocated by Scheduled Castes:1995-96
Crops Irrigated
Area Un-
irrigated Total
Cereals 6.72 9.55 8.94
Pulses 3.92 10.94 10.67
Sugarcane 4.02 0.00 4.02
Oilseeds 5.92 9.11 8.74
Fibres 4.76 7.23 6.79
Fruits and Vegetables 4.48 7.00 6.37
Non Food Crops 5.79 8.37 8.03
Note: Percent share of area allocated by SC group of Farmers to total area under the crop
Source: .Govt of Karnataka, Agricultural Census – 1995-96
Table 10 (b): Area Allocated to Commercial Crops by the Group of Scheduled Caste Cultivators as a Share of their Total Area Allocated 1995-96
(Per cent)
Sl No
Crops Marginal Small Semi-Medium
Medium Large All
1 Paddy 16.15 7.67 6.33 5.03 6.94 8.25
2 Jowar 10.47 16.87 19.56 21.37 24.19 17.65
3 Cereals 59.28 51.58 49.59 47.37 45.73 51.34
4 Foodgrains 74.65 69.57 68.11 67.37 66.17 69.49
5 Non-foodcrops
25.35 30.43 31.89 32.63 33.83 30.51
Notes: Land holdings sizes are: Marginal – upto 1 hectare, Small –1.0 to 2.0 ha.,
Semi-Medium 2.0 ha., Medium – 4.0 to 10.0 ha., Large – Above 10 hectares
Source: .Govt of Karnataka, Agricultural Census – 1995-96

Dr Ambedkar Institute Seminar27/03/04- RSD
19
4. Welfare Schemes for Scheduled Castes in Karnataka
Karnataka is one of those few states that have incorporated number of welfare
schemes. Historically it began under the Chief Ministership of Late Sri Devaraj Urs
and later on carried by the other political leaders. The schemes cover food security,
education to the children, schemes to provide shelter, old age pension, hostels for
students, gender specific schemes for women and concessions for education.
4.1. Food Security to the Poor
One of the major initiatives taken for providing food security to the weaker
sections is by providing them easy and assured access to food. This is intended
through the Public Distribution System network. A targeted distribution system was
introduced and a distinction was made in the PDS cards issued to the beneficiaries.
The criteria for the issue of Ration cards under different categories are as under:
Table 11: The Status of Ration Cards as on 31-10-003 is as under:
Type of Ration Cards
Rural Urban Informal Rationing Area
Total
YELLOW+AAY 249309 5513851 5536840 6300000
i. AAY (Anthyodaya Anna Yojana) Cards:
AAY cards to the poorest of the poor families both in Rural and Urban areas.
Cumulatively till October 2003. AAY cards have been issued to 4.80 lakh identified
families under this scheme. The process of issue of ration cards to the additional 2.40
lakh families are under progress.
ii. Yellow Cards:
Yellow cards are issued to families in rural areas with an annual income of
Rs.12,000/- and below and in Urban Informal Rationing (IR) areas with an annual
income of Rs.17,000/- below and in persons living in slums.
In addition to these PDS cards are also given to those above certain income
level and above poverty line.

Dr Ambedkar Institute Seminar27/03/04- RSD
20
The State Government has issued instruction to the district Deputy
Commissioners to involve the Panchayati Raj Instructions in the Public Distribution
System, to make it more effective and transparent. Among the steps taken to make
the scheme effective following steps are taken:
i. The list of Below Poverty Line Families is exhibited in the Gram Panchayat
Office and other public offices, which would help in identifying the
ineligible families.
ii. Beneficiaries will have access to such lists and prices for scale of issue of
food grains, list of members of Vigilance Committees have to be published
at the Gram Panchayat Office and other public places for the information
of the general public.
iii. A Vigilance Committee is constituted to review the effective functioning of
the Fair Price Shop and to report the shortcomings if any, to the
concerned District offices. One Committee will function for each fair price
shop with eight members out of which one of the members would be an
elected member of the Gram Panchayat.
iv. The District Officers shall initiate legal action based on the
reports/recommendations of the Vigilance Committees
4.2. Education oriented Schemes
Proportion of dropouts from the schools is quite high among poor and more so
among the Scheduled Castes. In order to reduce the dropouts from schools a few
innovative schemes were introduced. A number of programmes have been
implemented in order to bring the out of school children into schools. These include i.
Children Census; ii. Enrolment Drive; iii. Chinnara Angala (backyard School); iv.
Cooliyinda Shalege (from labour to school); v. .Beediyinda Shalege (from street to
school); vi. Baa Baale Shalege (Bringing back Girls to school); vii. Baa Marali
Shalege (Come back to School); viii. Flexi Schools (Sadaa Shale). All these

Dr Ambedkar Institute Seminar27/03/04- RSD
21
programmes attempt to get the children back to schools. The success of these
programmes has not been evaluated and so also the impact of these on the
Scheduled Castes.
4.3. Housing Schemes
i. Ambedkar Housing Scheme for Rural Areas
This is the housing scheme for SC/STs, whose annual income is Rs.11, 800/-
or below. An assistance of Rs.20,000/- is paid aa subsidy. From 95-96 to 2001-02,
1,43,403 houses have been built. During 2001-02, 26,489 houses and during 2002-
03, 18,415 houses have been built. During the year 2003-04 (upto Oct. 2003) 10,264
houses have been built.
ii. Urban Housing Schemes:
There are two schemes operating in urban areas. First scheme involves
construction of EWS houses by Rajiv Gandhi Rural Housing Corporation Limited
under Ashaya. The second scheme includes free distribution of sites for persons
below the poverty line under Ashraya. About 1,15,719 houses were constructed in
urban areas under the “Ashraya” since inception i.e., from 1990-91 to 2003-04 (upto
Oct. 003). In 2001-02, 18,167 sites were distributed under Ashraya in urban areas
and in 2002-03, 1,127 sites were distributed. Total of 21,747 EWS houses were
constructed in urban areas in the year 2003-04 (upto Oct. 2003) 11,467 houses were
constructed in urban areas including 10,477 under Urban Ashraya and 990 under
Urban Ambedkar.
iii. Indira Awaas Yojana:
The Indira Awaas Yojana renamed as Integrated Rural Housing, which has become
an independent scheme from 1st January 1996, aims at providing houses for
Scheduled castes and Scheduled Tribes and Freed Bonded Labourers, who are
below the poverty line. Coverage is also extended to other poor people subject to the

Dr Ambedkar Institute Seminar27/03/04- RSD
22
condition that financial assistance does not exceed 40 per cent of the total allocation.
From 1990-91 to 2003-04 (upto Sept. 2003), 5.84 lakh houses have been built;
28,910 houses were constructed in 2002-03 and 10,729 in 2003-04 (upto Sept.2003).
Table12: Achievements under Integrated Rural Housing Scheme (Indira Awas
Yojane)
(In lakhs)
Year Programme Progress
2000-01 0.31 0.28**
2001-02 0.32 0.29**
2002-03 0.33 0.29**
2003-04(upto Sept.03) 0.38 0.11**
Note: **include backlog houses
Out of the total funds 20 per cent has been earmarked for upgradation of
kutcha houses from 1999-2000. Rs.10,000 subsidy is provided for upgrading the
kutcha houses. Since 1999-2000 to 2003-04 (upto Sept. 2003) 0.54 lakh houses have
been built; out of which 13,542 houses were upgraded in 2002-03 and 4,463 in 2003-
04 (upto Sept.2003)
iv. SLUM CLEARANCE : Centrally Sponsored Valmiki Ambedkar
Malin Basti Awas Yojana (VAMBAY)
The Karnataka Slum Clearance Board has taken up a programme to construct
about 33,282 houses under the “VAMBAY” scheme. Out of these, 16,597 houses
have been completed. One more subsidiary scheme under VAMBAY called “NIRMAL
BHARATH ABHIYAN”, is taken up by earmarking 20 per cent of Vambay Grant for
Construction of 791 Community Toilet Complexes of 10 seaters each at a unit cost of
Rs.40,000 per seater; out of which 102 toilet complexes have been completed.
Under Vambay Scheme, Government of India has sanctioned Rs.28.82 crores
subsidy for construction of 10,312 houses during 2002-03, which has already been

Dr Ambedkar Institute Seminar27/03/04- RSD
23
implemented in Bangalore City and in slums of 21 Class-I cities of Karnataka through
Karnataka Land army Corporation, Nirmithi Kendra and Karnataka Slum Clearance
Board.
5. Developmental Initiatives Welfare of the Scheduled Castes & Scheduled
Tribes
In Karnataka various schemes for improving the socio-economic conditions of
scheduled caste and scheduled tribes are being implemented. Some of these are
indicated below:
Financial assistance of Rs.8,000/-and Rs.10,000/- for each scheduled caste
student pursuing M.Phil and Ph.D. respectively provided under the scheme of
Fellowship to M.Phil. and Ph.D. students. During 2003-04 (upto Oct. 2003) 312
SC beneficiaries were covered and financial assistance of Rs.17.27 lakhs have
been provided and also Rs.3.83 lakhs have been provided to cover 67 ST
beneficiaries.
Students of scheduled caste who are studying in IIT/IIM/IISc have been provide
with a maximum financial assistance of Rs.50,000 to each student. Financial
assistance of Rs.2.50 lakhs is provided to five students during 2003-04 (upto
Oct.2003)
Beside, financial assistance of Rs. 10 lakh per annum is also provided to those
scheduled caste students who take up higher studies in foreign universities. An
amount of Rs.18.50 lakhs have been disbursed as financial assistance to five
students during 2003-04 (upto Oct.2003).
Scheduled caste women are trained in various crafts through 61 tailoring centers
in the state. During 2003-04 (upto Oct.2003), Rs.31.70 lakhs have been spent
and 299 beneficiaries covered.

Dr Ambedkar Institute Seminar27/03/04- RSD
24
To create self-employment among unemployed scheduled caste persons,
provision has been made for three months training of light motor vehicle and
autorikshaw. A stipend of Rs.150 and Rs.300 is provided to beneficiaries in rural
and urban areas respectively during the period of training. During 2003-04 (upto
Oct.2003) 118 beneficiaries have been covered and an expenditure of Rs.1.26
lakhs has been incurred.
Under Navachetana Scheme, certain reputed institutions/private organisations
are imparting training to scheduled caste unemployed youths in different trades
and in computer to enable them to get employment or self-employment. During
2003-04 (upto Oct.2003) 125 SC beneficiaries have been covered and an amount
of Rs.25 lakhs has been spent and 500 ST beneficiaries have been covered and
an amount of Rs.20 lakhs have been spent.
Compensation ranging from Rs.25,000/- to Rs.2 lakhs is paid to the victims of
atrocities, depending upon the nature of loss sustained. During 2003-04 (upto
Oct.2003) Rs.1.94 crores have been spent, as against the annual target of Rs.3
crores.
Postmetric scholarships are being sanctioned to scheduled caste students whose
parents annual income is within Rs.65,290/-. The GOI will provide the funds over
and above the committed liability of the State government. During 2003-04 (upto
Oct.2003) Rs.389.23 lakhs have been spent on 17,605 students.
1,121 parametric hostels are providing free boarding and lodging facilities to
70,070 scheduled caste students studying in VI to X standard. During 2003-04
(upto Oct.2003) Rs. 3,323.88 lakhs have been spent as against the target of Rs.6,
032.44 lakhs.
The distribution of free houses to the scheduled caste families are being
implemented in the state. During 2003-04 (upto Nov.2003) Rs.25 crores has been
released to build 15,000 Ambedkar houses.

Dr Ambedkar Institute Seminar27/03/04- RSD
25
In 2003-04, a new scheme, Koushalya, was announced in the budget speech.
The objective of the scheme is to provide training to scheduled tribe unemployed
women candidates in different trades. During 2003-04 (upto Dec.2003) 1,269 ST
beneficiaries were covered and a financial assistance of Rs.1 crore has been
provided.
Devadasi:- the objective of the scheme is to identify devadasi women in 8 districts
of the state and assistance is provided to land purchase, dairy and other gainful
activities under the land purchased, self-employment scheme and individual
borewell schemes. During 2003-04 (upto Nov.2003) Rs. 18.47 lakhs have been
spent nd 109 beneficiaries have been covered under self-employment scheme.
6. Conclusions
This paper tried to analyse the hypothesis regarding market participation of
the deprived Castes especially on the background of one of the most radical
institutional change i.e. land reforms. Though the success of land reforms measures
has bee mixed across the country, it is one of the major determinants of the agrarian
structure. Further, it also reflects the present institutional setback in rural India. On
this background it becomes easy to find out the market participation of the deprived
Castes in rural India. Our endeavour towards locating the market participation was
mainly guided by the hypothesis extended in the near past about the market as an
effective correcting measure and partial withdrawal of the State from interfering with
poverty, agrarian parameters and other welfare measures. One of the important
hypothesis that was raised by Deepak Lal in his book on `Hindu Equilibrium’

Dr Ambedkar Institute Seminar27/03/04- RSD
26
regarding the analysis of social stability through the Caste system needs to be looked
critically. He especially took help of he neo-classical paradigms in which a large
number of untenable assumptions were entered into. To quote, he says that “I would
accept that as Dumont emphasizes, the unique feature distinguishing the Caste
system from other modes of social stratification in the disjunction of power and status
in the Caste hierarchy. But I would argue that it is the peculiar environmental
circumstances of endemic political instability in the ancient Hindu monarchies for
which the system was forged which makes this disjunction economically, rational and
ritually enforceable” (Lal, 1988, p. 73). On this background Dr. Ambedkar’s
hypotheses are more pertinent and institutional in nature (Ambedkar, 1946 and
1948). In fact, on the latter’s methodology, still we can explain the present situation
of marginal market participation and continued poverty of Scheduled Castes and
Scheduled Tribes in the rural areas.
Our paper very modestly tried to highlight the fact that a large number of
people from the deprived Castes from rural areas depend on agricultural sector.
Poverty and deprivation are largely dictated by access to land and means of
livelihhod. Land deprivation is therefore crucial. A majority of them are agricultural
labourers whereas only about 12 per cent are cultivators. Out of the cultivators, it is
only less than half who have some access (even theoretical) to the product market
as producers, thereby clearly indicating their weak bargaining power as consumers.
On the other hand, the agricultural labourers belonging to deprived Castes have
always been at the other end of the hierarchy. They too have extremely weak
bargaining position in relation to their wage labour. In such a situation, it will not be
prudent to assume that the market would correct the distortions through the price
mechanism and hence it will not be erroneous, if we state that the NEP is likely to
have hazardous impact on the deprived Castes both in living standard and
employment.

Dr Ambedkar Institute Seminar27/03/04- RSD
27
REFERENCES
Ambedkar, B.R. (1989). Writings and Speeches of Dr Babasaheb Ambedkar, (Eds Vasant Moon) Vol 1, Education Department, Government of Maharashtra, Mumbai. Government of India (1992). Census of India – 1991, Series I, India Final Population Totals: Brief Analysis of Primary Census Abstract, Paper 2 of 1992, New Delhi. Government of India(1998). All India Report on Agricultural Census 1990-91, Ministry of Agriculture, New Delhi. Government of Karnataka, (1985). Agricultural Census – 1980-81 Census Commissioner, Directorate of Economics and Statistics, Bangalore. Government of Karnataka, (1990). Agricultural Census – 1985-86 Census Commissioner, Directorate of Economics and Statistics, Bangalore. Government of Karnataka, (2001). Agricultural Census – 1995-96 Census Commissioner, Directorate of Economics and Statistics, Bangalore. Government of Karnataka, (Various Years). Economic Survey of Karnataka, Directorate of Economics and Statistics, Bangalore. Kamble, B.N. (1995). Effectiveness of Developmental Programmes for Scheduled Castes and Scheduled Tribes in Maharashtra, Unpublished Ph.D Thesis submitted to University of Pune, Gokhale Institute of Politics and Economics, Pune. Lal, Deepak (1988). Cultural Stability and Economic Stagnation: India C. 1500 BC-AD 1980 (Hindu Equilibrium), Clarendon Press, Oxford. Singh, Tarlok, Haque, T. and Reddy A.V.S. (1992). Impact of Land Reforms on Agriculture and Rural Development, National Institute of Rural Development, Hyderabad. Tendulkar, Suresh, D. and L.R. Jain (1995). “Economic Reforms and Poverty”, Economic and Political Weekly, Vol. XXX, No. 23. Thorat, S K (1996 ). “Ambedkar on Economics of Hindu Social Order: Understanding Its Orthodoxy and Legacy” in Walter Fernandes “The Emerging Dalit Identity” Indian Social Institute, Delhi. Thorat, S K and R.S. Deshpande (1999). “Caste and Labour Market Discrimination” Indian Journal of Labour Economics, Vol. 42, No. 4. Yadav, Manohar (2003). Socio-Economic Survey of Scheduled Castes and Scheduled Tribes in Karnataka: A Critical Analysis, Institute for Social and Economic Change, Bangalore.