agilent ar04financials
TRANSCRIPT
Notice of 2005 Annual Meeting and Proxy Statement
2004 Annual Report to Stockholders
2004 Annual Report Consolidated Financial Statements

TABLE OF CONTENTS
Page
Selected Financial Data . . . . . . . . . . . . . . . . . . . . . . . . . . . . . . . . . . . . . . . . . . . . . . . . . . . . . . . . . . . . . 1
Management’s Discussion and Analysis of Financial Condition and Results of Operations . . . 3
Report of Independent Registered Public Accounting Firm . . . . . . . . . . . . . . . . . . . . . . . . . . . . . . 39
Consolidated Statement of Operations . . . . . . . . . . . . . . . . . . . . . . . . . . . . . . . . . . . . . . . . . . . . . . . . 40
Consolidated Balance Sheet . . . . . . . . . . . . . . . . . . . . . . . . . . . . . . . . . . . . . . . . . . . . . . . . . . . . . . . . . 41
Consolidated Statement of Cash Flows . . . . . . . . . . . . . . . . . . . . . . . . . . . . . . . . . . . . . . . . . . . . . . . . 42
Consolidated Statement of Stockholders’ Equity . . . . . . . . . . . . . . . . . . . . . . . . . . . . . . . . . . . . . . . 43
Notes to Consolidated Financial Statements . . . . . . . . . . . . . . . . . . . . . . . . . . . . . . . . . . . . . . . . . . . 44
Quarterly Summary . . . . . . . . . . . . . . . . . . . . . . . . . . . . . . . . . . . . . . . . . . . . . . . . . . . . . . . . . . . . . . . . . 78

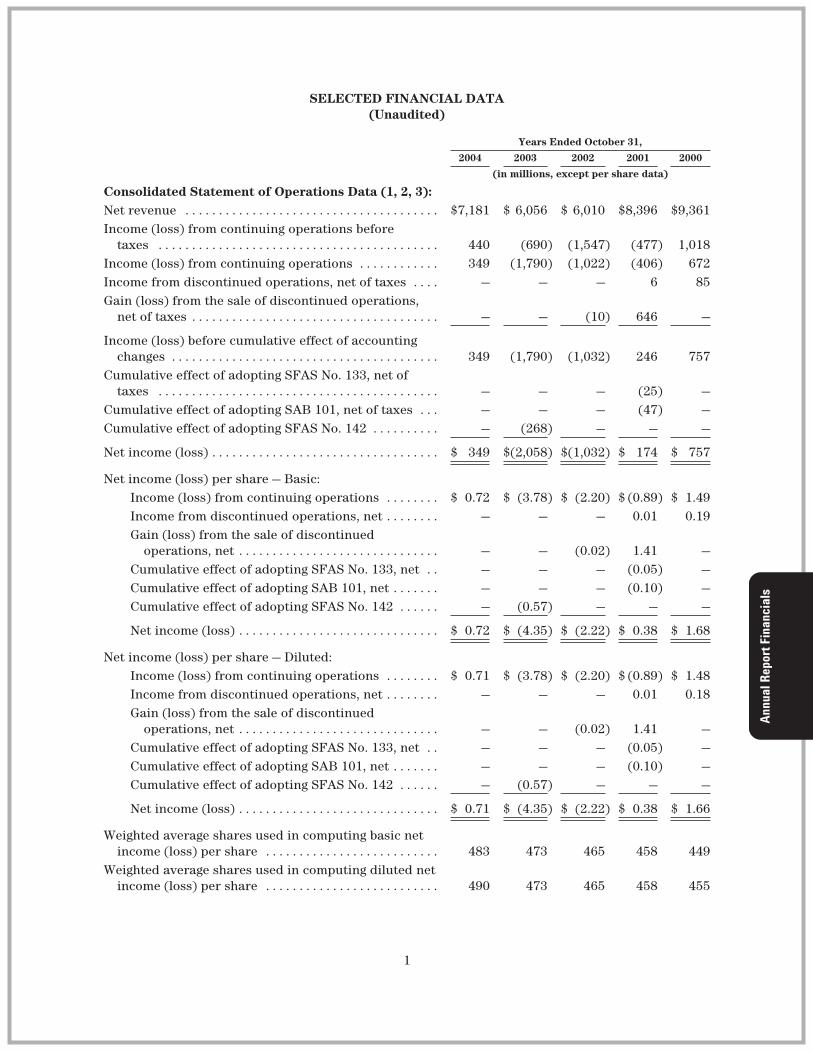
SELECTED FINANCIAL DATA(Unaudited)
Years Ended October 31,
2004 2003 2002 2001 2000
(in millions, except per share data)
Consolidated Statement of Operations Data (1, 2, 3):Net revenue . . . . . . . . . . . . . . . . . . . . . . . . . . . . . . . . . . . . . . $7,181 $ 6,056 $ 6,010 $8,396 $9,361Income (loss) from continuing operations before
taxes . . . . . . . . . . . . . . . . . . . . . . . . . . . . . . . . . . . . . . . . . . 440 (690) (1,547) (477) 1,018Income (loss) from continuing operations . . . . . . . . . . . . 349 (1,790) (1,022) (406) 672Income from discontinued operations, net of taxes . . . . — — — 6 85Gain (loss) from the sale of discontinued operations,
net of taxes . . . . . . . . . . . . . . . . . . . . . . . . . . . . . . . . . . . . . — — (10) 646 —
Income (loss) before cumulative effect of accountingchanges . . . . . . . . . . . . . . . . . . . . . . . . . . . . . . . . . . . . . . . . 349 (1,790) (1,032) 246 757
Cumulative effect of adopting SFAS No. 133, net oftaxes . . . . . . . . . . . . . . . . . . . . . . . . . . . . . . . . . . . . . . . . . . — — — (25) —
Cumulative effect of adopting SAB 101, net of taxes . . . — — — (47) —Cumulative effect of adopting SFAS No. 142 . . . . . . . . . . — (268) — — —
Net income (loss) . . . . . . . . . . . . . . . . . . . . . . . . . . . . . . . . . . $ 349 $(2,058) $(1,032) $ 174 $ 757
Net income (loss) per share — Basic:Income (loss) from continuing operations . . . . . . . . $ 0.72 $ (3.78) $ (2.20) $ (0.89) $ 1.49Income from discontinued operations, net . . . . . . . . — — — 0.01 0.19Gain (loss) from the sale of discontinued
operations, net . . . . . . . . . . . . . . . . . . . . . . . . . . . . . . — — (0.02) 1.41 —Cumulative effect of adopting SFAS No. 133, net . . — — — (0.05) —Cumulative effect of adopting SAB 101, net . . . . . . . — — — (0.10) —Cumulative effect of adopting SFAS No. 142 . . . . . . — (0.57) — — —
Net income (loss) . . . . . . . . . . . . . . . . . . . . . . . . . . . . . . $ 0.72 $ (4.35) $ (2.22) $ 0.38 $ 1.68
Net income (loss) per share — Diluted:Income (loss) from continuing operations . . . . . . . . $ 0.71 $ (3.78) $ (2.20) $ (0.89) $ 1.48Income from discontinued operations, net . . . . . . . . — — — 0.01 0.18Gain (loss) from the sale of discontinued
operations, net . . . . . . . . . . . . . . . . . . . . . . . . . . . . . . — — (0.02) 1.41 —Cumulative effect of adopting SFAS No. 133, net . . — — — (0.05) —Cumulative effect of adopting SAB 101, net . . . . . . . — — — (0.10) —Cumulative effect of adopting SFAS No. 142 . . . . . . — (0.57) — — —
Net income (loss) . . . . . . . . . . . . . . . . . . . . . . . . . . . . . . $ 0.71 $ (4.35) $ (2.22) $ 0.38 $ 1.66
Weighted average shares used in computing basic netincome (loss) per share . . . . . . . . . . . . . . . . . . . . . . . . . . 483 473 465 458 449
Weighted average shares used in computing diluted netincome (loss) per share . . . . . . . . . . . . . . . . . . . . . . . . . . 490 473 465 458 455
1
October 31,
2004 2003 2002 2001 2000
(in millions)
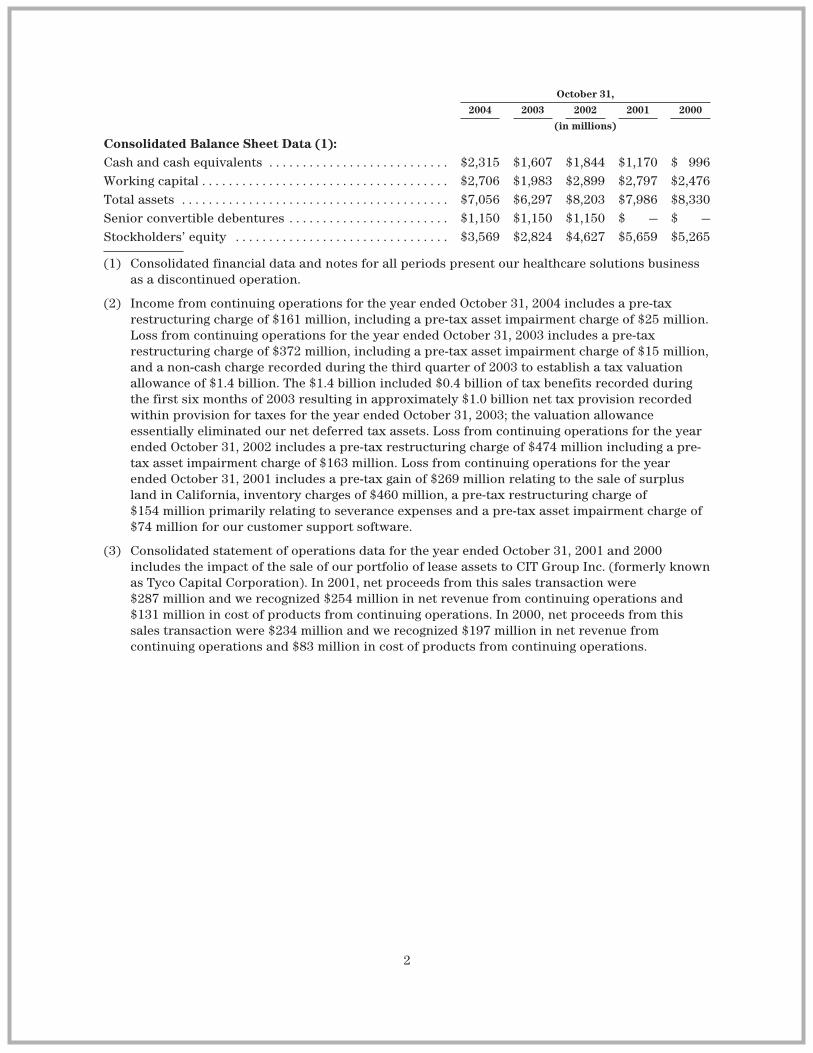
Consolidated Balance Sheet Data (1):Cash and cash equivalents . . . . . . . . . . . . . . . . . . . . . . . . . . . $2,315 $1,607 $1,844 $1,170 $ 996Working capital . . . . . . . . . . . . . . . . . . . . . . . . . . . . . . . . . . . . . $2,706 $1,983 $2,899 $2,797 $2,476Total assets . . . . . . . . . . . . . . . . . . . . . . . . . . . . . . . . . . . . . . . . $7,056 $6,297 $8,203 $7,986 $8,330Senior convertible debentures . . . . . . . . . . . . . . . . . . . . . . . . $1,150 $1,150 $1,150 $ — $ —Stockholders’ equity . . . . . . . . . . . . . . . . . . . . . . . . . . . . . . . . $3,569 $2,824 $4,627 $5,659 $5,265
(1) Consolidated financial data and notes for all periods present our healthcare solutions businessas a discontinued operation.
(2) Income from continuing operations for the year ended October 31, 2004 includes a pre-taxrestructuring charge of $161 million, including a pre-tax asset impairment charge of $25 million.Loss from continuing operations for the year ended October 31, 2003 includes a pre-taxrestructuring charge of $372 million, including a pre-tax asset impairment charge of $15 million,and a non-cash charge recorded during the third quarter of 2003 to establish a tax valuationallowance of $1.4 billion. The $1.4 billion included $0.4 billion of tax benefits recorded duringthe first six months of 2003 resulting in approximately $1.0 billion net tax provision recordedwithin provision for taxes for the year ended October 31, 2003; the valuation allowanceessentially eliminated our net deferred tax assets. Loss from continuing operations for the yearended October 31, 2002 includes a pre-tax restructuring charge of $474 million including a pre-tax asset impairment charge of $163 million. Loss from continuing operations for the yearended October 31, 2001 includes a pre-tax gain of $269 million relating to the sale of surplusland in California, inventory charges of $460 million, a pre-tax restructuring charge of$154 million primarily relating to severance expenses and a pre-tax asset impairment charge of$74 million for our customer support software.
(3) Consolidated statement of operations data for the year ended October 31, 2001 and 2000includes the impact of the sale of our portfolio of lease assets to CIT Group Inc. (formerly knownas Tyco Capital Corporation). In 2001, net proceeds from this sales transaction were$287 million and we recognized $254 million in net revenue from continuing operations and$131 million in cost of products from continuing operations. In 2000, net proceeds from thissales transaction were $234 million and we recognized $197 million in net revenue fromcontinuing operations and $83 million in cost of products from continuing operations.
2
MANAGEMENT’S DISCUSSION AND ANALYSIS OF FINANCIAL CONDITION ANDRESULTS OF OPERATIONS
The following discussion should be read in conjunction with the consolidated financialstatements and notes thereto included elsewhere in this Annual Report on Form 10-K. This reportcontains forward-looking statements including, without limitation, statements regarding trends,cyclicality, seasonality and growth in the markets we sell into, our strategic direction, expendituresin research and development, contracts, remediation and indemnification, our future effective taxrate, new product introductions, product pricing, changes to our manufacturing processes, ourliquidity position, our ability to generate cash from continuing operations, our image sensortechnology and the sale of our camera module business, our expected growth, the potential impact ofour adopting new accounting pronouncements, our financial results, revenue generated frominternational sales, our potential repatriation of earnings, the impact of our enterprise resourceplanning systems implementation, the impact of our variable cost structure, our obligations underand assumptions about our retirement and post-retirement benefit plans, our lease paymentobligations, savings from our restructuring programs and the existence or length of an economicrecovery that involve risks and uncertainties. Our actual results could differ from the resultscontemplated by these forward-looking statements due to certain factors, including those discussedin Item 7 and elsewhere in this report.
Overview
Agilent, incorporated in Delaware in May 1999, is a global diversified technology organizationthat provides enabling solutions to markets within the communications, electronics, life sciences andchemical analysis industries. Prior to our initial public offering of 15.9 percent of our stock inNovember 1999, we were a wholly-owned subsidiary of Hewlett-Packard. Hewlett-Packarddistributed the remaining 84.1 percent of our stock to its stockholders on June 2, 2000 in the form ofa stock dividend.
Our fiscal year end is October 31. Unless otherwise stated, all years and dates refer to our fiscalyear.
Reclassifications
Amounts in the consolidated financial statements as of and for the years ended October 31,2003 and October 31, 2002 have been reclassified to conform to the presentation used in 2004.
Executive Summary
The sales of our products and services are dependent, to a large degree, on customers whoseindustries are subject to cyclical trends in the demand for their products. Shifts in thesemiconductor market, electronics industry, computer industry and telecommunications markets, aswell as rapidly shifting global economic conditions, have had and will have significant impacts onour businesses.
In those industry segments where we are a capital equipment provider, our revenue isdependent on the capital expenditure budgets and spending patterns of our customers, who oftendelay or accelerate purchases in reaction to changes in their businesses and in the economy. Weexpect some portions of our businesses to remain cyclical in the foreseeable future. Given thesespending patterns, we are moving towards a more variable cost structure in order to minimize anyadverse impact to our profitability. This includes the use of contract manufacturers and third-partyservice providers.
We generate revenue directly from sales of components incorporated in consumer electronics,such as cell phones, cameras, games, personal computers, and printers, or indirectly from sales of
3
test and measurement equipment used to design, manufacture or test such components. Sales ofthese components and test and measurement equipment are concentrated during the holiday season.This seasonal pattern means that we typically experience higher revenues and orders during ourfourth quarter as manufacturers ramp up production and then decline in our first quarter. We alsoexperience larger volumes of business in our fourth quarter for products that we sell to theaerospace and defense industry and the U.S. government and generally experience reduced volumesduring our first quarter. However, in the fourth quarter of 2004 our usual seasonal increase inrevenues and orders did not occur. We experienced a decline in orders in the third and fourthquarter largely in the semiconductor and wireless handset manufacturing test markets.
Orders in 2004 were up by 15 percent, with much of that growth in the first half of the year. Testand measurement orders increased 18 percent year-over-year related to a strong Aerospace andDefense industry, growth in consumer electronics, and expansion of the Asian handsetmanufacturing capacity. Semiconductor products orders grew 20 percent over 2003, with strength inthe personal systems market, offset by a decline in the networking market. Our automated testbusiness saw a slight decline in orders over the prior year, caused by a market decrease in thesecond half of the year. Orders increased 13 percent over last year in the life sciences and chemicalanalysis markets. This increase was driven by the demand for replacement systems over our largeinstalled base, increased U.S. government spending for homeland security, spending related toenvironmental testing in Asia, and increased demand from generic drug manufacturers.
Annual revenues were at their highest level since 2001. Net revenue for the year was $7,181million, an increase of 19 percent over 2003. Our test and measurement and our life sciences andchemical analysis businesses experienced revenue growth throughout 2004. However our automatedtest and semiconductor products business experienced revenue declines in the second half of theyear, particularly in the fourth quarter. These declines were in large part due to our customers’excess capacity and excess inventory in the semiconductor industry.
Cost of sales as a percentage of net revenue decreased 5 percentage points from 2003 to 2004.This is a reflection of our continued work on lowering our cost structure. We will continue to see thebenefits of a more variable cost structure, including the impact of using contract manufacturers andthird-party service providers.
Operating expenses as a percent of revenue have declined from 62 percent in 2002 and 50percent in 2003 to 38 percent in 2004. In dollar terms, operating expenses have declined $720million from 2002 to 2003 and $294 million from 2003 to 2004. Reduced restructuring and assetimpairment charges, coupled with increased savings from these efforts, account for the majority ofthe expense reduction in both years. In 2004, pension and post-retirement benefits decreased by $45million due to additional funding, better investment results and a favorable interest rateenvironment. Our efforts to reduce our infrastructure costs and to control discretionary spendingalso contributed to the decrease. We completed the implementation of our Enterprise ResourcePlanning (“ERP”) and Customer Relationship Management (“CRM”) projects, and have now begun tosee some of the benefits in cost savings and operational improvement.
Total cash and cash equivalents increased $708 million to $2.3 billion at October 31, 2004. Netcash provided from operating activities was $663 million for 2004. Cash on hand as of October 31,2004 was $2,315 million. Days sales outstanding decreased to 52 days as of October 31, 2004 from 58days a year ago. We have improved our inventory days-on-hand from 93 days as of October 31, 2003to 89 days as of the end of the current period.
Income from operations in 2004 was $386 million, an increase of approximately $1,111 million.The increase was due to an increase in revenue of $1,125 million, as well as the benefit of our
4

restructuring plans. As we increased our revenues, we continued to keep spending under tightcontrol allowing this revenue increase to fully impact our profit increase.
Looking forward, we expect increases in the test and measurement and life sciences andchemical analysis markets in 2005. We expect the semiconductor and semiconductor capitalequipment markets to be slightly down. We intend to further reduce our costs and expenses to meetour operating cost structure goals. The announced sale of our camera module business is notexpected to have a material impact on operating profits in 2005. The revenues for 2004 associatedwith the camera module business were approximately $300 million.
Critical Accounting Policies and Estimates
The preparation of financial statements in accordance with accounting principles generallyaccepted in the U.S. requires management to make estimates and assumptions that affect theamounts reported in our consolidated financial statements and accompanying notes. Managementbases its estimates on historical experience and various other assumptions believed to bereasonable. Although these estimates are based on management’s best knowledge of current eventsand actions that may impact the company in the future, actual results may be different from theestimates. Our critical accounting policies are those that affect our financial statements materiallyand involve difficult, subjective or complex judgments by management. Those policies are revenuerecognition, restructuring and asset impairment charges, inventory valuation, retirement and post-retirement plan assumptions, valuation of long-lived assets and accounting for income taxes.
Revenue recognition. We enter into agreements to sell products (hardware or software),services, and other arrangements (multiple element arrangements) that include combinations ofproducts and services. Revenue from product sales, net of trade discounts and allowances, isrecognized provided that persuasive evidence of an arrangement exists, delivery has occurred, theprice is fixed or determinable, and collectibility is reasonably assured. Delivery is considered to haveoccurred when title and risk of loss have transferred to the customer. Revenue is reduced forestimated product returns and distributor price protection, when appropriate. For sales that includecustomer-specified acceptance criteria, revenue is recognized after the acceptance criteria have beenmet. For products that include installation, if the installation meets the criteria to be considered aseparate element, product revenue is recognized upon delivery, and recognition of installationrevenue occurs when the installation is complete. Otherwise, neither the product nor the installationrevenue is recognized until the installation is complete. Revenue from services is deferred andrecognized over the contractual period or as services are rendered and accepted by the customer.When arrangements include multiple elements, we use objective evidence of fair value to allocaterevenue to the elements and recognize revenue when the criteria for revenue recognition have beenmet for each element. The amount of product revenue recognized is affected by our judgments as towhether an arrangement includes multiple elements and if so, whether vendor-specific objectiveevidence of fair value exists for those elements. Changes to the elements in an arrangement and theability to establish vendor-specific objective evidence for those elements could affect the timing ofthe revenue recognition. Most of these conditions are subjective and actual results could vary fromthe estimated outcome, requiring future adjustments to revenue.
Restructuring and asset impairment charges. We recognize a liability for restructuringcosts at fair value only when the liability is incurred. The three main components of ourrestructuring plans are related to workforce reductions, the consolidation of excess facilities andasset impairments. Asset impairments primarily consist of property, plant and equipment.Workforce-related charges are accrued when it is determined that a liability has been incurred,which is generally after individuals have been notified of their termination dates and expectedseverance payments. Plans to consolidate excess facilities result in charges for lease termination feesand future commitments to pay lease charges, net of estimated future sublease income. We recognize
5
charges for consolidation of excess facilities when we have vacated the premises. Asset impairmentcharges are based on an estimate of the amounts and timing of future cash flows related to theexpected future remaining use and ultimate sale or disposal of buildings and equipment. Theseestimates were derived using the guidance of Statement of Financial Accounting Standards (“SFAS”)No. 144, “Accounting for the Impairment or Disposal of Long-Lived Assets” (“SFAS No. 144”), StaffAccounting Bulletin 100, “Restructuring and Impairment Charges” (“SAB 100”), Emerging IssuesTask Force 94-3, “Liability Recognition for Costs to Exit an Activity (Including Certain CostsIncurred in a Restructuring)” (“EITF 94-3”) and lastly, SFAS No. 146 “Accounting for Exit orDisposal Activities” (“SFAS No. 146”) which is effective for exit and disposal activities initiated afterDecember 31, 2002. If the amounts and timing of cash flows from restructuring activities aresignificantly different from what we have estimated, the actual amount of restructuring and assetimpairment charges could be materially different, either higher or lower, than those we haverecorded.
Inventory valuation. We assess the valuation of our inventory on a quarterly basis andperiodically write down the value for estimated excess and obsolete inventory based upon estimatesabout future demand and actual usage. Such estimates are difficult to make under most economicconditions. The excess balance determined by this analysis becomes the basis for our excessinventory charge. Our marketing department plays a key role in our excess inventory review processby providing updated sales forecasts, managing product rollovers and working with manufacturingto maximize recovery of excess inventory. If actual market conditions are less favorable than thoseprojected by management, additional write-downs may be required. If actual market conditions aremore favorable than anticipated, inventory previously written down may be sold, resulting in lowercost of sales and higher income from operations than expected in that period.
Retirement and post-retirement plan assumptions. Retirement and post-retirementbenefit plans are a significant cost of doing business and yet represent obligations that will beultimately settled far in the future and therefore are subject to estimation. Pension accounting isintended to reflect the recognition of future benefit costs over the employee’s approximate serviceperiod based on the terms of the plans and the investment and funding decisions made by us. We arerequired to make assumptions regarding such variables as the expected long-term rate of return onassets and the discount rate, which are used to determine service cost and interest cost to arrive atpension income or expense for the year. As of October 31, 2004, the expected long-term rate ofreturn in the U.S. was 8.5 percent, and ranged from 4.5 to 7.5 percent for our plans outside the U.S.We have analyzed the rates of return on assets used and determined that these rates are reasonablebased on the plans’ historical performance relative to the overall markets in the countries where theplans are effective. Management will continue to assess the assumptions on the expected long-termrate of return on plan assets for each plan based on relevant market conditions as prescribed byaccounting principles generally accepted in the U.S. and will make adjustments to the assumptionsas appropriate. Discount rate assumptions were based on the prevailing market long-term interestrates at the measurement date. We are also required to make assumptions for the long-term healthcare cost trend rates for our post-retirement benefit plans. If any of our assumptions were to change,our benefit plan expenses would also change. A one percent decrease in the estimated return onplan assets would result in increased pension expense of $6 million for 2005 in the U.S. and$11 million for 2005 for all plans outside the U.S. Retirement and post-retirement benefit planexpense is allocated to cost of sales, research and development and selling, general andadministrative expenses in the consolidated statement of operations. We incurred expenses of$142 million in 2004, $187 million in 2003 and $122 million in 2002 for our retirement and post-retirement plans. We expect expenses of approximately $117 million in 2005 for our retirement andpost-retirement plans.
Workforce-related events such as restructuring cause curtailment and settlement gains or losseswhen they have a material impact on the average future working lifetime or total number of
6

participants in our retirement and postretirement plans. Our restructuring programs have resultedin material changes to our plan demographics in the U.S. and several other countries in 2002 and2003. The curtailment and settlement gains and losses related to each event are separately identifiedin Note 14, “Retirement Plans and Post-retirement Benefits” to the consolidated financial statementsin Item 15 of this report.
Valuation of long-lived assets. We performed our fiscal 2004 annual goodwill impairmentanalysis in the fourth quarter of 2004. Based on our estimates of forecasted discounted cash flowsand our market capitalization, at that time, we concluded that we did not have any impairment. Wehave also assessed the recoverability of our long-lived assets, by determining whether the carryingvalue of such assets will be recovered through undiscounted future cash flows. We incurred$25 million of asset impairment charges in 2004, primarily relating to a manufacturing site inCalifornia.
The process of evaluating the potential impairment of goodwill and other intangibles is highlysubjective and requires significant judgment. We estimate expected future cash flows of our variousbusinesses, which operate in a number of markets and geographical regions. We then determine thecarrying value of these businesses. We exercise judgment in assigning and allocating certain assetsand liabilities to these businesses. We then compare the carrying value including goodwill and otherintangibles to the discounted future cash flows. If the total of future cash flows is less than thecarrying amount of the assets, we recognize an impairment loss based on the excess of the carryingamount over the fair value of the assets. Estimates of the future cash flows associated with theassets are critical to these assessments. Changes in these estimates based on changed economicconditions or business strategies could result in material impairment charges in future periods. Weperformed the required transitional impairment test upon our adoption of SFAS No. 142 in the firstquarter of 2003 and recorded a $268 million charge related to goodwill.
The process of evaluating the potential impairment of long-lived assets such as our propertyplant and equipment is also highly subjective and requires significant judgment. In order to estimatethe fair value of long-lived assets, we typically make various assumptions about the future prospectsfor the business that the asset relates to, consider market factors specific to that business andestimate future cash flows to be generated by that business. Based on these assumptions andestimates, we determine whether we need to take an impairment charge to reduce the value of theasset stated on our balance sheet to reflect its estimated fair value. Assumptions and estimates aboutfuture values and remaining useful lives are complex and often subjective. They can be affected by avariety of factors, including external factors such as the real estate market, industry and economictrends, and internal factors such as changes in our business strategy and our internal forecasts.Although we believe the assumptions and estimates we have made in the past have been reasonableand appropriate, changes in assumptions and estimates could materially impact our reportedfinancial results.
Accounting for income taxes. Significant management judgment is required indetermining our provision for income taxes and in determining whether deferred tax assets will berealized in full or in part. When it is more likely than not that all or some portion of specific deferredtax assets such as net operating losses or foreign tax credit carryforwards will not be realized, avaluation allowance must be established for the amount of the deferred tax assets that aredetermined not to be realizable. Realization is based on our ability to generate sufficient futuretaxable income. During the third quarter of 2003, we recorded a non-cash charge to establish avaluation allowance of $1.4 billion, which included approximately $0.4 billion of tax benefitsrecorded during the first six months of 2003 resulting in an approximately $1.0 billion net taxprovision recorded within provision for taxes for 2003. The valuation allowance was determined inaccordance with the provisions of SFAS No. 109 “Accounting for Income Taxes” (“SFAS No. 109”),
7

which requires an assessment of both positive and negative evidence when determining whether it ismore likely than not that deferred tax assets are recoverable. Such assessment is required on ajurisdiction-by-jurisdiction basis. Cumulative losses incurred in the U.S. and in the U.K. jurisdictionsin recent years represented sufficient negative evidence, which made it difficult for positiveevidence to overcome under SFAS No. 109. Accordingly, a full valuation allowance was recorded. Weintend to maintain a full valuation allowance until sufficient positive evidence exists to supportreversal of the valuation allowance. Profits or losses incurred in the U.S. and the U.K. affect theongoing amount of the valuation allowance. We expect that pre-tax income in fiscal 2005 will berecognized at a lower rate because future income taxes in the U.S. and the U.K. will be offset againstadjustments to the valuation allowance to effectively eliminate any tax expense or benefit in thosejurisdictions. Income taxes will continue to be recorded for various jurisdictions subject to the needfor valuation allowances in those jurisdictions.
We have not provided for U.S. federal income and foreign withholding taxes on a portion of ournon-U.S. subsidiaries’ undistributed income as of October 31, 2004 because we intend to reinvestsuch income indefinitely. Should we decide to remit this income to the U.S. in a future period, ourprovision for income taxes may increase materially in that period.
On October 22, 2004, the American Jobs Creation Act (“AJCA”) was signed into law. The AJCAincludes a deduction of 85 percent for certain foreign earnings that are repatriated, as defined in theAJCA, at an effective tax cost of 5.25 percent on any such repatriated foreign earnings. Agilent mayelect to apply this provision to qualifying earnings repatriations in fiscal 2005. We have begun anevaluation of the effects of the repatriation provision. However, Agilent does not expect to be able tocomplete this evaluation until after Congress or the Treasury Department provides additionalclarifying language on key elements of the provision. We expect to complete our evaluation of theeffects of the repatriation provision within a reasonable period of time following the publication ofthe additional clarifying language. The range of possible amounts that Agilent is considering forrepatriation under this provision is between zero and $970 million. The related potential range ofincome tax is between zero and $51 million.
We are subject to ongoing tax examinations of our tax returns by the Internal Revenue Service andother tax authorities in various jurisdictions. We regularly assess the likelihood of adverse outcomesresulting from these examinations to determine the adequacy of our provision for income taxes.
Restructuring and Asset Impairment
Summary
We currently have three restructuring plans – one initiated in the fourth quarter of 2001 (the“2001 Plan”), a second initiated in the fourth quarter of 2002 (the “2002 Plan”), and a third initiatedin the first quarter of 2003 (the “2003 Plan”) after it became clear that the actions taken in fiscal2001 and fiscal 2002 would not be sufficient to return the company to profitability.
All of our plans were designed to reduce costs and expenses in order to return the company toprofitability. As of the end of 2004, we have reduced our workforce by approximately 16,700 people(approximately 15,100 from involuntary terminations and approximately 1,600 from net attrition) toapproximately 28,000 employees.
Our plans to consolidate excess facilities resulted in charges for lease termination fees andlosses anticipated from sub-lease agreements. We have exited more than 115 production, supportand sales facilities in the U.S., Korea, Japan, U.K. and other countries, representing more than 4.6million square feet, or about 24 percent of our worldwide property. We will continue to make leasepayments on some of this space over the next five years. We lease most of these buildings from third
8

parties, and the closures impacted all segments. In most cases, we are exiting administrative officebuildings which house sales and administrative employees. However, a small number of productionfacilities were closed as a result of our plans to consolidate manufacturing into fewer sites.
Actions for all plans have been focused on segments that were impacted most severely by themarket downturn – primarily our test and measurement and semiconductor products businesses– but actions have also been taken to reduce the costs associated with support services such asfinance, information technology, workplace services and to a lesser extent our other businesssegments. Cost reductions were initiated by moving manufacturing and some of our global sharedservices operations sites to lower cost regions, reducing the number of properties, particularly salesand administrative sites, and by reducing our workforce through involuntary terminations andselected outsourcing of manufacturing and administrative functions. Our strategy is to movetowards a more variable operating cost structure.
We have executed all key actions under our 2001 Plan, although there may be changes inestimates for the consolidation of excess facilities due to changes in market conditions from thoseoriginally expected at the time the charges were recorded. Our 2002 Plan is complete. We arecontinuing to see the estimated savings of $350 million per quarter ($300 million from the 2001 Planand $50 million from the 2002 Plan) that was initially projected. The 2003 Plan is still beingimplemented, however, we have already realized the expected $125 million reduction in quarterlyoperational costs. We expect to incur further restructuring costs and increase the savings related tothe 2003 Plan in the first half of 2005.
We recorded restructuring and asset impairment charges of $161 million, $372 million and $474million for 2004, 2003 and 2002, respectively. Our plans to consolidate excess facilities resulted incharges of $35 million in 2004 for lease termination fees and losses anticipated from sub-leaseagreements related to our 2001 and 2003 Plans. Similar charges in 2003 and 2002 were $37 millionand $53 million, respectively. We will continue to make lease payments on some of this excessfacility space over the next five years. Charges associated with workforce reductions and assetimpairments related to our 2003 Plan were $101 million and $25 million, respectively, for 2004.Similar charges relating to all plans were $353 million for 2003 and $421 million for 2002.
The restructuring accrual for all plans, representing future outlays, which totaled $87 million asof October 31, 2004 and $89 million as of October 31, 2003 is recorded in other accrued liabilities onthe consolidated balance sheet. For further details on our restructuring plans, see Note 13,“Restructuring and Asset Impairment” to the consolidated financial statements in Item 15 of thisreport.
New Accounting Pronouncements
Adoption of New Pronouncements
In January 2003 the Financial Accounting Standards Board (“FASB”) issued InterpretationNo. 46, “Consolidation of Variable Interest Entities” (“FIN 46”) which was amended by FIN 46Rissued in December 2003. FIN 46 addresses consolidation by business enterprises of variableinterest entities (“VIE’s”) that either: (1) do not have sufficient equity investment at risk to permitthe entity to finance its activities without additional subordinated financial support, or (2) for whichthe equity investors lack an essential characteristic of a controlling financial interest. FIN 46requires consolidation of VIE’s for which Agilent is the primary beneficiary and disclosure of asignificant interest in a VIE for which Agilent is not the primary beneficiary. As a result of ourreview, no entities were identified requiring disclosure or consolidation under FIN 46.
In December 2003, the Securities and Exchange Commission issued Staff Accounting Bulletin(“SAB”) No. 104, “Revenue Recognition” (“SAB No. 104”). SAB No. 104 rescinds certain sections of
9
SAB No. 101, “Revenue Recognition in Financial Statements” (“SAB No. 101”), related to multipleelement revenue arrangements, superceded as a result of the issuance of EITF 00-21, “Accountingfor Revenue Arrangements with Multiple Deliverables” (“EITF 00-21”). The revenue recognitionprinciples of SAB No. 101 remain largely unchanged by the issuance of SAB No. 104. The adoption ofthis standard did not affect our financial condition, results of operations or cash flows.
In December 2003, the FASB issued a revision SFAS No. 132 (the “revision”), “Employers’Disclosures about Pensions and Other Postretirement Benefits”. The revision requires additionaldisclosures relating to the description of the types of plan assets, investment strategy, measurementdate(s), plan obligations, cash flows, and components of net periodic benefit cost of defined benefitpension plans and other defined benefit postretirement plans recognized during interim periods. Weadopted the disclosure requirements beginning with the first quarter of 2004 and the standard iseffective for all future quarterly and annual reports; see Note 14 for such disclosures.
In March 2004, the FASB issued EITF No. 03-01, “The Meaning of Other-Than-TemporaryImpairment and its Application to Certain Investments,” which provides new guidance for assessingimpairment losses on debt and equity investments. The new impairment model applies to investmentsaccounted for under the cost or equity method and investments accounted for under FAS 115,“Accounting for Certain Investments in Debt and Equity Securities.” EITF No. 03-01 also includes newdisclosure requirements for cost method investments and for all investments that are in an unrealizedloss position. In September 2004, the FASB delayed the accounting provisions of EITF No. 03-01;however the disclosure requirements remain effective and the applicable ones have been adopted forour year-end 2004. We will evaluate the effect, if any, of EITF 03-01 when final guidance is issued.
In March 2004, the EITF reached a consensus on EITF Issue No. 03-16, “Accounting forInvestments in Limited Liability Companies” (“EITF 03-16”). The EITF concluded that if investors ina limited liability company have specific ownership accounts, they should follow the guidanceprescribed in Statement of Position 78-9, “Accounting for Investments in Real Estate Ventures, andEITF Topic No. D-46, Accounting for Limited Partnership Investments.” Otherwise, investors shouldfollow the significant influence model prescribed in Accounting Principles Board Opinion No. 18,“The Equity Method of Accounting for Investments in Common Stock.” The adoption of this Issue didnot have a material impact on the company’s financial condition, results of operations or cash flows.
In December 2004, the FASB issued SFAS No. 123 (Revised 2004) “Share-Based Payment” (“SFASNo. 123R”). SFAS No. 123R addresses all forms of share-based payment (“SBP”) awards, includingshares issued under employee stock purchase plans, stock options, restricted stock and stockappreciation rights. SFAS No. 123R will require Agilent to expense SBP awards with compensationcost for SBP transactions measured at fair value. The FASB originally stated a preference for a latticemodel because it believed that a lattice model more fully captures the unique characteristics ofemployee stock options in the estimate of fair value, as compared to the Black-Scholes model whichAgilent currently uses for its footnote disclosure. The FASB decided to remove its explicit preferencefor a lattice model and not require a single valuation methodology. SFAS No. 123R requires Agilent toadopt the new accounting provisions beginning in our fourth quarter of 2005. Agilent has not yetdetermined the impact of applying the various provisions of SFAS No. 123R.
In May 2004, the FASB issued a FASB Staff Position (“FSP”) regarding SFAS No. 106,“Employers’ Accounting for Postretirement Benefits Other Than Pensions”. FSP No. 106-2,“Accounting and Disclosure Requirements Related to the Medicare Prescription Drug, Improvementand Modernization Act of 2003” discusses the effect of the Medicare Prescription Drug, Improvementand Modernization Act (the “Act”) enacted in December 2003 and supersedes FSP No. 106-1, whichwas issued in January 2004. FSP No. 106-2 considers the effect of the two new features introducedin the Act in determining our accumulated postretirement benefit obligation (“APBO”) and netperiodic postretirement benefit cost. The effect on the APBO will be accounted for as an actuarial
10
experience gain to be amortized into income over the average remaining service period of planparticipants. Companies may elect to defer accounting for this benefit or may attempt to reflect thebest estimate of the impact of the Act on their net periodic costs currently. The adoption of FSPNo. 106-2 in the fourth quarter of 2004 did not have a material impact on our consolidated financialposition, results of operations or cash flows.
In November 2004, the FASB issued FASB Statement No. 151, “Inventory Costs – an amendmentof ARB No. 43” (“FAS 151”), which is the result of its efforts to converge U.S. accounting standardsfor inventories with International Accounting Standards. FAS No. 151 requires idle facility expenses,freight, handling costs, and wasted material (spoilage) costs to be recognized as current-periodcharges. It also requires that allocation of fixed production overheads to the costs of conversion bebased on the normal capacity of the production facilities. FAS No. 151 will be effective for inventorycosts incurred during fiscal years beginning after June 15, 2005. We are evaluating the impact of thisstandard on our consolidated financial statements.
In December 2004, the FASB issued an FSP regarding “Accounting and Disclosure Guidance forthe Foreign Earnings Repatriation Provision within the AJCA, FSP 109-b. FSP 109-b allows Agilenttime beyond the fourth quarter of 2004, the period of enactment, to evaluate the effect of the AJCAon our plan for reinvestment or repatriation of foreign earnings for purposes of applying SFAS No.109 “Accounting of Income Taxes.” See the discussion of the potential impact on Agilent in “CriticalAccounting Policies and Estimates — Accounting for Income Taxes,” above.
Acquisitions
We made one acquisition during 2003 and three during 2004, which were not significant to ourconsolidated financial position, results of operations or cash flows. These acquisitions wereaccounted for either under the purchase method of accounting as defined in SFAS No. 141 or as apurchase of assets. For the acquisitions accounted for under SFAS No. 141, the results of operationsof the acquired companies were included prospectively from the date of acquisition and theacquisition cost was allocated to the acquired tangible assets and liabilities and identifiableintangible assets based on fair values at the date of acquisition. Residual amounts were recorded asgoodwill. In-process research and development write-offs were insignificant.
Unaudited pro forma statement of operations information has not been presented because theeffects of the purchase method acquisitions were not material on either an individual or anaggregated basis.
Foreign Currency
Our revenues, costs and expenses, and monetary assets and liabilities are exposed to changes inforeign currency exchange rates as a result of our global operating and financing activities. We hedgenet cash flow and balance sheet exposures that are not denominated in the functional currencies ofour subsidiaries on a short term and anticipated basis. We do experience some fluctuations withinindividual lines of the consolidated statement of operations and balance sheet as our hedgingprogram is not designed to offset the currency movements in each category of revenues, expenses,monetary assets and liabilities. However, movements in exchange rates net of our hedging activitieshad no material effect on our net income (loss) in the periods presented. For example, theweakening of the U.S. dollar throughout 2004 led to an increase in revenue of approximately$150 million, which primarily affected Europe and Japan. However, this was offset by an increase tocost of sales of approximately $65 million and an increase to operating expenses of approximately$80 million relating to those foreign currency movements. Our hedging activities resulted in anincrease of cost of sales of approximately $3 million for the fiscal year end October 31, 2004. Theeffect of exchange rate movements on our consolidated statement of cash flows was $14 million in2004 compared to $20 million and $6 million in 2003 and 2002, respectively.
11
Indemnifications
Indemnifications to Hewlett-Packard Company
We have given multiple indemnities to Hewlett-Packard Company in connection with ouractivities prior to our spin-off from Hewlett-Packard for the businesses that constituted Agilent priorto the spin-off. These indemnifications cover a variety of aspects of our business, including, but notlimited to, employee, tax, intellectual property and environmental matters. The agreementscontaining these indemnifications have been previously disclosed as exhibits to our registrationstatement on Form S-1 filed on August 16, 1999. In our opinion, the fair value of theseindemnifications is not material.
Indemnifications to Koninklijke Philips Electronics, N.V. (“Philips”)
In connection with the sale of our healthcare solutions business to Philips on August 1, 2001, weindemnified Philips for various matters, including product liability issues arising within two years ofthe sale agreement. In our opinion, the fair value of these indemnifications is not material.
Indemnifications to Officers and Directors
Our corporate by-laws require that we indemnify our officers and directors, as well as thosewho act as directors and officers of other entities at our request, against expenses, judgments, fines,settlements and other amounts actually and reasonably incurred in connection with any proceedingsarising out of their services to Agilent. In addition, we have entered into separate indemnificationagreements with each director and each board-appointed officer of Agilent which provide forindemnification of these directors and officers under similar circumstances and under additionalcircumstances. The indemnification obligations are more fully described in the by-laws and theindemnification agreements. See Exhibits 3.2 and 10.6 of this document. We purchase standardinsurance to cover claims or a portion of the claims made against our directors and officers. Since amaximum obligation is not explicitly stated in our by-laws or in our indemnification agreements andwill depend on the facts and circumstances that arise out of any future claims, the overall maximumamount of the obligations cannot be reasonably estimated. Historically, we have not made paymentsrelated to these obligations, and the fair value for these obligations is zero on the consolidatedbalance sheet as of October 31, 2004.
Other Indemnifications
As is customary in our industry and as provided for in local law in the U.S. and otherjurisdictions, many of our standard contracts provide remedies to our customers and others withwhom we enter into contracts, such as defense, settlement, or payment of judgment for intellectualproperty claims related to the use of our products. From time to time, we indemnify customers, aswell as our suppliers, contractors, lessors, lessees, companies that purchase our businesses or assetsand others with whom we enter into contracts, against combinations of loss, expense, or liabilityarising from various triggering events related to the sale and the use of our products and services,the use of their goods and services, the use of facilities and state of our owned facilities, the state ofthe assets and businesses that we sell and other matters covered by such contracts, usually up to aspecified maximum amount. In addition, from time to time we also provide protection to theseparties against claims related to undiscovered liabilities, additional product liability orenvironmental obligations. In our experience, claims made under such indemnifications are rare andthe associated estimated fair value of the liability is not material.
Results of Continuing Operations
Income from continuing operations increased to $349 million in 2004 from losses of$1,790 million in 2003 and $1,022 million in 2002. The increase in income from 2003 to 2004 ofapproximately $2,139 million was primarily due to revenues increasing by $1,125 million, gross
12

margins improving by 5 percentage points, while operating expenses were down $294 million year-over-year. The provision for taxes also decreased by $1,009 million year over year due to the$1,022 million valuation allowance charge in 2003. The increase in loss from 2002 to 2003 ofapproximately $768 million was also primarily due to this tax provision of $1,022 million, offset by areduction of $326 million of goodwill amortization charges. Fiscal year 2004 was an improved yearfor Agilent. Agilent had strong profitability in all four quarters of 2004 due to tight controls on ouroperating structure and 19 percent revenue growth. This is despite a weakening in oursemiconductor-related businesses markets, which we began to experience in the third quarter after astrong first half. We have accomplished cost reductions via streamlining our IT systems environmentand the number of IT applications. This was brought about by the completion of the implementationof our ERP and CRM projects. Direct IT costs incurred for the implementation of our ERP and CRMprojects were $162 million in 2004, $180 million in 2003 and $146 million in 2002. We have alsoreduced our workforce to 28,000 employees from a peak of 44,000 in April 2001. The final step ofour restructuring was the consolidation of excess manufacturing facilities and moving global sharedservices to lower cost regions and outsourcing services where it made economic sense. Our grossmargins improved in 2004. We have reduced our indirect spending by approximately $82 million.This reduction was accomplished by focusing our spending with preferred suppliers and bycontinuing to reduce spending on IT consulting services. We have also continued to monitor ourprofessional service agreements for savings and value provided to the business. Indirect spendinghas been reduced through a combination of stronger sourcing negotiations, demand managementand compliance with our policy of using preferred suppliers.
We have continued to maintain our research and development expenditures in order to preparefor our future. We introduced several new products including new proteomic tools and theindustry’s first fully automated lab-on-a-chip system for basic research and drug discovery in our lifesciences and chemical analysis business. In our automated test business, we introduced a newmemory test system as well as strengthened the systems on a chip platform with enhancements andnew products. We have also entered into the flat panel display test market with our acquisition ofIBM’s flat panel display business. In our test and measurement segment we introduced the world’sfirst 13 gigahertz oscilloscope.
Orders and Net RevenueYears Ended October 31, 2004 over 2003
% Change2003 over 2002
% Change2004 2003 2002
(in millions)
Orders . . . . . . . . . . . . . . . . . . . . . . . . . . . . . . . $6,997 $6,084 $6,013 15% 1 %
Net Revenue:Products . . . . . . . . . . . . . . . . . . . . . . . . . . . $6,302 $5,240 $5,234 20% —Services and other . . . . . . . . . . . . . . . . . . 879 816 776 8% 5 %
Total net revenue . . . . . . . . . . . . . . . . . . . . . $7,181 $6,056 $6,010 19% 1 %
Years Ended October 31, 2004 over 2003Ppts Change
2003 over 2002Ppts Change2004 2003 2002
% of Total Net Revenue:Products . . . . . . . . . . . . . . . . . . . . . . . . . . . 88% 87% 87% 1 % —Services and other . . . . . . . . . . . . . . . . . . 12% 13% 13% (1)% —
Total . . . . . . . . . . . . . . . . . . . . . . . . . . . . . . 100% 100% 100% — —
13
Years Ended October 31, 2004 over 2003% Change
2003 over 2002% Change2004 2003 2002
(in millions)
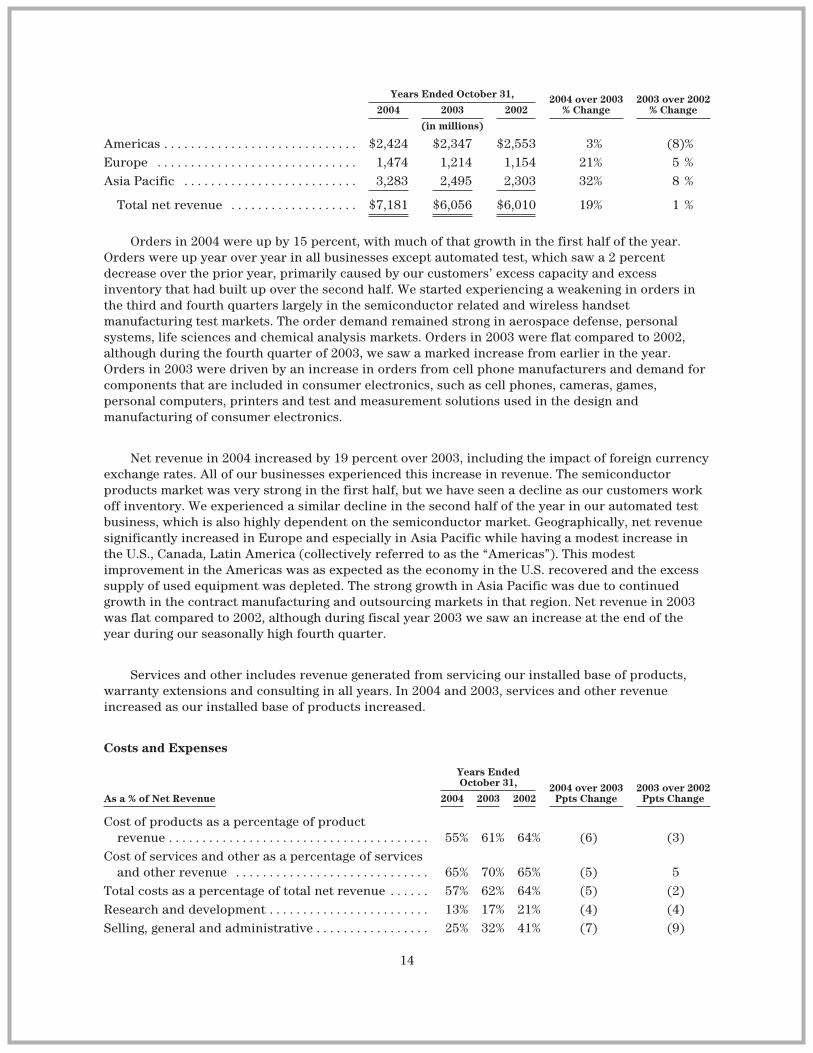
Americas . . . . . . . . . . . . . . . . . . . . . . . . . . . . . $2,424 $2,347 $2,553 3% (8)%Europe . . . . . . . . . . . . . . . . . . . . . . . . . . . . . . 1,474 1,214 1,154 21% 5 %Asia Pacific . . . . . . . . . . . . . . . . . . . . . . . . . . 3,283 2,495 2,303 32% 8 %
Total net revenue . . . . . . . . . . . . . . . . . . . $7,181 $6,056 $6,010 19% 1 %
Orders in 2004 were up by 15 percent, with much of that growth in the first half of the year.Orders were up year over year in all businesses except automated test, which saw a 2 percentdecrease over the prior year, primarily caused by our customers’ excess capacity and excessinventory that had built up over the second half. We started experiencing a weakening in orders inthe third and fourth quarters largely in the semiconductor related and wireless handsetmanufacturing test markets. The order demand remained strong in aerospace defense, personalsystems, life sciences and chemical analysis markets. Orders in 2003 were flat compared to 2002,although during the fourth quarter of 2003, we saw a marked increase from earlier in the year.Orders in 2003 were driven by an increase in orders from cell phone manufacturers and demand forcomponents that are included in consumer electronics, such as cell phones, cameras, games,personal computers, printers and test and measurement solutions used in the design andmanufacturing of consumer electronics.
Net revenue in 2004 increased by 19 percent over 2003, including the impact of foreign currencyexchange rates. All of our businesses experienced this increase in revenue. The semiconductorproducts market was very strong in the first half, but we have seen a decline as our customers workoff inventory. We experienced a similar decline in the second half of the year in our automated testbusiness, which is also highly dependent on the semiconductor market. Geographically, net revenuesignificantly increased in Europe and especially in Asia Pacific while having a modest increase inthe U.S., Canada, Latin America (collectively referred to as the “Americas”). This modestimprovement in the Americas was as expected as the economy in the U.S. recovered and the excesssupply of used equipment was depleted. The strong growth in Asia Pacific was due to continuedgrowth in the contract manufacturing and outsourcing markets in that region. Net revenue in 2003was flat compared to 2002, although during fiscal year 2003 we saw an increase at the end of theyear during our seasonally high fourth quarter.
Services and other includes revenue generated from servicing our installed base of products,warranty extensions and consulting in all years. In 2004 and 2003, services and other revenueincreased as our installed base of products increased.
Costs and Expenses
As a % of Net Revenue
Years EndedOctober 31, 2004 over 2003
Ppts Change2003 over 2002
Ppts Change2004 2003 2002
Cost of products as a percentage of productrevenue . . . . . . . . . . . . . . . . . . . . . . . . . . . . . . . . . . . . . . . 55% 61% 64% (6) (3)
Cost of services and other as a percentage of servicesand other revenue . . . . . . . . . . . . . . . . . . . . . . . . . . . . . 65% 70% 65% (5) 5
Total costs as a percentage of total net revenue . . . . . . 57% 62% 64% (5) (2)Research and development . . . . . . . . . . . . . . . . . . . . . . . . 13% 17% 21% (4) (4)Selling, general and administrative . . . . . . . . . . . . . . . . . 25% 32% 41% (7) (9)
14
Total cost of sales as a percentage of net revenue decreased 5 percentage points from 2003 to2004. Cost of services and other as a percentage of services and other revenue decreased by 5percentage points and cost of products as a percentage of product revenue decreased 6 percentagepoints from 2003. This is a reflection of our continued work on lowering our cost structure,principally through our restructuring programs that contributed incremental savings of $248 millionin 2004 as compared to 2003. We will continue to see the benefits of a more variable cost structurethrough use of selective outsourcing and our variable pay programs for our employees.
Total cost of sales as a percentage of net revenue was relatively flat from 2002 to 2003. Cost ofservices and other as a percentage of services and other revenue increased by 5 percentage pointswhile cost of products as a percentage of product revenue decreased slightly from 2002. The increasein cost of services and other was driven by increased materials consumption for our service andsupport businesses. Cost of products decreased primarily due to net incremental restructuringsavings of $310 million, and a reduction of inventory charges. This decrease was offset byunfavorable mix and volume impacts and the unfavorable currency impact due to the weakening ofthe U.S. dollar.
Inventory charges totaled $45 million in 2004, $11 million in 2003 and $74 million in 2002.Inventory charges in 2004 included a $20 million charge relating to our camera module business.Inventory charges in 2002 reflected continuing weakness in some of our largest markets, particularlyin the telecommunications market. We experienced a significant decline in inventory charges in 2003compared to 2002 primarily due to our efforts to effectively manage our inventory levels. Sales ofpreviously reserved inventory were $24 million in 2004, compared to $17 million in 2003 and $34million in 2002.
Research and development expenses as a percentage of net revenue decreased by 4 percentagepoints in 2004 as a result of net incremental savings from our restructuring efforts of approximately$89 million. The actual decrease from 2003 to 2004 was $118 million. Research and developmentexpenses as a percentage of net revenue decreased in 2003 from 2002 as a result of savings from ourrestructuring efforts of approximately $220 million and decreased indirect spending ofapproximately $95 million in 2003. These savings were offset by increased costs due to theweakening of the U.S. dollar of approximately $30 million. Our research and development effortsfocus on potential new products and product improvements covering a wide variety of technologiesin communications, electronics, life sciences and chemical analysis, none of which is individuallysignificant to our operations. At our central research facility, Agilent Laboratories, we conduct fivetypes of research and development: basic research, which contributes to the fundamentalunderstanding of areas anticipated to be important in the very long term; foundation technologiesresearch, which enables fundamental advances across all businesses; communications research,which creates technologies to enable pervasive access to information; life sciences research, whichenables new measurement solutions to facilitate the development of next-generationpharmaceuticals and molecular diagnostics; and measurement research, which provides criticaladvances in test and measurement electronics and systems. The research at Agilent Laboratoriesrepresents less than 10 percent of Agilent’s consolidated spending on research and development andis intended to be relatively high in technical risk and to be the foundation for future products over alonger time horizon, generally five to ten years out. The majority of our research and development isnearer term and occurs in Agilent’s four business segments. This research and development is aimedat improving the more than 20,000 products already in production and on new product releases.Because of the large number of new and existing products and research and development projectsacross all of our businesses and at Agilent Laboratories, it is difficult to quantify the impact of anyspecific products or projects. We are committed to bringing new products to the market and havefocused our development efforts on key strategic opportunities in order to align our business withavailable markets and position ourselves to capture market share.
15
Selling, general and administrative expenses as a percentage of net revenue decreased 8percentage points in 2004 compared to 2003. Of the $176 million decline, approximately $137million related to our ongoing restructuring cost savings. The decline was also driven in part by thedecrease in indirect spending. The remainder of the decrease reflects our efforts in reducing ourinfrastructure costs and initiatives to control discretionary spending. Selling, general andadministrative expenses as a percentage of net revenue decreased 9 percentage points in 2003compared to 2002. Selling and general and administrative expenses declined primarily due to adecrease in goodwill amortization and impairments of $326 million. The decline was also driven inpart by a decline in indirect spending of $55 million, and incremental net restructuring savings ofapproximately $170 million, which were partially offset by increased costs due to the weakening ofthe U.S. dollar.
At October 31, 2004, our headcount was approximately 28,000 compared to 29,000 in 2003 and36,000 in 2002.
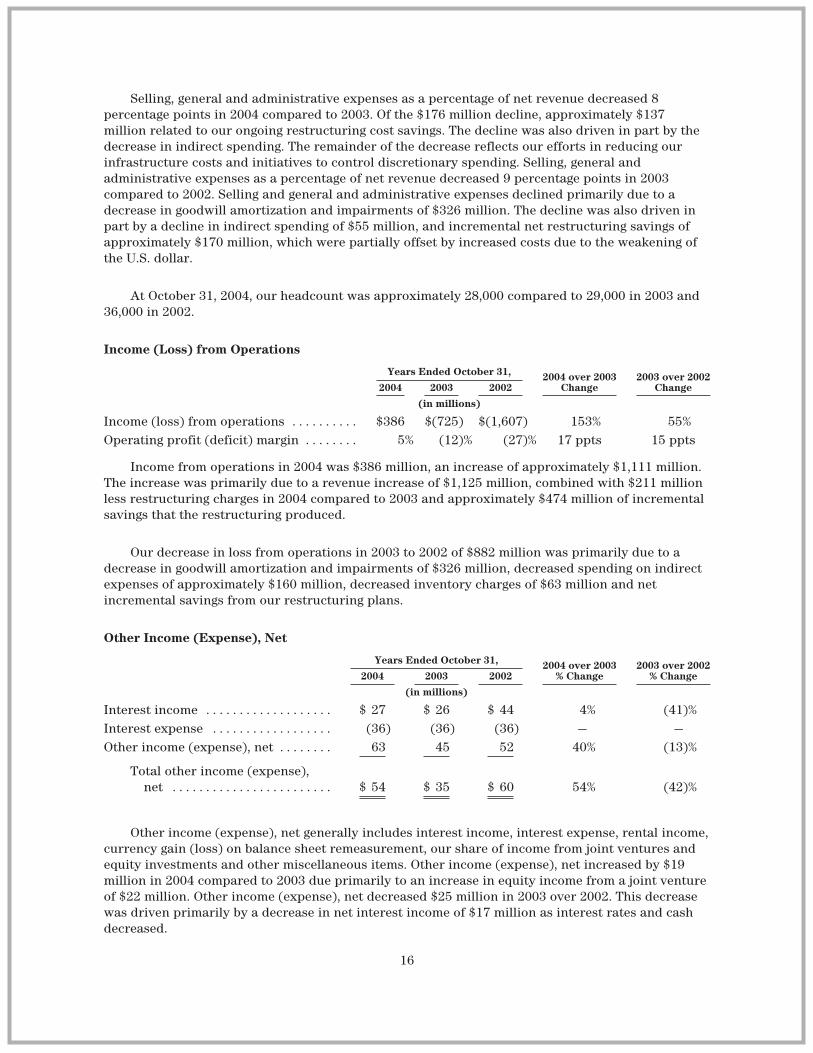
Income (Loss) from Operations
Years Ended October 31, 2004 over 2003Change
2003 over 2002Change2004 2003 2002
(in millions)
Income (loss) from operations . . . . . . . . . . $386 $(725) $(1,607) 153% 55%Operating profit (deficit) margin . . . . . . . . 5% (12)% (27)% 17 ppts 15 ppts
Income from operations in 2004 was $386 million, an increase of approximately $1,111 million.The increase was primarily due to a revenue increase of $1,125 million, combined with $211 millionless restructuring charges in 2004 compared to 2003 and approximately $474 million of incrementalsavings that the restructuring produced.
Our decrease in loss from operations in 2003 to 2002 of $882 million was primarily due to adecrease in goodwill amortization and impairments of $326 million, decreased spending on indirectexpenses of approximately $160 million, decreased inventory charges of $63 million and netincremental savings from our restructuring plans.
Other Income (Expense), Net
Years Ended October 31, 2004 over 2003% Change
2003 over 2002% Change2004 2003 2002
(in millions)
Interest income . . . . . . . . . . . . . . . . . . . $ 27 $ 26 $ 44 4% (41)%Interest expense . . . . . . . . . . . . . . . . . . (36) (36) (36) — —Other income (expense), net . . . . . . . . 63 45 52 40% (13)%
Total other income (expense),net . . . . . . . . . . . . . . . . . . . . . . . . $ 54 $ 35 $ 60 54% (42)%
Other income (expense), net generally includes interest income, interest expense, rental income,currency gain (loss) on balance sheet remeasurement, our share of income from joint ventures andequity investments and other miscellaneous items. Other income (expense), net increased by $19million in 2004 compared to 2003 due primarily to an increase in equity income from a joint ventureof $22 million. Other income (expense), net decreased $25 million in 2003 over 2002. This decreasewas driven primarily by a decrease in net interest income of $17 million as interest rates and cashdecreased.
16
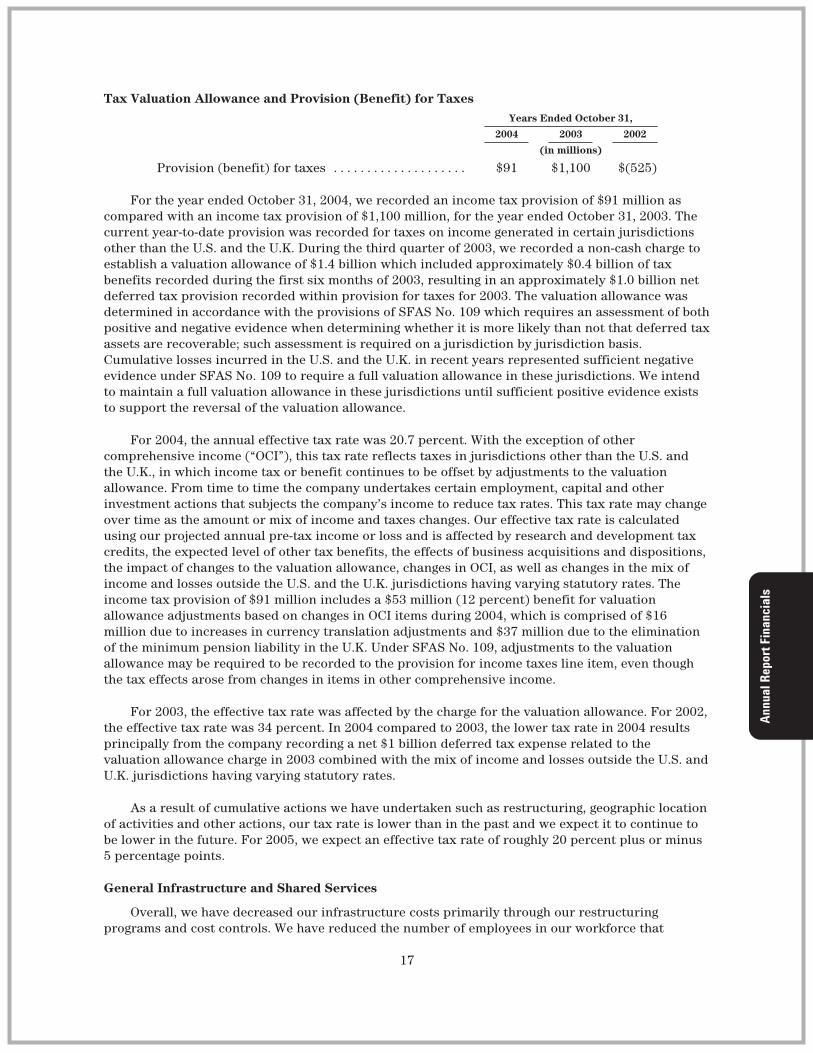
Tax Valuation Allowance and Provision (Benefit) for TaxesYears Ended October 31,
2004 2003 2002
(in millions)
Provision (benefit) for taxes . . . . . . . . . . . . . . . . . . . . $91 $1,100 $(525)
For the year ended October 31, 2004, we recorded an income tax provision of $91 million ascompared with an income tax provision of $1,100 million, for the year ended October 31, 2003. Thecurrent year-to-date provision was recorded for taxes on income generated in certain jurisdictionsother than the U.S. and the U.K. During the third quarter of 2003, we recorded a non-cash charge toestablish a valuation allowance of $1.4 billion which included approximately $0.4 billion of taxbenefits recorded during the first six months of 2003, resulting in an approximately $1.0 billion netdeferred tax provision recorded within provision for taxes for 2003. The valuation allowance wasdetermined in accordance with the provisions of SFAS No. 109 which requires an assessment of bothpositive and negative evidence when determining whether it is more likely than not that deferred taxassets are recoverable; such assessment is required on a jurisdiction by jurisdiction basis.Cumulative losses incurred in the U.S. and the U.K. in recent years represented sufficient negativeevidence under SFAS No. 109 to require a full valuation allowance in these jurisdictions. We intendto maintain a full valuation allowance in these jurisdictions until sufficient positive evidence existsto support the reversal of the valuation allowance.
For 2004, the annual effective tax rate was 20.7 percent. With the exception of othercomprehensive income (“OCI”), this tax rate reflects taxes in jurisdictions other than the U.S. andthe U.K., in which income tax or benefit continues to be offset by adjustments to the valuationallowance. From time to time the company undertakes certain employment, capital and otherinvestment actions that subjects the company’s income to reduce tax rates. This tax rate may changeover time as the amount or mix of income and taxes changes. Our effective tax rate is calculatedusing our projected annual pre-tax income or loss and is affected by research and development taxcredits, the expected level of other tax benefits, the effects of business acquisitions and dispositions,the impact of changes to the valuation allowance, changes in OCI, as well as changes in the mix ofincome and losses outside the U.S. and the U.K. jurisdictions having varying statutory rates. Theincome tax provision of $91 million includes a $53 million (12 percent) benefit for valuationallowance adjustments based on changes in OCI items during 2004, which is comprised of $16million due to increases in currency translation adjustments and $37 million due to the eliminationof the minimum pension liability in the U.K. Under SFAS No. 109, adjustments to the valuationallowance may be required to be recorded to the provision for income taxes line item, even thoughthe tax effects arose from changes in items in other comprehensive income.
For 2003, the effective tax rate was affected by the charge for the valuation allowance. For 2002,the effective tax rate was 34 percent. In 2004 compared to 2003, the lower tax rate in 2004 resultsprincipally from the company recording a net $1 billion deferred tax expense related to thevaluation allowance charge in 2003 combined with the mix of income and losses outside the U.S. andU.K. jurisdictions having varying statutory rates.
As a result of cumulative actions we have undertaken such as restructuring, geographic locationof activities and other actions, our tax rate is lower than in the past and we expect it to continue tobe lower in the future. For 2005, we expect an effective tax rate of roughly 20 percent plus or minus5 percentage points.
General Infrastructure and Shared Services
Overall, we have decreased our infrastructure costs primarily through our restructuringprograms and cost controls. We have reduced the number of employees in our workforce that
17
provide support services such as finance, information technology and workplace services, decreasedthe space that we occupy in our sales and administrative buildings and moved some of our globalshared services operations sites to lower cost regions. Compared to the same time last year,incremental savings for infrastructure costs for the twelve months ended October 31, 2004associated with restructuring plans and cost controls were approximately $230 million. We allocatedthese savings to all businesses according to usage of related services. The general infrastructure andshared services ended 2004 with approximately 4,000 employees, a decrease of approximately 200employees from one year ago and approximately 1,700 employees from two years ago.
Segment Overview
Agilent is a global diversified technology company that provides enabling solutions to marketswithin the communications, electronics, life sciences and chemical analysis industries. We have fourprimary businesses: test and measurement, automated test, semiconductor products and lifesciences and chemical analysis. In addition to the discussion below, also see Note 19, “SegmentInformation” in Notes to Consolidated Financial Statements.
Test and Measurement
Our test and measurement business provides standard and customized solutions that are usedin the design, development, manufacture, installation, deployment and operation of electronicequipment and systems and communications networks and services. Our communications testsolutions generated approximately 70 percent of test and measurement revenues in 2004 while ourgeneral purpose test solutions generated approximately 30 percent. Overall order activity over thelast 3 years demonstrates the cyclical nature of the markets for our test and measurement products.Orders dropped dramatically during 2002 (29 percent) and 2003 (5 percent) and grew 18 percentyear-over-year in 2004.
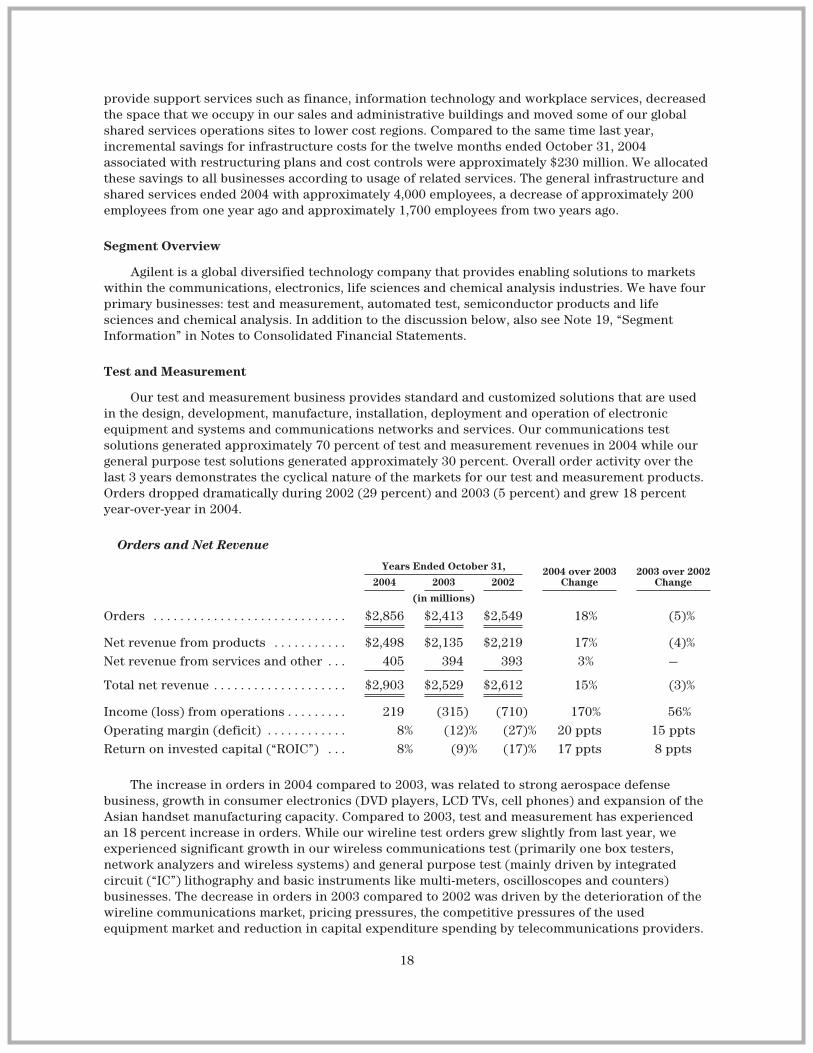
Orders and Net Revenue
Years Ended October 31, 2004 over 2003Change
2003 over 2002Change2004 2003 2002
(in millions)
Orders . . . . . . . . . . . . . . . . . . . . . . . . . . . . . $2,856 $2,413 $2,549 18% (5)%
Net revenue from products . . . . . . . . . . . $2,498 $2,135 $2,219 17% (4)%Net revenue from services and other . . . 405 394 393 3% —
Total net revenue . . . . . . . . . . . . . . . . . . . . $2,903 $2,529 $2,612 15% (3)%
Income (loss) from operations . . . . . . . . . 219 (315) (710) 170% 56%Operating margin (deficit) . . . . . . . . . . . . 8% (12)% (27)% 20 ppts 15 pptsReturn on invested capital (“ROIC”) . . . 8% (9)% (17)% 17 ppts 8 ppts
The increase in orders in 2004 compared to 2003, was related to strong aerospace defensebusiness, growth in consumer electronics (DVD players, LCD TVs, cell phones) and expansion of theAsian handset manufacturing capacity. Compared to 2003, test and measurement has experiencedan 18 percent increase in orders. While our wireline test orders grew slightly from last year, weexperienced significant growth in our wireless communications test (primarily one box testers,network analyzers and wireless systems) and general purpose test (mainly driven by integratedcircuit (“IC”) lithography and basic instruments like multi-meters, oscilloscopes and counters)businesses. The decrease in orders in 2003 compared to 2002 was driven by the deterioration of thewireline communications market, pricing pressures, the competitive pressures of the usedequipment market and reduction in capital expenditure spending by telecommunications providers.
18
Test and measurement revenues were up 15 percent year-over-year. Leading this trend in thecommunications test markets, wireless test revenues were up 22 percent while wireline test was down11 percent year-over-year. The good results in wireless test was in large part due to the expansion ofcell phone handset production in Asia. Pricing pressure and the used equipment market impactedwireline revenues. Communications test makes up approximately 70 percent of the test andmeasurement revenues and wireless test makes up approximately 80 percent of communications test.General purpose test revenues were up 13 percent year-over-year mainly as a result of growth inaerospace defense as well as in our logic analyzers, oscilloscopes and design software.
We saw a reduction in orders from wireless handset manufacturers in the fourth quarter of2004, as they began to absorb the excess capacity that they put in place earlier in the year. This waspartially offset by growth in our wireless handset R&D products as customers began to focus on newcellular formats, investments in 3.5G technologies and the development of converged cellular andwireless network devices. In the fourth quarter of 2004, we saw growth in our wirelessinfrastructure test as top base station manufacturers continued to expand capacity of existingformats to upgrade or improve the quality of service. In some regions, the expansion of 3G capacityhas increased the need for additional test equipment. We expect our wireless test business to remainsoft through most of the first half 2005 as handset manufacturers rebalance their manufacturingcapacity versus the demand. In our general purpose test market, we expect to see continued demandfrom the U.S. government and prime military contractors, as recapitalization and modernizationcontinues.
Net revenue for 2003 declined 3 percent compared to 2002, following the same trends as orders.The decline in net revenue was primarily the result of the slowdown in the telecommunicationsindustry partially offset by favorable currency impacts.
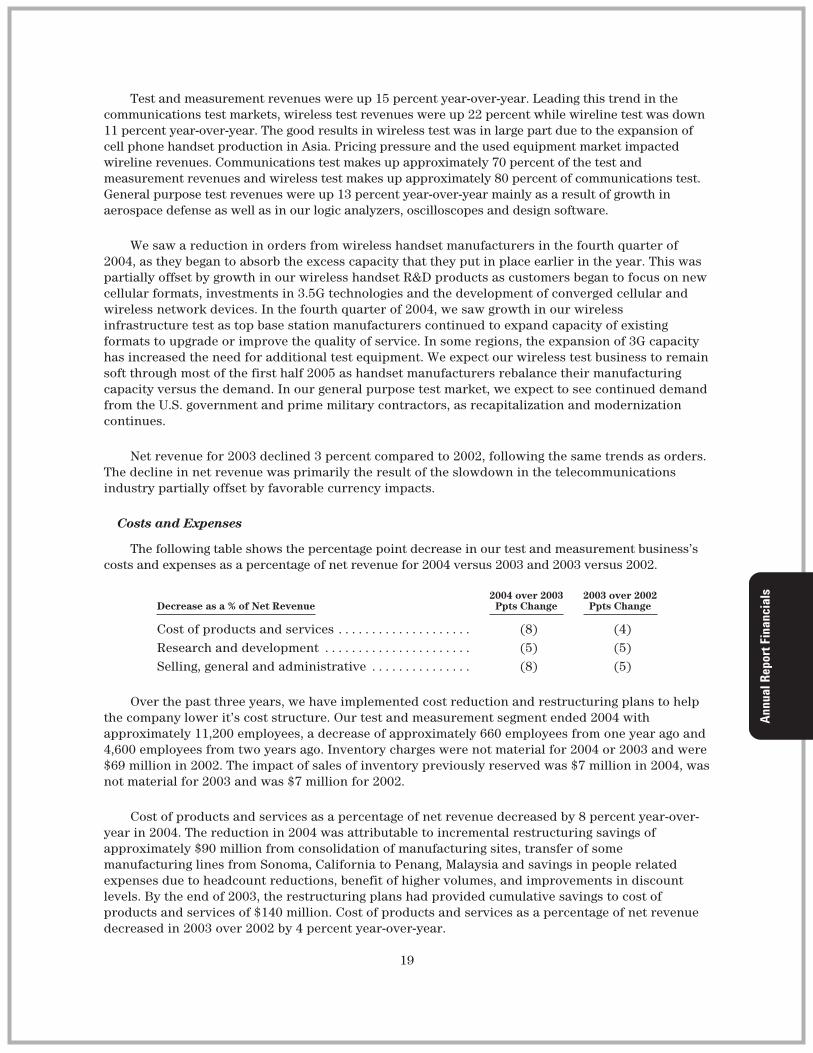
Costs and Expenses
The following table shows the percentage point decrease in our test and measurement business’scosts and expenses as a percentage of net revenue for 2004 versus 2003 and 2003 versus 2002.
Decrease as a % of Net Revenue2004 over 2003
Ppts Change2003 over 2002
Ppts Change
Cost of products and services . . . . . . . . . . . . . . . . . . . . (8) (4)Research and development . . . . . . . . . . . . . . . . . . . . . . (5) (5)Selling, general and administrative . . . . . . . . . . . . . . . (8) (5)
Over the past three years, we have implemented cost reduction and restructuring plans to helpthe company lower it’s cost structure. Our test and measurement segment ended 2004 withapproximately 11,200 employees, a decrease of approximately 660 employees from one year ago and4,600 employees from two years ago. Inventory charges were not material for 2004 or 2003 and were$69 million in 2002. The impact of sales of inventory previously reserved was $7 million in 2004, wasnot material for 2003 and was $7 million for 2002.
Cost of products and services as a percentage of net revenue decreased by 8 percent year-over-year in 2004. The reduction in 2004 was attributable to incremental restructuring savings ofapproximately $90 million from consolidation of manufacturing sites, transfer of somemanufacturing lines from Sonoma, California to Penang, Malaysia and savings in people relatedexpenses due to headcount reductions, benefit of higher volumes, and improvements in discountlevels. By the end of 2003, the restructuring plans had provided cumulative savings to cost ofproducts and services of $140 million. Cost of products and services as a percentage of net revenuedecreased in 2003 over 2002 by 4 percent year-over-year.
19
Research and development expenses as a percentage of net revenue decreased 5 percent year-over-year. On a dollar basis, expenses were down 15 percent, mainly due to $35 million ofrestructuring savings and an $11 million reduction in indirect expenses. We have reduced ourresearch and development headcount to match the size and focus of the business. We have focusedour development efforts on strategic opportunities that align our business with available marketsand have cancelled new product introductions that would not result in an adequate return oninvestment. Research and development expenses as a percentage of net revenue decreased 5 percentin 2003 from 2002 due to restructuring savings and reduction in indirect expense savings.
Selling, general and administrative expenses as a percentage of net revenue decreased 8 percentin 2004 compared to 2003 due to increased revenue, $42 million in restructuring savings, efficienciesgained from our ERP implementation and a $2 million reduction in indirect expenses. Thesereductions were partially offset by an unfavorable currency impact of $26 million. Selling, generaland administrative expenses as a percentage of net revenue decreased 5 percent in 2003 comparedto 2002 due to restructuring savings, efficiencies gained from our ERP implementation andreduction in indirect expenses.
Income (Loss) from Operations
Operating profit increased by $534 million compared to 2003 on a revenue increase of only $374million. Aggressive restructuring through workforce reductions, reduction in our cost structure andstrict discretionary spending controls helped comparative operating results. This resulted inrestructuring savings of $167 million for the test and measurement business. This segment’s returnon invested capital (“ROIC”) was 8 percent, negative 9 percent and negative 17 percent for 2004,2003 and 2002, respectively.
Automated Test
Our automated test business provides test system solutions that are used in the manufacture ofsemiconductor devices, electronics (primarily printed circuit-board assemblies) and flat paneldisplays. Our test solutions enable electronics designers and manufacturers to shorten the design-to-production cycle, lower manufacturing cost of test, confirm the functional quality of their devicesand of their manufacturing processes, and accelerate the high-volume delivery of their products. Themain driver of our customers’ business (IT, networking, and internet infrastructure) are theconsumers who drive the market for PC’s, cell phones, electronic games, and similar consumerelectronics. Our automated test segment experienced a difficult last quarter in 2004 as the businessenvironment was much weaker than expected. This segment is undergoing major product transitionsin several of its product lines.
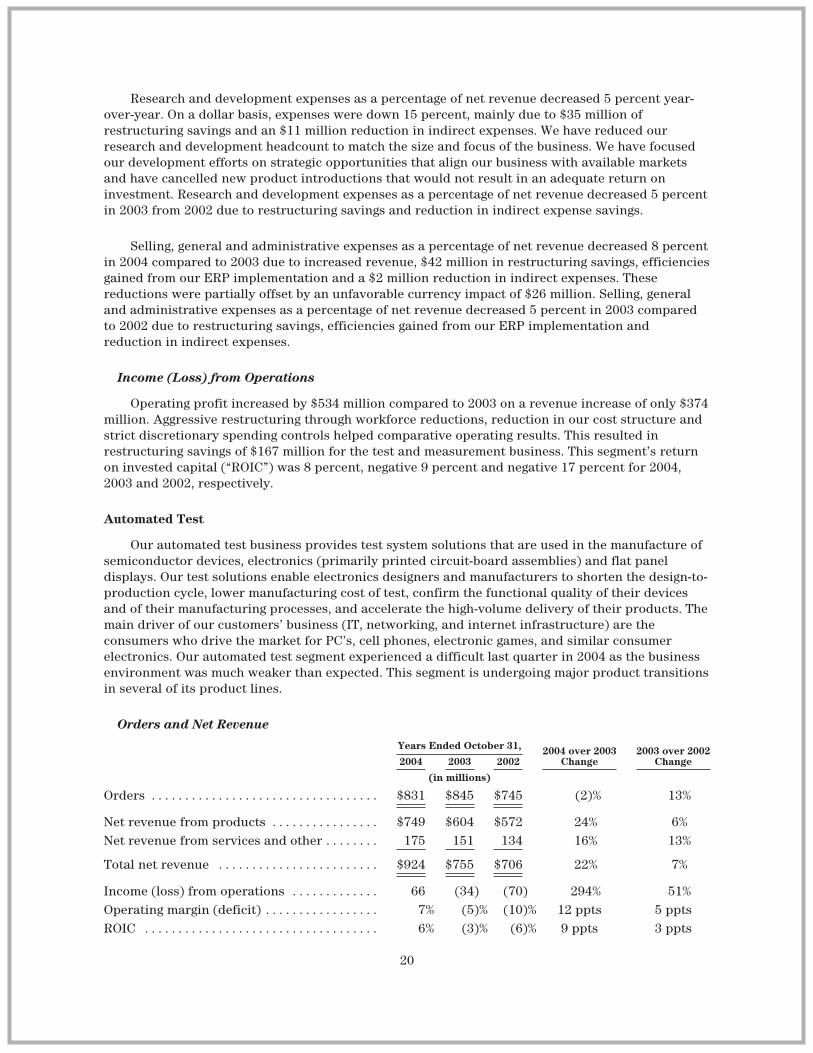
Orders and Net Revenue
Years Ended October 31, 2004 over 2003Change
2003 over 2002Change2004 2003 2002
(in millions)
Orders . . . . . . . . . . . . . . . . . . . . . . . . . . . . . . . . . . $831 $845 $745 (2)% 13%
Net revenue from products . . . . . . . . . . . . . . . . $749 $604 $572 24% 6%Net revenue from services and other . . . . . . . . 175 151 134 16% 13%
Total net revenue . . . . . . . . . . . . . . . . . . . . . . . . $924 $755 $706 22% 7%
Income (loss) from operations . . . . . . . . . . . . . 66 (34) (70) 294% 51%Operating margin (deficit) . . . . . . . . . . . . . . . . . 7% (5)% (10)% 12 ppts 5 pptsROIC . . . . . . . . . . . . . . . . . . . . . . . . . . . . . . . . . . . 6% (3)% (6)% 9 ppts 3 ppts
20

Orders in 2004 decreased 2 percent compared to 2003, primarily due to a weak second halfcaused by our customers’ excess inventory. Our customers also delayed purchases in anticipation ofour recently released next-generation flash memory and system-on-a-chip (“SOC”) test systems.Semiconductor test orders were down 6 percent while electronic manufacturing test orders were up18 percent compared to last year. In the fourth quarter of 2004, our automated test segment reachedits lowest level of quarterly orders since the first quarter of 2003. This downturn could continuethrough the first half of next year.
Orders in 2003 increased 13 percent compared to 2002 primarily due to increasing strength inthe semiconductor test market as customers started to build increased production capacity for nextgeneration devices. This increase was mainly driven by demand for consumer products incomputation such as PC chip sets, graphics, and networking, digital consumer products and wirelessproducts. In the fourth quarter of 2003, our automated test segment reached its highest level ofquarterly orders since the fourth quarter of 2000 and continued to achieve market growth throughdesign wins.
Net revenue in 2004 increased 22 percent compared to 2003 primarily due to an improvedmarketplace. Semiconductor test revenue growth was mixed, with strong parametric test revenuefrom our investments in 300-millimeter fabrication and wafer production test and solid SOC testrevenue. Revenue for our flash memory business declined 13 percent. Services and other revenueincreased 16 percent. Services and other includes the sale of support for hardware and software,and the sale of services such as, training, application development and test consulting for newinstallations and our installed base. We expect the downturn in orders we experienced in the secondhalf of 2004 to impact revenues in the first half of 2005.
Net revenue in 2003 increased 7 percent compared to 2002 primarily due to increased sales ofour products across the board in semiconductor test such as, flash memory and SOC, and electronicmanufacturing test markets. Semiconductor test grew 7 percent and electronic manufacturing testalso grew 7 percent. Support and services revenue increased 13 percent.
Costs and Expenses
The following table shows the percentage point increase/(decrease) in our automated testsegment’s costs and expenses as a percentage of net revenue for 2004, 2003 and 2002.
Increase/(Decrease) as a % of Net Revenue2004 over 2003
Ppts Change2003 over 2002
Ppts Change
Cost of products and services . . . . . . . . . . . . . . . . . . . . (2) 2Research and development . . . . . . . . . . . . . . . . . . . . . . (3) (2)Selling, general and administrative . . . . . . . . . . . . . . . (7) (6)
As a part of the effort to lower our company’s cost structure, our automated test segment endedthis fiscal year with approximately 2,200 employees, a decrease of approximately 60 employees fromone year ago and 600 employees from two years ago.
Cost of products and services as a percentage of net revenue decreased in 2004 compared to2003. Our automated test segment continued to control costs through outsourcing to contractmanufacturers, and monitoring indirect and direct material costs. The decreases were drivenprimarily by higher revenue, savings from costs controls, lower infrastructure costs and efficienciesfrom outsourcing to contract manufacturers. The pricing environment remains highly competitive.
Cost of products and services as a percentage of net revenue increased in 2003 compared to2002. Savings from cost controls, and efficiencies from outsourcing to contract manufacturers were
21
offset by competitive pricing pressures. In 2002, integrated device manufacturers (“IDMs”), designhouses, and contract manufacturers focused on buying technology capability through high margintesters. However in 2003, as we saw signs of economic recovery, our customers added capacity andbought more focused cost effective systems. Pricing pressures affected the majority of our products.
We sold $3 million of inventory in 2004 that was previously reserved compared to $8 million in2003 and $4 million in 2002.
Research and development expenses in 2004 as a percentage of net revenue decreased 3percentage points from 2003. On a dollar basis, expenses increased 7 percent compared to last year.The increase is related to the company’s plan to aggressively expand the breadth of its offerings inflash and SOC test systems. The 2 percentage point decrease in research and development expensesas a percentage of net revenue in 2003 compared to 2002 was due to aggressive cost controls put inplace, which focused our efforts on more strategic opportunities to align our business with availablemarkets. On a dollar basis, research and development expenses in 2003 decreased 4 percent from2002.
Selling, general and administrative expenses as a percentage of net revenue decreased 7percentage points in 2004 compared to 2003, while on a dollar basis, expenses were down 7 percent.The decreases reflect our efforts in reducing our infrastructure costs and initiatives to controldiscretionary spending. In 2003, selling, general, and administrative expenses as a percentage of netrevenue were down 6 percentage points compared to 2002, while on a dollar basis, expenses weredown 9 percent. The decrease reflects our success in controlling discretionary spending.
Income (Loss) from Operations
In 2004, our automated test segment achieved an operating profit of $66 million, a rebound froman operating loss of $34 million from 2003. This $100 million profit improvement was the result of$169 million in revenue growth, gross margin improvement and expense controls. In 2003, ourautomated test segment reduced operating losses by 51 percent compared to 2002 while revenueincreased 7 percent. Automated test returned to profitability in the second half of 2003. Thereduction in loss from operations in 2003 compared to 2002 was primarily due to higher net revenueand reduced spending resulting from our cost reduction measures. In addition, operationalefficiencies arising from outsourcing to contract manufacturers contributed to the return toprofitability in the second half and improvement in 2003. This segment achieved a ROIC of 6 percentin 2004 compared to a ROIC of negative 3 percent in 2003 and negative 6 percent in 2002.
Semiconductor Products
Our semiconductor products business is a leading supplier of semiconductor components,modules and assemblies for consumer and commercial electronics applications. We design, developand manufacture products for the networking and personal systems markets. Our personal systemsproducts, which accounted for 72 percent of our 2004 revenue, are used in mobile phones, opticalmice, flat panel displays, printers and plasma televisions. Our networking products include fiberoptic transceivers for sending and receiving data over high-speed networks and ICs for enterprisestorage and networking.
Overall, 2004 marked the semiconductor products business’s return to healthy financialperformance, with orders and revenue growing over 2003 by 20 percent and 27 percent, respectively.A small operating loss in 2003 was replaced by solid profit in 2004. After a strong first half of 2004,this business, along with most of our industry, experienced a decline in the second half, due to ourcustomers working off excess inventory. The decline is expected to extend into 2005, but we doanticipate growth opportunities for some of our new products, such as E-pHEMT based front-endmodules and laser mouse navigation devices.
22

Orders and Net RevenueYears Ended October 31, 2004 over 2003
Change2003 over 2002
Change2004 2003 2002
(in millions)
Orders . . . . . . . . . . . . . . . . . . . . . $1,978 $1,652 $1,568 20% 5%
Net revenue . . . . . . . . . . . . . . . . . $2,021 $1,586 $1,559 27% 2%Income (loss) from
operations . . . . . . . . . . . . . . . . 166 (59) (115) 381% 49%Operating margin (deficit) . . . . 8% (4)% (7)% 12 ppts 3 pptsROIC . . . . . . . . . . . . . . . . . . . . . . . 17% (2)% (3)% 19 ppts 1 ppt
Total orders grew 20 percent in 2004, up from 5 percent growth experienced in 2003. Ourpersonal systems market achieved 32 percent growth in 2004 orders, but our networking marketsuffered a 4 percent decline. There is a continuing geographic shift of our business, with orders fromAsia increasing 5 percent in 2003 and 40 percent in 2004, and accounting for 62 percent of totalorders in 2004. Orders from the Americas declined 1 percent in 2003 and 11 percent in 2004.
Robust 2004 order growth in the personal systems market was driven by strength in physicallayer networking components, FBAR duplexers, E-pHEMT power modules, optocouplers and cameramodules. Within our networking segment, despite being down as a whole, there were a number ofproduct lines that had marked increases. For example, application specific integrated circuits(“ASICs”) grew 18 percent and physical layer networking components grew 74 percent over 2003.Fiber optics and storage area network products, however, suffered double-digit declines comparedto 2003.
Revenue grew 27 percent overall in 2004 compared to a 2 percent increase in 2003. Growthcontinued in the personal systems segment, as revenue increased 37 percent in 2004, following 3percent growth in 2003. Optocouplers and wireless communication components led the increase in2004. The Networking segment grew 7 percent in 2004 after declining 1 percent in 2003. Revenuesfrom sales to Hewlett-Packard, primarily for ASICs, storage area networking and motion-controlproducts, were 14 percent of the business’s net revenue in 2004, compared to 20 percent in 2003 and33 percent in 2002.
Costs and Expenses
The following table shows the percentage point increase/(decrease) in our semiconductorproducts business’s costs and expenses as a percentage of its net revenue for 2004 versus 2003, and2003 versus 2002.
Increase/(Decrease) as a % of Net Revenue2004 over 2003
Ppts Change2003 over 2002
Ppts Change
Cost of products . . . . . . . . . . . . . . . . . . . . . . . . . . . . . . . (4) 2Research and development . . . . . . . . . . . . . . . . . . . . . . (4) (4)Selling, general and administrative . . . . . . . . . . . . . . . (3) (2)
Though gross margins suffered in the final quarter of 2004 as revenue fell, 2004 as a whole stillshowed a four percentage point improvement in cost of sales compared to 2003. Despite typicalerosion of average selling prices within the semiconductor industry, most notably in our fiber-opticsand camera module businesses, significant gross margin improvement was achieved as a result ofthe incremental margins on $435 million in additional revenue over 2003, as well as approximately$100 million of incremental restructuring savings and ERP implementation efforts that took placelargely in 2002 and 2003.
23
The erosion of average selling prices of established products is typical of the industry and newproducts typically yield larger gross margins. Consistent with trends in the semiconductor markets,we anticipate that average-selling prices will continue to deteriorate in 2005. However, as part of ournormal course of business, we plan to offset this deterioration with ongoing cost reduction activitiesand new product introductions.
The sale of previously reserved inventory, due to unanticipated demand for products previouslyconsidered to be unmarketable, had a small impact on year-over-year cost of sales comparisons. In2004 we sold $11 million worth of inventory that we had previously written down, compared to $5million in 2003 and $18 million in 2002. Inventory charges were not material in any of the periodspresented.
Research and development expenses dropped 4 percentage points expressed as a percentage ofrevenue from 2003 to 2004. Selling, general and administrative expenses dropped 3 percentagepoints as a percentage of revenue from 2003 to 2004. This improvement resulted from the increasein revenue from 2003 to 2004 in combination with expenses being held slightly under 2003’s level inabsolute dollar terms. Total semiconductor products headcount was flat from 2003 to 2004.
Income (Loss) from Operations
Operating profit in 2004 of $166 million represents a $225 million improvement over theoperating loss of $59 million in 2003, and a 12 percentage point improvement in operation margins.The segment’s ROIC was 17 percent, negative 2 percent and negative 3 percent for 2004, 2003 and2002 respectively. The improvement achieved in 2004 drew from a variety of previously mentionedsources, such as higher revenue, ERP efficiencies, restructuring efforts from early 2003, and thecontinual release of new products. Restructuring efforts played a proportionally larger role in theimprovement seen in 2003 compared to 2002.
In the fourth quarter of 2004 we agreed to sell inventory and fixed assets relating to our cameramodule business. We will continue to sell the image sensors that are a component part of the cameramodules, but after the sale we will no longer produce the assembled modules. We will retainintellectual property and research and development activities associated with the image sensortechnology. This announced sale is not expected to have a material impact on operating profits in2005. The revenues for 2004 associated with the camera module business were approximately $300million.
Life Sciences and Chemical Analysis
Our life sciences and chemical analysis business provides application-focused solutions thatinclude instruments, software, consumables and services that enable customers to identify, quantifyand analyze the physical and biological properties of substances and products. Our seven keyproduct categories include: microarrays, microfluidics, gas chromatography, liquid chromatography,mass spectrometry, software and informatics, and related consumables, reagents and services. Thebusiness achieved solid growth in 2004, with orders and revenue growing by 13 percent and 12percent, respectively, compared to 2003, and operating income up 30 percent. Growth was relativelyeven between our businesses serving the life sciences and chemical analysis markets.
24
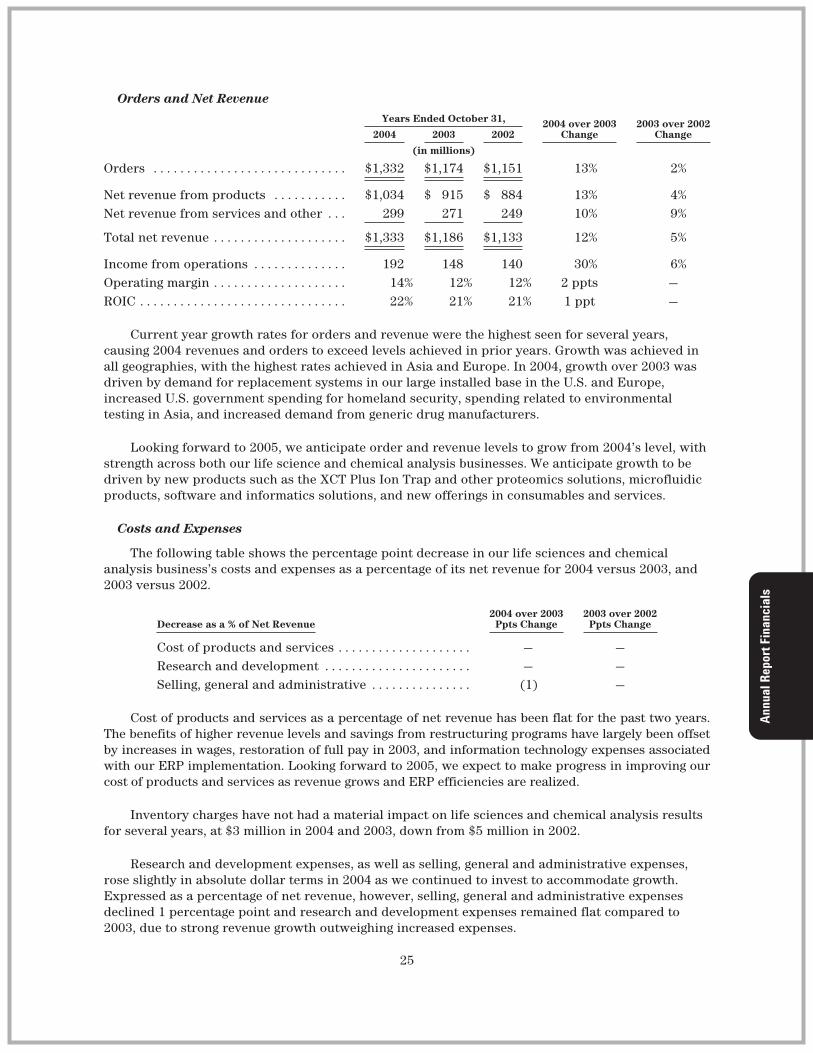
Orders and Net Revenue
Years Ended October 31, 2004 over 2003Change
2003 over 2002Change2004 2003 2002
(in millions)
Orders . . . . . . . . . . . . . . . . . . . . . . . . . . . . . $1,332 $1,174 $1,151 13% 2%
Net revenue from products . . . . . . . . . . . $1,034 $ 915 $ 884 13% 4%Net revenue from services and other . . . 299 271 249 10% 9%
Total net revenue . . . . . . . . . . . . . . . . . . . . $1,333 $1,186 $1,133 12% 5%
Income from operations . . . . . . . . . . . . . . 192 148 140 30% 6%Operating margin . . . . . . . . . . . . . . . . . . . . 14% 12% 12% 2 ppts —ROIC . . . . . . . . . . . . . . . . . . . . . . . . . . . . . . . 22% 21% 21% 1 ppt —
Current year growth rates for orders and revenue were the highest seen for several years,causing 2004 revenues and orders to exceed levels achieved in prior years. Growth was achieved inall geographies, with the highest rates achieved in Asia and Europe. In 2004, growth over 2003 wasdriven by demand for replacement systems in our large installed base in the U.S. and Europe,increased U.S. government spending for homeland security, spending related to environmentaltesting in Asia, and increased demand from generic drug manufacturers.
Looking forward to 2005, we anticipate order and revenue levels to grow from 2004’s level, withstrength across both our life science and chemical analysis businesses. We anticipate growth to bedriven by new products such as the XCT Plus Ion Trap and other proteomics solutions, microfluidicproducts, software and informatics solutions, and new offerings in consumables and services.
Costs and Expenses
The following table shows the percentage point decrease in our life sciences and chemicalanalysis business’s costs and expenses as a percentage of its net revenue for 2004 versus 2003, and2003 versus 2002.
Decrease as a % of Net Revenue2004 over 2003
Ppts Change2003 over 2002
Ppts Change
Cost of products and services . . . . . . . . . . . . . . . . . . . . — —Research and development . . . . . . . . . . . . . . . . . . . . . . — —Selling, general and administrative . . . . . . . . . . . . . . . (1) —
Cost of products and services as a percentage of net revenue has been flat for the past two years.The benefits of higher revenue levels and savings from restructuring programs have largely been offsetby increases in wages, restoration of full pay in 2003, and information technology expenses associatedwith our ERP implementation. Looking forward to 2005, we expect to make progress in improving ourcost of products and services as revenue grows and ERP efficiencies are realized.
Inventory charges have not had a material impact on life sciences and chemical analysis resultsfor several years, at $3 million in 2004 and 2003, down from $5 million in 2002.
Research and development expenses, as well as selling, general and administrative expenses,rose slightly in absolute dollar terms in 2004 as we continued to invest to accommodate growth.Expressed as a percentage of net revenue, however, selling, general and administrative expensesdeclined 1 percentage point and research and development expenses remained flat compared to2003, due to strong revenue growth outweighing increased expenses.
25
Income from Operations
Our life science and chemical analysis business’s 30 percent increase in income from operationsin 2004 compared to 2003 was accomplished by strong, broad-based revenue growth combined withprudent expense management. Operating profit as a percentage of revenue increased 2 percentagepoints in 2004 compared to 2003, reaching 14 percent of revenue. The segment’s ROIC was 22percent, 21 percent and 21 percent for 2004, 2003 and 2002 respectively.
Financial Condition
Liquidity and Capital Resources
Our financial position remained strong at October 31, 2004, with cash and cash equivalents of$2,315 million.
Net Cash Used in Operating Activities
We generated cash from continuing operations of $663 million in 2004 compared to $164 millionused in 2003. We spent $138 million on restructuring activities in 2004, primarily in the form ofseverance payments, compared to $379 million in fiscal 2003. We generated cash from continuingoperations of $409 million in the last quarter of 2004.
In 2004, accounts receivable generated cash of $80 million versus cash generated of $52 millionin 2003. In 2004, accounts payable generated cash of $43 million versus cash generated of $69million in 2003. Cash used from inventory was $79 million in 2004 compared to cash generation of$157 million in 2003. Inventory days on hand were slightly improved as of the end of 2004 at 89 dayscompared to 93 days in 2003.
We used $63 million of cash in 2004 to fund our U.S. defined benefit plan and contributed $83million to our international defined benefits plans. Cash contributions in 2004 were approximately$72 million or 33 percent less than in 2003. In 2005, we expect funding requirements for our variousbenefit plans to continue to decrease. Our annual contributions are highly dependent on the relativeperformance of our assets versus our projected liabilities, among other factors. As the value of ourassets increases relative to our future projected obligations we will make smaller contributions tomaintain our funded status.
In 2004, as in 2003, we recorded no goodwill amortization in accordance with SFAS No. 142.Depreciation and amortization decreased from $362 million in 2003 to $292 million in 2004reflecting the reduced acquisitions of property plant and equipment over the past few years and thefull amortization of other intangibles relating to business combinations. We had a non-cash charge of$268 million related to the adoption of SFAS No. 142 in the first quarter of 2003.
We paid income taxes amounting to $149 million in 2004, as compared to $122 million in 2003.
Net Cash Used in Investing Activities
Net cash used in investing activities for 2004 was $114 million compared to $203 million in2003. Investments in property, plant and equipment continue to decrease to $118 million, a decreaseof $87 million from 2003. Over half of the property, plant and equipment purchases were related toour investments in information technology programs such as the ERP and CRM systems and thedevelopment of our website. We also have been making investments in some of our facilities. Thetotal cash outlays for these initiatives were $102 million in 2004 compared to $209 million in 2003.Cash used for investments in property, plant and equipment has decreased driven by our overall
26

strategy of tight spending controls and cash conservation. However, we are making appropriateinvestments in our IT and facility infrastructure with our improved cash position.
Net Cash Provided by Financing Activities
Net cash generated by financing activities for 2004 was $145 million compared to $110 millionin 2003. In the first quarter of 2002, we borrowed $1,123 million, net of issuance costs, under aprivate offering of three percent senior convertible debenture due 2021. Beginning in December2004, we have an option to redeem the debt in whole or in part in cash. If we choose to redeem thedebt, the holders may elect to receive common stock at the initial conversion price of $32.22 pershare in place of cash. Holders of the debentures have an option to require us to repurchasedebentures, in whole or in part, on December 1 in each of 2006, 2011 and 2016.
Other
We have contractual commitments for non-cancelable operating leases and vendor financingarrangements with CIT and others. We provide lease guarantees on these financing arrangementsand we have no other material guarantees or commitments. See Note 17, “Commitments” in Item 15of this report for further information on our non-cancelable operating leases.
Our liquidity is affected by many factors, some of which are based on normal ongoingoperations of our business and some of which arise from fluctuations related to global economicsand markets. Our cash balances are generated and held in many locations throughout the world.Local government regulations may restrict our ability to move cash balances to meet cash needsunder certain circumstances. We do not currently expect such regulations and restrictions to impactour ability to pay vendors and conduct operations throughout our global organization.
On February 7, 2003 Standard and Poor’s Rating Services lowered its corporate credit andsenior note ratings for Agilent to “speculative grade” status, from BBB minus to BB. On May 22, 2003Moody’s Investors Service downgraded its senior unsecured rating of Agilent from Baa2 to Ba2.Moody’s also assigned the company a first time senior implied rating of Ba2. Both Moody’s and S&Pattached a “negative outlook” to their ratings at the time of the downgrades. The downgrades did nothave any material impact on our liquidity. On May 25, 2004, S&P revised its outlook to “positive”from “negative”. On December 20, 2004, Moody’s revised its outlook to “stable” from “negative”.There are no financial covenants related to our senior unsecured convertible notes. We believe thatour current cash and cash equivalents and other financing capabilities will be sufficient to satisfyour working capital, capital expenditure and other liquidity needs for 2005.
Contractual Commitments
Our cash flows from operations are dependent on a number of factors, including fluctuations inour operating results, accounts receivable collections, inventory management, and the timing of taxand other payments. As a result, the impact of contractual obligations on our liquidity and capitalresources in future periods should be analyzed in conjunction with such factors.
27
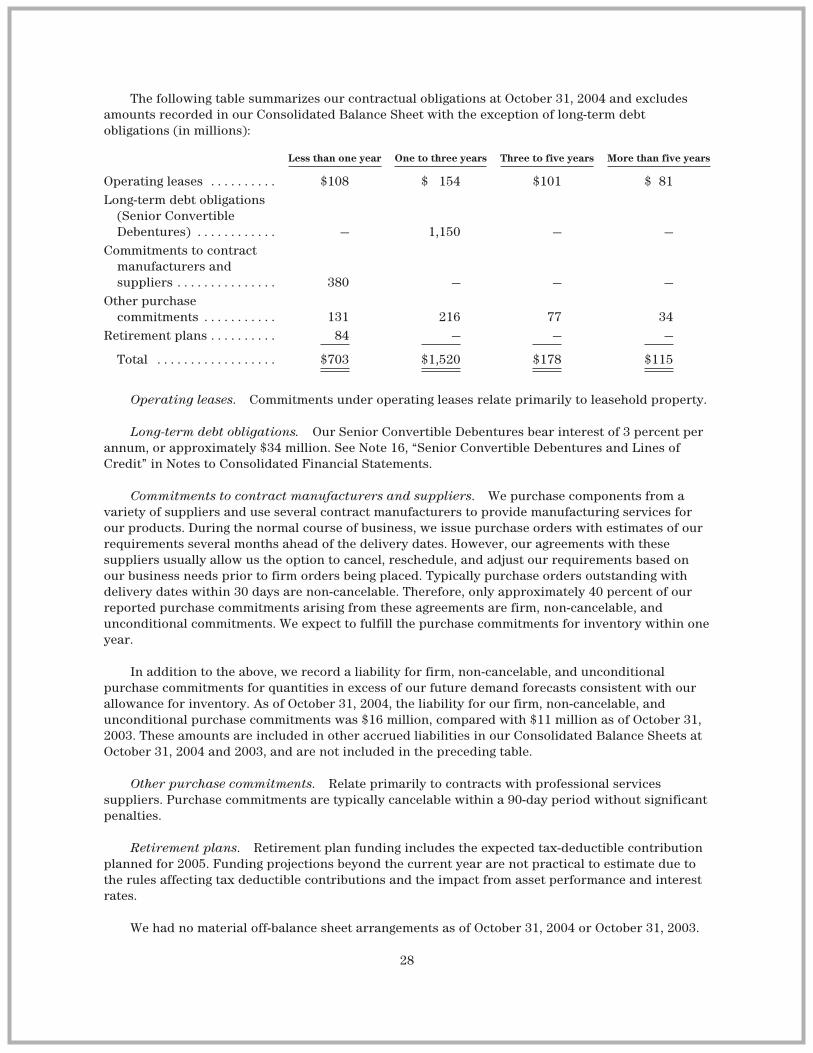
The following table summarizes our contractual obligations at October 31, 2004 and excludesamounts recorded in our Consolidated Balance Sheet with the exception of long-term debtobligations (in millions):
Less than one year One to three years Three to five years More than five years
Operating leases . . . . . . . . . . $108 $ 154 $101 $ 81Long-term debt obligations
(Senior ConvertibleDebentures) . . . . . . . . . . . . — 1,150 — —
Commitments to contractmanufacturers andsuppliers . . . . . . . . . . . . . . . 380 — — —
Other purchasecommitments . . . . . . . . . . . 131 216 77 34
Retirement plans . . . . . . . . . . 84 — — —
Total . . . . . . . . . . . . . . . . . . $703 $1,520 $178 $115
Operating leases. Commitments under operating leases relate primarily to leasehold property.
Long-term debt obligations. Our Senior Convertible Debentures bear interest of 3 percent perannum, or approximately $34 million. See Note 16, “Senior Convertible Debentures and Lines ofCredit” in Notes to Consolidated Financial Statements.
Commitments to contract manufacturers and suppliers. We purchase components from avariety of suppliers and use several contract manufacturers to provide manufacturing services forour products. During the normal course of business, we issue purchase orders with estimates of ourrequirements several months ahead of the delivery dates. However, our agreements with thesesuppliers usually allow us the option to cancel, reschedule, and adjust our requirements based onour business needs prior to firm orders being placed. Typically purchase orders outstanding withdelivery dates within 30 days are non-cancelable. Therefore, only approximately 40 percent of ourreported purchase commitments arising from these agreements are firm, non-cancelable, andunconditional commitments. We expect to fulfill the purchase commitments for inventory within oneyear.
In addition to the above, we record a liability for firm, non-cancelable, and unconditionalpurchase commitments for quantities in excess of our future demand forecasts consistent with ourallowance for inventory. As of October 31, 2004, the liability for our firm, non-cancelable, andunconditional purchase commitments was $16 million, compared with $11 million as of October 31,2003. These amounts are included in other accrued liabilities in our Consolidated Balance Sheets atOctober 31, 2004 and 2003, and are not included in the preceding table.
Other purchase commitments. Relate primarily to contracts with professional servicessuppliers. Purchase commitments are typically cancelable within a 90-day period without significantpenalties.
Retirement plans. Retirement plan funding includes the expected tax-deductible contributionplanned for 2005. Funding projections beyond the current year are not practical to estimate due tothe rules affecting tax deductible contributions and the impact from asset performance and interestrates.
We had no material off-balance sheet arrangements as of October 31, 2004 or October 31, 2003.
28

Non-GAAP Financial Information
ROIC is a tool by which we track how much value we are creating for our shareholders. ROIC iscalculated by dividing the annualized segment return by the average of the last five quarter-endbalances of segment invested capital, as shown below. We utilize ROIC as a performance measure forour businesses, and our senior managers’ compensation is linked to ROIC improvements as well asother performance criteria. We believe that ROIC provides our management with a means to analyzeand improve their business, measuring segment profitability in relation to net asset investments.
29
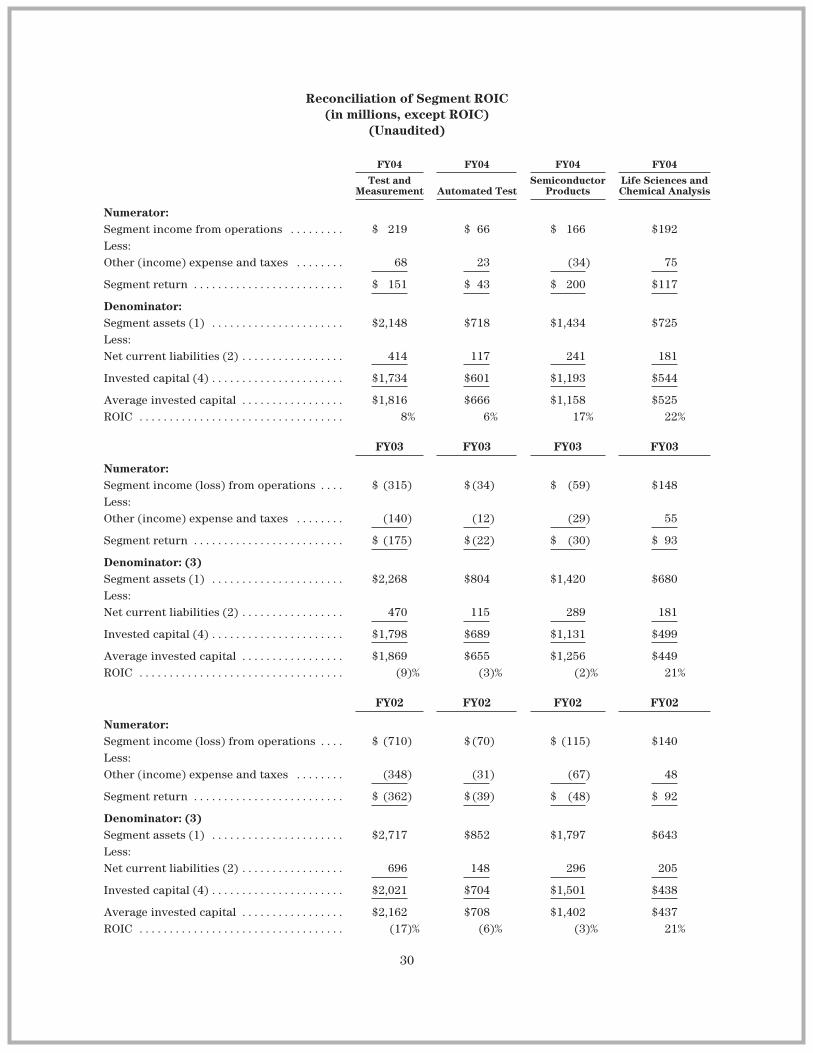
Reconciliation of Segment ROIC(in millions, except ROIC)
(Unaudited)
FY04 FY04 FY04 FY04
Test andMeasurement Automated Test
SemiconductorProducts
Life Sciences andChemical Analysis
Numerator:Segment income from operations . . . . . . . . . $ 219 $ 66 $ 166 $192Less:Other (income) expense and taxes . . . . . . . . 68 23 (34) 75
Segment return . . . . . . . . . . . . . . . . . . . . . . . . . $ 151 $ 43 $ 200 $117
Denominator:Segment assets (1) . . . . . . . . . . . . . . . . . . . . . . $2,148 $718 $1,434 $725Less:Net current liabilities (2) . . . . . . . . . . . . . . . . . 414 117 241 181
Invested capital (4) . . . . . . . . . . . . . . . . . . . . . . $1,734 $601 $1,193 $544
Average invested capital . . . . . . . . . . . . . . . . . $1,816 $666 $1,158 $525ROIC . . . . . . . . . . . . . . . . . . . . . . . . . . . . . . . . . . 8% 6% 17% 22%
FY03 FY03 FY03 FY03
Numerator:Segment income (loss) from operations . . . . $ (315) $ (34) $ (59) $148Less:Other (income) expense and taxes . . . . . . . . (140) (12) (29) 55
Segment return . . . . . . . . . . . . . . . . . . . . . . . . . $ (175) $ (22) $ (30) $ 93
Denominator: (3)Segment assets (1) . . . . . . . . . . . . . . . . . . . . . . $2,268 $804 $1,420 $680Less:Net current liabilities (2) . . . . . . . . . . . . . . . . . 470 115 289 181
Invested capital (4) . . . . . . . . . . . . . . . . . . . . . . $1,798 $689 $1,131 $499
Average invested capital . . . . . . . . . . . . . . . . . $1,869 $655 $1,256 $449ROIC . . . . . . . . . . . . . . . . . . . . . . . . . . . . . . . . . . (9)% (3)% (2)% 21%
FY02 FY02 FY02 FY02
Numerator:Segment income (loss) from operations . . . . $ (710) $ (70) $ (115) $140Less:Other (income) expense and taxes . . . . . . . . (348) (31) (67) 48
Segment return . . . . . . . . . . . . . . . . . . . . . . . . . $ (362) $ (39) $ (48) $ 92
Denominator: (3)Segment assets (1) . . . . . . . . . . . . . . . . . . . . . . $2,717 $852 $1,797 $643Less:Net current liabilities (2) . . . . . . . . . . . . . . . . . 696 148 296 205
Invested capital (4) . . . . . . . . . . . . . . . . . . . . . . $2,021 $704 $1,501 $438
Average invested capital . . . . . . . . . . . . . . . . . $2,162 $708 $1,402 $437ROIC . . . . . . . . . . . . . . . . . . . . . . . . . . . . . . . . . . (17)% (6)% (3)% 21%
30
(1) Segment assets consist of inventory, accounts receivable, property, plant and equipment, allocatedcorporate assets, gross goodwill and other intangibles less impairments. Allocated corporate assets includeestimated net deferred tax assets as if the valuation allowance had not been recorded.
(2) Includes accounts payable, employee compensation and benefits and other accrued liabilities.
(3) Segment assets, net current liabilities, invested capital and average invested capital were all changed in2004. Amounts for 2003 and 2002 have been restated to conform to the current period’s presentation.
(4) Average invested capital was computed using an average of the last five quarters.
We provide non-GAAP financial information in order to provide meaningful supplementalinformation regarding our operational performance and to enhance our investors’ overallunderstanding of our core current financial performance and our prospects for the future. Webelieve that our investors benefit from seeing our results “through the eyes” of management inaddition to the GAAP presentation. Management measures segment and enterprise performance,including employee performance, using measures such as those that are disclosed in this report. Thisinformation facilitates management’s internal comparisons to the company’s historical operatingresults and comparisons to competitors’ operating results.
Non-GAAP information allows for greater transparency to supplemental information used bymanagement in its financial and operational decision-making. Historically, we have reported similarnon-GAAP information to our investors in our press releases and in items furnished to the SEC. Webelieve that the inclusion of comparative numbers provides consistency in our financial reporting.
This information is not in accordance with, or an alternative for generally accepted accountingprinciples in the United States. The non-GAAP information we provide may be different from thenon-GAAP information provided by other companies.
Risks, Uncertainties and Other Factors That May Affect Future Results
Our operating results and financial condition could be harmed if the markets into which wesell our products decline.
We recently experienced reduced demand for our products and services in many of the marketsthat we serve worldwide, as was the case in semiconductor test and semiconductor products.Revenues in the semiconductor test and semiconductor products businesses fluctuated significantlyover the past three years. However, other markets we serve have stabilized or demonstrated growth,such as life sciences and chemical analysis. Agilent consists of several diverse businesses, anddemand in our markets remains cyclical and volatile. Pricing pressures and competition remainespecially intense in semiconductor-related industries, which could prevent achievement of ourlong-term gross margin goals and could require us to implement additional cost cutting measures tosustain profitability.
Visibility into our markets is limited. Any decline in our customers’ markets or in generaleconomic conditions would likely result in a reduction in demand for our products and services. Forexample, if the Asia Pacific market does not grow as anticipated, or if the semiconductor marketcontinues to slow, our results could suffer. As the broader semiconductor market is one of thedrivers for our test and measurement business, a continued slowdown in the semiconductor marketcould result in a slowdown in our Test and Measurement business. Also, if our customers’ marketsdecline, we may not be able to collect on outstanding amounts due to us. Such decline could harmour consolidated financial position, results of operations, cash flows and stock price, and could limitour ability to sustain profitability. Also, in such an environment, pricing pressures could intensify,and if we were unable to respond quickly enough this could further reduce our gross margins.
31
Finally, we may be required to secure additional debt or equity financing at some time in the future,and we cannot assure you that such financing will be available on acceptable terms when required. Ifour senior unsecured convertible notes rating is downgraded, we could be required to pay a higherinterest rate for future borrowing needs and we may have stricter terms.
We may not be successful in our efforts to maintain a reduced cost structure, and the actionsthat we take in order to accomplish this transition could have long-term adverse effects on ourbusiness.
We have taken, and continue to take, various actions to transition our company to a reducedcost structure. In response to declining revenues, beginning in 2001 we scaled back our operations,reduced our expenses, decreased our workforce by approximately one-third, froze hiring, cut backsignificantly on our use of temporary workers and reduced discretionary spending. We also initiatedfacility closures to reduce production levels. Although our revenues are no longer declining, wecontinue to take steps to reach or maintain our quarterly operating cost structure goal.
There are several risks inherent in our efforts to maintain a reduced cost structure. Theseinclude the risk that we will not be able to reduce expenditures quickly enough and hold them at alevel necessary to sustain or increase profitability, and that we may have to undertake furtherrestructuring initiatives that would entail additional charges and cause us to take additional actions.Our expenses were higher than anticipated during the second quarter of 2004, which adverselyaffected our performance. As we grow, we expect to face ongoing pressure to control expenses. If weare not able to hold down expenses we may have to further reduce our workforce. There is also therisk that cost-cutting initiatives will impair our ability to effectively develop and market products, toremain competitive in the industries in which we compete and to operate effectively. Each of theabove measures could have long-term effects on our business by reducing our pool of technicaltalent, decreasing or slowing improvements in our products, making it more difficult for us torespond to customers, limiting our ability to increase production quickly if and when the demand forour products increases and limiting our ability to hire and retain key personnel. Thesecircumstances could cause our income to be lower than it otherwise might be, which wouldadversely affect our stock price.
If we do not introduce successful new products and services in a timely manner, our productsand services will become obsolete, and our operating results will suffer.
We generally sell our products in industries that are characterized by rapid technologicalchanges, frequent new product and service introductions and changing industry standards. Inaddition, many of the markets in which we operate are seasonal and cyclical. Without the timelyintroduction of new products, services and enhancements, our products and services will becometechnologically obsolete over time, in which case our revenue and operating results would suffer.The success of our new products and services will depend on several factors, including our ability to:
• properly identify customer needs;
• innovate and develop new technologies, services and applications;
• successfully commercialize new technologies in a timely manner;
• manufacture and deliver our products in sufficient volumes on time;
• differentiate our offerings from our competitors’ offerings;
• price our products competitively;
• anticipate our competitors’ development of new products, services or technologicalinnovations; and
• control product quality in our manufacturing process.
32
Dependence on contract manufacturing and outsourcing other portions of our supply chainmay adversely affect our ability to bring products to market and damage our reputation.Dependence on outsourced information technology function may impair our ability to operateeffectively.
As part of our efforts to streamline operations and to cut costs, we have been outsourcing andwill continue to evaluate additional outsourcing. If our contract manufacturers or otheroutsourcers fail to perform their obligations in a timely manner or at satisfactory quality levels,our ability to bring products to market and our reputation could suffer. For example, during amarket upturn, our contract manufacturers may be unable to meet our demand requirements,which may preclude us from fulfilling our customers’ orders on a timely basis. The ability of thesemanufacturers to perform is largely outside of our control. In addition, we outsourced significantportions of our information technology function. Since information technology is critical to ouroperations, any failure to perform on the part of the contract manufacturers could impair ourability to operate effectively. In addition to the risks outlined above, problems with manufacturingor IT outsourcing could result in lower revenues, and impact our results of operations and ourstock price. Much of our outsourcing takes place in developing countries, and as a result may besubject to geopolitical uncertainty.
Future changes in financial accounting standards or taxation rules may adversely affect ourreported results of operations.
A change in accounting standards or a change in existing taxation rules can have a significanteffect on our reported results. New accounting pronouncements and taxation rules and varyinginterpretations of accounting pronouncements have occurred and may occur in the future. Thesenew accounting pronouncements and taxation rules may adversely affect our reported financialresults or the way we conduct our business.
For example, under the newly-issued SFAS No. 123R we will be required to account for equityunder our stock plans as a compensation expense and our net income and net income per share willbe significantly reduced. Currently, we record compensation expense only in connection with optiongrants that have an exercise price below fair market value. For option grants that have an exerciseprice at fair market value, we calculate compensation expense and disclose their impact on netincome (loss) and net income (loss) per share, as well as the impact of all stock-based compensationexpense in a footnote to the consolidated financial statements. SFAS No. 123R requires Agilent toadopt the new accounting provisions beginning in our fourth quarter of 2005, and will requireAgilent to expense SBP awards, including shares issued under employee stock purchase plans, stockoptions, restricted stock and stock appreciation rights, as compensation cost.
Fluctuations in our quarterly operating results may cause volatility in the price of ourcommon stock and the senior convertible debentures.
Given the nature of the markets in which we participate, we cannot reliably predict futurerevenue and profitability. Our quarterly sales and operating results have become highly dependenton the volume and timing of orders received during the quarter, which are difficult to forecast.These results are also dependent on the seasonal and cyclical nature of our end markets such asconsumer electronics, including cell phones. In addition, a significant portion of our operatingexpenses is relatively fixed in nature due to our significant sales, research and development andmanufacturing costs. If we cannot adjust spending quickly enough to compensate for a revenueshortfall, this may magnify the adverse impact of such revenue shortfall on our results ofoperations. Fluctuations in our operating results may cause volatility in the price of our commonstock and the debentures.
33
Our income may suffer if our manufacturing capacity does not match our demand.
Because we cannot immediately adapt our production capacity and related cost structures torapidly changing market conditions, when demand does not meet our expectations, ourmanufacturing capacity will likely exceed our production requirements. If, during a general marketupturn or an upturn in one of our segments, we cannot increase our manufacturing capacity to meetproduct demand, we will not be able to fulfill orders in a timely manner. This inability couldmaterially and adversely affect our results. By contrast, during the economic downturn we hadexcess manufacturing capacity as a result of the decrease in purchasing and capital spending in thecommunications, electronics and semiconductor industries. The fixed costs associated with excessmanufacturing capacity adversely affected, and could in the future affect our income.
Failure to adjust our purchases due to changing market conditions or failure to estimate ourcustomers’ demand could adversely affect our income.
Our income could be harmed if we are unable to adjust our purchases to market fluctuations,including those caused by the seasonal or cyclical nature of the markets in which we operate. Thesale of our products and services are dependent, to a large degree, on customers whose industriesare subject to seasonal or cyclical trends in the demand for their products. For example, theconsumer electronics market is particularly volatile, making demand difficult to anticipate. During amarket upturn, we may not be able to purchase sufficient supplies or components to meet increasingproduct demand, which could materially affect our results. In addition, some of the parts thatrequire custom design are not readily available from alternate suppliers due to their unique designor the length of time necessary for design work. Should a supplier cease manufacturing such acomponent, we would be forced to reengineer our product. In addition to discontinuing parts,suppliers may also extend lead times, limit supplies or increase prices due to capacity constraints orother factors. By contrast, in order to secure components for the production of products, we maycontinue to enter into non-cancelable purchase commitments with vendors, or at times makeadvance payments to suppliers, which could impact our ability to adjust our inventory to decliningmarket demands. Prior commitments of this type have resulted in an excess of parts when demandfor our communications, semiconductor and electronics products has decreased. If demand for ourproducts is less than we expect, we may experience additional excess and obsolete inventories andbe forced to incur additional charges.
Economic, political and other risks associated with international sales and operations couldadversely affect our results of operations.
Because we sell our products worldwide, our business is subject to risks associated with doingbusiness internationally. We anticipate that revenue from international operations will continue torepresent a majority of our total revenue. In addition, many of our employees, contractmanufacturers, suppliers, job functions and manufacturing facilities are increasingly located outsidethe U.S. Accordingly, our future results could be harmed by a variety of factors, including:
• interruption to transportation flows for delivery of parts to us and finished goods to ourcustomers;
• changes in foreign currency exchange rates;
• changes in a specific country’s or region’s political, economic or other conditions;
• trade protection measures and import or export licensing requirements;
• negative consequences from changes in tax laws;
• difficulty in staffing and managing widespread operations;
• differing labor regulations;
34
• differing protection of intellectual property;
• unexpected changes in regulatory requirements; and
• geopolitical turmoil, including terrorism and war.
We centralized most of our accounting processes to two locations: Malaysia and India. Theseprocesses include general accounting, accounts payable and accounts receivables functions. Ifconditions change in those countries, it may adversely affect operations, including impairing ourability to pay our suppliers and collect our receivables. Our results of operations, as well as ourliquidity, may be adversely affected and possible delays may occur in reporting financial results.
Our business will suffer if we are not able to retain and hire key personnel.
Our future success depends partly on the continued service of our key research, engineering,sales, marketing, manufacturing, executive and administrative personnel. If we fail to retain and hirea sufficient number of these personnel, we will not be able to maintain or expand our business.Since 2001, we have experienced temporary pay reductions, workforce reductions and limited payincreases, which may harm our long-term ability to hire and retain key personnel. As the marketcontinues its recovery, there is intense competition for certain highly technical specialties ingeographic areas where we continue to recruit, and it may become more difficult to retain our keyemployees.
Our acquisitions, strategic alliances, joint ventures and divestitures may result in financialresults that are different than expected.
In the normal course of business, we frequently engage in discussions with third parties relatingto possible acquisitions, strategic alliances, joint ventures and divestitures. As a result of suchtransactions, our financial results may differ from the investment community’s expectations in agiven quarter. In addition, acquisitions and strategic alliances may require us to integrate a differentcompany culture, management team and business infrastructure. We may have difficulty developing,manufacturing and marketing the products of a newly acquired company in a way that enhances theperformance of our combined businesses or product lines to realize the value from expectedsynergies. Depending on the size and complexity of an acquisition, our successful integration of theentity depends on a variety of factors, including:
• the retention of key employees;
• the management of facilities and employees in different geographic areas;
• the retention of key customers; and
• the integration or coordination of different research and development, product manufacturingand sales programs and facilities.
A successful divestiture depends on various factors, including our ability to:
• effectively transfer liabilities, contracts, facilities and employees to the purchaser;
• identify and separate the intellectual property to be divested from the intellectual propertythat we wish to keep; and
• reduce fixed costs previously associated with the divested assets or business.
Any additional impairment of the value of purchased assets and goodwill could have asignificant negative impact on our future operating results.
In addition, if customers of the divested business do not receive the same level of service fromthe new owners, this may adversely affect our other businesses to the extent that these customers
35
also purchase other Agilent products. All of these efforts require varying levels of managementresources, which may divert our attention from other business operations. Further, if marketconditions or other factors lead us to change our strategic direction, we may not realize the expectedvalue from such transactions. If we do not realize the expected benefits or synergies of suchtransactions, our consolidated financial position, results of operations, cash flows and stock pricecould be negatively impacted.
Unforeseen problems with the stability and maintenance of our new information systems haveinterfered and could further interfere with our operations.
As a part of the effort to replace our current information systems, we implemented newenterprise resource planning software and other software applications to manage our businessoperations. Our profit projections could be inaccurate if we misjudged the potential savings from theimplementation of the new systems, or if we are unable to adequately maintain or adjust thesystems. In addition, if our new systems fail to provide accurate and increased visibility into pricingand cost structures, we may be unable to improve or maximize our profit margins. Following thefirst phase of our enterprise resource planning software implementation, we experienced difficultiesin providing customer quotes and in acknowledging and shipping customer orders. Although webelieve that these systems are stable, as we add additional functionality, new problems could arisethat we have not foreseen. Such problems could adversely impact our ability to do the following in atimely manner: provide quotes, take customer orders, ship products, provide services and support toour customers, bill and track our customers, fulfill contractual obligations and otherwise run ourbusiness. As a result, our financial position, results of operations, cash flows and stock price couldbe adversely affected.
Environmental contamination from past operations could subject us to unreimbursed costsand could harm on-site operations and the future use and value of the properties involved andenvironmental contamination caused by ongoing operations could subject us to substantialliabilities in the future.
Some of our properties are undergoing remediation by Hewlett-Packard for subsurfacecontaminations that were known at the time of our separation from Hewlett-Packard. Hewlett-Packard has agreed to retain the liability for this subsurface contamination, perform the requiredremediation and indemnify us with respect to claims arising out of that contamination. Thedetermination of the existence and cost of any additional contamination caused by us could involvecostly and time-consuming negotiations and litigation. In addition, Hewlett-Packard will have accessto our properties to perform remediation. While Hewlett-Packard has agreed to minimizeinterference with on-site operations at those properties, remediation activities and subsurfacecontamination may require us to incur unreimbursed costs and could harm on-site operations andthe future use and value of the properties. We cannot be sure that Hewlett-Packard will continue tofulfill its indemnification or remediation obligations.
We have agreed to indemnify Hewlett-Packard for any liability associated with contaminationfrom past operations at all other properties transferred from Hewlett-Packard to us other than thoseproperties currently undergoing remediation by Hewlett-Packard. While we are not aware of anymaterial liabilities associated with any potential subsurface contamination at any of thoseproperties, subsurface contamination may exist, and we may be exposed to material liability as aresult of the existence of that contamination.
Our semiconductor and other manufacturing processes involve the use of substances regulatedunder various international, federal, state and local laws governing the environment. We may besubject to liabilities for environmental contamination, and these liabilities may be substantial.Although our policy is to apply strict standards for environmental protection at our sites inside and
36

outside the U.S., even if the sites outside the U.S. are not subject to regulations imposed by foreigngovernments, we may not be aware of all conditions that could subject us to liability.
Our customers and we are subject to various governmental regulations, compliance withwhich may cause us to incur significant expenses, and if we fail to maintain satisfactorycompliance with certain regulations, we may be forced to recall products and cease theirmanufacture and distribution, and we could be subject to civil or criminal penalties.
Our businesses are subject to various significant international, federal, state and localregulations, including but not limited to health and safety, packaging, product content, labor andimport/export regulations. These regulations are complex, change frequently and have tended tobecome more stringent over time. We may be required to incur significant expenses to comply withthese regulations or to remedy violations of these regulations. Any failure by us to comply withapplicable government regulations could also result in cessation of our operations or portions of ouroperations, product recalls or impositions of fines and restrictions on our ability to carry on orexpand our operations. In addition, because many of our products are regulated or sold intoregulated industries, we must comply with additional regulations in marketing our products.
Our products and operations are also often subject to the rules of industrial standards bodies,like the International Standards Organization, as well as regulation by other agencies such as theU.S. Federal Communications Commission. We also must comply with work safety rules. If we fail toadequately address any of these regulations, our businesses could be harmed.
Some of our chemical analysis products are used in conjunction with chemicals whosemanufacture, processing, distribution and notification requirements are regulated by the U.S.Environmental Protection Agency under the Toxic Substances Control Act, and by regulatory bodiesin other countries with laws similar to the Toxic Substances Control Act. We must conform themanufacture, processing, distribution of and notification about these chemicals to these laws andadapt to regulatory requirements in all countries as these requirements change. If we fail to complywith these requirements in the manufacture or distribution of our products, then we could be madeto pay civil penalties, face criminal prosecution and, in some cases, be prohibited from distributingour products in commerce until the products or component substances are brought into compliance.
We are subject to laws and regulations governing government contracts, and failure toaddress these laws and regulations or comply with government contracts could harm ourbusiness by leading to a reduction in revenue associated with these customers.
We have agreements relating to the sale of our products to government entities and, as a result,we are subject to various statutes and regulations that apply to companies doing business with thegovernment. The laws governing government contracts differ from the laws governing privatecontracts. For example, many government contracts contain pricing terms and conditions that arenot applicable to private contracts. We are also subject to investigation for compliance with theregulations governing government contracts. A failure to comply with these regulations might resultin suspension of these contracts, or administrative penalties.
Third parties may claim that we are infringing their intellectual property, and we could suffersignificant litigation or licensing expenses or be prevented from selling products.
While we do not believe that any of our products infringe the valid intellectual property rights ofthird parties, we may be unaware of intellectual property rights of others that may cover some of ourtechnology, products or services. Any litigation regarding patents or other intellectual propertycould be costly and time-consuming and could divert our management and key personnel from ourbusiness operations. The complexity of the technology involved and the uncertainty of intellectualproperty litigation increase these risks. Claims of intellectual property infringement might also
37

require us to enter into costly license agreements. However, we may not be able to obtain licenseagreements on terms acceptable to us, or at all. We also may be subject to significant damages orinjunctions against development and sale of certain of our products.
We often rely on licenses of intellectual property useful for our businesses. We cannot ensurethat these licenses will be available in the future on favorable terms or at all.
Third parties may infringe our intellectual property, and we may expend significant resourcesenforcing our rights or suffer competitive injury.
Our success depends in large part on our proprietary technology. We rely on a combination ofpatents, copyrights, trademarks, trade secrets, confidentiality provisions and licensing arrangementsto establish and protect our proprietary rights. If we fail to successfully enforce our intellectualproperty rights, our competitive position could suffer, which could harm our operating results.
Our pending patent and trademark registration applications may not be allowed, or competitorsmay challenge the validity or scope of our patents, copyrights or trademarks. In addition, ourpatents may not provide us a significant competitive advantage.
We may be required to spend significant resources to monitor and police our intellectualproperty rights. We may not be able to detect infringement and our competitive position may beharmed before we do so. In addition, competitors may design around our technology or developcompeting technologies. Intellectual property rights and our ability to enforce them may also beunavailable or limited in some foreign countries, which could make it easier for competitors tocapture market share and result in lost revenues. Furthermore, some intellectual property rights arelicensed to other companies, allowing them to compete with us using that intellectual property.
If we suffer loss to our factories, facilities or distribution system due to catastrophe, ouroperations could be seriously harmed.
Our factories, facilities and distribution system are subject to catastrophic loss due to fire, flood,terrorism or other natural or man-made disasters. In particular, several of our facilities could besubject to a catastrophic loss caused by earthquake due to their locations. Our production facilities,headquarters and Agilent Technologies Laboratories in California, and our production facilities inWashington and Japan, are all located in areas with above average seismic activity. If any of thesefacilities were to experience a catastrophic loss, it could disrupt our operations, delay production,shipments and revenue and result in large expenses to repair or replace the facility. In addition,since we have recently consolidated our manufacturing facilities, we are more likely to experiencean interruption to our operations in the event of a catastrophe in any one location. Although wecarry insurance for property damage and business interruption, we do not carry insurance orfinancial reserves for interruptions or potential losses arising from earthquakes or terrorism.
38

REPORT OF INDEPENDENT REGISTERED PUBLIC ACCOUNTING FIRM
To the Stockholders and Board of Directors of Agilent Technologies, Inc.:
In our opinion, the accompanying consolidated balance sheet and the related consolidatedstatements of operations, cash flows and stockholders’ equity present fairly, in all material respects,the financial position of Agilent Technologies, Inc. and its subsidiaries at October 31, 2004 and 2003,and the results of their operations and their cash flows for each of the three years in the periodended October 31, 2004 in conformity with accounting principles generally accepted in the UnitedStates of America. These financial statements are the responsibility of the Company’s management.Our responsibility is to express an opinion on these financial statements based on our audits. Weconducted our audits of these statements in accordance with the standards of the Public CompanyAccounting Oversight Board (United States). Those standards require that we plan and perform theaudit to obtain reasonable assurance about whether the financial statements are free of materialmisstatement. An audit includes examining, on a test basis, evidence supporting the amounts anddisclosures in the financial statements, assessing the accounting principles used and significantestimates made by management, and evaluating the overall financial statement presentation. Webelieve that our audits provide a reasonable basis for our opinion.
As discussed in the notes to the consolidated financial statements, the Company adoptedStatement of Financial Accounting Standards (“SFAS”) No. 142, “Goodwill and Other IntangibleAssets” as of November 1, 2002.
PRICEWATERHOUSECOOPERS LLP
San Jose, CaliforniaDecember 17, 2004
39
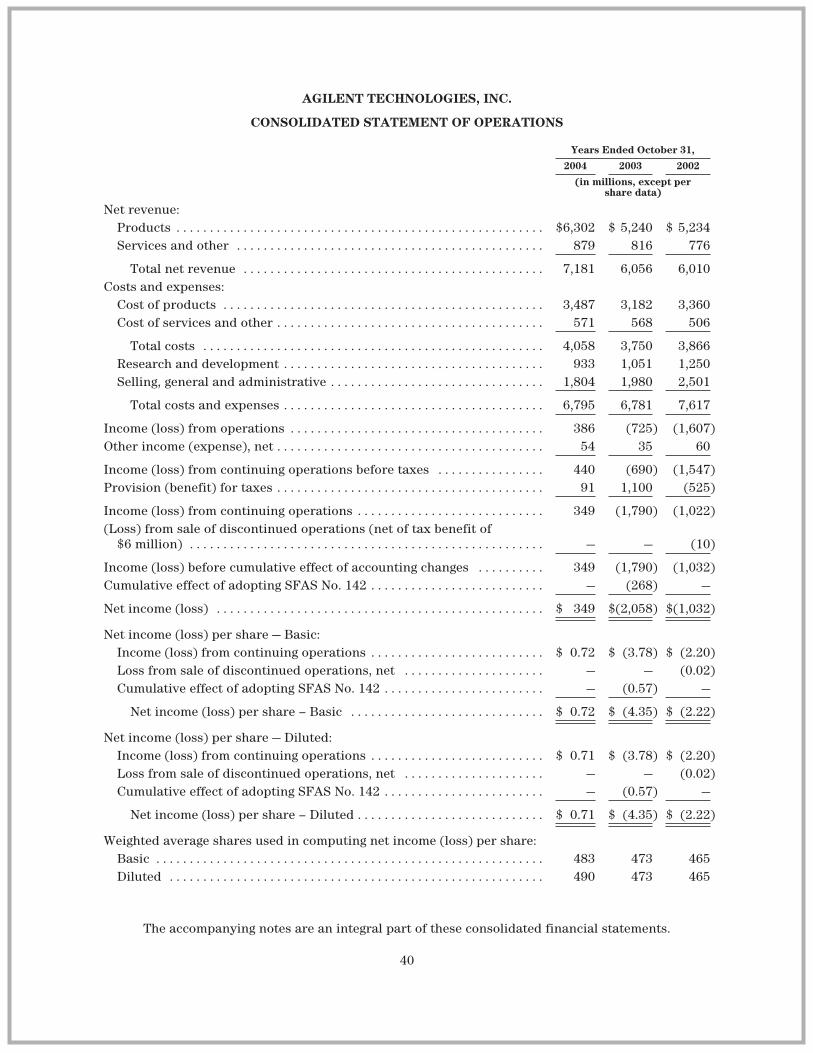
AGILENT TECHNOLOGIES, INC.
CONSOLIDATED STATEMENT OF OPERATIONS
Years Ended October 31,
2004 2003 2002
(in millions, except pershare data)
Net revenue:Products . . . . . . . . . . . . . . . . . . . . . . . . . . . . . . . . . . . . . . . . . . . . . . . . . . . . . . . $6,302 $ 5,240 $ 5,234Services and other . . . . . . . . . . . . . . . . . . . . . . . . . . . . . . . . . . . . . . . . . . . . . . 879 816 776
Total net revenue . . . . . . . . . . . . . . . . . . . . . . . . . . . . . . . . . . . . . . . . . . . . . 7,181 6,056 6,010Costs and expenses:
Cost of products . . . . . . . . . . . . . . . . . . . . . . . . . . . . . . . . . . . . . . . . . . . . . . . . 3,487 3,182 3,360Cost of services and other . . . . . . . . . . . . . . . . . . . . . . . . . . . . . . . . . . . . . . . . 571 568 506
Total costs . . . . . . . . . . . . . . . . . . . . . . . . . . . . . . . . . . . . . . . . . . . . . . . . . . . 4,058 3,750 3,866Research and development . . . . . . . . . . . . . . . . . . . . . . . . . . . . . . . . . . . . . . . 933 1,051 1,250Selling, general and administrative . . . . . . . . . . . . . . . . . . . . . . . . . . . . . . . . 1,804 1,980 2,501
Total costs and expenses . . . . . . . . . . . . . . . . . . . . . . . . . . . . . . . . . . . . . . . 6,795 6,781 7,617
Income (loss) from operations . . . . . . . . . . . . . . . . . . . . . . . . . . . . . . . . . . . . . . 386 (725) (1,607)Other income (expense), net . . . . . . . . . . . . . . . . . . . . . . . . . . . . . . . . . . . . . . . . 54 35 60
Income (loss) from continuing operations before taxes . . . . . . . . . . . . . . . . 440 (690) (1,547)Provision (benefit) for taxes . . . . . . . . . . . . . . . . . . . . . . . . . . . . . . . . . . . . . . . . 91 1,100 (525)
Income (loss) from continuing operations . . . . . . . . . . . . . . . . . . . . . . . . . . . . 349 (1,790) (1,022)(Loss) from sale of discontinued operations (net of tax benefit of
$6 million) . . . . . . . . . . . . . . . . . . . . . . . . . . . . . . . . . . . . . . . . . . . . . . . . . . . . . — — (10)
Income (loss) before cumulative effect of accounting changes . . . . . . . . . . 349 (1,790) (1,032)Cumulative effect of adopting SFAS No. 142 . . . . . . . . . . . . . . . . . . . . . . . . . . — (268) —
Net income (loss) . . . . . . . . . . . . . . . . . . . . . . . . . . . . . . . . . . . . . . . . . . . . . . . . . $ 349 $(2,058) $(1,032)
Net income (loss) per share — Basic:Income (loss) from continuing operations . . . . . . . . . . . . . . . . . . . . . . . . . . $ 0.72 $ (3.78) $ (2.20)Loss from sale of discontinued operations, net . . . . . . . . . . . . . . . . . . . . . — — (0.02)Cumulative effect of adopting SFAS No. 142 . . . . . . . . . . . . . . . . . . . . . . . . — (0.57) —
Net income (loss) per share – Basic . . . . . . . . . . . . . . . . . . . . . . . . . . . . . $ 0.72 $ (4.35) $ (2.22)
Net income (loss) per share — Diluted:Income (loss) from continuing operations . . . . . . . . . . . . . . . . . . . . . . . . . . $ 0.71 $ (3.78) $ (2.20)Loss from sale of discontinued operations, net . . . . . . . . . . . . . . . . . . . . . — — (0.02)Cumulative effect of adopting SFAS No. 142 . . . . . . . . . . . . . . . . . . . . . . . . — (0.57) —
Net income (loss) per share – Diluted . . . . . . . . . . . . . . . . . . . . . . . . . . . . $ 0.71 $ (4.35) $ (2.22)
Weighted average shares used in computing net income (loss) per share:Basic . . . . . . . . . . . . . . . . . . . . . . . . . . . . . . . . . . . . . . . . . . . . . . . . . . . . . . . . . . 483 473 465Diluted . . . . . . . . . . . . . . . . . . . . . . . . . . . . . . . . . . . . . . . . . . . . . . . . . . . . . . . . 490 473 465
The accompanying notes are an integral part of these consolidated financial statements.
40
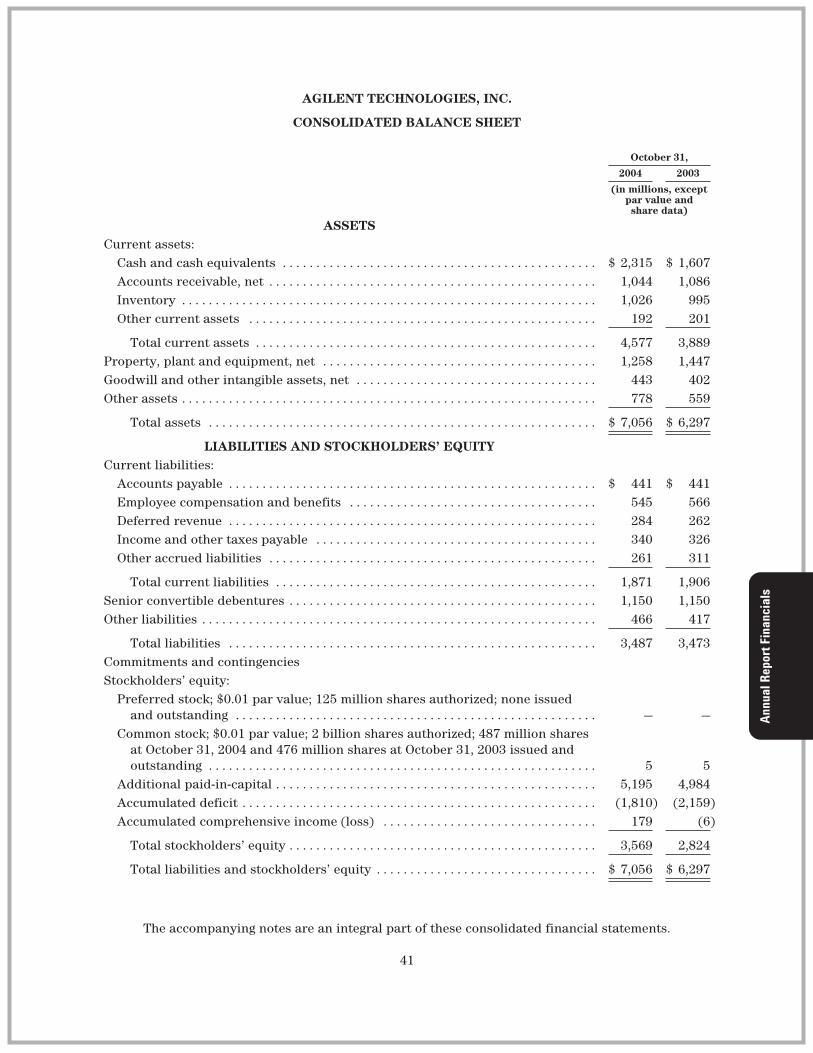
AGILENT TECHNOLOGIES, INC.
CONSOLIDATED BALANCE SHEET
October 31,
2004 2003
(in millions, exceptpar value andshare data)
ASSETSCurrent assets:
Cash and cash equivalents . . . . . . . . . . . . . . . . . . . . . . . . . . . . . . . . . . . . . . . . . . . . . . . $ 2,315 $ 1,607Accounts receivable, net . . . . . . . . . . . . . . . . . . . . . . . . . . . . . . . . . . . . . . . . . . . . . . . . . 1,044 1,086Inventory . . . . . . . . . . . . . . . . . . . . . . . . . . . . . . . . . . . . . . . . . . . . . . . . . . . . . . . . . . . . . . 1,026 995Other current assets . . . . . . . . . . . . . . . . . . . . . . . . . . . . . . . . . . . . . . . . . . . . . . . . . . . . 192 201
Total current assets . . . . . . . . . . . . . . . . . . . . . . . . . . . . . . . . . . . . . . . . . . . . . . . . . . . 4,577 3,889Property, plant and equipment, net . . . . . . . . . . . . . . . . . . . . . . . . . . . . . . . . . . . . . . . . . 1,258 1,447Goodwill and other intangible assets, net . . . . . . . . . . . . . . . . . . . . . . . . . . . . . . . . . . . . 443 402Other assets . . . . . . . . . . . . . . . . . . . . . . . . . . . . . . . . . . . . . . . . . . . . . . . . . . . . . . . . . . . . . . 778 559
Total assets . . . . . . . . . . . . . . . . . . . . . . . . . . . . . . . . . . . . . . . . . . . . . . . . . . . . . . . . . . $ 7,056 $ 6,297
LIABILITIES AND STOCKHOLDERS’ EQUITYCurrent liabilities:
Accounts payable . . . . . . . . . . . . . . . . . . . . . . . . . . . . . . . . . . . . . . . . . . . . . . . . . . . . . . . $ 441 $ 441Employee compensation and benefits . . . . . . . . . . . . . . . . . . . . . . . . . . . . . . . . . . . . . 545 566Deferred revenue . . . . . . . . . . . . . . . . . . . . . . . . . . . . . . . . . . . . . . . . . . . . . . . . . . . . . . . 284 262Income and other taxes payable . . . . . . . . . . . . . . . . . . . . . . . . . . . . . . . . . . . . . . . . . . 340 326Other accrued liabilities . . . . . . . . . . . . . . . . . . . . . . . . . . . . . . . . . . . . . . . . . . . . . . . . . 261 311
Total current liabilities . . . . . . . . . . . . . . . . . . . . . . . . . . . . . . . . . . . . . . . . . . . . . . . . 1,871 1,906Senior convertible debentures . . . . . . . . . . . . . . . . . . . . . . . . . . . . . . . . . . . . . . . . . . . . . . 1,150 1,150Other liabilities . . . . . . . . . . . . . . . . . . . . . . . . . . . . . . . . . . . . . . . . . . . . . . . . . . . . . . . . . . . 466 417
Total liabilities . . . . . . . . . . . . . . . . . . . . . . . . . . . . . . . . . . . . . . . . . . . . . . . . . . . . . . . 3,487 3,473Commitments and contingenciesStockholders’ equity:
Preferred stock; $0.01 par value; 125 million shares authorized; none issuedand outstanding . . . . . . . . . . . . . . . . . . . . . . . . . . . . . . . . . . . . . . . . . . . . . . . . . . . . . . — —
Common stock; $0.01 par value; 2 billion shares authorized; 487 million sharesat October 31, 2004 and 476 million shares at October 31, 2003 issued andoutstanding . . . . . . . . . . . . . . . . . . . . . . . . . . . . . . . . . . . . . . . . . . . . . . . . . . . . . . . . . . 5 5
Additional paid-in-capital . . . . . . . . . . . . . . . . . . . . . . . . . . . . . . . . . . . . . . . . . . . . . . . . 5,195 4,984Accumulated deficit . . . . . . . . . . . . . . . . . . . . . . . . . . . . . . . . . . . . . . . . . . . . . . . . . . . . . (1,810) (2,159)Accumulated comprehensive income (loss) . . . . . . . . . . . . . . . . . . . . . . . . . . . . . . . . 179 (6)
Total stockholders’ equity . . . . . . . . . . . . . . . . . . . . . . . . . . . . . . . . . . . . . . . . . . . . . . 3,569 2,824
Total liabilities and stockholders’ equity . . . . . . . . . . . . . . . . . . . . . . . . . . . . . . . . . $ 7,056 $ 6,297
The accompanying notes are an integral part of these consolidated financial statements.
41
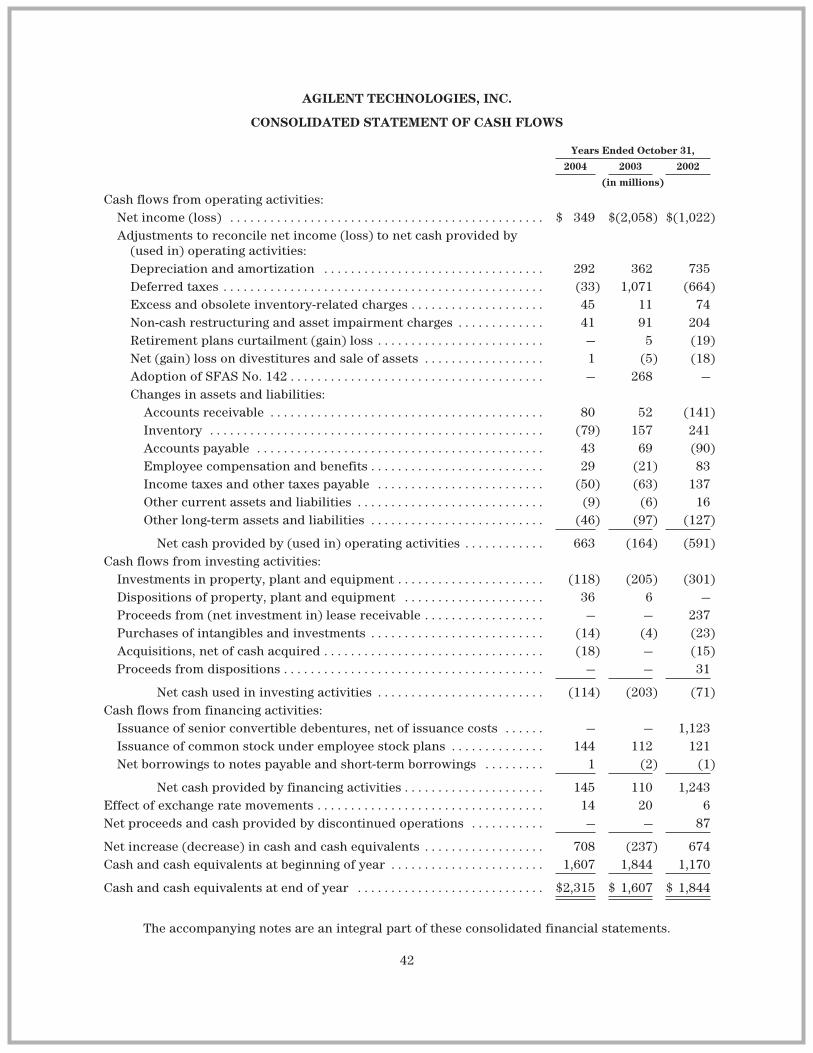
AGILENT TECHNOLOGIES, INC.
CONSOLIDATED STATEMENT OF CASH FLOWS
Years Ended October 31,
2004 2003 2002
(in millions)
Cash flows from operating activities:Net income (loss) . . . . . . . . . . . . . . . . . . . . . . . . . . . . . . . . . . . . . . . . . . . . . . . $ 349 $(2,058) $(1,022)Adjustments to reconcile net income (loss) to net cash provided by
(used in) operating activities:Depreciation and amortization . . . . . . . . . . . . . . . . . . . . . . . . . . . . . . . . . 292 362 735Deferred taxes . . . . . . . . . . . . . . . . . . . . . . . . . . . . . . . . . . . . . . . . . . . . . . . . (33) 1,071 (664)Excess and obsolete inventory-related charges . . . . . . . . . . . . . . . . . . . . 45 11 74Non-cash restructuring and asset impairment charges . . . . . . . . . . . . . 41 91 204Retirement plans curtailment (gain) loss . . . . . . . . . . . . . . . . . . . . . . . . . — 5 (19)Net (gain) loss on divestitures and sale of assets . . . . . . . . . . . . . . . . . . 1 (5) (18)Adoption of SFAS No. 142 . . . . . . . . . . . . . . . . . . . . . . . . . . . . . . . . . . . . . . — 268 —Changes in assets and liabilities:
Accounts receivable . . . . . . . . . . . . . . . . . . . . . . . . . . . . . . . . . . . . . . . . . 80 52 (141)Inventory . . . . . . . . . . . . . . . . . . . . . . . . . . . . . . . . . . . . . . . . . . . . . . . . . . (79) 157 241Accounts payable . . . . . . . . . . . . . . . . . . . . . . . . . . . . . . . . . . . . . . . . . . . 43 69 (90)Employee compensation and benefits . . . . . . . . . . . . . . . . . . . . . . . . . . 29 (21) 83Income taxes and other taxes payable . . . . . . . . . . . . . . . . . . . . . . . . . (50) (63) 137Other current assets and liabilities . . . . . . . . . . . . . . . . . . . . . . . . . . . . (9) (6) 16Other long-term assets and liabilities . . . . . . . . . . . . . . . . . . . . . . . . . . (46) (97) (127)
Net cash provided by (used in) operating activities . . . . . . . . . . . . 663 (164) (591)Cash flows from investing activities:
Investments in property, plant and equipment . . . . . . . . . . . . . . . . . . . . . . (118) (205) (301)Dispositions of property, plant and equipment . . . . . . . . . . . . . . . . . . . . . 36 6 —Proceeds from (net investment in) lease receivable . . . . . . . . . . . . . . . . . . — — 237Purchases of intangibles and investments . . . . . . . . . . . . . . . . . . . . . . . . . . (14) (4) (23)Acquisitions, net of cash acquired . . . . . . . . . . . . . . . . . . . . . . . . . . . . . . . . . (18) — (15)Proceeds from dispositions . . . . . . . . . . . . . . . . . . . . . . . . . . . . . . . . . . . . . . . — — 31
Net cash used in investing activities . . . . . . . . . . . . . . . . . . . . . . . . . (114) (203) (71)Cash flows from financing activities:
Issuance of senior convertible debentures, net of issuance costs . . . . . . — — 1,123Issuance of common stock under employee stock plans . . . . . . . . . . . . . . 144 112 121Net borrowings to notes payable and short-term borrowings . . . . . . . . . 1 (2) (1)
Net cash provided by financing activities . . . . . . . . . . . . . . . . . . . . . 145 110 1,243Effect of exchange rate movements . . . . . . . . . . . . . . . . . . . . . . . . . . . . . . . . . . 14 20 6Net proceeds and cash provided by discontinued operations . . . . . . . . . . . — — 87
Net increase (decrease) in cash and cash equivalents . . . . . . . . . . . . . . . . . . 708 (237) 674Cash and cash equivalents at beginning of year . . . . . . . . . . . . . . . . . . . . . . . 1,607 1,844 1,170
Cash and cash equivalents at end of year . . . . . . . . . . . . . . . . . . . . . . . . . . . . $2,315 $ 1,607 $ 1,844
The accompanying notes are an integral part of these consolidated financial statements.
42

AGILENT TECHNOLOGIES, INC.
CONSOLIDATED STATEMENT OF STOCKHOLDERS’ EQUITY
Numberof
Shares
Common Stock RetainedIncome/
(AccumulatedDeficit)
AccumulatedComprehensiveIncome/(Loss) Total
ParValue
AdditionalPaid-inCapital
(in millions, except number of shares in thousands)
Balance as of October 31, 2001 . . . . . . . . . . . . . . . . . . . . . . . . . . . 461,031 5 4,723 931 — 5,659Components of comprehensive loss:
Net loss . . . . . . . . . . . . . . . . . . . . . . . . . . . . . . . . . . . . . . . . . . . . . — — — (1,032) — (1,032)Reclassification adjustment relating to derivatives (net of
tax benefit of $4 million) . . . . . . . . . . . . . . . . . . . . . . . . . . . . — — — — (7) (7)SFAS No. 133 cumulative transition adjustment (net of tax
benefit of $3 million) . . . . . . . . . . . . . . . . . . . . . . . . . . . . . . . — — — — (6) (6)Foreign currency translation (net of tax of $4 million) . . . . — — — — 7 7Change in unrealized gain (loss) on investment (net of tax
benefit of $1 million) . . . . . . . . . . . . . . . . . . . . . . . . . . . . . . . — — — — (1) (1)Unrealized gain on derivatives (net of tax expense of $2
million) . . . . . . . . . . . . . . . . . . . . . . . . . . . . . . . . . . . . . . . . . . . — — — — 4 4Change in minimum pension liability adjustment (net of
tax benefit of $78 million) . . . . . . . . . . . . . . . . . . . . . . . . . . . — — — — (146) (146)
Total comprehensive loss . . . . . . . . . . . . . . . . . . . . . . . . . . . . (1,181)
Shares issued for employee benefit plans and other . . . . . . . . 5,993 — 145 — — 145Other additional paid-in-capital . . . . . . . . . . . . . . . . . . . . . . . . . . — — 4 — — 4
Balance as of October 31, 2002 . . . . . . . . . . . . . . . . . . . . . . . . . . . 467,024 5 4,872 (101) (149) 4,627Components of comprehensive loss:
Net loss . . . . . . . . . . . . . . . . . . . . . . . . . . . . . . . . . . . . . . . . . . . . . — — — (2,058) — (2,058)Reclassification adjustment relating to derivatives (net of
tax expense of $2 million) . . . . . . . . . . . . . . . . . . . . . . . . . . . — — — — 4 4Reclassification adjustment relating to investments (net of
tax expense of $1 million) . . . . . . . . . . . . . . . . . . . . . . . . . . . — — — — 2 2Foreign currency translation (net of tax benefit of $46
million) . . . . . . . . . . . . . . . . . . . . . . . . . . . . . . . . . . . . . . . . . . . — — — — 96 96Unrealized gain (loss) on derivatives (net of tax expense of
$7 million) . . . . . . . . . . . . . . . . . . . . . . . . . . . . . . . . . . . . . . . . — — — — (13) (13)Change in minimum pension liability adjustment (net of
tax expense of $38 million) . . . . . . . . . . . . . . . . . . . . . . . . . . — — — — 54 54
Total comprehensive loss . . . . . . . . . . . . . . . . . . . . . . . . . . . . (1,915)
Shares issued for employee benefit plans and other . . . . . . . . 9,125 — 112 — — 112
Balance as of October 31, 2003 . . . . . . . . . . . . . . . . . . . . . . . . . . . 476,149 5 4,984 (2,159) (6) 2,824Components of comprehensive income:
Net income . . . . . . . . . . . . . . . . . . . . . . . . . . . . . . . . . . . . . . . . . . — — — 349 — 349Reclassification adjustment relating to derivatives (net of
tax expense of $3 million) . . . . . . . . . . . . . . . . . . . . . . . . . . . — — — — 5 5Reclassification adjustment relating to investments (net of
tax expense of $2 million) . . . . . . . . . . . . . . . . . . . . . . . . . . . — — — — 3 3Foreign currency translation (net of tax expense of $14
million) . . . . . . . . . . . . . . . . . . . . . . . . . . . . . . . . . . . . . . . . . . . — — — — 89 89Unrealized gain (loss) on derivatives (net of tax benefit of
$2 million) . . . . . . . . . . . . . . . . . . . . . . . . . . . . . . . . . . . . . . . . — — — — (4) (4)Change in minimum pension liability adjustment (net of
tax expense of $40 million) . . . . . . . . . . . . . . . . . . . . . . . . . . — — — — 92 92
Total comprehensive income . . . . . . . . . . . . . . . . . . . . . . . . . 534
Shares issued for employee benefit plans and other . . . . . . . . 9,920 — 193 — — 193Issuance of common stock for an acquisition . . . . . . . . . . . . . . 772 — 18 — — 18
Balance as of October 31, 2004 . . . . . . . . . . . . . . . . . . . . . . . . . . . 486,841 $5 $5,195 $(1,810) $ 179 $ 3,569
The accompanying notes are an integral part of these consolidated financial statements.
43
AGILENT TECHNOLOGIES, INC.
NOTES TO CONSOLIDATED FINANCIAL STATEMENTS
1. Overview
Agilent Technologies, Inc. (“we,” “Agilent” or “the company”), incorporated in Delaware inMay 1999, is a global diversified technology organization that provides enabling solutions totechnology markets within the communications, electronics, life sciences and chemical analysisindustries. Prior to our initial public offering of 16 percent of our stock in November 1999, we werea wholly-owned subsidiary of Hewlett-Packard Company (“Hewlett-Packard”). Hewlett-Packarddistributed the remaining 84 percent of our stock to its stockholders on June 2, 2000 in the form of astock dividend.
Our fiscal year end is October 31. Unless otherwise stated, all years and dates refer to our fiscalyear.
2. Summary of Significant Accounting Policies
Basis of presentation. The accompanying financial data has been prepared by us pursuant tothe rules and regulations of the U.S. Securities and Exchange Commission (“SEC”). Amounts in theconsolidated financial statements as of and for the years ended October 31, 2003 and October 31,2002 were reclassified to conform to the presentation in 2004.
Principles of consolidation. The consolidated financial statements include the accounts of thecompany and our wholly- and majority-owned subsidiaries. All significant intercompany accountsand transactions have been eliminated. Partially owned, non-controlled equity affiliates areaccounted for under the equity method.
Use of estimates. The preparation of financial statements in accordance with accountingprinciples generally accepted in the U.S. requires management to make estimates and assumptionsthat affect the amounts reported in our consolidated financial statements and accompanying notes.Management bases its estimates on historical experience and various other assumptions believed tobe reasonable. Although these estimates are based on management’s best knowledge of currentevents and actions that may impact the company in the future, actual results may be different fromthe estimates. Our critical accounting policies are those that affect our financial statementsmaterially and involve difficult, subjective or complex judgments by management. Those policies arerevenue recognition, restructuring and asset impairment charges, inventory valuation, retirementand post-retirement plan assumptions, valuation of long-lived assets and accounting for incometaxes.
Revenue recognition. We enter into agreements to sell products (hardware and/or software),services and other arrangements (multiple element arrangements) that include combinations ofproducts and services.
We recognize revenue, net of trade discounts and allowances, provided that (1) persuasiveevidence of an arrangement exists, (2) delivery has occurred, (3) the price is fixed or determinableand (4) collectibility is reasonably assured. Delivery is considered to have occurred when title andrisk of loss have transferred to the customer, for products, or when the service has been provided.We consider the price to be fixed or determinable when the price is not subject to refund oradjustments. We consider arrangements with extended payment terms not to be fixed ordeterminable and accordingly we defer revenue until amounts become due. At the time of thetransaction, we evaluate the creditworthiness of our customers to determine the appropriate timingof revenue recognition.
44

AGILENT TECHNOLOGIES, INC.
NOTES TO CONSOLIDATED FINANCIAL STATEMENTS — (Continued)
Product revenue. Our product revenue is generated predominantly from the sales of varioustypes of test equipment and semiconductor components. Software is embedded in many of our testequipment products, but the software component is generally considered to be incidental. Productrevenue, including sales to resellers and distributors, is reduced for estimated returns anddistributor price protection, when appropriate. For sales or arrangements that include customer-specified acceptance criteria, including those where acceptance is required upon achievement ofperformance milestones, revenue is recognized after the acceptance criteria have been met. Forproducts that include installation, if the installation meets the criteria to be considered a separateelement, product revenue is recognized upon delivery, and recognition of installation revenue isdelayed until the installation is complete. Otherwise, neither the product nor the installationrevenue is recognized until the installation is complete.
Where software is licensed separately, revenue is recognized when the software is delivered andtitle and risk of loss have been transferred to the customer or, in the case of electronic delivery ofsoftware, when the customer is given access to the licensed software programs. We also evaluatewhether collection of the receivable is probable, the fee is fixed or determinable and whether anyother undelivered elements of the arrangement exist, on which a portion of the total fee would beallocated based on vendor-specific objective evidence. Revenue from software licensing was notmaterial for all periods presented.
Service revenue. Revenue from services includes extended warranty, customer support,consulting, training and education. Service revenue is deferred and recognized over the contractualperiod or as services are rendered and accepted by the customer. For example, customer supportcontracts are recognized ratably over the contractual period, while training revenue is recognized asthe training is provided to the customer. In addition the four revenue recognition criteria describedabove must be met before service revenue is recognized.
Multiple element arrangements. We use objective evidence of fair value to allocate revenue toelements in multiple element arrangements and recognize revenue when the criteria for revenuerecognition have been met for each element. If the criteria are not met, then revenue is deferreduntil such criteria are met or until the period(s) over which the last undelivered element isdelivered. In the absence of objective evidence of fair value of a delivered element, we allocaterevenue to the fair value of the undelivered elements and the residual revenue to the deliveredelements. The price charged when an element is sold separately generally determines fair value.
Deferred revenue. Deferred revenue is primarily comprised of advanced billing and customerdeposits for service, support and maintenance agreements.
Accounts receivable and allowance for doubtful accounts. Trade accounts receivable arerecorded at the invoiced amount and do not bear interest. Such accounts receivable has beenreduced by an allowance for doubtful accounts, which is our best estimate of the amount of probablecredit losses in our existing accounts receivable. We determine the allowance based on our historicalwrite-off experience and the aging of such receivables, among other factors. The allowance has notbeen material for any periods presented. We do not have any off-balance-sheet credit exposurerelated to our customers.
Warranty. Our warranty terms typically extend 90 days after delivery for on-site repairs andone to three years for products returned to Agilent for repair. Our warranty is accounted for inaccordance with Statement of Financial Standards No. 5, “Accounting for Contingencies”
45
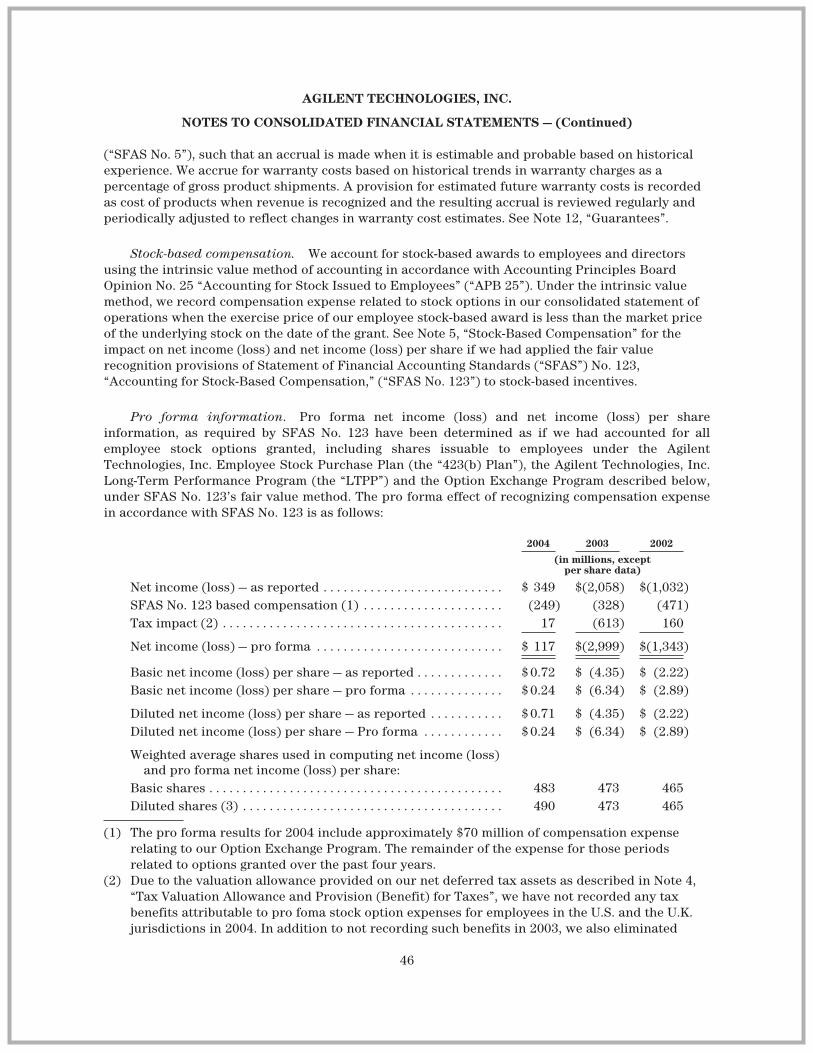
AGILENT TECHNOLOGIES, INC.
NOTES TO CONSOLIDATED FINANCIAL STATEMENTS — (Continued)
(“SFAS No. 5”), such that an accrual is made when it is estimable and probable based on historicalexperience. We accrue for warranty costs based on historical trends in warranty charges as apercentage of gross product shipments. A provision for estimated future warranty costs is recordedas cost of products when revenue is recognized and the resulting accrual is reviewed regularly andperiodically adjusted to reflect changes in warranty cost estimates. See Note 12, “Guarantees”.
Stock-based compensation. We account for stock-based awards to employees and directorsusing the intrinsic value method of accounting in accordance with Accounting Principles BoardOpinion No. 25 “Accounting for Stock Issued to Employees” (“APB 25”). Under the intrinsic valuemethod, we record compensation expense related to stock options in our consolidated statement ofoperations when the exercise price of our employee stock-based award is less than the market priceof the underlying stock on the date of the grant. See Note 5, “Stock-Based Compensation” for theimpact on net income (loss) and net income (loss) per share if we had applied the fair valuerecognition provisions of Statement of Financial Accounting Standards (“SFAS”) No. 123,“Accounting for Stock-Based Compensation,” (“SFAS No. 123”) to stock-based incentives.
Pro forma information. Pro forma net income (loss) and net income (loss) per shareinformation, as required by SFAS No. 123 have been determined as if we had accounted for allemployee stock options granted, including shares issuable to employees under the AgilentTechnologies, Inc. Employee Stock Purchase Plan (the “423(b) Plan”), the Agilent Technologies, Inc.Long-Term Performance Program (the “LTPP”) and the Option Exchange Program described below,under SFAS No. 123’s fair value method. The pro forma effect of recognizing compensation expensein accordance with SFAS No. 123 is as follows:
2004 2003 2002
(in millions, exceptper share data)
Net income (loss) — as reported . . . . . . . . . . . . . . . . . . . . . . . . . . . $ 349 $(2,058) $(1,032)SFAS No. 123 based compensation (1) . . . . . . . . . . . . . . . . . . . . . (249) (328) (471)Tax impact (2) . . . . . . . . . . . . . . . . . . . . . . . . . . . . . . . . . . . . . . . . . . 17 (613) 160
Net income (loss) — pro forma . . . . . . . . . . . . . . . . . . . . . . . . . . . . $ 117 $(2,999) $(1,343)
Basic net income (loss) per share — as reported . . . . . . . . . . . . . $0.72 $ (4.35) $ (2.22)Basic net income (loss) per share — pro forma . . . . . . . . . . . . . . $0.24 $ (6.34) $ (2.89)
Diluted net income (loss) per share — as reported . . . . . . . . . . . $0.71 $ (4.35) $ (2.22)Diluted net income (loss) per share — Pro forma . . . . . . . . . . . . $0.24 $ (6.34) $ (2.89)
Weighted average shares used in computing net income (loss)and pro forma net income (loss) per share:
Basic shares . . . . . . . . . . . . . . . . . . . . . . . . . . . . . . . . . . . . . . . . . . . . 483 473 465Diluted shares (3) . . . . . . . . . . . . . . . . . . . . . . . . . . . . . . . . . . . . . . . 490 473 465
(1) The pro forma results for 2004 include approximately $70 million of compensation expenserelating to our Option Exchange Program. The remainder of the expense for those periodsrelated to options granted over the past four years.
(2) Due to the valuation allowance provided on our net deferred tax assets as described in Note 4,“Tax Valuation Allowance and Provision (Benefit) for Taxes”, we have not recorded any taxbenefits attributable to pro foma stock option expenses for employees in the U.S. and the U.K.jurisdictions in 2004. In addition to not recording such benefits in 2003, we also eliminated
46

AGILENT TECHNOLOGIES, INC.
NOTES TO CONSOLIDATED FINANCIAL STATEMENTS — (Continued)
$613 million of accumulated tax benefits recognized between 1996 and 2002 for pro formareporting purposes.
(3) Approximately 41 million outstanding options were considered antidilutive for the purposes ofthis pro-forma calculation for fiscal year 2004.
The fair value of options granted was estimated at grant date using a Black-Scholes option-pricing model with the following weighted-average assumptions:
2004 2003 2002
Risk-free interest rate for options . . . . . . . . . . 2.75-3.95% 1.15-3.31% 2.90%Risk-free interest rate for the 423(b) Plan . . . 1.04-1.31% 1.10-1.77% 1.89-5.87%Dividend yield . . . . . . . . . . . . . . . . . . . . . . . . . . . 0% 0% 0%Volatility for options . . . . . . . . . . . . . . . . . . . . . 53-64% 60-80% 63%Volatility for the 423(b) Plan . . . . . . . . . . . . . . 36-61% 63-80% 47-77%Expected option life . . . . . . . . . . . . . . . . . . . . . . 5.5 years 3.5-5.5 years 5.5 yearsExpected life for the 423(b) Plan . . . . . . . . . . . 6 months-1 year 6 months-2 years 6 months-1 year
For purposes of pro forma disclosures, the estimated fair value of the options is amortized toexpense over the vesting period of the options and amortized over six months to two years for the423(b) Plan.
Shipping and handling costs. Our shipping and handling costs charged to customers areincluded in net revenue and the associated expense is recorded in total costs for all periodspresented.
Goodwill and purchased intangible assets. On November 1, 2002, we adopted SFAS No. 142“Goodwill and Other Intangible Assets” (“SFAS No. 142”), which requires that goodwill no longer beamortized but reviewed annually (or more frequently if impairment indicators arise) forimpairment. Subsequently, we were required to evaluate our existing goodwill and intangible assetsand make any necessary reclassification in order to comply with the new criteria in SFAS No. 142.
As part of our initial assessment of goodwill impairment, we used the fair value measurementrequirement, rather than the previously required undiscounted cash flows approach. As a result ofthat assessment, we recorded a transitional impairment loss from the implementation of SFAS No.142 as a change in accounting principle in the first quarter of 2003. The fair value of the reportingunits was determined primarily by the income approach, which estimates the fair value based on thefuture discounted cash flows. The first step evaluation of reporting units on a fair value basis, asrequired by SFAS No. 142, indicated that an impairment existed in the communications solutionsreporting unit within our test and measurement business. The revenue forecasts of thecommunications solutions reporting unit have been impacted by the prolonged economic downturnin the communications test markets. As such, we were required to perform the second step analysisto determine the amount of the impairment loss for the reporting unit that failed the first step test.The second step analysis consisted of comparing the implied fair value of the reporting unit’sgoodwill with the carrying amount of the reporting unit’s goodwill, with an impairment chargeresulting from any excess of the carrying value of the reporting unit’s goodwill over the implied fairvalue of the reporting unit’s goodwill. Based upon this evaluation, we recorded an impairmentcharge of $268 million, representing 100 percent of the reporting unit’s goodwill and approximately
47
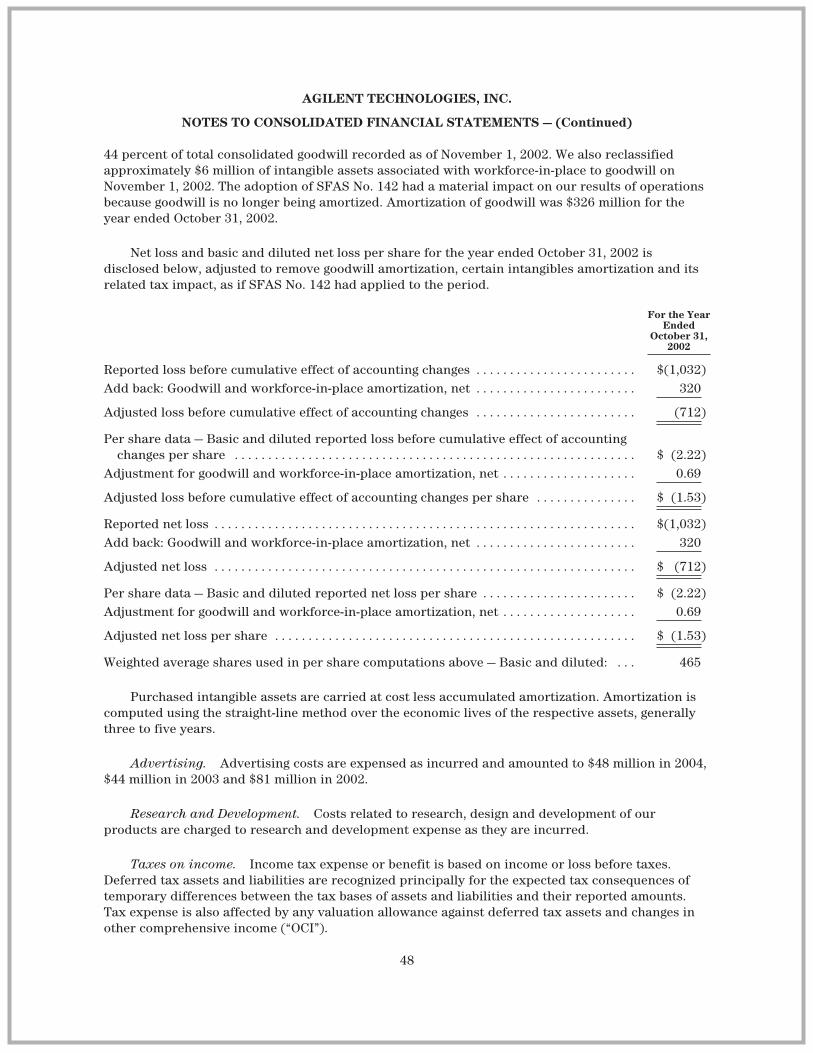
AGILENT TECHNOLOGIES, INC.
NOTES TO CONSOLIDATED FINANCIAL STATEMENTS — (Continued)
44 percent of total consolidated goodwill recorded as of November 1, 2002. We also reclassifiedapproximately $6 million of intangible assets associated with workforce-in-place to goodwill onNovember 1, 2002. The adoption of SFAS No. 142 had a material impact on our results of operationsbecause goodwill is no longer being amortized. Amortization of goodwill was $326 million for theyear ended October 31, 2002.
Net loss and basic and diluted net loss per share for the year ended October 31, 2002 isdisclosed below, adjusted to remove goodwill amortization, certain intangibles amortization and itsrelated tax impact, as if SFAS No. 142 had applied to the period.
For the YearEnded
October 31,2002
Reported loss before cumulative effect of accounting changes . . . . . . . . . . . . . . . . . . . . . . . . $(1,032)Add back: Goodwill and workforce-in-place amortization, net . . . . . . . . . . . . . . . . . . . . . . . . 320
Adjusted loss before cumulative effect of accounting changes . . . . . . . . . . . . . . . . . . . . . . . . (712)
Per share data — Basic and diluted reported loss before cumulative effect of accountingchanges per share . . . . . . . . . . . . . . . . . . . . . . . . . . . . . . . . . . . . . . . . . . . . . . . . . . . . . . . . . . . . $ (2.22)
Adjustment for goodwill and workforce-in-place amortization, net . . . . . . . . . . . . . . . . . . . . 0.69
Adjusted loss before cumulative effect of accounting changes per share . . . . . . . . . . . . . . . $ (1.53)
Reported net loss . . . . . . . . . . . . . . . . . . . . . . . . . . . . . . . . . . . . . . . . . . . . . . . . . . . . . . . . . . . . . . . $(1,032)Add back: Goodwill and workforce-in-place amortization, net . . . . . . . . . . . . . . . . . . . . . . . . 320
Adjusted net loss . . . . . . . . . . . . . . . . . . . . . . . . . . . . . . . . . . . . . . . . . . . . . . . . . . . . . . . . . . . . . . . $ (712)
Per share data — Basic and diluted reported net loss per share . . . . . . . . . . . . . . . . . . . . . . . $ (2.22)Adjustment for goodwill and workforce-in-place amortization, net . . . . . . . . . . . . . . . . . . . . 0.69
Adjusted net loss per share . . . . . . . . . . . . . . . . . . . . . . . . . . . . . . . . . . . . . . . . . . . . . . . . . . . . . . $ (1.53)
Weighted average shares used in per share computations above — Basic and diluted: . . . 465
Purchased intangible assets are carried at cost less accumulated amortization. Amortization iscomputed using the straight-line method over the economic lives of the respective assets, generallythree to five years.
Advertising. Advertising costs are expensed as incurred and amounted to $48 million in 2004,$44 million in 2003 and $81 million in 2002.
Research and Development. Costs related to research, design and development of ourproducts are charged to research and development expense as they are incurred.
Taxes on income. Income tax expense or benefit is based on income or loss before taxes.Deferred tax assets and liabilities are recognized principally for the expected tax consequences oftemporary differences between the tax bases of assets and liabilities and their reported amounts.Tax expense is also affected by any valuation allowance against deferred tax assets and changes inother comprehensive income (“OCI”).
48

AGILENT TECHNOLOGIES, INC.
NOTES TO CONSOLIDATED FINANCIAL STATEMENTS — (Continued)
Net income (loss) per share. Basic net income (loss) per share is computed by dividing netincome (loss) — the numerator — by the weighted average number of common shares outstanding —the denominator — during the period excluding the dilutive effect of stock options, other employeestock plans and our senior convertible debentures. Diluted net income (loss) per share gives effect toall potentially dilutive common stock equivalents outstanding during the period. In computingdiluted net income (loss) per share, the average stock price for the period is used in determining thenumber of shares assumed to be purchased from the proceeds of stock option exercises. Diluted netincome per share for 2004 excluded the potentially dilutive effect of 41 million common stockequivalents as their effect was antidilutive. Diluted net loss per share for 2003 and 2002 excludedthe potentially dilutive effect of all common stock equivalents as the effect was antidilutive.
Cash and cash equivalents. We classify investments as cash equivalents if their originalmaturity is three months or less at the date of purchase. Cash equivalents are stated at cost, whichapproximates fair value.
Approximately 30 percent of our cash and cash equivalents is held in the U.S. and 50 percent isheld in a centrally managed global cash pool outside the U.S. The remainder is diversified amongvarious major financial institutions throughout the world. Approximately 10 percent of our overallcash and cash equivalents is maintained in demand deposit accounts with global financialinstitutions of high credit quality, and is available to be used in paying and receiving activities. Theremainder is invested in institutional money market funds, short-term bank time deposits andsimilar short-duration instruments with fixed maturities from overnight to 90 days. Agilent monitorsthe credit-worthiness of these financial institutions and institutional money market funds on acontinuous basis. We have not experienced any credit losses from cash investments placed withthese institutions.
Fair value of financial instruments. The carrying values of certain of our financialinstruments, including cash and cash equivalents, accrued compensation and other accruedliabilities approximate fair value because of their short maturities. The fair values of investments aredetermined using quoted market prices for those securities or similar financial instruments.
Concentration of credit risk. We sell the majority of our products through our direct salesforce. No single customer accounted for 10 percent or more of the combined accounts receivablebalance at October 31, 2004 and 2003. Credit risk with respect to accounts receivable is generallydiversified due to the large number of entities comprising our customer base and their dispersionacross many different industries and geographies. We perform ongoing credit evaluations of ourcustomers’ financial conditions, and require collateral, such as letters of credit and bank guarantees,in certain circumstances.
Derivative instruments. For derivative instruments that are designated and qualify as a fairvalue hedge, changes in value of the derivative are recognized in income in the current period, alongwith the offsetting gain or loss on the hedged item attributable to the hedged risk. For derivativeinstruments that are designated and qualify as a cash flow hedge, changes in the value of theeffective portion of the derivative instrument are recognized in other comprehensive loss, acomponent of stockholders’ equity. These amounts are reclassified and recognized in income wheneither the forecasted transaction occurs or it becomes probable the forecasted transaction will notoccur. Changes in the fair value of the ineffective portion of derivative instruments are recognized inincome in the current period. Ineffectiveness in 2004, 2003 and 2002 was not significant.
49
AGILENT TECHNOLOGIES, INC.
NOTES TO CONSOLIDATED FINANCIAL STATEMENTS — (Continued)
We enter into foreign exchange contracts, primarily forward contracts and purchased options,to hedge exposures to changes in foreign currency exchange rates. These contracts are designated atinception as hedges of the related foreign currency exposures, which include committed andanticipated intercompany transactions and assets and liabilities that are denominated in currenciesother than the functional currency of the subsidiary, which has the exposure. To achieve hedgeaccounting, contracts must reduce the foreign currency exchange rate risk otherwise inherent in theamount and duration of the hedged exposures and comply with established risk managementpolicies; hedging contracts generally mature within twelve months. We do not use derivativefinancial instruments for speculative or trading purposes.
When hedging anticipated cash flow exposure, foreign exchange contract expirations are set soas to occur in the same period that the goods are expected to be sold to third parties, allowingrealized gains and losses on the contracts to be recognized into total costs. When hedging balancesheet exposure, gains and losses on foreign exchange contracts are recognized in other income(expense), net in the same period as the occurrence of gains and losses on remeasurement of thenon-functional currency denominated assets and liabilities. The gains and losses, which have notbeen material, are included in cash flows from operating activities in the consolidated statement ofcash flows.
We may also, from time to time, acquire warrants to purchase securities of other companies aspart of strategic relationships.
Inventory. Inventory is valued at standard cost, which approximates actual cost computed ona first-in, first-out basis, not in excess of market value. We assess the valuation of our inventory on aquarterly basis and periodically write down the value for estimated excess and obsolete inventorybased on estimates about future demand and actual usage.
Property, plant and equipment. Property, plant and equipment are stated at cost lessaccumulated depreciation. Additions, improvements and major renewals are capitalized;maintenance, repairs and minor renewals are expensed as incurred. When assets are retired ordisposed of, the assets and related accumulated depreciation and amortization are removed fromour general ledger and the resulting gain or loss is reflected in the consolidated statement ofoperations. Buildings and improvements are depreciated over fifteen to forty years and machineryand equipment over three to ten years. The straight-line method of depreciation is used for allproperty, plant and equipment.
Capitalized software. We capitalize certain internal and external costs incurred to acquire orcreate internal use software in accordance with AICPA Statement of Position 98-1, “Accounting forthe Costs of Computer Software Developed or Obtained for Internal Use.” Capitalized software isincluded in property, plant and equipment and is depreciated over three to five years whendevelopment is complete.
Impairment of long-lived assets. We continually monitor events and changes in circumstancesthat could indicate carrying amounts of long-lived assets, including intangible assets, may not berecoverable. When such events or changes in circumstances occur, we assess the recoverability oflong-lived assets by determining whether the carrying value of such assets will be recovered throughundiscounted expected future cash flows. If the total of the undiscounted future cash flows is lessthan the carrying amount of those assets, we recognize an impairment loss based on the excess ofthe carrying amount over the fair value of the assets.
50

AGILENT TECHNOLOGIES, INC.
NOTES TO CONSOLIDATED FINANCIAL STATEMENTS — (Continued)
Foreign currency translation. The functional currency for many of our subsidiaries outside theU.S is local currency based on the criteria of SFAS No. 52 “Foreign Currency Translation”. For thosesubsidiaries that operate in a local currency functional environment, all assets and liabilities aretranslated into U.S. dollars using current exchange rates; revenue and expenses are translated usingaverage exchange rates in effect during each period. Resulting translation adjustments are reported asa separate component of accumulated comprehensive income (loss) in stockholders’ equity.
For those subsidiaries that operate in a U.S. dollar functional environment, foreign currencyassets and liabilities are remeasured into U.S. dollars at current exchange rates except for inventory,property, plant and equipment, other assets and deferred revenue, which are remeasured athistorical exchange rates. Revenue and expenses are generally translated at average exchange ratesin effect during each period, except for those expenses related to balance sheet amounts that areremeasured at historical exchange rates. Gains or losses from foreign currency remeasurement areincluded in consolidated net income (loss).
3. New Accounting Pronouncements
Adoption of New Pronouncements.
In January 2003 the Financial Accounting Standards Board (“FASB”) issued InterpretationNo. 46, “Consolidation of Variable Interest Entities” (“FIN 46”) which was amended by FIN 46Rissued in December 2003. FIN 46 addresses consolidation by business enterprises of variableinterest entities (“VIE’s”) that either: (1) do not have sufficient equity investment at risk to permitthe entity to finance its activities without additional subordinated financial support, or (2) for whichthe equity investors lack an essential characteristic of a controlling financial interest. FIN 46requires consolidation of VIE’s for which Agilent is the primary beneficiary and disclosure of asignificant interest in a VIE for which Agilent is not the primary beneficiary. As a result of ourreview, no entities were identified requiring disclosure or consolidation under FIN 46.
In December 2003, the Securities and Exchange Commission issued Staff Accounting Bulletin(“SAB”) No. 104, “Revenue Recognition” (“SAB No. 104”). SAB No. 104 rescinds certain sections ofSAB No. 101, “Revenue Recognition in Financial Statements” (“SAB No. 101”), related to multipleelement revenue arrangements, superceded as a result of the issuance of EITF 00-21, “Accountingfor Revenue Arrangements with Multiple Deliverables” (“EITF 00-21”). The revenue recognitionprinciples of SAB No. 101 remain largely unchanged by the issuance of SAB No. 104. The adoption ofthis standard did not affect our financial condition, results of operations or cash flows.
In December 2003, the FASB issued a revision SFAS No. 132 (the “revision”), “Employers’Disclosures about Pensions and Other Postretirement Benefits”. The revision requires additionaldisclosures relating to the description of the types of plan assets, investment strategy, measurementdate(s), plan obligations, cash flows, and components of net periodic benefit cost of defined benefitpension plans and other defined benefit postretirement plans recognized during interim periods. Weadopted the disclosure requirements beginning with the first quarter of 2004 and the standard iseffective for all future quarterly and annual reports; see Note 14 for such disclosures.
In March 2004, the FASB issued EITF No. 03-01, “The Meaning of Other-Than-TemporaryImpairment and its Application to Certain Investments,” which provides new guidance for assessingimpairment losses on debt and equity investments. The new impairment model applies to investmentsaccounted for under the cost or equity method and investments accounted for under FAS 115,“Accounting for Certain Investments in Debt and Equity Securities.” EITF No. 03-01 also includes new
51

AGILENT TECHNOLOGIES, INC.
NOTES TO CONSOLIDATED FINANCIAL STATEMENTS — (Continued)
disclosure requirements for cost method investments and for all investments that are in an unrealizedloss position. In September 2004, the FASB delayed the accounting provisions of EITF No. 03-01;however the disclosure requirements remain effective and the applicable ones have been adopted forour year-end 2004. We will evaluate the effect, if any, of EITF 03-01 when final guidance is issued.
In March 2004, the EITF reached a consensus on EITF Issue No. 03-16, “Accounting forInvestments in Limited Liability Companies” (“EITF 03-16”). The EITF concluded that if investors ina limited liability company have specific ownership accounts, they should follow the guidanceprescribed in Statement of Position 78-9, “Accounting for Investments in Real Estate Ventures, andEITF Topic No. D-46, Accounting for Limited Partnership Investments.” Otherwise, investors shouldfollow the significant influence model prescribed in Accounting Principles Board Opinion No. 18,“The Equity Method of Accounting for Investments in Common Stock.” The adoption of this Issue didnot have a material impact on the company’s financial condition, results of operations or cash flows.
In December 2004, the FASB issued SFAS No. 123 (Revised 2004) “Share-Based Payment”(“SFAS No. 123R”). SFAS No. 123R addresses all forms of share-based payment (“SBP”) awards,including shares issued under employee stock purchase plans, stock options, restricted stock andstock appreciation rights. SFAS No. 123R will require Agilent to expense SBP awards withcompensation cost for SBP transactions measured at fair value. The FASB originally stated apreference for a lattice model because it believed that a lattice model more fully captures the uniquecharacteristics of employee stock options in the estimate of fair value, as compared to the Black-Scholes model which Agilent currently uses for its footnote disclosure. The FASB decided to removeits explicit preference for a lattice model and not require a single valuation methodology. SFASNo. 123R requires Agilent to adopt the new accounting provisions beginning in our fourth quarter of2005. Agilent has not yet determined the impact of applying the various provisions of SFASNo. 123R.
In May 2004, the FASB issued a FASB Staff Position (“FSP”) regarding SFAS No. 106,“Employers’ Accounting for Postretirement Benefits Other Than Pensions”. FSP No. 106-2,“Accounting and Disclosure Requirements Related to the Medicare Prescription Drug, Improvementand Modernization Act of 2003” discusses the effect of the Medicare Prescription Drug, Improvementand Modernization Act (the “Act”) enacted in December 2003 and supersedes FSP No. 106-1, whichwas issued in January 2004. FSP No. 106-2 considers the effect of the two new features introducedin the Act in determining our accumulated postretirement benefit obligation (“APBO”) and netperiodic postretirement benefit cost. The effect on the APBO will be accounted for as an actuarialexperience gain to be amortized into income over the average remaining service period of planparticipants. Companies may elect to defer accounting for this benefit or may attempt to reflect thebest estimate of the impact of the Act on their net periodic costs currently. The adoption of FSP No.106-2 in the fourth quarter of 2004 did not have a material impact on our consolidated financialposition, results of operations or cash flows.
In November 2004, the FASB issued FASB Statement No. 151, “Inventory Costs — an amendmentof ARB No. 43” (“FAS 151”), which is the result of its efforts to converge U.S. accounting standardsfor inventories with International Accounting Standards. FAS No. 151 requires idle facility expenses,freight, handling costs, and wasted material (spoilage) costs to be recognized as current-periodcharges. It also requires that allocation of fixed production overheads to the costs of conversion bebased on the normal capacity of the production facilities. FAS No. 151 will be effective for inventorycosts incurred during fiscal years beginning after June 15, 2005. We are evaluating the impact of thisstandard on our consolidated financial statements.
52
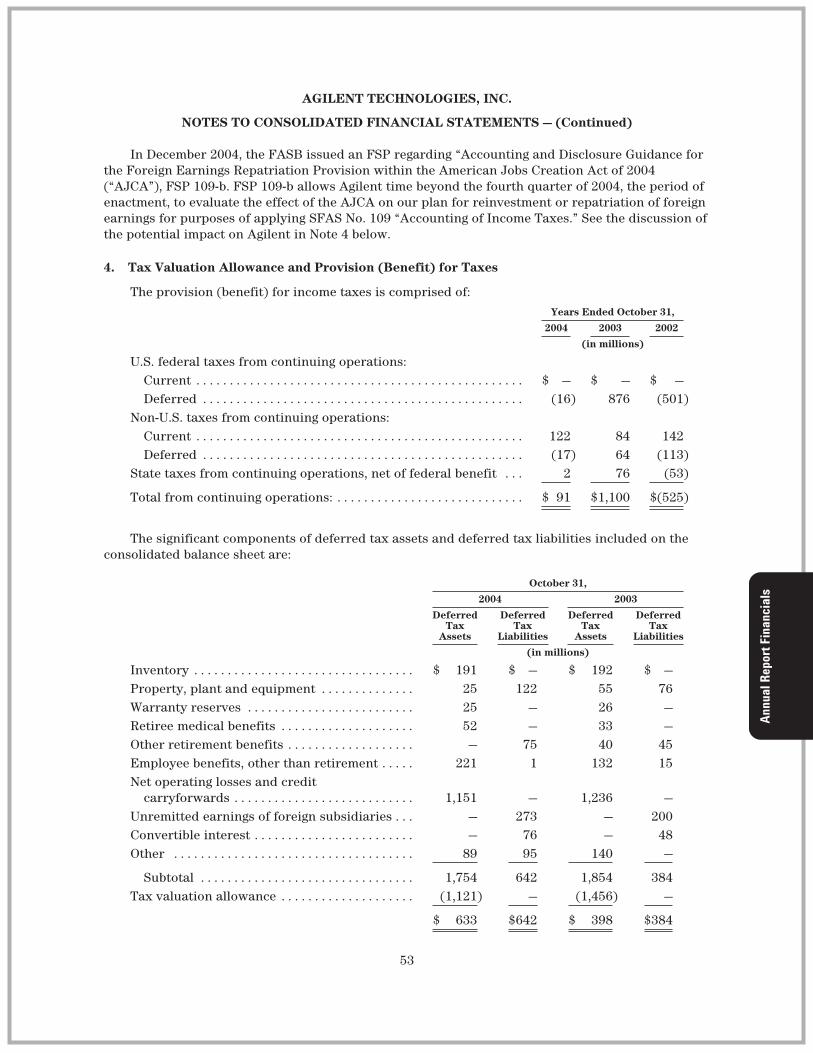
AGILENT TECHNOLOGIES, INC.
NOTES TO CONSOLIDATED FINANCIAL STATEMENTS — (Continued)
In December 2004, the FASB issued an FSP regarding “Accounting and Disclosure Guidance forthe Foreign Earnings Repatriation Provision within the American Jobs Creation Act of 2004(“AJCA”), FSP 109-b. FSP 109-b allows Agilent time beyond the fourth quarter of 2004, the period ofenactment, to evaluate the effect of the AJCA on our plan for reinvestment or repatriation of foreignearnings for purposes of applying SFAS No. 109 “Accounting of Income Taxes.” See the discussion ofthe potential impact on Agilent in Note 4 below.
4. Tax Valuation Allowance and Provision (Benefit) for Taxes
The provision (benefit) for income taxes is comprised of:Years Ended October 31,
2004 2003 2002
(in millions)
U.S. federal taxes from continuing operations:Current . . . . . . . . . . . . . . . . . . . . . . . . . . . . . . . . . . . . . . . . . . . . . . . . . $ — $ — $ —Deferred . . . . . . . . . . . . . . . . . . . . . . . . . . . . . . . . . . . . . . . . . . . . . . . . (16) 876 (501)
Non-U.S. taxes from continuing operations:Current . . . . . . . . . . . . . . . . . . . . . . . . . . . . . . . . . . . . . . . . . . . . . . . . . 122 84 142Deferred . . . . . . . . . . . . . . . . . . . . . . . . . . . . . . . . . . . . . . . . . . . . . . . . (17) 64 (113)
State taxes from continuing operations, net of federal benefit . . . 2 76 (53)
Total from continuing operations: . . . . . . . . . . . . . . . . . . . . . . . . . . . . $ 91 $1,100 $(525)
The significant components of deferred tax assets and deferred tax liabilities included on theconsolidated balance sheet are:
October 31,
2004 2003
DeferredTax
Assets
DeferredTax
Liabilities
DeferredTax
Assets
DeferredTax
Liabilities
(in millions)
Inventory . . . . . . . . . . . . . . . . . . . . . . . . . . . . . . . . . $ 191 $ — $ 192 $ —Property, plant and equipment . . . . . . . . . . . . . . 25 122 55 76Warranty reserves . . . . . . . . . . . . . . . . . . . . . . . . . 25 — 26 —Retiree medical benefits . . . . . . . . . . . . . . . . . . . . 52 — 33 —Other retirement benefits . . . . . . . . . . . . . . . . . . . — 75 40 45Employee benefits, other than retirement . . . . . 221 1 132 15Net operating losses and credit
carryforwards . . . . . . . . . . . . . . . . . . . . . . . . . . . 1,151 — 1,236 —Unremitted earnings of foreign subsidiaries . . . — 273 — 200Convertible interest . . . . . . . . . . . . . . . . . . . . . . . . — 76 — 48Other . . . . . . . . . . . . . . . . . . . . . . . . . . . . . . . . . . . . 89 95 140 —
Subtotal . . . . . . . . . . . . . . . . . . . . . . . . . . . . . . . . 1,754 642 1,854 384Tax valuation allowance . . . . . . . . . . . . . . . . . . . . (1,121) — (1,456) —
$ 633 $642 $ 398 $384
53
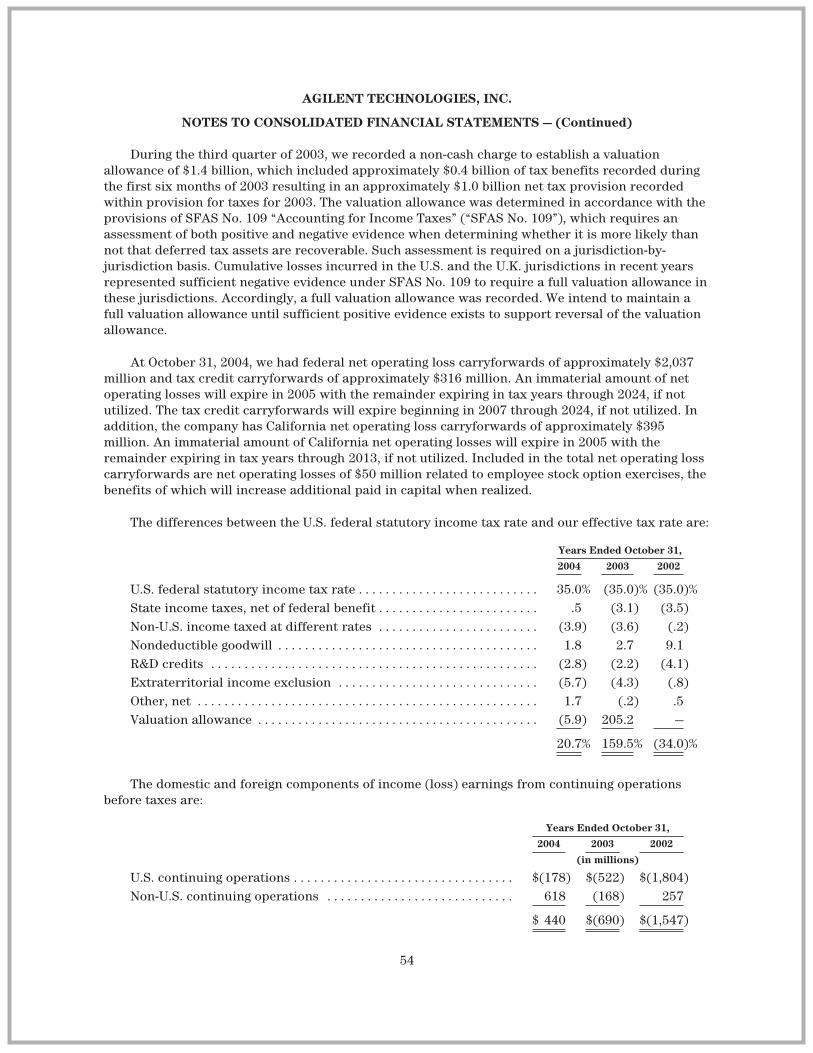
AGILENT TECHNOLOGIES, INC.
NOTES TO CONSOLIDATED FINANCIAL STATEMENTS — (Continued)
During the third quarter of 2003, we recorded a non-cash charge to establish a valuationallowance of $1.4 billion, which included approximately $0.4 billion of tax benefits recorded duringthe first six months of 2003 resulting in an approximately $1.0 billion net tax provision recordedwithin provision for taxes for 2003. The valuation allowance was determined in accordance with theprovisions of SFAS No. 109 “Accounting for Income Taxes” (“SFAS No. 109”), which requires anassessment of both positive and negative evidence when determining whether it is more likely thannot that deferred tax assets are recoverable. Such assessment is required on a jurisdiction-by-jurisdiction basis. Cumulative losses incurred in the U.S. and the U.K. jurisdictions in recent yearsrepresented sufficient negative evidence under SFAS No. 109 to require a full valuation allowance inthese jurisdictions. Accordingly, a full valuation allowance was recorded. We intend to maintain afull valuation allowance until sufficient positive evidence exists to support reversal of the valuationallowance.
At October 31, 2004, we had federal net operating loss carryforwards of approximately $2,037million and tax credit carryforwards of approximately $316 million. An immaterial amount of netoperating losses will expire in 2005 with the remainder expiring in tax years through 2024, if notutilized. The tax credit carryforwards will expire beginning in 2007 through 2024, if not utilized. Inaddition, the company has California net operating loss carryforwards of approximately $395million. An immaterial amount of California net operating losses will expire in 2005 with theremainder expiring in tax years through 2013, if not utilized. Included in the total net operating losscarryforwards are net operating losses of $50 million related to employee stock option exercises, thebenefits of which will increase additional paid in capital when realized.
The differences between the U.S. federal statutory income tax rate and our effective tax rate are:
Years Ended October 31,
2004 2003 2002
U.S. federal statutory income tax rate . . . . . . . . . . . . . . . . . . . . . . . . . . . 35.0% (35.0)% (35.0)%State income taxes, net of federal benefit . . . . . . . . . . . . . . . . . . . . . . . . .5 (3.1) (3.5)Non-U.S. income taxed at different rates . . . . . . . . . . . . . . . . . . . . . . . . (3.9) (3.6) (.2)Nondeductible goodwill . . . . . . . . . . . . . . . . . . . . . . . . . . . . . . . . . . . . . . . 1.8 2.7 9.1R&D credits . . . . . . . . . . . . . . . . . . . . . . . . . . . . . . . . . . . . . . . . . . . . . . . . . (2.8) (2.2) (4.1)Extraterritorial income exclusion . . . . . . . . . . . . . . . . . . . . . . . . . . . . . . (5.7) (4.3) (.8)Other, net . . . . . . . . . . . . . . . . . . . . . . . . . . . . . . . . . . . . . . . . . . . . . . . . . . . 1.7 (.2) .5Valuation allowance . . . . . . . . . . . . . . . . . . . . . . . . . . . . . . . . . . . . . . . . . . (5.9) 205.2 —
20.7% 159.5% (34.0)%
The domestic and foreign components of income (loss) earnings from continuing operationsbefore taxes are:
Years Ended October 31,
2004 2003 2002
(in millions)
U.S. continuing operations . . . . . . . . . . . . . . . . . . . . . . . . . . . . . . . . . $(178) $(522) $(1,804)Non-U.S. continuing operations . . . . . . . . . . . . . . . . . . . . . . . . . . . . 618 (168) 257
$ 440 $(690) $(1,547)
54
AGILENT TECHNOLOGIES, INC.
NOTES TO CONSOLIDATED FINANCIAL STATEMENTS — (Continued)
We consider the operating income of non-United States subsidiaries to be indefinitely investedoutside the United States. No provision has been made for United States federal and state, or foreigntaxes that may result from future remittances of undistributed earnings of foreign subsidiaries, thecumulative amount of which is approximately $1,179 million as of October 31, 2004. If managementdecides to remit this income to the U.S. in a future period, our provision for income taxes mayincrease materially in that period.
On October 22, 2004, the AJCA was signed into law. The AJCA includes a deduction for85 percent of certain foreign earnings that are repatriated, as defined in the AJCA, at an effectivetax cost of 5.25 percent on any such repatriated foreign earnings. Agilent may elect to apply thisprovision to qualifying earnings repatriations in fiscal 2005. Agilent has begun an evaluation of theeffects of the repatriation provision; however, we do not expect to be able to complete thisevaluation until after Congress or the Treasury Department provide additional clarifying languageon key elements of the provision. We expect to complete our evaluation of the effects of therepatriation provision within a reasonable period of time following the publication of the additionalclarifying language. The range of possible amounts that Agilent is considering for repatriation underthis provision is between zero and $970 million. The related potential range of income tax is betweenzero and $51 million.
We are subject to ongoing tax examinations of our tax returns by the Internal Revenue Serviceand other tax authorities in various jurisdictions. We regularly assess the likelihood of adverseoutcomes resulting from these examinations to determine the adequacy of our provision for incometaxes.
5. Stock-Based Compensation
We follow the accounting provisions of Accounting Principles Board Opinion No. 25,“Accounting for Stock Issued to Employees” (“APB No. 25”) for stock-based compensation granted toemployees. Accordingly, compensation expense is recognized in our consolidated statement ofoperations only when options are granted at an exercise price that is less than the market price ofthe underlying stock on the date of the grant. Any compensation expense is recognized ratably overthe associated service period, which is generally the option vesting term.
Employee stock purchase plans. In February 2000, we implemented the Agilent Technologies,Inc. Employee Stock Purchase Plan (the “Legacy Plan”) that allowed eligible employees to contributeup to ten percent of their base compensation to the purchase of our common stock. Under theprovisions of the Legacy Plan, employee contributions were partially matched with sharescontributed by us. These matching shares also generally vested over two years. Compensationexpense for the matching provision for the Legacy Plan was measured using the fair value of shareson the date of purchase by Agilent for the Legacy Plan and was recognized over the two-year vestingperiod.
Effective October 31, 2000, purchases and contributions under the Legacy Plan ceased. Allunvested matching shares under the Legacy Plan maintained their original vesting terms based onthe employee’s continued employment. Vesting of these matching shares was completed byOctober 31, 2002. Compensation expense under the Legacy Plan was nil in 2004 and 2003 and$16 million in 2002. At October 31, 2004, 9,802,100 shares of our common stock had been authorizedfor issuance under the Legacy Plan and 3,426,716 of these shares had been issued. The remainder ofthe authorized shares are not expected to be issued, as the Legacy Plan is no longer functioning.
55
AGILENT TECHNOLOGIES, INC.
NOTES TO CONSOLIDATED FINANCIAL STATEMENTS — (Continued)
Effective November 1, 2000, we adopted a new plan, the 423(b) Plan. Under the provisions ofthe 423(b) Plan, eligible employees may contribute up to ten percent of their base compensation topurchase shares of our common stock at 85 percent of the lower of the fair market value at the entrydate or the purchase date as defined by the 423(b) Plan. As of October 31, 2004, 39,868,411 shares ofour common stock were authorized for issuance under the 423(b) Plan and 20,595,128 of theseshares have been issued.
Incentive compensation plans. On September 17, 1999, we adopted the Agilent Technologies,Inc. 1999 Stock Plan (the “Stock Plan”) and subsequently reserved 67,800,000 shares of our commonstock for issuance under the Stock Plan. In addition, on May 31, 2000, 19,000,000 shares of ourcommon stock were registered pursuant to converted stock options previously granted by Hewlett-Packard Company. In February 2001, our stockholders approved an additional 45,000,000 shares ofour common stock for issuance under the Stock Plan. These shares were subsequently registered inMay 2002. Stock options, stock appreciation rights, stock awards and cash awards may be grantedunder the Stock Plan. Options granted under the Stock Plan may be either “incentive stock options,”as defined in section 422 of the Internal Revenue Code, or non-statutory. Options generally vest at arate of 25 percent per year over a period of four years from the date of grant and have a maximumterm of ten years. The exercise price for incentive stock options is generally not less than 100percent of the fair market value of our common stock on the date the stock award is granted.
On March 4, 2003, our stockholders approved an amendment to the Stock Plan. The amendmentpermits the company to offer a one-time exchange of options issued under the Stock Plan having anexercise price greater than $25 for a lesser number of options to be granted at least six months andone day from the cancellation of surrendered options (the “Option Exchange Program”). On May 20,2003, we implemented the Option Exchange Program by filing a Tender Offer Statement with the SEC,which allowed eligible employees a one-time opportunity to exchange options to purchase shares of thecompany’s common stock, whether vested or unvested, which were granted under our Stock Plan, withexercise prices greater than $25 per share. The Option Exchange Program was offered from May 20,2003 to June 18, 2003 and options to purchase approximately 26 million shares were exchanged, withan average exercise price of $51. As a result, the company issued options to purchase approximately13.8 million shares at a weighted-average exercise price of $28 per share during the first quarter of2004. Under the provisions of APB 25 no compensation expense has been, or will be, recognized in ourconsolidated statement of operations for the issuance of the replacement options.
Effective November 1, 2003, the Compensation Committee of the Board of Directors approvedthe LTPP for the company’s executive officers. Participants in this program are entitled to receiveunrestricted shares of the company’s stock after the end of a three-year period, if specifiedperformance targets are met. On November 18, 2003 the Compensation Committee approvedapproximately 322,000 shares to be issued to the company’s executive officers. We include thedilutive impact of this program in our diluted net income per share calculation. The amount ofcompensation expense, using the variable accounting method pursuant to APB No. 25, was notmaterial for the year ended October 31, 2004. The stock will be awarded in fiscal 2007, and the finalaward may vary as it is based on certain performance metrics. On November 16, 2004, theCompensation Committee approved approximately 419,000 shares to be issued for the company’sexecutive officers in connection with the LTPP. The shares will be awarded in fiscal year 2008, andthe final award may vary as it is based on certain performance metrics.
At October 31, 2004, shares registered and available for option and restricted stock grants were61,945,186. Compensation expense for discounted options, stock appreciation rights and restricted
56
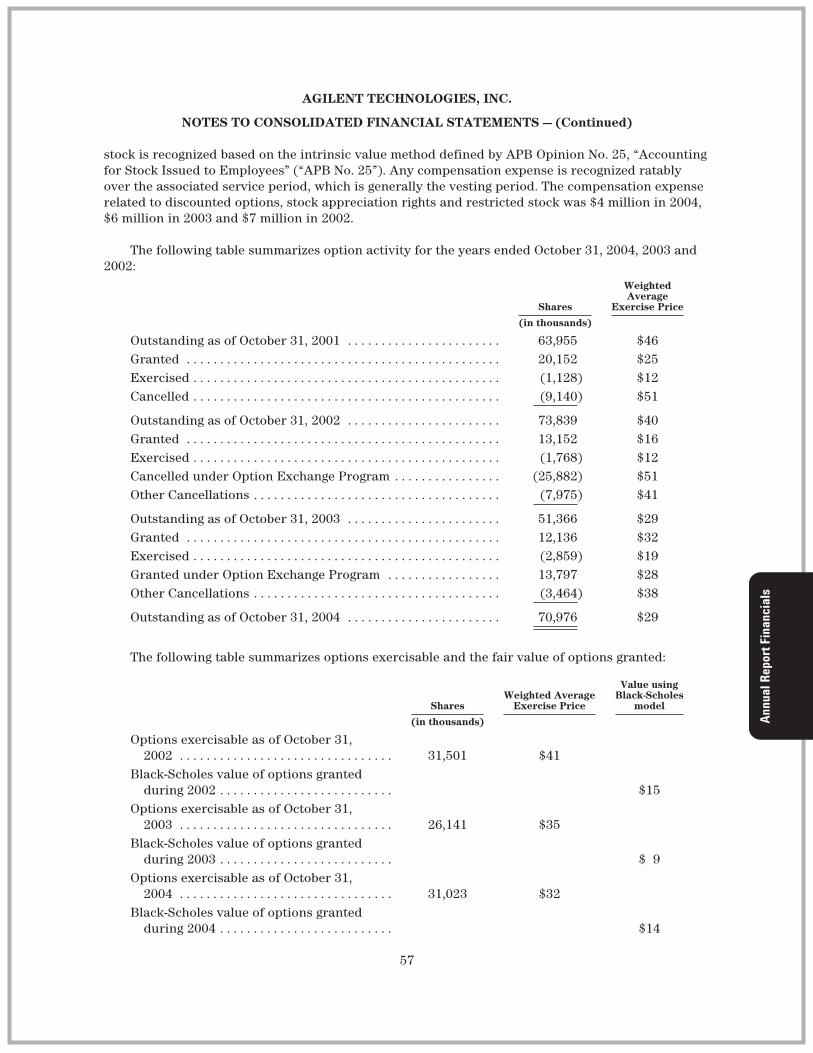
AGILENT TECHNOLOGIES, INC.
NOTES TO CONSOLIDATED FINANCIAL STATEMENTS — (Continued)
stock is recognized based on the intrinsic value method defined by APB Opinion No. 25, “Accountingfor Stock Issued to Employees” (“APB No. 25”). Any compensation expense is recognized ratablyover the associated service period, which is generally the vesting period. The compensation expenserelated to discounted options, stock appreciation rights and restricted stock was $4 million in 2004,$6 million in 2003 and $7 million in 2002.
The following table summarizes option activity for the years ended October 31, 2004, 2003 and2002:
Shares
WeightedAverage
Exercise Price
(in thousands)
Outstanding as of October 31, 2001 . . . . . . . . . . . . . . . . . . . . . . . 63,955 $46Granted . . . . . . . . . . . . . . . . . . . . . . . . . . . . . . . . . . . . . . . . . . . . . . . 20,152 $25Exercised . . . . . . . . . . . . . . . . . . . . . . . . . . . . . . . . . . . . . . . . . . . . . . (1,128) $12Cancelled . . . . . . . . . . . . . . . . . . . . . . . . . . . . . . . . . . . . . . . . . . . . . . (9,140) $51
Outstanding as of October 31, 2002 . . . . . . . . . . . . . . . . . . . . . . . 73,839 $40Granted . . . . . . . . . . . . . . . . . . . . . . . . . . . . . . . . . . . . . . . . . . . . . . . 13,152 $16Exercised . . . . . . . . . . . . . . . . . . . . . . . . . . . . . . . . . . . . . . . . . . . . . . (1,768) $12Cancelled under Option Exchange Program . . . . . . . . . . . . . . . . (25,882) $51Other Cancellations . . . . . . . . . . . . . . . . . . . . . . . . . . . . . . . . . . . . . (7,975) $41
Outstanding as of October 31, 2003 . . . . . . . . . . . . . . . . . . . . . . . 51,366 $29Granted . . . . . . . . . . . . . . . . . . . . . . . . . . . . . . . . . . . . . . . . . . . . . . . 12,136 $32Exercised . . . . . . . . . . . . . . . . . . . . . . . . . . . . . . . . . . . . . . . . . . . . . . (2,859) $19Granted under Option Exchange Program . . . . . . . . . . . . . . . . . 13,797 $28Other Cancellations . . . . . . . . . . . . . . . . . . . . . . . . . . . . . . . . . . . . . (3,464) $38
Outstanding as of October 31, 2004 . . . . . . . . . . . . . . . . . . . . . . . 70,976 $29
The following table summarizes options exercisable and the fair value of options granted:
SharesWeighted Average
Exercise Price
Value usingBlack-Scholes
model
(in thousands)
Options exercisable as of October 31,2002 . . . . . . . . . . . . . . . . . . . . . . . . . . . . . . . . 31,501 $41
Black-Scholes value of options grantedduring 2002 . . . . . . . . . . . . . . . . . . . . . . . . . . $15
Options exercisable as of October 31,2003 . . . . . . . . . . . . . . . . . . . . . . . . . . . . . . . . 26,141 $35
Black-Scholes value of options grantedduring 2003 . . . . . . . . . . . . . . . . . . . . . . . . . . $ 9
Options exercisable as of October 31,2004 . . . . . . . . . . . . . . . . . . . . . . . . . . . . . . . . 31,023 $32
Black-Scholes value of options grantedduring 2004 . . . . . . . . . . . . . . . . . . . . . . . . . . $14
57

AGILENT TECHNOLOGIES, INC.
NOTES TO CONSOLIDATED FINANCIAL STATEMENTS — (Continued)
The following table summarizes information about all options outstanding at October 31, 2004:
Options OutstandingOptions Exercisable
Range ofExercise Prices
NumberOutstanding
WeightedAverage
RemainingContractual
Life
WeightedAverageExercise
PriceNumber
Exercisable
WeightedAverageExercise
Price
(in thousands) (in thousands)
$ 0 – 15 . . . . . . . . . . . . . . . . . . . . 2,093 6.0 years $13 1,772 $13$15.01 – 25 . . . . . . . . . . . . . . . . . . . . 14,382 8.0 years $18 4,611 $19$25.01 – 30 . . . . . . . . . . . . . . . . . . . . 31,564 7.5 years $27 12,418 $27$30.01 – 40 . . . . . . . . . . . . . . . . . . . . 16,509 7.4 years $34 6,084 $35$40.01 – 50 . . . . . . . . . . . . . . . . . . . . 3,586 4.5 years $44 3,574 $44$50 and over . . . . . . . . . . . . . . . . . . . 2,842 5.6 years $68 2,564 $69
70,976 $29 31,023 $32
6. Net Income (Loss) Per Share
The following is a reconciliation of the numerators and denominators of the basic and dilutednet income (loss) per share computations for the periods presented below.
For the Years EndedOctober 31,
2004 2003 2002
(in millions)
Numerator:Income (loss) from continuing operations . . . . . . . . . . . . . . . $349 $(1,790) $(1,022)Loss from the sale of discontinued operations, net of
taxes . . . . . . . . . . . . . . . . . . . . . . . . . . . . . . . . . . . . . . . . . . . . . — — (10)
Income (loss) before cumulative effect of accountingchanges . . . . . . . . . . . . . . . . . . . . . . . . . . . . . . . . . . . . . . . . . . 349 (1,790) (1,032)
Cumulative effect of adopting SFAS No. 142 . . . . . . . . . . . . — (268) —
Net income (loss) . . . . . . . . . . . . . . . . . . . . . . . . . . . . . . . . . . . . $349 $(2,058) $(1,032)
Denominators:Basic weighted average shares . . . . . . . . . . . . . . . . . . . . . . . . 483 473 465Diluted weighted average shares . . . . . . . . . . . . . . . . . . . . . . . 490 473 465
Options to purchase 41 million shares of common stock at a weighted average exercise price of$35 per share were outstanding in 2004, but were not included in the computation of diluted netincome per share because the options were antidilutive for 2004. Options to purchase 51 millionshares of common stock at a weighted average exercise price of $29 per share were outstanding in2003, but were not included in the computation of diluted net loss per share because the optionswere antidilutive for 2003. The options, which expire no later than 2014, were still outstanding atthe end of 2004. Options to purchase 74 million shares of common stock at a weighted averageexercise price of $40 per share were outstanding in 2002, but were not included in the computationof diluted net loss per share because the options were antidilutive in that year.
58
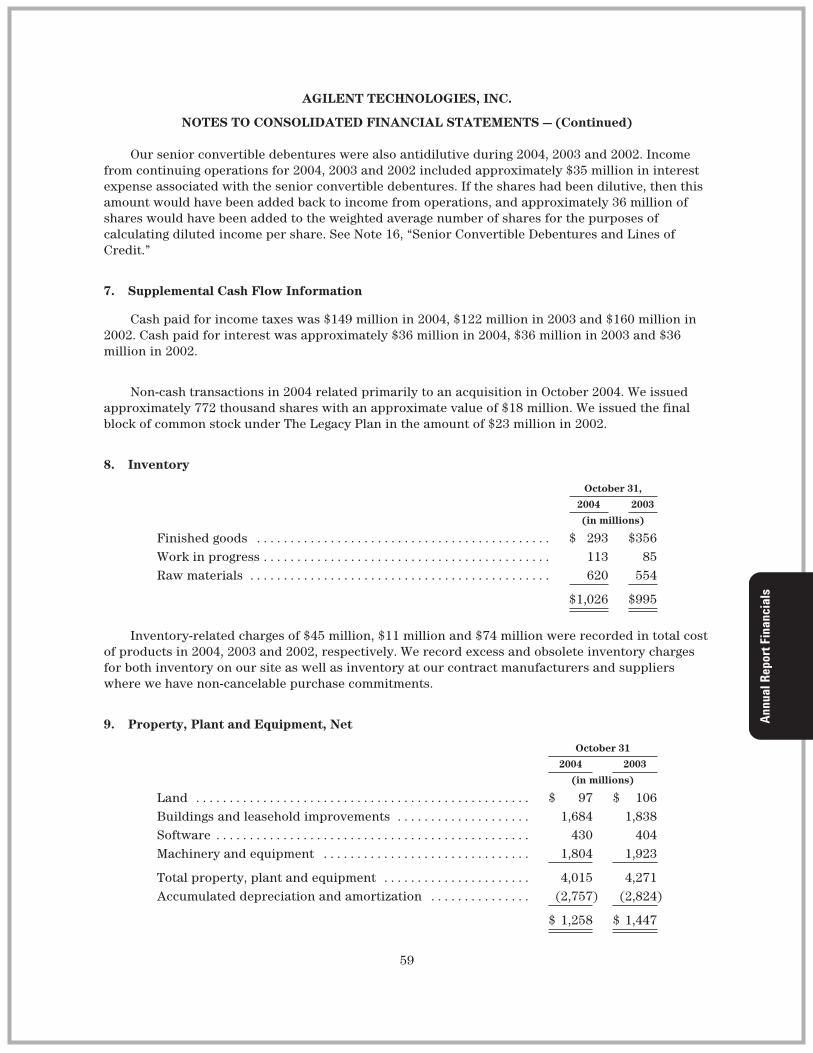
AGILENT TECHNOLOGIES, INC.
NOTES TO CONSOLIDATED FINANCIAL STATEMENTS — (Continued)
Our senior convertible debentures were also antidilutive during 2004, 2003 and 2002. Incomefrom continuing operations for 2004, 2003 and 2002 included approximately $35 million in interestexpense associated with the senior convertible debentures. If the shares had been dilutive, then thisamount would have been added back to income from operations, and approximately 36 million ofshares would have been added to the weighted average number of shares for the purposes ofcalculating diluted income per share. See Note 16, “Senior Convertible Debentures and Lines ofCredit.”
7. Supplemental Cash Flow Information
Cash paid for income taxes was $149 million in 2004, $122 million in 2003 and $160 million in2002. Cash paid for interest was approximately $36 million in 2004, $36 million in 2003 and $36million in 2002.
Non-cash transactions in 2004 related primarily to an acquisition in October 2004. We issuedapproximately 772 thousand shares with an approximate value of $18 million. We issued the finalblock of common stock under The Legacy Plan in the amount of $23 million in 2002.
8. Inventory
October 31,
2004 2003
(in millions)
Finished goods . . . . . . . . . . . . . . . . . . . . . . . . . . . . . . . . . . . . . . . . . . . . $ 293 $356Work in progress . . . . . . . . . . . . . . . . . . . . . . . . . . . . . . . . . . . . . . . . . . . 113 85Raw materials . . . . . . . . . . . . . . . . . . . . . . . . . . . . . . . . . . . . . . . . . . . . . 620 554
$1,026 $995
Inventory-related charges of $45 million, $11 million and $74 million were recorded in total costof products in 2004, 2003 and 2002, respectively. We record excess and obsolete inventory chargesfor both inventory on our site as well as inventory at our contract manufacturers and supplierswhere we have non-cancelable purchase commitments.
9. Property, Plant and Equipment, Net
October 31
2004 2003
(in millions)
Land . . . . . . . . . . . . . . . . . . . . . . . . . . . . . . . . . . . . . . . . . . . . . . . . . . $ 97 $ 106Buildings and leasehold improvements . . . . . . . . . . . . . . . . . . . . 1,684 1,838Software . . . . . . . . . . . . . . . . . . . . . . . . . . . . . . . . . . . . . . . . . . . . . . . 430 404Machinery and equipment . . . . . . . . . . . . . . . . . . . . . . . . . . . . . . . 1,804 1,923
Total property, plant and equipment . . . . . . . . . . . . . . . . . . . . . . 4,015 4,271Accumulated depreciation and amortization . . . . . . . . . . . . . . . (2,757) (2,824)
$ 1,258 $ 1,447
59
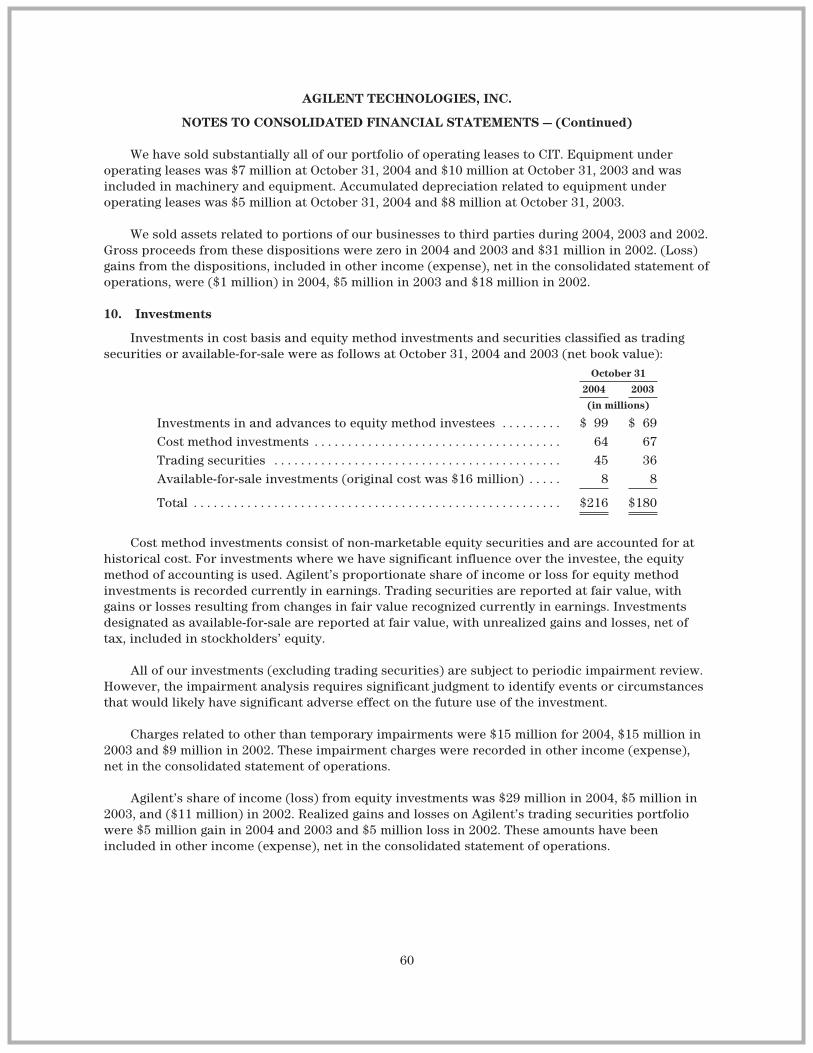
AGILENT TECHNOLOGIES, INC.
NOTES TO CONSOLIDATED FINANCIAL STATEMENTS — (Continued)
We have sold substantially all of our portfolio of operating leases to CIT. Equipment underoperating leases was $7 million at October 31, 2004 and $10 million at October 31, 2003 and wasincluded in machinery and equipment. Accumulated depreciation related to equipment underoperating leases was $5 million at October 31, 2004 and $8 million at October 31, 2003.
We sold assets related to portions of our businesses to third parties during 2004, 2003 and 2002.Gross proceeds from these dispositions were zero in 2004 and 2003 and $31 million in 2002. (Loss)gains from the dispositions, included in other income (expense), net in the consolidated statement ofoperations, were ($1 million) in 2004, $5 million in 2003 and $18 million in 2002.
10. Investments
Investments in cost basis and equity method investments and securities classified as tradingsecurities or available-for-sale were as follows at October 31, 2004 and 2003 (net book value):
October 31
2004 2003
(in millions)
Investments in and advances to equity method investees . . . . . . . . . $ 99 $ 69Cost method investments . . . . . . . . . . . . . . . . . . . . . . . . . . . . . . . . . . . . . 64 67Trading securities . . . . . . . . . . . . . . . . . . . . . . . . . . . . . . . . . . . . . . . . . . . 45 36Available-for-sale investments (original cost was $16 million) . . . . . 8 8
Total . . . . . . . . . . . . . . . . . . . . . . . . . . . . . . . . . . . . . . . . . . . . . . . . . . . . . . . $216 $180
Cost method investments consist of non-marketable equity securities and are accounted for athistorical cost. For investments where we have significant influence over the investee, the equitymethod of accounting is used. Agilent’s proportionate share of income or loss for equity methodinvestments is recorded currently in earnings. Trading securities are reported at fair value, withgains or losses resulting from changes in fair value recognized currently in earnings. Investmentsdesignated as available-for-sale are reported at fair value, with unrealized gains and losses, net oftax, included in stockholders’ equity.
All of our investments (excluding trading securities) are subject to periodic impairment review.However, the impairment analysis requires significant judgment to identify events or circumstancesthat would likely have significant adverse effect on the future use of the investment.
Charges related to other than temporary impairments were $15 million for 2004, $15 million in2003 and $9 million in 2002. These impairment charges were recorded in other income (expense),net in the consolidated statement of operations.
Agilent’s share of income (loss) from equity investments was $29 million in 2004, $5 million in2003, and ($11 million) in 2002. Realized gains and losses on Agilent’s trading securities portfoliowere $5 million gain in 2004 and 2003 and $5 million loss in 2002. These amounts have beenincluded in other income (expense), net in the consolidated statement of operations.
60

AGILENT TECHNOLOGIES, INC.
NOTES TO CONSOLIDATED FINANCIAL STATEMENTS — (Continued)
11. Goodwill and Other Intangible Assets
The goodwill balances as of October 31, 2004 and 2003 and the movements in the year endedOctober 31, 2004 for each of our reportable segments are shown in the table below:
Test andMeasurement
AutomatedTest
SemiconductorProducts
Life Sciencesand
ChemicalAnalysis Total
(in millions)
Goodwill at October 31, 2002 . . . . . . . . . . $ 434 $74 $85 $23 $ 616Adoption of SFAS No. 142 goodwill
impairment . . . . . . . . . . . . . . . . . . . . . . . (268) — — — (268)Foreign currency translation impact . . . 17 11 10 1 39Goodwill arising from acquisitions . . . . . — — 1 — 1
Goodwill at October 31, 2003 . . . . . . . . . . 183 85 96 24 388Foreign currency translation impact . . . 8 3 2 — 13Goodwill arising from acquisitions . . . . . — 5 — 16 21
Goodwill at October 31, 2004 . . . . . . . . . $ 191 $93 $98 $40 $ 422
The component parts of other intangibles as of October 31, 2004 and October 31, 2003 areshown in the table below:
Other Intangible Assets
GrossCarryingAmount
AccumulatedAmortization
Net BookValue
(in millions)
As of October 31, 2004:Purchased technology . . . . . . . . . . . . . . . . . . . . . . $143 $128 $15Customer relationships . . . . . . . . . . . . . . . . . . . . . 29 23 6
Total . . . . . . . . . . . . . . . . . . . . . . . . . . . . . . . . . . . $172 $151 $21
As of October 31, 2003:Purchased technology . . . . . . . . . . . . . . . . . . . . . . $122 $110 $12Customer relationships . . . . . . . . . . . . . . . . . . . . . 23 21 2
Total . . . . . . . . . . . . . . . . . . . . . . . . . . . . . . . . . . . $145 $131 $14
The net book value of other intangibles includes a $5 million favorable impact related tocurrency during 2004. We purchased $22 million of other intangibles during 2004, which wasprimarily related to two acquisitions. These acquisitions also resulted in additional goodwill of $21million. Pro-forma disclosures are not required for these acquisitions as they were immaterial.
Amortization for intangible assets was $20 million in 2004, $45 million in 2003 and $52 millionin 2002. Future amortization expense related to existing intangible assets is estimated to be $8million for 2005, $5 million for 2006, $3 million for 2007 and $5 million thereafter.
61
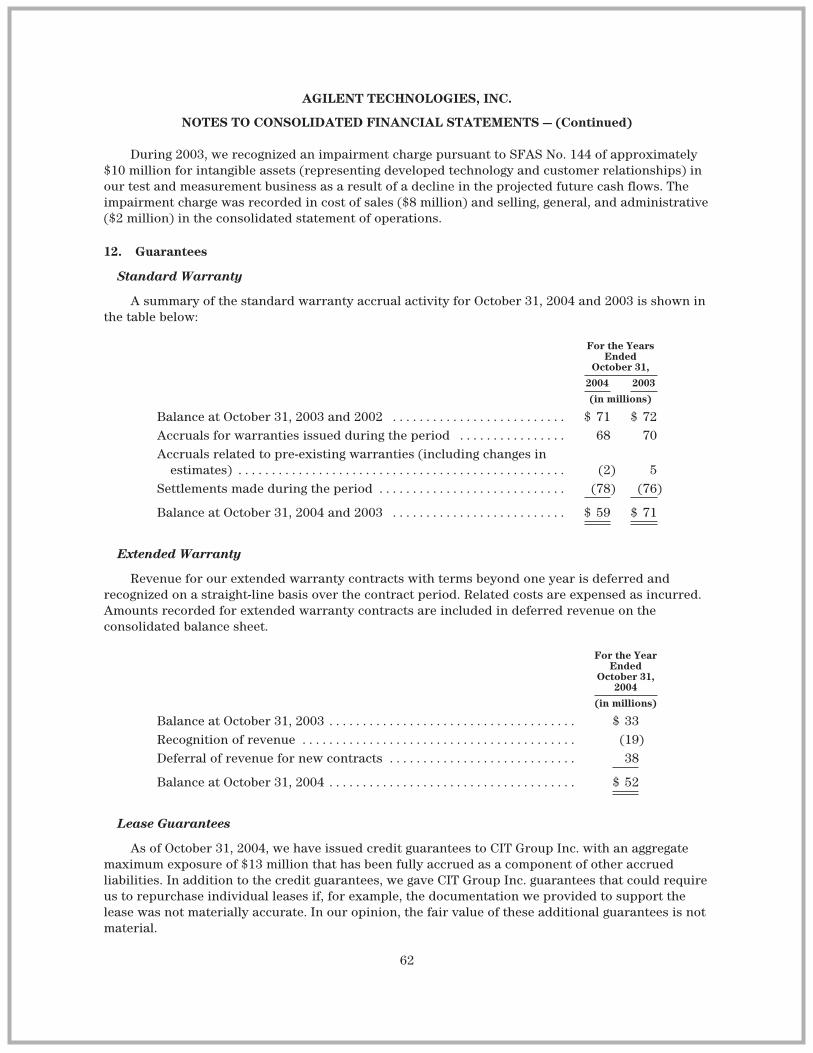
AGILENT TECHNOLOGIES, INC.
NOTES TO CONSOLIDATED FINANCIAL STATEMENTS — (Continued)
During 2003, we recognized an impairment charge pursuant to SFAS No. 144 of approximately$10 million for intangible assets (representing developed technology and customer relationships) inour test and measurement business as a result of a decline in the projected future cash flows. Theimpairment charge was recorded in cost of sales ($8 million) and selling, general, and administrative($2 million) in the consolidated statement of operations.
12. Guarantees
Standard Warranty
A summary of the standard warranty accrual activity for October 31, 2004 and 2003 is shown inthe table below:
For the YearsEnded
October 31,
2004 2003
(in millions)
Balance at October 31, 2003 and 2002 . . . . . . . . . . . . . . . . . . . . . . . . . . $ 71 $ 72Accruals for warranties issued during the period . . . . . . . . . . . . . . . . 68 70Accruals related to pre-existing warranties (including changes in
estimates) . . . . . . . . . . . . . . . . . . . . . . . . . . . . . . . . . . . . . . . . . . . . . . . . . (2) 5Settlements made during the period . . . . . . . . . . . . . . . . . . . . . . . . . . . . (78) (76)
Balance at October 31, 2004 and 2003 . . . . . . . . . . . . . . . . . . . . . . . . . . $ 59 $ 71
Extended Warranty
Revenue for our extended warranty contracts with terms beyond one year is deferred andrecognized on a straight-line basis over the contract period. Related costs are expensed as incurred.Amounts recorded for extended warranty contracts are included in deferred revenue on theconsolidated balance sheet.
For the YearEnded
October 31,2004
(in millions)
Balance at October 31, 2003 . . . . . . . . . . . . . . . . . . . . . . . . . . . . . . . . . . . . . $ 33Recognition of revenue . . . . . . . . . . . . . . . . . . . . . . . . . . . . . . . . . . . . . . . . . (19)Deferral of revenue for new contracts . . . . . . . . . . . . . . . . . . . . . . . . . . . . 38
Balance at October 31, 2004 . . . . . . . . . . . . . . . . . . . . . . . . . . . . . . . . . . . . . $ 52
Lease Guarantees
As of October 31, 2004, we have issued credit guarantees to CIT Group Inc. with an aggregatemaximum exposure of $13 million that has been fully accrued as a component of other accruedliabilities. In addition to the credit guarantees, we gave CIT Group Inc. guarantees that could requireus to repurchase individual leases if, for example, the documentation we provided to support thelease was not materially accurate. In our opinion, the fair value of these additional guarantees is notmaterial.
62
AGILENT TECHNOLOGIES, INC.
NOTES TO CONSOLIDATED FINANCIAL STATEMENTS — (Continued)
We have evaluated our relationship with the CIT Group Inc. and have determined that CIT is nota variable interest entity under FIN 46.
Indemnifications to Hewlett-Packard Company
We have given multiple indemnities to Hewlett-Packard Company in connection with ouractivities prior to our spin-off from Hewlett-Packard for the businesses that constituted Agilent priorto the spin-off. These indemnifications cover a variety of aspects of our business, including, but notlimited to, employee, tax, intellectual property and environmental matters. The agreementscontaining these indemnifications have been previously disclosed as exhibits to our registrationstatement on Form S-1 filed on August 16, 1999. In our opinion, the fair value of theseindemnifications is not material.
Indemnifications to Koninklijke Philips Electronics, N.V. (“Philips”)
In connection with the sale of our healthcare solutions business to Philips on August 1, 2001, weindemnified Philips for various matters, including product liability issues arising within two years ofthe sale agreement. In our opinion, the fair value of these indemnifications is not material.
Indemnifications to Officers and Directors
Our corporate by-laws require that we indemnify our officers and directors, as well as thosewho act as directors and officers of other entities at our request, against expenses, judgments, fines,settlements and other amounts actually and reasonably incurred in connection with any proceedingsarising out of their services to Agilent. In addition, we have entered into separate indemnificationagreements with each director and each board-appointed officer of Agilent, which provides forindemnification of these directors and officers under similar circumstances and under additionalcircumstances. The indemnification obligations are more fully described in the by-laws and theindemnification agreements. See Exhibits 3.2 and 10.6 of this document. We purchase standardinsurance to cover claims or a portion of the claims made against our directors and officers. Since amaximum obligation is not explicitly stated in our by-laws or in our indemnification agreements andwill depend on the facts and circumstances that arise out of any future claims, the overall maximumamount of the obligations cannot be reasonably estimated. Historically, we have not made paymentsrelated to these obligations, and the fair value for these obligations is zero on the consolidatedbalance sheet as of October 31, 2004.
Other Indemnifications
As is customary in our industry and as provided for in local law in the U.S. and otherjurisdictions, many of our standard contracts provide remedies to our customers and others withwhom we enter into contracts, such as defense, settlement, or payment of judgment for intellectualproperty claims related to the use of our products. From time to time, we indemnify customers, aswell as our suppliers, contractors, lessors, lessees, companies that purchase our businesses or assetsand others with whom we enter into contracts, against combinations of loss, expense, or liabilityarising from various triggering events related to the sale and the use of our products and services,the use of their goods and services, the use of facilities and state of our owned facilities, the state ofthe assets and businesses that we sell and other matters covered by such contracts, usually up to aspecified maximum amount. In addition, from time to time we also provide protection to theseparties against claims related to undiscovered liabilities, additional product liability orenvironmental obligations. In our experience, claims made under such indemnifications are rare andthe associated estimated fair value of the liability is not material.
63
AGILENT TECHNOLOGIES, INC.
NOTES TO CONSOLIDATED FINANCIAL STATEMENTS — (Continued)
13. Restructuring and Asset Impairment
Summary
We currently have three restructuring plans — one initiated in the fourth quarter of 2001 (the“2001 Plan”), a second initiated in the fourth quarter of 2002 (the “2002 Plan”), and a third initiatedin the first quarter of 2003 (the “2003 Plan”) after it became clear that the actions taken in fiscal2001 and fiscal 2002 would not be sufficient to return the company to profitability.
All of our plans were designed to reduce costs and expenses in order to return the company toprofitability. As of the end of 2004, we have reduced our workforce by approximately 16,700 people(approximately 15,100 from involuntary terminations and approximately 1,600 from net attrition) to28,000 employees.
Our plans to consolidate excess facilities resulted in charges for lease termination fees andlosses anticipated from sub-lease agreements. We have exited more than 115 production, supportand sales facilities in the U.S., Korea, Japan, U.K. and other countries, representing more than 4.6million square feet, or about 24 percent of our worldwide property. We will continue to make leasepayments on some of this space over the next five years. We lease most of these buildings from thirdparties, and the closures impacted all segments. In most cases, we are exiting administrative officebuildings, which house sales and administrative employees. However, a small number of productionfacilities were closed as a result of our plans to consolidate manufacturing into fewer sites.
Actions for all plans have been focused on segments that were impacted most severely by themarket downturn – primarily our test and measurement and semiconductor products businesses – butactions have also been taken to reduce the costs associated with support services such as finance,information technology, workplace services and to a lesser extent our other business segments. Costreductions were initiated by moving manufacturing and some of our global shared services operationssites to lower cost regions, reducing the number of properties, particularly sales and administrativesites, and by reducing our workforce through involuntary terminations and selected outsourcing ofmanufacturing and administrative functions. Our strategy is to move towards a more variableoperating cost structure.
We have executed all key actions under our 2001 Plan, although there may be changes inestimates for the consolidation of excess facilities due to changes in market conditions from thoseoriginally expected at the time the charges were recorded. Our 2002 Plan is complete. Our 2003 Planis substantially complete, although we anticipate some charges in the first half of 2005 as wecomplete the Plan.
The 2001 Plan
The 2001 plan impacted the test and measurement business and the semiconductor productsbusiness and had little direct impact on the automated test and life sciences and chemical analysisbusinesses except as the plan related to support services reductions across all of our businesses.
We have executed all key actions under this plan, however we will continue to make leasepayments over the next five years.
We continue to carry out our plan to consolidate excess facilities. During 2004 we recorded anadditional $7 million in net charges and adjustments due primarily to reductions in our estimate of
64
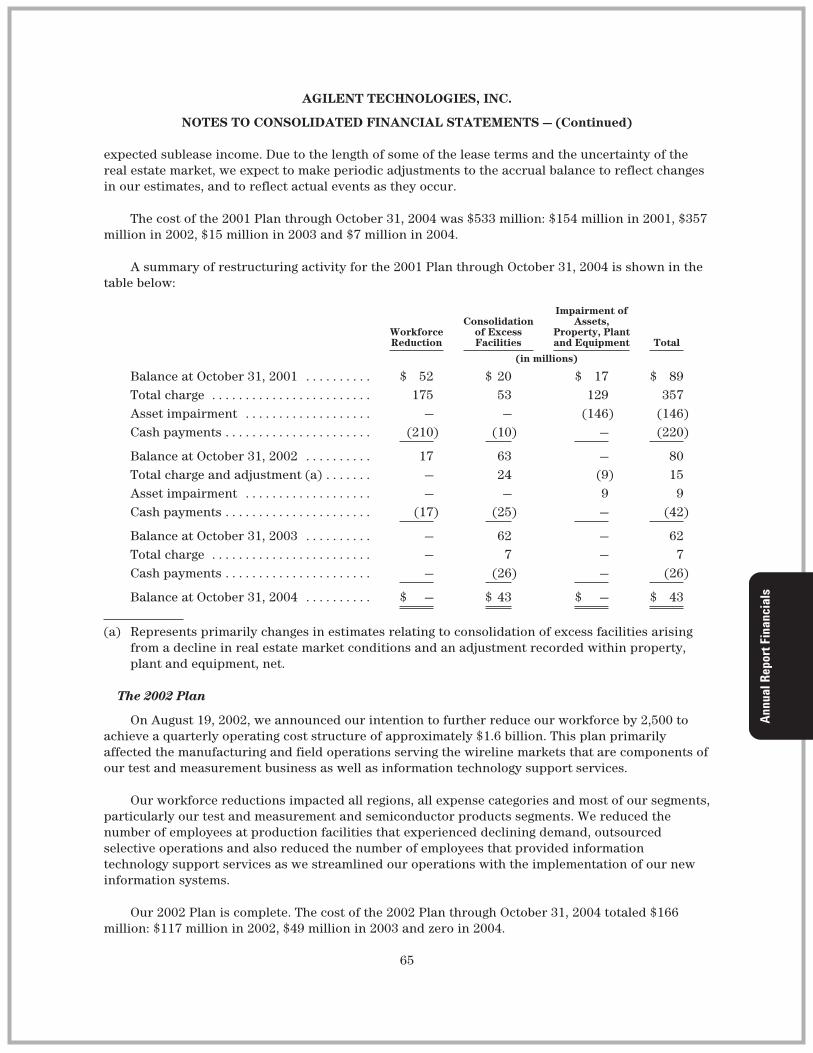
AGILENT TECHNOLOGIES, INC.
NOTES TO CONSOLIDATED FINANCIAL STATEMENTS — (Continued)
expected sublease income. Due to the length of some of the lease terms and the uncertainty of thereal estate market, we expect to make periodic adjustments to the accrual balance to reflect changesin our estimates, and to reflect actual events as they occur.
The cost of the 2001 Plan through October 31, 2004 was $533 million: $154 million in 2001, $357million in 2002, $15 million in 2003 and $7 million in 2004.
A summary of restructuring activity for the 2001 Plan through October 31, 2004 is shown in thetable below:
WorkforceReduction
Consolidationof ExcessFacilities
Impairment ofAssets,
Property, Plantand Equipment Total
(in millions)
Balance at October 31, 2001 . . . . . . . . . . $ 52 $ 20 $ 17 $ 89Total charge . . . . . . . . . . . . . . . . . . . . . . . . 175 53 129 357Asset impairment . . . . . . . . . . . . . . . . . . . — — (146) (146)Cash payments . . . . . . . . . . . . . . . . . . . . . . (210) (10) — (220)
Balance at October 31, 2002 . . . . . . . . . . 17 63 — 80Total charge and adjustment (a) . . . . . . . — 24 (9) 15Asset impairment . . . . . . . . . . . . . . . . . . . — — 9 9Cash payments . . . . . . . . . . . . . . . . . . . . . . (17) (25) — (42)
Balance at October 31, 2003 . . . . . . . . . . — 62 — 62Total charge . . . . . . . . . . . . . . . . . . . . . . . . — 7 — 7Cash payments . . . . . . . . . . . . . . . . . . . . . . — (26) — (26)
Balance at October 31, 2004 . . . . . . . . . . $ — $ 43 $ — $ 43
(a) Represents primarily changes in estimates relating to consolidation of excess facilities arisingfrom a decline in real estate market conditions and an adjustment recorded within property,plant and equipment, net.
The 2002 Plan
On August 19, 2002, we announced our intention to further reduce our workforce by 2,500 toachieve a quarterly operating cost structure of approximately $1.6 billion. This plan primarilyaffected the manufacturing and field operations serving the wireline markets that are components ofour test and measurement business as well as information technology support services.
Our workforce reductions impacted all regions, all expense categories and most of our segments,particularly our test and measurement and semiconductor products segments. We reduced thenumber of employees at production facilities that experienced declining demand, outsourcedselective operations and also reduced the number of employees that provided informationtechnology support services as we streamlined our operations with the implementation of our newinformation systems.
Our 2002 Plan is complete. The cost of the 2002 Plan through October 31, 2004 totaled $166million: $117 million in 2002, $49 million in 2003 and zero in 2004.
65
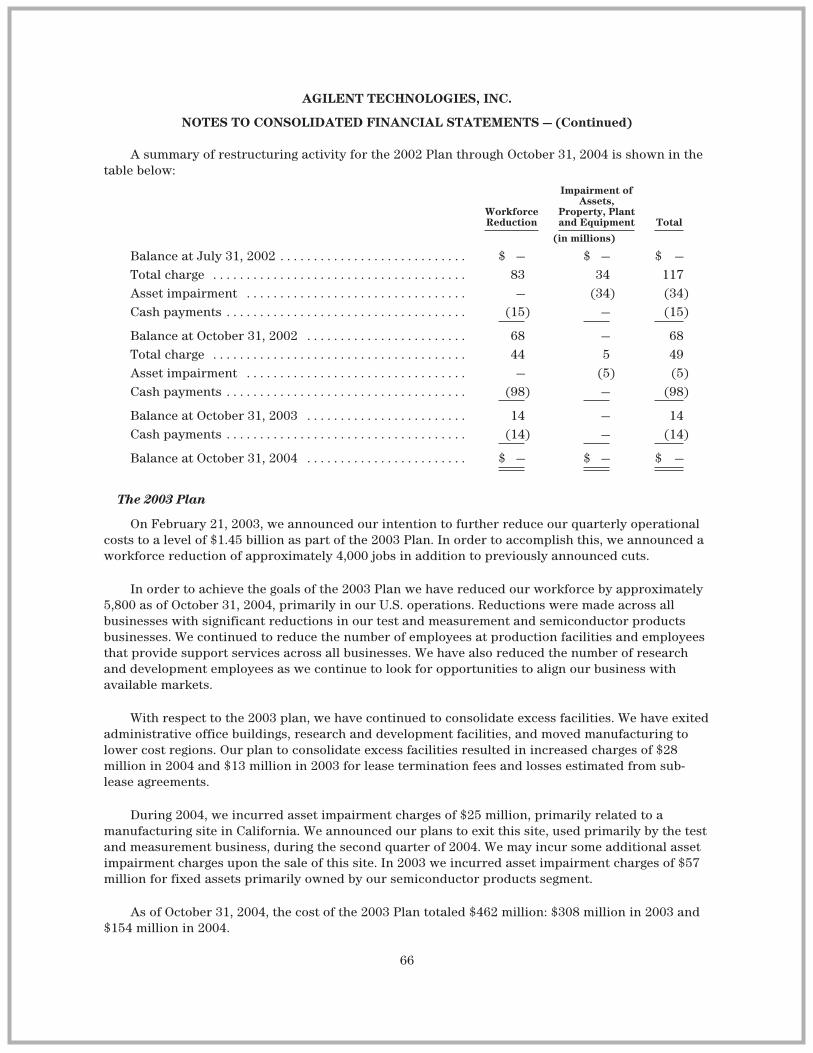
AGILENT TECHNOLOGIES, INC.
NOTES TO CONSOLIDATED FINANCIAL STATEMENTS — (Continued)
A summary of restructuring activity for the 2002 Plan through October 31, 2004 is shown in thetable below:
WorkforceReduction
Impairment ofAssets,
Property, Plantand Equipment Total
(in millions)
Balance at July 31, 2002 . . . . . . . . . . . . . . . . . . . . . . . . . . . . $ — $ — $ —Total charge . . . . . . . . . . . . . . . . . . . . . . . . . . . . . . . . . . . . . . 83 34 117Asset impairment . . . . . . . . . . . . . . . . . . . . . . . . . . . . . . . . . — (34) (34)Cash payments . . . . . . . . . . . . . . . . . . . . . . . . . . . . . . . . . . . . (15) — (15)
Balance at October 31, 2002 . . . . . . . . . . . . . . . . . . . . . . . . 68 — 68Total charge . . . . . . . . . . . . . . . . . . . . . . . . . . . . . . . . . . . . . . 44 5 49Asset impairment . . . . . . . . . . . . . . . . . . . . . . . . . . . . . . . . . — (5) (5)Cash payments . . . . . . . . . . . . . . . . . . . . . . . . . . . . . . . . . . . . (98) — (98)
Balance at October 31, 2003 . . . . . . . . . . . . . . . . . . . . . . . . 14 — 14Cash payments . . . . . . . . . . . . . . . . . . . . . . . . . . . . . . . . . . . . (14) — (14)
Balance at October 31, 2004 . . . . . . . . . . . . . . . . . . . . . . . . $ — $ — $ —
The 2003 Plan
On February 21, 2003, we announced our intention to further reduce our quarterly operationalcosts to a level of $1.45 billion as part of the 2003 Plan. In order to accomplish this, we announced aworkforce reduction of approximately 4,000 jobs in addition to previously announced cuts.
In order to achieve the goals of the 2003 Plan we have reduced our workforce by approximately5,800 as of October 31, 2004, primarily in our U.S. operations. Reductions were made across allbusinesses with significant reductions in our test and measurement and semiconductor productsbusinesses. We continued to reduce the number of employees at production facilities and employeesthat provide support services across all businesses. We have also reduced the number of researchand development employees as we continue to look for opportunities to align our business withavailable markets.
With respect to the 2003 plan, we have continued to consolidate excess facilities. We have exitedadministrative office buildings, research and development facilities, and moved manufacturing tolower cost regions. Our plan to consolidate excess facilities resulted in increased charges of $28million in 2004 and $13 million in 2003 for lease termination fees and losses estimated from sub-lease agreements.
During 2004, we incurred asset impairment charges of $25 million, primarily related to amanufacturing site in California. We announced our plans to exit this site, used primarily by the testand measurement business, during the second quarter of 2004. We may incur some additional assetimpairment charges upon the sale of this site. In 2003 we incurred asset impairment charges of $57million for fixed assets primarily owned by our semiconductor products segment.
As of October 31, 2004, the cost of the 2003 Plan totaled $462 million: $308 million in 2003 and$154 million in 2004.
66
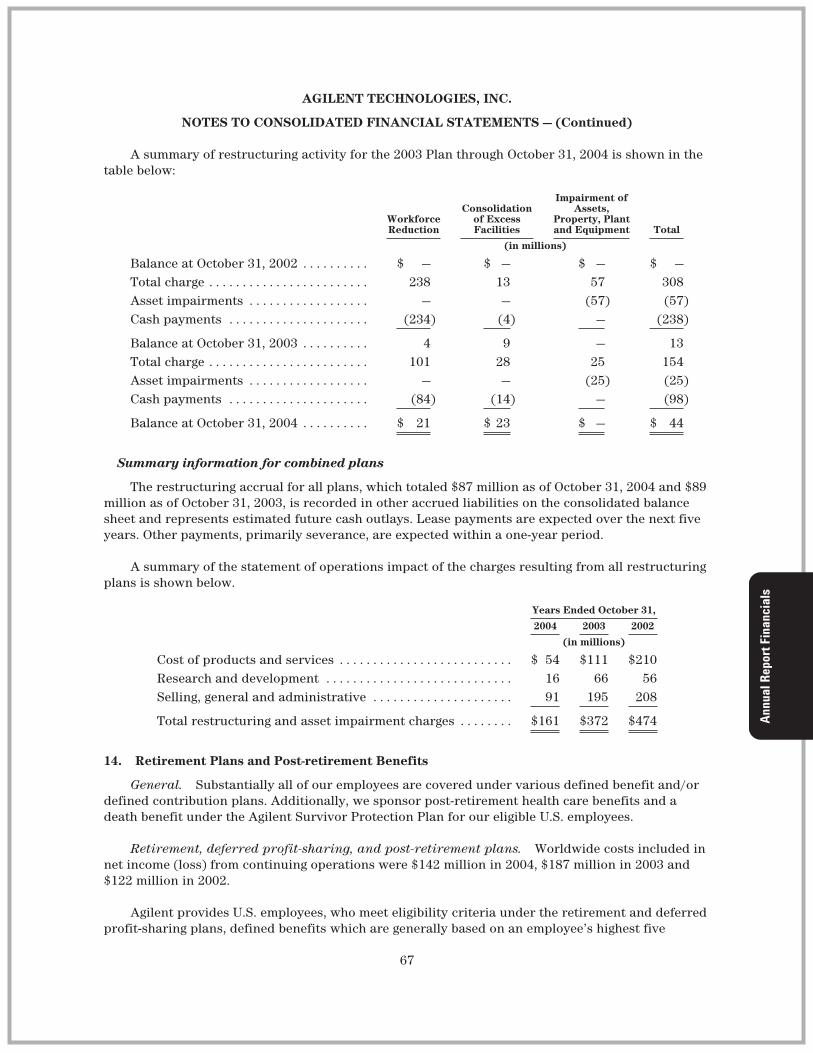
AGILENT TECHNOLOGIES, INC.
NOTES TO CONSOLIDATED FINANCIAL STATEMENTS — (Continued)
A summary of restructuring activity for the 2003 Plan through October 31, 2004 is shown in thetable below:
WorkforceReduction
Consolidationof ExcessFacilities
Impairment ofAssets,
Property, Plantand Equipment Total
(in millions)
Balance at October 31, 2002 . . . . . . . . . . $ — $ — $ — $ —Total charge . . . . . . . . . . . . . . . . . . . . . . . . 238 13 57 308Asset impairments . . . . . . . . . . . . . . . . . . — — (57) (57)Cash payments . . . . . . . . . . . . . . . . . . . . . (234) (4) — (238)
Balance at October 31, 2003 . . . . . . . . . . 4 9 — 13Total charge . . . . . . . . . . . . . . . . . . . . . . . . 101 28 25 154Asset impairments . . . . . . . . . . . . . . . . . . — — (25) (25)Cash payments . . . . . . . . . . . . . . . . . . . . . (84) (14) — (98)
Balance at October 31, 2004 . . . . . . . . . . $ 21 $ 23 $ — $ 44
Summary information for combined plans
The restructuring accrual for all plans, which totaled $87 million as of October 31, 2004 and $89million as of October 31, 2003, is recorded in other accrued liabilities on the consolidated balancesheet and represents estimated future cash outlays. Lease payments are expected over the next fiveyears. Other payments, primarily severance, are expected within a one-year period.
A summary of the statement of operations impact of the charges resulting from all restructuringplans is shown below.
Years Ended October 31,
2004 2003 2002
(in millions)
Cost of products and services . . . . . . . . . . . . . . . . . . . . . . . . . . $ 54 $111 $210Research and development . . . . . . . . . . . . . . . . . . . . . . . . . . . . 16 66 56Selling, general and administrative . . . . . . . . . . . . . . . . . . . . . 91 195 208
Total restructuring and asset impairment charges . . . . . . . . $161 $372 $474
14. Retirement Plans and Post-retirement Benefits
General. Substantially all of our employees are covered under various defined benefit and/ordefined contribution plans. Additionally, we sponsor post-retirement health care benefits and adeath benefit under the Agilent Survivor Protection Plan for our eligible U.S. employees.
Retirement, deferred profit-sharing, and post-retirement plans. Worldwide costs included innet income (loss) from continuing operations were $142 million in 2004, $187 million in 2003 and$122 million in 2002.
Agilent provides U.S. employees, who meet eligibility criteria under the retirement and deferredprofit-sharing plans, defined benefits which are generally based on an employee’s highest five
67
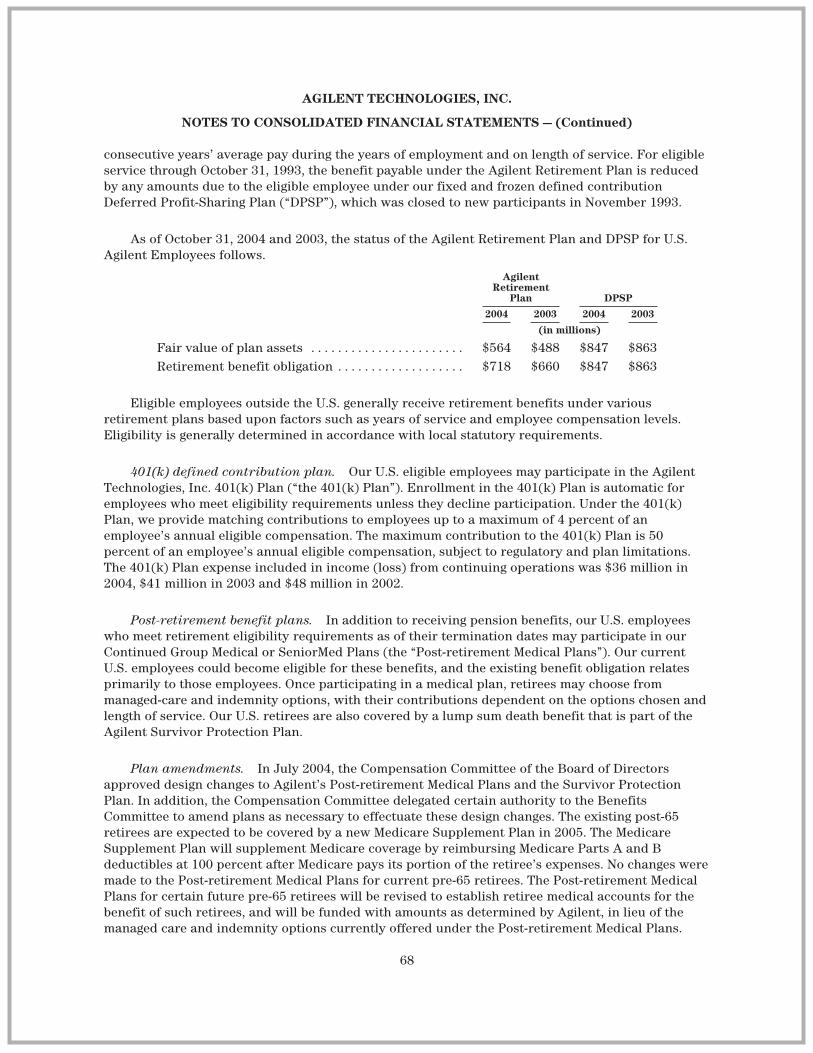
AGILENT TECHNOLOGIES, INC.
NOTES TO CONSOLIDATED FINANCIAL STATEMENTS — (Continued)
consecutive years’ average pay during the years of employment and on length of service. For eligibleservice through October 31, 1993, the benefit payable under the Agilent Retirement Plan is reducedby any amounts due to the eligible employee under our fixed and frozen defined contributionDeferred Profit-Sharing Plan (“DPSP”), which was closed to new participants in November 1993.
As of October 31, 2004 and 2003, the status of the Agilent Retirement Plan and DPSP for U.S.Agilent Employees follows.
AgilentRetirement
Plan DPSP
2004 2003 2004 2003
(in millions)
Fair value of plan assets . . . . . . . . . . . . . . . . . . . . . . . $564 $488 $847 $863Retirement benefit obligation . . . . . . . . . . . . . . . . . . . $718 $660 $847 $863
Eligible employees outside the U.S. generally receive retirement benefits under variousretirement plans based upon factors such as years of service and employee compensation levels.Eligibility is generally determined in accordance with local statutory requirements.
401(k) defined contribution plan. Our U.S. eligible employees may participate in the AgilentTechnologies, Inc. 401(k) Plan (“the 401(k) Plan”). Enrollment in the 401(k) Plan is automatic foremployees who meet eligibility requirements unless they decline participation. Under the 401(k)Plan, we provide matching contributions to employees up to a maximum of 4 percent of anemployee’s annual eligible compensation. The maximum contribution to the 401(k) Plan is 50percent of an employee’s annual eligible compensation, subject to regulatory and plan limitations.The 401(k) Plan expense included in income (loss) from continuing operations was $36 million in2004, $41 million in 2003 and $48 million in 2002.
Post-retirement benefit plans. In addition to receiving pension benefits, our U.S. employeeswho meet retirement eligibility requirements as of their termination dates may participate in ourContinued Group Medical or SeniorMed Plans (the “Post-retirement Medical Plans”). Our currentU.S. employees could become eligible for these benefits, and the existing benefit obligation relatesprimarily to those employees. Once participating in a medical plan, retirees may choose frommanaged-care and indemnity options, with their contributions dependent on the options chosen andlength of service. Our U.S. retirees are also covered by a lump sum death benefit that is part of theAgilent Survivor Protection Plan.
Plan amendments. In July 2004, the Compensation Committee of the Board of Directorsapproved design changes to Agilent’s Post-retirement Medical Plans and the Survivor ProtectionPlan. In addition, the Compensation Committee delegated certain authority to the BenefitsCommittee to amend plans as necessary to effectuate these design changes. The existing post-65retirees are expected to be covered by a new Medicare Supplement Plan in 2005. The MedicareSupplement Plan will supplement Medicare coverage by reimbursing Medicare Parts A and Bdeductibles at 100 percent after Medicare pays its portion of the retiree’s expenses. No changes weremade to the Post-retirement Medical Plans for current pre-65 retirees. The Post-retirement MedicalPlans for certain future pre-65 retirees will be revised to establish retiree medical accounts for thebenefit of such retirees, and will be funded with amounts as determined by Agilent, in lieu of themanaged care and indemnity options currently offered under the Post-retirement Medical Plans.
68
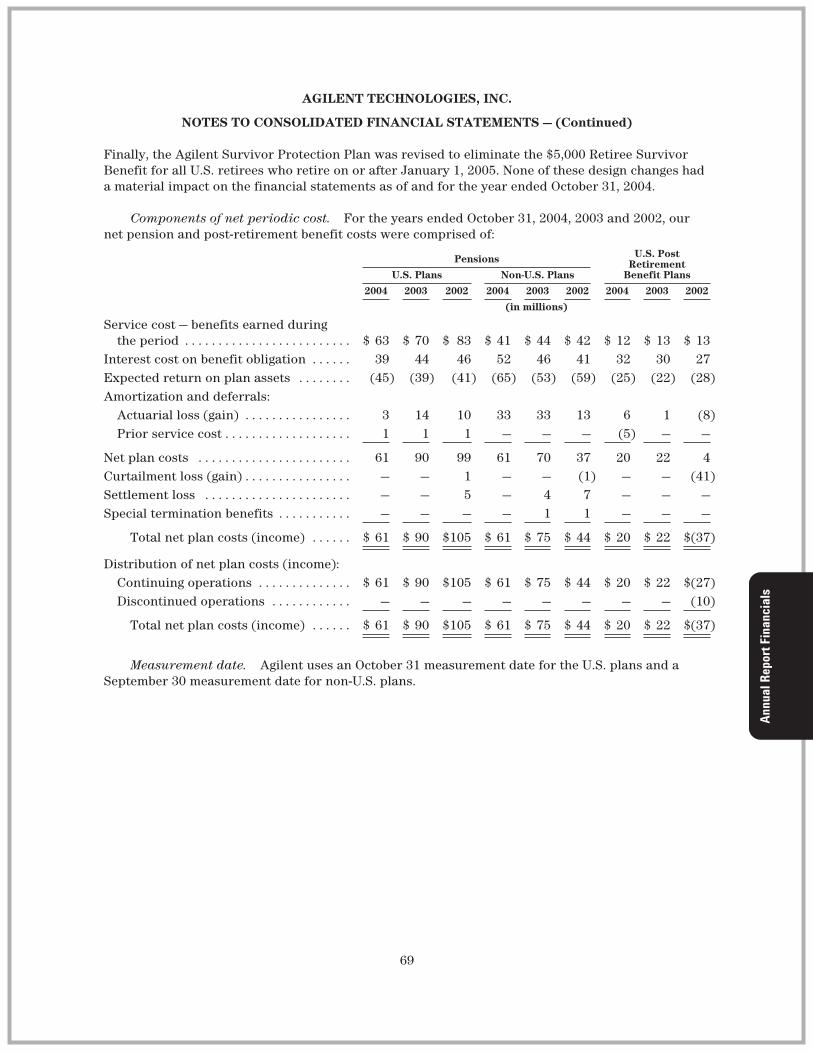
AGILENT TECHNOLOGIES, INC.
NOTES TO CONSOLIDATED FINANCIAL STATEMENTS — (Continued)
Finally, the Agilent Survivor Protection Plan was revised to eliminate the $5,000 Retiree SurvivorBenefit for all U.S. retirees who retire on or after January 1, 2005. None of these design changes hada material impact on the financial statements as of and for the year ended October 31, 2004.
Components of net periodic cost. For the years ended October 31, 2004, 2003 and 2002, ournet pension and post-retirement benefit costs were comprised of:
Pensions U.S. PostRetirement
Benefit PlansU.S. Plans Non-U.S. Plans
2004 2003 2002 2004 2003 2002 2004 2003 2002
(in millions)
Service cost — benefits earned duringthe period . . . . . . . . . . . . . . . . . . . . . . . . . $ 63 $ 70 $ 83 $ 41 $ 44 $ 42 $ 12 $ 13 $ 13
Interest cost on benefit obligation . . . . . . 39 44 46 52 46 41 32 30 27Expected return on plan assets . . . . . . . . (45) (39) (41) (65) (53) (59) (25) (22) (28)Amortization and deferrals:
Actuarial loss (gain) . . . . . . . . . . . . . . . . 3 14 10 33 33 13 6 1 (8)Prior service cost . . . . . . . . . . . . . . . . . . . 1 1 1 — — — (5) — —
Net plan costs . . . . . . . . . . . . . . . . . . . . . . . 61 90 99 61 70 37 20 22 4Curtailment loss (gain) . . . . . . . . . . . . . . . . — — 1 — — (1) — — (41)Settlement loss . . . . . . . . . . . . . . . . . . . . . . — — 5 — 4 7 — — —Special termination benefits . . . . . . . . . . . — — — — 1 1 — — —
Total net plan costs (income) . . . . . . $ 61 $ 90 $105 $ 61 $ 75 $ 44 $ 20 $ 22 $(37)
Distribution of net plan costs (income):Continuing operations . . . . . . . . . . . . . . $ 61 $ 90 $105 $ 61 $ 75 $ 44 $ 20 $ 22 $(27)Discontinued operations . . . . . . . . . . . . — — — — — — — — (10)
Total net plan costs (income) . . . . . . $ 61 $ 90 $105 $ 61 $ 75 $ 44 $ 20 $ 22 $(37)
Measurement date. Agilent uses an October 31 measurement date for the U.S. plans and aSeptember 30 measurement date for non-U.S. plans.
69
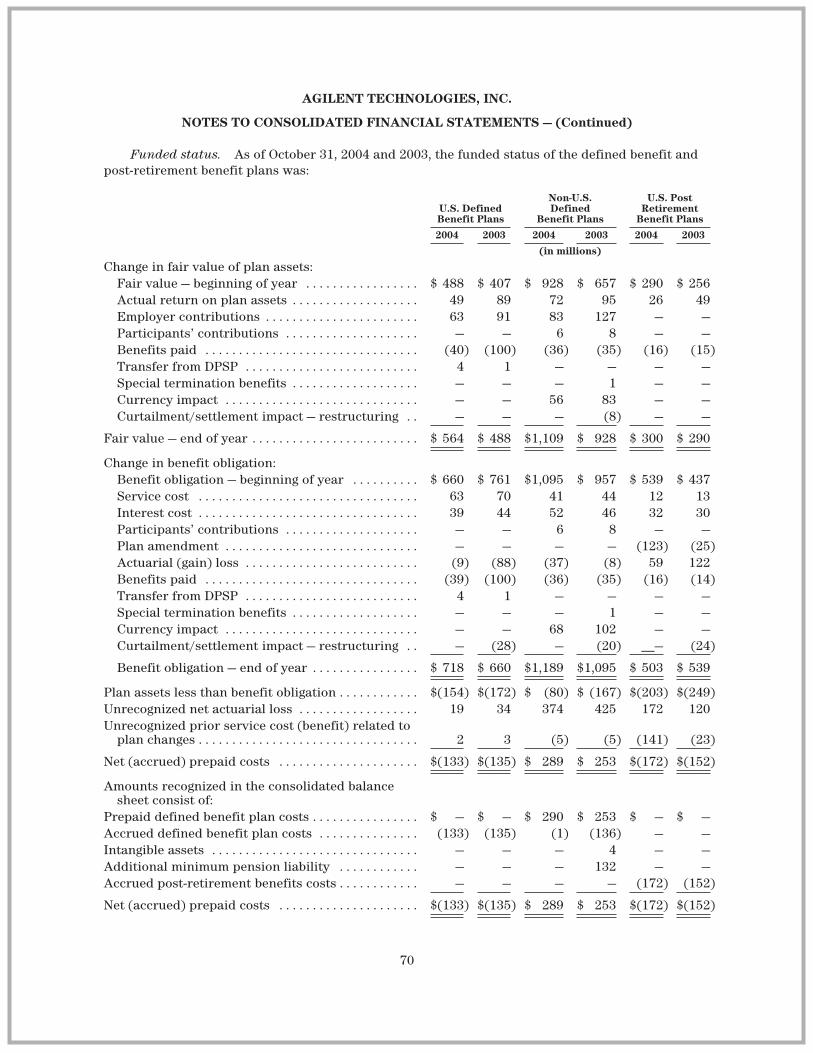
AGILENT TECHNOLOGIES, INC.
NOTES TO CONSOLIDATED FINANCIAL STATEMENTS — (Continued)
Funded status. As of October 31, 2004 and 2003, the funded status of the defined benefit andpost-retirement benefit plans was:
U.S. DefinedBenefit Plans
Non-U.S.Defined
Benefit Plans
U.S. PostRetirement
Benefit Plans
2004 2003 2004 2003 2004 2003
(in millions)
Change in fair value of plan assets:Fair value — beginning of year . . . . . . . . . . . . . . . . . $ 488 $ 407 $ 928 $ 657 $ 290 $ 256Actual return on plan assets . . . . . . . . . . . . . . . . . . . 49 89 72 95 26 49Employer contributions . . . . . . . . . . . . . . . . . . . . . . . 63 91 83 127 — —Participants’ contributions . . . . . . . . . . . . . . . . . . . . — — 6 8 — —Benefits paid . . . . . . . . . . . . . . . . . . . . . . . . . . . . . . . . (40) (100) (36) (35) (16) (15)Transfer from DPSP . . . . . . . . . . . . . . . . . . . . . . . . . . 4 1 — — — —Special termination benefits . . . . . . . . . . . . . . . . . . . — — — 1 — —Currency impact . . . . . . . . . . . . . . . . . . . . . . . . . . . . . — — 56 83 — —Curtailment/settlement impact — restructuring . . — — — (8) — —
Fair value — end of year . . . . . . . . . . . . . . . . . . . . . . . . . $ 564 $ 488 $1,109 $ 928 $ 300 $ 290
Change in benefit obligation:Benefit obligation — beginning of year . . . . . . . . . . $ 660 $ 761 $1,095 $ 957 $ 539 $ 437Service cost . . . . . . . . . . . . . . . . . . . . . . . . . . . . . . . . . 63 70 41 44 12 13Interest cost . . . . . . . . . . . . . . . . . . . . . . . . . . . . . . . . . 39 44 52 46 32 30Participants’ contributions . . . . . . . . . . . . . . . . . . . . — — 6 8 — —Plan amendment . . . . . . . . . . . . . . . . . . . . . . . . . . . . . — — — — (123) (25)Actuarial (gain) loss . . . . . . . . . . . . . . . . . . . . . . . . . . (9) (88) (37) (8) 59 122Benefits paid . . . . . . . . . . . . . . . . . . . . . . . . . . . . . . . . (39) (100) (36) (35) (16) (14)Transfer from DPSP . . . . . . . . . . . . . . . . . . . . . . . . . . 4 1 — — — —Special termination benefits . . . . . . . . . . . . . . . . . . . — — — 1 — —Currency impact . . . . . . . . . . . . . . . . . . . . . . . . . . . . . — — 68 102 — —Curtailment/settlement impact — restructuring . . — (28) — (20) __— (24)
Benefit obligation — end of year . . . . . . . . . . . . . . . . $ 718 $ 660 $1,189 $1,095 $ 503 $ 539
Plan assets less than benefit obligation . . . . . . . . . . . . $(154) $(172) $ (80) $ (167) $(203) $(249)Unrecognized net actuarial loss . . . . . . . . . . . . . . . . . . 19 34 374 425 172 120Unrecognized prior service cost (benefit) related to
plan changes . . . . . . . . . . . . . . . . . . . . . . . . . . . . . . . . . 2 3 (5) (5) (141) (23)
Net (accrued) prepaid costs . . . . . . . . . . . . . . . . . . . . . $(133) $(135) $ 289 $ 253 $(172) $(152)
Amounts recognized in the consolidated balancesheet consist of:
Prepaid defined benefit plan costs . . . . . . . . . . . . . . . . $ — $ — $ 290 $ 253 $ — $ —Accrued defined benefit plan costs . . . . . . . . . . . . . . . (133) (135) (1) (136) — —Intangible assets . . . . . . . . . . . . . . . . . . . . . . . . . . . . . . . — — — 4 — —Additional minimum pension liability . . . . . . . . . . . . — — — 132 — —Accrued post-retirement benefits costs . . . . . . . . . . . . — — — — (172) (152)
Net (accrued) prepaid costs . . . . . . . . . . . . . . . . . . . . . $(133) $(135) $ 289 $ 253 $(172) $(152)
70

AGILENT TECHNOLOGIES, INC.
NOTES TO CONSOLIDATED FINANCIAL STATEMENTS — (Continued)
Investment policies and strategies. Plan assets consist primarily of listed stocks and bonds. Inthe U.S. our Agilent Retirement Plan and post-retirement benefit assets are allocated approximately80 percent to equities and approximately 20 percent to fixed income investments. Our DPSP assetsare allocated approximately 60 percent to equities and approximately 40 percent to fixed incomeinvestments. Approximately 10 percent of our U.S. equity portfolio consists of alternativeinvestments consisting largely of private equity partnerships. We desire to obtain the optimum rateof investment return on the total investment portfolio consistent with the assumption of areasonable level of risk. The safety and protection of principal is a primary concern and we believethat a well-diversified investment portfolio will result in the highest attainable investment return(income plus capital appreciation) with the lowest overall risk. Specific investment objectives for theplans are: maintain and enhance the purchasing power of the plans’ assets; achieve investmentreturns consistent with the level of risk being taken; and earn performance rates of return inaccordance with the benchmarks adopted for each asset class. Outside the U.S., our assets areallocated between 50-75 percent to equities and 25-50 percent to fixed income investmentsdepending on the plan. All plans’ assets are broadly diversified.
As of October 31, 2004 and October 31, 2003, our defined benefit plans in aggregate hadprojected benefit obligations (“PBO”) that were in excess of the fair value of the plan assets. Theamounts of the obligations and assets for the plans were:
U.S. DefinedBenefit PlansOctober 31,
Non-U.S.Defined
Benefit PlansOctober 31,
2004 2003 2004 2003
(in millions)
Aggregate projected benefit obligation (“PBO”) . . . . . $(718) $(660) $(1,189) $(1,095)Aggregate accumulated benefit obligation (“ABO”) . . $(481) $(422) $(1,009) $ (924)Aggregate fair value of plan assets . . . . . . . . . . . . . . . . $ 564 $ 488 $ 1,109 $ 928
Contributions and estimated future benefit payments. During fiscal year 2005, we expect tocontribute $40 million to the Agilent Retirement Plan, $44 million to plans outside the U.S., and zeroto the Post-retirement Medical Plans. We expect to pay the following benefit payments, whichinclude expected future service.
U.S. DefinedBenefit Plans
Non-U.S.Defined
Benefit Plans
U.S. PostRetirement
BenefitPlans
(in millions)
2005 . . . . . . . . . . . . . . . . . . . . . . . . . . . . . . . . $ 37 $ 23 $ 182006 . . . . . . . . . . . . . . . . . . . . . . . . . . . . . . . . $ 54 $ 26 $ 202007 . . . . . . . . . . . . . . . . . . . . . . . . . . . . . . . . $ 54 $ 29 $ 222008 . . . . . . . . . . . . . . . . . . . . . . . . . . . . . . . . $ 59 $ 33 $ 242009 . . . . . . . . . . . . . . . . . . . . . . . . . . . . . . . . $ 65 $ 37 $ 262010-2014 . . . . . . . . . . . . . . . . . . . . . . . . . . . $368 $257 $158
No additional minimum pension liability was required for 2004 due to improved investmentperformance and employer contributions. For 2003, an additional minimum pension liabilityadjustment was required for our pension plans in Germany, Japan and the United Kingdom as the
71
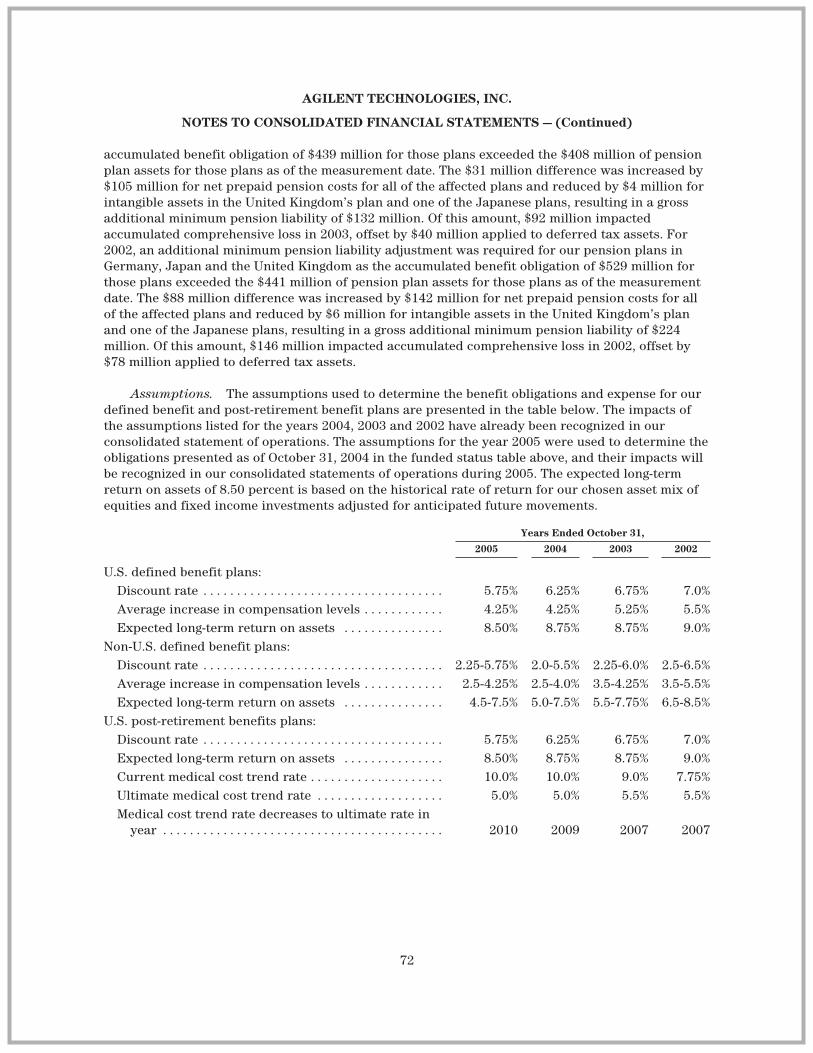
AGILENT TECHNOLOGIES, INC.
NOTES TO CONSOLIDATED FINANCIAL STATEMENTS — (Continued)
accumulated benefit obligation of $439 million for those plans exceeded the $408 million of pensionplan assets for those plans as of the measurement date. The $31 million difference was increased by$105 million for net prepaid pension costs for all of the affected plans and reduced by $4 million forintangible assets in the United Kingdom’s plan and one of the Japanese plans, resulting in a grossadditional minimum pension liability of $132 million. Of this amount, $92 million impactedaccumulated comprehensive loss in 2003, offset by $40 million applied to deferred tax assets. For2002, an additional minimum pension liability adjustment was required for our pension plans inGermany, Japan and the United Kingdom as the accumulated benefit obligation of $529 million forthose plans exceeded the $441 million of pension plan assets for those plans as of the measurementdate. The $88 million difference was increased by $142 million for net prepaid pension costs for allof the affected plans and reduced by $6 million for intangible assets in the United Kingdom’s planand one of the Japanese plans, resulting in a gross additional minimum pension liability of $224million. Of this amount, $146 million impacted accumulated comprehensive loss in 2002, offset by$78 million applied to deferred tax assets.
Assumptions. The assumptions used to determine the benefit obligations and expense for ourdefined benefit and post-retirement benefit plans are presented in the table below. The impacts ofthe assumptions listed for the years 2004, 2003 and 2002 have already been recognized in ourconsolidated statement of operations. The assumptions for the year 2005 were used to determine theobligations presented as of October 31, 2004 in the funded status table above, and their impacts willbe recognized in our consolidated statements of operations during 2005. The expected long-termreturn on assets of 8.50 percent is based on the historical rate of return for our chosen asset mix ofequities and fixed income investments adjusted for anticipated future movements.
Years Ended October 31,
2005 2004 2003 2002
U.S. defined benefit plans:Discount rate . . . . . . . . . . . . . . . . . . . . . . . . . . . . . . . . . . . . 5.75% 6.25% 6.75% 7.0%Average increase in compensation levels . . . . . . . . . . . . 4.25% 4.25% 5.25% 5.5%Expected long-term return on assets . . . . . . . . . . . . . . . 8.50% 8.75% 8.75% 9.0%
Non-U.S. defined benefit plans:Discount rate . . . . . . . . . . . . . . . . . . . . . . . . . . . . . . . . . . . . 2.25-5.75% 2.0-5.5% 2.25-6.0% 2.5-6.5%Average increase in compensation levels . . . . . . . . . . . . 2.5-4.25% 2.5-4.0% 3.5-4.25% 3.5-5.5%Expected long-term return on assets . . . . . . . . . . . . . . . 4.5-7.5% 5.0-7.5% 5.5-7.75% 6.5-8.5%
U.S. post-retirement benefits plans:Discount rate . . . . . . . . . . . . . . . . . . . . . . . . . . . . . . . . . . . . 5.75% 6.25% 6.75% 7.0%Expected long-term return on assets . . . . . . . . . . . . . . . 8.50% 8.75% 8.75% 9.0%Current medical cost trend rate . . . . . . . . . . . . . . . . . . . . 10.0% 10.0% 9.0% 7.75%Ultimate medical cost trend rate . . . . . . . . . . . . . . . . . . . 5.0% 5.0% 5.5% 5.5%Medical cost trend rate decreases to ultimate rate in
year . . . . . . . . . . . . . . . . . . . . . . . . . . . . . . . . . . . . . . . . . . 2010 2009 2007 2007
72
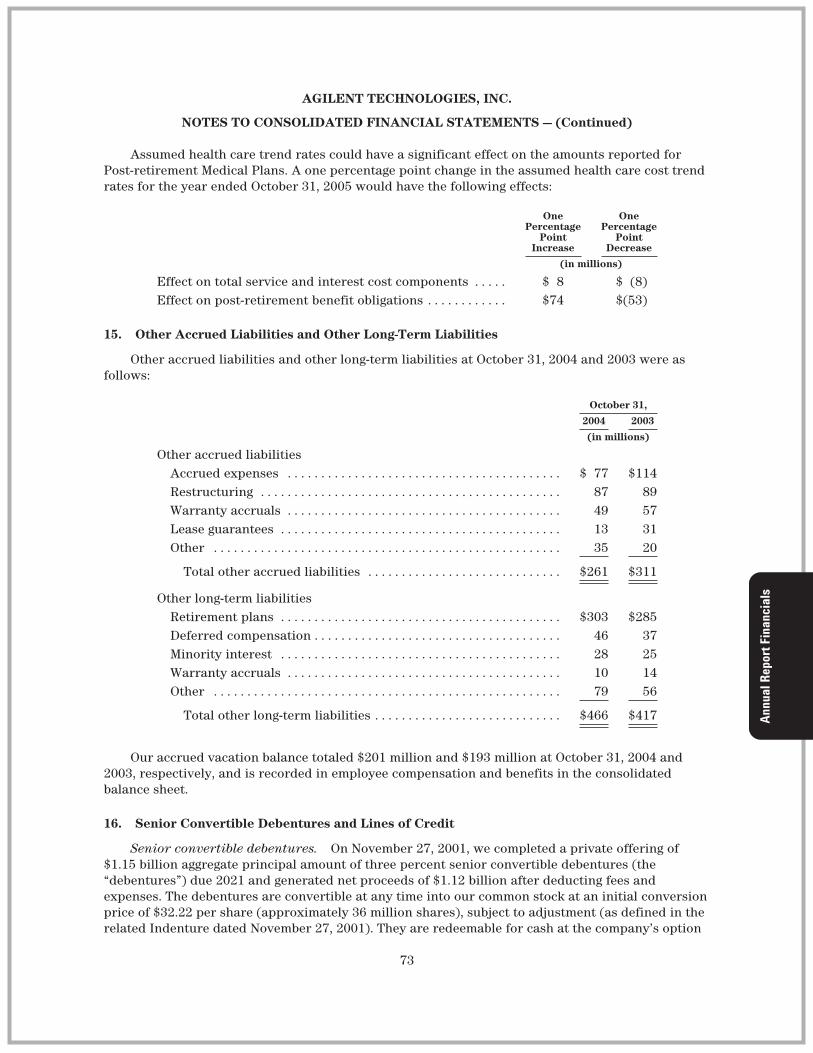
AGILENT TECHNOLOGIES, INC.
NOTES TO CONSOLIDATED FINANCIAL STATEMENTS — (Continued)
Assumed health care trend rates could have a significant effect on the amounts reported forPost-retirement Medical Plans. A one percentage point change in the assumed health care cost trendrates for the year ended October 31, 2005 would have the following effects:
OnePercentage
PointIncrease
OnePercentage
PointDecrease
(in millions)
Effect on total service and interest cost components . . . . . $ 8 $ (8)Effect on post-retirement benefit obligations . . . . . . . . . . . . $74 $(53)
15. Other Accrued Liabilities and Other Long-Term Liabilities
Other accrued liabilities and other long-term liabilities at October 31, 2004 and 2003 were asfollows:
October 31,
2004 2003
(in millions)
Other accrued liabilitiesAccrued expenses . . . . . . . . . . . . . . . . . . . . . . . . . . . . . . . . . . . . . . . . . $ 77 $114Restructuring . . . . . . . . . . . . . . . . . . . . . . . . . . . . . . . . . . . . . . . . . . . . . 87 89Warranty accruals . . . . . . . . . . . . . . . . . . . . . . . . . . . . . . . . . . . . . . . . . 49 57Lease guarantees . . . . . . . . . . . . . . . . . . . . . . . . . . . . . . . . . . . . . . . . . . 13 31Other . . . . . . . . . . . . . . . . . . . . . . . . . . . . . . . . . . . . . . . . . . . . . . . . . . . . 35 20
Total other accrued liabilities . . . . . . . . . . . . . . . . . . . . . . . . . . . . . $261 $311
Other long-term liabilitiesRetirement plans . . . . . . . . . . . . . . . . . . . . . . . . . . . . . . . . . . . . . . . . . . $303 $285Deferred compensation . . . . . . . . . . . . . . . . . . . . . . . . . . . . . . . . . . . . . 46 37Minority interest . . . . . . . . . . . . . . . . . . . . . . . . . . . . . . . . . . . . . . . . . . 28 25Warranty accruals . . . . . . . . . . . . . . . . . . . . . . . . . . . . . . . . . . . . . . . . . 10 14Other . . . . . . . . . . . . . . . . . . . . . . . . . . . . . . . . . . . . . . . . . . . . . . . . . . . . 79 56
Total other long-term liabilities . . . . . . . . . . . . . . . . . . . . . . . . . . . . $466 $417
Our accrued vacation balance totaled $201 million and $193 million at October 31, 2004 and2003, respectively, and is recorded in employee compensation and benefits in the consolidatedbalance sheet.
16. Senior Convertible Debentures and Lines of Credit
Senior convertible debentures. On November 27, 2001, we completed a private offering of$1.15 billion aggregate principal amount of three percent senior convertible debentures (the“debentures”) due 2021 and generated net proceeds of $1.12 billion after deducting fees andexpenses. The debentures are convertible at any time into our common stock at an initial conversionprice of $32.22 per share (approximately 36 million shares), subject to adjustment (as defined in therelated Indenture dated November 27, 2001). They are redeemable for cash at the company’s option
73
AGILENT TECHNOLOGIES, INC.
NOTES TO CONSOLIDATED FINANCIAL STATEMENTS — (Continued)
beginning at any time on or after December 6, 2004 at a price equal to 100 percent of the principalamount plus interest. Holders of the debentures have the ability to require us to repurchase thedebentures, in whole or in part, on December 1 in each of 2006, 2011 and 2016. Holders also havethe right to require us to repurchase all or a portion of the outstanding debentures if the companyundergoes a Fundamental Change (as defined in the Indenture). The debentures bear interest at anannual rate of three percent, which is payable on June 1 and December 1 of each year beginningJune 1, 2002. The interest rate will reset (as defined in the Indenture) in June 2006, June 2011 andJune 2016, but in no event will it be reset below three percent or above five percent per annum. Todate there have been no adjustments to the conversion price of the debentures.
Lines of credit. Effective November 1, 2002, we terminated our $250 million five-yearrevolving credit facility that was due to expire on November 5, 2005 and did not extend the $250million 364-day revolving credit facility that expired on November 1, 2002. There were no balancesoutstanding under either facility at October 31, 2004.
17. Commitments
Operating Lease Commitments: Agilent Technologies leases certain real and personal propertyfrom unrelated third parties under non-cancelable operating leases. Future minimum lease paymentsunder leases at October 31, 2004 were $108 million for 2005, $87 million for 2006, $67 million for 2007,$55 million for 2008, $46 million for 2009 and $ 81 million thereafter. Certain leases require AgilentTechnologies to pay property taxes, insurance and routine maintenance, and include escalationclauses. Rent expense was $116 million in 2004, $126 million in 2003 and $177 million in 2002.
18. Contingencies
We are involved in lawsuits, claims, investigations and proceedings, including patent,commercial and environmental matters that arise in the ordinary course of business. There are nosuch matters pending that we expect to be material in relation to our business, consolidatedfinancial condition, results of operations or cash flows.
19. Segment Information
Description of segments. We are a diversified technology company that provides enablingsolutions to customers in markets within the communications, electronics, life sciences and chemicalanalysis industries.
We organize our business operations into four major businesses — test and measurement,automated test, semiconductor products, and life sciences and chemical analysis — each of whichcomprises a reportable segment. The segments were determined based primarily on how the chiefoperating decision maker views and evaluates our operations. Other factors, including customerbase, homogeneity of products, technology and delivery channels, were also considered indetermining our reportable segments.
Our four reportable segments are as follows:
• test and measurement business provides standard and customized solutions that are used inthe design, development, manufacture, installation, deployment and operation of electronicequipment and systems and communications networks and services. These solutions includetest and measurement instruments and systems, communications service and networkmonitoring, management, and optimization tools and software design tools and associatedservices;
74
AGILENT TECHNOLOGIES, INC.
NOTES TO CONSOLIDATED FINANCIAL STATEMENTS — (Continued)
• automated test business provides test system solutions that are used in the manufacture ofsemiconductor devices, electronics (primarily printed circuit-board assemblies) and flat paneldisplays. Our test solutions enable electronics designers and manufacturers to shorten thedesign-to-production cycle, lower manufacturing cost of test, confirm the functional quality oftheir devices and of their manufacturing processes, and accelerate the high-volume delivery oftheir products;
• semiconductor products business is a leading supplier of semiconductor components,modules and assemblies for consumer and commercial electronics applications. We design,develop and manufacture products for the networking and personal systems markets. Ournetworking products include fiber optic transceivers for sending and receiving data over high-speed networks and ICs for enterprise storage and networking; and
• life sciences and chemical analysis business provides application-focused solutions thatinclude instruments, software, consumables and services that enable customers to identify,quantify and analyze the physical and biological properties of substances and products. Ourseven key product categories include: microarrays, microfluidics, gas chromatography, liquidchromatography, mass spectrometry, software and informatics, and related consumables,reagents and services.
Segment revenue and profit. The accounting policies used to derive reportable segmentresults are generally the same as those described in Note 2, “Summary of Significant AccountingPolicies.”
A significant portion of the segments’ expenses arise from shared services and infrastructurethat we have historically provided to the segments in order to realize economies of scale and toefficiently use resources. These expenses, collectively called corporate charges, include costs ofcentralized research and development, legal, accounting, employee benefits, real estate, insuranceservices, information technology services, treasury and other corporate infrastructure expenses.Charges are allocated to the segments and the allocations have been determined on a basis that weconsidered to be a reasonable reflection of the utilization of services provided to or benefits receivedby the segments.
The following tables reflect the results of our reportable segments under our managementreporting system. These results are not necessarily a depiction that is in conformity with accountingprinciples generally accepted in the U.S. The performance of each segment is measured based onseveral metrics, including income (loss) from operations. These results are used, in part, by the chiefoperating decision maker in evaluating the performance of, and in allocating resources to, each ofthe segments.
75
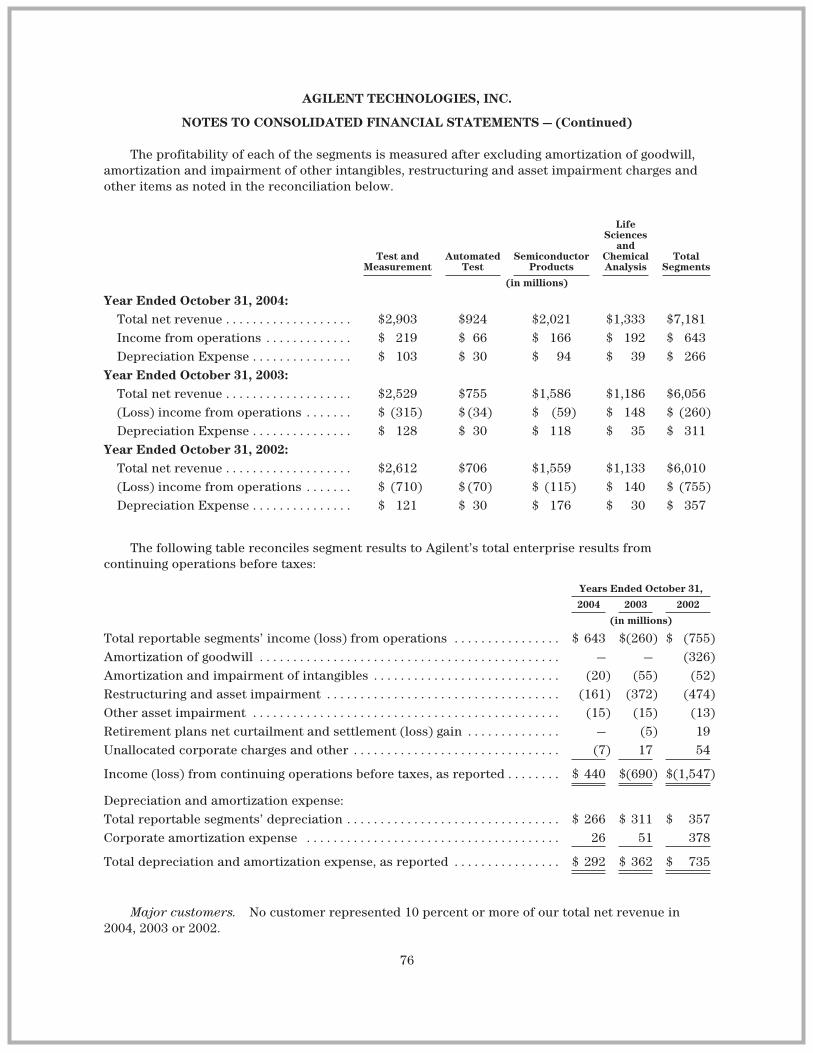
AGILENT TECHNOLOGIES, INC.
NOTES TO CONSOLIDATED FINANCIAL STATEMENTS — (Continued)
The profitability of each of the segments is measured after excluding amortization of goodwill,amortization and impairment of other intangibles, restructuring and asset impairment charges andother items as noted in the reconciliation below.
Test andMeasurement
AutomatedTest
SemiconductorProducts
LifeSciences
andChemicalAnalysis
TotalSegments
(in millions)
Year Ended October 31, 2004:Total net revenue . . . . . . . . . . . . . . . . . . . $2,903 $924 $2,021 $1,333 $7,181Income from operations . . . . . . . . . . . . . $ 219 $ 66 $ 166 $ 192 $ 643Depreciation Expense . . . . . . . . . . . . . . . $ 103 $ 30 $ 94 $ 39 $ 266
Year Ended October 31, 2003:Total net revenue . . . . . . . . . . . . . . . . . . . $2,529 $755 $1,586 $1,186 $6,056(Loss) income from operations . . . . . . . $ (315) $ (34) $ (59) $ 148 $ (260)Depreciation Expense . . . . . . . . . . . . . . . $ 128 $ 30 $ 118 $ 35 $ 311
Year Ended October 31, 2002:Total net revenue . . . . . . . . . . . . . . . . . . . $2,612 $706 $1,559 $1,133 $6,010(Loss) income from operations . . . . . . . $ (710) $ (70) $ (115) $ 140 $ (755)Depreciation Expense . . . . . . . . . . . . . . . $ 121 $ 30 $ 176 $ 30 $ 357
The following table reconciles segment results to Agilent’s total enterprise results fromcontinuing operations before taxes:
Years Ended October 31,
2004 2003 2002
(in millions)
Total reportable segments’ income (loss) from operations . . . . . . . . . . . . . . . . $ 643 $(260) $ (755)Amortization of goodwill . . . . . . . . . . . . . . . . . . . . . . . . . . . . . . . . . . . . . . . . . . . . . — — (326)Amortization and impairment of intangibles . . . . . . . . . . . . . . . . . . . . . . . . . . . . (20) (55) (52)Restructuring and asset impairment . . . . . . . . . . . . . . . . . . . . . . . . . . . . . . . . . . . (161) (372) (474)Other asset impairment . . . . . . . . . . . . . . . . . . . . . . . . . . . . . . . . . . . . . . . . . . . . . . (15) (15) (13)Retirement plans net curtailment and settlement (loss) gain . . . . . . . . . . . . . . — (5) 19Unallocated corporate charges and other . . . . . . . . . . . . . . . . . . . . . . . . . . . . . . . (7) 17 54
Income (loss) from continuing operations before taxes, as reported . . . . . . . . $ 440 $(690) $(1,547)
Depreciation and amortization expense:Total reportable segments’ depreciation . . . . . . . . . . . . . . . . . . . . . . . . . . . . . . . . $ 266 $ 311 $ 357Corporate amortization expense . . . . . . . . . . . . . . . . . . . . . . . . . . . . . . . . . . . . . . 26 51 378
Total depreciation and amortization expense, as reported . . . . . . . . . . . . . . . . $ 292 $ 362 $ 735
Major customers. No customer represented 10 percent or more of our total net revenue in2004, 2003 or 2002.
76
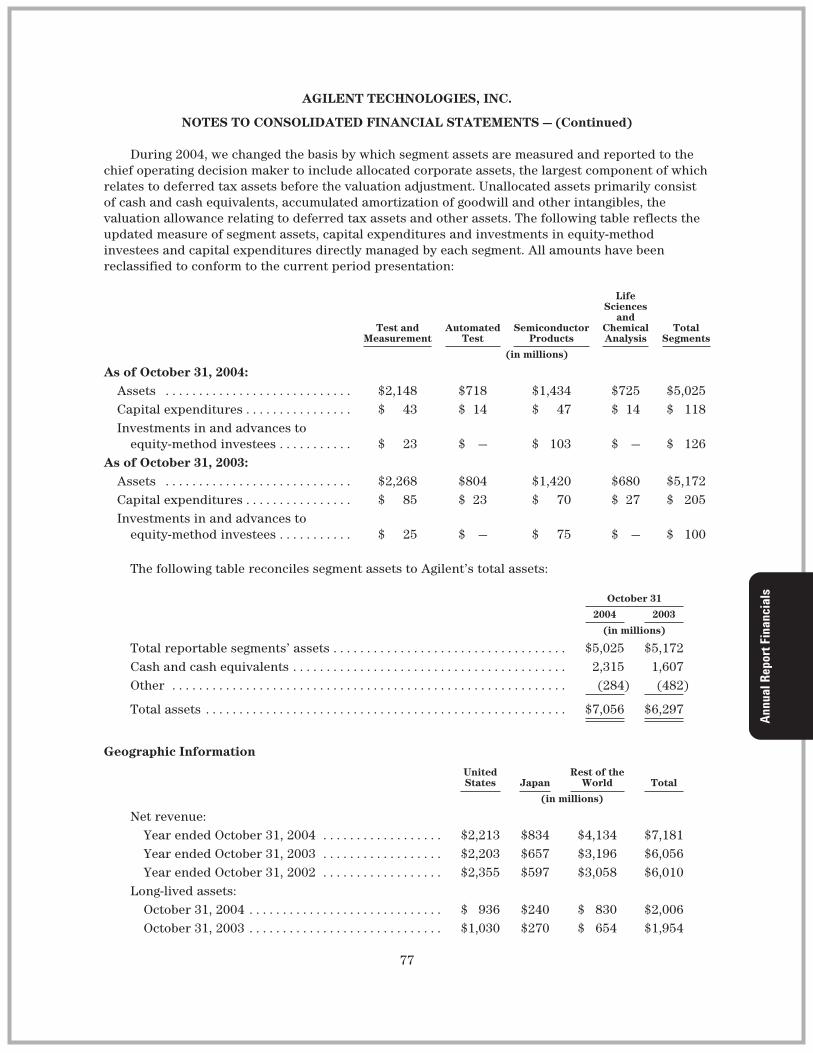
AGILENT TECHNOLOGIES, INC.
NOTES TO CONSOLIDATED FINANCIAL STATEMENTS — (Continued)
During 2004, we changed the basis by which segment assets are measured and reported to thechief operating decision maker to include allocated corporate assets, the largest component of whichrelates to deferred tax assets before the valuation adjustment. Unallocated assets primarily consistof cash and cash equivalents, accumulated amortization of goodwill and other intangibles, thevaluation allowance relating to deferred tax assets and other assets. The following table reflects theupdated measure of segment assets, capital expenditures and investments in equity-methodinvestees and capital expenditures directly managed by each segment. All amounts have beenreclassified to conform to the current period presentation:
Test andMeasurement
AutomatedTest
SemiconductorProducts
LifeSciences
andChemicalAnalysis
TotalSegments
(in millions)
As of October 31, 2004:Assets . . . . . . . . . . . . . . . . . . . . . . . . . . . . $2,148 $718 $1,434 $725 $5,025Capital expenditures . . . . . . . . . . . . . . . . $ 43 $ 14 $ 47 $ 14 $ 118Investments in and advances to
equity-method investees . . . . . . . . . . . $ 23 $ — $ 103 $ — $ 126As of October 31, 2003:
Assets . . . . . . . . . . . . . . . . . . . . . . . . . . . . $2,268 $804 $1,420 $680 $5,172Capital expenditures . . . . . . . . . . . . . . . . $ 85 $ 23 $ 70 $ 27 $ 205Investments in and advances to
equity-method investees . . . . . . . . . . . $ 25 $ — $ 75 $ — $ 100
The following table reconciles segment assets to Agilent’s total assets:
October 31
2004 2003
(in millions)
Total reportable segments’ assets . . . . . . . . . . . . . . . . . . . . . . . . . . . . . . . . . . . $5,025 $5,172Cash and cash equivalents . . . . . . . . . . . . . . . . . . . . . . . . . . . . . . . . . . . . . . . . . 2,315 1,607Other . . . . . . . . . . . . . . . . . . . . . . . . . . . . . . . . . . . . . . . . . . . . . . . . . . . . . . . . . . . (284) (482)
Total assets . . . . . . . . . . . . . . . . . . . . . . . . . . . . . . . . . . . . . . . . . . . . . . . . . . . . . . $7,056 $6,297
Geographic Information
UnitedStates Japan
Rest of theWorld Total
(in millions)
Net revenue:Year ended October 31, 2004 . . . . . . . . . . . . . . . . . . $2,213 $834 $4,134 $7,181Year ended October 31, 2003 . . . . . . . . . . . . . . . . . . $2,203 $657 $3,196 $6,056Year ended October 31, 2002 . . . . . . . . . . . . . . . . . . $2,355 $597 $3,058 $6,010
Long-lived assets:October 31, 2004 . . . . . . . . . . . . . . . . . . . . . . . . . . . . . $ 936 $240 $ 830 $2,006October 31, 2003 . . . . . . . . . . . . . . . . . . . . . . . . . . . . . $1,030 $270 $ 654 $1,954
77
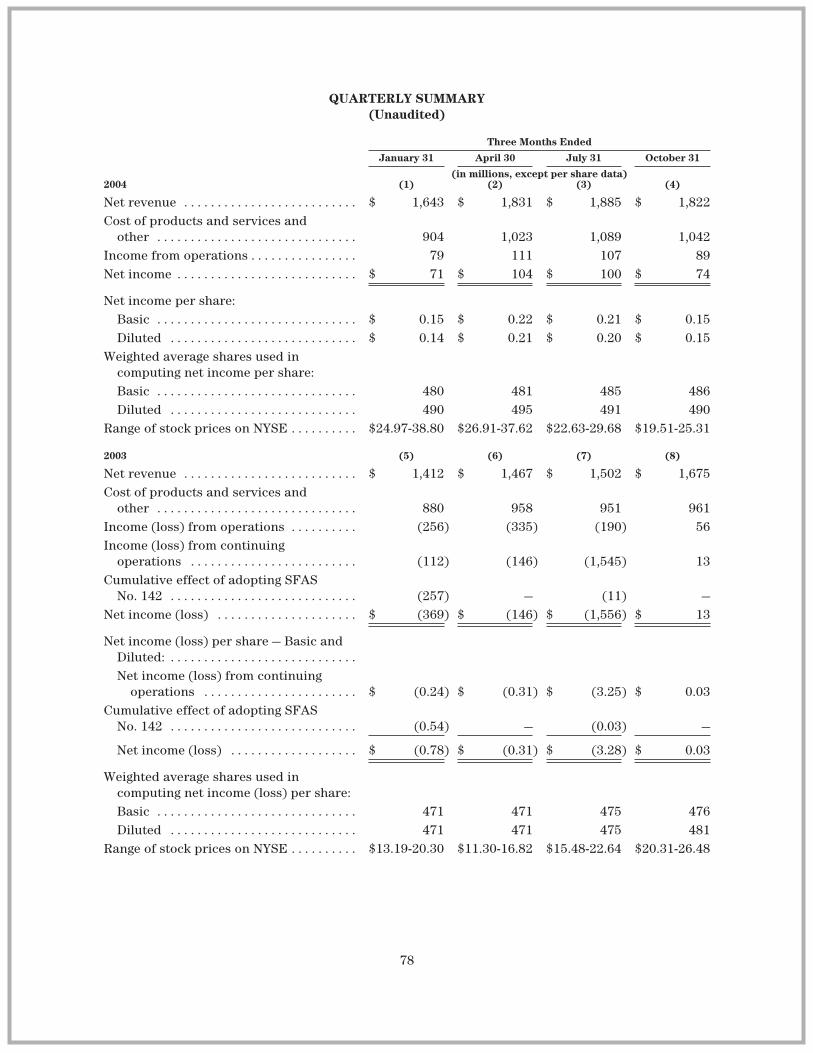
QUARTERLY SUMMARY(Unaudited)
Three Months Ended
January 31 April 30 July 31 October 31
(in millions, except per share data)2004 (1) (2) (3) (4)
Net revenue . . . . . . . . . . . . . . . . . . . . . . . . . . $ 1,643 $ 1,831 $ 1,885 $ 1,822Cost of products and services and
other . . . . . . . . . . . . . . . . . . . . . . . . . . . . . . 904 1,023 1,089 1,042Income from operations . . . . . . . . . . . . . . . . 79 111 107 89Net income . . . . . . . . . . . . . . . . . . . . . . . . . . . $ 71 $ 104 $ 100 $ 74
Net income per share:Basic . . . . . . . . . . . . . . . . . . . . . . . . . . . . . . $ 0.15 $ 0.22 $ 0.21 $ 0.15Diluted . . . . . . . . . . . . . . . . . . . . . . . . . . . . $ 0.14 $ 0.21 $ 0.20 $ 0.15
Weighted average shares used incomputing net income per share:Basic . . . . . . . . . . . . . . . . . . . . . . . . . . . . . . 480 481 485 486Diluted . . . . . . . . . . . . . . . . . . . . . . . . . . . . 490 495 491 490
Range of stock prices on NYSE . . . . . . . . . . $24.97-38.80 $26.91-37.62 $22.63-29.68 $19.51-25.31
2003 (5) (6) (7) (8)
Net revenue . . . . . . . . . . . . . . . . . . . . . . . . . . $ 1,412 $ 1,467 $ 1,502 $ 1,675Cost of products and services and
other . . . . . . . . . . . . . . . . . . . . . . . . . . . . . . 880 958 951 961Income (loss) from operations . . . . . . . . . . (256) (335) (190) 56Income (loss) from continuing
operations . . . . . . . . . . . . . . . . . . . . . . . . . (112) (146) (1,545) 13Cumulative effect of adopting SFAS
No. 142 . . . . . . . . . . . . . . . . . . . . . . . . . . . . (257) — (11) —Net income (loss) . . . . . . . . . . . . . . . . . . . . . $ (369) $ (146) $ (1,556) $ 13
Net income (loss) per share — Basic andDiluted: . . . . . . . . . . . . . . . . . . . . . . . . . . . .Net income (loss) from continuing
operations . . . . . . . . . . . . . . . . . . . . . . . $ (0.24) $ (0.31) $ (3.25) $ 0.03Cumulative effect of adopting SFAS
No. 142 . . . . . . . . . . . . . . . . . . . . . . . . . . . . (0.54) — (0.03) —
Net income (loss) . . . . . . . . . . . . . . . . . . . $ (0.78) $ (0.31) $ (3.28) $ 0.03
Weighted average shares used incomputing net income (loss) per share:Basic . . . . . . . . . . . . . . . . . . . . . . . . . . . . . . 471 471 475 476Diluted . . . . . . . . . . . . . . . . . . . . . . . . . . . . 471 471 475 481
Range of stock prices on NYSE . . . . . . . . . . $13.19-20.30 $11.30-16.82 $15.48-22.64 $20.31-26.48
78
NOTES:(1) Includes pre-tax restructuring and asset impairment charges of $45 million primarily relating to
severance expenses(2) Includes pre-tax restructuring and asset impairment charges of $20 million primarily relating to
severance expenses(3) Includes pre-tax restructuring and asset impairment charges of $42 million primarily relating to
severance expenses(4) Includes pre-tax restructuring and asset impairment charges of $54 million primarily relating to
severance expenses(5) Includes pre-tax restructuring and asset impairment charges of $42 million primarily relating to
severance expenses(6) Includes pre-tax restructuring and asset impairment charges of $131 million primarily relating
to severance expenses(7) Includes pre-tax restructuring and asset impairment charges of $141 million primarily relating
to severance expenses and a non-cash charge to establish a tax valuation allowance of $1.4billion
(8) Includes pre-tax restructuring and asset impairment charges of $58 million primarily relating toseverance expenses
79