aggregate demand and aggregate supply
TRANSCRIPT
12
SHORT-RUN ECONOMIC FLUCTUATIONS
Copyright © 2004 South-Western
3333Aggregate Demand and Aggregate
Supply
Copyright © 2004 South-Western
Short-Run Economic Fluctuations
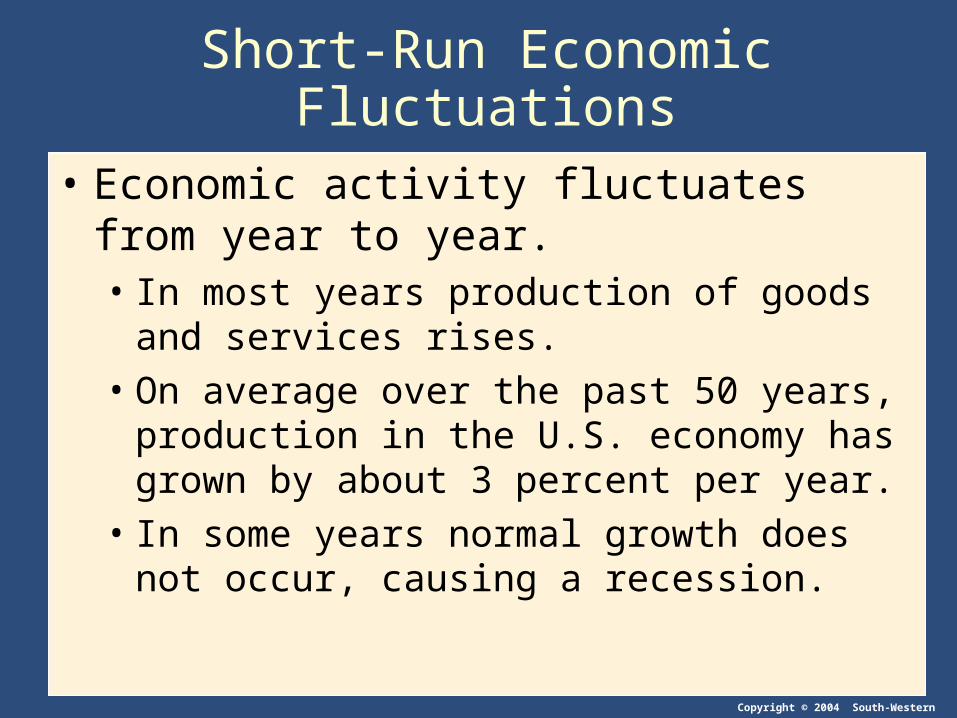
• Economic activity fluctuates from year to year.• In most years production of goods and services
rises.• On average over the past 50 years, production in the
U.S. economy has grown by about 3 percent per year.
• In some years normal growth does not occur, causing a recession.
Copyright © 2004 South-Western
Short-Run Economic Fluctuations
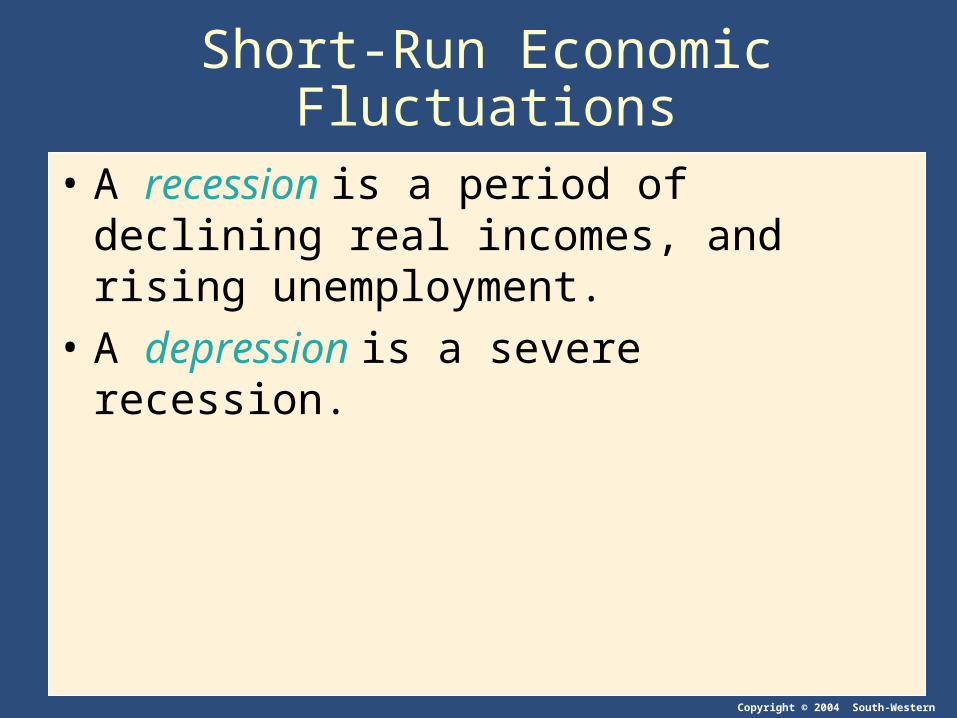
• A recession is a period of declining real incomes, and rising unemployment.
• A depression is a severe recession.
Copyright © 2004 South-Western
THREE KEY FACTS ABOUT ECONOMIC FLUCTUATIONS
• Economic fluctuations are irregular and unpredictable.• Fluctuations in the economy are often called the
business cycle.
• Most macroeconomic variables fluctuate together.
• As output falls, unemployment rises.
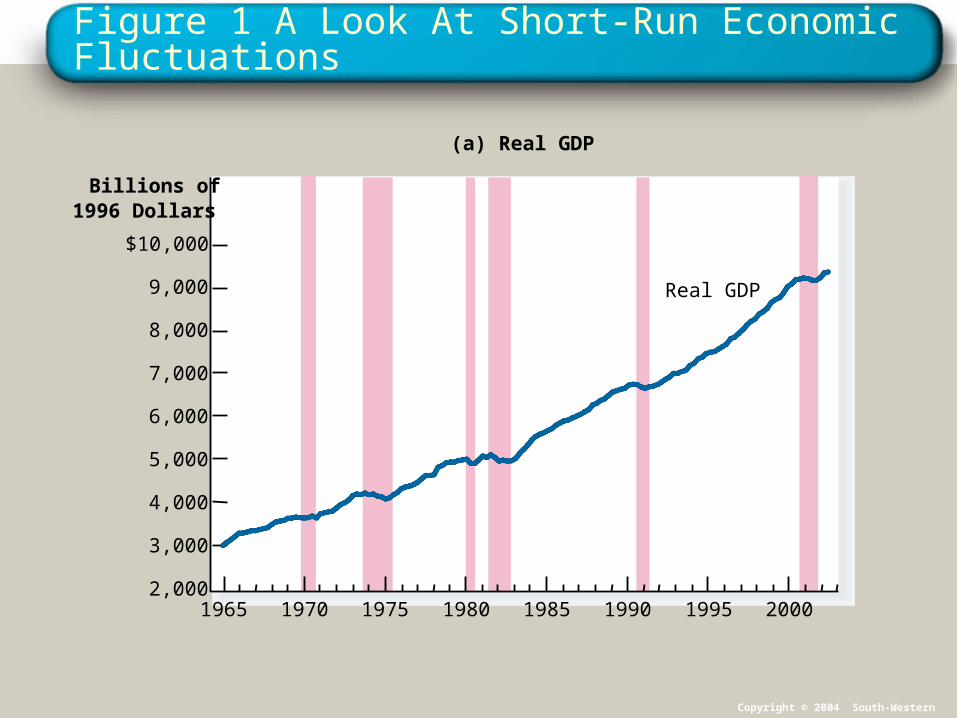
Figure 1 A Look At Short-Run Economic Fluctuations
Billions of1996 Dollars
Real GDP
(a) Real GDP
$10,000
9,000
8,000
7,000
6,000
5,000
4,000
3,000
2,0001965 1970 1975 1980 1985 1990 1995 2000
Copyright © 2004 South-Western

Copyright © 2004 South-Western
THREE KEY FACTS ABOUT ECONOMIC FLUCTUATIONS
• Most macroeconomic variables fluctuate together.• Most macroeconomic variables that measure some
type of income or production fluctuate closely together.
• Although many macroeconomic variables fluctuate together, they fluctuate by different amounts.
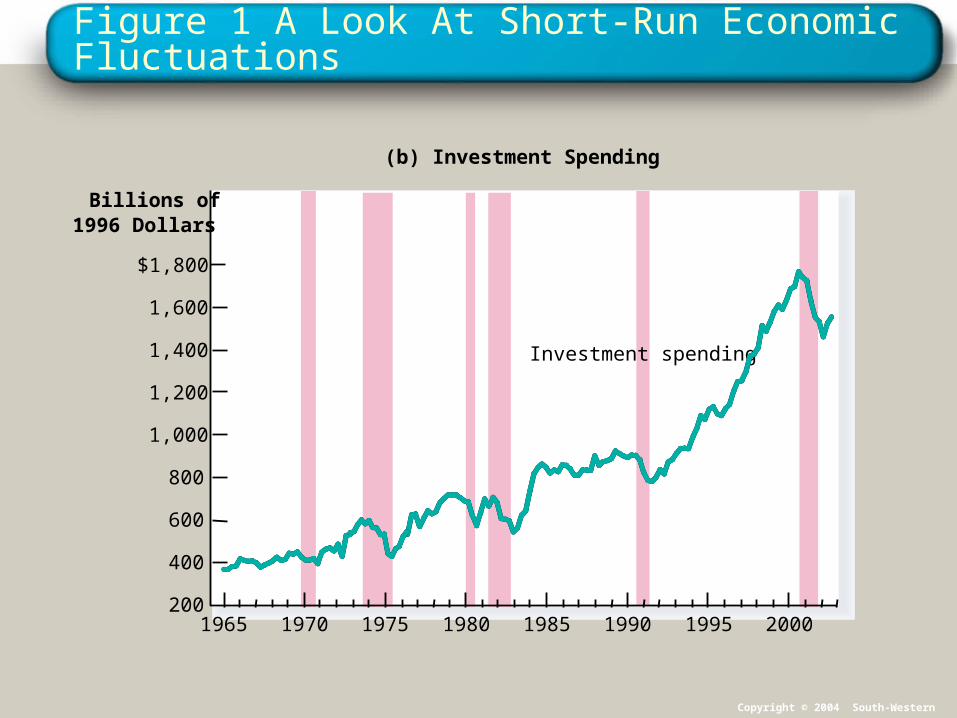
Figure 1 A Look At Short-Run Economic Fluctuations
Billions of1996 Dollars
(b) Investment Spending
$1,800
1,600
1,400
1,200
1,000
800
600
400
2001965 1970 1975 1980 1985 1990 1995 2000
Investment spending
Copyright © 2004 South-Western
Copyright © 2004 South-Western
THREE KEY FACTS ABOUT ECONOMIC FLUCTUATIONS
• As output falls, unemployment rises.• Changes in real GDP are inversely related to
changes in the unemployment rate.• During times of recession, unemployment rises
substantially.
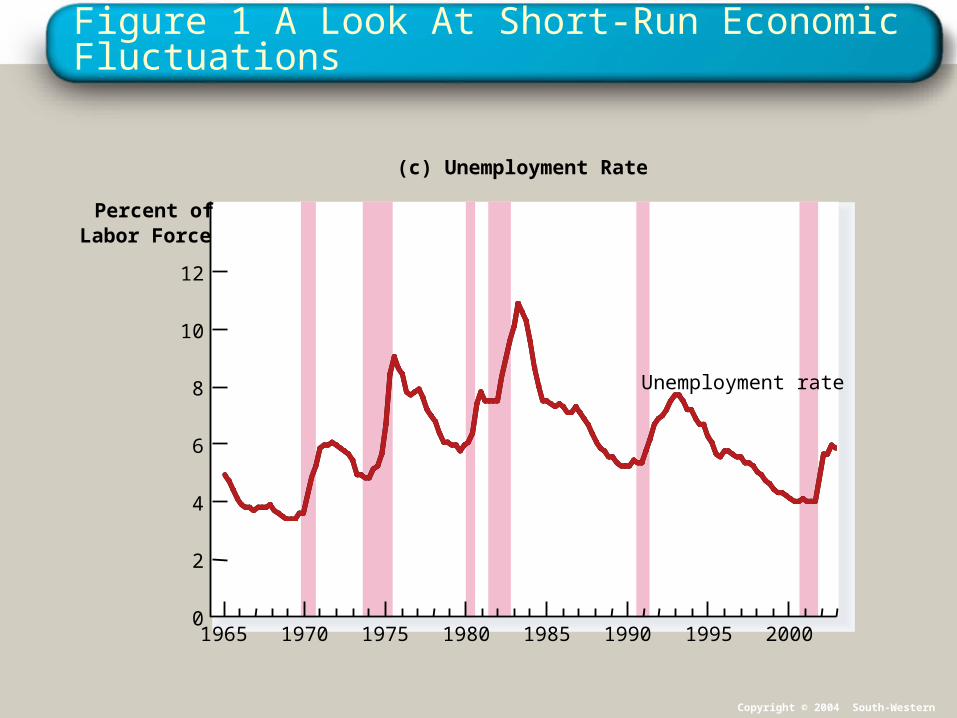
Figure 1 A Look At Short-Run Economic Fluctuations
Percent ofLabor Force
(c) Unemployment Rate
0
2
4
6
8
10
12
1965 1970 1975 1980 1985 1990 1995 2000
Unemployment rate
Copyright © 2004 South-Western
Copyright © 2004 South-Western
EXPLAINING SHORT-RUN ECONOMIC FLUCTUATIONS
• How the Short Run Differs from the Long Run• Most economists believe that classical theory
describes the world in the long run but not in the short run.
• Changes in the money supply affect nominal variables but not real variables in the long run.
• The assumption of monetary neutrality is not appropriate when studying year-to-year changes in the economy.
Copyright © 2004 South-Western
The Basic Model of Economic Fluctuations
• Two variables are used to develop a model to analyze the short-run fluctuations.• The economy’s output of goods and services
measured by real GDP.• The overall price level measured by the CPI or the
GDP deflator.
Copyright © 2004 South-Western
The Basic Model of Economic Fluctuations
• The Basic Model of Aggregate Demand and Aggregate Supply• Economist use the model of aggregate demand and
aggregate supply to explain short-run fluctuations in economic activity around its long-run trend.
Copyright © 2004 South-Western
The Basic Model of Economic Fluctuations
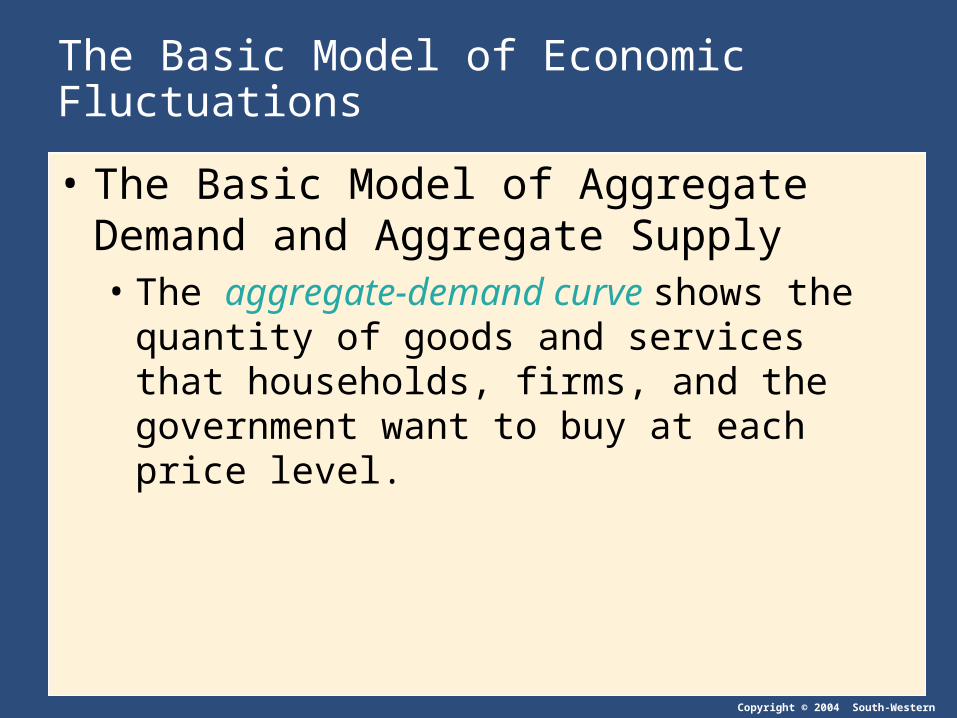
• The Basic Model of Aggregate Demand and Aggregate Supply• The aggregate-demand curve shows the quantity of
goods and services that households, firms, and the government want to buy at each price level.
Copyright © 2004 South-Western
The Basic Model of Economic Fluctuations
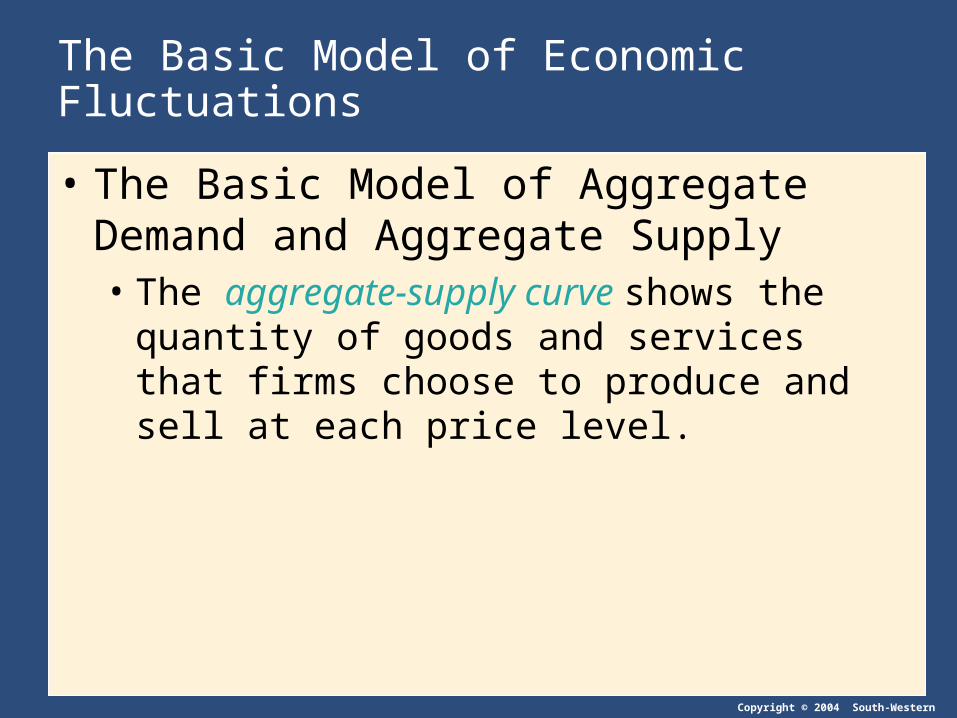
• The Basic Model of Aggregate Demand and Aggregate Supply• The aggregate-supply curve shows the quantity of
goods and services that firms choose to produce and sell at each price level.
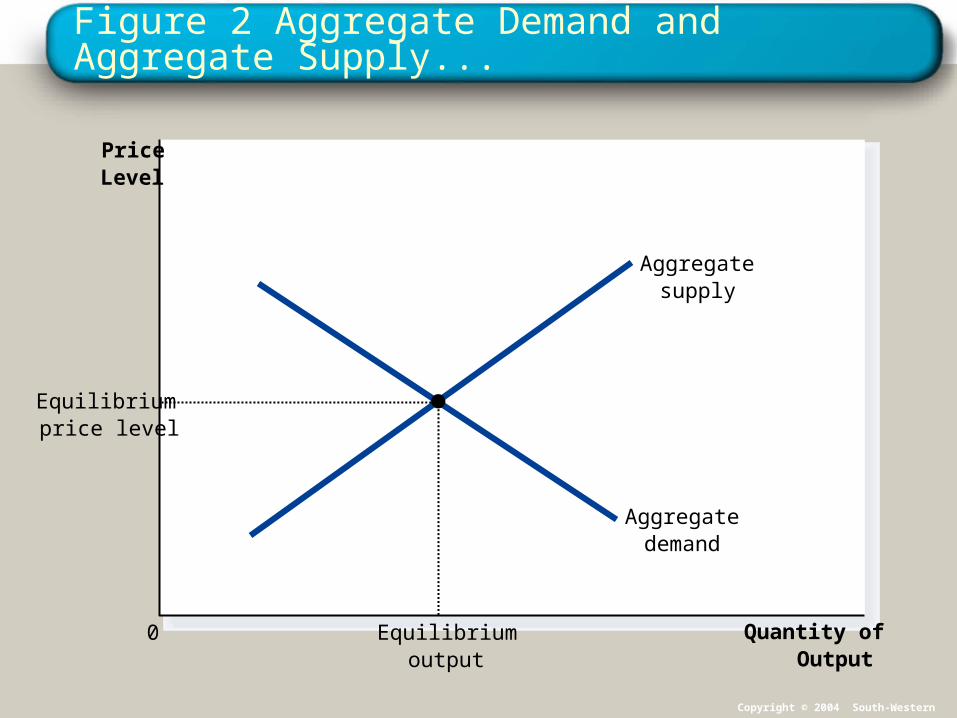
Figure 2 Aggregate Demand and Aggregate Supply...
Quantity ofOutput
PriceLevel
0
Aggregatesupply
Aggregatedemand
Equilibriumoutput
Equilibriumprice level
Copyright © 2004 South-Western
Copyright © 2004 South-Western
THE AGGREGATE-DEMAND CURVE
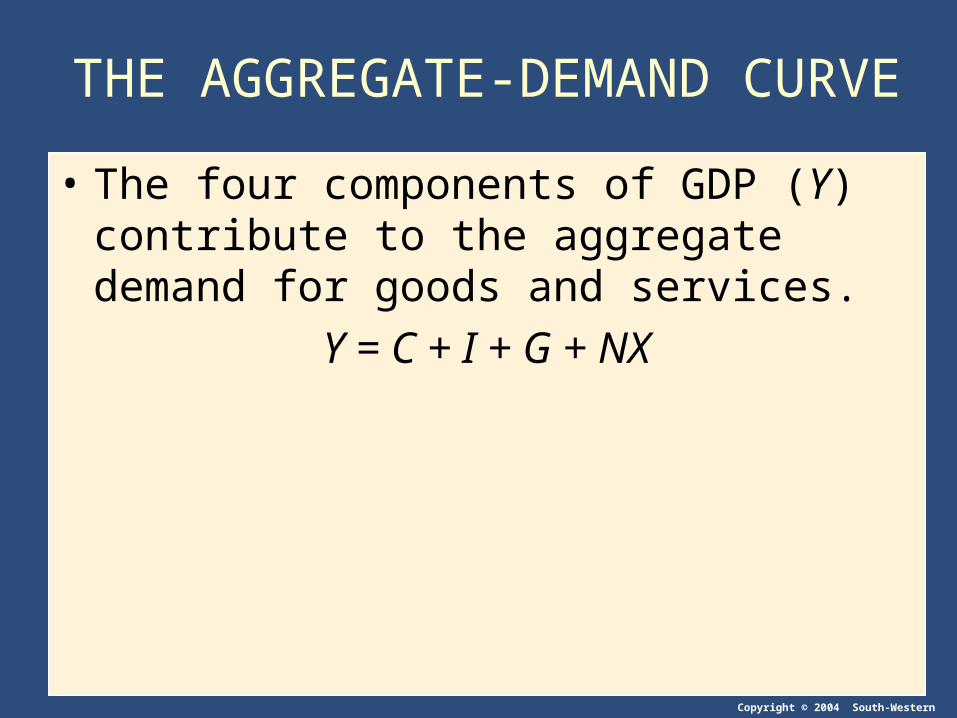
• The four components of GDP (Y) contribute to the aggregate demand for goods and services.
Y = C + I + G + NX
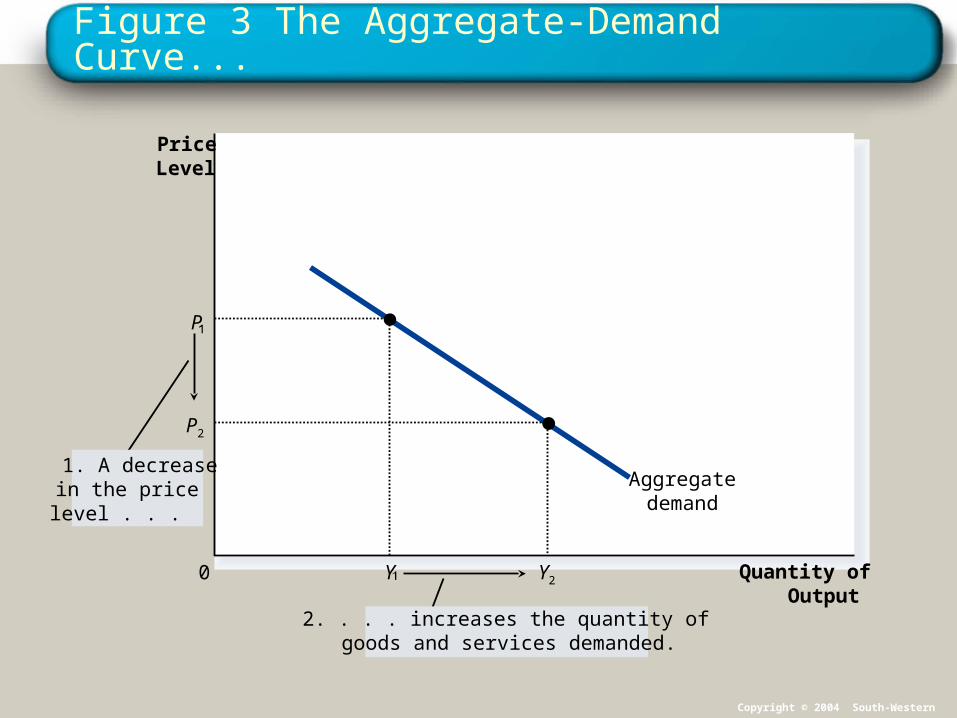
Figure 3 The Aggregate-Demand Curve...
Quantity ofOutput
PriceLevel
0
Aggregatedemand
P
Y Y2
P2
1. A decreasein the pricelevel . . .
2. . . . increases the quantity ofgoods and services demanded.
Copyright © 2004 South-Western
Copyright © 2004 South-Western
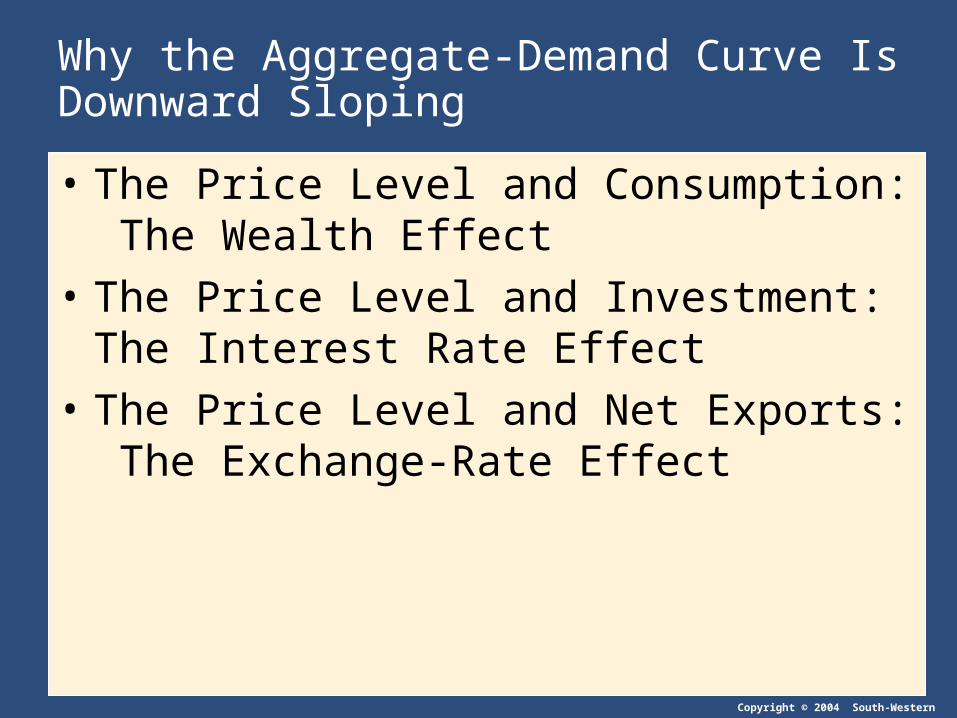
Why the Aggregate-Demand Curve Is Downward Sloping
• The Price Level and Consumption: The Wealth Effect
• The Price Level and Investment: The Interest Rate Effect
• The Price Level and Net Exports: The Exchange-Rate Effect
Copyright © 2004 South-Western
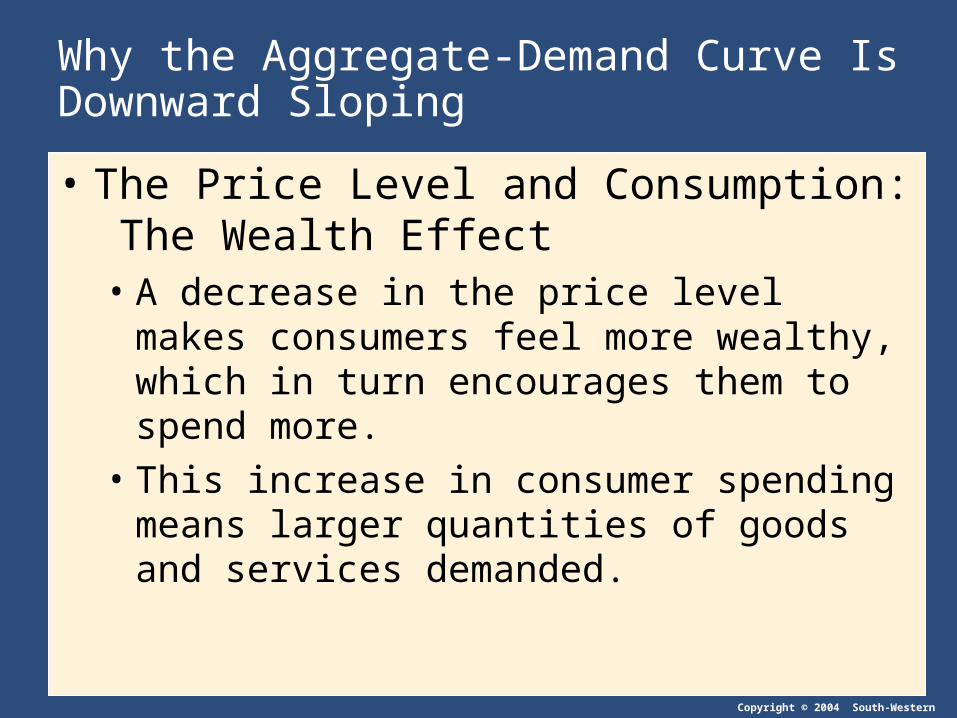
Why the Aggregate-Demand Curve Is Downward Sloping
• The Price Level and Consumption: The Wealth Effect• A decrease in the price level makes consumers feel
more wealthy, which in turn encourages them to spend more.
• This increase in consumer spending means larger quantities of goods and services demanded.
Copyright © 2004 South-Western
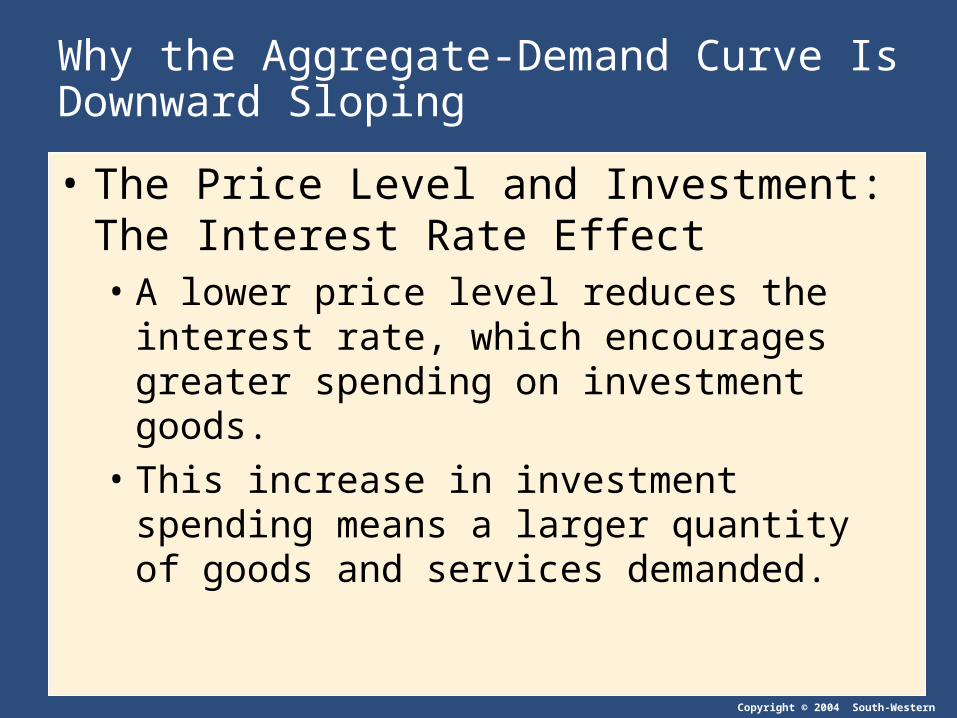
Why the Aggregate-Demand Curve Is Downward Sloping
• The Price Level and Investment: The Interest Rate Effect• A lower price level reduces the interest rate, which
encourages greater spending on investment goods.• This increase in investment spending means a larger
quantity of goods and services demanded.
Copyright © 2004 South-Western
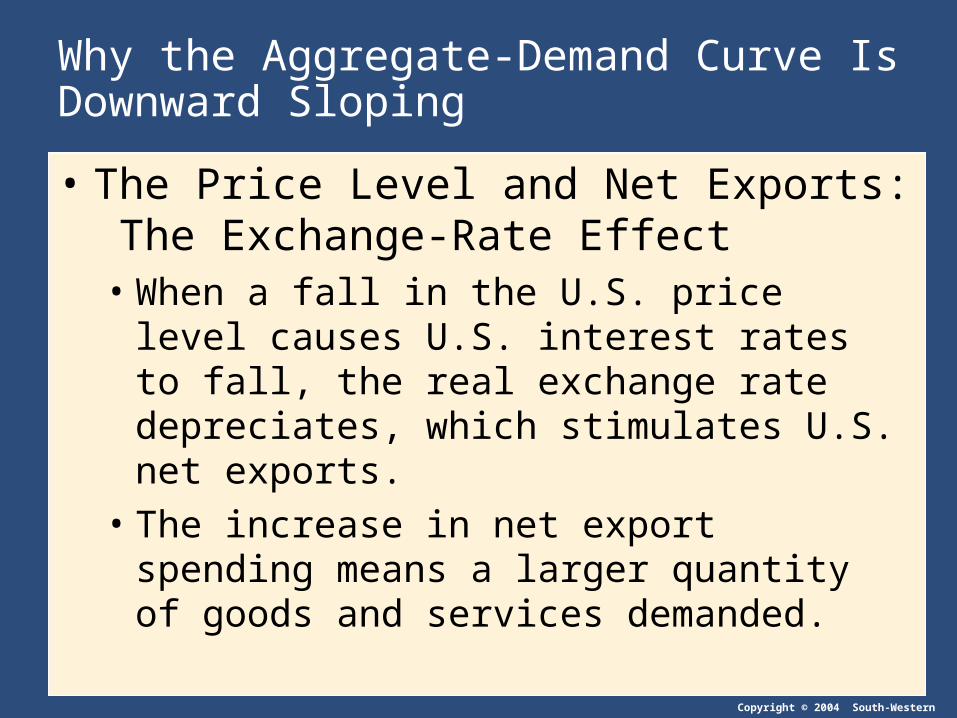
Why the Aggregate-Demand Curve Is Downward Sloping
• The Price Level and Net Exports: The Exchange-Rate Effect• When a fall in the U.S. price level causes U.S.
interest rates to fall, the real exchange rate depreciates, which stimulates U.S. net exports.
• The increase in net export spending means a larger quantity of goods and services demanded.
Copyright © 2004 South-Western
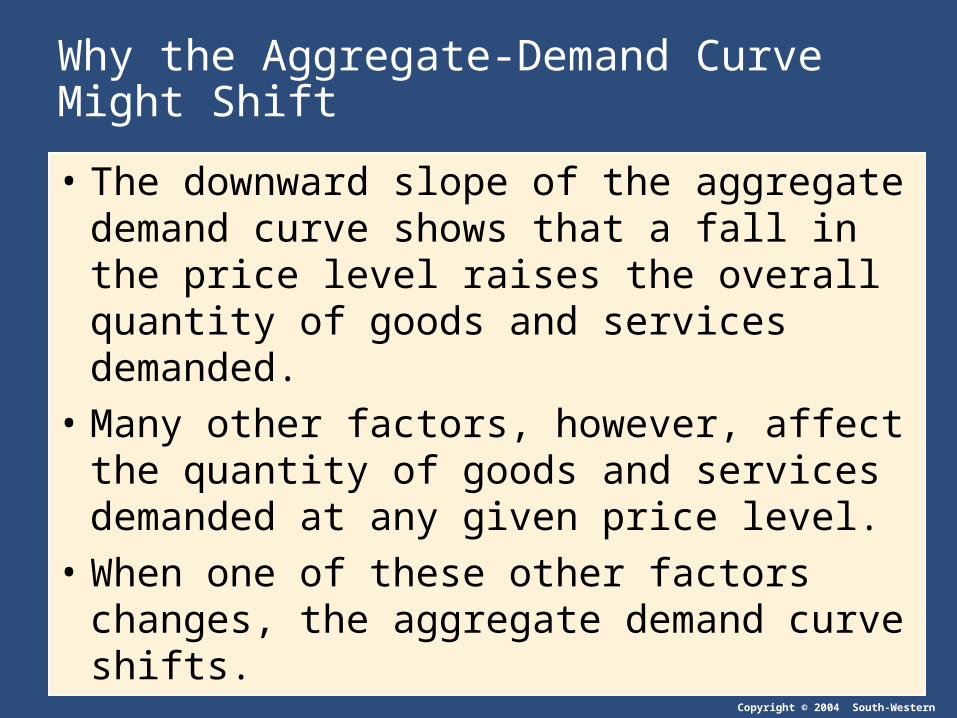
Why the Aggregate-Demand Curve Might Shift
• The downward slope of the aggregate demand curve shows that a fall in the price level raises the overall quantity of goods and services demanded.
• Many other factors, however, affect the quantity of goods and services demanded at any given price level.
• When one of these other factors changes, the aggregate demand curve shifts.
Copyright © 2004 South-Western
Why the Aggregate-Demand Curve Might Shift
• Shifts arising from • Consumption• Investment• Government Purchases• Net Exports
Copyright © 2004 South-Western
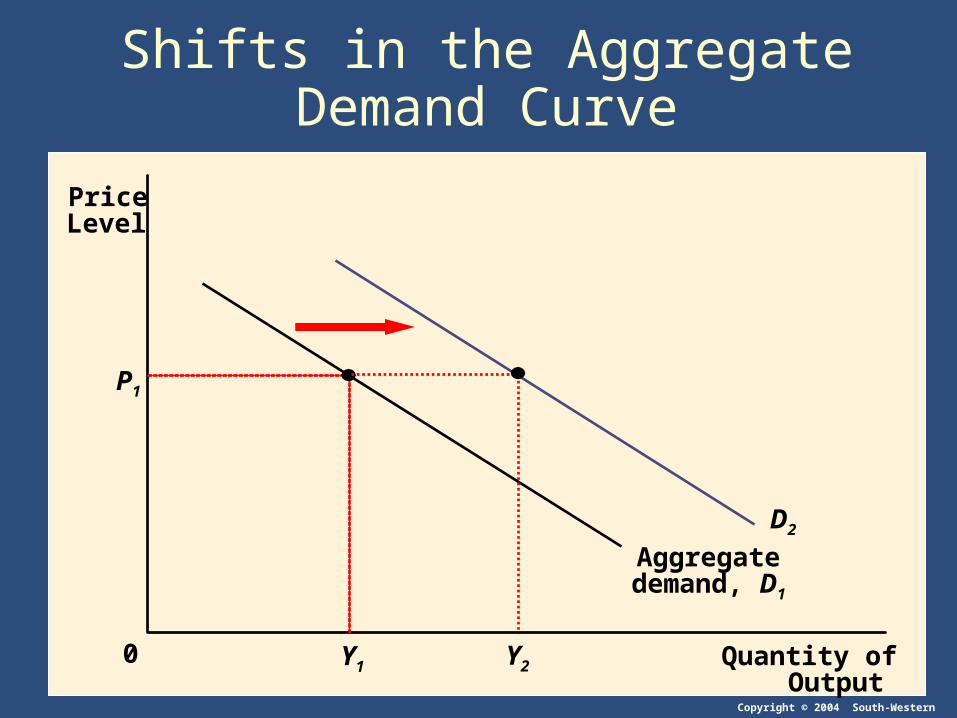
Shifts in the Aggregate Demand Curve
Quantity ofOutput
PriceLevel
0
Aggregatedemand, D1
P1
Y1
D2
Y2
Copyright © 2004 South-Western
THE AGGREGATE-SUPPLY CURVE
• In the long run, the aggregate-supply curve is vertical.
• In the short run, the aggregate-supply curve is upward sloping.
Copyright © 2004 South-Western
THE AGGREGATE-SUPPLY CURVE
• The Long-Run Aggregate-Supply Curve• In the long run, an economy’s production of goods
and services depends on its supplies of labor, capital, and natural resources and on the available technology used to turn these factors of production into goods and services.
• The price level does not affect these variables in the long run.
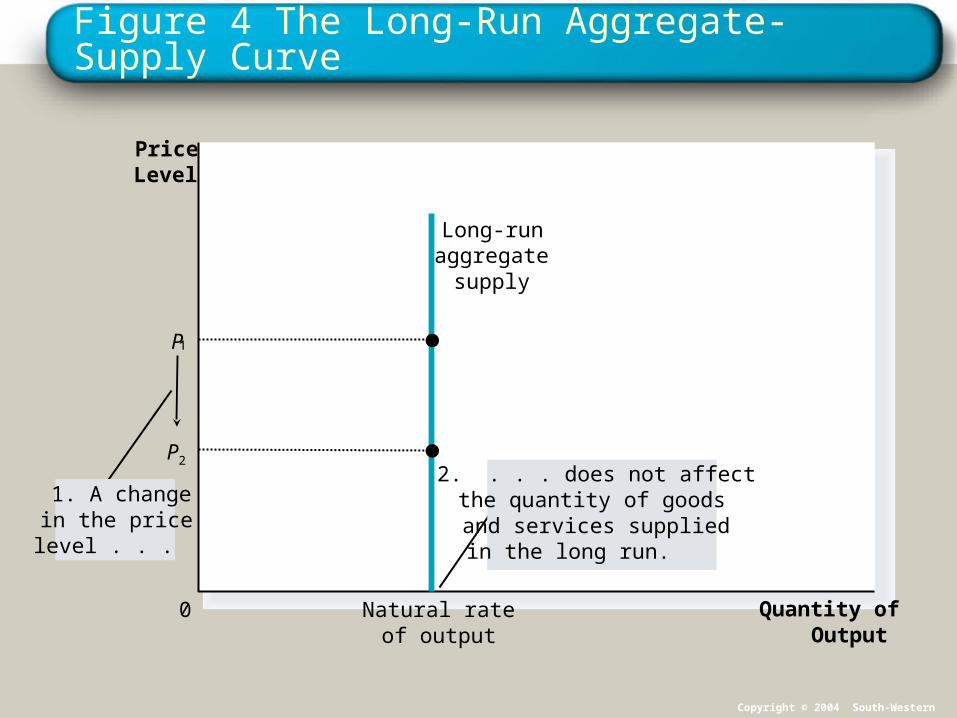
Figure 4 The Long-Run Aggregate-Supply Curve
Quantity ofOutput
Natural rateof output
PriceLevel
0
Long-runaggregate
supply
P2
1. A changein the pricelevel . . .
2. . . . does not affect the quantity of goods and services supplied in the long run.
P
Copyright © 2004 South-Western
Copyright © 2004 South-Western
THE AGGREGATE-SUPPLY CURVE
• The Long-Run Aggregate-Supply Curve• The long-run aggregate-supply curve is vertical at
the natural rate of output.• This level of production is also referred to as
potential output or full-employment output.
Copyright © 2004 South-Western
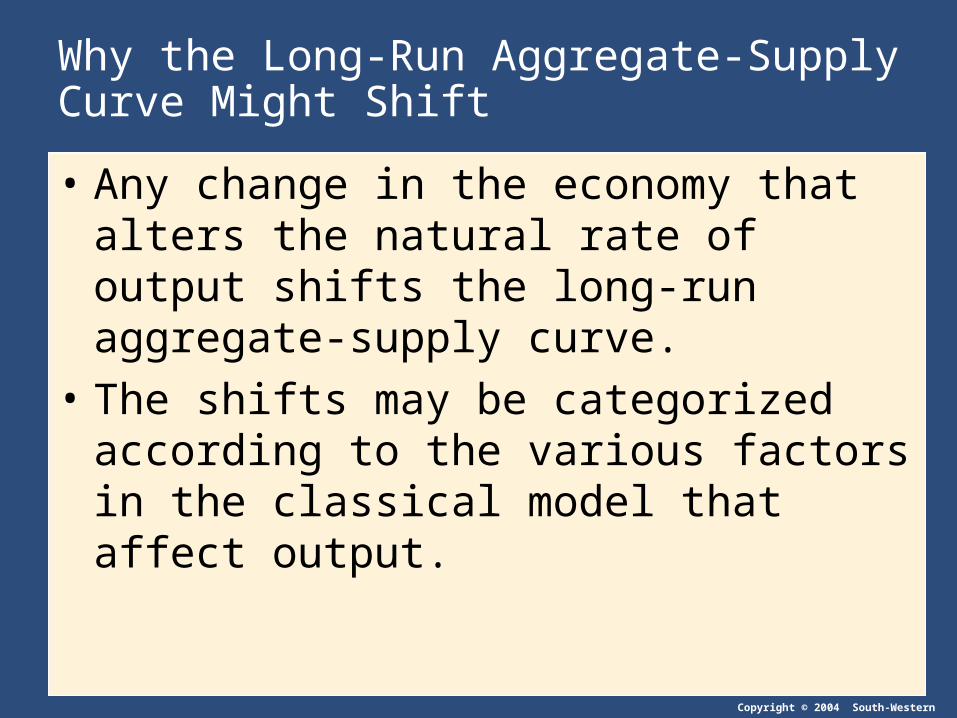
Why the Long-Run Aggregate-Supply Curve Might Shift
• Any change in the economy that alters the natural rate of output shifts the long-run aggregate-supply curve.
• The shifts may be categorized according to the various factors in the classical model that affect output.
Copyright © 2004 South-Western
Why the Long-Run Aggregate-Supply Curve Might Shift
• Shifts arising • Labor• Capital• Natural Resources• Technological Knowledge
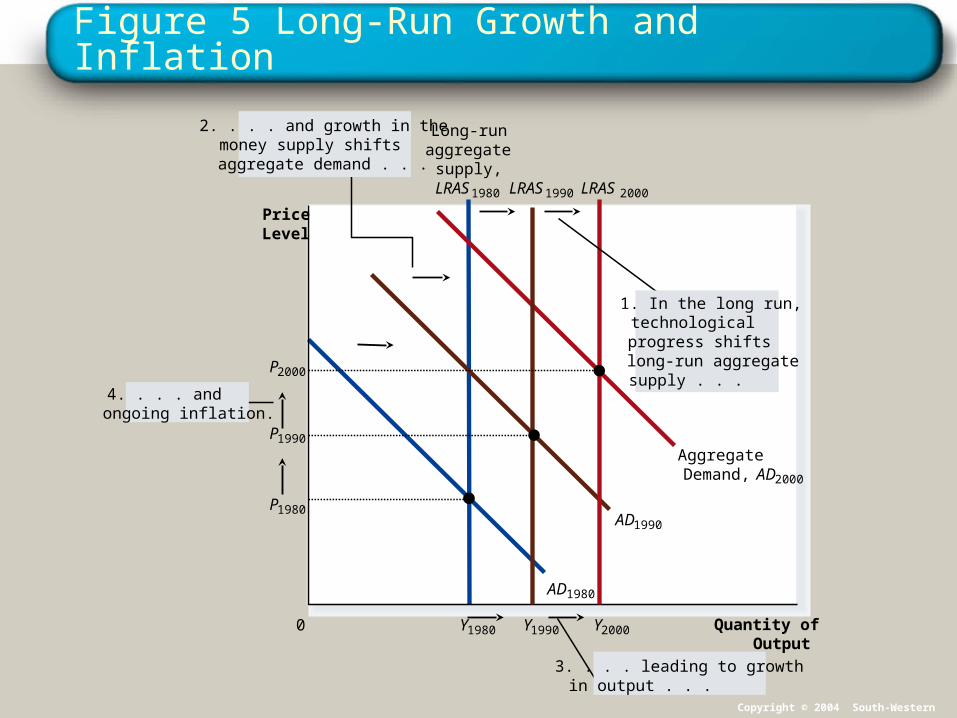
Figure 5 Long-Run Growth and Inflation
Quantity ofOutput
Y1980
AD1980
AD1990
Aggregate Demand, AD2000
PriceLevel
0
Long-runaggregate
supply,LRAS1980
Y1990
LRAS1990
Y2000
LRAS2000
P1980
1. In the long run,technological progress shifts long-run aggregate supply . . .
4. . . . andongoing inflation.
3. . . . leading to growthin output . . .
P1990
P2000
2. . . . and growth in the money supply shifts aggregate demand . . .
Copyright © 2004 South-Western
Copyright © 2004 South-Western
A New Way to Depict Long-Run Growth and Inflation
• Short-run fluctuations in output and price level should be viewed as deviations from the continuing long-run trends.
Copyright © 2004 South-Western
Why the Aggregate-Supply Curve Slopes Upward in the Short Run
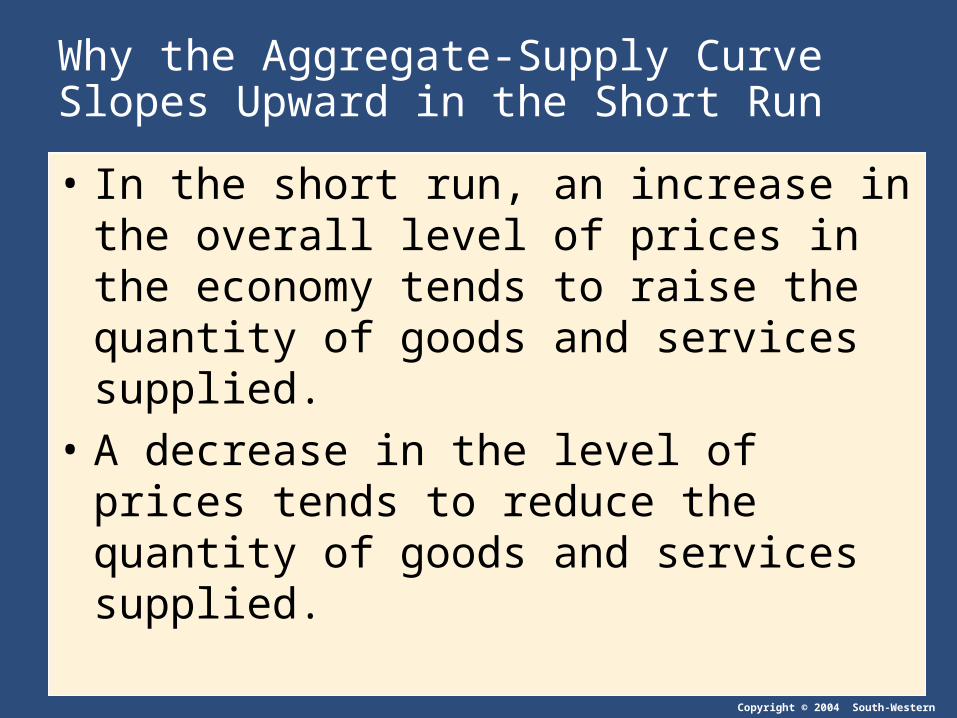
• In the short run, an increase in the overall level of prices in the economy tends to raise the quantity of goods and services supplied.
• A decrease in the level of prices tends to reduce the quantity of goods and services supplied.
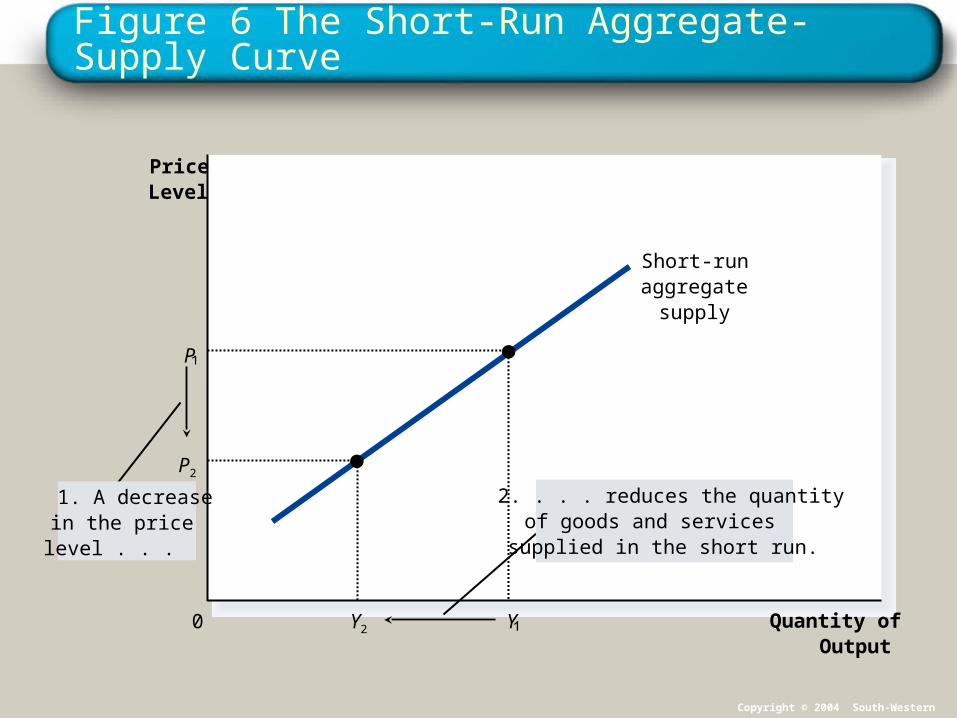
Figure 6 The Short-Run Aggregate-Supply Curve
Quantity ofOutput
PriceLevel
0
Short-runaggregate
supply
1. A decreasein the pricelevel . . .
2. . . . reduces the quantityof goods and servicessupplied in the short run.
Y
P
Y2
P2
Copyright © 2004 South-Western
Copyright © 2004 South-Western
Why the Aggregate-Supply Curve Slopes Upward in the Short Run
• The Misperceptions Theory
• The Sticky-Wage Theory
• The Sticky-Price Theory
Copyright © 2004 South-Western
Why the Aggregate-Supply Curve Slopes Upward in the Short Run
• The Misperceptions Theory• Changes in the overall price level temporarily
mislead suppliers about what is happening in the markets in which they sell their output:
• A lower price level causes misperceptions about relative prices.
• These misperceptions induce suppliers to decrease the quantity of goods and services supplied.
Copyright © 2004 South-Western
Why the Aggregate-Supply Curve Slopes Upward in the Short Run
• The Sticky-Wage Theory• Nominal wages are slow to adjust, or are “sticky” in
the short run:• Wages do not adjust immediately to a fall in the price
level.
• A lower price level makes employment and production less profitable.
• This induces firms to reduce the quantity of goods and services supplied.
Copyright © 2004 South-Western
The Sticky-Price Theory
• Prices of some goods and services adjust sluggishly in response to changing economic conditions:
• An unexpected fall in the price level leaves some firms with higher-than-desired prices.
• This depresses sales, which induces firms to reduce the quantity of goods and services they produce.
Copyright © 2004 South-Western
Why the Short-Run Aggregate-Supply Curve Might Shift
• Shifts arising • Labor• Capital• Natural Resources.• Technology.• Expected Price Level.
Copyright © 2004 South-Western
Why the Aggregate Supply Curve Might Shift
• An increase in the expected price level reduces the quantity of goods and services supplied and shifts the short-run aggregate supply curve to the left.
• A decrease in the expected price level raises the quantity of goods and services supplied and shifts the short-run aggregate supply curve to the right.
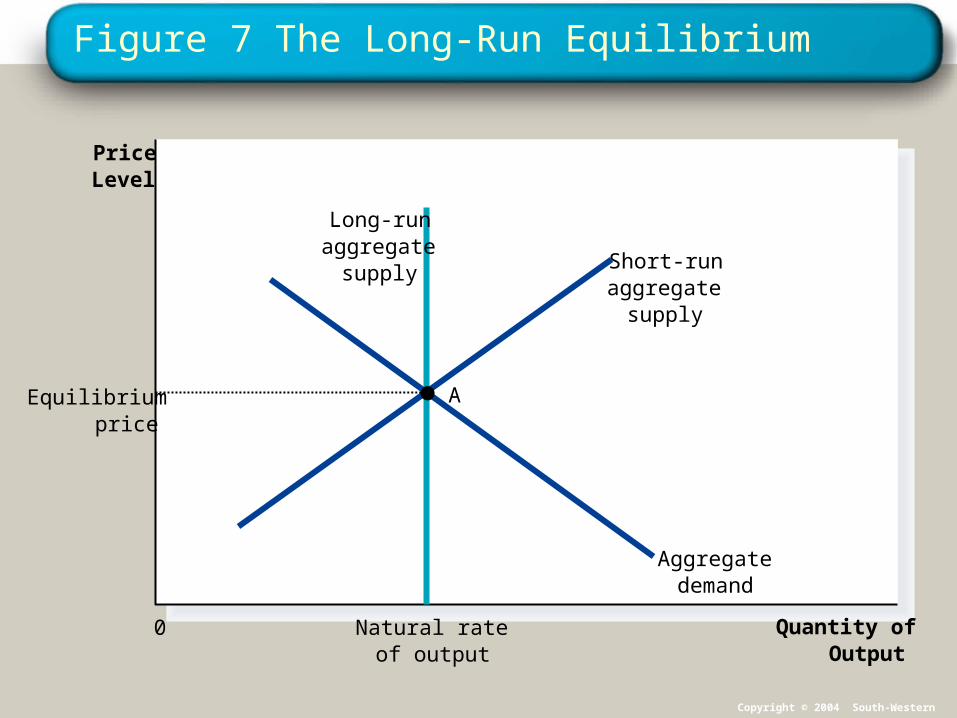
Figure 7 The Long-Run Equilibrium
Natural rateof output
Quantity ofOutput
PriceLevel
0
Short-runaggregate
supply
Long-runaggregate
supply
Aggregatedemand
AEquilibriumprice
Copyright © 2004 South-Western
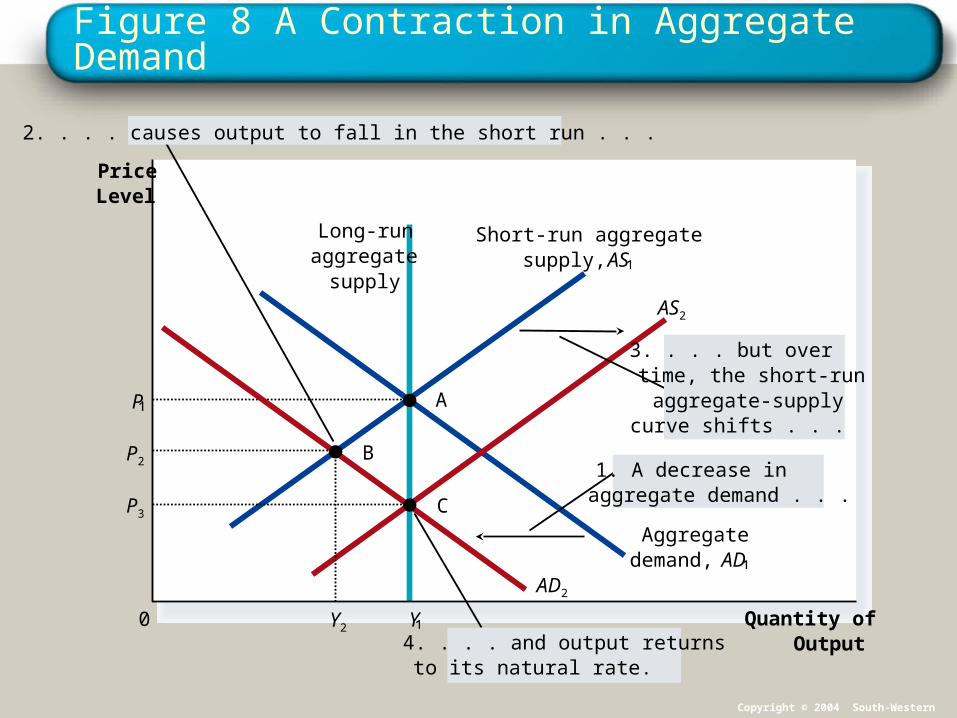
Figure 8 A Contraction in Aggregate Demand
Quantity ofOutput
PriceLevel
0
Short-run aggregatesupply, AS
Long-runaggregate
supply
Aggregatedemand, AD
AP
Y
AD2
AS2
1. A decrease inaggregate demand . . .
2. . . . causes output to fall in the short run . . .
3. . . . but over time, the short-runaggregate-supplycurve shifts . . .
4. . . . and output returnsto its natural rate.
CP3
BP2
Y2
Copyright © 2004 South-Western
Copyright © 2004 South-Western
TWO CAUSES OF ECONOMIC FLUCTUATIONS
• Shifts in Aggregate Demand• In the short run, shifts in aggregate demand cause
fluctuations in the economy’s output of goods and services.
• In the long run, shifts in aggregate demand affect the overall price level but do not affect output.
Copyright © 2004 South-Western
TWO CAUSES OF ECONOMIC FLUCTUATIONS
• An Adverse Shift in Aggregate Supply• A decrease in one of the determinants of aggregate
supply shifts the curve to the left:• Output falls below the natural rate of employment.
• Unemployment rises.
• The price level rises.
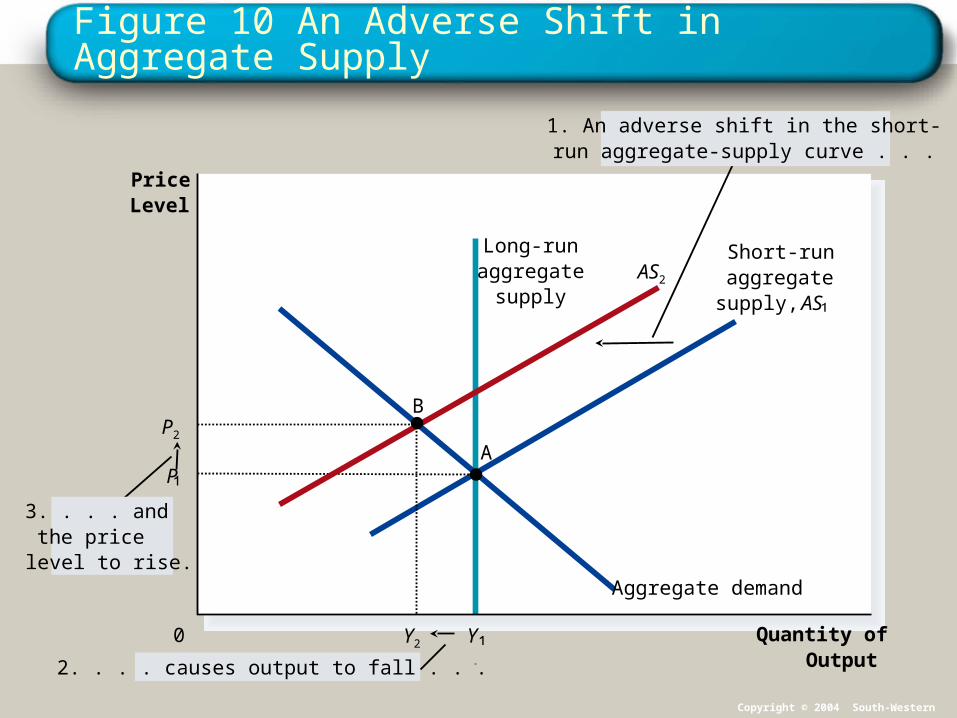
Figure 10 An Adverse Shift in Aggregate Supply
Quantity ofOutput
PriceLevel
0
Aggregate demand
3. . . . and the price level to rise.
2. . . . causes output to fall . . .
1. An adverse shift in the short-run aggregate-supply curve . . .
Short-runaggregate
supply, AS
Long-runaggregate
supply
Y
AP
AS2
B
Y2
P2
Copyright © 2004 South-Western
Copyright © 2004 South-Western
The Effects of a Shift in Aggregate Supply
• Stagflation• Adverse shifts in aggregate supply cause stagflation
—a period of recession and inflation.• Output falls and prices rise.
• Policymakers who can influence aggregate demand cannot offset both of these adverse effects simultaneously.
Copyright © 2004 South-Western
The Effects of a Shift in Aggregate Supply
• Policy Responses to Recession• Policymakers may respond to a recession in one of
the following ways:• Do nothing and wait for prices and wages to adjust.
• Take action to increase aggregate demand by using monetary and fiscal policy.
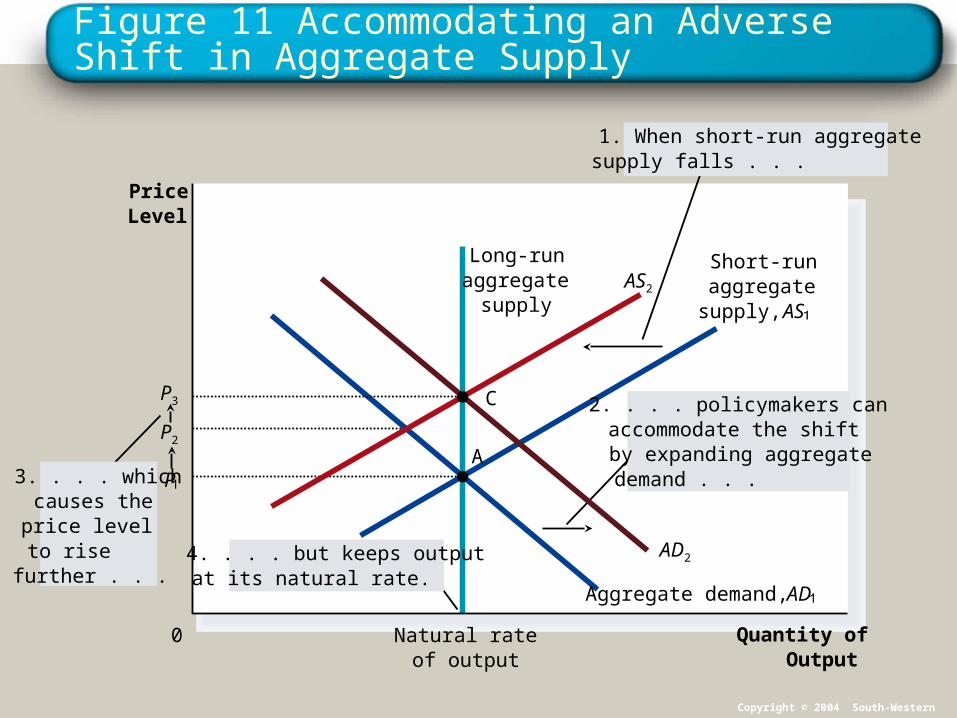
Figure 11 Accommodating an Adverse Shift in Aggregate Supply
Quantity ofOutput
Natural rateof output
PriceLevel
0
Short-runaggregate
supply, AS
Long-runaggregate
supply
Aggregate demand, AD
P2
AP
AS2
3. . . . whichcauses theprice level to rise further . . .
4. . . . but keeps outputat its natural rate.
2. . . . policymakers canaccommodate the shiftby expanding aggregatedemand . . .
1. When short-run aggregatesupply falls . . .
AD2
CP3
Copyright © 2004 South-Western
Copyright © 2004 South-Western
Summary
• All societies experience short-run economic fluctuations around long-run trends.
• These fluctuations are irregular and largely unpredictable.
• When recessions occur, real GDP and other measures of income, spending, and production fall, and unemployment rises.

Copyright © 2004 South-Western
Summary
• Economists analyze short-run economic fluctuations using the aggregate demand and aggregate supply model.
• According to the model of aggregate demand and aggregate supply, the output of goods and services and the overall level of prices adjust to balance aggregate demand and aggregate supply.
Copyright © 2004 South-Western
Summary
• The aggregate-demand curve slopes downward for three reasons: a wealth effect, an interest rate effect, and an exchange rate effect.
• Any event or policy that changes consumption, investment, government purchases, or net exports at a given price level will shift the aggregate-demand curve.
Copyright © 2004 South-Western
Summary
• In the long run, the aggregate supply curve is vertical.
• The short-run, the aggregate supply curve is upward sloping.
• The are three theories explaining the upward slope of short-run aggregate supply: the misperceptions theory, the sticky-wage theory, and the sticky-price theory.
Copyright © 2004 South-Western
Summary
• Events that alter the economy’s ability to produce output will shift the short-run aggregate-supply curve.
• Also, the position of the short-run aggregate-supply curve depends on the expected price level.
• One possible cause of economic fluctuations is a shift in aggregate demand.
Copyright © 2004 South-Western
Summary
• A second possible cause of economic fluctuations is a shift in aggregate supply.
• Stagflation is a period of falling output and rising prices.