age differences in visual abilities in nighttime driving field conditions professor: liu student:...
TRANSCRIPT

Age differences in visual abilities in nighttime driving field conditions
Professor: LiuStudent: Ruby
www.themegallery.com
Company LogoCompany Logo
Objective
This study was to provide field data on age differences in sign easy for read and object detection.
Different age groups were tested for nighttime visual ability.

www.themegallery.com
Company LogoCompany Logo
References
The hazard detection have primarily focused on the effects of roadway lighting. (Janoff & Staplin, 1987)
Most studies discussed the visual function and inferences are drawn about the impkications of age differences and driving safety. (Ball & Owsley, 1997; Shinar & Schieber, 1991)

www.themegallery.com
Company LogoCompany Logo
References
Older drivers’ easily read distances were 65-77% of younger drivers. (Sivak, Olson, & Pastalan, 1981)
The studies examining age differences, used Landolt rings to measure the easily read. (Olson & Bernstein, 1997)

www.themegallery.com
Company LogoCompany Logo
Method
Participants Older driver group-10 participants.
53-75 years old (average of 65.6 years) Younger drivers group-10 participants.
19-25 years old (average of 22.5 years)
All participants had corrected acuity of 20/25 or better.

www.themegallery.com
Company LogoCompany Logo
Method
Field Site and Conditions This experiment consisted of three roads:
Road A --- was used for sign easily read assessment which included two sign easily read. (the length was 2000 feet)
Road B --- was used for hazard detection. (the length was 500 feet)
Road C --- was used for the pedestrian detection task. (the length was 1000 feet)
Using photometric to measure the peripheral light at each night of testing.
www.themegallery.com
Company LogoCompany Logo
Method
Apparatus1/2 A 1993 Ford Taurus vehicle. A Numetrics Nitestr distance measuring instrument
was used to record visibility distances. Three visibility conditions were tested:
Standard clear weather. Simulated inclement weather wear a plastic vis
or. Glare a set of standard headlamps mounted o
ncoming in the opposite travel lane.

www.themegallery.com
Company LogoCompany Logo
Method
Apparatus2/2 The easily read task consisted of an 8’’Landolt ring
Placed on a 24’’ sign background. The object detection task consisted of two objects.
The small road hazard object was an upside-down bowl measuring 7’’ high and 13’’ wide.
The pedestrian object was a child-sized 3’6’’tall. The average reflectance clothing was gray clothing. The low reflectance clothing was dark red.

www.themegallery.com
Company LogoCompany Logo
Method
Experimental design One lap through the test course 2 sign easily read
and 2 object detection. Each participants completed 2 practice laps and 16
experimental laps.
www.themegallery.com
Company LogoCompany Logo
Method
Procedure
Participants were seated in the front passenger seat of the test vehicle.
Participants were called out the position of the gap or the position of the object as soon as they could.
When the participants response, the experimenter would press the Numetrics and record the distance.

www.themegallery.com
Company LogoCompany Logo
Results
Sign easily read 1/2
www.themegallery.com
Company LogoCompany Logo
Results
Sign easily read 2/2 Young group correctly identified the Landolt gap 147
feet further away the older group at clear weather. The younger group average was 467 feet and the ol
der group average 320 feet. older group read the signs at 65% of the distance of the younger group.
The young group average was 192 feet while the older group was 126 feet. (at SIW situation.)
The older group’s distance as a percent of the younger group’s performance was again 65%.
There were no significant main effects for easily read distance under SIW.
www.themegallery.com
Company LogoCompany Logo
Results
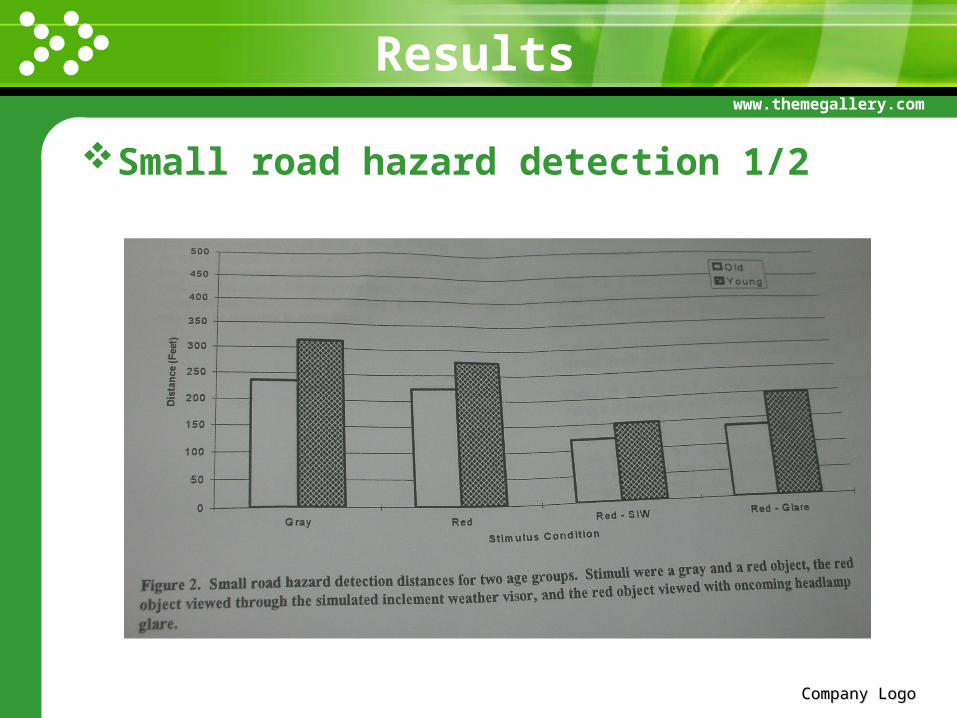
Small road hazard detection 1/2

www.themegallery.com
Company LogoCompany Logo
Results
Small road hazard detection2/2
The gray object across age groups had longer detection distances. (p=0.066)
The older group’s detection distances were 78% of the younger group.
The presence of glare headlights significantly hurt the detection distances of both ages, an average 37% reduction.
www.themegallery.com
Company LogoCompany Logo
Results
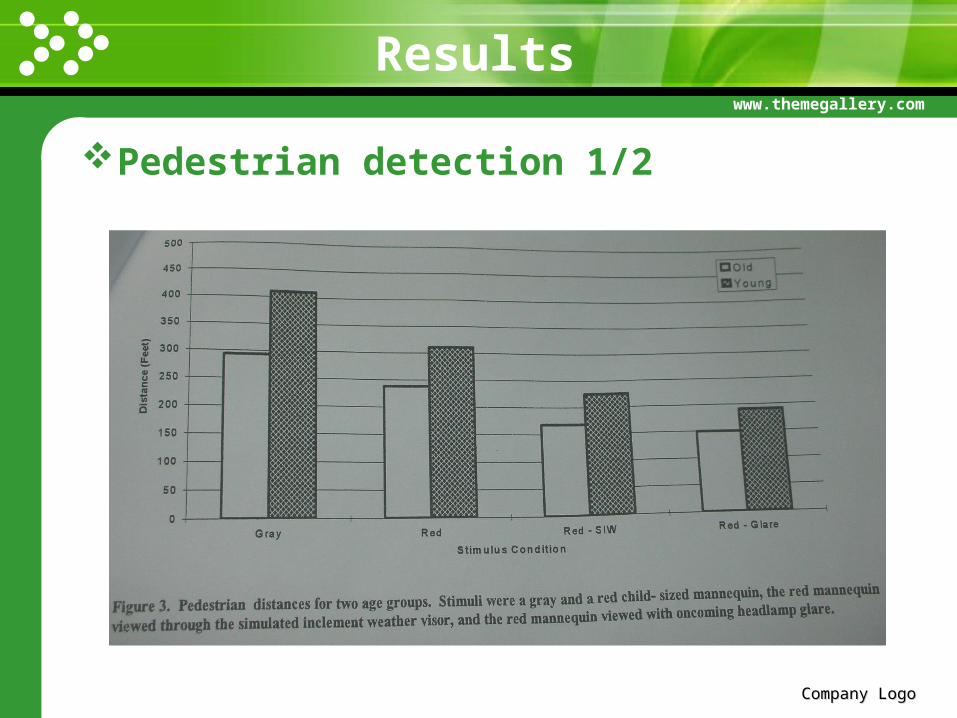
Pedestrian detection 1/2
www.themegallery.com
Company LogoCompany Logo
Results
Pedestrian detection2/2
The gray clothing was significant longer detection distances for both age groups.
The older group’s detection distances were 75% of the younger group.
The SIW reduced the detection of pedestrian targets fro both groups by 37%.
www.themegallery.com
Company LogoCompany Logo
Discussion
Older drivers have reduced easily read and object detection distances when compare to a younger group of people.
The glare conditions results severe pedestrian detection losses for the older groups.participants were significant showed their visual sea
rch for the target in a range, which forced them to look more directly into the glare headlights.
(Shinar & Schieber, 1991)