after-hours trading in equity futures markets
TRANSCRIPT

The authors thank Jorge Andras-da-Silva and Tugrul Vehbi for excellent research assistance and MichaelBarclay, Terence Hendershott, Alexander Ten Holter, Alex Kurov, and Simon Taylor for useful discussionsand an anonymous referee for comments. Goodhart acknowledges the ESRC Research Programme on WorldEconomy and Finance, Phase 1, via their grant to the FMG to study “The Stability of the Global FinancialSystem, Regulation and Policy Response.”
*Correspondence author, CFAP, Judge Business School, Trumpington St., Cambridge CB2 1AG, U.K. Tel: �44-0-1223-764-227, e-mail: [email protected]
Received October 2007; Accepted April 2008
� Mardi Dungey is at the Centre for Financial Analysis and Policy, University of Cambridge,Cambridge, U.K. and Centre for Applied Macroeconomic Analysis, Australian NationalUniversity, Canberra, Australia.
� Luba Fakhrutdinova is at the Centre for Financial Analysis and Policy, University of Cambridge,Cambridge, U.K.
� Charles Goodhart is at the Financial Markets Group, London School of Economics, London, U.K.
The Journal of Futures Markets, Vol. 29, No. 2, 114–136 (2009)© 2008 Wiley Periodicals, Inc.Published online in Wiley InterScience (www.interscience.wiley.com).DOI: 10.1002/fut.20354
AFTER-HOURS TRADING IN
EQUITY FUTURES MARKETS
MARDI DUNGEY*LUBA FAKHRUTDINOVACHARLES GOODHART
Although it is well known that electronic futures data absorb news (slightly) inadvance of spot markets the role of the electronic futures movement in out-of-hours trading has not previously been explored. The behavior of the 24-hour tradein the S&P 500 and NASDAQ 100 futures market reveals the important role ofthese markets in absorbing news releases occurring outside of normal tradinghours. Peaks in volume and volatility in this market occur in conjunction with U.S.8:30 A.M. EST news releases, before the opening of the open-outcry markets, andin a less pronounced fashion immediately post-close the open-outcry market.Price impact in these markets is statistically higher in the post-close than in thepre-open periods. © 2008 Wiley Periodicals, Inc. Jrl Fut Mark 29:114–136, 2009

After-Hours Trading in Equity Futures Markets 115
Journal of Futures Markets DOI: 10.1002/fut
INTRODUCTION
Spot and futures equity markets generally have formal opening and closingtimes for floor-based trade, but increasingly these markets can be accessed viaelectronic trading systems anywhere in the world, 24-hours a day, though not(so far at least) over the weekend break. One reason why this is important isthat many researchers in this field have taken the temporal passage of the spot,or futures (for the same set of hours as the spot market) markets around theworld as providing an indication of, or proxy for, causal relationships betweenmarkets. Thus, for example, the change in price between the open and close ofthe New York Stock Exchange (NYSE) is used as an explanatory variable inequations to model the change in price between the previous close to the newopen of the Tokyo Stock Exchange, or the London Stock Exchange (Engel, Ito, &Lin, 1990).
Although this process is not biased, it may distribute the effects of newsincorrectly in 24-hour markets. For example, many economic news announce-ments in the U.S. occur at 8:30 A.M. EST, before the opening of the NYSE, seealso Andersen, Bollerslev, Diebold, and Vega (2007), who for this reason usefutures rather than spot market data. Company data are also often announcedafter the market has officially shut; in previous times this was at least partlyto protect the companies from over reactions to data, allowing analysts time toabsorb the information before responding with market actions on the next day. More recently the advent of extended hours trading on ElectronicCommunication Networks (ECNs) has increased the hours for spot trading inequity markets. In the presence of 24-hour trading electronic markets, theeffects of news in equity markets should be incorporated immediately, just as inthe foreign exchange markets; for an analysis of diurnal patterns in foreignexchange markets, see Huang and Masulis (1999).
This study shows the effects of after-hours trade on the absorption of newsreleases using Global Exchange (GLOBEX) data on S&P 500 and NASDAQ100 futures contracts traded on the Chicago Mercantile Exchange (CME).
The electronic futures markets of the CME provide a particularly interestingset of circumstances for investigating the impact of market structure on price dis-covery. Three products essentially co-exist. The first is the standard futurespit–contract, which trades in the physical pit during the regular trading hours of8:30 A.M. until 15:15 P.M. Central Standard Time (CST). The second is the cor-responding electronic product of the same contract size, which trades on theGLOBEX exchange during the nonpit trading hours. Both contracts can co-existbecause of the different pricing structures that favor action during regular trad-ing hours where possible. The third product is the newer E-minis, which tradeonly electronically around the clock and whose size is around one-fifth of the size
of the standard contract. This final category has experienced enormous growth inthe past five years, see Chicago Mercantile Exchange (2005).
The two electronic contracts, standard size and E-mini, currently co-existfor pricing reasons: for large players the standard contract is substantiallycheaper. Despite the rapid growth of the E-minis, this study concentrates onthe standard contract mainly because of its importance for the major players;importantly, however, preliminary investigations reveal that many of the pat-terns observed here are also apparent in the E-mini data.
Although it is already known that futures markets lead spot markets inabsorbing information, it has also become apparent that electronic trading maylead open outcry; for example, Hasbrouck (2003) and Kurov and Lasser(2004). Only relatively recently have researchers begun to investigate the elec-tronic out-of-hours trade in futures; see Barclay and Hendershott (2003). Theactivity of the after-hours equity futures market is described in some detail inthe second section. The market shows clear characteristics of higher trade vol-ume, volatility, and price changes with news releases when those news releasesoccur outside the regular trading hours.
The market is found to be most active in terms of transacted volume andvolatility in the two hours immediately preceding and immediately followingthe opening hours of the NYSE. These are hours that are regarded as dominatedby U.S. factors, whether “news” from the U.S. or reactions to overnight eventsby the U.S. markets, and are also the hours in which many of the ECNs oper-ate their extended market hours. The Asian trading period (from 19:00 to 1:00CST) exhibits little activity, but the market is significantly livelier in theEuropean space (from 1:00 to 6:30 CST) although not comparable to the pre-open U.S. period. However, the greatest price impact revealed by the VARmethodology of Hasbrouck (1991) is uncovered in the thinner volume, post-close period. Price impact during after-hours trading otherwise is relatively low.
This article proceeds as follows. The second section describes the featuresof the out-of-hours equity futures contracts for the S&P 500 and NASDAQ100. The third section characterizes the volume of trade in these contracts,including the importance of news effects, whereas the fourth section turns tomeasures of price impact in the different time zones, and measures of informedtrading are discussed in the fifth section. The sixth section concludes.
ROUND-THE-CLOCK EQUITY FUTURES MARKETS
Strong linkages between equity markets across time zones are well documented.In general, price spillovers occur as price changes in the foreign markets (andrelevant information) are incorporated into the local market (Solnik, 1983; Cho,
116 Dungey, Fakhrutdinova, and Goodhart
Journal of Futures Markets DOI: 10.1002/fut

After-Hours Trading in Equity Futures Markets 117
Journal of Futures Markets DOI: 10.1002/fut
Eun, & Senbet, 1986, on stock markets). In this vein, Eun and Shim (1989)study linkages among the standard trading hours for nine developed stock markets and report evidence of market innovations from the U.S. flowing to the other markets, with limited evidence of foreign market influence back to theU.S. market. Recent studies of ECNs have concluded that trade out of regulartrading hours improves price discovery and efficiency in the regular market butthat higher trading costs deter maximum price efficiency outside of hours; seeBarclay and Hendershott (2003) and Barclay, Hendershott, and Jones (2007).
Rapid development in technology has permitted the move from floor-basedmarkets to screen-based systems. In most markets the transmission to elec-tronic trade has resulted in the complete loss of floor trading. However, in acouple of instances both survive contemporaneously, notably in instrumentstraded on the CME. For a number of equity futures contracts based on theS&P 500 and the NASDAQ 100 an open-outcry pit operates during the regulartrading hours of 8:30 A.M. until 3:15 P.M. CST. A second screen-based systemoperates through the GLOBEX Trading System.1 A summary comparison of thebehavior of the electronic market and the open-outcry market is found inCoppejans and Domowitz (1999) using E-minis data. A plausible reason for the continued existence of the two markets is the higher transaction fees in theafter-hours trading (see the CME website for details of pricing structures thatvary with the type of market participant, the volume transacted, and the instru-ment), but can be generalized to the extent that out-of-hours trading is moreexpensive than during regular trading hours.
The sample of this study concerns S&P 500 and NASDAQ 100 futures con-tracts, which have cash settlement in March, June, September, and Decemberon the close of the final trading day in each period, usually the Thursday closestto the 15th of the month. Activity and interest in this market is growing rapidly;see Chicago Mercantile Exchange (2005). The CME also reports spectaculargrowth in options traded on these products since their introduction in late 2003.The basic characteristics of the contracts are given in Table I.
The data for this study have been obtained from the CME and compriseunsigned trades posted on the GLOBEX Trading System. The sample coversthe period from January 2003 to September 2006, which in the case of theS&P 500 contract involves some 2 million observations, and for the NASDAQ100 about 20% of that at just over 437,000 observations.
The choice of the standard rather than the E-mini contract is based partlyon the consideration that large market players continue to transact substantial
1 GLOBEX is an international, automated order entry and matching system, which has a network extendingto ten financial centers, including New York, Chicago, London, and Tokyo. It opens almost 24 hours a daywith down times from 4:30 to 5:00 P.M. CST daily for maintenance and weekend closure from 3:15 P.M. CSTFridays to 6:00 P.M. CST Sundays.

118 Dungey, Fakhrutdinova, and Goodhart
Journal of Futures Markets DOI: 10.1002/fut
positions in the standard contract. Although Hasbrouck (2003) has revealedthat the E-minis dominate price discovery over the open-outcry movementthere has not, to the authors’ knowledge, yet been a study comparing the E-minis with the standard contracts. Part of the attraction of comparing E-miniswith the pit–contracts is that they are both open contemporaneously, so that itis possible to examine their relative efficiency, as in Hasbrouck (2003) and inCoppejans and Domowitz (1999).
The standard contracts traded on the pit and electronically do not overlapin their trading periods between the open outcry and electronic markets; theyare the same contract but traded on different trading platforms with differentclearing fees, although a trader can easily change positions by operating oneither platform. The relative cost advantage of operating in the standard con-tract during regular trading hours and the ability to use the same instrument inthe after-hours trade account for the continued liquidity in the electronic after-hours market, despite the gains of the E-mini.
The differences between the open outcry and electronic markets do mean thatit is more difficult to construct comparisons on trading volume analogous to thoseconstructed for ECN trades on the NASDAQ by Barclay and Hendershott (2003).On the other hand, the GLOBEX platform truly completes the out-of-regular trad-ing hours time zone, as opposed to ECNs, which merely extend the trading day(closing around 8 P.M. EST and opening around 6.00 A.M. EST, although recentlyopening has begun as early as 4:00 A.M. EST to catch the European trading zone).
AFTER-HOURS VOLUME
Figure 1 illustrates the average daily volume transacted in the S&P 500 andNASDAQ 100 futures contracts across a day for the period of January 2003 to
TABLE I
Characteristics of the S&P 500 and NASDAQ Futures Contract GLOBEX Trading
Contract size NASDAQ: $100 times the indexS&P 500: $250 times the stock price index
Minimum fluctuation 1 point � $2.50
Contract listing March, June, September, December
Last day of trade Thursday prior to third Friday of contract month
Trading limits 5.0% increase or decrease from prior settlement priceTrading hours
Monday–Thursday 5:00 P.M. CST–8:15 A.M. CST3:30 P.M. CST–4:30 P.M. CST
Shutdown 4:30 P.M. CST–5:00 P.M. CST
Sunday and holidays 5:00 P.M. CST–8:15 A.M. CST
Source: CME web page: www.cme.com, www.spglobal.com

After-Hours Trading in Equity Futures Markets 119
Journal of Futures Markets DOI: 10.1002/fut
September 2006, with the units given as the number of contracts transacted.The horizontal scale is the 24-hour clock for CST, and the dashed vertical linesdivide the day into several time zones.
These time zone designations are given in Table II in a 24-hour clock forboth CST and GMT for ease of conversion (EST is the equivalent of CST�onehour). These times do not correspond to the full normal trading hours ofexchanges in those markets, with the exception of the Chicago pit period. Theglobal trading day for both equities begins at 09:00 local time in Tokyo, which is19:00 CST. At 01:00 CST trading passes to London, where it is 07:00 GMT.Immediately before the opening of the pit market, and aligned with 07:30 A.M. inthe New York markets, trading is designated as the pre-open period at 06:30 CST.This continues until the close of the GLOBEX trade immediately before (butwith a 15-minute gap between) the open of the Chicago open-outcry pit at 08:30CST. GLOBEX-based trade resumes at 15:15 CST and the period until 19:00 CSTis denoted as the post-close period. Within that period the GLOBEX system clos-es for maintenance everyday between 16:30 and 17:00 CST.
The electronic market displays a distinct intraday pattern. During Tokyo trad-ing hours there is no evidence of volume spikes, and the market essentially remainsquiet until European trade begins when a prominent rise in volume occurs at02:00 CST (08:00 GMT). The pre-open period is the period of consistently highestaverage trading volume per day on the GLOBEX platform.2 The spike in volume in
0
80
160
240
320
400
480
01:00
NASDAQ
S&P
CST
6:30
Postclose
Chicago pitLondon
15:30 19:00
Tokyo
24:008:15
Preopen
FIGURE 1Average volume in S&P 500 and NASDAQ 100 futures contracts by a 15-minute interval
(January 2003–September 2006).
2Although their study omitted nontrading hours, Coppejans and Domowitz (1999) also noted the high vol-ume immediately before opening, which they attributed to pre-opening positioning in the absence of a formalpre-opening mechanism such as found in other markets.

120 Dungey, Fakhrutdinova, and Goodhart
Journal of Futures Markets DOI: 10.1002/fut
the pre-opening period is pronounced, and despite being only one-tenth of theafter-hours trading day accounts for almost 30% of the total volume transacted perday over the sample period. Post-close trade is also relatively high.
A comparison of Figure 1 with the corresponding trading time breakdownfor NASDAQ stocks in Figure 1 of Barclay and Hendershott (2003) is reveal-ing. Their figure covers the extended trading day from 06:00 EST to 20:00 ESTfor the top 250 NASDAQ stocks by volume for the period March to December2000. Despite the differences in data source and sample period the figuresshow a somewhat similar pattern, with a large morning volume peak and asmaller immediate post-close volume peak. However, there are important dif-ferences in the timing of the volume peaks in the two samples. In the spotNASDAQ data of Barclay and Hendershott the peaks occur at 09:30 EST, afterthe opening of the pit. The pre-open trade is relatively smaller, although theydo record that it triples between the half hour beginning 08:00 and 08:30 (byway of comparison the trade volume in the futures data rises by 73 and 78% forthe S&P 500 and NASDAQ, respectively). The post-close peak in Figure 1occurs at 15:30 CST, which is an hour later than the post-close peak Barclayand Hendershott (which is 15:30 EST). The fact that the secondary peaks inboth markets occur immediately after the close suggests that there is some-thing about the closing that is important to volume, rather than the release ofinformation, which should hit both markets simultaneously.3 One possibility isthat market participants desire the anonymity that can come via the electronicafter-hours market and are willing to pay the higher cost. 4 This prospect isscope for future work in linking to a behavioral finance model.
TABLE II
Designated Time Zones and Trading Hours in CST and GMT
Designated Time Zone CST Hours GMT Hours Number of Hours
Tokyo 19:00–01:00 01:00–07:00 6London 01:00–06:30 07:00–12:30 5.5Pre-open 06:30–08:15 12:30–14:15 1.75Chicago pit 08:30–15:15 14:30–21:15 6.75Post-close 15:15–19:00 21:15–01:00 3.5Market closure 16:30–17:00 22:30–23:00 0.5
3This observation is based on the average of data from two different samples and data sets. Ideally the twosample periods would correspond; however, it seems unlikely that this will affect the outcomes presented here.4We are grateful to participants at the Federal Reserve Bank of Atlanta—Cambridge—RPI Conference onFinancial Integration in November 2007 for discussions on this possibility. Speculative activity is also a pos-sibility in this market, although it is usually ignored in most analysis of market structure. Day traders are,however, arguably less present in the larger contract future indices under examination here than in the E-minis market (a Google search on day trading and E-minis brings up over 100,000 entries).

After-Hours Trading in Equity Futures Markets 121
Journal of Futures Markets DOI: 10.1002/fut
Table III gives the average daily volume in each time zone in terms of thenumber of contracts traded. Unlike the after-hours trade analysis in the NAS-DAQ by Barclay and Hendershott (2004), who report an average of only 100transactions per day in each of the pre-open and post-close periods, there is asubstantial volume transacted during the after-hour periods. The currentdataset reveals that the average number of contracts traded in the pre-openperiod each day is almost 730 for the S&P and 187 for the NASDAQ. The low-est trading period is the Tokyo period, which is also the longest of the samplesin the day, pointing to very low liquidity in this time zone. The final twocolumns of Table III give the average number of trades per minute for each ofthe time period. To make some comparison with the open-outcry pit,Hasbrouck (2004) records an average of 12 transactions per minute for theS&P 500 contract.
In after-hours trading, the London time zone trades the greatest numberof contracts for both instruments—at some three contracts per minute. Theshorter, more intense pre-open period records an average of six contracts perminute.
Clearly the S&P 500 futures contract has lower volume in the after-hoursthan the regular trading hours period, but the difference is nowhere near asextreme as that recorded in the ECN data to date. The NASDAQ figures arenot as impressive; in London there is less than one contract per minute trade,but again this doubles to almost 1.6 per minute in the pre-open trade.
The pre-open period can potentially incorporate a lot of information, inpart because of the generally greater number of traders active in the U.S. timezone, but not least because of the presence of important news releases at 08:30EST (07:30 CST), corresponding precisely to the timing of the spike in the vol-ume data.
Immediately following the close of the CME at 15:15 CST (which isequivalently 16:15 P.M. EST) there is a surge in activity. This average picture
TABLE III
Average Daily Volume in Different Time Zones for the S&P 500 and NASDAQ 100Futures Contracts (January 2003 to September 2006)
Number of Contracts Trades per Minute
Time Zone S&P 500 NASDAQ S&P 500 NASDAQ
Tokyo 277.2 99.8 0.77 0.28London 1072.4 259.2 3.25 0.79Pre-open 729.9 187.5 6.08 1.56Post-close 277.2 115.4 1.69 0.55Total after-hours 2435.4 661.9 2.39 0.65
122 Dungey, Fakhrutdinova, and Goodhart
Journal of Futures Markets DOI: 10.1002/fut
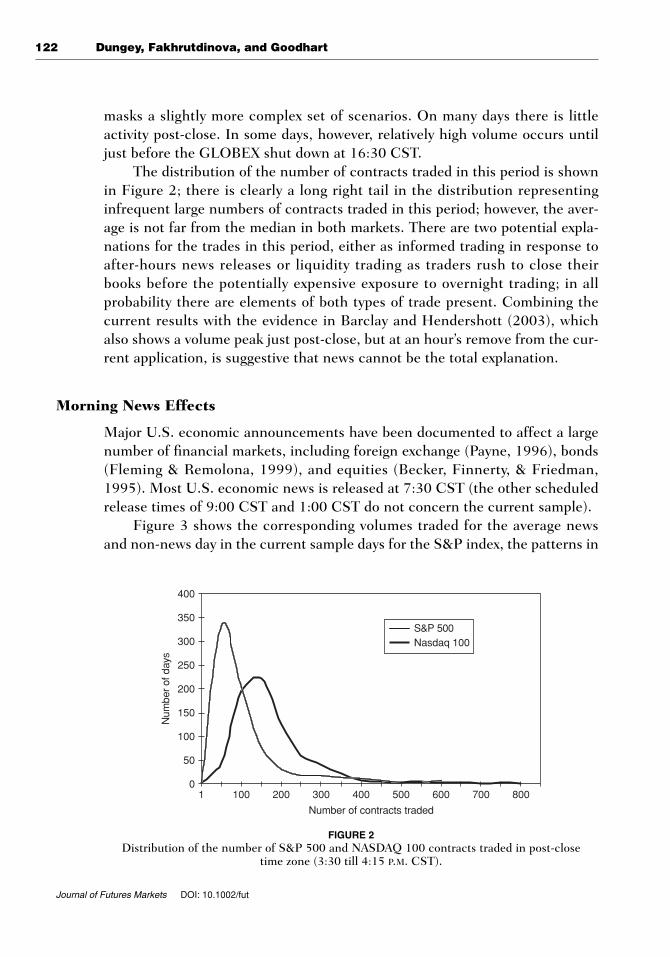
masks a slightly more complex set of scenarios. On many days there is littleactivity post-close. In some days, however, relatively high volume occurs untiljust before the GLOBEX shut down at 16:30 CST.
The distribution of the number of contracts traded in this period is shownin Figure 2; there is clearly a long right tail in the distribution representinginfrequent large numbers of contracts traded in this period; however, the aver-age is not far from the median in both markets. There are two potential expla-nations for the trades in this period, either as informed trading in response toafter-hours news releases or liquidity trading as traders rush to close theirbooks before the potentially expensive exposure to overnight trading; in allprobability there are elements of both types of trade present. Combining thecurrent results with the evidence in Barclay and Hendershott (2003), whichalso shows a volume peak just post-close, but at an hour’s remove from the cur-rent application, is suggestive that news cannot be the total explanation.
Morning News Effects
Major U.S. economic announcements have been documented to affect a largenumber of financial markets, including foreign exchange (Payne, 1996), bonds(Fleming & Remolona, 1999), and equities (Becker, Finnerty, & Friedman,1995). Most U.S. economic news is released at 7:30 CST (the other scheduledrelease times of 9:00 CST and 1:00 CST do not concern the current sample).
Figure 3 shows the corresponding volumes traded for the average newsand non-news day in the current sample days for the S&P index, the patterns in
0
50
100
150
200
250
300
350
400
1 100 200 300 400 500 600 700 800
Number of contracts traded
Num
ber
of d
ays
S&P 500Nasdaq 100
FIGURE 2Distribution of the number of S&P 500 and NASDAQ 100 contracts traded in post-close
time zone (3:30 till 4:15 P.M. CST).

After-Hours Trading in Equity Futures Markets 123
Journal of Futures Markets DOI: 10.1002/fut
the NASDAQ are similar. The news days are categorized as those days on whichany of the following major macroeconomic announcements are released: PPI,retail sales, GDP, nonfarm payrolls, CPI. The peak in the pre-open volumeshown in Figure 1 is clearly related to news events, and there is some evidencethat news impacts the post-close volume slightly also. Volume on those days issubstantially higher than on the nonannouncement days—for reference com-pare the vertical scale of Figure 3 with that of Figure 1.5
Afternoon News Effects
One possible reason for the activity in the post-close period is the long-standingtradition of company announcements in this period. Originally this was a strat-egy intended to give markets sufficient time to assess information properlybefore acting upon it, and so reducing unwarranted volatility. However, withthe advent of extended hours trading this is clearly no longer the case, and infact the announcements may be emerging into illiquid markets. In the currentapplication the instrument is a futures contract on an equity index. No onecomponent of the index accounts for a substantial proportion of the index, and,
0
200
400
600
800
1000
1200
01:00 6:30
Postclose
Chicago pitLondon
15:30 19:00
Tokyo
24:008:15
CST
Preopen
newsnonews
FIGURE 3Average volume in S&P 500 futures contracts on news and no-news days,
January 2003–September 2006.
5The figures include the day following a public holiday in the data. On these days, some of which containnews announcements, the CME trading hours differ from normal days, usually opening later. This meansthat there are some trades on GLOBEX recorded after 9:00 A.M. for those days. After checking that thesedays were not on average substantially different from the remainder of the sample, the trades in the post-9:00A.M. time were deleted from this study, but the usual GLOBEX trading times on those days were not. Thepertinent holidays are New Year’s Day, Martin Luther King’s Birthday, Washington’s Birthday, Memorial Day,Independence Day, Labor Day, Columbus Day, Veterans Day, Thanksgiving, and Christmas Day.

124 Dungey, Fakhrutdinova, and Goodhart
Journal of Futures Markets DOI: 10.1002/fut
given the stop rules on exchanges, even a company announcement that resultsin sufficient change in that company’s stock to result in a stop should notdirectly cause a substantial change in the index. The announcement has tobecome in some sense systemic (or contagious) or provide information aboutthe general state of the economy to have an impact.
Liquidity traders are expected to close positions at the end of trading days,being unwilling to hold the settlement risk and overnight positions. Brock andKleidon (1992) in footnote 2 of their paper state that even with the possibility of24-hour trade (as here), without continuous settlement process traders wouldstill be most likely to wish either to be at a zero or short position overnight.Barclay and Hendershott (2004) show that waiting for cheaper regular tradinghours is not necessarily advantageous to liquidity traders, and that there areprofits to be made from liquidity provision after hours. The high potential risk ofretaining an open position overnight leads to high demand for liquidity at theend of the regular trading hours, and it is plausible that with the extended trad-ing in spot markets because of ECNs and the development of the new 24-hourGLOBEX platform at least some of the post-close volume seen in the equityfutures market is liquidity trading. However, comparisons between results forindividual stocks and stock indices such as here are complicated by differentincentives for trading these different instruments. The price impact results cal-culated in the fourth section reveal that the post-close market for the equityfutures index is relatively expensive trade. It is possible that the characteristicsare consistent with a rush to meet end of day limits by the market participants.In this article, however, concentration is on the extent to which trade can beascribed to information arrival.
To examine the potential impact of company news announcements, com-pany earnings announcements occurring in the post-close period are consid-ered. Quarterly earning releases for many large firms regularly occur in thepost-close periods during January, April, July, and October each year.Denoting each of these four months as the announcement months, Table IVprovides the average number of contracts traded per day during the time peri-od of 3:30 to 4:15 CST in each of the earnings announcement months as aproportion of the average number of contracts traded per day in the 3:30 to4:15 CST period.
The data for the earnings months are compared with the remainingmonths in the year via the column labeled “Rest.” Thus, the NASDAQ resultsindicate that the contracts traded in the earning months are greater than dur-ing the total sample (as the ratio is above 1 in each case), and subsequently innonearnings announcement months the ratio of contracts traded is only 0.76of the total sample. In the case of the S&P 500 the earnings announcementmonths are also higher than the average for the year and lower in the “Rest.”

After-Hours Trading in Equity Futures Markets 125
Journal of Futures Markets DOI: 10.1002/fut
The disparity is not as great with the S&P 500 as the NASDAQ—potentiallyreflecting more high-tech stocks with earnings releases in the post-close periodin general, possibly due to their West Coast location. The month with thelargest number of contracts traded is clearly October in both indices. This maybe a consequence of (previously noted) higher fourth quarter responsiveness torevisions for the next year’s outlook (see Cornell and Landsman, 1989).Although the sample averages are higher in the announcement months, the dif-ference is not statistically significant.
In examining the tails of the distributions given in Figure 2, a number ofthe largest numbers of contracts traded coincide with earnings announcementsfor the high-tech companies; for example, IBM, Microsoft, Intel, Google,Yahoo!, Dell, Texas Instruments, which are primarily located on the West Coastof the U.S. There are, however, a substantial number of days in the tails of thetwo distributions that are out of earning announcement months and do notseem to be associated with news about particular companies.
For both indices the 24 days in the tail of the distribution were examined,making up 3.3% (3.2%) of the distribution for the NASDAQ (S&P 500). Theamounts traded in this tail range from 169 to 394 contracts for the NASDAQ and393 to 1,147 contracts for the S&P 500. Of these 24 days, 5 occurred outside ofthe earnings announcement months in the NASDAQ and 9 in the S&P 500.
These days are provided in Table V; two days were common to both indices(4 February 2003, 25 September 2003). As indicated in Table V, six of thesedays could be associated with general economic conditions rather than specificnews releases. Most relevant news related to general economic or politicalnews conditions. In particular, for both indices, the following were recorded in news reports: military action against Iraq (6 March 2003); general economicdata released earlier in the day (4 February 2003, 14 August 2003, and 23 May2006); and perceived weakness or merger activity in the technology sector(2 June 2003, 3 February 2004, and 23 May 2006).
TABLE IV
Average Contracts Traded per Day in the Period 3:30 to4:15 CST in Each Index by Month as a Proportion of the
Total Average Contracts Traded per Day in the Period
S&P 500 NASDAQ 100
January 1.26 1.53April 1.14 1.50July 1.04 1.29October 1.35 1.61Rest 0.90 0.76

126 Dungey, Fakhrutdinova, and Goodhart
Journal of Futures Markets DOI: 10.1002/fut
On the remaining six days in the tail there was no readily identifiablenews-generating activity. The mixture of results here suggests that there issome underlying level of liquidity trade in this market overlaid with informedtrade on the back of news announcements. Market participants clearly findmerit in being involved in this market in order to respond to price changes asthe result of out-of-normal trading hours news as well as for end of day trading.
Weekend Effects
The anomalous behavior of many asset prices over weekends has been recordedacross equity markets. The GLOBEX futures market ceases trading for the week-end on Fridays at 15:15 CST and reopens at 18:00 CST on Sunday evening(which corresponds to 08:00 A.M. Monday morning in Tokyo and 09:00 A.M. inSydney, local time). Activity in this early Monday morning trading period isreputed to be quite pronounced, as the news of the weekend is absorbed into themarket well ahead of the opening of the floor-traded futures or spot markets forthe equity indices. However, Figure 4 shows that the volume of Sunday eveningtrade in the S&P 500 is no more pronounced than that of any other average day,the same holds true for the NASDAQ (not shown here).
However, when early Monday morning trade is compared with the averagetrade on no-news days it is quickly seen that the average volume on Mondaymornings is greater.6 However, the Monday morning trade is lower than on the
TABLE V
Large Trading Volumes Occurring in Nonearnings Announcement Months and Associated News
Index Date Trades News
S&P 04-Feb-03 363 Manufacturing growthND 640S&P 27-Feb-03 512ND 06-Mar-03 211 IraqS&P 02-Jun-03 609 Software company mergers, biotechS&P 05-Aug-03 420S&P 14-Aug-03 1015 Beginning data and rising treasury yieldsS&P 25-Sep-03 453ND 171ND 03-Feb-04 240 Manufacturing, weakness in the technology sectorS&P 10-Aug-04 451ND 02-Dec-04 178S&P 31-Oct-05 393S&P 23-May-06 567 Weakness in technology, economic growth
6Two Monday mornings in the sample included news announcements. Excluding them from the weekendeffects makes little difference to the reported results.

After-Hours Trading in Equity Futures Markets 127
Journal of Futures Markets DOI: 10.1002/fut
average news day. These results are particularly interesting, as they show howeasily market microstructure can be masked. There is a definite weekend effectpresent in the data but it is not initially evident without specifically accountingfor news announcements.
Existing literature also pinpoints the so-called “triple witching days,” whenindex futures, index options, and stock options simultaneously expire, and areeither paid out or rolled over as high volume days; see particularly Barclay et al.(2007) who examine the NASDAQ and S&P 500 in this context. They find thatthere is evidence of higher volume in underlying stock movements associatedwith these indices. The current data are based on the generic index publishedby the CME (the CME determines when trade switches from the nearest to thenext-to-nearest futures contract before the expiration date). There is no evi-dence of higher volume in the pre-open volume in both futures indices on thetriple witching days in the current sample.
AFTER-HOURS PRICE IMPACT
Information-based microstructure models demonstrate that new informationbecomes impounded in prices as a result of trading by informed traders.Glosten and Milgrom (1985) and Easley and O’Hara (1987) suggest that tradescan signal information—associated particularly with informed traders. Trades,in themselves, could therefore affect the behavior of prices. In after-hours trad-ing when potentially fewer informed traders are active, and volume is lower,
0
200
400
600
800
1000
SundayNonewsNewsnon-Sunday
Postclose
Chicagopit
Tokyo London
MondaySunday
6:30 8:1517:15 19:00 1:00
Preopen
FIGURE 4Average volume: Sunday, non-Sunday, news, and no-news days.

128 Dungey, Fakhrutdinova, and Goodhart
Journal of Futures Markets DOI: 10.1002/fut
there is a strong presumption that price impact will be higher; for example,Barclay and Hendershott (2003).
To investigate the price impact the Hasbrouck (1991) VAR methodology isadapted to the non-contiguous time zones examined in this paper. The Hasbrouck(1991) model uses a Wold-ordered bivariate vector autoregression representationof trade volume and price revision. Specifically the VAR can be represented as
(1)
where which are, respectively, defined as the signed volume traded,, and the price revision, The matrix B is 2 � 2 lower triangular with ones
on the main diagonal representing the normalization adopted. That is
The matrices A(L) are full matrices of lagged impact coefficients and representtemporally uncorrelated structural shocks to the system where and is diagonal and positive definite. The Hasbrouck method exploits the one to one rela-tionship between shocks to and contemporaneous changes in yt to interpret thecoefficient, as the measure of the initial price impact of a trade. Subsequentvalues of the lagged coefficients are used to give the transmission path of prices backto equilibrium, which is the impulse responses to the shock. As the data used aretransaction by transaction, rather than equally spaced intervals, the critical, but rela-tively uncontroversial, assumption in the use of this methodology is that the data dis-play covariance stationarity.
This model has been widely applied to considerations of price impact infinancial market data. In Hasbrouck (1991) the initial application considers as a variable taking the values of {1, �1, 0} depending on whether the transac-tion is identified as a buy, sell, or nonidentified transaction. The zero valueswere then eliminated from the analysis. Hasbrouck also augmented this withan actual signed volume and a signed quadratic volume. Unfortunately the cur-rent data set does not contain quotes or information on transaction direction,and these limitations provide us with several challenges in implementing the Hasbrouck method. In what follows the problems of dealing with transac-tion-based data are addressed.
There is now a significant literature on signing transactions when this isnot clearly identified in the original data. The quote method (used byHasbrouck) identifies a buy (sell) as the case when the trade price is above(below) the mid-point of the prevailing bid and ask quotes. The tick methodassigns a buy (sell) to the case where there is an increase (decrease) in thetrade price, and takes account of cases where there is no change in price by
xt
� b21,et
©et ~ N(0, © )
B � c 1 0b21 1
d .
rt.xt
yt � 5xt, rt6,Byt � A(L)yt�1 � et

assigning it the same direction as the previous transaction. More sophisticatedalgorithms for assigning trade direction are those of Lee and Ready (1991),which is based on using the quote test for trades not conducted at the mid-quote where the tick test is used instead, as also used, for example, in Barclayand Hendershott (2004). Ellis, Michaely, and O’Hara (2000) further modifiedthis by reducing the role of the quote test to only those trades conducted at theask and bid prices and expanded the tick test to all other observations.
Some comparisons of the success of these algorithms for trade classifica-tion exist, both Finucane (2000) and Theissen (2001) found that the tick testdid not underperform compared with the Lee and Ready (1991) tests, whereasEllis, Michaely and O’Hara found that the Lee and Ready test improved classi-fication by some 5% of observations over the tick and quote tests, and their owninnovation improved on this again. Madhavan, Ming, Strasser, and Wang(2002) compared the Lee and Ready and the Ellis, Michaely, and O’Hara testsfinding that dominance of one or other depends on the market under consider-ation. Unfortunately, in the current data set there are insufficient observationson quotes to use the quote-based methods, so the tick test is the only one avail-able. It is worth noting that the above papers report correct classifications ofaround 75–80% of transactions via the tick method, and perhaps a further 5%improvement using the more sophisticated combinations of quote and ticks.
The absence of quote data may potentially produce a more important prob-lem than simply signing the trade. Bid–ask bounce may seriously distort thestructure of the covariance matrix in the sample data away from that of the trueunderlying price process, introducing negative serial correlation into the returnsprocess. Hasbrouck (2004) provides a simple demonstration of the potentialextent of the problem. Consider the case where bid and ask prices are separatedby an execution cost, c, and the preferred mid-quote data distribute these costsequally on either side. When transaction data are used these execution costs areimplicitly assumed to be zero, and this understatement is evident in nonzeroautocovariance terms between the returns. Following Hasbrouck (2004), theobserved price, pt, is
where bt and at represent the bid and ask prices, and qt is the trade direction.The underlying process driving these observed prices is given by the efficientprice, mt, which is a random walk with random news arrival andexecution costs, so that In this case, one means ofestimating the execution cost, c, is via the expression for the autocovarianceof the returns. Period by period returns under this model can be expressed as
bt � mt � c � mt � c � at.ut ~ N(0, s2),
pt � e bt if qt � �1at if qt � �1
After-Hours Trading in Equity Futures Markets 129
Journal of Futures Markets DOI: 10.1002/fut

130 Dungey, Fakhrutdinova, and Goodhart
Journal of Futures Markets DOI: 10.1002/fut
and the assumption of independence between the executioncost and the news arrival means that the autocovariance for the returns is givenby Hence, the autocovariance properties of the datagive an estimate of the execution cost under the assumptions of the model.
However, the form of the particular model is quite restrictive, and does notspecifically account for the clustering of arrivals seen in data or that the execu-tion costs may be time varying or asymmetric. Hasbrouck (2004) proposes aMarkov Chain Monte Carlo approach to take into account the distribution ofexecution costs potentially evident in the sample. Using relatively uninformativepriors, simulations of the data are drawn using a Gibbs sampler to generate a pos-terior density over the unobserved trade direction from the observed price data.The method requires a specification of the price formation process, such as givenabove. Hasbrouck uses this simple case to compare measures of the executioncost from the autocovariance properties of sample data on four futures contractswith Bayesian estimates of execution cost and finds that the former seems to bea major overestimate of c. The source of this bias is the independence assump-tion in the expression for the autocovariance given above—in deriving such anexpression independence between news and trade direction in noncontempora-neous periods is assumed, but this is not explicitly imposed in the Bayesian esti-mates. Clearly the model results suggest that there is substantial feedbackbetween news and direction of trade across successive transactions.
Despite the insights it offers, the simple model is unlikely to be satisfactory.In a slightly more complex specification, where traders take into account theinformation revealed by previous price impact in determining the efficientprice, the estimate of execution cost is slightly higher, although still well belowthat of the autocovariance properties of the sample. Hasbrouck concludes thatthe Bayesian estimates of the execution costs are generally in the same directionas those generated by the simple sample properties, and it seems likely that thelatter are substantial overestimates of the true values. The use of Bayesiantechniques to estimate trade direction is a promising area of future research for the case where only transaction data are available. It requires a strongmodel of the underlying price process including distributional assumptions,and technical implementation is not always straightforward because of difficul-ties with empirical convergence. What currently does seem clear is that theautocovariance properties of the sample provide an overestimate of the cost,whereas it is not yet evident how much of the observed price change should beassigned to direction of trade, and how much to other costs.
To get an idea of the potential extent of the problem of nonzero executioncosts in the current application the sample autocovariances for the NASDAQand S&P 500 returns for each time zone are calculated. The results given inTable VI show relatively small execution cost estimates, with those for the S&P
Cov(¢pt, ¢pt�1) � �c2.
¢pt � c¢qt � ut
After-Hours Trading in Equity Futures Markets 131
Journal of Futures Markets DOI: 10.1002/fut
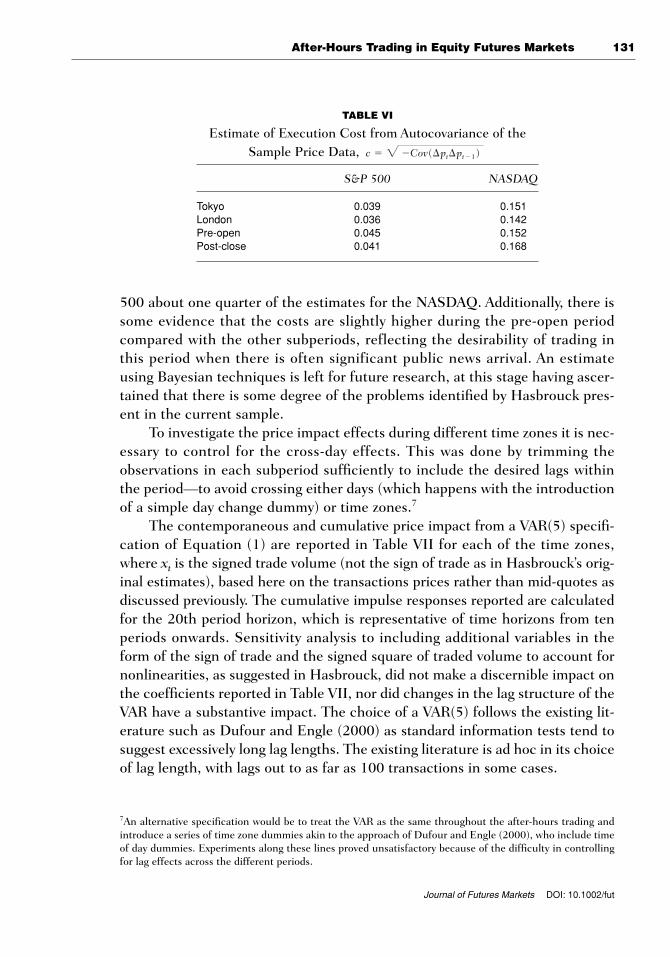
500 about one quarter of the estimates for the NASDAQ. Additionally, there issome evidence that the costs are slightly higher during the pre-open periodcompared with the other subperiods, reflecting the desirability of trading inthis period when there is often significant public news arrival. An estimateusing Bayesian techniques is left for future research, at this stage having ascer-tained that there is some degree of the problems identified by Hasbrouck pres-ent in the current sample.
To investigate the price impact effects during different time zones it is nec-essary to control for the cross-day effects. This was done by trimming theobservations in each subperiod sufficiently to include the desired lags withinthe period—to avoid crossing either days (which happens with the introductionof a simple day change dummy) or time zones.7
The contemporaneous and cumulative price impact from a VAR(5) specifi-cation of Equation (1) are reported in Table VII for each of the time zones,where xt is the signed trade volume (not the sign of trade as in Hasbrouck’s orig-inal estimates), based here on the transactions prices rather than mid-quotes asdiscussed previously. The cumulative impulse responses reported are calculatedfor the 20th period horizon, which is representative of time horizons from tenperiods onwards. Sensitivity analysis to including additional variables in theform of the sign of trade and the signed square of traded volume to account fornonlinearities, as suggested in Hasbrouck, did not make a discernible impact onthe coefficients reported in Table VII, nor did changes in the lag structure of theVAR have a substantive impact. The choice of a VAR(5) follows the existing lit-erature such as Dufour and Engle (2000) as standard information tests tend tosuggest excessively long lag lengths. The existing literature is ad hoc in its choiceof lag length, with lags out to as far as 100 transactions in some cases.
7An alternative specification would be to treat the VAR as the same throughout the after-hours trading andintroduce a series of time zone dummies akin to the approach of Dufour and Engle (2000), who include timeof day dummies. Experiments along these lines proved unsatisfactory because of the difficulty in controllingfor lag effects across the different periods.
TABLE VI
Estimate of Execution Cost from Autocovariance of theSample Price Data,
S&P 500 NASDAQ
Tokyo 0.039 0.151London 0.036 0.142Pre-open 0.045 0.152Post-close 0.041 0.168
c � 2 �Cov(¢pt¢pt�1)

132 Dungey, Fakhrutdinova, and Goodhart
Journal of Futures Markets DOI: 10.1002/fut
In all after-hours trading zones the price impact is positive and statistically sig-nificant at 5% for both indices. The significance of the price impacts is robust tothe potential problems with the covariance matrix associated with the transactionsdata, bootstrapping does not change these results.8 The initial price impact inTokyo shows that a one-unit buy trade is associated with a price increase of 0.0137in the S&P 500 futures index and 0.0465 in NASDAQ futures. In London the ini-tial price impact is slightly lower for both indices. The most interesting periods arethe pre-open and post-close. In the pre-open period, which has already been seento be high volume, and particularly influenced by macroeconomic news announce-ments, the initial price impact coefficient is statistically significant for both mar-kets at 0.0109 and 0.0376 for the S&P 500 and NASDAQ, respectively. However,in the post-close period the price impact in both markets is statistically significantlyhigher at 0.0113 for the S&P 500 and 0.0492 for the NASDAQ. However, theprice impact in the post-close for the S&P 500 remains below that of the Tokyo andLondon time zones. The cumulative price impacts reported show a similar pattern.
During the pre-open period the price impact is significantly lower than theprice impact in the other time zones considered. This is the highest trading volumeperiod. Price impact during the period of next greatest volume, the post-close is sig-nificantly higher, and in the case of the NASDAQ the highest of all the periodsconsidered. This is a low-volume trading period, on average no greater than volumein either Tokyo or London. Barclay and Hendershott (2004) find the oppositeresult for individual stocks, in that the initial price impact in individual stocks ishigher in the pre-open than post-close period when measured using effectivespreads (although comparisons across different instruments, such as betweenequity futures and individual stock prices, are difficult to make).
TABLE VII
INITIAL and Cumulative 20th Period Price Impact for the S&P 500 and NASDAQ 100 Futures Contracts (July 2002–September 2006)
S&P 500 NASDAQ 100
Cumulative Price Cumulative PriceTime Zone Price Impact �b21 Impact 20th Period Price Impact �b21 Impact 20th Period
Tokyo 0.0137 0.050 0.0465 0.1813London 0.0132 0.041 0.0405 0.1571Pre-open 0.0109 0.038 0.0376 0.1374Post-close 0.0113 0.040 0.0492 0.1550
Note. All estimates are statistically significant at 5%.
8The estimated covariance matrices of residuals in each VAR are strongly diagonal in each case; there is nosubstantive evidence of nonzero covariance terms.

After-Hours Trading in Equity Futures Markets 133
Journal of Futures Markets DOI: 10.1002/fut
PUBLIC AND PRIVATE INFORMATION IN AFTER-HOURS MARKETS
The two periods of particular interest in after-hours trading are the pre-openand post-close. A potential difference between these periods is the type ofinformation released. In the post-close period information is often likely to becompany or sector specific, relating to outcomes in particular stocks. In thepre-open period, as seen above, information is most likely to relate to publicannouncement of macroeconomic aggregates. These two types of informationmay be treated quite differently in the markets. Potentially the highly activepre-open period announcements are very public and traders are relatively wellinformed on their impact and have pre-formed expectations on how they willreact, so the information in the sense of asymmetry between players is less pro-nounced than for company-specific announcements, which may occur in themore thinly traded post-close market.
Easley, Kiefer, and O’Hara (1997) develop a means of assessing theproportion of informed and uninformed (or liquidity) trades in total tradingactivity using the proportion of informed trade measure deducted from tradedirection or PIN (Probability of Information-based trading). This relies on aBayesian tree stylized analysis of how markets react following news arrival.Unfortunately the methodology does not transfer well into the application, pro-ducing only corner solutions.9 Recently, Benos and Jochec (2007) have thrownempirical doubt upon this measure.
The standard vector moving average representation of a VAR facilitates aforecast error variance decomposition of the sources of movements in variablesunder the assumption that the shocks are independently distributed. Previousauthors have interpreted the contribution of volume shocks to variation inreturns as the proportion of price discovery because of private information; seeBarclay and Hendershott (2003).
The results presented in Table VIII suggest that the role of private infor-mation is around one-third of the total. For the pre-open period this is similarto that observed in Barclay and Hendershott (2003) who examine electronictrading for individual NASDAQ stocks out of hours. However, they find a rela-tively smaller private information component in the post-close, at around 25%,whereas in this study the share is relatively unchanged across all the timezones.10
9The PIN takes the value of 1/3 when each of the estimated parameters takes a corner value of one.Investigations revealed that this was particularly the case as the number of observations increased.10The horizon for the variance decomposition makes very little qualitative difference as the results settle tothe decompositions reported here very quickly.

134 Dungey, Fakhrutdinova, and Goodhart
Journal of Futures Markets DOI: 10.1002/fut
CONCLUSION
This paper has considered the after-hours trading market for CME equity regu-lar futures contracts on the S&P 500 and NASDAQ 100 traded on theGLOBEX electronic platform. To the authors’ knowledge it is the first paper tostudy such a market. In equity markets the spot market ECNs cover extendedhours but not a full 24-hour trade. Volume in electronic trade in futures was shown to be highest in the two periods immediately surrounding the opening hours for the CME pit for these instruments, notably from 6:30 A.M. to8:15 A.M. CST and 3:30 P.M. to 7:00 P.M. CST (christened the pre-open andpost-close periods). High volumes in the pre-open period were shown to be par-ticularly associated with anticipated macroeconomic news releases for the U.S.economy, which occur at 8:30 EST before the opening of the spot-trading floor.Informed trade seems to contribute approximately equivalently during all timezones across the day. However, price impact was shown to be statistically signif-icantly higher in the post-close period than the pre-open. If liquidity traders doneed to settle overnight positions in the post-close trade it may be relativelyexpensive to do so, and if this is being done as a means of preserving anonymityin the market, then it provides a direct measure of the cost of that service.
BIBLIOGRAPHY
Andersen, T., Bollerslev, T., Diebold, F. X., & Vega, C. (2007). Real-time price discov-ery in stock, bond and foreign exchange markets. Journal of InternationalEconomics, 73, 251–277.
Barclay, M. J., & Hendershott, T. (2003). Price discovery and trading after hours. TheReview of Financial Studies, 16, 1041–1073.
Barclay, M. J., & Hendershott, T. (2004). Liquidity externalities and adverse selection:Evidence from trading after hours. Journal of Finance, 59, 681–710.
Barclay, M. J., Hendershott, T., & Jones, C. M. (2007). Order consolidation, price effi-ciency and extreme liquidity shocks. Journal of Financial and QuantitativeAnalysis, 43, 93–122.
TABLE VIII
Proportion of Private Information Variance Decomposition (% ofTotal Variance in Returns Because of Shocks in Volume Traded
at the 50 Observation Horizon)
S&P 500 NASDAQ
Tokyo 31.21 33.65London 31.16 33.29Pre-open 31.49 32.65Post-close 28.26 33.11

After-Hours Trading in Equity Futures Markets 135
Journal of Futures Markets DOI: 10.1002/fut
Becker, K., Finnerty, J., & Friedman, J. (1995). Economic news and equity market linkagesbetween the US and UK. Journal of Banking and Finance, 19, 1191–1210.
Benos, E., & Jochec, M. (2007). Testing the PIN variable. University of Illinois, manu-script. Available at SSRN, abstract-933211.
Brock, W., & Kleidon, A. (1992). Periodic market closure and trading volume: A modelof intraday bids and asks. Journal of Economic Dynamics and Control, 16,451–489.
Chicago Mercantile Exchange (2005). CME Equity Index Futures and Options:Information Guide. CME. Available at http://www.cme.com.
Cho, D., Eun C., & Senbet L. (1986). International arbitrage pricing theory: An empir-ical investigation. Journal of Finance, 41, 313–330.
Coppejans, M., & Domowitz, I. (1999). Pricing behavior in an off-hours computerizedmarket. Journal of Empirical Finance, 6, 583–607.
Cornell, B., & Landsman, W. R. (1989). Security price response to quarterly earningsannouncements and analysts’ forecast revisions. Accounting Review, 64, 680–692.
Dufour, A., & Engle, R. (2000). Time and the price impact of a trade. Journal ofFinance, 55, 2467–2498.
Easley, D., Kiefer, N. M., & O’Hara, M. (1997). The information content of the tradingprocess. Journal of Empirical Finance, 4, 159–186.
Easley, D., & O’Hara, M. (1987). Price, trade size, and information in securities mar-kets. Journal of Financial and Quantitative Analysis, 24, 241–256.
Ellis, K., Michaely, R., & O’Hara, M. (2000). The accuracy of trade classification rules:Evidence from NASDAQ. Journal of Financial and Quantitative Analysis, 35,529–551.
Engel, R. F., Ito T., & Lin, W. (1990). Meteor showers or heat waves? Heteroskedasticintra-daily volatility in the foreign exchange market. Econometrica, 58, 525–542.
Eun, C., & Shim, S. (1989). International transmission of stock market movements.Journal of Financial and Quantitative Analysis, 24, 241–256.
Finucane, T. J. (2000). A direct test of methods for inferring trade direction from intra-day data. Journal of Financial and Quantitative Analysis, 35, 553–576.
Fleming, M. J., & Remolona, E. (1999). Price formation and liquidity on the US treas-ury market: The response to public information. Journal of Finance, 54,1901–1915.
Glosten, L., & Milgrom P. (1985). Bid, ask and transaction prices in a specialist marketwith heterogeneously informed traders. Journal of Financial Economics, 14,71–100.
Hasbrouck, J. (1991). Measuring the information content of stock trades. Journal ofFinance, 46, 179–207.
Hasbrouck, J. (2003). Intraday price formation in the US equity index markets. Journalof Finance, 58, 2375–2399.
Hasbrouck, J. (2004). Liquidity in the futures pits: Inferring market dynamics fromincomplete data. Journal of Financial and Quantitative Analysis, 39, 305–326.
Huang, R., & Masulis, R. (1999). FX spreads and dealer competition across the 24-hourtrading day, Review of Financial Studies, 12, 61–93.
Kurov, A., & Lasser, D. (2004). Price dynamics in the regular and e-mini futures markets.Journal of Financial and Quantitative Analysis, 39, 365–384.
Lee, C., & Ready, M. (1991). Inferring trade direction from intraday data. Journal ofFinance, 46, 733–746.

Madhavan, A., Ming, K., Straser, V., & Wang, Y. (2002). How effective are effectivespreads? An evaluation of trade side classification algorithms, manuscript,Investment Technology Group, New York, downloadable from http://www.itg.com/news_events/research_papers.php.
Payne, R. (1996). Announcement effects and seasonality in the intra-day foreignexchange market. FMG Discussion Paper 238, Financial Markets Group.
Solnik, B. (1983). International arbitrage pricing theory. Journal of Finance, 38,449–457.
Theissen, E. (2001). A test of the accuracy of the Lee/Ready Trade classification algo-rithm. Journal of International Financial Markets, Institutions and Money, 11,147–165.
136 Dungey, Fakhrutdinova, and Goodhart
Journal of Futures Markets DOI: 10.1002/fut