aes corporation: today. tomorrow. making it...
TRANSCRIPT
»AES Corporation: Today. Tomorrow. Making it Happen.Victoria Harker, Executive Vice President & CFOMerrill Lynch Power & Gas Conference New York, NYSeptember 25, 2007
AES Corporation 2
» Safe Harbor Disclosure
Certain statements in the following presentation regarding AES’s business operations may constitute “forward-looking statements.” Such forward-looking statements include, but are not limited to, those related to future earnings, growth and financial and operating performance. Forward-looking statements are not intended to be a guarantee of future results, but instead constitute AES’s current expectations based on reasonable assumptions. Forecasted financial information is based on certain material assumptions. These assumptions include, but are not limited to, continued normal or better levels of operating performance and electricity demand at our distribution companies and operational performance at our generation businesses consistent with historical levels, as well as achievements of planned productivity improvements and incremental growth from investments at investment levels and rates of return consistent with prior experience. For additional assumptions see the Appendix to this presentation. Actual results could differ materially from those projected in our forward-looking statements due to risks, uncertainties and other factors. Important factors that could affect actual results are discussed in AES’s filings with the Securities and Exchange Commission including but not limited to the risks discussed under Item 1A “Risk Factors” in the Company’s Annual Report on Form 10-K/A for the year ended December 31, 2006, as well as our other SEC filings. AES undertakes no obligation to update or revise any forward-looking statements, whether as a result of new information, future events or otherwise.
AES Corporation 3
» A Global Opportunity
› Industry Leadership
– Over 25 years of development, construction & operational experience
– Operations in 28 countries on 5 continents managing $33 billion assets
› Diversified Portfolio
– 44 GW generation plants largely contracted under long-term contracts
– 13 Utilities
– Alternative energy business:
› Over 1,000 MW wind projects in operation
› Production of greenhouse gas emissions credits
› Strong Development Pipeline
– More than 25,000 MW of core power projects and 4,000 MW of wind projects in the pipeline
Contains Forward Looking Statements
AES Corporation 4
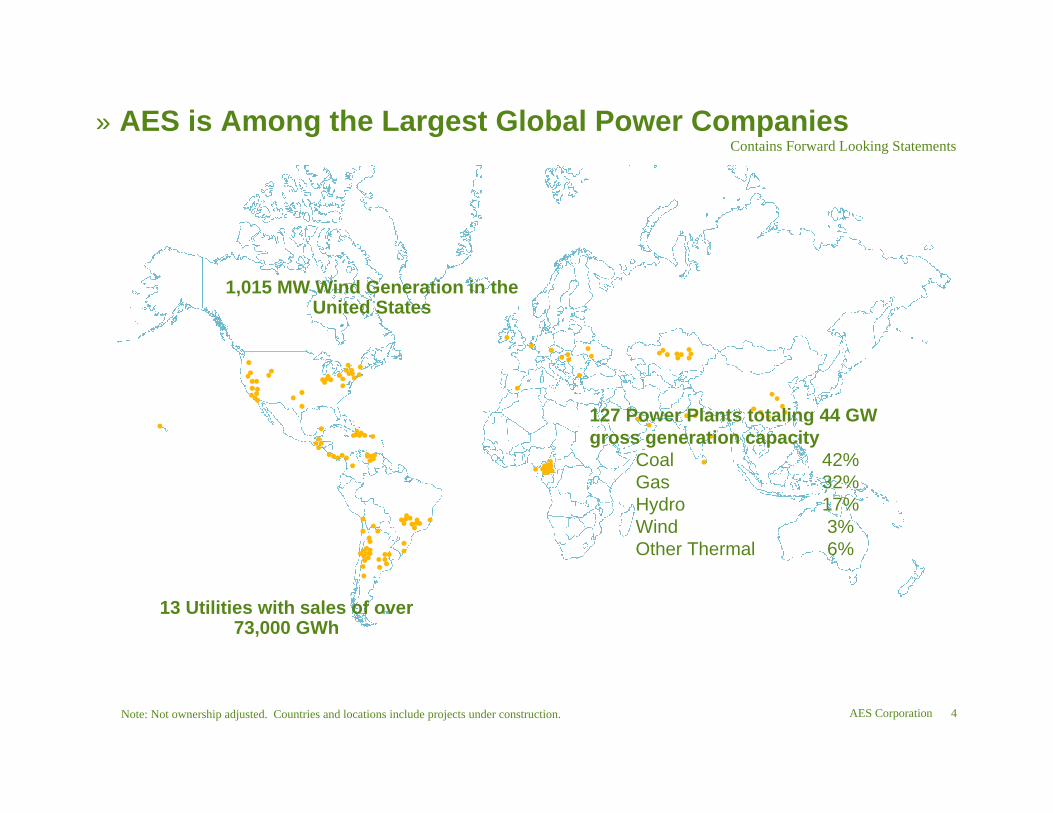
» AES is Among the Largest Global Power Companies
Note: Not ownership adjusted. Countries and locations include projects under construction.
13 Utilities with sales of over 73,000 GWh
127 Power Plants totaling 44 GW gross generation capacity
Coal 42%Gas 32%Hydro 17%Wind 3%Other Thermal 6%
1,015 MW Wind Generation in the United States
Contains Forward Looking Statements
AES Corporation 5
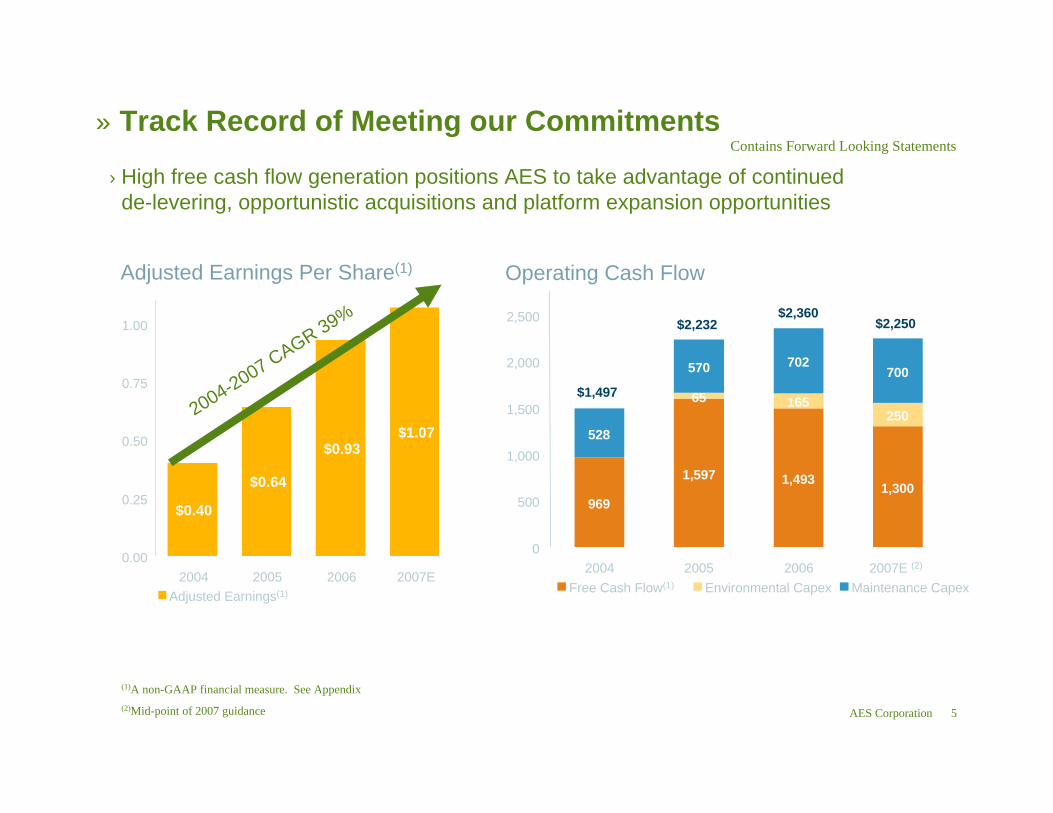
› High free cash flow generation positions AES to take advantage of continued de-levering, opportunistic acquisitions and platform expansion opportunities
Adjusted Earnings Per Share(1) Operating Cash Flow
$1,497
$2,232$2,360
$2,250
» Track Record of Meeting our Commitments
(1)A non-GAAP financial measure. See Appendix(2)Mid-point of 2007 guidance
Contains Forward Looking Statements
2004-2007 CAGR 39%
$0.40
$0.64
$0.93$1.07
0.00
0.25
0.50
0.75
1.00
2004 2005 2006 2007EAdjusted Earnings(1)
969
1,597 1,493 1,300
65 165250
528
570 702700
0
500
1,000
1,500
2,000
2,500
2004 2005 2006 2007E (2)
Free Cash Flow(1) Environmental Capex Maintenance Capex
AES Corporation 6
B
0
500
1,000
1,500
2,000
2,500
3,000
3,500
4,000 EP Tiete Gener
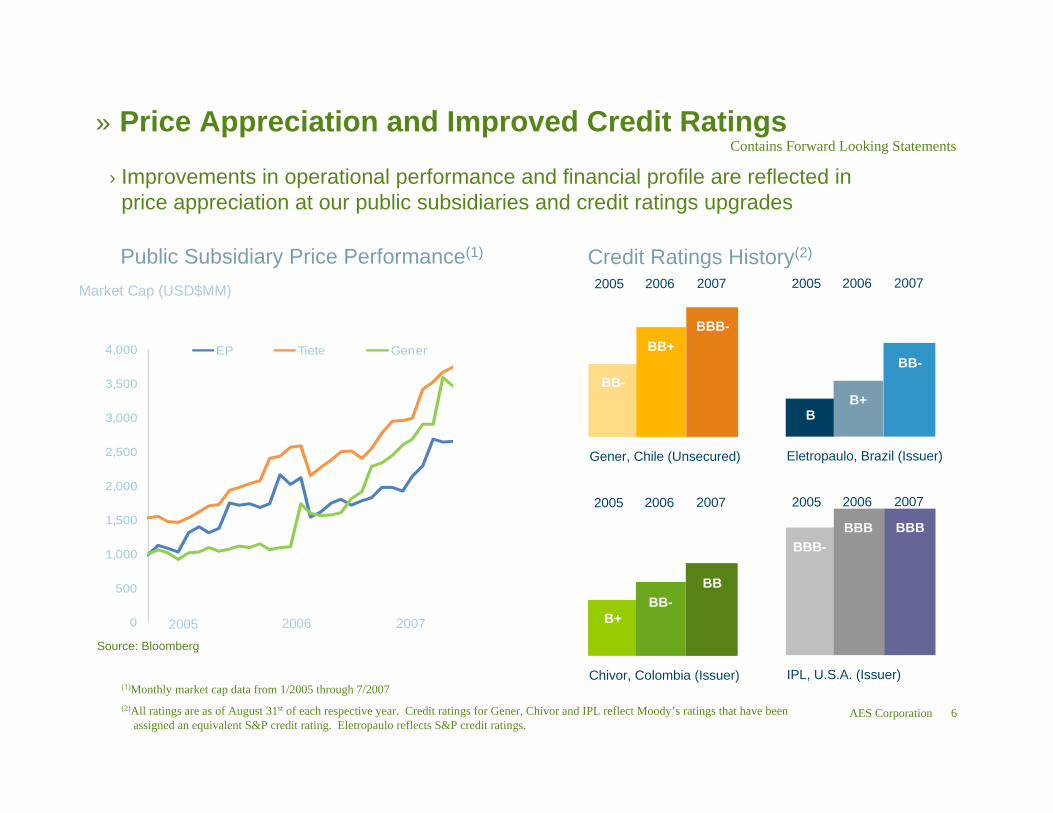
» Price Appreciation and Improved Credit Ratings
Market Cap (USD$MM)
2005 2006 2007
› Improvements in operational performance and financial profile are reflected in price appreciation at our public subsidiaries and credit ratings upgrades
Public Subsidiary Price Performance(1) Credit Ratings History(2)
(1)Monthly market cap data from 1/2005 through 7/2007(2)All ratings are as of August 31st of each respective year. Credit ratings for Gener, Chivor and IPL reflect Moody’s ratings that have been
assigned an equivalent S&P credit rating. Eletropaulo reflects S&P credit ratings.
Source: Bloomberg
Gener, Chile (Unsecured)
BB-
BB+BBB-
2005 2006 2007
IPL, U.S.A. (Issuer)
BBB-BBB BBB
2005 2006 2007
Eletropaulo, Brazil (Issuer)
B+
BB-
2005 2006 2007
Chivor, Colombia (Issuer)
B+BB-
BB
2005 2006 2007
Contains Forward Looking Statements
AES Corporation 7
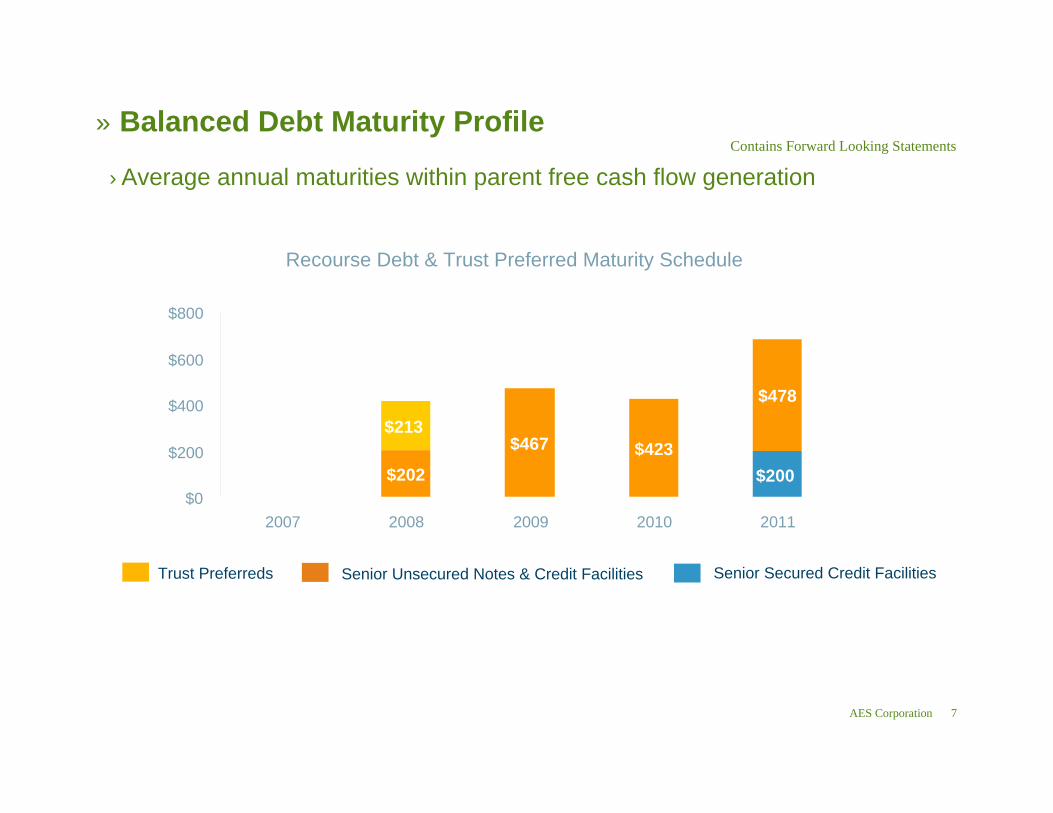
» Balanced Debt Maturity Profile
Senior Secured Credit FacilitiesSenior Unsecured Notes & Credit FacilitiesTrust Preferreds
Contains Forward Looking Statements
› Average annual maturities within parent free cash flow generation
Recourse Debt & Trust Preferred Maturity Schedule
$200$202
$467 $423
$478
$213
$0
$200
$400
$600
$800
2007 2008 2009 2010 2011
AES Corporation 8
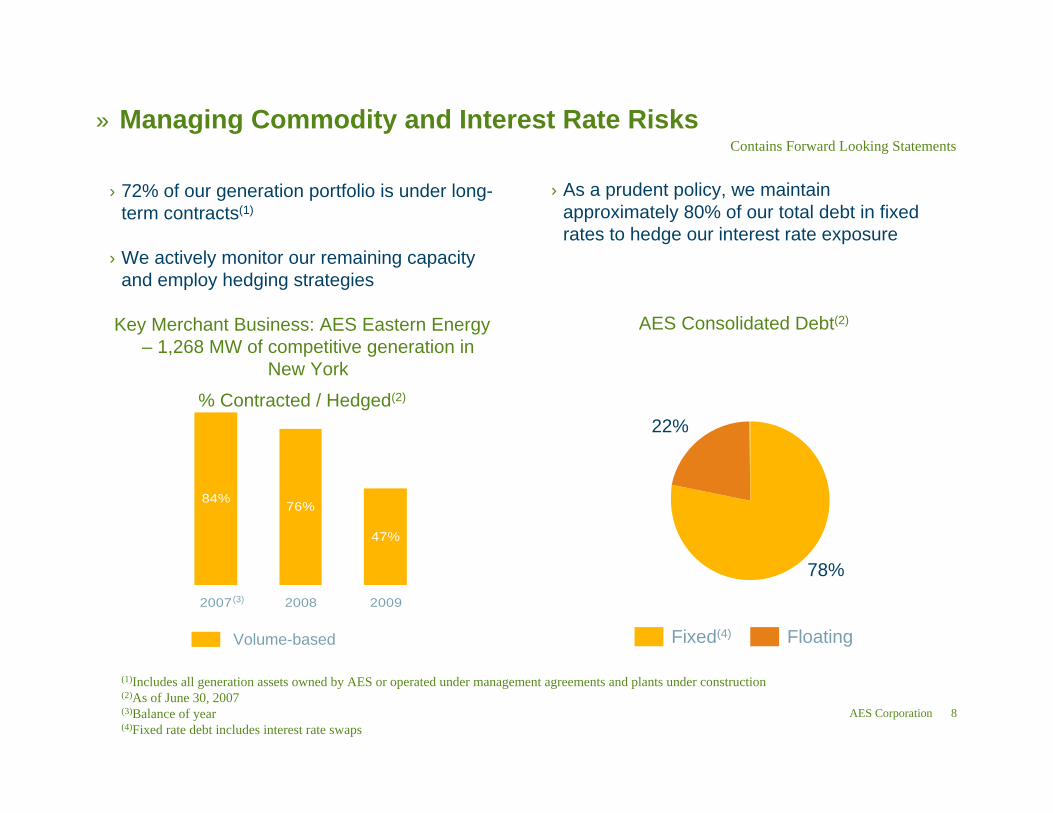
› 72% of our generation portfolio is under long-term contracts(1)
› We actively monitor our remaining capacity and employ hedging strategies
Key Merchant Business: AES Eastern Energy – 1,268 MW of competitive generation in
New York
% Contracted / Hedged(2)
84% 76%
47%
2007 2008 2009
Volume-based
» Managing Commodity and Interest Rate Risks
(1)Includes all generation assets owned by AES or operated under management agreements and plants under construction(2)As of June 30, 2007(3)Balance of year(4)Fixed rate debt includes interest rate swaps
(3)
Contains Forward Looking Statements
Fixed(4) Floating
› As a prudent policy, we maintain approximately 80% of our total debt in fixed rates to hedge our interest rate exposure
AES Consolidated Debt(2)
78%
22%
AES Corporation 9
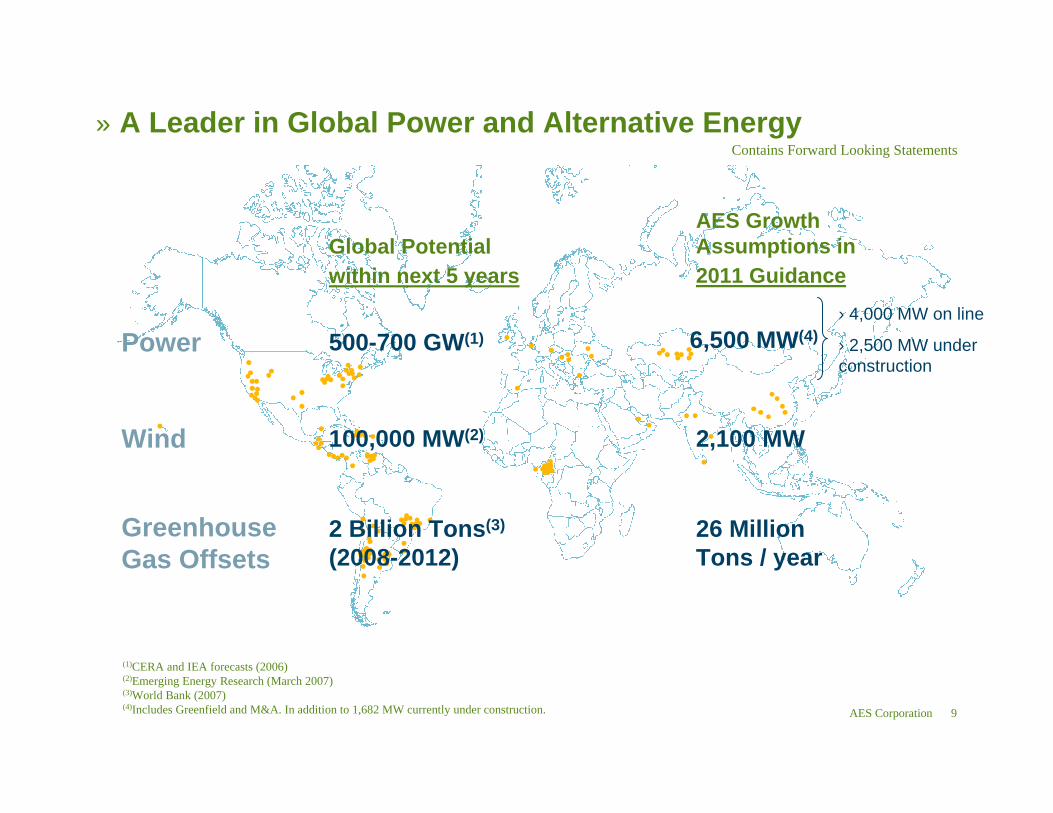
» A Leader in Global Power and Alternative EnergyContains Forward Looking Statements
2 Billion Tons(3)
(2008-2012)
100,000 MW(2)
500-700 GW(1)
Global Potential within next 5 years
26 Million Tons / year
2,100 MW
6,500 MW(4)
AES Growth Assumptions in 2011 Guidance
Greenhouse Gas Offsets
Wind
Power
(1)CERA and IEA forecasts (2006)(2)Emerging Energy Research (March 2007)(3)World Bank (2007)(4)Includes Greenfield and M&A. In addition to 1,682 MW currently under construction.
› 4,000 MW on line
› 2,500 MW under construction
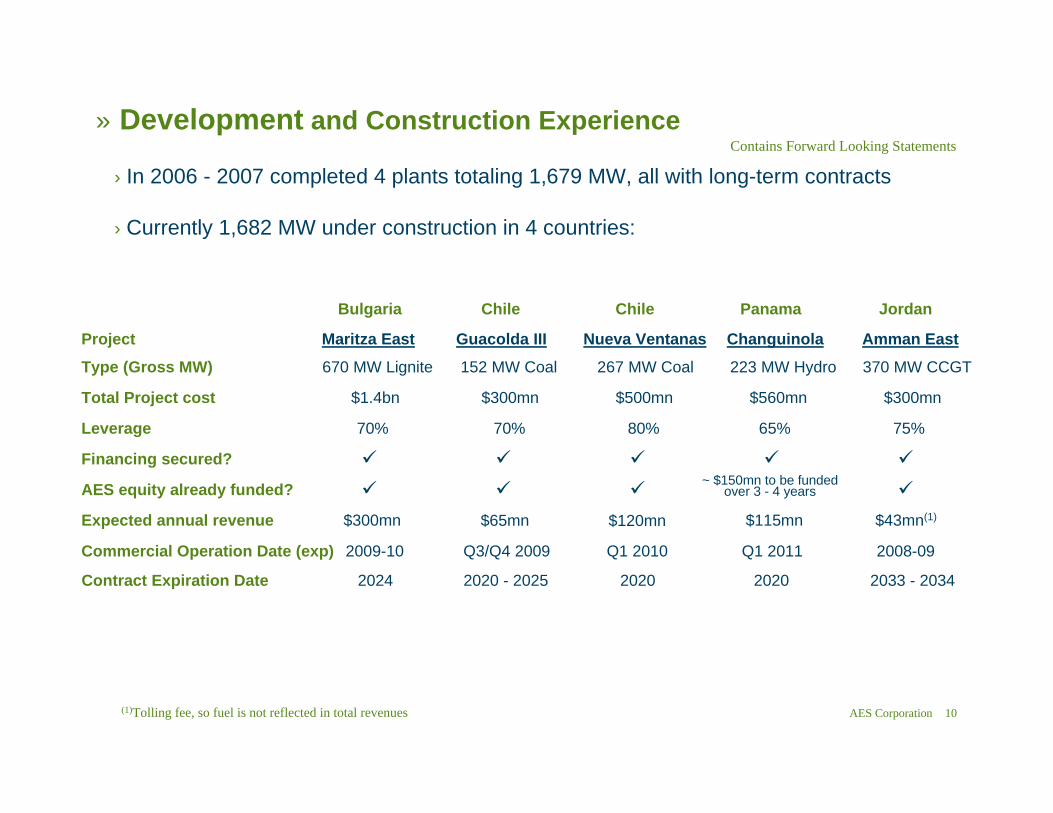
AES Corporation 10(1)Tolling fee, so fuel is not reflected in total revenues
» Development and Construction Experience
› In 2006 - 2007 completed 4 plants totaling 1,679 MW, all with long-term contracts
› Currently 1,682 MW under construction in 4 countries:
Contains Forward Looking Statements
Bulgaria Chile Chile Panama Jordan
Project Maritza East Guacolda III Nueva Ventanas Changuinola Amman East
Type (Gross MW) 670 MW Lignite 152 MW Coal 267 MW Coal 223 MW Hydro 370 MW CCGT
Total Project cost $1.4bn $300mn $500mn $560mn $300mn
Leverage 70% 70% 80% 65% 75%
Financing secured?
AES equity already funded?
Expected annual revenue $300mn $115mn $43mn(1)
Commercial Operation Date (exp) 2009-10 Q3/Q4 2009 Q1 2010 Q1 2011 2008-09
~ $150mn to be funded over 3 - 4 years
$65mn $120mn
Contract Expiration Date 2024 2020 - 2025 2020 2020 2033 - 2034
AES Corporation 11
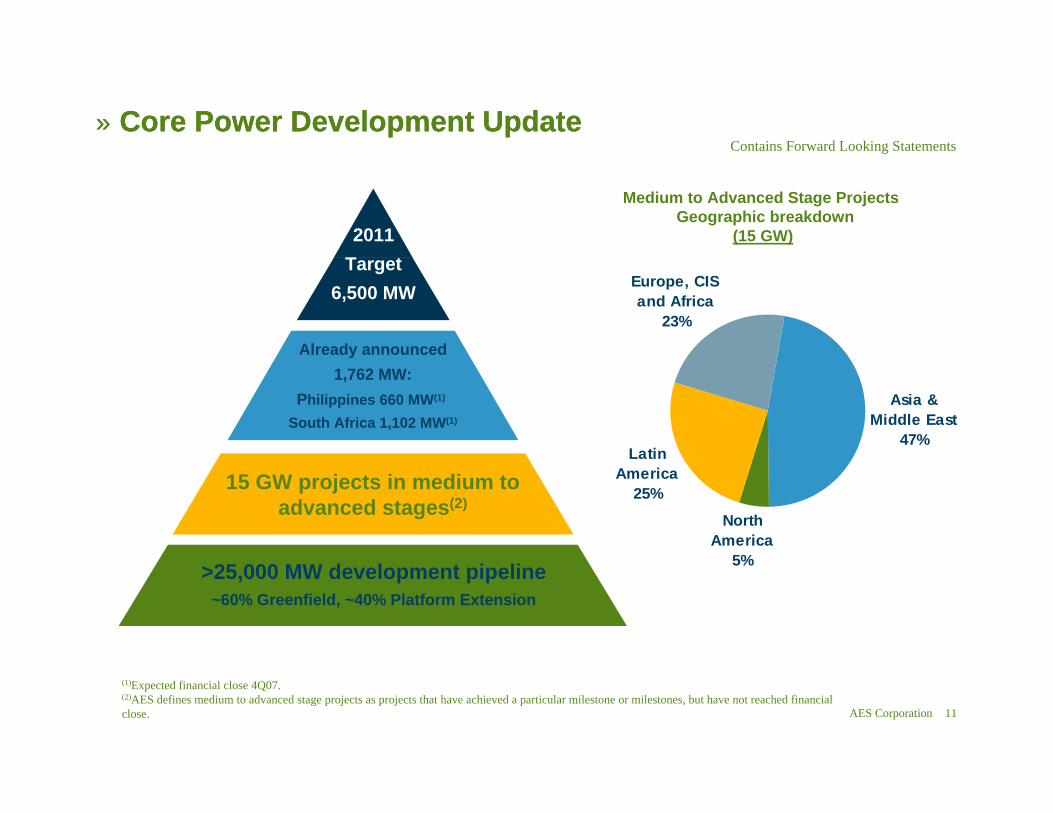
» Core Power Development Update» Core Power Development UpdateContains Forward Looking Statements
(1)Expected financial close 4Q07.(2)AES defines medium to advanced stage projects as projects that have achieved a particular milestone or milestones, but have not reached financial close.
>25,000 MW development pipeline~60% Greenfield, ~40% Platform Extension
2011Target
6,500 MW
Already announced1,762 MW:
Philippines 660 MW(1)
South Africa 1,102 MW(1)
15 GW projects in medium to advanced stages(2)
Asia & Middle East
47%
North America
5%
Latin America
25%
Europe, CIS and Africa
23%
Medium to Advanced Stage Projects Geographic breakdown
(15 GW)
AES Corporation 12
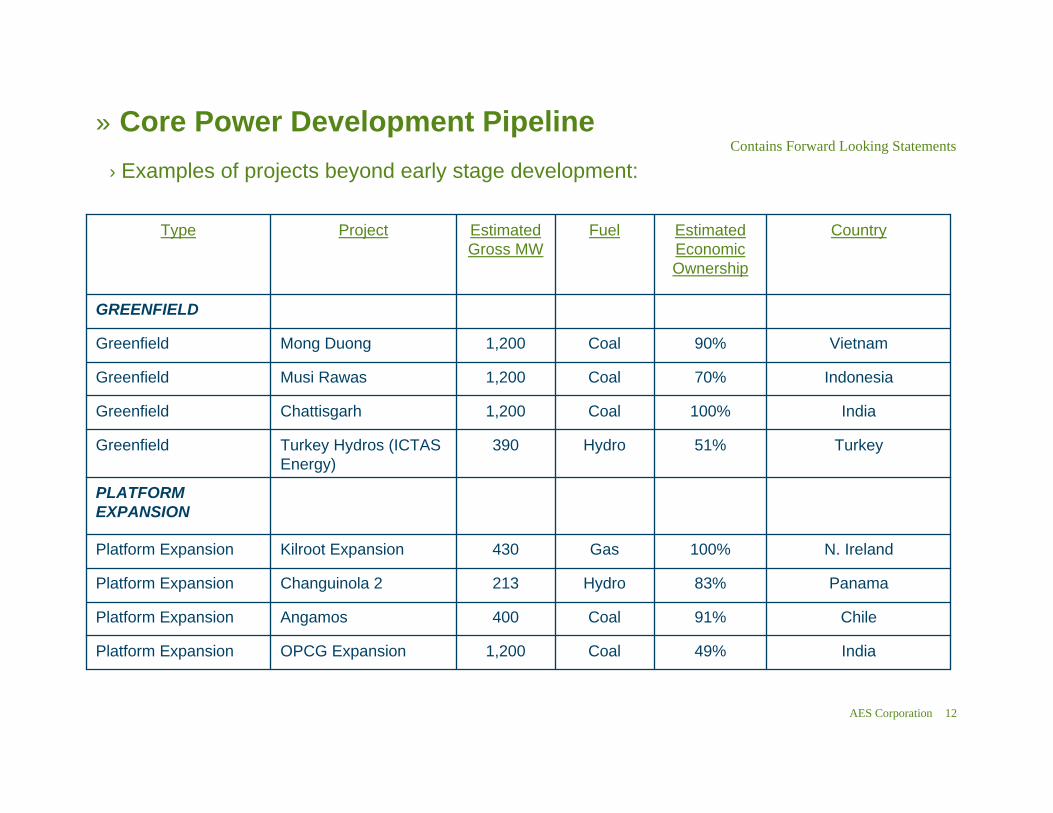
» Core Power Development Pipeline
GREENFIELD
Platform Expansion
Platform Expansion
Platform Expansion
Platform Expansion
PLATFORM EXPANSION
Greenfield
Greenfield
Greenfield
Greenfield
Type
49%
91%
83%
100%
51%
100%
70%
90%
Estimated Economic Ownership
India
Chile
Panama
N. Ireland
Turkey
India
Indonesia
Vietnam
Country
Hydro390Turkey Hydros (ICTAS Energy)
Coal1,200Chattisgarh
Coal1,200Musi Rawas
Coal1,200OPCG Expansion
Coal400Angamos
Hydro213Changuinola 2
Gas430Kilroot Expansion
Coal1,200Mong Duong
Fuel Estimated Gross MW
Project
Contains Forward Looking Statements
› Examples of projects beyond early stage development:
AES Corporation 13
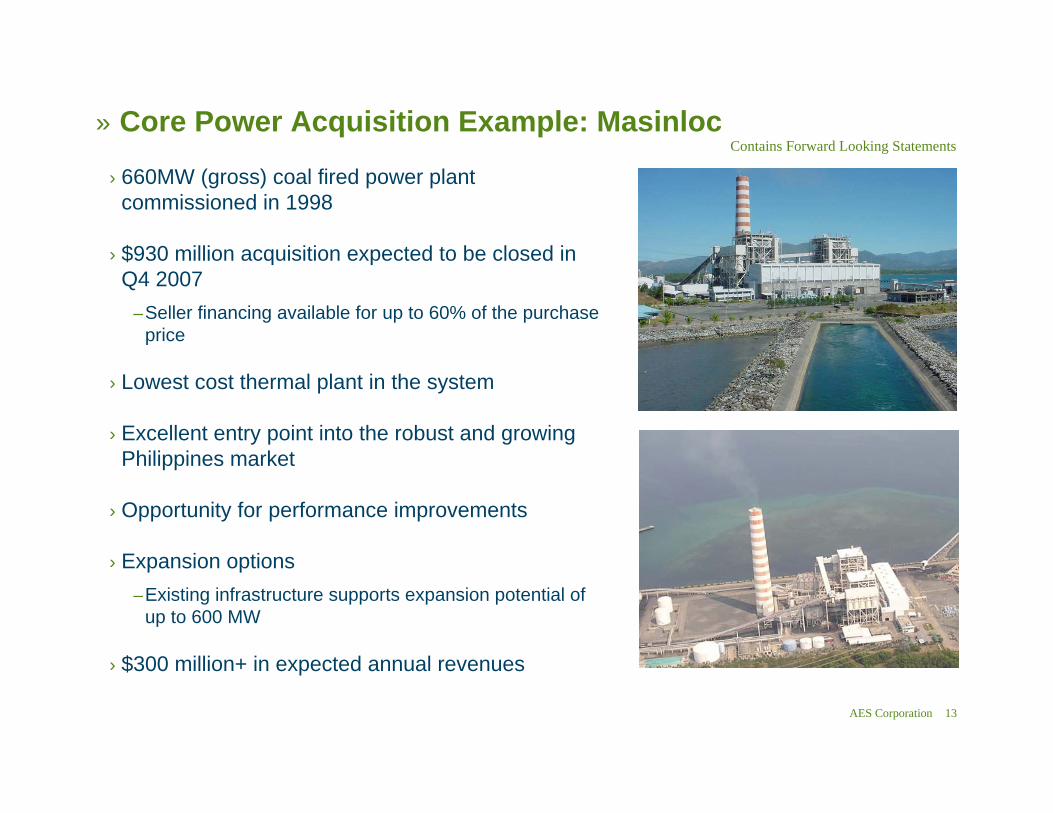
» Core Power Acquisition Example: MasinlocContains Forward Looking Statements
› 660MW (gross) coal fired power plant commissioned in 1998
› $930 million acquisition expected to be closed in Q4 2007
–Seller financing available for up to 60% of the purchase price
› Lowest cost thermal plant in the system
› Excellent entry point into the robust and growing Philippines market
› Opportunity for performance improvements
› Expansion options–Existing infrastructure supports expansion potential of
up to 600 MW
› $300 million+ in expected annual revenues
AES Corporation 14
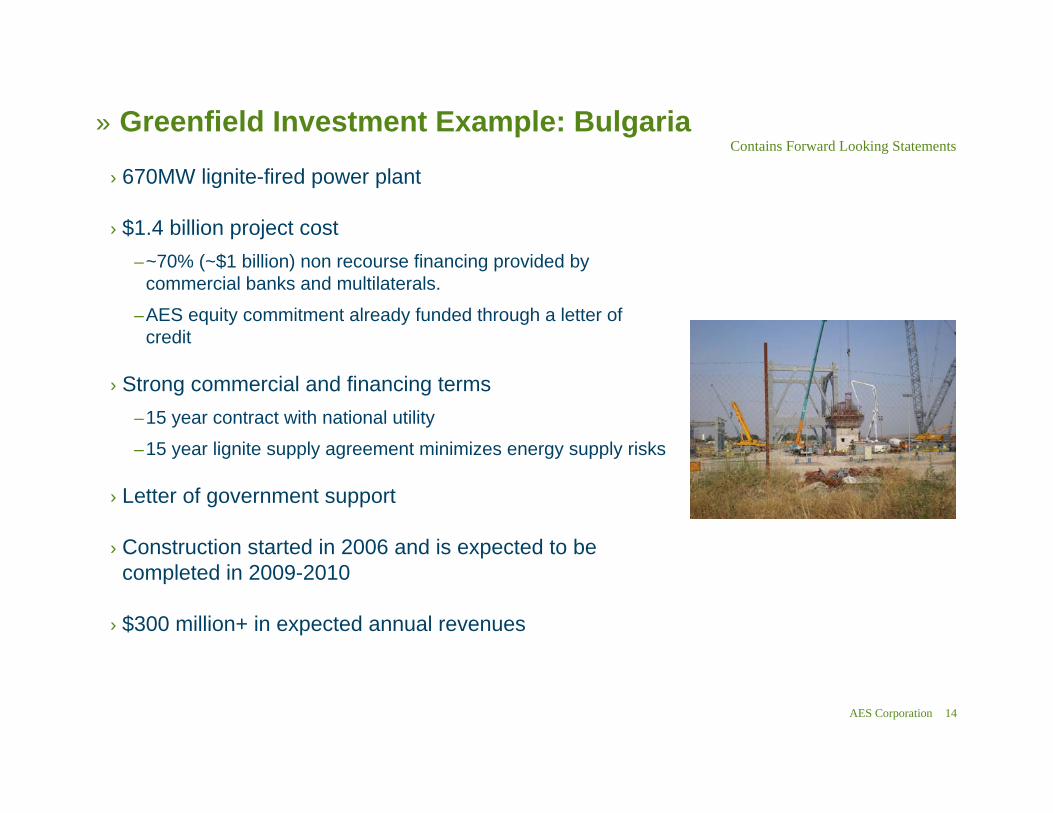
› 670MW lignite-fired power plant
› $1.4 billion project cost–~70% (~$1 billion) non recourse financing provided by
commercial banks and multilaterals.
–AES equity commitment already funded through a letter of credit
› Strong commercial and financing terms–15 year contract with national utility
–15 year lignite supply agreement minimizes energy supply risks
› Letter of government support
› Construction started in 2006 and is expected to be completed in 2009-2010
› $300 million+ in expected annual revenues
» Greenfield Investment Example: BulgariaContains Forward Looking Statements
AES Corporation 15
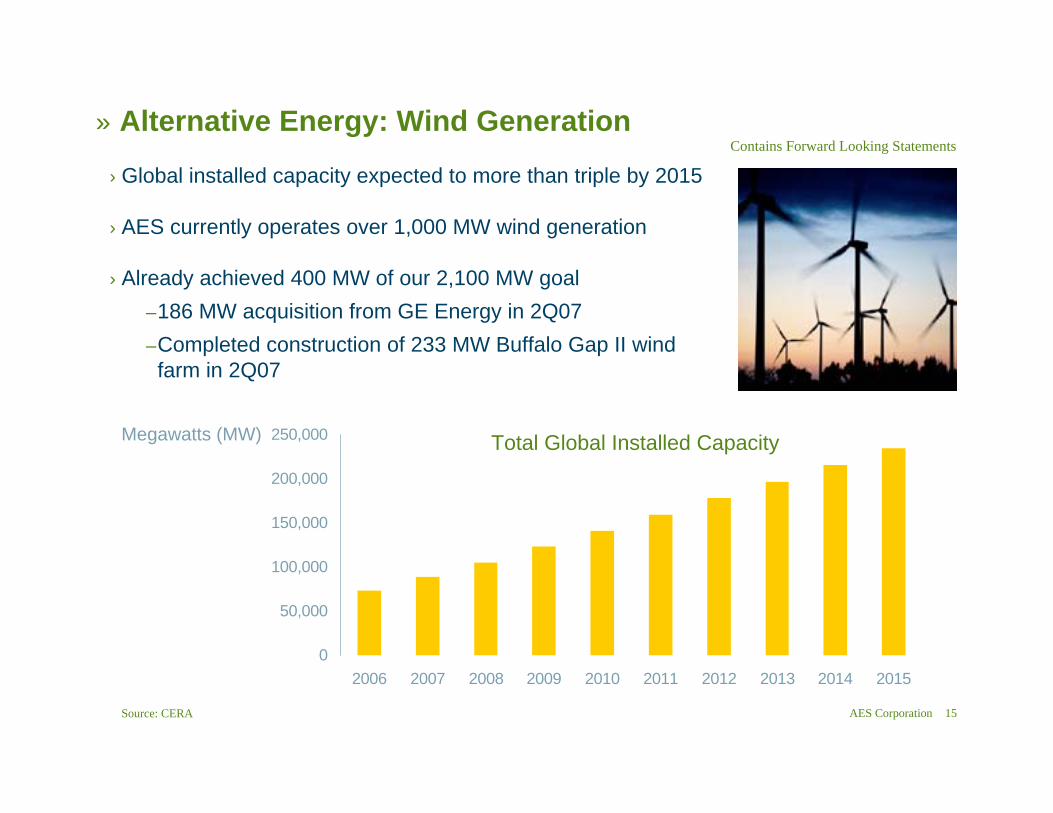
» Alternative Energy: Wind Generation
Source: CERA
› Global installed capacity expected to more than triple by 2015
› AES currently operates over 1,000 MW wind generation
› Already achieved 400 MW of our 2,100 MW goal–186 MW acquisition from GE Energy in 2Q07–Completed construction of 233 MW Buffalo Gap II wind farm in 2Q07
Contains Forward Looking Statements
0
50,000
100,000
150,000
200,000
250,000
2006 2007 2008 2009 2010 2011 2012 2013 2014 2015
Total Global Installed CapacityMegawatts (MW)
AES Corporation 16
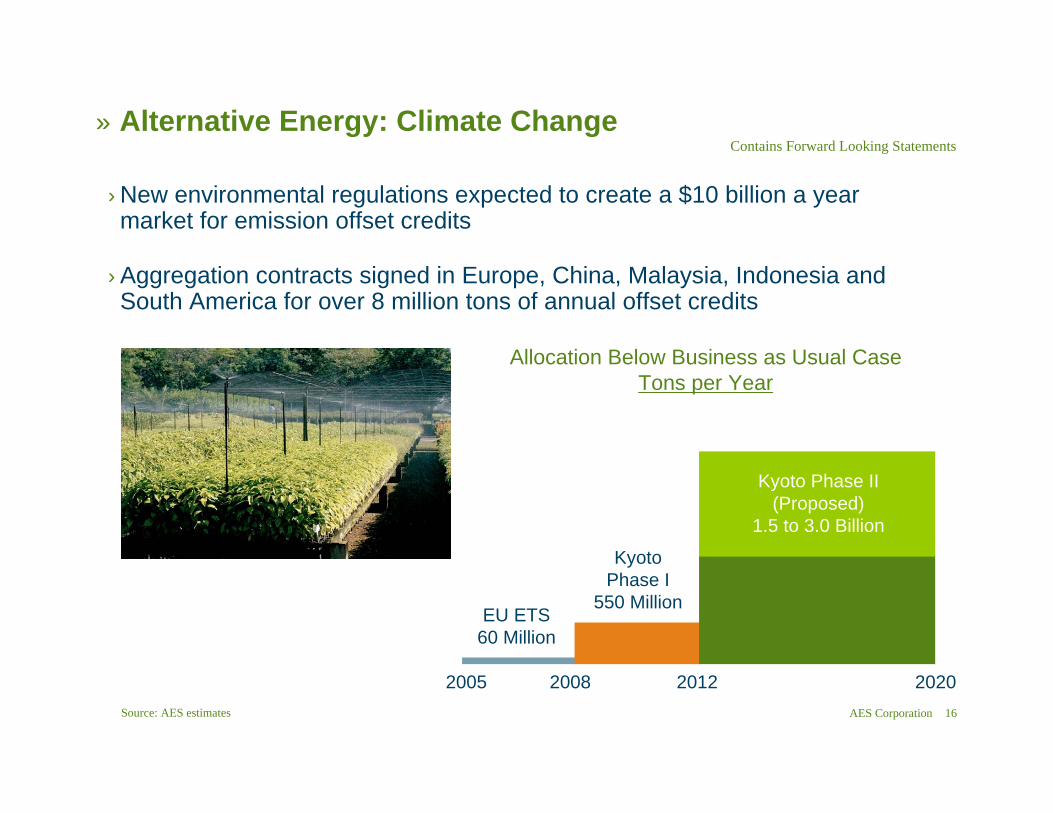
» Alternative Energy: Climate Change
› New environmental regulations expected to create a $10 billion a year market for emission offset credits
› Aggregation contracts signed in Europe, China, Malaysia, Indonesia and South America for over 8 million tons of annual offset credits
Contains Forward Looking Statements
2005 2008 2012 2020
Allocation Below Business as Usual CaseTons per Year
EU ETS60 Million
KyotoPhase I
550 Million
Kyoto Phase II(Proposed)
1.5 to 3.0 Billion
Source: AES estimates
AES Corporation 17
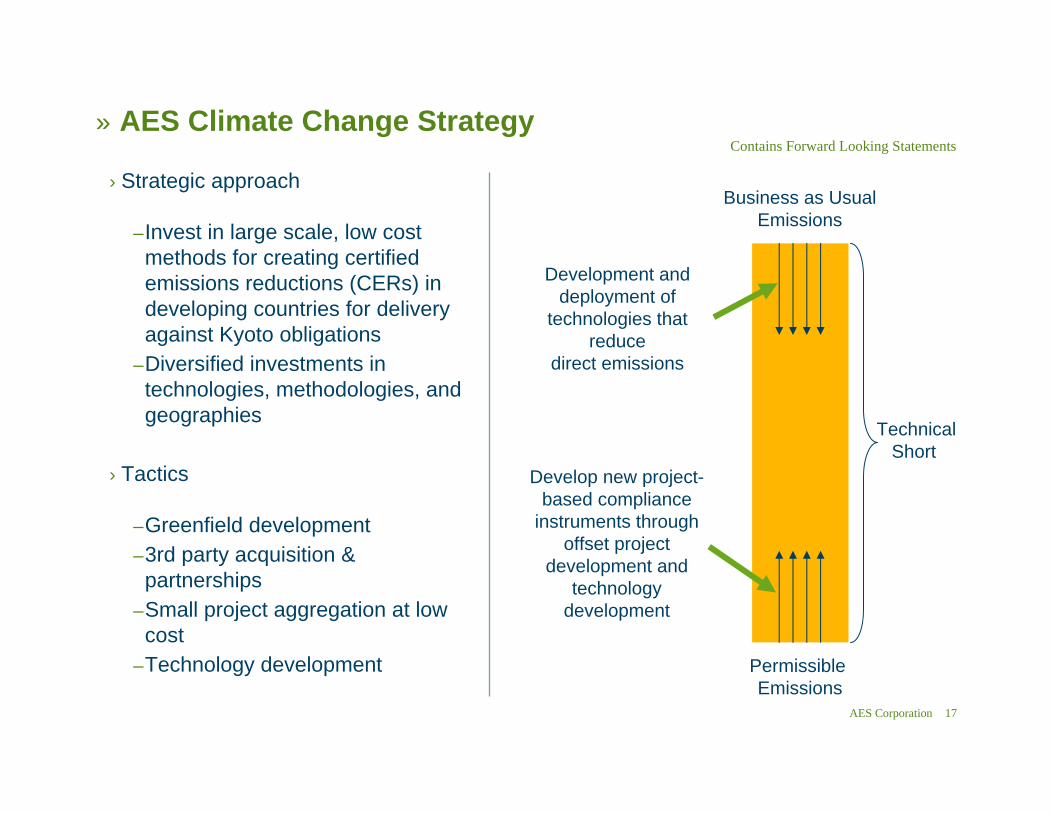
» AES Climate Change Strategy
Business as UsualEmissions
Permissible Emissions
TechnicalShort
Development and deployment of
technologies thatreduce
direct emissions
Develop new project-based compliance
instruments through offset project
development and technology
development
Contains Forward Looking Statements
› Strategic approach
–Invest in large scale, low cost methods for creating certified emissions reductions (CERs) in developing countries for delivery against Kyoto obligations
–Diversified investments in technologies, methodologies, and geographies
› Tactics
–Greenfield development–3rd party acquisition & partnerships
–Small project aggregation at low cost
–Technology development
AES Corporation 18
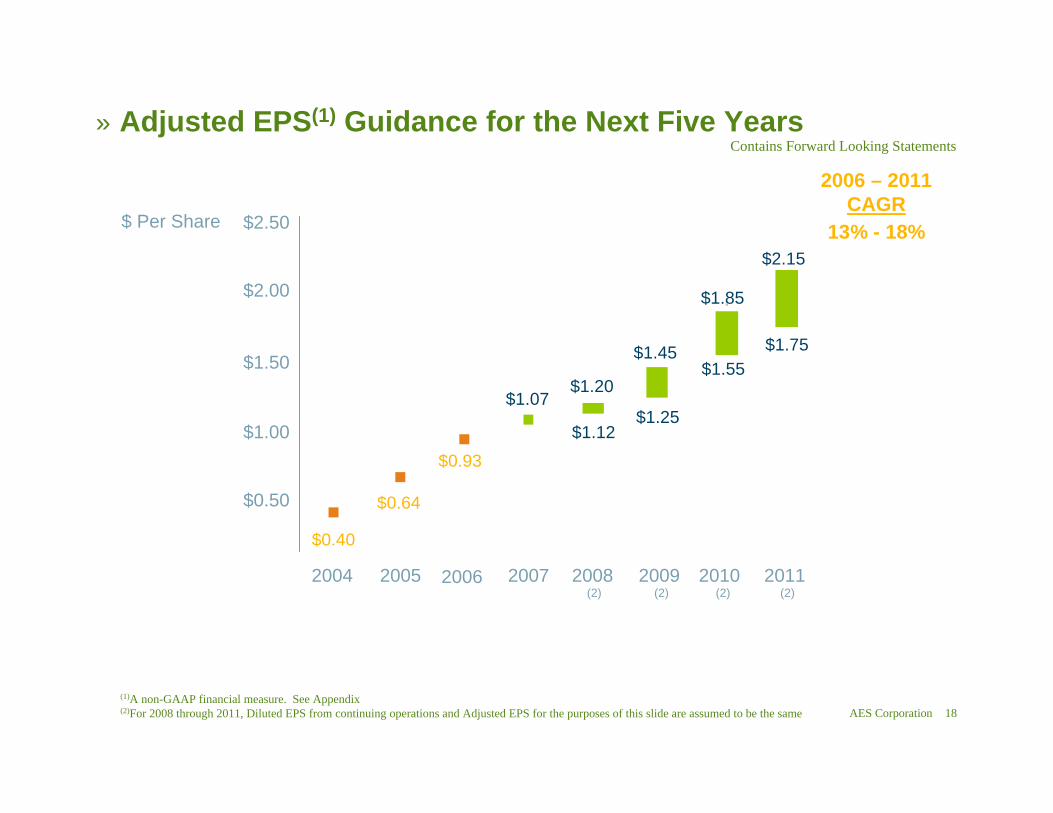
$1.55
$0.93
$1.07
(1)A non-GAAP financial measure. See Appendix(2)For 2008 through 2011, Diluted EPS from continuing operations and Adjusted EPS for the purposes of this slide are assumed to be the same
» Adjusted EPS(1) Guidance for the Next Five YearsContains Forward Looking Statements
$1.12$1.25
$1.45 $1.75
$2.15
$1.85
$1.20
$0.64
$0.40
$0.50
$1.00
$1.50
$2.00
$2.50
2005 2006 2007 2008 2009 2010 2011
2006 – 2011 CAGR
13% - 18%
2004(2)(2) (2)(2)
$ Per Share
AES Corporation 19
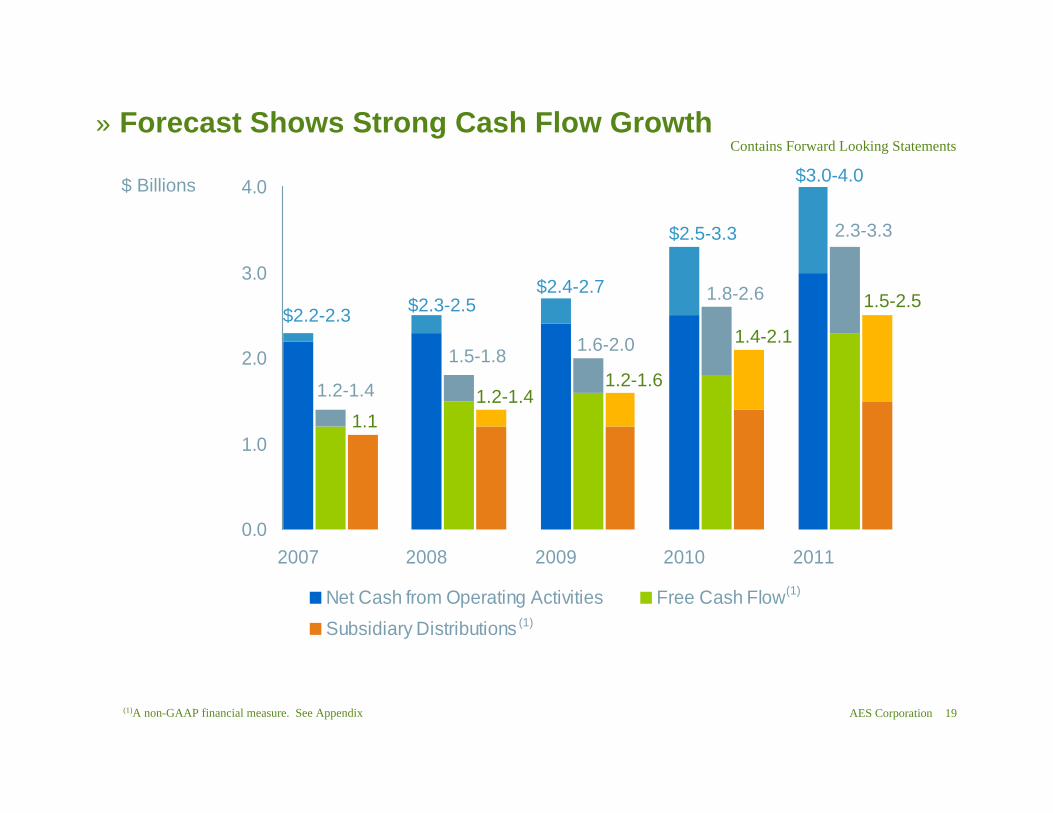
» Forecast Shows Strong Cash Flow GrowthContains Forward Looking Statements
(1)A non-GAAP financial measure. See Appendix
0.0
1.0
2.0
3.0
4.0
2007 2008 2009 2010 2011
Net Cash from Operating Activities Free Cash FlowSubsidiary Distributions
$2.4-2.7$2.3-2.5$2.2-2.3
$2.5-3.3
$3.0-4.0
1.5-1.8
1.2-1.4
1.6-2.0
1.8-2.6
2.3-3.3
1.2-1.41.1
1.2-1.6
1.4-2.1
1.5-2.5
$ Billions
(1)
(1)
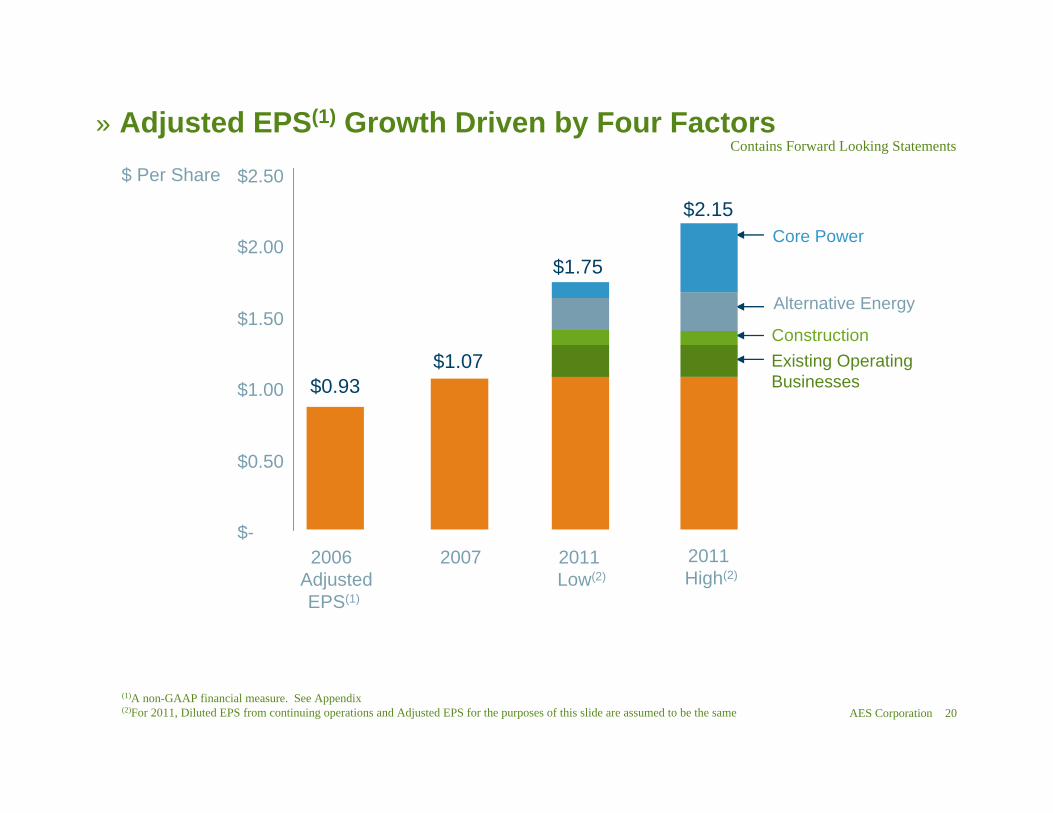
AES Corporation 20(1)A non-GAAP financial measure. See Appendix(2)For 2011, Diluted EPS from continuing operations and Adjusted EPS for the purposes of this slide are assumed to be the same
» Adjusted EPS(1) Growth Driven by Four Factors
$-
$0.50
$1.00
$1.50
$2.00
$2.50
$0.93$1.07
2006 AdjustedEPS(1)
2007 2011 Low(2)
2011 High(2)
$1.75
$2.15
Existing Operating Businesses
Alternative Energy
Core Power
Construction
Contains Forward Looking Statements
$ Per Share
AES Corporation 21
» Summary
› Solid Fundamentals and Operating Model–Project Finance skills–Operating and Turnaround Expertise
› Global Reach, Local Insights
› Experienced in Leveraging Market Opportunities and Industry Dynamics
› Rigorous Capital Allocation and Risk Management
› Double Digit Earnings Growth (2006-2011)
› Strong and Growing Free Cash Flow
Contains Forward Looking Statements
AES Corporation 22
» Appendix
AES Corporation 23
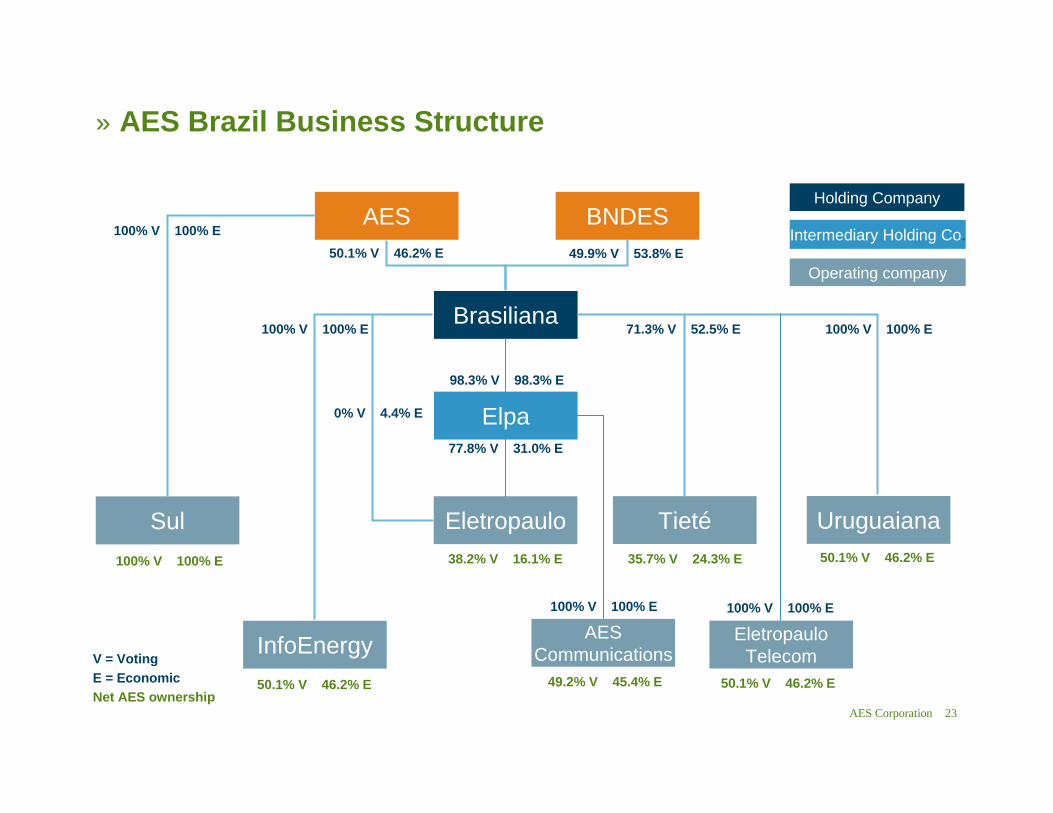
» AES Brazil Business Structure
100% V 100% E100% V 100% E
AES BNDES
Brasiliana
Sul Eletropaulo Tieté
InfoEnergy EletropauloTelecom
AESCommunications
50.1% V 46.2% E100% V 100% E
49.9% V 53.8% E
100% V 100% E
V = VotingE = EconomicNet AES ownership
50.1% V 46.2% E 50.1% V 46.2% E49.2% V 45.4% E
38.2% V 16.1% E 35.7% V 24.3% E
Holding Company
Intermediary Holding Co.
Operating company
Uruguaiana50.1% V 46.2% E
71.3% V 52.5% E 100% V 100% E
0% V 4.4% E Elpa98.3% V 98.3% E
77.8% V 31.0% E
100% V 100% E
AES Corporation 24
» AssumptionsForecasted financial information is based on certain material assumptions. Such assumptions include, but are not limited to: (a) no unforeseen external events such as wars, depressions, or economic or political disruptions occur; (b) businesses continue to operate in a manner consistent with or better than prior operating performance, including achievement of planned productivity improvements including benefits of global sourcing, and in accordance with the provisions of their relevant contracts or concessions; (c) new business opportunities are available to AES in sufficient quantity to achieve its growth objectives; (d) no material disruptions or discontinuities occur in GDP, foreign exchange rates, inflation or interest rates during the forecast period; and (e) material business-specific risks as described in the Company’s SEC filings do not occur individually or cumulatively. In addition, benefits from global sourcing include avoided costs, reduction in capital project costs versus budgetary estimates, and projected savings based on assumed spend volume which may or may not actually be achieved. Also, improvement in certain KPIs such as equivalent forced outage rate and commercial availability may not improve financial performance at all facilities based on commercial terms and conditions. These benefits will not be fully reflected in the Company’s consolidated financial results.
The cash held at qualifying holding companies (QHCs) represents cash sent to subsidiaries of the Company domiciled outside of the U.S. Such subsidiaries had no contractual restrictions on their ability to send cash to AES, the Parent Company. Cash at those subsidiaries was used for investment and related activities outside of the U.S. These investments included equity investments and loans to other foreign subsidiaries as well as development and general costs and expenses incurred outside the U.S. Since the cash held by these QHCs is available to the Parent, AES uses the combined measure of subsidiary distributions to Parent and QHCs as a useful measure of cash available to the Parent to meet its international liquidity needs. AES believes that unconsolidated parent company liquidity is important to the liquidity position of AES as a parent company because of the non-recourse nature of most of AES’s indebtedness.
AES Corporation 25
› Adjusted earnings per share – Defined as diluted earnings per share from continuing operations excluding gains or losses associated with (a) mark-to-market amounts related to FAS 133 derivative transactions, (b) foreign currency transaction impacts on the net monetary position related to Brazil and Argentina, (c) significant asset gains or losses due to disposition transactions and impairments, and (d) early retirement of recourse debt. AES believes that adjusted earnings per share better reflects the underlying business performance of the Company, and is considered in the Company’s internal evaluation of financial performance. Factors in this determination include the variability associated with mark-to-market gains or losses related to certain derivative transactions, currency gains and losses, periodic strategic decisions to dispose of certain assets which may influence results in a given period, and the early retirement of corporate debt.
› Free cash flow – Net cash flow from operating activities less maintenance capital expenditures. Maintenance capital expenditures reflect property additions less growth capital expenditures. AES believes that free cash flow is a useful measure for evaluating our financial condition because it represents the amount of cash provided by operations less maintenance capital expenditures as defined by our businesses, that may be available for investing or for repaying debt.
› Subsidiary distributions – Cash distributions (primarily dividends and interest income) from subsidiary companies to the parent company and qualified holding companies. These cash flows are the source of cash flow to the parent to meet corporate interest, overhead, cash taxes, and discretionary uses such as recourse debt reductions and corporate investments.
» Definitions of Non-GAAP Financial Measures
AES Corporation 26
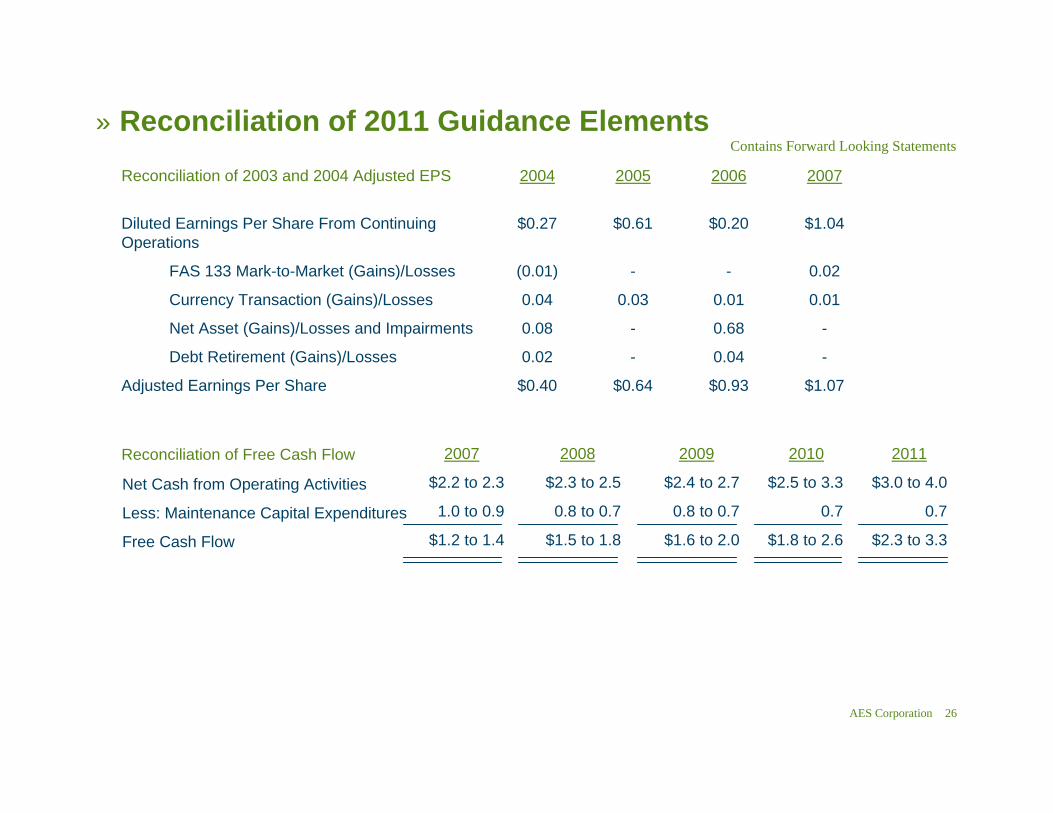
» Reconciliation of 2011 Guidance Elements
$0.40
0.02
0.08
0.04
(0.01)
$0.27
2004
$0.64
-
-
0.03
-
$0.61
2005
$0.93
0.04
0.68
0.01
-
$0.20
2006
$1.07
-
-
0.01
0.02
$1.04
2007Reconciliation of 2003 and 2004 Adjusted EPS
Adjusted Earnings Per Share
Debt Retirement (Gains)/Losses
Net Asset (Gains)/Losses and Impairments
Currency Transaction (Gains)/Losses
FAS 133 Mark-to-Market (Gains)/Losses
Diluted Earnings Per Share From Continuing Operations
Reconciliation of Free Cash Flow
Net Cash from Operating Activities
Less: Maintenance Capital Expenditures
Free Cash Flow
$2.4 to 2.7
0.8 to 0.7
$1.6 to 2.0
20092008
$2.3 to 2.5
0.8 to 0.7
$1.5 to 1.8
$2.5 to 3.3
0.7
$1.8 to 2.6
2010
$3.0 to 4.0
0.7
$2.3 to 3.3
20112007
$2.2 to 2.3
1.0 to 0.9
$1.2 to 1.4
Contains Forward Looking Statements