aerodynamic heating at hypersonic speed - intech...
TRANSCRIPT
10
Aerodynamic Heating at Hypersonic Speed
Andrey B Gorshkov Central Research Institute of Machine Building
Russia
1 Introduction
At designing and modernization of a reentry space vehicle it is required accurate and
reliable data on the flow field aerodynamic characteristics heat transfer processes Taking
into account the wide range of flow conditions realized at hypersonic flight of the vehicle in
the atmosphere it leads to the need to incorporate in employed theoretical models the
effects of rarefaction viscous-inviscid interaction flow separation laminar-turbulent
transition and a variety of physical and chemical processes occurring in the gas phase and
on the vehicle surface
Getting the necessary information through laboratory and flight experiments requires
considerable expenses In addition the reproduction of hypersonic flight conditions at ground
experimental facilities is in many cases impossible As a result the theoretical simulation of
hypersonic flow past a spacecraft is of great importance Use of numerical calculations with
their relatively small cost provides with highly informative flow data and gives an
opportunity to reproduce a wide range of flow conditions including the conditions that
cannot be reached in ground experimental facilities Thus numerical simulation provides the
transfer of experimental data obtained in laboratory tests on the flight conditions One of the main problems that arise at designing a spacecraft reentering the Earthrsquos atmosphere with orbital velocity is the precise definition of high convective heat fluxes (aerodynamic heating) to the vehicle surface at hypersonic flight In a dense atmosphere where the assumption of continuity of gas medium is true a detailed analysis of parameters of flow and heat transfer of a reentry vehicle may be made on the basis of numerical integration of the Navier-Stokes equations allowing for the physical and chemical processes in the shock layer at hypersonic flight conditions Taking into account the increasing complexity of practical problems a task of verification of employed physical models and numerical techniques arises by means of comparison of computed results with experimental data In this chapter some results are presented of calculations of perfect gas and real air flow
which have been obtained using a computer code developed by the author (Gorshkov
1997) The code solves two- or three-dimensional Navier-Stokes equations cast in
conservative form in arbitrary curvilinear coordinate system using the implicit iteration
scheme (Yoon amp Jameson 1987) Three gas models have been used in the calculations
perfect gas equilibrium and nonequilibrium chemically reacting air Flow is supposed to be
laminar
The first two cases considered are hypersonic flow of a perfect gas at wind tunnel conditions In experiments conducted at the Central Research Institute of Machine Building
wwwintechopencom
Heat Transfer - Mathematical Modelling Numerical Methods and Information Technology
234
(TsNIImash) (Gubanova et al 1992) areas of elevated heat fluxes have been found on the windward side of a delta wing with blunt edges Here results of computations are presented which have been made to numerically reproduce the observed experimental effect The second case is hypersonic flow over a test model of the Pre-X demonstrator (Baiocco et al 2006) designed to glide in the Earths atmosphere A comparison between thermovision experimental data on heat flux obtained in TsNIImash and calculation results is made As the third case a flow of dissociating air at equilibrium and nonequilibrium conditions is considered The characteristics of flow field and convective heat transfer are presented over a winged configuration of a small-scale reentry vehicle (Vaganov et al 2006) which was developed in Russia at some points of a reentry trajectory in the Earths atmosphere
2 Basic equations
For the three-dimensional flows of a chemically reacting nonequilibrium gas mixture in an arbitrary curvilinear coordinate system
x y z t x y z t x y z t tξ ξ η η ζ ζ τ= ( ) = ( ) = ( ) =
the Navier-Stokes equations in conservative form can be written as follows (see eg Hoffmann amp Chiang 2000)
part part part partpartτ partξ partη partζ+ + + =Q E F G
S (1)
( ) ( ) ( )1 1 t x c y c z cx y z ξ η ζ ξ ξ ξ ξminus minus= part part = + + +E Q E F GJ J
( ) ( )1 1t x c y c z c t x c y c z cJ Jη η η η ζ ζ ζ ζminus minus= + + + = + + +F Q E F G G Q E F G
Here J ndash Jacobian of the coordinate transformation and metric derivatives are related by
( ) x t x y zJ y z y z x y zη ζ ζ η τ τ τξ ξ ξ ξ ξ= minus = minus minus minus etc
Q is a vector of the conservative variables Eつ Fつ and Gつ are x y and z components of mass momentum and energy in Cartesian coordinate system S is a source term taking into account chemical processes
2
2
2
( ) ( )( )
xy xzxx
yzyyxyc c c
yzxz zz
x y
i i i x i i y
vu wvu wuu pu
wvv puvv
w vwuw w p
e e p u m e pe p v m
u d v d
ρρ ρρ ρ τ ρ τρ τρ ρ τρ τρ τρρ ρ τρ τ ρ τρ ρ ρ
⎛ ⎞⎛ ⎞⎛ ⎞ ⎜ ⎟⎜ ⎟ minus⎜ ⎟ minus⎜ ⎟+ minus⎜ ⎟⎜ ⎟ ⎜ ⎟⎜ ⎟ minus+ minus⎜ ⎟ minus ⎜ ⎟⎜ ⎟= = = =⎜ ⎟ ⎜ ⎟⎜ ⎟ minusminus + minus⎜ ⎟ ⎜ ⎟⎜ ⎟⎜ ⎟ ⎜ ⎟+ minus ++ minus⎜ ⎟⎜ ⎟ ⎜ ⎟⎜ ⎟ ⎜ ⎟+ ⎜ ⎟⎝ ⎠ +⎝ ⎠ ⎝ ⎠
Q E F G
0
0
0
0
0z
ii i z
w m
w d ωρ
⎛ ⎞ ⎛ ⎞⎜ ⎟ ⎜ ⎟⎜ ⎟ ⎜ ⎟⎜ ⎟ ⎜ ⎟⎜ ⎟ = ⎜ ⎟⎜ ⎟ ⎜ ⎟⎜ ⎟ ⎜ ⎟minus⎜ ⎟ ⎜ ⎟⎜ ⎟⎜ ⎟+ ⎝ ⎠⎝ ⎠
S
x xx xy xz x y xy yy yz y z xz yz zz zm u v w q m u v w q m u v w qτ τ τ τ τ τ τ τ τ= + + minus = + + minus = + + minus
wwwintechopencom
Aerodynamic Heating at Hypersonic Speed
235
where ρ ρi ndash densities of the gas mixture and chemical species i u v and w ndash Cartesian velocity components along the axes x y and z respectively the total energy of the gas mixture per unit volume e is the sum of internal and kinetic energies
2 2 2( ) 2e u v wρε ρ= + + +
The components of the viscous stress tensor are
2 2 2xx yy zz
u v wdiv div div
x y zτ μ λ τ μ λ τ μ λpart part part= + = + = +part part partV V V
xy xz yz
u v u w v w u v wdiv
y x z x z y x y zτ μ τ μ τ μ⎛ ⎞ ⎛ ⎞part part part part part part part part part⎛ ⎞= + = + = + = + +⎜ ⎟ ⎜ ⎟⎜ ⎟part part part part part part part part part⎝ ⎠⎝ ⎠ ⎝ ⎠ V
Inviscid parts of the fluxes E = Einv - Ev F = Finv - Fv и G = Ginv - Gv in a curvilinear coordinate system have the form
1 1 1
( ) ( ) ( )
x x x
y y yinv inv inv
z z z
t t t
i i i
U V W
Uu p Vu p Wu p
Uv p Vv p Wv pJ J J
Uw p Vw p Ww p
e p U p e p V p e p W p
U V W
ρ ρ ρρ ξ ρ η ρ ζρ ξ ρ η ρ ζρ ξ ρ η ρ ζ
ξ η ζρ ρ ρ
minus minus minus
⎛ ⎞ ⎛ ⎞ ⎛ ⎞⎜ ⎟ ⎜ ⎟ ⎜ ⎟+ + +⎜ ⎟ ⎜ ⎟ ⎜ ⎟⎜ ⎟ ⎜ ⎟ ⎜ ⎟+ + +⎜ ⎟ ⎜ ⎟ ⎜ ⎟= = =+ + +⎜ ⎟ ⎜ ⎟ ⎜ ⎟⎜ ⎟ ⎜ ⎟ ⎜ ⎟+ minus + minus + minus⎜ ⎟ ⎜ ⎟ ⎜ ⎟⎜ ⎟ ⎜ ⎟ ⎜ ⎟⎝ ⎠ ⎝ ⎠ ⎝ ⎠
E F G
where U V and W ndash velocity components in the transformed coordinate system
t x y z t x y z t x y zU u v w V u v w W u v wξ ξ ξ ξ η η η η ζ ζ ζ ζ= + + + = + + + = + + +
Fluxes due to processes of molecular transport (viscosity diffusion and thermal conductivity) Ev Fv и Gv in a curvilinear coordinate system
( )1 1
0 0
x xx y xy z xz x xx y xy z xz
x xy y yy z yz x xy y yy z yz
v vx xz y yz z zz x xz y yz z zz
x x y y z z x x y y z z
x i x y i y z i z x i x y i
J J
m m m m m m
d d d d d
ξ τ ξ τ ξ τ η τ η τ η τξ τ ξ τ ξ τ η τ η τ η τξ τ ξ τ ξ τ η τ η τ η τξ ξ ξ η η ηξ ξ ξ η η
minus minus
⎛ ⎞⎜ ⎟+ + + +⎜ ⎟⎜ ⎟+ + + +⎜ ⎟= =⎜ ⎟+ + + +⎜ ⎟+ + + +⎜ ⎟⎜ ⎟⎜ ⎟minus + + minus +⎝ ⎠
E F
( ) y z i zdη
⎛ ⎞⎜ ⎟⎜ ⎟⎜ ⎟⎜ ⎟⎜ ⎟⎜ ⎟⎜ ⎟⎜ ⎟⎜ ⎟+⎝ ⎠
( )1
0
x xx y xy z xz
x xy y yy z yz
vx xz y yz z zz
x x y y z z
x i x y i y z i z
J
m m m
d d d
ζ τ ζ τ ζ τζ τ ζ τ ζ τζ τ ζ τ ζ τζ ζ ζζ ζ ζ
minus
⎛ ⎞⎜ ⎟+ +⎜ ⎟⎜ ⎟+ +⎜ ⎟= ⎜ ⎟+ +⎜ ⎟+ +⎜ ⎟⎜ ⎟⎜ ⎟minus + +⎝ ⎠
G
wwwintechopencom
Heat Transfer - Mathematical Modelling Numerical Methods and Information Technology
236
Partial derivatives with respect to x y and z in the components of the viscous stress tensor
and in flux terms describing diffusion di = (dix diy diz) and thermal conductivity
q = (qx qy qz) are calculated according to the chain rule
21 Chemically reacting nonequilibrium air In the calculation results presented in this chapter air is assumed to consist of five chemical species N2 O2 NO N O Vibrational and rotational temperatures of molecules are equal to the translational temperature Pressure is calculated according to Daltons law for a mixture of ideal gases
ii
gm i
RTRTp p
M M
ρρ= = =sum sum
where 〈gm 〈i ndash molecular weights of the gas mixture and the i-th chemical species The internal energy of the gas mixture per unit mass is
( ) ( )vi fi i i i ei i vmi i i m
c h c C T c T c Tε ε ε= + + +sum sum sum sum
Here ci =ρiρ hfi εei ndash mass concentration formation enthalpy and energy of electronic excitation of species i Cvi ndash heat capacity at constant volume of the translational and rotational degrees of freedom of species i equal to 32(RMi) for atoms and 52(RMi) for diatomic molecules Vibrational energy εvm of the m-th molecular species is calculated in the approximation of the harmonic oscillator The diffusion fluxes of the i-th chemical species are determined according to Ficks law and for example in the direction of the x-axis have the form
i
i x i
cd D
xρ part= minus part
To determine diffusion coefficients Di approximation of constant Schmidt numbers Sci = μρDi is used which are supposed to be equal to 075 for atoms and molecules Total heat flux q is the sum of heat fluxes by thermal conductivity and diffusion of chemical species
( ) ( )x i i x i pi vi ei fii
Tq h d h C T T T h
xκ ε εpart= minus + = + + +part sum
where hi Cちi ndash enthalpy and heat capacity at constant pressure of translational and rotational
degrees of freedom of the i-th chemical species per unit mass Viscosity μ and thermal conductivity κ of nonequilibrium mixture of gases are found by formulas of Wilke (1950) and of Mason amp Saxena (1958) The values of the rate constants of chemical reactions were taken from (Vlasov et al 1997) where they were selected on the basis of various theoretical and experimental data in particular as a result of comparison with flight data on electron density in the shock layer near the experimental vehicle RAM-C (Grantham 1970) Later this model of nonequilibrium air was tested in (Vlasov amp Gorshkov 2001) for conditions of hypersonic flow past the reentry vehicle OREX (Inouye 1995)
wwwintechopencom
Aerodynamic Heating at Hypersonic Speed
237
22 Perfect gas and equilibrium air In the calculations using the models of perfect gas and equilibrium air mass conservation
equations of chemical species in the system (1) are absent For a perfect gas the viscosity is
determined by Sutherlandrsquos formula thermal conductivity is found from the assumption of
the constant Prandtl number Pr = 072 For equilibrium air pressure internal energy
viscosity and thermal conductivity are determined from the thermodynamic relations
( ) ( ) ( ) ( )p p T T T Tρ ε ε ρ μ μ ρ κ κ ρ= = = =
23 Boundary conditions On the body surface a no-slip condition of the flow u = v = w =0 fixed wall temperature
Tw = const or adiabatic wall qw = wTw4 are specified where qw ndash total heat flux to the surface
due to heat conduction and diffusion of chemical species (2) w = 08 ndash emissivity of thermal
protection material - Stefan-Boltzmannrsquos constant
Concentrations of chemical species on the surface are found from equations of mass balance
which for atoms are of the form
2 10
2 2i w
i n i w i i wi w i
RTd K K
M
γρ γ π+ = = minus (3)
where γiw ndash the probability of heterogeneous recombination of the i-th chemical species
In hypersonic flow a shock wave is formed around a body Shock-capturing or shock-fitting approach is used In the latter case the shock wave is seen as a flow boundary with the implementation on it of the Rankine-Hugoniot conditions which result from integration of the Navier-Stokes equations (1) across the shock neglecting the source term S and the derivatives along it Assuming that a coordinate line = const coincides with the shock wave the Rankine-Hugoniot conditions can be represented in the form sinfin =F F or in more details (for a perfect gas)
( ) ( )( ) ( )( ) ( )
2 2
2 2 2 2( ) ( )
2 2 2 2
s ns n
s ns s n
s ns s n
ns s ns
V D V D
V D P V D P
V D V V D V
V D V V D Vh h
τ ττ τ
ρ ρρ ρρ ρ
infin infininfin infin infin
infin infin infininfin infininfin
minus = minusminus + = minus +minus = minus
minus minus+ + = + + (4)
here indices infin and s stand for parameters ahead and behind the shock D ndash shock velocity
V and Vn ndash projection of flow velocity on the directions of the tangent τ and the external
normal n to the shock wave In (4) terms are omitted responsible for the processes of
viscosity and thermal conductivity because in the calculation results presented below the
shock wave fitting is used for flows at high Reynolds numbers
24 Numerical method An implicit finite-difference numerical scheme linearized with respect to the previous time
step n for the Navier-Stokes equations (1) in general form can be written as follows
wwwintechopencom
Heat Transfer - Mathematical Modelling Numerical Methods and Information Technology
238
nξ η ζτ δ δ δ τ⎡ ⎤+ Δ + + minus Δ = minusΔ⎣ ⎦I A B C T Q R (5)
( ) ( ) ( ) ( ) n n n nn ξ η ζδ δ δ part part part part part part part part= + + minus = = = =R E F G S A E Q B F Q C G Q T S Q
Here symbols δξ δ and δ denote finite-difference operators which approximate the partial derivatives partpartξ partpart and partpart the index and indicates that the value is taken at time n I ndash identity matrix ΔQ = Qn +1 - Qn ndash increment vector of the conservative variables at time-step Δ = n+1 ndash n Let us consider first the inviscid flow Yoon amp Jameson (1987) have proposed a method of approximate factorization of the algebraic equations (5) ndash Lower-Upper Symmetric Successive OverRelaxation (LU-SSOR) scheme Suppose that in the transformed coordinates (ξ ζ) the grid is uniform and grid spacing in all directions is unity Δξ=Δ=Δζ=1 Then the LU-SSOR scheme at a point (ijk) of a finite-difference grid can be written as
1 nminus Δ = minusLD U Q R (6)
1 1 1 1 1 1
1 ( )
i j k i j k i j k i j k i j k i j k
β ρ ρ ρτ+ + + minus minus minusminus minus minus + + +
⎧ ⎫= + = + = + + + minus⎨ ⎬Δ⎩ ⎭= minus minus minus = + +
A B CL D L U D U D I T
L A B C U A B C
where
2 2 2
2 2 2
2 2 2
( ) 2
( ) 2
( ) 2
x y z
x y z
x y z
U
V
W
βρ ρ ξ ξ ξβρ ρ η η ηβρ ρ ζ ζ ζ
plusmnplusmnplusmn
= plusmn = + + += plusmn = + + += plusmn = + + +
A A
B B
C C
A A I
B B I
C C I
a
a
a
Here the indices of the quantities at the point (ijk) are omitted for brevity βge1 is a constant ρA ρB ρC ndash the spectral radii of the ldquoinviscidrdquo parts of the Jacobians A B и C а ndash the speed of sound Inversion of the equation system (6) is made in two steps
L Q R nΔ = minus (7a)
U Q D QΔ = Δ (7b)
It is seen from (6) that for non chemically reacting flows (S=0 T=0) LU-SSOR scheme does not require inversion of any matrices For reacting flows due to the presence of the Jacobian of the chemical source Tne0 the forward and back steps in (7) require generally speaking matrix inversion However calculations have shown that if the conditions are not too close to equilibrium then in the chemical Jacobian Т one can retain only diagonal terms which contain solely the partial derivatives with respect to concentrations of chemical species In this approximation scheme (6) leads to the scalar diagonal inversion also for the case of chemically reacting flows Thus calculation time grows directly proportionally to the number of chemical species concentrations This is important in calculations of complex flows of reacting gas mixtures when the number of considered chemical species is large In the case of viscous flow so as not to disrupt the diagonal structure of scheme (6) instead of the ldquoviscousrdquo Jacobians Av Bv и Cv their spectral radii are used
wwwintechopencom
Aerodynamic Heating at Hypersonic Speed
239
( ) ( ) ( )2 2 2 2 2 2 2 2 2 Pr Pr Pr
v x y z v x y z v x y z
γ μ γ μ γ μρ ξ ξ ξ ρ η η η ρ ζ ζ ζρ ρ ρ= + + = + + = + +CA B
In the finite-difference equation (6) central differences are employed both for viscous and convective fluxes The use of central differences to approximate the convective terms can cause non-physical oscillations of the flow parameters at high Reynolds numbers To suppress such numerical oscillations artificial dissipation terms were added in the right part R of (6) according to Pulliam (1986) In calculations presented below it was assumed that the derivatives partξpartt partpartt and partpartt are zero and Δ = infin Since steady flow is considered these assumptions do not affect the final result
3 Calculation results
31 Flow and heat transfer on blunt delta wing In thermovision experiments (Gubanova et al 1992) in hypersonic flow past a delta wing with blunt nose and edges two regions of elevated heat were observed on its windward surface At a distance of approximately 12-15 r from the nose of the wing (r ndash nose radius) there were narrow bands of high heat fluxes which extended almost parallel to the symmetry plane at a small interval (3-5 r) from it to the final section of the wing at х asymp 100 r (see Fig 1 in which the calculated distribution of heat fluxes is shown at the experimental conditions) The level of heat fluxes in the bands was approximately twice the value of background heat transfer corresponding to the level for a delta plate with sharp edges under the same conditions It turned out that this effect exists in a fairly narrow range of flow parameters In particular on the same wing but with a sharp tip a similar increase in heat flux was not observed This effect was explained by the interaction of shock waves arising at the tip and on the blunt edges of the wing (Gubanova et al 1992 Lesin amp Lunev 1994) In this section numerical results calculated for the experimental conditions are presented and compared with measured heat flux values (see also (Vlasov et al 2009))
Fig 1 Calculated distribution of non-dimensional heat flux Q = qq0 on the windward side of the blunt delta wing q0 ndash heat flux at the stagnation point of a sphere with a radius equal to the nose radius of the wing
Perfect gas hypersonic flow ( = 14) past a delta wing with a spherical nose and cylindrical edges of the same radius is considered Mach and Reynolds numbers calculated with free stream flow parameters and the wing nose radius are Minfin = 14 and Reinfin = 14middot104 angle of attack α = 10deg wing sweep angle λ = 75deg The free stream stagnation temperature T0infin = 1205 K the wall temperature Tw = 300 K Due to the symmetry of flow only half of the wing is computed The flow calculation was performed with shock-fitting procedure the computational grid is 120times40times119 (in the longitudinal transverse and circumferential
wwwintechopencom
Heat Transfer - Mathematical Modelling Numerical Methods and Information Technology
240
directions respectively see Fig 2) Below in this section all quantities with a dimension of length unless otherwise specified are normalized to the wing nose radius r
Fig 2 The computational grid on the wing surface in the plane of symmetry (z = 0) and in the exit section for the converged numerical solution
Fig 3 Streamlines near the windward surface of the wing Top ndash at a distance of one grid step from the wall bottom ndash at the outer edge of the boundary layer
Calculated patterns of streamlines near the windward surface of the wing at a distance of one grid step from the wall and at the outer edge of the boundary layer are shown in Fig 3 The streamlines flowing down from the wing edge on the windward plane at almost constant pressure form the line of diverging flow (line A-A) along which there are bands of elevated heat fluxes At the symmetry plane a line of converging streamlines is realized along the entire length of the wing but upstream the shock interaction point A flow impinges on the symmetry plane from the edges and downstream from A ndash from the diverging line A-A A characteristic feature of the considered case is that the distribution of heat fluxes on the windward side is mainly determined by the values of convergence and divergence of streamlines at almost constant pressure (see Fig 4 which shows the distribution of pressure and heat flux on the windward side in several sections x = const) Local maxima of heat fluxes near symmetry plane appear only at xgt 15 near the line z = 4 (after the nose shock wave intersects with the shock wave from the edges) and the relative intensity of these heat peaks grows with increasing distance from the nose (Fig 4b)
wwwintechopencom
Aerodynamic Heating at Hypersonic Speed
241
003
008
0 05 1
P
1
2 34
5
z
0
005
01
015
0 5 10
Q
z
12
34
(a) (b)
Fig 4 Pressure distribution Р = pρinfinVinfin2 (a) and heat flux Q = qq0 (b) on windward side of wing in sections 1-5 ndash x = 10 20 30 50 90 z= zzmax zmax ndash wingspan in section х = const
Comparison of the upper and lower parts of Fig 3 shows that the flow near the wall and at the outer edge of the boundary layer are noticeably different the streamlines near the wall are directed to the symmetry plane (converging) and in inviscid region ndash from it (diverging) It follows that the velocity component directed along the wing chord changes sign across the boundary layer which indicates the existence of transverse vortex (cross separation flow) in the boundary layer This is illustrated in Fig 5a which shows the projection of streamlines on the plane of the cross section at x = 90
400
1200
1200
700
1000T
0
(a) (b)
Fig 5 Projection of streamlines (a) and isolines of stagnation temperature T0 K (b) in cross section x = 90
The distribution of the boundary layer thickness is clearly seen in Fig 5b which shows the contours of the stagnation temperature T0 in the cross section x = 90 On the windward side of the wing minimum thickness of the boundary layer is located on the diverging line (line A-A in Fig 3) On the left and on the right sides of the diverging line there are converging lines with a thicker boundary layer (about 2 and 3 times respectively) One of the
wwwintechopencom
Heat Transfer - Mathematical Modelling Numerical Methods and Information Technology
242
converging lines is the symmetry plane Here the boundary layer thickness on the windward side reaches a maximum amounting to about one-third of the shock layer thickness Near the wing edge because of the expansion and acceleration of the flow the boundary layer thickness decreases sharply (at the edge it is almost 20 times less than at the symmetry plane on the windward side) On the leeward side of the wing flow separation occurs and the concept of the boundary layer loses its meaning Here scope of viscous flow is half the shock layer The shape of calculated shock wave in Fig 6a induced by the wing nose as a blunt body is determined by the law of the explosive analogy so that some front part of the wing
x le xA asymp 15 will be located inside the initially axisymmetric shock wave The coordinate of point A (xA) is located in the vicinity of interaction region of shock waves induced by the nose and the edges of the wing Here the profiles of pressure and heat flux along the edge are local maxima
0
10
000
005
0 15 30
zP
Q2
x
shock wing edge
P
Q
xA
0
005
-1 -05 0 05 1
Q
z
calculation
experiment
(a) (b)
Fig 6 Profiles of pressure heat flux and the shock wave along the wing edge (a) and distribution of heat fluxes in cross section x = 90 (b)
In Fig 6b the distribution of computed heat fluxes qq0 in the neighborhood of the wing end section at x = 90 is presented in comparison with the experiment of Gubanova et al (1992) depending on the transverse coordinate z On the whole the calculation correctly predicts the magnitude and position of local maximum of heat flux near the symmetry plane taking into account the small asymmetry in the experimental data Note that near the minima of heat fluxes calculated values are lower than experimental ones probably due to effect of smoothing of experimental data in these narrow regions
32 Heat transfer on test model of Pre-X space vehicle Currently developed hypersonic aircraft have dimensions several times smaller than previously created space vehicles Shuttle and Buran This results in increase of heat load on a vehicle during flight and therefore the problem of reliable calculation of heat fluxes on the surface for such relatively small bodies is particularly important Thus the problem arises of verification of the employed physical models and numerical methods by comparing calculation results with experimental data
wwwintechopencom
Aerodynamic Heating at Hypersonic Speed
243
In 2006-2007 on TsNIImashrsquos experimental base in a piston gasdynamic wind tunnel PGU-7 a heat transfer study has been conducted on a small-scale model of Pre-X reentry demonstrator (Baiocco 2006) This vehicle is designed to obtain in flight conditions experimental data pertaining to aerothermodynamic phenomena that are not modeled in ground tests but they are critical for design of a vehicle returning from the Earthrsquos orbit In particular Pre-X demonstrator is developed to test in a real flight and in specified locations on the vehicle surface samples of reusable thermal protection materials and to assess their durability During the study thermovision measurements have been conducted of heat fluxes on the model of scale 115 at various flow regimes ndash M = 10 Re = 1106-5106 1m (Kovalev et al 2009) Processing of thermovision measurements was carried out in accordance with standard technique and composed of determination of the model surface temperature during experiment extraction from these data distributions of heat fluxes on the observed model surface and binding of the resulting thermovision frame to a three-dimensional CAD model of the demonstrator The same CAD model has been used for numerical simulation of heat transfer on the Pre-X test model As a normalizing value the heat flux q0 at the stagnation point of a sphere with radius of 70 mm is adopted which is determined using the Fay-Riddell formula Advantage of data presentation in this form is due to invariability of the relative values Q = qq0 on most model surface at variations of flow parameters
Fig 7 Calculated distributions of pressure Р = ちρinfinVinfin2 (left) and stagnation temperature T0 K (right) on surface and in shock layer (in symmetry plane and in exit section) for test model of Pre-X vehicle
On the base of the numerical solution of the Navier-Stokes equations a study was carried out of flow parameters and heat transfer for laminar flow over a test model of Pre-X space
wwwintechopencom
Heat Transfer - Mathematical Modelling Numerical Methods and Information Technology
244
vehicle for experimental conditions in the piston gasdynamic wind tunnel Mach and Reynolds numbers calculated from the free-stream parameters and the length of the model (330 mm) are Minfin = 10 and Reinfin = 7middot105 Angle of attack ndash 45deg The flap deflection angle was (as in the experiment) = 5 10 and 15deg The stagnation temperature of the free-stream flow and the wing surface temperature ndash T0infin = 1000 K and Tw = 300 K respectively An approximation of a perfect gas was used with ratio of specific heats = 14 The calculations were performed with a shock-fitting procedure ie the bow shock was considered as a discontinuity with implementation of the Rankine-Hugoniot relations (4) across it On the model surface no-slip and fixed temperature conditions were set Note that in view of the flow symmetry computations were made only for a half of the model although in the figures below for comparison with experiment the calculated data (upon reflection in the symmetry plane) are presented on the entire model The overall flow pattern obtained in the calculations over the test model of Pre-X space vehicle is shown in Fig 7 where for the case of the flap deflection angle = 15deg pressure and stagnation temperature Т0 isolines in the shock layer and on the model surface are shown It is seen that there are two areas of high pressure on the nose tip of the model (P asymp 092) and on the deflection flaps In the latter case the pressure in the flow passing through the two shock waves reaches P asymp 13 Isolines of Т0 show the size of regions where viscous forces are significant a thin boundary layer on the windward side of the model and an extensive separation zone on the leeward side The small separation zone appearing at deflection flaps although about four times thicker than the boundary layer upstream of it is almost not visible in the scale of the figure Fig 8 shows the distributions of relative heat flow Q on the windward side of the model obtained in the experiments and in the calculations at deflection angles of flaps = 5 10 and 15deg For the case = 5deg it can be noted rather good agreement between experiment and calculation in the values of heat flux in the central part of the model and on the flaps It is evident that before deflected flaps there is a region of low heat fluxes caused by near separation state (according to calculation results) of the boundary layer In analyzing the experimental data it should be taken into account the effect of apparent temperature reduction of the surface area with a large angle to the thermovision observation line It is precisely this effect that explains the fact that in the nose part of the model the experimental values of heat flux are less than the calculated ones Also narrow zones of high (at the sharp edges of the flaps) or low (in the separation zone at the root of the flaps) values of heat flux are smoothed or not visible in the experiment due to insufficient resolution of thermovision equipment The resolution capability of thermovisor is clearly visible by the size of cells in the experimental isoline pattern of heat flux in Fig 8 It should be noted that the calculations do not take into account a slit between the deflection flaps available on the test model the presence of which should lead to a decrease in the separation region in front of the flaps At an angle of flap deflection = 10deg as in the previous case = 5deg there is fairly good agreement between calculation and experiment for the values of heat flux in the central part of the model and on the flaps The calculations show that the growth of the flap deflection angle from 5deg to 10deg results in the formation of a large separation zone in front of the flaps and in a decrease in heat flux value Q from 02 to 01 At the largest angle of flap deflection = 15deg the maximum of calculated heat flux occurs in the zone of impingement of the separated boundary layer where the level of Q is 2-3 times higher than its level on the undeflected flap The coincidence of calculation results with
wwwintechopencom
Aerodynamic Heating at Hypersonic Speed
245
experimental data in the front part of the model up to the separation zone before the flaps is satisfactory On the flaps the level of heat flux in the experiment is about one and a half times more than in the calculation This difference in heat flux values is apparently due to laminar-turbulent transition in separation region induced by the deflected flaps which takes place in the experiment
δ = 5deg
δ = 10deg
δ = 15deg
Fig 8 Experimental (left) and calculated (right) heat fluxes Q = qq0 on windward side of test model of Pre-X space vehicle at different deflection angles of flaps
wwwintechopencom
Heat Transfer - Mathematical Modelling Numerical Methods and Information Technology
246
33 Flow and heat transfer on a winged space vehicle at reentry to Earths atmosphere This section presents the results of numerical simulation of flow and heat transfer on a
winged version of the small-scale reentry vehicle being developed in TsAGI (Vaganov et al
2006) moving at hypersonic speed in the Earths atmosphere Calculations were made using
two physical-chemical models of the gas medium - equilibrium and non-equilibrium
chemically reacting air
The bow shock was captured in contrast to the previous two flow cases Thus on the inflow
boundary the free-stream conditions were specified On the vehicle surface no-slip and
adiabatic wall conditions were supposed In calculations with use of the nonequilibrium air
model the vehicle surface was supposed to be low catalytical with the probability of
heterogeneous recombination of O and N atoms equal to А = 001
A computational grid was provided by Mikhalin VA (Dmitriev et al 2007) and was taken
from the inviscid flow calculation The number of points in the direction normal to the
vehicle surface has been increased to resolve the wall boundary layer Part of the results
presented below was reported in (Dmitriev et al 2007 Gorshkov et al 2008a)
Calculations were performed for two points of a reentry trajectory for which thermal loads
are close to maximum (Table 1) The angle of attack α = 35deg the vehicle length L = 9m A
grid 93times50times101 in the longitudinal transverse and circumferential directions respectively
were used in the calculations The surface grid of the vehicle is shown in Fig 9
Н
km
Vinfin
msec ReinfinL Minfin Рinfin atm Тinfin K
70 5952 346middot105 200 576middot10-5 219
63 5152 684middot105 166 159middot10-4 243
Table 1 Parameters of trajectory points
Fig 9 Surface grid of the small-scale reentry vehicle
In Fig 10a contours of total enthalpy H0 on the surface and in the shock layer near the reentry vehicle are shown On the windward side one can see the shock wave the thin wall boundary layer and the inviscid flow between them in which the values of H0 are constant In the calculations the shock wave is smeared upon 3-5 grid points and has a finite thickness due to the use of artificial dissipation In particular a local decrease in H0 in a strong shock
wwwintechopencom
Aerodynamic Heating at Hypersonic Speed
247
wave on the windward side which can be seen in the figure has no physical meaning and is due to the influence of artificial dissipation Recall that the Navier-Stokes equations do not correctly describe the shock structure at Mach numbers Mgt 15 In the shock layer on the leeward side it is visible a large area with reduced values of total enthalpy Н0ltН0infin (Н0infin ndash total enthalpy in the free-stream) which arises as a result of boundary layer separation from the vehicle surface Chemical processes occurring in the shock layer over the vehicle are illustrated in Fig 10b which shows contours of mass concentrations of oxygen atoms つо Under the considered conditions in the vicinity of the vehicle nose behind the shock wave O2 dissociation is complete On the windward side downstream the nose in the shock layer and on the surface the recombination occurs and the concentration of O decreases In contrast on the leeward side where the flow is very rarefied the level of つо remains high indicating that the process of recombination of atomic oxygen is frozen
boundary layer
shock wave
(a) (b)
Fig 10 Total enthalpy MJkg (a) and mass concentration of oxygen atoms (b) on the surface and in the shock layer near the vehicle 〉 = 63 km
0001
001
01
1
0 5 10
P
x m
equilibrium air
nonequilibrium air
equilibrium air
Fig 11 Pressure distribution P = ちρinfinVinfin2 on vehicle surface overall view (left) and in symmetry plane (right) 〉 = 63 km
wwwintechopencom
Heat Transfer - Mathematical Modelling Numerical Methods and Information Technology
248
In Fig 11 and 12 isolines of pressure heat flux qw and equilibrium radiation temperature Tw
on the vehicle surface are shown for cases of equilibrium and non-equilibrium dissociating
air Comparison of qw and Tw distributions on the vehicle surface in the symmetry plane for
two air models are depicted in Fig 13
Analysis of the calculation results shows that pressure distribution on the windward surface
of the vehicle does not depend on physical-chemical model of the gas medium - the
difference in pressure values for equilibrium and non-equilibrium air flow is 1 - 2 On the
leeward side pressure on the surface for nonequilibrium flow may be nearly two times
lower than for equilibrium flow (eg in the vicinity of the tail) This is probably due to the
fact that the effective ratio of specific heats for nonequilibrium air is greater than for
equilibrium air because in the shock layer on the leeward side nonequilibrium flow is
chemically frozen and here there is a sufficiently high concentration of atoms (see Fig 10b)
equilibrium air nonequilibrium air
Fig 12 Distributions of heat flux qw kWm2 (top) and equilibrium radiation temperature TwdegC (bottom) on the vehicle surface 〉 = 63 km
Nonequilibrium chemical processes in the shock layer and finite catalytic activity of the
vehicle surface (А = 001) significantly reduce the calculated levels of heat transfer in
comparison with the case of equilibrium air flow The most significant decrease in heat flux
is observed on the vehicle nose part (for x le 1 m) and in the vicinity of the tail For example
at the nose stagnation point the level of heat flux decreases by about 40 ndash from 640 to 385
kWm2 while the surface temperature decreases by nearly 15 ndash from 1670 to 1430 degC
Note a high heat flux level on the thin edge of the wing compared with one at the nose
stagnation point Particularly intense heating occurs at the sharp bend of the wing where the
values of heat flux and surface temperature even slightly exceed their values at the front
stagnation point In the case of equilibrium air flow the exceeding for heat flux is about 10
(710 and 640 kWm2) for temperature - 3 (1720 and 1670 degC) In the case of
nonequilibrium air flow the exceeding is more significant for heat flux - 30 (540 and 385
kWm2) for temperature - 10 (1570 and 1430 deg C)
wwwintechopencom
Aerodynamic Heating at Hypersonic Speed
249
In other parts of the vehicle surface difference in heat flux levels for the two air models is somewhat less and it decreases downstream presumably due to gradual recombination of atoms in the boundary layer at flowing along the surface in case of non-equilibrium air
1
10
100
1000
0 5 10
Qw
x m
equilibrium air
nonequilibrium air
0
1000
2000
0 5 10
Tw
x m
equilibrium air
nonequilibrium air
Fig 13 Profiles of heat flux qw kWm2 (left) and equilibrium radiation temperature TwdegC (right) on vehicle surface in symmetry plane 〉 = 63 km
A similar flow and heat flux patterns are observed for the altitude H = 70 km as seen in Fig 14 where contours of heat flux and equilibrium radiation wall temperature are shown at this altitude for the two air models For equilibrium air overall level of heat flux at 70 km is slightly higher than at 63 km For example heat flux value at the nose stagnation point is increased by 5 (675 compared with 640 kWm2) The opposite situation occurs for the model of nonequilibrium air in this case the stagnation point heat flux value at 70 km is lower than at 63 km ndash by 7 (360 and 385 kWm2 respectively)
equilibrium air nonequilibrium air
Fig 14 Distributions of heat flux qw kWm2 (top) and equilibrium radiation temperature TwdegC (bottom) on the vehicle surface 〉 = 70 km
wwwintechopencom
Heat Transfer - Mathematical Modelling Numerical Methods and Information Technology
250
4 Conclusion
A three-dimensional stationary NavierndashStokes computer code for laminar flow developed
by the author has been briefly described The code is mainly intended to calculate super-
and hypersonic flows over bodies accounting for high temperature real gas effects with
special emphasis on convective heat transfer Three gas models perfect gas equilibrium and
nonequilibrium gas mixture can be used in the calculations
In the chapter a comparison of code calculation results with experimental data is made for
two perfect gas hypersonic flow cases at wind tunnel conditions First case is a simulation of
an anomalous heat transfer on the windward side a delta wing with blunt edges On the
whole the calculation correctly predicts the magnitude and position of local maximum of
heat flux near the wing symmetry plane taking into account a small asymmetry in the
experimental data Second case is a computation of heat transfer on a test model of the Pre-X
demonstrator Satisfactory agreement with thermovision heat fluxes on the smooth
windward side and on the flaps is obtained except for the largest deflection angle of flaps
= 15deg when the level of heat flux in the experiment is about one and a half times more than
in the calculation This discrepancy is apparently due to laminar-turbulent transition in
separation region induced by the deflected flaps which takes place in the experiment
Third flow case concerns chemically reacting air flow at equilibrium or nonequilibrium
conditions Flowfield and convective heat transfer parameters for a winged shape of a small-
scale reentry vehicle are calculated for two points of a reentry trajectory in the Earthrsquos
atmosphere Heat flux and equilibrium radiation temperature distributions on the vehicle
surface are obtained Also regions of maximal thermal loadings are localized
Calculations show that for nonequilibrium air flow the use of a low catalytic coating (with
probability of heterogeneous recombination of atoms А = 001) on the vehicle surface
enables to decrease considerably the level of heat fluxes in regions of maximal heat transfer
in the nose part and on the wing edges in comparison with equilibrium air flow For
example for trajectory points with maximal thermal load a reduction of up to 40 in heat
flux (which results in a 15 reduction of equilibrium radiation wall temperature) can be
obtained at the vehicle nose
5 Acknowledgments
The author is grateful to Kovalev RV Marinin VP and Vlasov VI for delivering
thermovision data on test model of Pre-X vehicle and also to Churakov DA and Mihalin
VA for providing computational grids
6 References
Baiocco P Guedron S Plotard P amp Moulin J (2006) The Pre-X atmospheric re-entry
experimental lifting body Program status and system synthesis Proceedings of 57th
International Astronautical Congress 2-6 October 2006 IAC-06-D2P22
Churakov DA Gorshkov AB Kovalev RV Vlasov VI Beloshitsky AV Dyadkin
AA amp Zhurin SV (2008) Heat Transfer of Reentry Vehicles during Atmosphere
Flight Proceedings of 6-th European Symposium on Aerothermodynamics for Space
Vehicles Versailles France 3 - 6 November 2008
wwwintechopencom
Aerodynamic Heating at Hypersonic Speed
251
Dmitriev VG Vaganov AV Gorshkov AB Lapygin VI Galaktionov AYu amp
Mikhalin VA (2007) Analysis of Aerothermodynamic Parameters of Reusable
Space Wing Vehicle Proceedings of 2nd European Conference for Aero-Space Sciences
Brussels Belgium July 1-6 2007
Gorshkov AB (1997) Calculation of Base Heat Transfer Behind Thin Cone-Shaped Bodies
Cosmonautics and Rocket Engineering No 11 (1997) pp 13-20 (in Russian)
Gorshkov AB Kovalev R V Vlasov V I amp Zemlyanskiy B A (2008a) Simulation of
Heat Transfer to Space Vehicles during a Gliding Reentry into Earthrsquos
Atmosphere Proceedings of 14th International Conference on Methods of Aerophysical
Research (ICMAR-2008) Novosibirsk Russia 30 June - 06 July 2008
Gorshkov AB Kovalev R V Vlasov amp V I Zemlyanskiy B A (2008b) Heat Transfer
Investigation for Hypersonic Flow over Experimental Model of Pre-X Reentry
Vehicle Proceedings of 7th Sino-Russian High-Speed Flow Conference (SRHFC-7)
Novosibirsk Russia 1 - 3 July 2008
Grantham WL (1970) Flight results of a 25000 fps re-entry experiment NASA TN D 6062
Gubanova OI Zemlyansky BA Lessin AB Lunev VV Nikulin AN amp Syusin AV
(1992) Anomalous heat transfer on the windward side of a delta wing with a blunt
tip in hypersonic flow In Aerothermodynamics of aerospace systems Pt 1 pp 188-196
Moscow TsAGI (in Russian)
Hoffmann KA Chiang ST (2000) Computational fluid dynamics Vol 2 Engineering
Educational Systems ISBN 0-9623731-3-3 Kansas USA
Inouye Y (1995) OREX flight ndash quick report and lessons learned Proceedings of 2nd
European Symposium on Aerothermodynamics for Space Vehicles pp 271-279 ESTEC
Noordwik The Netherlands Europe Space Agency (November 1994)
Kovalev RV Kislykh VV Kolozezniy AE Kudryavtsev VV Marinin VP Vlasov
VI amp Zemliansky BA (2009) Experimental studies of Pre-X vehicle heat transfer
in PGU-7 test facility 3rd European Conference for Aerospace Sciences (EUCASS-2009)
Versailles France 6-9 July 2009
Lesin AB amp Lunev VV (1994) Heat transfer peaks on a blunt-nosed triangular plate in
hypersonic flow Fluid Dynamics Vol 29 No 2 (April 1994) pp 258-262 ISSN
0015-4628
Mason EA amp Saxena SC (1958) Approximate Formula for the Thermal Conductivity of
Gas Mixtures Phys Fluids Vol 1 No 5 (1958) pp 361-369
Pulliam TH (1986) Artificial dissipation models for the Euler equations AIAA Journal
Vol24 No 12 (December 1986) pp 1931-1940 ISSN 0001-1452
Vaganov AV Dmitriev VG Zadonsky SM Kireev AY Skuratov AS amp Stepanov
EA (2006) Estimations of low-sized winged reentry vehicle heat regimes on the
stage of its designing Physico-chemical kinetics in gas dynamics
wwwchemphysedurupdf2006-11-20-002pdf (in Russian)
Vlasov VI Gorshkov AB Kovalev RV amp Plastinin YuA (1997) Theoretical studies of
air ionization and NO vibrational excitation in low density hypersonic flow around
re-entry bodies AIAA Paper No 97-2582 (1997)
Vlasov V I amp Gorshkov A B (2001) Comparison of the Calculated Results for Hypersonic
Flow Past Blunt Bodies with the OREX Flight Test Data Fluid Dynamics Vol 36
No 5 (October 2001) pp 812-819 ISSN 0015-4628
wwwintechopencom
Heat Transfer - Mathematical Modelling Numerical Methods and Information Technology
252
Vlasov VI Gorshkov AB Kovalev RV amp Lunev VV (2009) Thin triangular blunt-
nosed plate in a viscous hypersonic flow Fluid Dynamics Vol 44 No 4 (August
2009) pp 596-605 ISSN 0015-4628
Wilke C (1950) A Viscosity Equation for Gas Mixtures JChemPhys Vol 18 No 4 (1950)
pp517-519
Yoon S amp Jameson A (1987) An LU-SSOR Scheme for the Euler and Navier-Stokes
Equations AIAA Paper No 87-0600 (1987)
wwwintechopencom
Heat Transfer - Mathematical Modelling Numerical Methods andInformation TechnologyEdited by Prof Aziz Belmiloudi
ISBN 978-953-307-550-1Hard cover 642 pagesPublisher InTechPublished online 14 February 2011Published in print edition February 2011
InTech EuropeUniversity Campus STeP Ri Slavka Krautzeka 83A 51000 Rijeka Croatia Phone +385 (51) 770 447 Fax +385 (51) 686 166
InTech ChinaUnit 405 Office Block Hotel Equatorial Shanghai No65 Yan An Road (West) Shanghai 200040 China
Phone +86-21-62489820 Fax +86-21-62489821
Over the past few decades there has been a prolific increase in research and development in area of heattransfer heat exchangers and their associated technologies This book is a collection of current research inthe above mentioned areas and describes modelling numerical methods simulation and informationtechnology with modern ideas and methods to analyse and enhance heat transfer for single and multiphasesystems The topics considered include various basic concepts of heat transfer the fundamental modes ofheat transfer (namely conduction convection and radiation) thermophysical properties computationalmethodologies control stabilization and optimization problems condensation boiling and freezing with manyreal-world problems and important modern applications The book is divided in four sections InverseStabilization and Optimization Problems Numerical Methods and Calculations Heat Transfer in MiniMicroSystems Energy Transfer and Solid Materials and each section discusses various issues methods andapplications in accordance with the subjects The combination of fundamental approach with many importantpractical applications of current interest will make this book of interest to researchers scientists engineers andgraduate students in many disciplines who make use of mathematical modelling inverse problemsimplementation of recently developed numerical methods in this multidisciplinary field as well as toexperimental and theoretical researchers in the field of heat and mass transfer
How to referenceIn order to correctly reference this scholarly work feel free to copy and paste the following
Andrey B Gorshkov (2011) Aerodynamic Heating at Hypersonic Speed Heat Transfer - MathematicalModelling Numerical Methods and Information Technology Prof Aziz Belmiloudi (Ed) ISBN 978-953-307-550-1 InTech Available from httpwwwintechopencombooksheat-transfer-mathematical-modelling-numerical-methods-and-information-technologyaerodynamic-heating-at-hypersonic-speed
wwwintechopencom
wwwintechopencom
copy 2011 The Author(s) Licensee IntechOpen This chapter is distributedunder the terms of the Creative Commons Attribution-NonCommercial-ShareAlike-30 License which permits use distribution and reproduction fornon-commercial purposes provided the original is properly cited andderivative works building on this content are distributed under the samelicense

Heat Transfer - Mathematical Modelling Numerical Methods and Information Technology
234
(TsNIImash) (Gubanova et al 1992) areas of elevated heat fluxes have been found on the windward side of a delta wing with blunt edges Here results of computations are presented which have been made to numerically reproduce the observed experimental effect The second case is hypersonic flow over a test model of the Pre-X demonstrator (Baiocco et al 2006) designed to glide in the Earths atmosphere A comparison between thermovision experimental data on heat flux obtained in TsNIImash and calculation results is made As the third case a flow of dissociating air at equilibrium and nonequilibrium conditions is considered The characteristics of flow field and convective heat transfer are presented over a winged configuration of a small-scale reentry vehicle (Vaganov et al 2006) which was developed in Russia at some points of a reentry trajectory in the Earths atmosphere
2 Basic equations
For the three-dimensional flows of a chemically reacting nonequilibrium gas mixture in an arbitrary curvilinear coordinate system
x y z t x y z t x y z t tξ ξ η η ζ ζ τ= ( ) = ( ) = ( ) =
the Navier-Stokes equations in conservative form can be written as follows (see eg Hoffmann amp Chiang 2000)
part part part partpartτ partξ partη partζ+ + + =Q E F G
S (1)
( ) ( ) ( )1 1 t x c y c z cx y z ξ η ζ ξ ξ ξ ξminus minus= part part = + + +E Q E F GJ J
( ) ( )1 1t x c y c z c t x c y c z cJ Jη η η η ζ ζ ζ ζminus minus= + + + = + + +F Q E F G G Q E F G
Here J ndash Jacobian of the coordinate transformation and metric derivatives are related by
( ) x t x y zJ y z y z x y zη ζ ζ η τ τ τξ ξ ξ ξ ξ= minus = minus minus minus etc
Q is a vector of the conservative variables Eつ Fつ and Gつ are x y and z components of mass momentum and energy in Cartesian coordinate system S is a source term taking into account chemical processes
2
2
2
( ) ( )( )
xy xzxx
yzyyxyc c c
yzxz zz
x y
i i i x i i y
vu wvu wuu pu
wvv puvv
w vwuw w p
e e p u m e pe p v m
u d v d
ρρ ρρ ρ τ ρ τρ τρ ρ τρ τρ τρρ ρ τρ τ ρ τρ ρ ρ
⎛ ⎞⎛ ⎞⎛ ⎞ ⎜ ⎟⎜ ⎟ minus⎜ ⎟ minus⎜ ⎟+ minus⎜ ⎟⎜ ⎟ ⎜ ⎟⎜ ⎟ minus+ minus⎜ ⎟ minus ⎜ ⎟⎜ ⎟= = = =⎜ ⎟ ⎜ ⎟⎜ ⎟ minusminus + minus⎜ ⎟ ⎜ ⎟⎜ ⎟⎜ ⎟ ⎜ ⎟+ minus ++ minus⎜ ⎟⎜ ⎟ ⎜ ⎟⎜ ⎟ ⎜ ⎟+ ⎜ ⎟⎝ ⎠ +⎝ ⎠ ⎝ ⎠
Q E F G
0
0
0
0
0z
ii i z
w m
w d ωρ
⎛ ⎞ ⎛ ⎞⎜ ⎟ ⎜ ⎟⎜ ⎟ ⎜ ⎟⎜ ⎟ ⎜ ⎟⎜ ⎟ = ⎜ ⎟⎜ ⎟ ⎜ ⎟⎜ ⎟ ⎜ ⎟minus⎜ ⎟ ⎜ ⎟⎜ ⎟⎜ ⎟+ ⎝ ⎠⎝ ⎠
S
x xx xy xz x y xy yy yz y z xz yz zz zm u v w q m u v w q m u v w qτ τ τ τ τ τ τ τ τ= + + minus = + + minus = + + minus
wwwintechopencom
Aerodynamic Heating at Hypersonic Speed
235
where ρ ρi ndash densities of the gas mixture and chemical species i u v and w ndash Cartesian velocity components along the axes x y and z respectively the total energy of the gas mixture per unit volume e is the sum of internal and kinetic energies
2 2 2( ) 2e u v wρε ρ= + + +
The components of the viscous stress tensor are
2 2 2xx yy zz
u v wdiv div div
x y zτ μ λ τ μ λ τ μ λpart part part= + = + = +part part partV V V
xy xz yz
u v u w v w u v wdiv
y x z x z y x y zτ μ τ μ τ μ⎛ ⎞ ⎛ ⎞part part part part part part part part part⎛ ⎞= + = + = + = + +⎜ ⎟ ⎜ ⎟⎜ ⎟part part part part part part part part part⎝ ⎠⎝ ⎠ ⎝ ⎠ V
Inviscid parts of the fluxes E = Einv - Ev F = Finv - Fv и G = Ginv - Gv in a curvilinear coordinate system have the form
1 1 1
( ) ( ) ( )
x x x
y y yinv inv inv
z z z
t t t
i i i
U V W
Uu p Vu p Wu p
Uv p Vv p Wv pJ J J
Uw p Vw p Ww p
e p U p e p V p e p W p
U V W
ρ ρ ρρ ξ ρ η ρ ζρ ξ ρ η ρ ζρ ξ ρ η ρ ζ
ξ η ζρ ρ ρ
minus minus minus
⎛ ⎞ ⎛ ⎞ ⎛ ⎞⎜ ⎟ ⎜ ⎟ ⎜ ⎟+ + +⎜ ⎟ ⎜ ⎟ ⎜ ⎟⎜ ⎟ ⎜ ⎟ ⎜ ⎟+ + +⎜ ⎟ ⎜ ⎟ ⎜ ⎟= = =+ + +⎜ ⎟ ⎜ ⎟ ⎜ ⎟⎜ ⎟ ⎜ ⎟ ⎜ ⎟+ minus + minus + minus⎜ ⎟ ⎜ ⎟ ⎜ ⎟⎜ ⎟ ⎜ ⎟ ⎜ ⎟⎝ ⎠ ⎝ ⎠ ⎝ ⎠
E F G
where U V and W ndash velocity components in the transformed coordinate system
t x y z t x y z t x y zU u v w V u v w W u v wξ ξ ξ ξ η η η η ζ ζ ζ ζ= + + + = + + + = + + +
Fluxes due to processes of molecular transport (viscosity diffusion and thermal conductivity) Ev Fv и Gv in a curvilinear coordinate system
( )1 1
0 0
x xx y xy z xz x xx y xy z xz
x xy y yy z yz x xy y yy z yz
v vx xz y yz z zz x xz y yz z zz
x x y y z z x x y y z z
x i x y i y z i z x i x y i
J J
m m m m m m
d d d d d
ξ τ ξ τ ξ τ η τ η τ η τξ τ ξ τ ξ τ η τ η τ η τξ τ ξ τ ξ τ η τ η τ η τξ ξ ξ η η ηξ ξ ξ η η
minus minus
⎛ ⎞⎜ ⎟+ + + +⎜ ⎟⎜ ⎟+ + + +⎜ ⎟= =⎜ ⎟+ + + +⎜ ⎟+ + + +⎜ ⎟⎜ ⎟⎜ ⎟minus + + minus +⎝ ⎠
E F
( ) y z i zdη
⎛ ⎞⎜ ⎟⎜ ⎟⎜ ⎟⎜ ⎟⎜ ⎟⎜ ⎟⎜ ⎟⎜ ⎟⎜ ⎟+⎝ ⎠
( )1
0
x xx y xy z xz
x xy y yy z yz
vx xz y yz z zz
x x y y z z
x i x y i y z i z
J
m m m
d d d
ζ τ ζ τ ζ τζ τ ζ τ ζ τζ τ ζ τ ζ τζ ζ ζζ ζ ζ
minus
⎛ ⎞⎜ ⎟+ +⎜ ⎟⎜ ⎟+ +⎜ ⎟= ⎜ ⎟+ +⎜ ⎟+ +⎜ ⎟⎜ ⎟⎜ ⎟minus + +⎝ ⎠
G
wwwintechopencom
Heat Transfer - Mathematical Modelling Numerical Methods and Information Technology
236
Partial derivatives with respect to x y and z in the components of the viscous stress tensor
and in flux terms describing diffusion di = (dix diy diz) and thermal conductivity
q = (qx qy qz) are calculated according to the chain rule
21 Chemically reacting nonequilibrium air In the calculation results presented in this chapter air is assumed to consist of five chemical species N2 O2 NO N O Vibrational and rotational temperatures of molecules are equal to the translational temperature Pressure is calculated according to Daltons law for a mixture of ideal gases
ii
gm i
RTRTp p
M M
ρρ= = =sum sum
where 〈gm 〈i ndash molecular weights of the gas mixture and the i-th chemical species The internal energy of the gas mixture per unit mass is
( ) ( )vi fi i i i ei i vmi i i m
c h c C T c T c Tε ε ε= + + +sum sum sum sum
Here ci =ρiρ hfi εei ndash mass concentration formation enthalpy and energy of electronic excitation of species i Cvi ndash heat capacity at constant volume of the translational and rotational degrees of freedom of species i equal to 32(RMi) for atoms and 52(RMi) for diatomic molecules Vibrational energy εvm of the m-th molecular species is calculated in the approximation of the harmonic oscillator The diffusion fluxes of the i-th chemical species are determined according to Ficks law and for example in the direction of the x-axis have the form
i
i x i
cd D
xρ part= minus part
To determine diffusion coefficients Di approximation of constant Schmidt numbers Sci = μρDi is used which are supposed to be equal to 075 for atoms and molecules Total heat flux q is the sum of heat fluxes by thermal conductivity and diffusion of chemical species
( ) ( )x i i x i pi vi ei fii
Tq h d h C T T T h
xκ ε εpart= minus + = + + +part sum
where hi Cちi ndash enthalpy and heat capacity at constant pressure of translational and rotational
degrees of freedom of the i-th chemical species per unit mass Viscosity μ and thermal conductivity κ of nonequilibrium mixture of gases are found by formulas of Wilke (1950) and of Mason amp Saxena (1958) The values of the rate constants of chemical reactions were taken from (Vlasov et al 1997) where they were selected on the basis of various theoretical and experimental data in particular as a result of comparison with flight data on electron density in the shock layer near the experimental vehicle RAM-C (Grantham 1970) Later this model of nonequilibrium air was tested in (Vlasov amp Gorshkov 2001) for conditions of hypersonic flow past the reentry vehicle OREX (Inouye 1995)
wwwintechopencom
Aerodynamic Heating at Hypersonic Speed
237
22 Perfect gas and equilibrium air In the calculations using the models of perfect gas and equilibrium air mass conservation
equations of chemical species in the system (1) are absent For a perfect gas the viscosity is
determined by Sutherlandrsquos formula thermal conductivity is found from the assumption of
the constant Prandtl number Pr = 072 For equilibrium air pressure internal energy
viscosity and thermal conductivity are determined from the thermodynamic relations
( ) ( ) ( ) ( )p p T T T Tρ ε ε ρ μ μ ρ κ κ ρ= = = =
23 Boundary conditions On the body surface a no-slip condition of the flow u = v = w =0 fixed wall temperature
Tw = const or adiabatic wall qw = wTw4 are specified where qw ndash total heat flux to the surface
due to heat conduction and diffusion of chemical species (2) w = 08 ndash emissivity of thermal
protection material - Stefan-Boltzmannrsquos constant
Concentrations of chemical species on the surface are found from equations of mass balance
which for atoms are of the form
2 10
2 2i w
i n i w i i wi w i
RTd K K
M
γρ γ π+ = = minus (3)
where γiw ndash the probability of heterogeneous recombination of the i-th chemical species
In hypersonic flow a shock wave is formed around a body Shock-capturing or shock-fitting approach is used In the latter case the shock wave is seen as a flow boundary with the implementation on it of the Rankine-Hugoniot conditions which result from integration of the Navier-Stokes equations (1) across the shock neglecting the source term S and the derivatives along it Assuming that a coordinate line = const coincides with the shock wave the Rankine-Hugoniot conditions can be represented in the form sinfin =F F or in more details (for a perfect gas)
( ) ( )( ) ( )( ) ( )
2 2
2 2 2 2( ) ( )
2 2 2 2
s ns n
s ns s n
s ns s n
ns s ns
V D V D
V D P V D P
V D V V D V
V D V V D Vh h
τ ττ τ
ρ ρρ ρρ ρ
infin infininfin infin infin
infin infin infininfin infininfin
minus = minusminus + = minus +minus = minus
minus minus+ + = + + (4)
here indices infin and s stand for parameters ahead and behind the shock D ndash shock velocity
V and Vn ndash projection of flow velocity on the directions of the tangent τ and the external
normal n to the shock wave In (4) terms are omitted responsible for the processes of
viscosity and thermal conductivity because in the calculation results presented below the
shock wave fitting is used for flows at high Reynolds numbers
24 Numerical method An implicit finite-difference numerical scheme linearized with respect to the previous time
step n for the Navier-Stokes equations (1) in general form can be written as follows
wwwintechopencom
Heat Transfer - Mathematical Modelling Numerical Methods and Information Technology
238
nξ η ζτ δ δ δ τ⎡ ⎤+ Δ + + minus Δ = minusΔ⎣ ⎦I A B C T Q R (5)
( ) ( ) ( ) ( ) n n n nn ξ η ζδ δ δ part part part part part part part part= + + minus = = = =R E F G S A E Q B F Q C G Q T S Q
Here symbols δξ δ and δ denote finite-difference operators which approximate the partial derivatives partpartξ partpart and partpart the index and indicates that the value is taken at time n I ndash identity matrix ΔQ = Qn +1 - Qn ndash increment vector of the conservative variables at time-step Δ = n+1 ndash n Let us consider first the inviscid flow Yoon amp Jameson (1987) have proposed a method of approximate factorization of the algebraic equations (5) ndash Lower-Upper Symmetric Successive OverRelaxation (LU-SSOR) scheme Suppose that in the transformed coordinates (ξ ζ) the grid is uniform and grid spacing in all directions is unity Δξ=Δ=Δζ=1 Then the LU-SSOR scheme at a point (ijk) of a finite-difference grid can be written as
1 nminus Δ = minusLD U Q R (6)
1 1 1 1 1 1
1 ( )
i j k i j k i j k i j k i j k i j k
β ρ ρ ρτ+ + + minus minus minusminus minus minus + + +
⎧ ⎫= + = + = + + + minus⎨ ⎬Δ⎩ ⎭= minus minus minus = + +
A B CL D L U D U D I T
L A B C U A B C
where
2 2 2
2 2 2
2 2 2
( ) 2
( ) 2
( ) 2
x y z
x y z
x y z
U
V
W
βρ ρ ξ ξ ξβρ ρ η η ηβρ ρ ζ ζ ζ
plusmnplusmnplusmn
= plusmn = + + += plusmn = + + += plusmn = + + +
A A
B B
C C
A A I
B B I
C C I
a
a
a
Here the indices of the quantities at the point (ijk) are omitted for brevity βge1 is a constant ρA ρB ρC ndash the spectral radii of the ldquoinviscidrdquo parts of the Jacobians A B и C а ndash the speed of sound Inversion of the equation system (6) is made in two steps
L Q R nΔ = minus (7a)
U Q D QΔ = Δ (7b)
It is seen from (6) that for non chemically reacting flows (S=0 T=0) LU-SSOR scheme does not require inversion of any matrices For reacting flows due to the presence of the Jacobian of the chemical source Tne0 the forward and back steps in (7) require generally speaking matrix inversion However calculations have shown that if the conditions are not too close to equilibrium then in the chemical Jacobian Т one can retain only diagonal terms which contain solely the partial derivatives with respect to concentrations of chemical species In this approximation scheme (6) leads to the scalar diagonal inversion also for the case of chemically reacting flows Thus calculation time grows directly proportionally to the number of chemical species concentrations This is important in calculations of complex flows of reacting gas mixtures when the number of considered chemical species is large In the case of viscous flow so as not to disrupt the diagonal structure of scheme (6) instead of the ldquoviscousrdquo Jacobians Av Bv и Cv their spectral radii are used
wwwintechopencom
Aerodynamic Heating at Hypersonic Speed
239
( ) ( ) ( )2 2 2 2 2 2 2 2 2 Pr Pr Pr
v x y z v x y z v x y z
γ μ γ μ γ μρ ξ ξ ξ ρ η η η ρ ζ ζ ζρ ρ ρ= + + = + + = + +CA B
In the finite-difference equation (6) central differences are employed both for viscous and convective fluxes The use of central differences to approximate the convective terms can cause non-physical oscillations of the flow parameters at high Reynolds numbers To suppress such numerical oscillations artificial dissipation terms were added in the right part R of (6) according to Pulliam (1986) In calculations presented below it was assumed that the derivatives partξpartt partpartt and partpartt are zero and Δ = infin Since steady flow is considered these assumptions do not affect the final result
3 Calculation results
31 Flow and heat transfer on blunt delta wing In thermovision experiments (Gubanova et al 1992) in hypersonic flow past a delta wing with blunt nose and edges two regions of elevated heat were observed on its windward surface At a distance of approximately 12-15 r from the nose of the wing (r ndash nose radius) there were narrow bands of high heat fluxes which extended almost parallel to the symmetry plane at a small interval (3-5 r) from it to the final section of the wing at х asymp 100 r (see Fig 1 in which the calculated distribution of heat fluxes is shown at the experimental conditions) The level of heat fluxes in the bands was approximately twice the value of background heat transfer corresponding to the level for a delta plate with sharp edges under the same conditions It turned out that this effect exists in a fairly narrow range of flow parameters In particular on the same wing but with a sharp tip a similar increase in heat flux was not observed This effect was explained by the interaction of shock waves arising at the tip and on the blunt edges of the wing (Gubanova et al 1992 Lesin amp Lunev 1994) In this section numerical results calculated for the experimental conditions are presented and compared with measured heat flux values (see also (Vlasov et al 2009))
Fig 1 Calculated distribution of non-dimensional heat flux Q = qq0 on the windward side of the blunt delta wing q0 ndash heat flux at the stagnation point of a sphere with a radius equal to the nose radius of the wing
Perfect gas hypersonic flow ( = 14) past a delta wing with a spherical nose and cylindrical edges of the same radius is considered Mach and Reynolds numbers calculated with free stream flow parameters and the wing nose radius are Minfin = 14 and Reinfin = 14middot104 angle of attack α = 10deg wing sweep angle λ = 75deg The free stream stagnation temperature T0infin = 1205 K the wall temperature Tw = 300 K Due to the symmetry of flow only half of the wing is computed The flow calculation was performed with shock-fitting procedure the computational grid is 120times40times119 (in the longitudinal transverse and circumferential
wwwintechopencom
Heat Transfer - Mathematical Modelling Numerical Methods and Information Technology
240
directions respectively see Fig 2) Below in this section all quantities with a dimension of length unless otherwise specified are normalized to the wing nose radius r
Fig 2 The computational grid on the wing surface in the plane of symmetry (z = 0) and in the exit section for the converged numerical solution
Fig 3 Streamlines near the windward surface of the wing Top ndash at a distance of one grid step from the wall bottom ndash at the outer edge of the boundary layer
Calculated patterns of streamlines near the windward surface of the wing at a distance of one grid step from the wall and at the outer edge of the boundary layer are shown in Fig 3 The streamlines flowing down from the wing edge on the windward plane at almost constant pressure form the line of diverging flow (line A-A) along which there are bands of elevated heat fluxes At the symmetry plane a line of converging streamlines is realized along the entire length of the wing but upstream the shock interaction point A flow impinges on the symmetry plane from the edges and downstream from A ndash from the diverging line A-A A characteristic feature of the considered case is that the distribution of heat fluxes on the windward side is mainly determined by the values of convergence and divergence of streamlines at almost constant pressure (see Fig 4 which shows the distribution of pressure and heat flux on the windward side in several sections x = const) Local maxima of heat fluxes near symmetry plane appear only at xgt 15 near the line z = 4 (after the nose shock wave intersects with the shock wave from the edges) and the relative intensity of these heat peaks grows with increasing distance from the nose (Fig 4b)
wwwintechopencom
Aerodynamic Heating at Hypersonic Speed
241
003
008
0 05 1
P
1
2 34
5
z
0
005
01
015
0 5 10
Q
z
12
34
(a) (b)
Fig 4 Pressure distribution Р = pρinfinVinfin2 (a) and heat flux Q = qq0 (b) on windward side of wing in sections 1-5 ndash x = 10 20 30 50 90 z= zzmax zmax ndash wingspan in section х = const
Comparison of the upper and lower parts of Fig 3 shows that the flow near the wall and at the outer edge of the boundary layer are noticeably different the streamlines near the wall are directed to the symmetry plane (converging) and in inviscid region ndash from it (diverging) It follows that the velocity component directed along the wing chord changes sign across the boundary layer which indicates the existence of transverse vortex (cross separation flow) in the boundary layer This is illustrated in Fig 5a which shows the projection of streamlines on the plane of the cross section at x = 90
400
1200
1200
700
1000T
0
(a) (b)
Fig 5 Projection of streamlines (a) and isolines of stagnation temperature T0 K (b) in cross section x = 90
The distribution of the boundary layer thickness is clearly seen in Fig 5b which shows the contours of the stagnation temperature T0 in the cross section x = 90 On the windward side of the wing minimum thickness of the boundary layer is located on the diverging line (line A-A in Fig 3) On the left and on the right sides of the diverging line there are converging lines with a thicker boundary layer (about 2 and 3 times respectively) One of the
wwwintechopencom
Heat Transfer - Mathematical Modelling Numerical Methods and Information Technology
242
converging lines is the symmetry plane Here the boundary layer thickness on the windward side reaches a maximum amounting to about one-third of the shock layer thickness Near the wing edge because of the expansion and acceleration of the flow the boundary layer thickness decreases sharply (at the edge it is almost 20 times less than at the symmetry plane on the windward side) On the leeward side of the wing flow separation occurs and the concept of the boundary layer loses its meaning Here scope of viscous flow is half the shock layer The shape of calculated shock wave in Fig 6a induced by the wing nose as a blunt body is determined by the law of the explosive analogy so that some front part of the wing
x le xA asymp 15 will be located inside the initially axisymmetric shock wave The coordinate of point A (xA) is located in the vicinity of interaction region of shock waves induced by the nose and the edges of the wing Here the profiles of pressure and heat flux along the edge are local maxima
0
10
000
005
0 15 30
zP
Q2
x
shock wing edge
P
Q
xA
0
005
-1 -05 0 05 1
Q
z
calculation
experiment
(a) (b)
Fig 6 Profiles of pressure heat flux and the shock wave along the wing edge (a) and distribution of heat fluxes in cross section x = 90 (b)
In Fig 6b the distribution of computed heat fluxes qq0 in the neighborhood of the wing end section at x = 90 is presented in comparison with the experiment of Gubanova et al (1992) depending on the transverse coordinate z On the whole the calculation correctly predicts the magnitude and position of local maximum of heat flux near the symmetry plane taking into account the small asymmetry in the experimental data Note that near the minima of heat fluxes calculated values are lower than experimental ones probably due to effect of smoothing of experimental data in these narrow regions
32 Heat transfer on test model of Pre-X space vehicle Currently developed hypersonic aircraft have dimensions several times smaller than previously created space vehicles Shuttle and Buran This results in increase of heat load on a vehicle during flight and therefore the problem of reliable calculation of heat fluxes on the surface for such relatively small bodies is particularly important Thus the problem arises of verification of the employed physical models and numerical methods by comparing calculation results with experimental data
wwwintechopencom
Aerodynamic Heating at Hypersonic Speed
243
In 2006-2007 on TsNIImashrsquos experimental base in a piston gasdynamic wind tunnel PGU-7 a heat transfer study has been conducted on a small-scale model of Pre-X reentry demonstrator (Baiocco 2006) This vehicle is designed to obtain in flight conditions experimental data pertaining to aerothermodynamic phenomena that are not modeled in ground tests but they are critical for design of a vehicle returning from the Earthrsquos orbit In particular Pre-X demonstrator is developed to test in a real flight and in specified locations on the vehicle surface samples of reusable thermal protection materials and to assess their durability During the study thermovision measurements have been conducted of heat fluxes on the model of scale 115 at various flow regimes ndash M = 10 Re = 1106-5106 1m (Kovalev et al 2009) Processing of thermovision measurements was carried out in accordance with standard technique and composed of determination of the model surface temperature during experiment extraction from these data distributions of heat fluxes on the observed model surface and binding of the resulting thermovision frame to a three-dimensional CAD model of the demonstrator The same CAD model has been used for numerical simulation of heat transfer on the Pre-X test model As a normalizing value the heat flux q0 at the stagnation point of a sphere with radius of 70 mm is adopted which is determined using the Fay-Riddell formula Advantage of data presentation in this form is due to invariability of the relative values Q = qq0 on most model surface at variations of flow parameters
Fig 7 Calculated distributions of pressure Р = ちρinfinVinfin2 (left) and stagnation temperature T0 K (right) on surface and in shock layer (in symmetry plane and in exit section) for test model of Pre-X vehicle
On the base of the numerical solution of the Navier-Stokes equations a study was carried out of flow parameters and heat transfer for laminar flow over a test model of Pre-X space
wwwintechopencom
Heat Transfer - Mathematical Modelling Numerical Methods and Information Technology
244
vehicle for experimental conditions in the piston gasdynamic wind tunnel Mach and Reynolds numbers calculated from the free-stream parameters and the length of the model (330 mm) are Minfin = 10 and Reinfin = 7middot105 Angle of attack ndash 45deg The flap deflection angle was (as in the experiment) = 5 10 and 15deg The stagnation temperature of the free-stream flow and the wing surface temperature ndash T0infin = 1000 K and Tw = 300 K respectively An approximation of a perfect gas was used with ratio of specific heats = 14 The calculations were performed with a shock-fitting procedure ie the bow shock was considered as a discontinuity with implementation of the Rankine-Hugoniot relations (4) across it On the model surface no-slip and fixed temperature conditions were set Note that in view of the flow symmetry computations were made only for a half of the model although in the figures below for comparison with experiment the calculated data (upon reflection in the symmetry plane) are presented on the entire model The overall flow pattern obtained in the calculations over the test model of Pre-X space vehicle is shown in Fig 7 where for the case of the flap deflection angle = 15deg pressure and stagnation temperature Т0 isolines in the shock layer and on the model surface are shown It is seen that there are two areas of high pressure on the nose tip of the model (P asymp 092) and on the deflection flaps In the latter case the pressure in the flow passing through the two shock waves reaches P asymp 13 Isolines of Т0 show the size of regions where viscous forces are significant a thin boundary layer on the windward side of the model and an extensive separation zone on the leeward side The small separation zone appearing at deflection flaps although about four times thicker than the boundary layer upstream of it is almost not visible in the scale of the figure Fig 8 shows the distributions of relative heat flow Q on the windward side of the model obtained in the experiments and in the calculations at deflection angles of flaps = 5 10 and 15deg For the case = 5deg it can be noted rather good agreement between experiment and calculation in the values of heat flux in the central part of the model and on the flaps It is evident that before deflected flaps there is a region of low heat fluxes caused by near separation state (according to calculation results) of the boundary layer In analyzing the experimental data it should be taken into account the effect of apparent temperature reduction of the surface area with a large angle to the thermovision observation line It is precisely this effect that explains the fact that in the nose part of the model the experimental values of heat flux are less than the calculated ones Also narrow zones of high (at the sharp edges of the flaps) or low (in the separation zone at the root of the flaps) values of heat flux are smoothed or not visible in the experiment due to insufficient resolution of thermovision equipment The resolution capability of thermovisor is clearly visible by the size of cells in the experimental isoline pattern of heat flux in Fig 8 It should be noted that the calculations do not take into account a slit between the deflection flaps available on the test model the presence of which should lead to a decrease in the separation region in front of the flaps At an angle of flap deflection = 10deg as in the previous case = 5deg there is fairly good agreement between calculation and experiment for the values of heat flux in the central part of the model and on the flaps The calculations show that the growth of the flap deflection angle from 5deg to 10deg results in the formation of a large separation zone in front of the flaps and in a decrease in heat flux value Q from 02 to 01 At the largest angle of flap deflection = 15deg the maximum of calculated heat flux occurs in the zone of impingement of the separated boundary layer where the level of Q is 2-3 times higher than its level on the undeflected flap The coincidence of calculation results with
wwwintechopencom
Aerodynamic Heating at Hypersonic Speed
245
experimental data in the front part of the model up to the separation zone before the flaps is satisfactory On the flaps the level of heat flux in the experiment is about one and a half times more than in the calculation This difference in heat flux values is apparently due to laminar-turbulent transition in separation region induced by the deflected flaps which takes place in the experiment
δ = 5deg
δ = 10deg
δ = 15deg
Fig 8 Experimental (left) and calculated (right) heat fluxes Q = qq0 on windward side of test model of Pre-X space vehicle at different deflection angles of flaps
wwwintechopencom
Heat Transfer - Mathematical Modelling Numerical Methods and Information Technology
246
33 Flow and heat transfer on a winged space vehicle at reentry to Earths atmosphere This section presents the results of numerical simulation of flow and heat transfer on a
winged version of the small-scale reentry vehicle being developed in TsAGI (Vaganov et al
2006) moving at hypersonic speed in the Earths atmosphere Calculations were made using
two physical-chemical models of the gas medium - equilibrium and non-equilibrium
chemically reacting air
The bow shock was captured in contrast to the previous two flow cases Thus on the inflow
boundary the free-stream conditions were specified On the vehicle surface no-slip and
adiabatic wall conditions were supposed In calculations with use of the nonequilibrium air
model the vehicle surface was supposed to be low catalytical with the probability of
heterogeneous recombination of O and N atoms equal to А = 001
A computational grid was provided by Mikhalin VA (Dmitriev et al 2007) and was taken
from the inviscid flow calculation The number of points in the direction normal to the
vehicle surface has been increased to resolve the wall boundary layer Part of the results
presented below was reported in (Dmitriev et al 2007 Gorshkov et al 2008a)
Calculations were performed for two points of a reentry trajectory for which thermal loads
are close to maximum (Table 1) The angle of attack α = 35deg the vehicle length L = 9m A
grid 93times50times101 in the longitudinal transverse and circumferential directions respectively
were used in the calculations The surface grid of the vehicle is shown in Fig 9
Н
km
Vinfin
msec ReinfinL Minfin Рinfin atm Тinfin K
70 5952 346middot105 200 576middot10-5 219
63 5152 684middot105 166 159middot10-4 243
Table 1 Parameters of trajectory points
Fig 9 Surface grid of the small-scale reentry vehicle
In Fig 10a contours of total enthalpy H0 on the surface and in the shock layer near the reentry vehicle are shown On the windward side one can see the shock wave the thin wall boundary layer and the inviscid flow between them in which the values of H0 are constant In the calculations the shock wave is smeared upon 3-5 grid points and has a finite thickness due to the use of artificial dissipation In particular a local decrease in H0 in a strong shock
wwwintechopencom
Aerodynamic Heating at Hypersonic Speed
247
wave on the windward side which can be seen in the figure has no physical meaning and is due to the influence of artificial dissipation Recall that the Navier-Stokes equations do not correctly describe the shock structure at Mach numbers Mgt 15 In the shock layer on the leeward side it is visible a large area with reduced values of total enthalpy Н0ltН0infin (Н0infin ndash total enthalpy in the free-stream) which arises as a result of boundary layer separation from the vehicle surface Chemical processes occurring in the shock layer over the vehicle are illustrated in Fig 10b which shows contours of mass concentrations of oxygen atoms つо Under the considered conditions in the vicinity of the vehicle nose behind the shock wave O2 dissociation is complete On the windward side downstream the nose in the shock layer and on the surface the recombination occurs and the concentration of O decreases In contrast on the leeward side where the flow is very rarefied the level of つо remains high indicating that the process of recombination of atomic oxygen is frozen
boundary layer
shock wave
(a) (b)
Fig 10 Total enthalpy MJkg (a) and mass concentration of oxygen atoms (b) on the surface and in the shock layer near the vehicle 〉 = 63 km
0001
001
01
1
0 5 10
P
x m
equilibrium air
nonequilibrium air
equilibrium air
Fig 11 Pressure distribution P = ちρinfinVinfin2 on vehicle surface overall view (left) and in symmetry plane (right) 〉 = 63 km
wwwintechopencom
Heat Transfer - Mathematical Modelling Numerical Methods and Information Technology
248
In Fig 11 and 12 isolines of pressure heat flux qw and equilibrium radiation temperature Tw
on the vehicle surface are shown for cases of equilibrium and non-equilibrium dissociating
air Comparison of qw and Tw distributions on the vehicle surface in the symmetry plane for
two air models are depicted in Fig 13
Analysis of the calculation results shows that pressure distribution on the windward surface
of the vehicle does not depend on physical-chemical model of the gas medium - the
difference in pressure values for equilibrium and non-equilibrium air flow is 1 - 2 On the
leeward side pressure on the surface for nonequilibrium flow may be nearly two times
lower than for equilibrium flow (eg in the vicinity of the tail) This is probably due to the
fact that the effective ratio of specific heats for nonequilibrium air is greater than for
equilibrium air because in the shock layer on the leeward side nonequilibrium flow is
chemically frozen and here there is a sufficiently high concentration of atoms (see Fig 10b)
equilibrium air nonequilibrium air
Fig 12 Distributions of heat flux qw kWm2 (top) and equilibrium radiation temperature TwdegC (bottom) on the vehicle surface 〉 = 63 km
Nonequilibrium chemical processes in the shock layer and finite catalytic activity of the
vehicle surface (А = 001) significantly reduce the calculated levels of heat transfer in
comparison with the case of equilibrium air flow The most significant decrease in heat flux
is observed on the vehicle nose part (for x le 1 m) and in the vicinity of the tail For example
at the nose stagnation point the level of heat flux decreases by about 40 ndash from 640 to 385
kWm2 while the surface temperature decreases by nearly 15 ndash from 1670 to 1430 degC
Note a high heat flux level on the thin edge of the wing compared with one at the nose
stagnation point Particularly intense heating occurs at the sharp bend of the wing where the
values of heat flux and surface temperature even slightly exceed their values at the front
stagnation point In the case of equilibrium air flow the exceeding for heat flux is about 10
(710 and 640 kWm2) for temperature - 3 (1720 and 1670 degC) In the case of
nonequilibrium air flow the exceeding is more significant for heat flux - 30 (540 and 385
kWm2) for temperature - 10 (1570 and 1430 deg C)
wwwintechopencom
Aerodynamic Heating at Hypersonic Speed
249
In other parts of the vehicle surface difference in heat flux levels for the two air models is somewhat less and it decreases downstream presumably due to gradual recombination of atoms in the boundary layer at flowing along the surface in case of non-equilibrium air
1
10
100
1000
0 5 10
Qw
x m
equilibrium air
nonequilibrium air
0
1000
2000
0 5 10
Tw
x m
equilibrium air
nonequilibrium air
Fig 13 Profiles of heat flux qw kWm2 (left) and equilibrium radiation temperature TwdegC (right) on vehicle surface in symmetry plane 〉 = 63 km
A similar flow and heat flux patterns are observed for the altitude H = 70 km as seen in Fig 14 where contours of heat flux and equilibrium radiation wall temperature are shown at this altitude for the two air models For equilibrium air overall level of heat flux at 70 km is slightly higher than at 63 km For example heat flux value at the nose stagnation point is increased by 5 (675 compared with 640 kWm2) The opposite situation occurs for the model of nonequilibrium air in this case the stagnation point heat flux value at 70 km is lower than at 63 km ndash by 7 (360 and 385 kWm2 respectively)
equilibrium air nonequilibrium air
Fig 14 Distributions of heat flux qw kWm2 (top) and equilibrium radiation temperature TwdegC (bottom) on the vehicle surface 〉 = 70 km
wwwintechopencom
Heat Transfer - Mathematical Modelling Numerical Methods and Information Technology
250
4 Conclusion
A three-dimensional stationary NavierndashStokes computer code for laminar flow developed
by the author has been briefly described The code is mainly intended to calculate super-
and hypersonic flows over bodies accounting for high temperature real gas effects with
special emphasis on convective heat transfer Three gas models perfect gas equilibrium and
nonequilibrium gas mixture can be used in the calculations
In the chapter a comparison of code calculation results with experimental data is made for
two perfect gas hypersonic flow cases at wind tunnel conditions First case is a simulation of
an anomalous heat transfer on the windward side a delta wing with blunt edges On the
whole the calculation correctly predicts the magnitude and position of local maximum of
heat flux near the wing symmetry plane taking into account a small asymmetry in the
experimental data Second case is a computation of heat transfer on a test model of the Pre-X
demonstrator Satisfactory agreement with thermovision heat fluxes on the smooth
windward side and on the flaps is obtained except for the largest deflection angle of flaps
= 15deg when the level of heat flux in the experiment is about one and a half times more than
in the calculation This discrepancy is apparently due to laminar-turbulent transition in
separation region induced by the deflected flaps which takes place in the experiment
Third flow case concerns chemically reacting air flow at equilibrium or nonequilibrium
conditions Flowfield and convective heat transfer parameters for a winged shape of a small-
scale reentry vehicle are calculated for two points of a reentry trajectory in the Earthrsquos
atmosphere Heat flux and equilibrium radiation temperature distributions on the vehicle
surface are obtained Also regions of maximal thermal loadings are localized
Calculations show that for nonequilibrium air flow the use of a low catalytic coating (with
probability of heterogeneous recombination of atoms А = 001) on the vehicle surface
enables to decrease considerably the level of heat fluxes in regions of maximal heat transfer
in the nose part and on the wing edges in comparison with equilibrium air flow For
example for trajectory points with maximal thermal load a reduction of up to 40 in heat
flux (which results in a 15 reduction of equilibrium radiation wall temperature) can be
obtained at the vehicle nose
5 Acknowledgments
The author is grateful to Kovalev RV Marinin VP and Vlasov VI for delivering
thermovision data on test model of Pre-X vehicle and also to Churakov DA and Mihalin
VA for providing computational grids
6 References
Baiocco P Guedron S Plotard P amp Moulin J (2006) The Pre-X atmospheric re-entry
experimental lifting body Program status and system synthesis Proceedings of 57th
International Astronautical Congress 2-6 October 2006 IAC-06-D2P22
Churakov DA Gorshkov AB Kovalev RV Vlasov VI Beloshitsky AV Dyadkin
AA amp Zhurin SV (2008) Heat Transfer of Reentry Vehicles during Atmosphere
Flight Proceedings of 6-th European Symposium on Aerothermodynamics for Space
Vehicles Versailles France 3 - 6 November 2008
wwwintechopencom
Aerodynamic Heating at Hypersonic Speed
251
Dmitriev VG Vaganov AV Gorshkov AB Lapygin VI Galaktionov AYu amp
Mikhalin VA (2007) Analysis of Aerothermodynamic Parameters of Reusable
Space Wing Vehicle Proceedings of 2nd European Conference for Aero-Space Sciences
Brussels Belgium July 1-6 2007
Gorshkov AB (1997) Calculation of Base Heat Transfer Behind Thin Cone-Shaped Bodies
Cosmonautics and Rocket Engineering No 11 (1997) pp 13-20 (in Russian)
Gorshkov AB Kovalev R V Vlasov V I amp Zemlyanskiy B A (2008a) Simulation of
Heat Transfer to Space Vehicles during a Gliding Reentry into Earthrsquos
Atmosphere Proceedings of 14th International Conference on Methods of Aerophysical
Research (ICMAR-2008) Novosibirsk Russia 30 June - 06 July 2008
Gorshkov AB Kovalev R V Vlasov amp V I Zemlyanskiy B A (2008b) Heat Transfer
Investigation for Hypersonic Flow over Experimental Model of Pre-X Reentry
Vehicle Proceedings of 7th Sino-Russian High-Speed Flow Conference (SRHFC-7)
Novosibirsk Russia 1 - 3 July 2008
Grantham WL (1970) Flight results of a 25000 fps re-entry experiment NASA TN D 6062
Gubanova OI Zemlyansky BA Lessin AB Lunev VV Nikulin AN amp Syusin AV
(1992) Anomalous heat transfer on the windward side of a delta wing with a blunt
tip in hypersonic flow In Aerothermodynamics of aerospace systems Pt 1 pp 188-196
Moscow TsAGI (in Russian)
Hoffmann KA Chiang ST (2000) Computational fluid dynamics Vol 2 Engineering
Educational Systems ISBN 0-9623731-3-3 Kansas USA
Inouye Y (1995) OREX flight ndash quick report and lessons learned Proceedings of 2nd
European Symposium on Aerothermodynamics for Space Vehicles pp 271-279 ESTEC
Noordwik The Netherlands Europe Space Agency (November 1994)
Kovalev RV Kislykh VV Kolozezniy AE Kudryavtsev VV Marinin VP Vlasov
VI amp Zemliansky BA (2009) Experimental studies of Pre-X vehicle heat transfer
in PGU-7 test facility 3rd European Conference for Aerospace Sciences (EUCASS-2009)
Versailles France 6-9 July 2009
Lesin AB amp Lunev VV (1994) Heat transfer peaks on a blunt-nosed triangular plate in
hypersonic flow Fluid Dynamics Vol 29 No 2 (April 1994) pp 258-262 ISSN
0015-4628
Mason EA amp Saxena SC (1958) Approximate Formula for the Thermal Conductivity of
Gas Mixtures Phys Fluids Vol 1 No 5 (1958) pp 361-369
Pulliam TH (1986) Artificial dissipation models for the Euler equations AIAA Journal
Vol24 No 12 (December 1986) pp 1931-1940 ISSN 0001-1452
Vaganov AV Dmitriev VG Zadonsky SM Kireev AY Skuratov AS amp Stepanov
EA (2006) Estimations of low-sized winged reentry vehicle heat regimes on the
stage of its designing Physico-chemical kinetics in gas dynamics
wwwchemphysedurupdf2006-11-20-002pdf (in Russian)
Vlasov VI Gorshkov AB Kovalev RV amp Plastinin YuA (1997) Theoretical studies of
air ionization and NO vibrational excitation in low density hypersonic flow around
re-entry bodies AIAA Paper No 97-2582 (1997)
Vlasov V I amp Gorshkov A B (2001) Comparison of the Calculated Results for Hypersonic
Flow Past Blunt Bodies with the OREX Flight Test Data Fluid Dynamics Vol 36
No 5 (October 2001) pp 812-819 ISSN 0015-4628
wwwintechopencom
Heat Transfer - Mathematical Modelling Numerical Methods and Information Technology
252
Vlasov VI Gorshkov AB Kovalev RV amp Lunev VV (2009) Thin triangular blunt-
nosed plate in a viscous hypersonic flow Fluid Dynamics Vol 44 No 4 (August
2009) pp 596-605 ISSN 0015-4628
Wilke C (1950) A Viscosity Equation for Gas Mixtures JChemPhys Vol 18 No 4 (1950)
pp517-519
Yoon S amp Jameson A (1987) An LU-SSOR Scheme for the Euler and Navier-Stokes
Equations AIAA Paper No 87-0600 (1987)
wwwintechopencom
Heat Transfer - Mathematical Modelling Numerical Methods andInformation TechnologyEdited by Prof Aziz Belmiloudi
ISBN 978-953-307-550-1Hard cover 642 pagesPublisher InTechPublished online 14 February 2011Published in print edition February 2011
InTech EuropeUniversity Campus STeP Ri Slavka Krautzeka 83A 51000 Rijeka Croatia Phone +385 (51) 770 447 Fax +385 (51) 686 166
InTech ChinaUnit 405 Office Block Hotel Equatorial Shanghai No65 Yan An Road (West) Shanghai 200040 China
Phone +86-21-62489820 Fax +86-21-62489821
Over the past few decades there has been a prolific increase in research and development in area of heattransfer heat exchangers and their associated technologies This book is a collection of current research inthe above mentioned areas and describes modelling numerical methods simulation and informationtechnology with modern ideas and methods to analyse and enhance heat transfer for single and multiphasesystems The topics considered include various basic concepts of heat transfer the fundamental modes ofheat transfer (namely conduction convection and radiation) thermophysical properties computationalmethodologies control stabilization and optimization problems condensation boiling and freezing with manyreal-world problems and important modern applications The book is divided in four sections InverseStabilization and Optimization Problems Numerical Methods and Calculations Heat Transfer in MiniMicroSystems Energy Transfer and Solid Materials and each section discusses various issues methods andapplications in accordance with the subjects The combination of fundamental approach with many importantpractical applications of current interest will make this book of interest to researchers scientists engineers andgraduate students in many disciplines who make use of mathematical modelling inverse problemsimplementation of recently developed numerical methods in this multidisciplinary field as well as toexperimental and theoretical researchers in the field of heat and mass transfer
How to referenceIn order to correctly reference this scholarly work feel free to copy and paste the following
Andrey B Gorshkov (2011) Aerodynamic Heating at Hypersonic Speed Heat Transfer - MathematicalModelling Numerical Methods and Information Technology Prof Aziz Belmiloudi (Ed) ISBN 978-953-307-550-1 InTech Available from httpwwwintechopencombooksheat-transfer-mathematical-modelling-numerical-methods-and-information-technologyaerodynamic-heating-at-hypersonic-speed
wwwintechopencom
wwwintechopencom
copy 2011 The Author(s) Licensee IntechOpen This chapter is distributedunder the terms of the Creative Commons Attribution-NonCommercial-ShareAlike-30 License which permits use distribution and reproduction fornon-commercial purposes provided the original is properly cited andderivative works building on this content are distributed under the samelicense
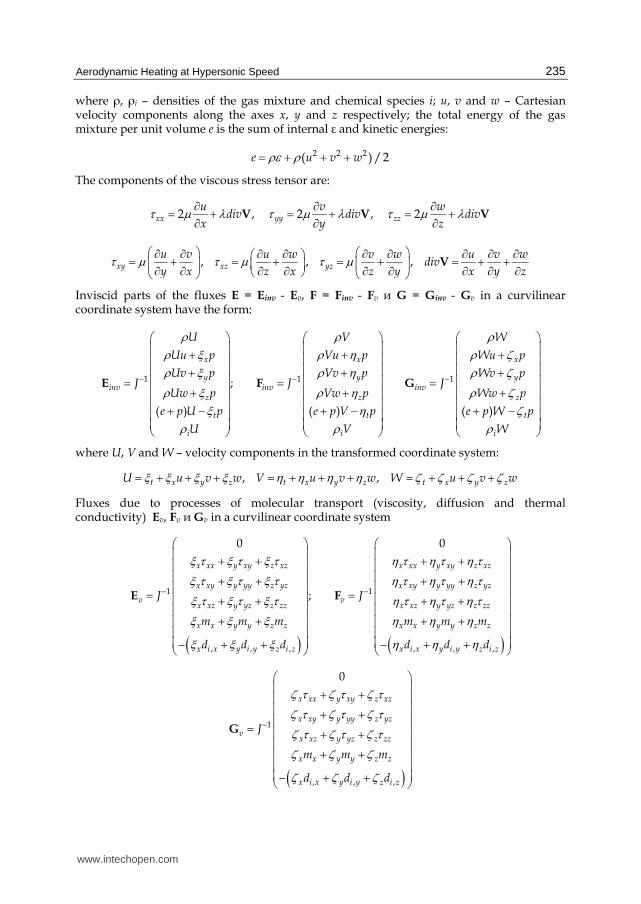
Aerodynamic Heating at Hypersonic Speed
235
where ρ ρi ndash densities of the gas mixture and chemical species i u v and w ndash Cartesian velocity components along the axes x y and z respectively the total energy of the gas mixture per unit volume e is the sum of internal and kinetic energies
2 2 2( ) 2e u v wρε ρ= + + +
The components of the viscous stress tensor are
2 2 2xx yy zz
u v wdiv div div
x y zτ μ λ τ μ λ τ μ λpart part part= + = + = +part part partV V V
xy xz yz
u v u w v w u v wdiv
y x z x z y x y zτ μ τ μ τ μ⎛ ⎞ ⎛ ⎞part part part part part part part part part⎛ ⎞= + = + = + = + +⎜ ⎟ ⎜ ⎟⎜ ⎟part part part part part part part part part⎝ ⎠⎝ ⎠ ⎝ ⎠ V
Inviscid parts of the fluxes E = Einv - Ev F = Finv - Fv и G = Ginv - Gv in a curvilinear coordinate system have the form
1 1 1
( ) ( ) ( )
x x x
y y yinv inv inv
z z z
t t t
i i i
U V W
Uu p Vu p Wu p
Uv p Vv p Wv pJ J J
Uw p Vw p Ww p
e p U p e p V p e p W p
U V W
ρ ρ ρρ ξ ρ η ρ ζρ ξ ρ η ρ ζρ ξ ρ η ρ ζ
ξ η ζρ ρ ρ
minus minus minus
⎛ ⎞ ⎛ ⎞ ⎛ ⎞⎜ ⎟ ⎜ ⎟ ⎜ ⎟+ + +⎜ ⎟ ⎜ ⎟ ⎜ ⎟⎜ ⎟ ⎜ ⎟ ⎜ ⎟+ + +⎜ ⎟ ⎜ ⎟ ⎜ ⎟= = =+ + +⎜ ⎟ ⎜ ⎟ ⎜ ⎟⎜ ⎟ ⎜ ⎟ ⎜ ⎟+ minus + minus + minus⎜ ⎟ ⎜ ⎟ ⎜ ⎟⎜ ⎟ ⎜ ⎟ ⎜ ⎟⎝ ⎠ ⎝ ⎠ ⎝ ⎠
E F G
where U V and W ndash velocity components in the transformed coordinate system
t x y z t x y z t x y zU u v w V u v w W u v wξ ξ ξ ξ η η η η ζ ζ ζ ζ= + + + = + + + = + + +
Fluxes due to processes of molecular transport (viscosity diffusion and thermal conductivity) Ev Fv и Gv in a curvilinear coordinate system
( )1 1
0 0
x xx y xy z xz x xx y xy z xz
x xy y yy z yz x xy y yy z yz
v vx xz y yz z zz x xz y yz z zz
x x y y z z x x y y z z
x i x y i y z i z x i x y i
J J
m m m m m m
d d d d d
ξ τ ξ τ ξ τ η τ η τ η τξ τ ξ τ ξ τ η τ η τ η τξ τ ξ τ ξ τ η τ η τ η τξ ξ ξ η η ηξ ξ ξ η η
minus minus
⎛ ⎞⎜ ⎟+ + + +⎜ ⎟⎜ ⎟+ + + +⎜ ⎟= =⎜ ⎟+ + + +⎜ ⎟+ + + +⎜ ⎟⎜ ⎟⎜ ⎟minus + + minus +⎝ ⎠
E F
( ) y z i zdη
⎛ ⎞⎜ ⎟⎜ ⎟⎜ ⎟⎜ ⎟⎜ ⎟⎜ ⎟⎜ ⎟⎜ ⎟⎜ ⎟+⎝ ⎠
( )1
0
x xx y xy z xz
x xy y yy z yz
vx xz y yz z zz
x x y y z z
x i x y i y z i z
J
m m m
d d d
ζ τ ζ τ ζ τζ τ ζ τ ζ τζ τ ζ τ ζ τζ ζ ζζ ζ ζ
minus
⎛ ⎞⎜ ⎟+ +⎜ ⎟⎜ ⎟+ +⎜ ⎟= ⎜ ⎟+ +⎜ ⎟+ +⎜ ⎟⎜ ⎟⎜ ⎟minus + +⎝ ⎠
G
wwwintechopencom
Heat Transfer - Mathematical Modelling Numerical Methods and Information Technology
236
Partial derivatives with respect to x y and z in the components of the viscous stress tensor
and in flux terms describing diffusion di = (dix diy diz) and thermal conductivity
q = (qx qy qz) are calculated according to the chain rule
21 Chemically reacting nonequilibrium air In the calculation results presented in this chapter air is assumed to consist of five chemical species N2 O2 NO N O Vibrational and rotational temperatures of molecules are equal to the translational temperature Pressure is calculated according to Daltons law for a mixture of ideal gases
ii
gm i
RTRTp p
M M
ρρ= = =sum sum
where 〈gm 〈i ndash molecular weights of the gas mixture and the i-th chemical species The internal energy of the gas mixture per unit mass is
( ) ( )vi fi i i i ei i vmi i i m
c h c C T c T c Tε ε ε= + + +sum sum sum sum
Here ci =ρiρ hfi εei ndash mass concentration formation enthalpy and energy of electronic excitation of species i Cvi ndash heat capacity at constant volume of the translational and rotational degrees of freedom of species i equal to 32(RMi) for atoms and 52(RMi) for diatomic molecules Vibrational energy εvm of the m-th molecular species is calculated in the approximation of the harmonic oscillator The diffusion fluxes of the i-th chemical species are determined according to Ficks law and for example in the direction of the x-axis have the form
i
i x i
cd D
xρ part= minus part
To determine diffusion coefficients Di approximation of constant Schmidt numbers Sci = μρDi is used which are supposed to be equal to 075 for atoms and molecules Total heat flux q is the sum of heat fluxes by thermal conductivity and diffusion of chemical species
( ) ( )x i i x i pi vi ei fii
Tq h d h C T T T h
xκ ε εpart= minus + = + + +part sum
where hi Cちi ndash enthalpy and heat capacity at constant pressure of translational and rotational
degrees of freedom of the i-th chemical species per unit mass Viscosity μ and thermal conductivity κ of nonequilibrium mixture of gases are found by formulas of Wilke (1950) and of Mason amp Saxena (1958) The values of the rate constants of chemical reactions were taken from (Vlasov et al 1997) where they were selected on the basis of various theoretical and experimental data in particular as a result of comparison with flight data on electron density in the shock layer near the experimental vehicle RAM-C (Grantham 1970) Later this model of nonequilibrium air was tested in (Vlasov amp Gorshkov 2001) for conditions of hypersonic flow past the reentry vehicle OREX (Inouye 1995)
wwwintechopencom
Aerodynamic Heating at Hypersonic Speed
237
22 Perfect gas and equilibrium air In the calculations using the models of perfect gas and equilibrium air mass conservation
equations of chemical species in the system (1) are absent For a perfect gas the viscosity is
determined by Sutherlandrsquos formula thermal conductivity is found from the assumption of
the constant Prandtl number Pr = 072 For equilibrium air pressure internal energy
viscosity and thermal conductivity are determined from the thermodynamic relations
( ) ( ) ( ) ( )p p T T T Tρ ε ε ρ μ μ ρ κ κ ρ= = = =
23 Boundary conditions On the body surface a no-slip condition of the flow u = v = w =0 fixed wall temperature
Tw = const or adiabatic wall qw = wTw4 are specified where qw ndash total heat flux to the surface
due to heat conduction and diffusion of chemical species (2) w = 08 ndash emissivity of thermal
protection material - Stefan-Boltzmannrsquos constant
Concentrations of chemical species on the surface are found from equations of mass balance
which for atoms are of the form
2 10
2 2i w
i n i w i i wi w i
RTd K K
M
γρ γ π+ = = minus (3)
where γiw ndash the probability of heterogeneous recombination of the i-th chemical species
In hypersonic flow a shock wave is formed around a body Shock-capturing or shock-fitting approach is used In the latter case the shock wave is seen as a flow boundary with the implementation on it of the Rankine-Hugoniot conditions which result from integration of the Navier-Stokes equations (1) across the shock neglecting the source term S and the derivatives along it Assuming that a coordinate line = const coincides with the shock wave the Rankine-Hugoniot conditions can be represented in the form sinfin =F F or in more details (for a perfect gas)
( ) ( )( ) ( )( ) ( )
2 2
2 2 2 2( ) ( )
2 2 2 2
s ns n
s ns s n
s ns s n
ns s ns
V D V D
V D P V D P
V D V V D V
V D V V D Vh h
τ ττ τ
ρ ρρ ρρ ρ
infin infininfin infin infin
infin infin infininfin infininfin
minus = minusminus + = minus +minus = minus
minus minus+ + = + + (4)
here indices infin and s stand for parameters ahead and behind the shock D ndash shock velocity
V and Vn ndash projection of flow velocity on the directions of the tangent τ and the external
normal n to the shock wave In (4) terms are omitted responsible for the processes of
viscosity and thermal conductivity because in the calculation results presented below the
shock wave fitting is used for flows at high Reynolds numbers
24 Numerical method An implicit finite-difference numerical scheme linearized with respect to the previous time
step n for the Navier-Stokes equations (1) in general form can be written as follows
wwwintechopencom
Heat Transfer - Mathematical Modelling Numerical Methods and Information Technology
238
nξ η ζτ δ δ δ τ⎡ ⎤+ Δ + + minus Δ = minusΔ⎣ ⎦I A B C T Q R (5)
( ) ( ) ( ) ( ) n n n nn ξ η ζδ δ δ part part part part part part part part= + + minus = = = =R E F G S A E Q B F Q C G Q T S Q
Here symbols δξ δ and δ denote finite-difference operators which approximate the partial derivatives partpartξ partpart and partpart the index and indicates that the value is taken at time n I ndash identity matrix ΔQ = Qn +1 - Qn ndash increment vector of the conservative variables at time-step Δ = n+1 ndash n Let us consider first the inviscid flow Yoon amp Jameson (1987) have proposed a method of approximate factorization of the algebraic equations (5) ndash Lower-Upper Symmetric Successive OverRelaxation (LU-SSOR) scheme Suppose that in the transformed coordinates (ξ ζ) the grid is uniform and grid spacing in all directions is unity Δξ=Δ=Δζ=1 Then the LU-SSOR scheme at a point (ijk) of a finite-difference grid can be written as
1 nminus Δ = minusLD U Q R (6)
1 1 1 1 1 1
1 ( )
i j k i j k i j k i j k i j k i j k
β ρ ρ ρτ+ + + minus minus minusminus minus minus + + +
⎧ ⎫= + = + = + + + minus⎨ ⎬Δ⎩ ⎭= minus minus minus = + +
A B CL D L U D U D I T
L A B C U A B C
where
2 2 2
2 2 2
2 2 2
( ) 2
( ) 2
( ) 2
x y z
x y z
x y z
U
V
W
βρ ρ ξ ξ ξβρ ρ η η ηβρ ρ ζ ζ ζ
plusmnplusmnplusmn
= plusmn = + + += plusmn = + + += plusmn = + + +
A A
B B
C C
A A I
B B I
C C I
a
a
a
Here the indices of the quantities at the point (ijk) are omitted for brevity βge1 is a constant ρA ρB ρC ndash the spectral radii of the ldquoinviscidrdquo parts of the Jacobians A B и C а ndash the speed of sound Inversion of the equation system (6) is made in two steps
L Q R nΔ = minus (7a)
U Q D QΔ = Δ (7b)
It is seen from (6) that for non chemically reacting flows (S=0 T=0) LU-SSOR scheme does not require inversion of any matrices For reacting flows due to the presence of the Jacobian of the chemical source Tne0 the forward and back steps in (7) require generally speaking matrix inversion However calculations have shown that if the conditions are not too close to equilibrium then in the chemical Jacobian Т one can retain only diagonal terms which contain solely the partial derivatives with respect to concentrations of chemical species In this approximation scheme (6) leads to the scalar diagonal inversion also for the case of chemically reacting flows Thus calculation time grows directly proportionally to the number of chemical species concentrations This is important in calculations of complex flows of reacting gas mixtures when the number of considered chemical species is large In the case of viscous flow so as not to disrupt the diagonal structure of scheme (6) instead of the ldquoviscousrdquo Jacobians Av Bv и Cv their spectral radii are used
wwwintechopencom
Aerodynamic Heating at Hypersonic Speed
239
( ) ( ) ( )2 2 2 2 2 2 2 2 2 Pr Pr Pr
v x y z v x y z v x y z
γ μ γ μ γ μρ ξ ξ ξ ρ η η η ρ ζ ζ ζρ ρ ρ= + + = + + = + +CA B
In the finite-difference equation (6) central differences are employed both for viscous and convective fluxes The use of central differences to approximate the convective terms can cause non-physical oscillations of the flow parameters at high Reynolds numbers To suppress such numerical oscillations artificial dissipation terms were added in the right part R of (6) according to Pulliam (1986) In calculations presented below it was assumed that the derivatives partξpartt partpartt and partpartt are zero and Δ = infin Since steady flow is considered these assumptions do not affect the final result
3 Calculation results
31 Flow and heat transfer on blunt delta wing In thermovision experiments (Gubanova et al 1992) in hypersonic flow past a delta wing with blunt nose and edges two regions of elevated heat were observed on its windward surface At a distance of approximately 12-15 r from the nose of the wing (r ndash nose radius) there were narrow bands of high heat fluxes which extended almost parallel to the symmetry plane at a small interval (3-5 r) from it to the final section of the wing at х asymp 100 r (see Fig 1 in which the calculated distribution of heat fluxes is shown at the experimental conditions) The level of heat fluxes in the bands was approximately twice the value of background heat transfer corresponding to the level for a delta plate with sharp edges under the same conditions It turned out that this effect exists in a fairly narrow range of flow parameters In particular on the same wing but with a sharp tip a similar increase in heat flux was not observed This effect was explained by the interaction of shock waves arising at the tip and on the blunt edges of the wing (Gubanova et al 1992 Lesin amp Lunev 1994) In this section numerical results calculated for the experimental conditions are presented and compared with measured heat flux values (see also (Vlasov et al 2009))
Fig 1 Calculated distribution of non-dimensional heat flux Q = qq0 on the windward side of the blunt delta wing q0 ndash heat flux at the stagnation point of a sphere with a radius equal to the nose radius of the wing
Perfect gas hypersonic flow ( = 14) past a delta wing with a spherical nose and cylindrical edges of the same radius is considered Mach and Reynolds numbers calculated with free stream flow parameters and the wing nose radius are Minfin = 14 and Reinfin = 14middot104 angle of attack α = 10deg wing sweep angle λ = 75deg The free stream stagnation temperature T0infin = 1205 K the wall temperature Tw = 300 K Due to the symmetry of flow only half of the wing is computed The flow calculation was performed with shock-fitting procedure the computational grid is 120times40times119 (in the longitudinal transverse and circumferential
wwwintechopencom
Heat Transfer - Mathematical Modelling Numerical Methods and Information Technology
240
directions respectively see Fig 2) Below in this section all quantities with a dimension of length unless otherwise specified are normalized to the wing nose radius r
Fig 2 The computational grid on the wing surface in the plane of symmetry (z = 0) and in the exit section for the converged numerical solution
Fig 3 Streamlines near the windward surface of the wing Top ndash at a distance of one grid step from the wall bottom ndash at the outer edge of the boundary layer
Calculated patterns of streamlines near the windward surface of the wing at a distance of one grid step from the wall and at the outer edge of the boundary layer are shown in Fig 3 The streamlines flowing down from the wing edge on the windward plane at almost constant pressure form the line of diverging flow (line A-A) along which there are bands of elevated heat fluxes At the symmetry plane a line of converging streamlines is realized along the entire length of the wing but upstream the shock interaction point A flow impinges on the symmetry plane from the edges and downstream from A ndash from the diverging line A-A A characteristic feature of the considered case is that the distribution of heat fluxes on the windward side is mainly determined by the values of convergence and divergence of streamlines at almost constant pressure (see Fig 4 which shows the distribution of pressure and heat flux on the windward side in several sections x = const) Local maxima of heat fluxes near symmetry plane appear only at xgt 15 near the line z = 4 (after the nose shock wave intersects with the shock wave from the edges) and the relative intensity of these heat peaks grows with increasing distance from the nose (Fig 4b)
wwwintechopencom
Aerodynamic Heating at Hypersonic Speed
241
003
008
0 05 1
P
1
2 34
5
z
0
005
01
015
0 5 10
Q
z
12
34
(a) (b)
Fig 4 Pressure distribution Р = pρinfinVinfin2 (a) and heat flux Q = qq0 (b) on windward side of wing in sections 1-5 ndash x = 10 20 30 50 90 z= zzmax zmax ndash wingspan in section х = const
Comparison of the upper and lower parts of Fig 3 shows that the flow near the wall and at the outer edge of the boundary layer are noticeably different the streamlines near the wall are directed to the symmetry plane (converging) and in inviscid region ndash from it (diverging) It follows that the velocity component directed along the wing chord changes sign across the boundary layer which indicates the existence of transverse vortex (cross separation flow) in the boundary layer This is illustrated in Fig 5a which shows the projection of streamlines on the plane of the cross section at x = 90
400
1200
1200
700
1000T
0
(a) (b)
Fig 5 Projection of streamlines (a) and isolines of stagnation temperature T0 K (b) in cross section x = 90
The distribution of the boundary layer thickness is clearly seen in Fig 5b which shows the contours of the stagnation temperature T0 in the cross section x = 90 On the windward side of the wing minimum thickness of the boundary layer is located on the diverging line (line A-A in Fig 3) On the left and on the right sides of the diverging line there are converging lines with a thicker boundary layer (about 2 and 3 times respectively) One of the
wwwintechopencom
Heat Transfer - Mathematical Modelling Numerical Methods and Information Technology
242
converging lines is the symmetry plane Here the boundary layer thickness on the windward side reaches a maximum amounting to about one-third of the shock layer thickness Near the wing edge because of the expansion and acceleration of the flow the boundary layer thickness decreases sharply (at the edge it is almost 20 times less than at the symmetry plane on the windward side) On the leeward side of the wing flow separation occurs and the concept of the boundary layer loses its meaning Here scope of viscous flow is half the shock layer The shape of calculated shock wave in Fig 6a induced by the wing nose as a blunt body is determined by the law of the explosive analogy so that some front part of the wing
x le xA asymp 15 will be located inside the initially axisymmetric shock wave The coordinate of point A (xA) is located in the vicinity of interaction region of shock waves induced by the nose and the edges of the wing Here the profiles of pressure and heat flux along the edge are local maxima
0
10
000
005
0 15 30
zP
Q2
x
shock wing edge
P
Q
xA
0
005
-1 -05 0 05 1
Q
z
calculation
experiment
(a) (b)
Fig 6 Profiles of pressure heat flux and the shock wave along the wing edge (a) and distribution of heat fluxes in cross section x = 90 (b)
In Fig 6b the distribution of computed heat fluxes qq0 in the neighborhood of the wing end section at x = 90 is presented in comparison with the experiment of Gubanova et al (1992) depending on the transverse coordinate z On the whole the calculation correctly predicts the magnitude and position of local maximum of heat flux near the symmetry plane taking into account the small asymmetry in the experimental data Note that near the minima of heat fluxes calculated values are lower than experimental ones probably due to effect of smoothing of experimental data in these narrow regions
32 Heat transfer on test model of Pre-X space vehicle Currently developed hypersonic aircraft have dimensions several times smaller than previously created space vehicles Shuttle and Buran This results in increase of heat load on a vehicle during flight and therefore the problem of reliable calculation of heat fluxes on the surface for such relatively small bodies is particularly important Thus the problem arises of verification of the employed physical models and numerical methods by comparing calculation results with experimental data
wwwintechopencom
Aerodynamic Heating at Hypersonic Speed
243
In 2006-2007 on TsNIImashrsquos experimental base in a piston gasdynamic wind tunnel PGU-7 a heat transfer study has been conducted on a small-scale model of Pre-X reentry demonstrator (Baiocco 2006) This vehicle is designed to obtain in flight conditions experimental data pertaining to aerothermodynamic phenomena that are not modeled in ground tests but they are critical for design of a vehicle returning from the Earthrsquos orbit In particular Pre-X demonstrator is developed to test in a real flight and in specified locations on the vehicle surface samples of reusable thermal protection materials and to assess their durability During the study thermovision measurements have been conducted of heat fluxes on the model of scale 115 at various flow regimes ndash M = 10 Re = 1106-5106 1m (Kovalev et al 2009) Processing of thermovision measurements was carried out in accordance with standard technique and composed of determination of the model surface temperature during experiment extraction from these data distributions of heat fluxes on the observed model surface and binding of the resulting thermovision frame to a three-dimensional CAD model of the demonstrator The same CAD model has been used for numerical simulation of heat transfer on the Pre-X test model As a normalizing value the heat flux q0 at the stagnation point of a sphere with radius of 70 mm is adopted which is determined using the Fay-Riddell formula Advantage of data presentation in this form is due to invariability of the relative values Q = qq0 on most model surface at variations of flow parameters
Fig 7 Calculated distributions of pressure Р = ちρinfinVinfin2 (left) and stagnation temperature T0 K (right) on surface and in shock layer (in symmetry plane and in exit section) for test model of Pre-X vehicle
On the base of the numerical solution of the Navier-Stokes equations a study was carried out of flow parameters and heat transfer for laminar flow over a test model of Pre-X space
wwwintechopencom
Heat Transfer - Mathematical Modelling Numerical Methods and Information Technology
244
vehicle for experimental conditions in the piston gasdynamic wind tunnel Mach and Reynolds numbers calculated from the free-stream parameters and the length of the model (330 mm) are Minfin = 10 and Reinfin = 7middot105 Angle of attack ndash 45deg The flap deflection angle was (as in the experiment) = 5 10 and 15deg The stagnation temperature of the free-stream flow and the wing surface temperature ndash T0infin = 1000 K and Tw = 300 K respectively An approximation of a perfect gas was used with ratio of specific heats = 14 The calculations were performed with a shock-fitting procedure ie the bow shock was considered as a discontinuity with implementation of the Rankine-Hugoniot relations (4) across it On the model surface no-slip and fixed temperature conditions were set Note that in view of the flow symmetry computations were made only for a half of the model although in the figures below for comparison with experiment the calculated data (upon reflection in the symmetry plane) are presented on the entire model The overall flow pattern obtained in the calculations over the test model of Pre-X space vehicle is shown in Fig 7 where for the case of the flap deflection angle = 15deg pressure and stagnation temperature Т0 isolines in the shock layer and on the model surface are shown It is seen that there are two areas of high pressure on the nose tip of the model (P asymp 092) and on the deflection flaps In the latter case the pressure in the flow passing through the two shock waves reaches P asymp 13 Isolines of Т0 show the size of regions where viscous forces are significant a thin boundary layer on the windward side of the model and an extensive separation zone on the leeward side The small separation zone appearing at deflection flaps although about four times thicker than the boundary layer upstream of it is almost not visible in the scale of the figure Fig 8 shows the distributions of relative heat flow Q on the windward side of the model obtained in the experiments and in the calculations at deflection angles of flaps = 5 10 and 15deg For the case = 5deg it can be noted rather good agreement between experiment and calculation in the values of heat flux in the central part of the model and on the flaps It is evident that before deflected flaps there is a region of low heat fluxes caused by near separation state (according to calculation results) of the boundary layer In analyzing the experimental data it should be taken into account the effect of apparent temperature reduction of the surface area with a large angle to the thermovision observation line It is precisely this effect that explains the fact that in the nose part of the model the experimental values of heat flux are less than the calculated ones Also narrow zones of high (at the sharp edges of the flaps) or low (in the separation zone at the root of the flaps) values of heat flux are smoothed or not visible in the experiment due to insufficient resolution of thermovision equipment The resolution capability of thermovisor is clearly visible by the size of cells in the experimental isoline pattern of heat flux in Fig 8 It should be noted that the calculations do not take into account a slit between the deflection flaps available on the test model the presence of which should lead to a decrease in the separation region in front of the flaps At an angle of flap deflection = 10deg as in the previous case = 5deg there is fairly good agreement between calculation and experiment for the values of heat flux in the central part of the model and on the flaps The calculations show that the growth of the flap deflection angle from 5deg to 10deg results in the formation of a large separation zone in front of the flaps and in a decrease in heat flux value Q from 02 to 01 At the largest angle of flap deflection = 15deg the maximum of calculated heat flux occurs in the zone of impingement of the separated boundary layer where the level of Q is 2-3 times higher than its level on the undeflected flap The coincidence of calculation results with
wwwintechopencom
Aerodynamic Heating at Hypersonic Speed
245
experimental data in the front part of the model up to the separation zone before the flaps is satisfactory On the flaps the level of heat flux in the experiment is about one and a half times more than in the calculation This difference in heat flux values is apparently due to laminar-turbulent transition in separation region induced by the deflected flaps which takes place in the experiment
δ = 5deg
δ = 10deg
δ = 15deg
Fig 8 Experimental (left) and calculated (right) heat fluxes Q = qq0 on windward side of test model of Pre-X space vehicle at different deflection angles of flaps
wwwintechopencom
Heat Transfer - Mathematical Modelling Numerical Methods and Information Technology
246
33 Flow and heat transfer on a winged space vehicle at reentry to Earths atmosphere This section presents the results of numerical simulation of flow and heat transfer on a
winged version of the small-scale reentry vehicle being developed in TsAGI (Vaganov et al
2006) moving at hypersonic speed in the Earths atmosphere Calculations were made using
two physical-chemical models of the gas medium - equilibrium and non-equilibrium
chemically reacting air
The bow shock was captured in contrast to the previous two flow cases Thus on the inflow
boundary the free-stream conditions were specified On the vehicle surface no-slip and
adiabatic wall conditions were supposed In calculations with use of the nonequilibrium air
model the vehicle surface was supposed to be low catalytical with the probability of
heterogeneous recombination of O and N atoms equal to А = 001
A computational grid was provided by Mikhalin VA (Dmitriev et al 2007) and was taken
from the inviscid flow calculation The number of points in the direction normal to the
vehicle surface has been increased to resolve the wall boundary layer Part of the results
presented below was reported in (Dmitriev et al 2007 Gorshkov et al 2008a)
Calculations were performed for two points of a reentry trajectory for which thermal loads
are close to maximum (Table 1) The angle of attack α = 35deg the vehicle length L = 9m A
grid 93times50times101 in the longitudinal transverse and circumferential directions respectively
were used in the calculations The surface grid of the vehicle is shown in Fig 9
Н
km
Vinfin
msec ReinfinL Minfin Рinfin atm Тinfin K
70 5952 346middot105 200 576middot10-5 219
63 5152 684middot105 166 159middot10-4 243
Table 1 Parameters of trajectory points
Fig 9 Surface grid of the small-scale reentry vehicle
In Fig 10a contours of total enthalpy H0 on the surface and in the shock layer near the reentry vehicle are shown On the windward side one can see the shock wave the thin wall boundary layer and the inviscid flow between them in which the values of H0 are constant In the calculations the shock wave is smeared upon 3-5 grid points and has a finite thickness due to the use of artificial dissipation In particular a local decrease in H0 in a strong shock
wwwintechopencom
Aerodynamic Heating at Hypersonic Speed
247
wave on the windward side which can be seen in the figure has no physical meaning and is due to the influence of artificial dissipation Recall that the Navier-Stokes equations do not correctly describe the shock structure at Mach numbers Mgt 15 In the shock layer on the leeward side it is visible a large area with reduced values of total enthalpy Н0ltН0infin (Н0infin ndash total enthalpy in the free-stream) which arises as a result of boundary layer separation from the vehicle surface Chemical processes occurring in the shock layer over the vehicle are illustrated in Fig 10b which shows contours of mass concentrations of oxygen atoms つо Under the considered conditions in the vicinity of the vehicle nose behind the shock wave O2 dissociation is complete On the windward side downstream the nose in the shock layer and on the surface the recombination occurs and the concentration of O decreases In contrast on the leeward side where the flow is very rarefied the level of つо remains high indicating that the process of recombination of atomic oxygen is frozen
boundary layer
shock wave
(a) (b)
Fig 10 Total enthalpy MJkg (a) and mass concentration of oxygen atoms (b) on the surface and in the shock layer near the vehicle 〉 = 63 km
0001
001
01
1
0 5 10
P
x m
equilibrium air
nonequilibrium air
equilibrium air
Fig 11 Pressure distribution P = ちρinfinVinfin2 on vehicle surface overall view (left) and in symmetry plane (right) 〉 = 63 km
wwwintechopencom
Heat Transfer - Mathematical Modelling Numerical Methods and Information Technology
248
In Fig 11 and 12 isolines of pressure heat flux qw and equilibrium radiation temperature Tw
on the vehicle surface are shown for cases of equilibrium and non-equilibrium dissociating
air Comparison of qw and Tw distributions on the vehicle surface in the symmetry plane for
two air models are depicted in Fig 13
Analysis of the calculation results shows that pressure distribution on the windward surface
of the vehicle does not depend on physical-chemical model of the gas medium - the
difference in pressure values for equilibrium and non-equilibrium air flow is 1 - 2 On the
leeward side pressure on the surface for nonequilibrium flow may be nearly two times
lower than for equilibrium flow (eg in the vicinity of the tail) This is probably due to the
fact that the effective ratio of specific heats for nonequilibrium air is greater than for
equilibrium air because in the shock layer on the leeward side nonequilibrium flow is
chemically frozen and here there is a sufficiently high concentration of atoms (see Fig 10b)
equilibrium air nonequilibrium air
Fig 12 Distributions of heat flux qw kWm2 (top) and equilibrium radiation temperature TwdegC (bottom) on the vehicle surface 〉 = 63 km
Nonequilibrium chemical processes in the shock layer and finite catalytic activity of the
vehicle surface (А = 001) significantly reduce the calculated levels of heat transfer in
comparison with the case of equilibrium air flow The most significant decrease in heat flux
is observed on the vehicle nose part (for x le 1 m) and in the vicinity of the tail For example
at the nose stagnation point the level of heat flux decreases by about 40 ndash from 640 to 385
kWm2 while the surface temperature decreases by nearly 15 ndash from 1670 to 1430 degC
Note a high heat flux level on the thin edge of the wing compared with one at the nose
stagnation point Particularly intense heating occurs at the sharp bend of the wing where the
values of heat flux and surface temperature even slightly exceed their values at the front
stagnation point In the case of equilibrium air flow the exceeding for heat flux is about 10
(710 and 640 kWm2) for temperature - 3 (1720 and 1670 degC) In the case of
nonequilibrium air flow the exceeding is more significant for heat flux - 30 (540 and 385
kWm2) for temperature - 10 (1570 and 1430 deg C)
wwwintechopencom
Aerodynamic Heating at Hypersonic Speed
249
In other parts of the vehicle surface difference in heat flux levels for the two air models is somewhat less and it decreases downstream presumably due to gradual recombination of atoms in the boundary layer at flowing along the surface in case of non-equilibrium air
1
10
100
1000
0 5 10
Qw
x m
equilibrium air
nonequilibrium air
0
1000
2000
0 5 10
Tw
x m
equilibrium air
nonequilibrium air
Fig 13 Profiles of heat flux qw kWm2 (left) and equilibrium radiation temperature TwdegC (right) on vehicle surface in symmetry plane 〉 = 63 km
A similar flow and heat flux patterns are observed for the altitude H = 70 km as seen in Fig 14 where contours of heat flux and equilibrium radiation wall temperature are shown at this altitude for the two air models For equilibrium air overall level of heat flux at 70 km is slightly higher than at 63 km For example heat flux value at the nose stagnation point is increased by 5 (675 compared with 640 kWm2) The opposite situation occurs for the model of nonequilibrium air in this case the stagnation point heat flux value at 70 km is lower than at 63 km ndash by 7 (360 and 385 kWm2 respectively)
equilibrium air nonequilibrium air
Fig 14 Distributions of heat flux qw kWm2 (top) and equilibrium radiation temperature TwdegC (bottom) on the vehicle surface 〉 = 70 km
wwwintechopencom
Heat Transfer - Mathematical Modelling Numerical Methods and Information Technology
250
4 Conclusion
A three-dimensional stationary NavierndashStokes computer code for laminar flow developed
by the author has been briefly described The code is mainly intended to calculate super-
and hypersonic flows over bodies accounting for high temperature real gas effects with
special emphasis on convective heat transfer Three gas models perfect gas equilibrium and
nonequilibrium gas mixture can be used in the calculations
In the chapter a comparison of code calculation results with experimental data is made for
two perfect gas hypersonic flow cases at wind tunnel conditions First case is a simulation of
an anomalous heat transfer on the windward side a delta wing with blunt edges On the
whole the calculation correctly predicts the magnitude and position of local maximum of
heat flux near the wing symmetry plane taking into account a small asymmetry in the
experimental data Second case is a computation of heat transfer on a test model of the Pre-X
demonstrator Satisfactory agreement with thermovision heat fluxes on the smooth
windward side and on the flaps is obtained except for the largest deflection angle of flaps
= 15deg when the level of heat flux in the experiment is about one and a half times more than
in the calculation This discrepancy is apparently due to laminar-turbulent transition in
separation region induced by the deflected flaps which takes place in the experiment
Third flow case concerns chemically reacting air flow at equilibrium or nonequilibrium
conditions Flowfield and convective heat transfer parameters for a winged shape of a small-
scale reentry vehicle are calculated for two points of a reentry trajectory in the Earthrsquos
atmosphere Heat flux and equilibrium radiation temperature distributions on the vehicle
surface are obtained Also regions of maximal thermal loadings are localized
Calculations show that for nonequilibrium air flow the use of a low catalytic coating (with
probability of heterogeneous recombination of atoms А = 001) on the vehicle surface
enables to decrease considerably the level of heat fluxes in regions of maximal heat transfer
in the nose part and on the wing edges in comparison with equilibrium air flow For
example for trajectory points with maximal thermal load a reduction of up to 40 in heat
flux (which results in a 15 reduction of equilibrium radiation wall temperature) can be
obtained at the vehicle nose
5 Acknowledgments
The author is grateful to Kovalev RV Marinin VP and Vlasov VI for delivering
thermovision data on test model of Pre-X vehicle and also to Churakov DA and Mihalin
VA for providing computational grids
6 References
Baiocco P Guedron S Plotard P amp Moulin J (2006) The Pre-X atmospheric re-entry
experimental lifting body Program status and system synthesis Proceedings of 57th
International Astronautical Congress 2-6 October 2006 IAC-06-D2P22
Churakov DA Gorshkov AB Kovalev RV Vlasov VI Beloshitsky AV Dyadkin
AA amp Zhurin SV (2008) Heat Transfer of Reentry Vehicles during Atmosphere
Flight Proceedings of 6-th European Symposium on Aerothermodynamics for Space
Vehicles Versailles France 3 - 6 November 2008
wwwintechopencom
Aerodynamic Heating at Hypersonic Speed
251
Dmitriev VG Vaganov AV Gorshkov AB Lapygin VI Galaktionov AYu amp
Mikhalin VA (2007) Analysis of Aerothermodynamic Parameters of Reusable
Space Wing Vehicle Proceedings of 2nd European Conference for Aero-Space Sciences
Brussels Belgium July 1-6 2007
Gorshkov AB (1997) Calculation of Base Heat Transfer Behind Thin Cone-Shaped Bodies
Cosmonautics and Rocket Engineering No 11 (1997) pp 13-20 (in Russian)
Gorshkov AB Kovalev R V Vlasov V I amp Zemlyanskiy B A (2008a) Simulation of
Heat Transfer to Space Vehicles during a Gliding Reentry into Earthrsquos
Atmosphere Proceedings of 14th International Conference on Methods of Aerophysical
Research (ICMAR-2008) Novosibirsk Russia 30 June - 06 July 2008
Gorshkov AB Kovalev R V Vlasov amp V I Zemlyanskiy B A (2008b) Heat Transfer
Investigation for Hypersonic Flow over Experimental Model of Pre-X Reentry
Vehicle Proceedings of 7th Sino-Russian High-Speed Flow Conference (SRHFC-7)
Novosibirsk Russia 1 - 3 July 2008
Grantham WL (1970) Flight results of a 25000 fps re-entry experiment NASA TN D 6062
Gubanova OI Zemlyansky BA Lessin AB Lunev VV Nikulin AN amp Syusin AV
(1992) Anomalous heat transfer on the windward side of a delta wing with a blunt
tip in hypersonic flow In Aerothermodynamics of aerospace systems Pt 1 pp 188-196
Moscow TsAGI (in Russian)
Hoffmann KA Chiang ST (2000) Computational fluid dynamics Vol 2 Engineering
Educational Systems ISBN 0-9623731-3-3 Kansas USA
Inouye Y (1995) OREX flight ndash quick report and lessons learned Proceedings of 2nd
European Symposium on Aerothermodynamics for Space Vehicles pp 271-279 ESTEC
Noordwik The Netherlands Europe Space Agency (November 1994)
Kovalev RV Kislykh VV Kolozezniy AE Kudryavtsev VV Marinin VP Vlasov
VI amp Zemliansky BA (2009) Experimental studies of Pre-X vehicle heat transfer
in PGU-7 test facility 3rd European Conference for Aerospace Sciences (EUCASS-2009)
Versailles France 6-9 July 2009
Lesin AB amp Lunev VV (1994) Heat transfer peaks on a blunt-nosed triangular plate in
hypersonic flow Fluid Dynamics Vol 29 No 2 (April 1994) pp 258-262 ISSN
0015-4628
Mason EA amp Saxena SC (1958) Approximate Formula for the Thermal Conductivity of
Gas Mixtures Phys Fluids Vol 1 No 5 (1958) pp 361-369
Pulliam TH (1986) Artificial dissipation models for the Euler equations AIAA Journal
Vol24 No 12 (December 1986) pp 1931-1940 ISSN 0001-1452
Vaganov AV Dmitriev VG Zadonsky SM Kireev AY Skuratov AS amp Stepanov
EA (2006) Estimations of low-sized winged reentry vehicle heat regimes on the
stage of its designing Physico-chemical kinetics in gas dynamics
wwwchemphysedurupdf2006-11-20-002pdf (in Russian)
Vlasov VI Gorshkov AB Kovalev RV amp Plastinin YuA (1997) Theoretical studies of
air ionization and NO vibrational excitation in low density hypersonic flow around
re-entry bodies AIAA Paper No 97-2582 (1997)
Vlasov V I amp Gorshkov A B (2001) Comparison of the Calculated Results for Hypersonic
Flow Past Blunt Bodies with the OREX Flight Test Data Fluid Dynamics Vol 36
No 5 (October 2001) pp 812-819 ISSN 0015-4628
wwwintechopencom
Heat Transfer - Mathematical Modelling Numerical Methods and Information Technology
252
Vlasov VI Gorshkov AB Kovalev RV amp Lunev VV (2009) Thin triangular blunt-
nosed plate in a viscous hypersonic flow Fluid Dynamics Vol 44 No 4 (August
2009) pp 596-605 ISSN 0015-4628
Wilke C (1950) A Viscosity Equation for Gas Mixtures JChemPhys Vol 18 No 4 (1950)
pp517-519
Yoon S amp Jameson A (1987) An LU-SSOR Scheme for the Euler and Navier-Stokes
Equations AIAA Paper No 87-0600 (1987)
wwwintechopencom
Heat Transfer - Mathematical Modelling Numerical Methods andInformation TechnologyEdited by Prof Aziz Belmiloudi
ISBN 978-953-307-550-1Hard cover 642 pagesPublisher InTechPublished online 14 February 2011Published in print edition February 2011
InTech EuropeUniversity Campus STeP Ri Slavka Krautzeka 83A 51000 Rijeka Croatia Phone +385 (51) 770 447 Fax +385 (51) 686 166
InTech ChinaUnit 405 Office Block Hotel Equatorial Shanghai No65 Yan An Road (West) Shanghai 200040 China
Phone +86-21-62489820 Fax +86-21-62489821
Over the past few decades there has been a prolific increase in research and development in area of heattransfer heat exchangers and their associated technologies This book is a collection of current research inthe above mentioned areas and describes modelling numerical methods simulation and informationtechnology with modern ideas and methods to analyse and enhance heat transfer for single and multiphasesystems The topics considered include various basic concepts of heat transfer the fundamental modes ofheat transfer (namely conduction convection and radiation) thermophysical properties computationalmethodologies control stabilization and optimization problems condensation boiling and freezing with manyreal-world problems and important modern applications The book is divided in four sections InverseStabilization and Optimization Problems Numerical Methods and Calculations Heat Transfer in MiniMicroSystems Energy Transfer and Solid Materials and each section discusses various issues methods andapplications in accordance with the subjects The combination of fundamental approach with many importantpractical applications of current interest will make this book of interest to researchers scientists engineers andgraduate students in many disciplines who make use of mathematical modelling inverse problemsimplementation of recently developed numerical methods in this multidisciplinary field as well as toexperimental and theoretical researchers in the field of heat and mass transfer
How to referenceIn order to correctly reference this scholarly work feel free to copy and paste the following
Andrey B Gorshkov (2011) Aerodynamic Heating at Hypersonic Speed Heat Transfer - MathematicalModelling Numerical Methods and Information Technology Prof Aziz Belmiloudi (Ed) ISBN 978-953-307-550-1 InTech Available from httpwwwintechopencombooksheat-transfer-mathematical-modelling-numerical-methods-and-information-technologyaerodynamic-heating-at-hypersonic-speed
wwwintechopencom
wwwintechopencom
copy 2011 The Author(s) Licensee IntechOpen This chapter is distributedunder the terms of the Creative Commons Attribution-NonCommercial-ShareAlike-30 License which permits use distribution and reproduction fornon-commercial purposes provided the original is properly cited andderivative works building on this content are distributed under the samelicense
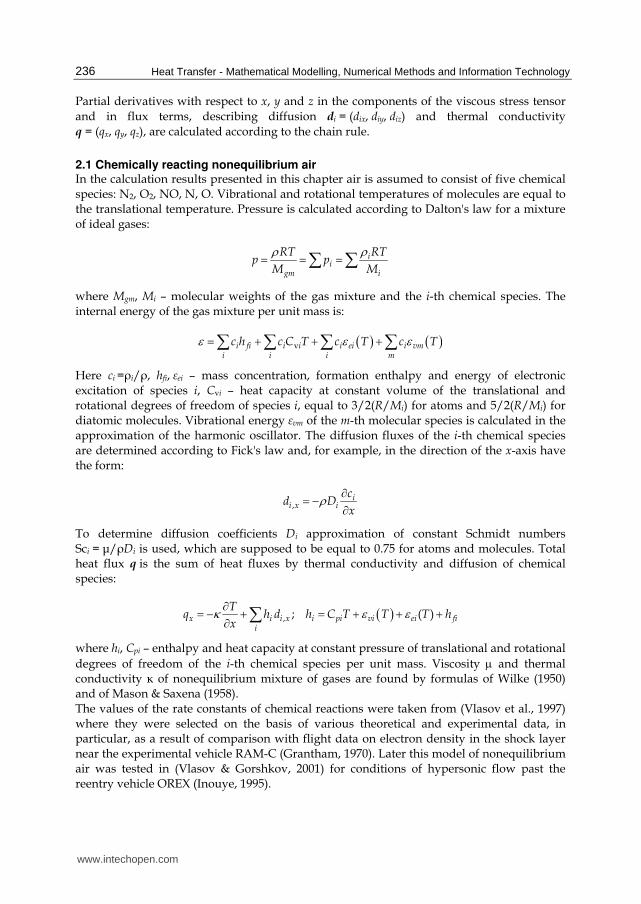
Heat Transfer - Mathematical Modelling Numerical Methods and Information Technology
236
Partial derivatives with respect to x y and z in the components of the viscous stress tensor
and in flux terms describing diffusion di = (dix diy diz) and thermal conductivity
q = (qx qy qz) are calculated according to the chain rule
21 Chemically reacting nonequilibrium air In the calculation results presented in this chapter air is assumed to consist of five chemical species N2 O2 NO N O Vibrational and rotational temperatures of molecules are equal to the translational temperature Pressure is calculated according to Daltons law for a mixture of ideal gases
ii
gm i
RTRTp p
M M
ρρ= = =sum sum
where 〈gm 〈i ndash molecular weights of the gas mixture and the i-th chemical species The internal energy of the gas mixture per unit mass is
( ) ( )vi fi i i i ei i vmi i i m
c h c C T c T c Tε ε ε= + + +sum sum sum sum
Here ci =ρiρ hfi εei ndash mass concentration formation enthalpy and energy of electronic excitation of species i Cvi ndash heat capacity at constant volume of the translational and rotational degrees of freedom of species i equal to 32(RMi) for atoms and 52(RMi) for diatomic molecules Vibrational energy εvm of the m-th molecular species is calculated in the approximation of the harmonic oscillator The diffusion fluxes of the i-th chemical species are determined according to Ficks law and for example in the direction of the x-axis have the form
i
i x i
cd D
xρ part= minus part
To determine diffusion coefficients Di approximation of constant Schmidt numbers Sci = μρDi is used which are supposed to be equal to 075 for atoms and molecules Total heat flux q is the sum of heat fluxes by thermal conductivity and diffusion of chemical species
( ) ( )x i i x i pi vi ei fii
Tq h d h C T T T h
xκ ε εpart= minus + = + + +part sum
where hi Cちi ndash enthalpy and heat capacity at constant pressure of translational and rotational
degrees of freedom of the i-th chemical species per unit mass Viscosity μ and thermal conductivity κ of nonequilibrium mixture of gases are found by formulas of Wilke (1950) and of Mason amp Saxena (1958) The values of the rate constants of chemical reactions were taken from (Vlasov et al 1997) where they were selected on the basis of various theoretical and experimental data in particular as a result of comparison with flight data on electron density in the shock layer near the experimental vehicle RAM-C (Grantham 1970) Later this model of nonequilibrium air was tested in (Vlasov amp Gorshkov 2001) for conditions of hypersonic flow past the reentry vehicle OREX (Inouye 1995)
wwwintechopencom
Aerodynamic Heating at Hypersonic Speed
237
22 Perfect gas and equilibrium air In the calculations using the models of perfect gas and equilibrium air mass conservation
equations of chemical species in the system (1) are absent For a perfect gas the viscosity is
determined by Sutherlandrsquos formula thermal conductivity is found from the assumption of
the constant Prandtl number Pr = 072 For equilibrium air pressure internal energy
viscosity and thermal conductivity are determined from the thermodynamic relations
( ) ( ) ( ) ( )p p T T T Tρ ε ε ρ μ μ ρ κ κ ρ= = = =
23 Boundary conditions On the body surface a no-slip condition of the flow u = v = w =0 fixed wall temperature
Tw = const or adiabatic wall qw = wTw4 are specified where qw ndash total heat flux to the surface
due to heat conduction and diffusion of chemical species (2) w = 08 ndash emissivity of thermal
protection material - Stefan-Boltzmannrsquos constant
Concentrations of chemical species on the surface are found from equations of mass balance
which for atoms are of the form
2 10
2 2i w
i n i w i i wi w i
RTd K K
M
γρ γ π+ = = minus (3)
where γiw ndash the probability of heterogeneous recombination of the i-th chemical species
In hypersonic flow a shock wave is formed around a body Shock-capturing or shock-fitting approach is used In the latter case the shock wave is seen as a flow boundary with the implementation on it of the Rankine-Hugoniot conditions which result from integration of the Navier-Stokes equations (1) across the shock neglecting the source term S and the derivatives along it Assuming that a coordinate line = const coincides with the shock wave the Rankine-Hugoniot conditions can be represented in the form sinfin =F F or in more details (for a perfect gas)
( ) ( )( ) ( )( ) ( )
2 2
2 2 2 2( ) ( )
2 2 2 2
s ns n
s ns s n
s ns s n
ns s ns
V D V D
V D P V D P
V D V V D V
V D V V D Vh h
τ ττ τ
ρ ρρ ρρ ρ
infin infininfin infin infin
infin infin infininfin infininfin
minus = minusminus + = minus +minus = minus
minus minus+ + = + + (4)
here indices infin and s stand for parameters ahead and behind the shock D ndash shock velocity
V and Vn ndash projection of flow velocity on the directions of the tangent τ and the external
normal n to the shock wave In (4) terms are omitted responsible for the processes of
viscosity and thermal conductivity because in the calculation results presented below the
shock wave fitting is used for flows at high Reynolds numbers
24 Numerical method An implicit finite-difference numerical scheme linearized with respect to the previous time
step n for the Navier-Stokes equations (1) in general form can be written as follows
wwwintechopencom
Heat Transfer - Mathematical Modelling Numerical Methods and Information Technology
238
nξ η ζτ δ δ δ τ⎡ ⎤+ Δ + + minus Δ = minusΔ⎣ ⎦I A B C T Q R (5)
( ) ( ) ( ) ( ) n n n nn ξ η ζδ δ δ part part part part part part part part= + + minus = = = =R E F G S A E Q B F Q C G Q T S Q
Here symbols δξ δ and δ denote finite-difference operators which approximate the partial derivatives partpartξ partpart and partpart the index and indicates that the value is taken at time n I ndash identity matrix ΔQ = Qn +1 - Qn ndash increment vector of the conservative variables at time-step Δ = n+1 ndash n Let us consider first the inviscid flow Yoon amp Jameson (1987) have proposed a method of approximate factorization of the algebraic equations (5) ndash Lower-Upper Symmetric Successive OverRelaxation (LU-SSOR) scheme Suppose that in the transformed coordinates (ξ ζ) the grid is uniform and grid spacing in all directions is unity Δξ=Δ=Δζ=1 Then the LU-SSOR scheme at a point (ijk) of a finite-difference grid can be written as
1 nminus Δ = minusLD U Q R (6)
1 1 1 1 1 1
1 ( )
i j k i j k i j k i j k i j k i j k
β ρ ρ ρτ+ + + minus minus minusminus minus minus + + +
⎧ ⎫= + = + = + + + minus⎨ ⎬Δ⎩ ⎭= minus minus minus = + +
A B CL D L U D U D I T
L A B C U A B C
where
2 2 2
2 2 2
2 2 2
( ) 2
( ) 2
( ) 2
x y z
x y z
x y z
U
V
W
βρ ρ ξ ξ ξβρ ρ η η ηβρ ρ ζ ζ ζ
plusmnplusmnplusmn
= plusmn = + + += plusmn = + + += plusmn = + + +
A A
B B
C C
A A I
B B I
C C I
a
a
a
Here the indices of the quantities at the point (ijk) are omitted for brevity βge1 is a constant ρA ρB ρC ndash the spectral radii of the ldquoinviscidrdquo parts of the Jacobians A B и C а ndash the speed of sound Inversion of the equation system (6) is made in two steps
L Q R nΔ = minus (7a)
U Q D QΔ = Δ (7b)
It is seen from (6) that for non chemically reacting flows (S=0 T=0) LU-SSOR scheme does not require inversion of any matrices For reacting flows due to the presence of the Jacobian of the chemical source Tne0 the forward and back steps in (7) require generally speaking matrix inversion However calculations have shown that if the conditions are not too close to equilibrium then in the chemical Jacobian Т one can retain only diagonal terms which contain solely the partial derivatives with respect to concentrations of chemical species In this approximation scheme (6) leads to the scalar diagonal inversion also for the case of chemically reacting flows Thus calculation time grows directly proportionally to the number of chemical species concentrations This is important in calculations of complex flows of reacting gas mixtures when the number of considered chemical species is large In the case of viscous flow so as not to disrupt the diagonal structure of scheme (6) instead of the ldquoviscousrdquo Jacobians Av Bv и Cv their spectral radii are used
wwwintechopencom
Aerodynamic Heating at Hypersonic Speed
239
( ) ( ) ( )2 2 2 2 2 2 2 2 2 Pr Pr Pr
v x y z v x y z v x y z
γ μ γ μ γ μρ ξ ξ ξ ρ η η η ρ ζ ζ ζρ ρ ρ= + + = + + = + +CA B
In the finite-difference equation (6) central differences are employed both for viscous and convective fluxes The use of central differences to approximate the convective terms can cause non-physical oscillations of the flow parameters at high Reynolds numbers To suppress such numerical oscillations artificial dissipation terms were added in the right part R of (6) according to Pulliam (1986) In calculations presented below it was assumed that the derivatives partξpartt partpartt and partpartt are zero and Δ = infin Since steady flow is considered these assumptions do not affect the final result
3 Calculation results
31 Flow and heat transfer on blunt delta wing In thermovision experiments (Gubanova et al 1992) in hypersonic flow past a delta wing with blunt nose and edges two regions of elevated heat were observed on its windward surface At a distance of approximately 12-15 r from the nose of the wing (r ndash nose radius) there were narrow bands of high heat fluxes which extended almost parallel to the symmetry plane at a small interval (3-5 r) from it to the final section of the wing at х asymp 100 r (see Fig 1 in which the calculated distribution of heat fluxes is shown at the experimental conditions) The level of heat fluxes in the bands was approximately twice the value of background heat transfer corresponding to the level for a delta plate with sharp edges under the same conditions It turned out that this effect exists in a fairly narrow range of flow parameters In particular on the same wing but with a sharp tip a similar increase in heat flux was not observed This effect was explained by the interaction of shock waves arising at the tip and on the blunt edges of the wing (Gubanova et al 1992 Lesin amp Lunev 1994) In this section numerical results calculated for the experimental conditions are presented and compared with measured heat flux values (see also (Vlasov et al 2009))
Fig 1 Calculated distribution of non-dimensional heat flux Q = qq0 on the windward side of the blunt delta wing q0 ndash heat flux at the stagnation point of a sphere with a radius equal to the nose radius of the wing
Perfect gas hypersonic flow ( = 14) past a delta wing with a spherical nose and cylindrical edges of the same radius is considered Mach and Reynolds numbers calculated with free stream flow parameters and the wing nose radius are Minfin = 14 and Reinfin = 14middot104 angle of attack α = 10deg wing sweep angle λ = 75deg The free stream stagnation temperature T0infin = 1205 K the wall temperature Tw = 300 K Due to the symmetry of flow only half of the wing is computed The flow calculation was performed with shock-fitting procedure the computational grid is 120times40times119 (in the longitudinal transverse and circumferential
wwwintechopencom
Heat Transfer - Mathematical Modelling Numerical Methods and Information Technology
240
directions respectively see Fig 2) Below in this section all quantities with a dimension of length unless otherwise specified are normalized to the wing nose radius r
Fig 2 The computational grid on the wing surface in the plane of symmetry (z = 0) and in the exit section for the converged numerical solution
Fig 3 Streamlines near the windward surface of the wing Top ndash at a distance of one grid step from the wall bottom ndash at the outer edge of the boundary layer
Calculated patterns of streamlines near the windward surface of the wing at a distance of one grid step from the wall and at the outer edge of the boundary layer are shown in Fig 3 The streamlines flowing down from the wing edge on the windward plane at almost constant pressure form the line of diverging flow (line A-A) along which there are bands of elevated heat fluxes At the symmetry plane a line of converging streamlines is realized along the entire length of the wing but upstream the shock interaction point A flow impinges on the symmetry plane from the edges and downstream from A ndash from the diverging line A-A A characteristic feature of the considered case is that the distribution of heat fluxes on the windward side is mainly determined by the values of convergence and divergence of streamlines at almost constant pressure (see Fig 4 which shows the distribution of pressure and heat flux on the windward side in several sections x = const) Local maxima of heat fluxes near symmetry plane appear only at xgt 15 near the line z = 4 (after the nose shock wave intersects with the shock wave from the edges) and the relative intensity of these heat peaks grows with increasing distance from the nose (Fig 4b)
wwwintechopencom
Aerodynamic Heating at Hypersonic Speed
241
003
008
0 05 1
P
1
2 34
5
z
0
005
01
015
0 5 10
Q
z
12
34
(a) (b)
Fig 4 Pressure distribution Р = pρinfinVinfin2 (a) and heat flux Q = qq0 (b) on windward side of wing in sections 1-5 ndash x = 10 20 30 50 90 z= zzmax zmax ndash wingspan in section х = const
Comparison of the upper and lower parts of Fig 3 shows that the flow near the wall and at the outer edge of the boundary layer are noticeably different the streamlines near the wall are directed to the symmetry plane (converging) and in inviscid region ndash from it (diverging) It follows that the velocity component directed along the wing chord changes sign across the boundary layer which indicates the existence of transverse vortex (cross separation flow) in the boundary layer This is illustrated in Fig 5a which shows the projection of streamlines on the plane of the cross section at x = 90
400
1200
1200
700
1000T
0
(a) (b)
Fig 5 Projection of streamlines (a) and isolines of stagnation temperature T0 K (b) in cross section x = 90
The distribution of the boundary layer thickness is clearly seen in Fig 5b which shows the contours of the stagnation temperature T0 in the cross section x = 90 On the windward side of the wing minimum thickness of the boundary layer is located on the diverging line (line A-A in Fig 3) On the left and on the right sides of the diverging line there are converging lines with a thicker boundary layer (about 2 and 3 times respectively) One of the
wwwintechopencom
Heat Transfer - Mathematical Modelling Numerical Methods and Information Technology
242
converging lines is the symmetry plane Here the boundary layer thickness on the windward side reaches a maximum amounting to about one-third of the shock layer thickness Near the wing edge because of the expansion and acceleration of the flow the boundary layer thickness decreases sharply (at the edge it is almost 20 times less than at the symmetry plane on the windward side) On the leeward side of the wing flow separation occurs and the concept of the boundary layer loses its meaning Here scope of viscous flow is half the shock layer The shape of calculated shock wave in Fig 6a induced by the wing nose as a blunt body is determined by the law of the explosive analogy so that some front part of the wing
x le xA asymp 15 will be located inside the initially axisymmetric shock wave The coordinate of point A (xA) is located in the vicinity of interaction region of shock waves induced by the nose and the edges of the wing Here the profiles of pressure and heat flux along the edge are local maxima
0
10
000
005
0 15 30
zP
Q2
x
shock wing edge
P
Q
xA
0
005
-1 -05 0 05 1
Q
z
calculation
experiment
(a) (b)
Fig 6 Profiles of pressure heat flux and the shock wave along the wing edge (a) and distribution of heat fluxes in cross section x = 90 (b)
In Fig 6b the distribution of computed heat fluxes qq0 in the neighborhood of the wing end section at x = 90 is presented in comparison with the experiment of Gubanova et al (1992) depending on the transverse coordinate z On the whole the calculation correctly predicts the magnitude and position of local maximum of heat flux near the symmetry plane taking into account the small asymmetry in the experimental data Note that near the minima of heat fluxes calculated values are lower than experimental ones probably due to effect of smoothing of experimental data in these narrow regions
32 Heat transfer on test model of Pre-X space vehicle Currently developed hypersonic aircraft have dimensions several times smaller than previously created space vehicles Shuttle and Buran This results in increase of heat load on a vehicle during flight and therefore the problem of reliable calculation of heat fluxes on the surface for such relatively small bodies is particularly important Thus the problem arises of verification of the employed physical models and numerical methods by comparing calculation results with experimental data
wwwintechopencom
Aerodynamic Heating at Hypersonic Speed
243
In 2006-2007 on TsNIImashrsquos experimental base in a piston gasdynamic wind tunnel PGU-7 a heat transfer study has been conducted on a small-scale model of Pre-X reentry demonstrator (Baiocco 2006) This vehicle is designed to obtain in flight conditions experimental data pertaining to aerothermodynamic phenomena that are not modeled in ground tests but they are critical for design of a vehicle returning from the Earthrsquos orbit In particular Pre-X demonstrator is developed to test in a real flight and in specified locations on the vehicle surface samples of reusable thermal protection materials and to assess their durability During the study thermovision measurements have been conducted of heat fluxes on the model of scale 115 at various flow regimes ndash M = 10 Re = 1106-5106 1m (Kovalev et al 2009) Processing of thermovision measurements was carried out in accordance with standard technique and composed of determination of the model surface temperature during experiment extraction from these data distributions of heat fluxes on the observed model surface and binding of the resulting thermovision frame to a three-dimensional CAD model of the demonstrator The same CAD model has been used for numerical simulation of heat transfer on the Pre-X test model As a normalizing value the heat flux q0 at the stagnation point of a sphere with radius of 70 mm is adopted which is determined using the Fay-Riddell formula Advantage of data presentation in this form is due to invariability of the relative values Q = qq0 on most model surface at variations of flow parameters
Fig 7 Calculated distributions of pressure Р = ちρinfinVinfin2 (left) and stagnation temperature T0 K (right) on surface and in shock layer (in symmetry plane and in exit section) for test model of Pre-X vehicle
On the base of the numerical solution of the Navier-Stokes equations a study was carried out of flow parameters and heat transfer for laminar flow over a test model of Pre-X space
wwwintechopencom
Heat Transfer - Mathematical Modelling Numerical Methods and Information Technology
244
vehicle for experimental conditions in the piston gasdynamic wind tunnel Mach and Reynolds numbers calculated from the free-stream parameters and the length of the model (330 mm) are Minfin = 10 and Reinfin = 7middot105 Angle of attack ndash 45deg The flap deflection angle was (as in the experiment) = 5 10 and 15deg The stagnation temperature of the free-stream flow and the wing surface temperature ndash T0infin = 1000 K and Tw = 300 K respectively An approximation of a perfect gas was used with ratio of specific heats = 14 The calculations were performed with a shock-fitting procedure ie the bow shock was considered as a discontinuity with implementation of the Rankine-Hugoniot relations (4) across it On the model surface no-slip and fixed temperature conditions were set Note that in view of the flow symmetry computations were made only for a half of the model although in the figures below for comparison with experiment the calculated data (upon reflection in the symmetry plane) are presented on the entire model The overall flow pattern obtained in the calculations over the test model of Pre-X space vehicle is shown in Fig 7 where for the case of the flap deflection angle = 15deg pressure and stagnation temperature Т0 isolines in the shock layer and on the model surface are shown It is seen that there are two areas of high pressure on the nose tip of the model (P asymp 092) and on the deflection flaps In the latter case the pressure in the flow passing through the two shock waves reaches P asymp 13 Isolines of Т0 show the size of regions where viscous forces are significant a thin boundary layer on the windward side of the model and an extensive separation zone on the leeward side The small separation zone appearing at deflection flaps although about four times thicker than the boundary layer upstream of it is almost not visible in the scale of the figure Fig 8 shows the distributions of relative heat flow Q on the windward side of the model obtained in the experiments and in the calculations at deflection angles of flaps = 5 10 and 15deg For the case = 5deg it can be noted rather good agreement between experiment and calculation in the values of heat flux in the central part of the model and on the flaps It is evident that before deflected flaps there is a region of low heat fluxes caused by near separation state (according to calculation results) of the boundary layer In analyzing the experimental data it should be taken into account the effect of apparent temperature reduction of the surface area with a large angle to the thermovision observation line It is precisely this effect that explains the fact that in the nose part of the model the experimental values of heat flux are less than the calculated ones Also narrow zones of high (at the sharp edges of the flaps) or low (in the separation zone at the root of the flaps) values of heat flux are smoothed or not visible in the experiment due to insufficient resolution of thermovision equipment The resolution capability of thermovisor is clearly visible by the size of cells in the experimental isoline pattern of heat flux in Fig 8 It should be noted that the calculations do not take into account a slit between the deflection flaps available on the test model the presence of which should lead to a decrease in the separation region in front of the flaps At an angle of flap deflection = 10deg as in the previous case = 5deg there is fairly good agreement between calculation and experiment for the values of heat flux in the central part of the model and on the flaps The calculations show that the growth of the flap deflection angle from 5deg to 10deg results in the formation of a large separation zone in front of the flaps and in a decrease in heat flux value Q from 02 to 01 At the largest angle of flap deflection = 15deg the maximum of calculated heat flux occurs in the zone of impingement of the separated boundary layer where the level of Q is 2-3 times higher than its level on the undeflected flap The coincidence of calculation results with
wwwintechopencom
Aerodynamic Heating at Hypersonic Speed
245
experimental data in the front part of the model up to the separation zone before the flaps is satisfactory On the flaps the level of heat flux in the experiment is about one and a half times more than in the calculation This difference in heat flux values is apparently due to laminar-turbulent transition in separation region induced by the deflected flaps which takes place in the experiment
δ = 5deg
δ = 10deg
δ = 15deg
Fig 8 Experimental (left) and calculated (right) heat fluxes Q = qq0 on windward side of test model of Pre-X space vehicle at different deflection angles of flaps
wwwintechopencom
Heat Transfer - Mathematical Modelling Numerical Methods and Information Technology
246
33 Flow and heat transfer on a winged space vehicle at reentry to Earths atmosphere This section presents the results of numerical simulation of flow and heat transfer on a
winged version of the small-scale reentry vehicle being developed in TsAGI (Vaganov et al
2006) moving at hypersonic speed in the Earths atmosphere Calculations were made using
two physical-chemical models of the gas medium - equilibrium and non-equilibrium
chemically reacting air
The bow shock was captured in contrast to the previous two flow cases Thus on the inflow
boundary the free-stream conditions were specified On the vehicle surface no-slip and
adiabatic wall conditions were supposed In calculations with use of the nonequilibrium air
model the vehicle surface was supposed to be low catalytical with the probability of
heterogeneous recombination of O and N atoms equal to А = 001
A computational grid was provided by Mikhalin VA (Dmitriev et al 2007) and was taken
from the inviscid flow calculation The number of points in the direction normal to the
vehicle surface has been increased to resolve the wall boundary layer Part of the results
presented below was reported in (Dmitriev et al 2007 Gorshkov et al 2008a)
Calculations were performed for two points of a reentry trajectory for which thermal loads
are close to maximum (Table 1) The angle of attack α = 35deg the vehicle length L = 9m A
grid 93times50times101 in the longitudinal transverse and circumferential directions respectively
were used in the calculations The surface grid of the vehicle is shown in Fig 9
Н
km
Vinfin
msec ReinfinL Minfin Рinfin atm Тinfin K
70 5952 346middot105 200 576middot10-5 219
63 5152 684middot105 166 159middot10-4 243
Table 1 Parameters of trajectory points
Fig 9 Surface grid of the small-scale reentry vehicle
In Fig 10a contours of total enthalpy H0 on the surface and in the shock layer near the reentry vehicle are shown On the windward side one can see the shock wave the thin wall boundary layer and the inviscid flow between them in which the values of H0 are constant In the calculations the shock wave is smeared upon 3-5 grid points and has a finite thickness due to the use of artificial dissipation In particular a local decrease in H0 in a strong shock
wwwintechopencom
Aerodynamic Heating at Hypersonic Speed
247
wave on the windward side which can be seen in the figure has no physical meaning and is due to the influence of artificial dissipation Recall that the Navier-Stokes equations do not correctly describe the shock structure at Mach numbers Mgt 15 In the shock layer on the leeward side it is visible a large area with reduced values of total enthalpy Н0ltН0infin (Н0infin ndash total enthalpy in the free-stream) which arises as a result of boundary layer separation from the vehicle surface Chemical processes occurring in the shock layer over the vehicle are illustrated in Fig 10b which shows contours of mass concentrations of oxygen atoms つо Under the considered conditions in the vicinity of the vehicle nose behind the shock wave O2 dissociation is complete On the windward side downstream the nose in the shock layer and on the surface the recombination occurs and the concentration of O decreases In contrast on the leeward side where the flow is very rarefied the level of つо remains high indicating that the process of recombination of atomic oxygen is frozen
boundary layer
shock wave
(a) (b)
Fig 10 Total enthalpy MJkg (a) and mass concentration of oxygen atoms (b) on the surface and in the shock layer near the vehicle 〉 = 63 km
0001
001
01
1
0 5 10
P
x m
equilibrium air
nonequilibrium air
equilibrium air
Fig 11 Pressure distribution P = ちρinfinVinfin2 on vehicle surface overall view (left) and in symmetry plane (right) 〉 = 63 km
wwwintechopencom
Heat Transfer - Mathematical Modelling Numerical Methods and Information Technology
248
In Fig 11 and 12 isolines of pressure heat flux qw and equilibrium radiation temperature Tw
on the vehicle surface are shown for cases of equilibrium and non-equilibrium dissociating
air Comparison of qw and Tw distributions on the vehicle surface in the symmetry plane for
two air models are depicted in Fig 13
Analysis of the calculation results shows that pressure distribution on the windward surface
of the vehicle does not depend on physical-chemical model of the gas medium - the
difference in pressure values for equilibrium and non-equilibrium air flow is 1 - 2 On the
leeward side pressure on the surface for nonequilibrium flow may be nearly two times
lower than for equilibrium flow (eg in the vicinity of the tail) This is probably due to the
fact that the effective ratio of specific heats for nonequilibrium air is greater than for
equilibrium air because in the shock layer on the leeward side nonequilibrium flow is
chemically frozen and here there is a sufficiently high concentration of atoms (see Fig 10b)
equilibrium air nonequilibrium air
Fig 12 Distributions of heat flux qw kWm2 (top) and equilibrium radiation temperature TwdegC (bottom) on the vehicle surface 〉 = 63 km
Nonequilibrium chemical processes in the shock layer and finite catalytic activity of the
vehicle surface (А = 001) significantly reduce the calculated levels of heat transfer in
comparison with the case of equilibrium air flow The most significant decrease in heat flux
is observed on the vehicle nose part (for x le 1 m) and in the vicinity of the tail For example
at the nose stagnation point the level of heat flux decreases by about 40 ndash from 640 to 385
kWm2 while the surface temperature decreases by nearly 15 ndash from 1670 to 1430 degC
Note a high heat flux level on the thin edge of the wing compared with one at the nose
stagnation point Particularly intense heating occurs at the sharp bend of the wing where the
values of heat flux and surface temperature even slightly exceed their values at the front
stagnation point In the case of equilibrium air flow the exceeding for heat flux is about 10
(710 and 640 kWm2) for temperature - 3 (1720 and 1670 degC) In the case of
nonequilibrium air flow the exceeding is more significant for heat flux - 30 (540 and 385
kWm2) for temperature - 10 (1570 and 1430 deg C)
wwwintechopencom
Aerodynamic Heating at Hypersonic Speed
249
In other parts of the vehicle surface difference in heat flux levels for the two air models is somewhat less and it decreases downstream presumably due to gradual recombination of atoms in the boundary layer at flowing along the surface in case of non-equilibrium air
1
10
100
1000
0 5 10
Qw
x m
equilibrium air
nonequilibrium air
0
1000
2000
0 5 10
Tw
x m
equilibrium air
nonequilibrium air
Fig 13 Profiles of heat flux qw kWm2 (left) and equilibrium radiation temperature TwdegC (right) on vehicle surface in symmetry plane 〉 = 63 km
A similar flow and heat flux patterns are observed for the altitude H = 70 km as seen in Fig 14 where contours of heat flux and equilibrium radiation wall temperature are shown at this altitude for the two air models For equilibrium air overall level of heat flux at 70 km is slightly higher than at 63 km For example heat flux value at the nose stagnation point is increased by 5 (675 compared with 640 kWm2) The opposite situation occurs for the model of nonequilibrium air in this case the stagnation point heat flux value at 70 km is lower than at 63 km ndash by 7 (360 and 385 kWm2 respectively)
equilibrium air nonequilibrium air
Fig 14 Distributions of heat flux qw kWm2 (top) and equilibrium radiation temperature TwdegC (bottom) on the vehicle surface 〉 = 70 km
wwwintechopencom
Heat Transfer - Mathematical Modelling Numerical Methods and Information Technology
250
4 Conclusion
A three-dimensional stationary NavierndashStokes computer code for laminar flow developed
by the author has been briefly described The code is mainly intended to calculate super-
and hypersonic flows over bodies accounting for high temperature real gas effects with
special emphasis on convective heat transfer Three gas models perfect gas equilibrium and
nonequilibrium gas mixture can be used in the calculations
In the chapter a comparison of code calculation results with experimental data is made for
two perfect gas hypersonic flow cases at wind tunnel conditions First case is a simulation of
an anomalous heat transfer on the windward side a delta wing with blunt edges On the
whole the calculation correctly predicts the magnitude and position of local maximum of
heat flux near the wing symmetry plane taking into account a small asymmetry in the
experimental data Second case is a computation of heat transfer on a test model of the Pre-X
demonstrator Satisfactory agreement with thermovision heat fluxes on the smooth
windward side and on the flaps is obtained except for the largest deflection angle of flaps
= 15deg when the level of heat flux in the experiment is about one and a half times more than
in the calculation This discrepancy is apparently due to laminar-turbulent transition in
separation region induced by the deflected flaps which takes place in the experiment
Third flow case concerns chemically reacting air flow at equilibrium or nonequilibrium
conditions Flowfield and convective heat transfer parameters for a winged shape of a small-
scale reentry vehicle are calculated for two points of a reentry trajectory in the Earthrsquos
atmosphere Heat flux and equilibrium radiation temperature distributions on the vehicle
surface are obtained Also regions of maximal thermal loadings are localized
Calculations show that for nonequilibrium air flow the use of a low catalytic coating (with
probability of heterogeneous recombination of atoms А = 001) on the vehicle surface
enables to decrease considerably the level of heat fluxes in regions of maximal heat transfer
in the nose part and on the wing edges in comparison with equilibrium air flow For
example for trajectory points with maximal thermal load a reduction of up to 40 in heat
flux (which results in a 15 reduction of equilibrium radiation wall temperature) can be
obtained at the vehicle nose
5 Acknowledgments
The author is grateful to Kovalev RV Marinin VP and Vlasov VI for delivering
thermovision data on test model of Pre-X vehicle and also to Churakov DA and Mihalin
VA for providing computational grids
6 References
Baiocco P Guedron S Plotard P amp Moulin J (2006) The Pre-X atmospheric re-entry
experimental lifting body Program status and system synthesis Proceedings of 57th
International Astronautical Congress 2-6 October 2006 IAC-06-D2P22
Churakov DA Gorshkov AB Kovalev RV Vlasov VI Beloshitsky AV Dyadkin
AA amp Zhurin SV (2008) Heat Transfer of Reentry Vehicles during Atmosphere
Flight Proceedings of 6-th European Symposium on Aerothermodynamics for Space
Vehicles Versailles France 3 - 6 November 2008
wwwintechopencom
Aerodynamic Heating at Hypersonic Speed
251
Dmitriev VG Vaganov AV Gorshkov AB Lapygin VI Galaktionov AYu amp
Mikhalin VA (2007) Analysis of Aerothermodynamic Parameters of Reusable
Space Wing Vehicle Proceedings of 2nd European Conference for Aero-Space Sciences
Brussels Belgium July 1-6 2007
Gorshkov AB (1997) Calculation of Base Heat Transfer Behind Thin Cone-Shaped Bodies
Cosmonautics and Rocket Engineering No 11 (1997) pp 13-20 (in Russian)
Gorshkov AB Kovalev R V Vlasov V I amp Zemlyanskiy B A (2008a) Simulation of
Heat Transfer to Space Vehicles during a Gliding Reentry into Earthrsquos
Atmosphere Proceedings of 14th International Conference on Methods of Aerophysical
Research (ICMAR-2008) Novosibirsk Russia 30 June - 06 July 2008
Gorshkov AB Kovalev R V Vlasov amp V I Zemlyanskiy B A (2008b) Heat Transfer
Investigation for Hypersonic Flow over Experimental Model of Pre-X Reentry
Vehicle Proceedings of 7th Sino-Russian High-Speed Flow Conference (SRHFC-7)
Novosibirsk Russia 1 - 3 July 2008
Grantham WL (1970) Flight results of a 25000 fps re-entry experiment NASA TN D 6062
Gubanova OI Zemlyansky BA Lessin AB Lunev VV Nikulin AN amp Syusin AV
(1992) Anomalous heat transfer on the windward side of a delta wing with a blunt
tip in hypersonic flow In Aerothermodynamics of aerospace systems Pt 1 pp 188-196
Moscow TsAGI (in Russian)
Hoffmann KA Chiang ST (2000) Computational fluid dynamics Vol 2 Engineering
Educational Systems ISBN 0-9623731-3-3 Kansas USA
Inouye Y (1995) OREX flight ndash quick report and lessons learned Proceedings of 2nd
European Symposium on Aerothermodynamics for Space Vehicles pp 271-279 ESTEC
Noordwik The Netherlands Europe Space Agency (November 1994)
Kovalev RV Kislykh VV Kolozezniy AE Kudryavtsev VV Marinin VP Vlasov
VI amp Zemliansky BA (2009) Experimental studies of Pre-X vehicle heat transfer
in PGU-7 test facility 3rd European Conference for Aerospace Sciences (EUCASS-2009)
Versailles France 6-9 July 2009
Lesin AB amp Lunev VV (1994) Heat transfer peaks on a blunt-nosed triangular plate in
hypersonic flow Fluid Dynamics Vol 29 No 2 (April 1994) pp 258-262 ISSN
0015-4628
Mason EA amp Saxena SC (1958) Approximate Formula for the Thermal Conductivity of
Gas Mixtures Phys Fluids Vol 1 No 5 (1958) pp 361-369
Pulliam TH (1986) Artificial dissipation models for the Euler equations AIAA Journal
Vol24 No 12 (December 1986) pp 1931-1940 ISSN 0001-1452
Vaganov AV Dmitriev VG Zadonsky SM Kireev AY Skuratov AS amp Stepanov
EA (2006) Estimations of low-sized winged reentry vehicle heat regimes on the
stage of its designing Physico-chemical kinetics in gas dynamics
wwwchemphysedurupdf2006-11-20-002pdf (in Russian)
Vlasov VI Gorshkov AB Kovalev RV amp Plastinin YuA (1997) Theoretical studies of
air ionization and NO vibrational excitation in low density hypersonic flow around
re-entry bodies AIAA Paper No 97-2582 (1997)
Vlasov V I amp Gorshkov A B (2001) Comparison of the Calculated Results for Hypersonic
Flow Past Blunt Bodies with the OREX Flight Test Data Fluid Dynamics Vol 36
No 5 (October 2001) pp 812-819 ISSN 0015-4628
wwwintechopencom
Heat Transfer - Mathematical Modelling Numerical Methods and Information Technology
252
Vlasov VI Gorshkov AB Kovalev RV amp Lunev VV (2009) Thin triangular blunt-
nosed plate in a viscous hypersonic flow Fluid Dynamics Vol 44 No 4 (August
2009) pp 596-605 ISSN 0015-4628
Wilke C (1950) A Viscosity Equation for Gas Mixtures JChemPhys Vol 18 No 4 (1950)
pp517-519
Yoon S amp Jameson A (1987) An LU-SSOR Scheme for the Euler and Navier-Stokes
Equations AIAA Paper No 87-0600 (1987)
wwwintechopencom
Heat Transfer - Mathematical Modelling Numerical Methods andInformation TechnologyEdited by Prof Aziz Belmiloudi
ISBN 978-953-307-550-1Hard cover 642 pagesPublisher InTechPublished online 14 February 2011Published in print edition February 2011
InTech EuropeUniversity Campus STeP Ri Slavka Krautzeka 83A 51000 Rijeka Croatia Phone +385 (51) 770 447 Fax +385 (51) 686 166
InTech ChinaUnit 405 Office Block Hotel Equatorial Shanghai No65 Yan An Road (West) Shanghai 200040 China
Phone +86-21-62489820 Fax +86-21-62489821
Over the past few decades there has been a prolific increase in research and development in area of heattransfer heat exchangers and their associated technologies This book is a collection of current research inthe above mentioned areas and describes modelling numerical methods simulation and informationtechnology with modern ideas and methods to analyse and enhance heat transfer for single and multiphasesystems The topics considered include various basic concepts of heat transfer the fundamental modes ofheat transfer (namely conduction convection and radiation) thermophysical properties computationalmethodologies control stabilization and optimization problems condensation boiling and freezing with manyreal-world problems and important modern applications The book is divided in four sections InverseStabilization and Optimization Problems Numerical Methods and Calculations Heat Transfer in MiniMicroSystems Energy Transfer and Solid Materials and each section discusses various issues methods andapplications in accordance with the subjects The combination of fundamental approach with many importantpractical applications of current interest will make this book of interest to researchers scientists engineers andgraduate students in many disciplines who make use of mathematical modelling inverse problemsimplementation of recently developed numerical methods in this multidisciplinary field as well as toexperimental and theoretical researchers in the field of heat and mass transfer
How to referenceIn order to correctly reference this scholarly work feel free to copy and paste the following
Andrey B Gorshkov (2011) Aerodynamic Heating at Hypersonic Speed Heat Transfer - MathematicalModelling Numerical Methods and Information Technology Prof Aziz Belmiloudi (Ed) ISBN 978-953-307-550-1 InTech Available from httpwwwintechopencombooksheat-transfer-mathematical-modelling-numerical-methods-and-information-technologyaerodynamic-heating-at-hypersonic-speed
wwwintechopencom
wwwintechopencom
copy 2011 The Author(s) Licensee IntechOpen This chapter is distributedunder the terms of the Creative Commons Attribution-NonCommercial-ShareAlike-30 License which permits use distribution and reproduction fornon-commercial purposes provided the original is properly cited andderivative works building on this content are distributed under the samelicense
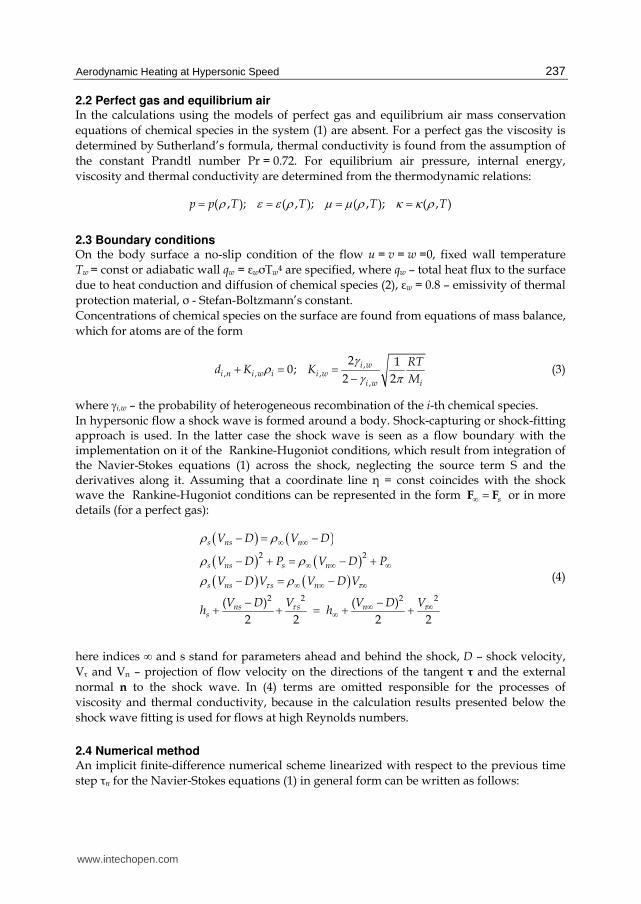
Aerodynamic Heating at Hypersonic Speed
237
22 Perfect gas and equilibrium air In the calculations using the models of perfect gas and equilibrium air mass conservation
equations of chemical species in the system (1) are absent For a perfect gas the viscosity is
determined by Sutherlandrsquos formula thermal conductivity is found from the assumption of
the constant Prandtl number Pr = 072 For equilibrium air pressure internal energy
viscosity and thermal conductivity are determined from the thermodynamic relations
( ) ( ) ( ) ( )p p T T T Tρ ε ε ρ μ μ ρ κ κ ρ= = = =
23 Boundary conditions On the body surface a no-slip condition of the flow u = v = w =0 fixed wall temperature
Tw = const or adiabatic wall qw = wTw4 are specified where qw ndash total heat flux to the surface
due to heat conduction and diffusion of chemical species (2) w = 08 ndash emissivity of thermal
protection material - Stefan-Boltzmannrsquos constant
Concentrations of chemical species on the surface are found from equations of mass balance
which for atoms are of the form
2 10
2 2i w
i n i w i i wi w i
RTd K K
M
γρ γ π+ = = minus (3)
where γiw ndash the probability of heterogeneous recombination of the i-th chemical species
In hypersonic flow a shock wave is formed around a body Shock-capturing or shock-fitting approach is used In the latter case the shock wave is seen as a flow boundary with the implementation on it of the Rankine-Hugoniot conditions which result from integration of the Navier-Stokes equations (1) across the shock neglecting the source term S and the derivatives along it Assuming that a coordinate line = const coincides with the shock wave the Rankine-Hugoniot conditions can be represented in the form sinfin =F F or in more details (for a perfect gas)
( ) ( )( ) ( )( ) ( )
2 2
2 2 2 2( ) ( )
2 2 2 2
s ns n
s ns s n
s ns s n
ns s ns
V D V D
V D P V D P
V D V V D V
V D V V D Vh h
τ ττ τ
ρ ρρ ρρ ρ
infin infininfin infin infin
infin infin infininfin infininfin
minus = minusminus + = minus +minus = minus
minus minus+ + = + + (4)
here indices infin and s stand for parameters ahead and behind the shock D ndash shock velocity
V and Vn ndash projection of flow velocity on the directions of the tangent τ and the external
normal n to the shock wave In (4) terms are omitted responsible for the processes of
viscosity and thermal conductivity because in the calculation results presented below the
shock wave fitting is used for flows at high Reynolds numbers
24 Numerical method An implicit finite-difference numerical scheme linearized with respect to the previous time
step n for the Navier-Stokes equations (1) in general form can be written as follows
wwwintechopencom
Heat Transfer - Mathematical Modelling Numerical Methods and Information Technology
238
nξ η ζτ δ δ δ τ⎡ ⎤+ Δ + + minus Δ = minusΔ⎣ ⎦I A B C T Q R (5)
( ) ( ) ( ) ( ) n n n nn ξ η ζδ δ δ part part part part part part part part= + + minus = = = =R E F G S A E Q B F Q C G Q T S Q
Here symbols δξ δ and δ denote finite-difference operators which approximate the partial derivatives partpartξ partpart and partpart the index and indicates that the value is taken at time n I ndash identity matrix ΔQ = Qn +1 - Qn ndash increment vector of the conservative variables at time-step Δ = n+1 ndash n Let us consider first the inviscid flow Yoon amp Jameson (1987) have proposed a method of approximate factorization of the algebraic equations (5) ndash Lower-Upper Symmetric Successive OverRelaxation (LU-SSOR) scheme Suppose that in the transformed coordinates (ξ ζ) the grid is uniform and grid spacing in all directions is unity Δξ=Δ=Δζ=1 Then the LU-SSOR scheme at a point (ijk) of a finite-difference grid can be written as
1 nminus Δ = minusLD U Q R (6)
1 1 1 1 1 1
1 ( )
i j k i j k i j k i j k i j k i j k
β ρ ρ ρτ+ + + minus minus minusminus minus minus + + +
⎧ ⎫= + = + = + + + minus⎨ ⎬Δ⎩ ⎭= minus minus minus = + +
A B CL D L U D U D I T
L A B C U A B C
where
2 2 2
2 2 2
2 2 2
( ) 2
( ) 2
( ) 2
x y z
x y z
x y z
U
V
W
βρ ρ ξ ξ ξβρ ρ η η ηβρ ρ ζ ζ ζ
plusmnplusmnplusmn
= plusmn = + + += plusmn = + + += plusmn = + + +
A A
B B
C C
A A I
B B I
C C I
a
a
a
Here the indices of the quantities at the point (ijk) are omitted for brevity βge1 is a constant ρA ρB ρC ndash the spectral radii of the ldquoinviscidrdquo parts of the Jacobians A B и C а ndash the speed of sound Inversion of the equation system (6) is made in two steps
L Q R nΔ = minus (7a)
U Q D QΔ = Δ (7b)
It is seen from (6) that for non chemically reacting flows (S=0 T=0) LU-SSOR scheme does not require inversion of any matrices For reacting flows due to the presence of the Jacobian of the chemical source Tne0 the forward and back steps in (7) require generally speaking matrix inversion However calculations have shown that if the conditions are not too close to equilibrium then in the chemical Jacobian Т one can retain only diagonal terms which contain solely the partial derivatives with respect to concentrations of chemical species In this approximation scheme (6) leads to the scalar diagonal inversion also for the case of chemically reacting flows Thus calculation time grows directly proportionally to the number of chemical species concentrations This is important in calculations of complex flows of reacting gas mixtures when the number of considered chemical species is large In the case of viscous flow so as not to disrupt the diagonal structure of scheme (6) instead of the ldquoviscousrdquo Jacobians Av Bv и Cv their spectral radii are used
wwwintechopencom
Aerodynamic Heating at Hypersonic Speed
239
( ) ( ) ( )2 2 2 2 2 2 2 2 2 Pr Pr Pr
v x y z v x y z v x y z
γ μ γ μ γ μρ ξ ξ ξ ρ η η η ρ ζ ζ ζρ ρ ρ= + + = + + = + +CA B
In the finite-difference equation (6) central differences are employed both for viscous and convective fluxes The use of central differences to approximate the convective terms can cause non-physical oscillations of the flow parameters at high Reynolds numbers To suppress such numerical oscillations artificial dissipation terms were added in the right part R of (6) according to Pulliam (1986) In calculations presented below it was assumed that the derivatives partξpartt partpartt and partpartt are zero and Δ = infin Since steady flow is considered these assumptions do not affect the final result
3 Calculation results
31 Flow and heat transfer on blunt delta wing In thermovision experiments (Gubanova et al 1992) in hypersonic flow past a delta wing with blunt nose and edges two regions of elevated heat were observed on its windward surface At a distance of approximately 12-15 r from the nose of the wing (r ndash nose radius) there were narrow bands of high heat fluxes which extended almost parallel to the symmetry plane at a small interval (3-5 r) from it to the final section of the wing at х asymp 100 r (see Fig 1 in which the calculated distribution of heat fluxes is shown at the experimental conditions) The level of heat fluxes in the bands was approximately twice the value of background heat transfer corresponding to the level for a delta plate with sharp edges under the same conditions It turned out that this effect exists in a fairly narrow range of flow parameters In particular on the same wing but with a sharp tip a similar increase in heat flux was not observed This effect was explained by the interaction of shock waves arising at the tip and on the blunt edges of the wing (Gubanova et al 1992 Lesin amp Lunev 1994) In this section numerical results calculated for the experimental conditions are presented and compared with measured heat flux values (see also (Vlasov et al 2009))
Fig 1 Calculated distribution of non-dimensional heat flux Q = qq0 on the windward side of the blunt delta wing q0 ndash heat flux at the stagnation point of a sphere with a radius equal to the nose radius of the wing
Perfect gas hypersonic flow ( = 14) past a delta wing with a spherical nose and cylindrical edges of the same radius is considered Mach and Reynolds numbers calculated with free stream flow parameters and the wing nose radius are Minfin = 14 and Reinfin = 14middot104 angle of attack α = 10deg wing sweep angle λ = 75deg The free stream stagnation temperature T0infin = 1205 K the wall temperature Tw = 300 K Due to the symmetry of flow only half of the wing is computed The flow calculation was performed with shock-fitting procedure the computational grid is 120times40times119 (in the longitudinal transverse and circumferential
wwwintechopencom
Heat Transfer - Mathematical Modelling Numerical Methods and Information Technology
240
directions respectively see Fig 2) Below in this section all quantities with a dimension of length unless otherwise specified are normalized to the wing nose radius r
Fig 2 The computational grid on the wing surface in the plane of symmetry (z = 0) and in the exit section for the converged numerical solution
Fig 3 Streamlines near the windward surface of the wing Top ndash at a distance of one grid step from the wall bottom ndash at the outer edge of the boundary layer
Calculated patterns of streamlines near the windward surface of the wing at a distance of one grid step from the wall and at the outer edge of the boundary layer are shown in Fig 3 The streamlines flowing down from the wing edge on the windward plane at almost constant pressure form the line of diverging flow (line A-A) along which there are bands of elevated heat fluxes At the symmetry plane a line of converging streamlines is realized along the entire length of the wing but upstream the shock interaction point A flow impinges on the symmetry plane from the edges and downstream from A ndash from the diverging line A-A A characteristic feature of the considered case is that the distribution of heat fluxes on the windward side is mainly determined by the values of convergence and divergence of streamlines at almost constant pressure (see Fig 4 which shows the distribution of pressure and heat flux on the windward side in several sections x = const) Local maxima of heat fluxes near symmetry plane appear only at xgt 15 near the line z = 4 (after the nose shock wave intersects with the shock wave from the edges) and the relative intensity of these heat peaks grows with increasing distance from the nose (Fig 4b)
wwwintechopencom
Aerodynamic Heating at Hypersonic Speed
241
003
008
0 05 1
P
1
2 34
5
z
0
005
01
015
0 5 10
Q
z
12
34
(a) (b)
Fig 4 Pressure distribution Р = pρinfinVinfin2 (a) and heat flux Q = qq0 (b) on windward side of wing in sections 1-5 ndash x = 10 20 30 50 90 z= zzmax zmax ndash wingspan in section х = const
Comparison of the upper and lower parts of Fig 3 shows that the flow near the wall and at the outer edge of the boundary layer are noticeably different the streamlines near the wall are directed to the symmetry plane (converging) and in inviscid region ndash from it (diverging) It follows that the velocity component directed along the wing chord changes sign across the boundary layer which indicates the existence of transverse vortex (cross separation flow) in the boundary layer This is illustrated in Fig 5a which shows the projection of streamlines on the plane of the cross section at x = 90
400
1200
1200
700
1000T
0
(a) (b)
Fig 5 Projection of streamlines (a) and isolines of stagnation temperature T0 K (b) in cross section x = 90
The distribution of the boundary layer thickness is clearly seen in Fig 5b which shows the contours of the stagnation temperature T0 in the cross section x = 90 On the windward side of the wing minimum thickness of the boundary layer is located on the diverging line (line A-A in Fig 3) On the left and on the right sides of the diverging line there are converging lines with a thicker boundary layer (about 2 and 3 times respectively) One of the
wwwintechopencom
Heat Transfer - Mathematical Modelling Numerical Methods and Information Technology
242
converging lines is the symmetry plane Here the boundary layer thickness on the windward side reaches a maximum amounting to about one-third of the shock layer thickness Near the wing edge because of the expansion and acceleration of the flow the boundary layer thickness decreases sharply (at the edge it is almost 20 times less than at the symmetry plane on the windward side) On the leeward side of the wing flow separation occurs and the concept of the boundary layer loses its meaning Here scope of viscous flow is half the shock layer The shape of calculated shock wave in Fig 6a induced by the wing nose as a blunt body is determined by the law of the explosive analogy so that some front part of the wing
x le xA asymp 15 will be located inside the initially axisymmetric shock wave The coordinate of point A (xA) is located in the vicinity of interaction region of shock waves induced by the nose and the edges of the wing Here the profiles of pressure and heat flux along the edge are local maxima
0
10
000
005
0 15 30
zP
Q2
x
shock wing edge
P
Q
xA
0
005
-1 -05 0 05 1
Q
z
calculation
experiment
(a) (b)
Fig 6 Profiles of pressure heat flux and the shock wave along the wing edge (a) and distribution of heat fluxes in cross section x = 90 (b)
In Fig 6b the distribution of computed heat fluxes qq0 in the neighborhood of the wing end section at x = 90 is presented in comparison with the experiment of Gubanova et al (1992) depending on the transverse coordinate z On the whole the calculation correctly predicts the magnitude and position of local maximum of heat flux near the symmetry plane taking into account the small asymmetry in the experimental data Note that near the minima of heat fluxes calculated values are lower than experimental ones probably due to effect of smoothing of experimental data in these narrow regions
32 Heat transfer on test model of Pre-X space vehicle Currently developed hypersonic aircraft have dimensions several times smaller than previously created space vehicles Shuttle and Buran This results in increase of heat load on a vehicle during flight and therefore the problem of reliable calculation of heat fluxes on the surface for such relatively small bodies is particularly important Thus the problem arises of verification of the employed physical models and numerical methods by comparing calculation results with experimental data
wwwintechopencom
Aerodynamic Heating at Hypersonic Speed
243
In 2006-2007 on TsNIImashrsquos experimental base in a piston gasdynamic wind tunnel PGU-7 a heat transfer study has been conducted on a small-scale model of Pre-X reentry demonstrator (Baiocco 2006) This vehicle is designed to obtain in flight conditions experimental data pertaining to aerothermodynamic phenomena that are not modeled in ground tests but they are critical for design of a vehicle returning from the Earthrsquos orbit In particular Pre-X demonstrator is developed to test in a real flight and in specified locations on the vehicle surface samples of reusable thermal protection materials and to assess their durability During the study thermovision measurements have been conducted of heat fluxes on the model of scale 115 at various flow regimes ndash M = 10 Re = 1106-5106 1m (Kovalev et al 2009) Processing of thermovision measurements was carried out in accordance with standard technique and composed of determination of the model surface temperature during experiment extraction from these data distributions of heat fluxes on the observed model surface and binding of the resulting thermovision frame to a three-dimensional CAD model of the demonstrator The same CAD model has been used for numerical simulation of heat transfer on the Pre-X test model As a normalizing value the heat flux q0 at the stagnation point of a sphere with radius of 70 mm is adopted which is determined using the Fay-Riddell formula Advantage of data presentation in this form is due to invariability of the relative values Q = qq0 on most model surface at variations of flow parameters
Fig 7 Calculated distributions of pressure Р = ちρinfinVinfin2 (left) and stagnation temperature T0 K (right) on surface and in shock layer (in symmetry plane and in exit section) for test model of Pre-X vehicle
On the base of the numerical solution of the Navier-Stokes equations a study was carried out of flow parameters and heat transfer for laminar flow over a test model of Pre-X space
wwwintechopencom
Heat Transfer - Mathematical Modelling Numerical Methods and Information Technology
244
vehicle for experimental conditions in the piston gasdynamic wind tunnel Mach and Reynolds numbers calculated from the free-stream parameters and the length of the model (330 mm) are Minfin = 10 and Reinfin = 7middot105 Angle of attack ndash 45deg The flap deflection angle was (as in the experiment) = 5 10 and 15deg The stagnation temperature of the free-stream flow and the wing surface temperature ndash T0infin = 1000 K and Tw = 300 K respectively An approximation of a perfect gas was used with ratio of specific heats = 14 The calculations were performed with a shock-fitting procedure ie the bow shock was considered as a discontinuity with implementation of the Rankine-Hugoniot relations (4) across it On the model surface no-slip and fixed temperature conditions were set Note that in view of the flow symmetry computations were made only for a half of the model although in the figures below for comparison with experiment the calculated data (upon reflection in the symmetry plane) are presented on the entire model The overall flow pattern obtained in the calculations over the test model of Pre-X space vehicle is shown in Fig 7 where for the case of the flap deflection angle = 15deg pressure and stagnation temperature Т0 isolines in the shock layer and on the model surface are shown It is seen that there are two areas of high pressure on the nose tip of the model (P asymp 092) and on the deflection flaps In the latter case the pressure in the flow passing through the two shock waves reaches P asymp 13 Isolines of Т0 show the size of regions where viscous forces are significant a thin boundary layer on the windward side of the model and an extensive separation zone on the leeward side The small separation zone appearing at deflection flaps although about four times thicker than the boundary layer upstream of it is almost not visible in the scale of the figure Fig 8 shows the distributions of relative heat flow Q on the windward side of the model obtained in the experiments and in the calculations at deflection angles of flaps = 5 10 and 15deg For the case = 5deg it can be noted rather good agreement between experiment and calculation in the values of heat flux in the central part of the model and on the flaps It is evident that before deflected flaps there is a region of low heat fluxes caused by near separation state (according to calculation results) of the boundary layer In analyzing the experimental data it should be taken into account the effect of apparent temperature reduction of the surface area with a large angle to the thermovision observation line It is precisely this effect that explains the fact that in the nose part of the model the experimental values of heat flux are less than the calculated ones Also narrow zones of high (at the sharp edges of the flaps) or low (in the separation zone at the root of the flaps) values of heat flux are smoothed or not visible in the experiment due to insufficient resolution of thermovision equipment The resolution capability of thermovisor is clearly visible by the size of cells in the experimental isoline pattern of heat flux in Fig 8 It should be noted that the calculations do not take into account a slit between the deflection flaps available on the test model the presence of which should lead to a decrease in the separation region in front of the flaps At an angle of flap deflection = 10deg as in the previous case = 5deg there is fairly good agreement between calculation and experiment for the values of heat flux in the central part of the model and on the flaps The calculations show that the growth of the flap deflection angle from 5deg to 10deg results in the formation of a large separation zone in front of the flaps and in a decrease in heat flux value Q from 02 to 01 At the largest angle of flap deflection = 15deg the maximum of calculated heat flux occurs in the zone of impingement of the separated boundary layer where the level of Q is 2-3 times higher than its level on the undeflected flap The coincidence of calculation results with
wwwintechopencom
Aerodynamic Heating at Hypersonic Speed
245
experimental data in the front part of the model up to the separation zone before the flaps is satisfactory On the flaps the level of heat flux in the experiment is about one and a half times more than in the calculation This difference in heat flux values is apparently due to laminar-turbulent transition in separation region induced by the deflected flaps which takes place in the experiment
δ = 5deg
δ = 10deg
δ = 15deg
Fig 8 Experimental (left) and calculated (right) heat fluxes Q = qq0 on windward side of test model of Pre-X space vehicle at different deflection angles of flaps
wwwintechopencom
Heat Transfer - Mathematical Modelling Numerical Methods and Information Technology
246
33 Flow and heat transfer on a winged space vehicle at reentry to Earths atmosphere This section presents the results of numerical simulation of flow and heat transfer on a
winged version of the small-scale reentry vehicle being developed in TsAGI (Vaganov et al
2006) moving at hypersonic speed in the Earths atmosphere Calculations were made using
two physical-chemical models of the gas medium - equilibrium and non-equilibrium
chemically reacting air
The bow shock was captured in contrast to the previous two flow cases Thus on the inflow
boundary the free-stream conditions were specified On the vehicle surface no-slip and
adiabatic wall conditions were supposed In calculations with use of the nonequilibrium air
model the vehicle surface was supposed to be low catalytical with the probability of
heterogeneous recombination of O and N atoms equal to А = 001
A computational grid was provided by Mikhalin VA (Dmitriev et al 2007) and was taken
from the inviscid flow calculation The number of points in the direction normal to the
vehicle surface has been increased to resolve the wall boundary layer Part of the results
presented below was reported in (Dmitriev et al 2007 Gorshkov et al 2008a)
Calculations were performed for two points of a reentry trajectory for which thermal loads
are close to maximum (Table 1) The angle of attack α = 35deg the vehicle length L = 9m A
grid 93times50times101 in the longitudinal transverse and circumferential directions respectively
were used in the calculations The surface grid of the vehicle is shown in Fig 9
Н
km
Vinfin
msec ReinfinL Minfin Рinfin atm Тinfin K
70 5952 346middot105 200 576middot10-5 219
63 5152 684middot105 166 159middot10-4 243
Table 1 Parameters of trajectory points
Fig 9 Surface grid of the small-scale reentry vehicle
In Fig 10a contours of total enthalpy H0 on the surface and in the shock layer near the reentry vehicle are shown On the windward side one can see the shock wave the thin wall boundary layer and the inviscid flow between them in which the values of H0 are constant In the calculations the shock wave is smeared upon 3-5 grid points and has a finite thickness due to the use of artificial dissipation In particular a local decrease in H0 in a strong shock
wwwintechopencom
Aerodynamic Heating at Hypersonic Speed
247
wave on the windward side which can be seen in the figure has no physical meaning and is due to the influence of artificial dissipation Recall that the Navier-Stokes equations do not correctly describe the shock structure at Mach numbers Mgt 15 In the shock layer on the leeward side it is visible a large area with reduced values of total enthalpy Н0ltН0infin (Н0infin ndash total enthalpy in the free-stream) which arises as a result of boundary layer separation from the vehicle surface Chemical processes occurring in the shock layer over the vehicle are illustrated in Fig 10b which shows contours of mass concentrations of oxygen atoms つо Under the considered conditions in the vicinity of the vehicle nose behind the shock wave O2 dissociation is complete On the windward side downstream the nose in the shock layer and on the surface the recombination occurs and the concentration of O decreases In contrast on the leeward side where the flow is very rarefied the level of つо remains high indicating that the process of recombination of atomic oxygen is frozen
boundary layer
shock wave
(a) (b)
Fig 10 Total enthalpy MJkg (a) and mass concentration of oxygen atoms (b) on the surface and in the shock layer near the vehicle 〉 = 63 km
0001
001
01
1
0 5 10
P
x m
equilibrium air
nonequilibrium air
equilibrium air
Fig 11 Pressure distribution P = ちρinfinVinfin2 on vehicle surface overall view (left) and in symmetry plane (right) 〉 = 63 km
wwwintechopencom
Heat Transfer - Mathematical Modelling Numerical Methods and Information Technology
248
In Fig 11 and 12 isolines of pressure heat flux qw and equilibrium radiation temperature Tw
on the vehicle surface are shown for cases of equilibrium and non-equilibrium dissociating
air Comparison of qw and Tw distributions on the vehicle surface in the symmetry plane for
two air models are depicted in Fig 13
Analysis of the calculation results shows that pressure distribution on the windward surface
of the vehicle does not depend on physical-chemical model of the gas medium - the
difference in pressure values for equilibrium and non-equilibrium air flow is 1 - 2 On the
leeward side pressure on the surface for nonequilibrium flow may be nearly two times
lower than for equilibrium flow (eg in the vicinity of the tail) This is probably due to the
fact that the effective ratio of specific heats for nonequilibrium air is greater than for
equilibrium air because in the shock layer on the leeward side nonequilibrium flow is
chemically frozen and here there is a sufficiently high concentration of atoms (see Fig 10b)
equilibrium air nonequilibrium air
Fig 12 Distributions of heat flux qw kWm2 (top) and equilibrium radiation temperature TwdegC (bottom) on the vehicle surface 〉 = 63 km
Nonequilibrium chemical processes in the shock layer and finite catalytic activity of the
vehicle surface (А = 001) significantly reduce the calculated levels of heat transfer in
comparison with the case of equilibrium air flow The most significant decrease in heat flux
is observed on the vehicle nose part (for x le 1 m) and in the vicinity of the tail For example
at the nose stagnation point the level of heat flux decreases by about 40 ndash from 640 to 385
kWm2 while the surface temperature decreases by nearly 15 ndash from 1670 to 1430 degC
Note a high heat flux level on the thin edge of the wing compared with one at the nose
stagnation point Particularly intense heating occurs at the sharp bend of the wing where the
values of heat flux and surface temperature even slightly exceed their values at the front
stagnation point In the case of equilibrium air flow the exceeding for heat flux is about 10
(710 and 640 kWm2) for temperature - 3 (1720 and 1670 degC) In the case of
nonequilibrium air flow the exceeding is more significant for heat flux - 30 (540 and 385
kWm2) for temperature - 10 (1570 and 1430 deg C)
wwwintechopencom
Aerodynamic Heating at Hypersonic Speed
249
In other parts of the vehicle surface difference in heat flux levels for the two air models is somewhat less and it decreases downstream presumably due to gradual recombination of atoms in the boundary layer at flowing along the surface in case of non-equilibrium air
1
10
100
1000
0 5 10
Qw
x m
equilibrium air
nonequilibrium air
0
1000
2000
0 5 10
Tw
x m
equilibrium air
nonequilibrium air
Fig 13 Profiles of heat flux qw kWm2 (left) and equilibrium radiation temperature TwdegC (right) on vehicle surface in symmetry plane 〉 = 63 km
A similar flow and heat flux patterns are observed for the altitude H = 70 km as seen in Fig 14 where contours of heat flux and equilibrium radiation wall temperature are shown at this altitude for the two air models For equilibrium air overall level of heat flux at 70 km is slightly higher than at 63 km For example heat flux value at the nose stagnation point is increased by 5 (675 compared with 640 kWm2) The opposite situation occurs for the model of nonequilibrium air in this case the stagnation point heat flux value at 70 km is lower than at 63 km ndash by 7 (360 and 385 kWm2 respectively)
equilibrium air nonequilibrium air
Fig 14 Distributions of heat flux qw kWm2 (top) and equilibrium radiation temperature TwdegC (bottom) on the vehicle surface 〉 = 70 km
wwwintechopencom
Heat Transfer - Mathematical Modelling Numerical Methods and Information Technology
250
4 Conclusion
A three-dimensional stationary NavierndashStokes computer code for laminar flow developed
by the author has been briefly described The code is mainly intended to calculate super-
and hypersonic flows over bodies accounting for high temperature real gas effects with
special emphasis on convective heat transfer Three gas models perfect gas equilibrium and
nonequilibrium gas mixture can be used in the calculations
In the chapter a comparison of code calculation results with experimental data is made for
two perfect gas hypersonic flow cases at wind tunnel conditions First case is a simulation of
an anomalous heat transfer on the windward side a delta wing with blunt edges On the
whole the calculation correctly predicts the magnitude and position of local maximum of
heat flux near the wing symmetry plane taking into account a small asymmetry in the
experimental data Second case is a computation of heat transfer on a test model of the Pre-X
demonstrator Satisfactory agreement with thermovision heat fluxes on the smooth
windward side and on the flaps is obtained except for the largest deflection angle of flaps
= 15deg when the level of heat flux in the experiment is about one and a half times more than
in the calculation This discrepancy is apparently due to laminar-turbulent transition in
separation region induced by the deflected flaps which takes place in the experiment
Third flow case concerns chemically reacting air flow at equilibrium or nonequilibrium
conditions Flowfield and convective heat transfer parameters for a winged shape of a small-
scale reentry vehicle are calculated for two points of a reentry trajectory in the Earthrsquos
atmosphere Heat flux and equilibrium radiation temperature distributions on the vehicle
surface are obtained Also regions of maximal thermal loadings are localized
Calculations show that for nonequilibrium air flow the use of a low catalytic coating (with
probability of heterogeneous recombination of atoms А = 001) on the vehicle surface
enables to decrease considerably the level of heat fluxes in regions of maximal heat transfer
in the nose part and on the wing edges in comparison with equilibrium air flow For
example for trajectory points with maximal thermal load a reduction of up to 40 in heat
flux (which results in a 15 reduction of equilibrium radiation wall temperature) can be
obtained at the vehicle nose
5 Acknowledgments
The author is grateful to Kovalev RV Marinin VP and Vlasov VI for delivering
thermovision data on test model of Pre-X vehicle and also to Churakov DA and Mihalin
VA for providing computational grids
6 References
Baiocco P Guedron S Plotard P amp Moulin J (2006) The Pre-X atmospheric re-entry
experimental lifting body Program status and system synthesis Proceedings of 57th
International Astronautical Congress 2-6 October 2006 IAC-06-D2P22
Churakov DA Gorshkov AB Kovalev RV Vlasov VI Beloshitsky AV Dyadkin
AA amp Zhurin SV (2008) Heat Transfer of Reentry Vehicles during Atmosphere
Flight Proceedings of 6-th European Symposium on Aerothermodynamics for Space
Vehicles Versailles France 3 - 6 November 2008
wwwintechopencom
Aerodynamic Heating at Hypersonic Speed
251
Dmitriev VG Vaganov AV Gorshkov AB Lapygin VI Galaktionov AYu amp
Mikhalin VA (2007) Analysis of Aerothermodynamic Parameters of Reusable
Space Wing Vehicle Proceedings of 2nd European Conference for Aero-Space Sciences
Brussels Belgium July 1-6 2007
Gorshkov AB (1997) Calculation of Base Heat Transfer Behind Thin Cone-Shaped Bodies
Cosmonautics and Rocket Engineering No 11 (1997) pp 13-20 (in Russian)
Gorshkov AB Kovalev R V Vlasov V I amp Zemlyanskiy B A (2008a) Simulation of
Heat Transfer to Space Vehicles during a Gliding Reentry into Earthrsquos
Atmosphere Proceedings of 14th International Conference on Methods of Aerophysical
Research (ICMAR-2008) Novosibirsk Russia 30 June - 06 July 2008
Gorshkov AB Kovalev R V Vlasov amp V I Zemlyanskiy B A (2008b) Heat Transfer
Investigation for Hypersonic Flow over Experimental Model of Pre-X Reentry
Vehicle Proceedings of 7th Sino-Russian High-Speed Flow Conference (SRHFC-7)
Novosibirsk Russia 1 - 3 July 2008
Grantham WL (1970) Flight results of a 25000 fps re-entry experiment NASA TN D 6062
Gubanova OI Zemlyansky BA Lessin AB Lunev VV Nikulin AN amp Syusin AV
(1992) Anomalous heat transfer on the windward side of a delta wing with a blunt
tip in hypersonic flow In Aerothermodynamics of aerospace systems Pt 1 pp 188-196
Moscow TsAGI (in Russian)
Hoffmann KA Chiang ST (2000) Computational fluid dynamics Vol 2 Engineering
Educational Systems ISBN 0-9623731-3-3 Kansas USA
Inouye Y (1995) OREX flight ndash quick report and lessons learned Proceedings of 2nd
European Symposium on Aerothermodynamics for Space Vehicles pp 271-279 ESTEC
Noordwik The Netherlands Europe Space Agency (November 1994)
Kovalev RV Kislykh VV Kolozezniy AE Kudryavtsev VV Marinin VP Vlasov
VI amp Zemliansky BA (2009) Experimental studies of Pre-X vehicle heat transfer
in PGU-7 test facility 3rd European Conference for Aerospace Sciences (EUCASS-2009)
Versailles France 6-9 July 2009
Lesin AB amp Lunev VV (1994) Heat transfer peaks on a blunt-nosed triangular plate in
hypersonic flow Fluid Dynamics Vol 29 No 2 (April 1994) pp 258-262 ISSN
0015-4628
Mason EA amp Saxena SC (1958) Approximate Formula for the Thermal Conductivity of
Gas Mixtures Phys Fluids Vol 1 No 5 (1958) pp 361-369
Pulliam TH (1986) Artificial dissipation models for the Euler equations AIAA Journal
Vol24 No 12 (December 1986) pp 1931-1940 ISSN 0001-1452
Vaganov AV Dmitriev VG Zadonsky SM Kireev AY Skuratov AS amp Stepanov
EA (2006) Estimations of low-sized winged reentry vehicle heat regimes on the
stage of its designing Physico-chemical kinetics in gas dynamics
wwwchemphysedurupdf2006-11-20-002pdf (in Russian)
Vlasov VI Gorshkov AB Kovalev RV amp Plastinin YuA (1997) Theoretical studies of
air ionization and NO vibrational excitation in low density hypersonic flow around
re-entry bodies AIAA Paper No 97-2582 (1997)
Vlasov V I amp Gorshkov A B (2001) Comparison of the Calculated Results for Hypersonic
Flow Past Blunt Bodies with the OREX Flight Test Data Fluid Dynamics Vol 36
No 5 (October 2001) pp 812-819 ISSN 0015-4628
wwwintechopencom
Heat Transfer - Mathematical Modelling Numerical Methods and Information Technology
252
Vlasov VI Gorshkov AB Kovalev RV amp Lunev VV (2009) Thin triangular blunt-
nosed plate in a viscous hypersonic flow Fluid Dynamics Vol 44 No 4 (August
2009) pp 596-605 ISSN 0015-4628
Wilke C (1950) A Viscosity Equation for Gas Mixtures JChemPhys Vol 18 No 4 (1950)
pp517-519
Yoon S amp Jameson A (1987) An LU-SSOR Scheme for the Euler and Navier-Stokes
Equations AIAA Paper No 87-0600 (1987)
wwwintechopencom
Heat Transfer - Mathematical Modelling Numerical Methods andInformation TechnologyEdited by Prof Aziz Belmiloudi
ISBN 978-953-307-550-1Hard cover 642 pagesPublisher InTechPublished online 14 February 2011Published in print edition February 2011
InTech EuropeUniversity Campus STeP Ri Slavka Krautzeka 83A 51000 Rijeka Croatia Phone +385 (51) 770 447 Fax +385 (51) 686 166
InTech ChinaUnit 405 Office Block Hotel Equatorial Shanghai No65 Yan An Road (West) Shanghai 200040 China
Phone +86-21-62489820 Fax +86-21-62489821
Over the past few decades there has been a prolific increase in research and development in area of heattransfer heat exchangers and their associated technologies This book is a collection of current research inthe above mentioned areas and describes modelling numerical methods simulation and informationtechnology with modern ideas and methods to analyse and enhance heat transfer for single and multiphasesystems The topics considered include various basic concepts of heat transfer the fundamental modes ofheat transfer (namely conduction convection and radiation) thermophysical properties computationalmethodologies control stabilization and optimization problems condensation boiling and freezing with manyreal-world problems and important modern applications The book is divided in four sections InverseStabilization and Optimization Problems Numerical Methods and Calculations Heat Transfer in MiniMicroSystems Energy Transfer and Solid Materials and each section discusses various issues methods andapplications in accordance with the subjects The combination of fundamental approach with many importantpractical applications of current interest will make this book of interest to researchers scientists engineers andgraduate students in many disciplines who make use of mathematical modelling inverse problemsimplementation of recently developed numerical methods in this multidisciplinary field as well as toexperimental and theoretical researchers in the field of heat and mass transfer
How to referenceIn order to correctly reference this scholarly work feel free to copy and paste the following
Andrey B Gorshkov (2011) Aerodynamic Heating at Hypersonic Speed Heat Transfer - MathematicalModelling Numerical Methods and Information Technology Prof Aziz Belmiloudi (Ed) ISBN 978-953-307-550-1 InTech Available from httpwwwintechopencombooksheat-transfer-mathematical-modelling-numerical-methods-and-information-technologyaerodynamic-heating-at-hypersonic-speed
wwwintechopencom
wwwintechopencom
copy 2011 The Author(s) Licensee IntechOpen This chapter is distributedunder the terms of the Creative Commons Attribution-NonCommercial-ShareAlike-30 License which permits use distribution and reproduction fornon-commercial purposes provided the original is properly cited andderivative works building on this content are distributed under the samelicense
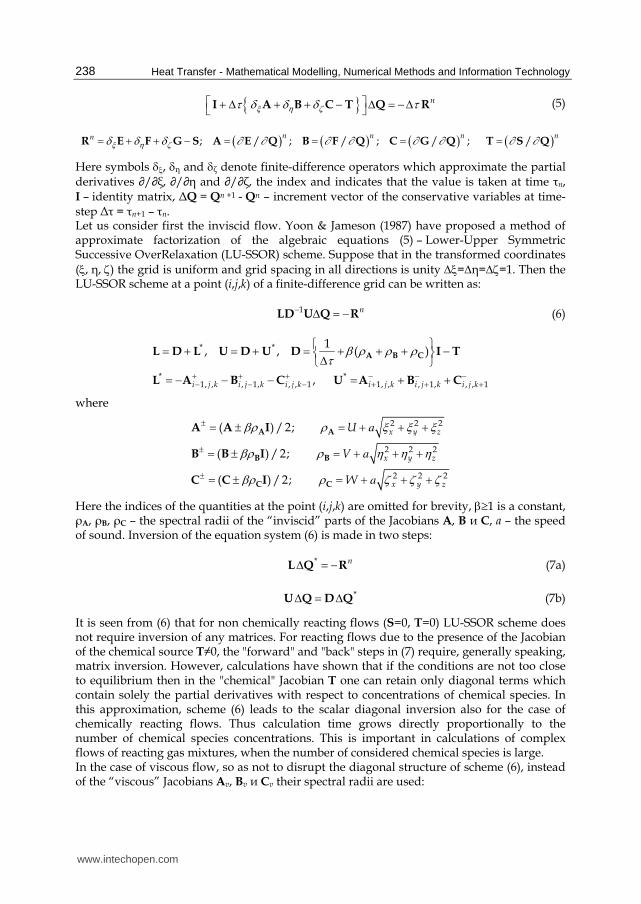
Heat Transfer - Mathematical Modelling Numerical Methods and Information Technology
238
nξ η ζτ δ δ δ τ⎡ ⎤+ Δ + + minus Δ = minusΔ⎣ ⎦I A B C T Q R (5)
( ) ( ) ( ) ( ) n n n nn ξ η ζδ δ δ part part part part part part part part= + + minus = = = =R E F G S A E Q B F Q C G Q T S Q
Here symbols δξ δ and δ denote finite-difference operators which approximate the partial derivatives partpartξ partpart and partpart the index and indicates that the value is taken at time n I ndash identity matrix ΔQ = Qn +1 - Qn ndash increment vector of the conservative variables at time-step Δ = n+1 ndash n Let us consider first the inviscid flow Yoon amp Jameson (1987) have proposed a method of approximate factorization of the algebraic equations (5) ndash Lower-Upper Symmetric Successive OverRelaxation (LU-SSOR) scheme Suppose that in the transformed coordinates (ξ ζ) the grid is uniform and grid spacing in all directions is unity Δξ=Δ=Δζ=1 Then the LU-SSOR scheme at a point (ijk) of a finite-difference grid can be written as
1 nminus Δ = minusLD U Q R (6)
1 1 1 1 1 1
1 ( )
i j k i j k i j k i j k i j k i j k
β ρ ρ ρτ+ + + minus minus minusminus minus minus + + +
⎧ ⎫= + = + = + + + minus⎨ ⎬Δ⎩ ⎭= minus minus minus = + +
A B CL D L U D U D I T
L A B C U A B C
where
2 2 2
2 2 2
2 2 2
( ) 2
( ) 2
( ) 2
x y z
x y z
x y z
U
V
W
βρ ρ ξ ξ ξβρ ρ η η ηβρ ρ ζ ζ ζ
plusmnplusmnplusmn
= plusmn = + + += plusmn = + + += plusmn = + + +
A A
B B
C C
A A I
B B I
C C I
a
a
a
Here the indices of the quantities at the point (ijk) are omitted for brevity βge1 is a constant ρA ρB ρC ndash the spectral radii of the ldquoinviscidrdquo parts of the Jacobians A B и C а ndash the speed of sound Inversion of the equation system (6) is made in two steps
L Q R nΔ = minus (7a)
U Q D QΔ = Δ (7b)
It is seen from (6) that for non chemically reacting flows (S=0 T=0) LU-SSOR scheme does not require inversion of any matrices For reacting flows due to the presence of the Jacobian of the chemical source Tne0 the forward and back steps in (7) require generally speaking matrix inversion However calculations have shown that if the conditions are not too close to equilibrium then in the chemical Jacobian Т one can retain only diagonal terms which contain solely the partial derivatives with respect to concentrations of chemical species In this approximation scheme (6) leads to the scalar diagonal inversion also for the case of chemically reacting flows Thus calculation time grows directly proportionally to the number of chemical species concentrations This is important in calculations of complex flows of reacting gas mixtures when the number of considered chemical species is large In the case of viscous flow so as not to disrupt the diagonal structure of scheme (6) instead of the ldquoviscousrdquo Jacobians Av Bv и Cv their spectral radii are used
wwwintechopencom
Aerodynamic Heating at Hypersonic Speed
239
( ) ( ) ( )2 2 2 2 2 2 2 2 2 Pr Pr Pr
v x y z v x y z v x y z
γ μ γ μ γ μρ ξ ξ ξ ρ η η η ρ ζ ζ ζρ ρ ρ= + + = + + = + +CA B
In the finite-difference equation (6) central differences are employed both for viscous and convective fluxes The use of central differences to approximate the convective terms can cause non-physical oscillations of the flow parameters at high Reynolds numbers To suppress such numerical oscillations artificial dissipation terms were added in the right part R of (6) according to Pulliam (1986) In calculations presented below it was assumed that the derivatives partξpartt partpartt and partpartt are zero and Δ = infin Since steady flow is considered these assumptions do not affect the final result
3 Calculation results
31 Flow and heat transfer on blunt delta wing In thermovision experiments (Gubanova et al 1992) in hypersonic flow past a delta wing with blunt nose and edges two regions of elevated heat were observed on its windward surface At a distance of approximately 12-15 r from the nose of the wing (r ndash nose radius) there were narrow bands of high heat fluxes which extended almost parallel to the symmetry plane at a small interval (3-5 r) from it to the final section of the wing at х asymp 100 r (see Fig 1 in which the calculated distribution of heat fluxes is shown at the experimental conditions) The level of heat fluxes in the bands was approximately twice the value of background heat transfer corresponding to the level for a delta plate with sharp edges under the same conditions It turned out that this effect exists in a fairly narrow range of flow parameters In particular on the same wing but with a sharp tip a similar increase in heat flux was not observed This effect was explained by the interaction of shock waves arising at the tip and on the blunt edges of the wing (Gubanova et al 1992 Lesin amp Lunev 1994) In this section numerical results calculated for the experimental conditions are presented and compared with measured heat flux values (see also (Vlasov et al 2009))
Fig 1 Calculated distribution of non-dimensional heat flux Q = qq0 on the windward side of the blunt delta wing q0 ndash heat flux at the stagnation point of a sphere with a radius equal to the nose radius of the wing
Perfect gas hypersonic flow ( = 14) past a delta wing with a spherical nose and cylindrical edges of the same radius is considered Mach and Reynolds numbers calculated with free stream flow parameters and the wing nose radius are Minfin = 14 and Reinfin = 14middot104 angle of attack α = 10deg wing sweep angle λ = 75deg The free stream stagnation temperature T0infin = 1205 K the wall temperature Tw = 300 K Due to the symmetry of flow only half of the wing is computed The flow calculation was performed with shock-fitting procedure the computational grid is 120times40times119 (in the longitudinal transverse and circumferential
wwwintechopencom
Heat Transfer - Mathematical Modelling Numerical Methods and Information Technology
240
directions respectively see Fig 2) Below in this section all quantities with a dimension of length unless otherwise specified are normalized to the wing nose radius r
Fig 2 The computational grid on the wing surface in the plane of symmetry (z = 0) and in the exit section for the converged numerical solution
Fig 3 Streamlines near the windward surface of the wing Top ndash at a distance of one grid step from the wall bottom ndash at the outer edge of the boundary layer
Calculated patterns of streamlines near the windward surface of the wing at a distance of one grid step from the wall and at the outer edge of the boundary layer are shown in Fig 3 The streamlines flowing down from the wing edge on the windward plane at almost constant pressure form the line of diverging flow (line A-A) along which there are bands of elevated heat fluxes At the symmetry plane a line of converging streamlines is realized along the entire length of the wing but upstream the shock interaction point A flow impinges on the symmetry plane from the edges and downstream from A ndash from the diverging line A-A A characteristic feature of the considered case is that the distribution of heat fluxes on the windward side is mainly determined by the values of convergence and divergence of streamlines at almost constant pressure (see Fig 4 which shows the distribution of pressure and heat flux on the windward side in several sections x = const) Local maxima of heat fluxes near symmetry plane appear only at xgt 15 near the line z = 4 (after the nose shock wave intersects with the shock wave from the edges) and the relative intensity of these heat peaks grows with increasing distance from the nose (Fig 4b)
wwwintechopencom
Aerodynamic Heating at Hypersonic Speed
241
003
008
0 05 1
P
1
2 34
5
z
0
005
01
015
0 5 10
Q
z
12
34
(a) (b)
Fig 4 Pressure distribution Р = pρinfinVinfin2 (a) and heat flux Q = qq0 (b) on windward side of wing in sections 1-5 ndash x = 10 20 30 50 90 z= zzmax zmax ndash wingspan in section х = const
Comparison of the upper and lower parts of Fig 3 shows that the flow near the wall and at the outer edge of the boundary layer are noticeably different the streamlines near the wall are directed to the symmetry plane (converging) and in inviscid region ndash from it (diverging) It follows that the velocity component directed along the wing chord changes sign across the boundary layer which indicates the existence of transverse vortex (cross separation flow) in the boundary layer This is illustrated in Fig 5a which shows the projection of streamlines on the plane of the cross section at x = 90
400
1200
1200
700
1000T
0
(a) (b)
Fig 5 Projection of streamlines (a) and isolines of stagnation temperature T0 K (b) in cross section x = 90
The distribution of the boundary layer thickness is clearly seen in Fig 5b which shows the contours of the stagnation temperature T0 in the cross section x = 90 On the windward side of the wing minimum thickness of the boundary layer is located on the diverging line (line A-A in Fig 3) On the left and on the right sides of the diverging line there are converging lines with a thicker boundary layer (about 2 and 3 times respectively) One of the
wwwintechopencom
Heat Transfer - Mathematical Modelling Numerical Methods and Information Technology
242
converging lines is the symmetry plane Here the boundary layer thickness on the windward side reaches a maximum amounting to about one-third of the shock layer thickness Near the wing edge because of the expansion and acceleration of the flow the boundary layer thickness decreases sharply (at the edge it is almost 20 times less than at the symmetry plane on the windward side) On the leeward side of the wing flow separation occurs and the concept of the boundary layer loses its meaning Here scope of viscous flow is half the shock layer The shape of calculated shock wave in Fig 6a induced by the wing nose as a blunt body is determined by the law of the explosive analogy so that some front part of the wing
x le xA asymp 15 will be located inside the initially axisymmetric shock wave The coordinate of point A (xA) is located in the vicinity of interaction region of shock waves induced by the nose and the edges of the wing Here the profiles of pressure and heat flux along the edge are local maxima
0
10
000
005
0 15 30
zP
Q2
x
shock wing edge
P
Q
xA
0
005
-1 -05 0 05 1
Q
z
calculation
experiment
(a) (b)
Fig 6 Profiles of pressure heat flux and the shock wave along the wing edge (a) and distribution of heat fluxes in cross section x = 90 (b)
In Fig 6b the distribution of computed heat fluxes qq0 in the neighborhood of the wing end section at x = 90 is presented in comparison with the experiment of Gubanova et al (1992) depending on the transverse coordinate z On the whole the calculation correctly predicts the magnitude and position of local maximum of heat flux near the symmetry plane taking into account the small asymmetry in the experimental data Note that near the minima of heat fluxes calculated values are lower than experimental ones probably due to effect of smoothing of experimental data in these narrow regions
32 Heat transfer on test model of Pre-X space vehicle Currently developed hypersonic aircraft have dimensions several times smaller than previously created space vehicles Shuttle and Buran This results in increase of heat load on a vehicle during flight and therefore the problem of reliable calculation of heat fluxes on the surface for such relatively small bodies is particularly important Thus the problem arises of verification of the employed physical models and numerical methods by comparing calculation results with experimental data
wwwintechopencom
Aerodynamic Heating at Hypersonic Speed
243
In 2006-2007 on TsNIImashrsquos experimental base in a piston gasdynamic wind tunnel PGU-7 a heat transfer study has been conducted on a small-scale model of Pre-X reentry demonstrator (Baiocco 2006) This vehicle is designed to obtain in flight conditions experimental data pertaining to aerothermodynamic phenomena that are not modeled in ground tests but they are critical for design of a vehicle returning from the Earthrsquos orbit In particular Pre-X demonstrator is developed to test in a real flight and in specified locations on the vehicle surface samples of reusable thermal protection materials and to assess their durability During the study thermovision measurements have been conducted of heat fluxes on the model of scale 115 at various flow regimes ndash M = 10 Re = 1106-5106 1m (Kovalev et al 2009) Processing of thermovision measurements was carried out in accordance with standard technique and composed of determination of the model surface temperature during experiment extraction from these data distributions of heat fluxes on the observed model surface and binding of the resulting thermovision frame to a three-dimensional CAD model of the demonstrator The same CAD model has been used for numerical simulation of heat transfer on the Pre-X test model As a normalizing value the heat flux q0 at the stagnation point of a sphere with radius of 70 mm is adopted which is determined using the Fay-Riddell formula Advantage of data presentation in this form is due to invariability of the relative values Q = qq0 on most model surface at variations of flow parameters
Fig 7 Calculated distributions of pressure Р = ちρinfinVinfin2 (left) and stagnation temperature T0 K (right) on surface and in shock layer (in symmetry plane and in exit section) for test model of Pre-X vehicle
On the base of the numerical solution of the Navier-Stokes equations a study was carried out of flow parameters and heat transfer for laminar flow over a test model of Pre-X space
wwwintechopencom
Heat Transfer - Mathematical Modelling Numerical Methods and Information Technology
244
vehicle for experimental conditions in the piston gasdynamic wind tunnel Mach and Reynolds numbers calculated from the free-stream parameters and the length of the model (330 mm) are Minfin = 10 and Reinfin = 7middot105 Angle of attack ndash 45deg The flap deflection angle was (as in the experiment) = 5 10 and 15deg The stagnation temperature of the free-stream flow and the wing surface temperature ndash T0infin = 1000 K and Tw = 300 K respectively An approximation of a perfect gas was used with ratio of specific heats = 14 The calculations were performed with a shock-fitting procedure ie the bow shock was considered as a discontinuity with implementation of the Rankine-Hugoniot relations (4) across it On the model surface no-slip and fixed temperature conditions were set Note that in view of the flow symmetry computations were made only for a half of the model although in the figures below for comparison with experiment the calculated data (upon reflection in the symmetry plane) are presented on the entire model The overall flow pattern obtained in the calculations over the test model of Pre-X space vehicle is shown in Fig 7 where for the case of the flap deflection angle = 15deg pressure and stagnation temperature Т0 isolines in the shock layer and on the model surface are shown It is seen that there are two areas of high pressure on the nose tip of the model (P asymp 092) and on the deflection flaps In the latter case the pressure in the flow passing through the two shock waves reaches P asymp 13 Isolines of Т0 show the size of regions where viscous forces are significant a thin boundary layer on the windward side of the model and an extensive separation zone on the leeward side The small separation zone appearing at deflection flaps although about four times thicker than the boundary layer upstream of it is almost not visible in the scale of the figure Fig 8 shows the distributions of relative heat flow Q on the windward side of the model obtained in the experiments and in the calculations at deflection angles of flaps = 5 10 and 15deg For the case = 5deg it can be noted rather good agreement between experiment and calculation in the values of heat flux in the central part of the model and on the flaps It is evident that before deflected flaps there is a region of low heat fluxes caused by near separation state (according to calculation results) of the boundary layer In analyzing the experimental data it should be taken into account the effect of apparent temperature reduction of the surface area with a large angle to the thermovision observation line It is precisely this effect that explains the fact that in the nose part of the model the experimental values of heat flux are less than the calculated ones Also narrow zones of high (at the sharp edges of the flaps) or low (in the separation zone at the root of the flaps) values of heat flux are smoothed or not visible in the experiment due to insufficient resolution of thermovision equipment The resolution capability of thermovisor is clearly visible by the size of cells in the experimental isoline pattern of heat flux in Fig 8 It should be noted that the calculations do not take into account a slit between the deflection flaps available on the test model the presence of which should lead to a decrease in the separation region in front of the flaps At an angle of flap deflection = 10deg as in the previous case = 5deg there is fairly good agreement between calculation and experiment for the values of heat flux in the central part of the model and on the flaps The calculations show that the growth of the flap deflection angle from 5deg to 10deg results in the formation of a large separation zone in front of the flaps and in a decrease in heat flux value Q from 02 to 01 At the largest angle of flap deflection = 15deg the maximum of calculated heat flux occurs in the zone of impingement of the separated boundary layer where the level of Q is 2-3 times higher than its level on the undeflected flap The coincidence of calculation results with
wwwintechopencom
Aerodynamic Heating at Hypersonic Speed
245
experimental data in the front part of the model up to the separation zone before the flaps is satisfactory On the flaps the level of heat flux in the experiment is about one and a half times more than in the calculation This difference in heat flux values is apparently due to laminar-turbulent transition in separation region induced by the deflected flaps which takes place in the experiment
δ = 5deg
δ = 10deg
δ = 15deg
Fig 8 Experimental (left) and calculated (right) heat fluxes Q = qq0 on windward side of test model of Pre-X space vehicle at different deflection angles of flaps
wwwintechopencom
Heat Transfer - Mathematical Modelling Numerical Methods and Information Technology
246
33 Flow and heat transfer on a winged space vehicle at reentry to Earths atmosphere This section presents the results of numerical simulation of flow and heat transfer on a
winged version of the small-scale reentry vehicle being developed in TsAGI (Vaganov et al
2006) moving at hypersonic speed in the Earths atmosphere Calculations were made using
two physical-chemical models of the gas medium - equilibrium and non-equilibrium
chemically reacting air
The bow shock was captured in contrast to the previous two flow cases Thus on the inflow
boundary the free-stream conditions were specified On the vehicle surface no-slip and
adiabatic wall conditions were supposed In calculations with use of the nonequilibrium air
model the vehicle surface was supposed to be low catalytical with the probability of
heterogeneous recombination of O and N atoms equal to А = 001
A computational grid was provided by Mikhalin VA (Dmitriev et al 2007) and was taken
from the inviscid flow calculation The number of points in the direction normal to the
vehicle surface has been increased to resolve the wall boundary layer Part of the results
presented below was reported in (Dmitriev et al 2007 Gorshkov et al 2008a)
Calculations were performed for two points of a reentry trajectory for which thermal loads
are close to maximum (Table 1) The angle of attack α = 35deg the vehicle length L = 9m A
grid 93times50times101 in the longitudinal transverse and circumferential directions respectively
were used in the calculations The surface grid of the vehicle is shown in Fig 9
Н
km
Vinfin
msec ReinfinL Minfin Рinfin atm Тinfin K
70 5952 346middot105 200 576middot10-5 219
63 5152 684middot105 166 159middot10-4 243
Table 1 Parameters of trajectory points
Fig 9 Surface grid of the small-scale reentry vehicle
In Fig 10a contours of total enthalpy H0 on the surface and in the shock layer near the reentry vehicle are shown On the windward side one can see the shock wave the thin wall boundary layer and the inviscid flow between them in which the values of H0 are constant In the calculations the shock wave is smeared upon 3-5 grid points and has a finite thickness due to the use of artificial dissipation In particular a local decrease in H0 in a strong shock
wwwintechopencom
Aerodynamic Heating at Hypersonic Speed
247
wave on the windward side which can be seen in the figure has no physical meaning and is due to the influence of artificial dissipation Recall that the Navier-Stokes equations do not correctly describe the shock structure at Mach numbers Mgt 15 In the shock layer on the leeward side it is visible a large area with reduced values of total enthalpy Н0ltН0infin (Н0infin ndash total enthalpy in the free-stream) which arises as a result of boundary layer separation from the vehicle surface Chemical processes occurring in the shock layer over the vehicle are illustrated in Fig 10b which shows contours of mass concentrations of oxygen atoms つо Under the considered conditions in the vicinity of the vehicle nose behind the shock wave O2 dissociation is complete On the windward side downstream the nose in the shock layer and on the surface the recombination occurs and the concentration of O decreases In contrast on the leeward side where the flow is very rarefied the level of つо remains high indicating that the process of recombination of atomic oxygen is frozen
boundary layer
shock wave
(a) (b)
Fig 10 Total enthalpy MJkg (a) and mass concentration of oxygen atoms (b) on the surface and in the shock layer near the vehicle 〉 = 63 km
0001
001
01
1
0 5 10
P
x m
equilibrium air
nonequilibrium air
equilibrium air
Fig 11 Pressure distribution P = ちρinfinVinfin2 on vehicle surface overall view (left) and in symmetry plane (right) 〉 = 63 km
wwwintechopencom
Heat Transfer - Mathematical Modelling Numerical Methods and Information Technology
248
In Fig 11 and 12 isolines of pressure heat flux qw and equilibrium radiation temperature Tw
on the vehicle surface are shown for cases of equilibrium and non-equilibrium dissociating
air Comparison of qw and Tw distributions on the vehicle surface in the symmetry plane for
two air models are depicted in Fig 13
Analysis of the calculation results shows that pressure distribution on the windward surface
of the vehicle does not depend on physical-chemical model of the gas medium - the
difference in pressure values for equilibrium and non-equilibrium air flow is 1 - 2 On the
leeward side pressure on the surface for nonequilibrium flow may be nearly two times
lower than for equilibrium flow (eg in the vicinity of the tail) This is probably due to the
fact that the effective ratio of specific heats for nonequilibrium air is greater than for
equilibrium air because in the shock layer on the leeward side nonequilibrium flow is
chemically frozen and here there is a sufficiently high concentration of atoms (see Fig 10b)
equilibrium air nonequilibrium air
Fig 12 Distributions of heat flux qw kWm2 (top) and equilibrium radiation temperature TwdegC (bottom) on the vehicle surface 〉 = 63 km
Nonequilibrium chemical processes in the shock layer and finite catalytic activity of the
vehicle surface (А = 001) significantly reduce the calculated levels of heat transfer in
comparison with the case of equilibrium air flow The most significant decrease in heat flux
is observed on the vehicle nose part (for x le 1 m) and in the vicinity of the tail For example
at the nose stagnation point the level of heat flux decreases by about 40 ndash from 640 to 385
kWm2 while the surface temperature decreases by nearly 15 ndash from 1670 to 1430 degC
Note a high heat flux level on the thin edge of the wing compared with one at the nose
stagnation point Particularly intense heating occurs at the sharp bend of the wing where the
values of heat flux and surface temperature even slightly exceed their values at the front
stagnation point In the case of equilibrium air flow the exceeding for heat flux is about 10
(710 and 640 kWm2) for temperature - 3 (1720 and 1670 degC) In the case of
nonequilibrium air flow the exceeding is more significant for heat flux - 30 (540 and 385
kWm2) for temperature - 10 (1570 and 1430 deg C)
wwwintechopencom
Aerodynamic Heating at Hypersonic Speed
249
In other parts of the vehicle surface difference in heat flux levels for the two air models is somewhat less and it decreases downstream presumably due to gradual recombination of atoms in the boundary layer at flowing along the surface in case of non-equilibrium air
1
10
100
1000
0 5 10
Qw
x m
equilibrium air
nonequilibrium air
0
1000
2000
0 5 10
Tw
x m
equilibrium air
nonequilibrium air
Fig 13 Profiles of heat flux qw kWm2 (left) and equilibrium radiation temperature TwdegC (right) on vehicle surface in symmetry plane 〉 = 63 km
A similar flow and heat flux patterns are observed for the altitude H = 70 km as seen in Fig 14 where contours of heat flux and equilibrium radiation wall temperature are shown at this altitude for the two air models For equilibrium air overall level of heat flux at 70 km is slightly higher than at 63 km For example heat flux value at the nose stagnation point is increased by 5 (675 compared with 640 kWm2) The opposite situation occurs for the model of nonequilibrium air in this case the stagnation point heat flux value at 70 km is lower than at 63 km ndash by 7 (360 and 385 kWm2 respectively)
equilibrium air nonequilibrium air
Fig 14 Distributions of heat flux qw kWm2 (top) and equilibrium radiation temperature TwdegC (bottom) on the vehicle surface 〉 = 70 km
wwwintechopencom
Heat Transfer - Mathematical Modelling Numerical Methods and Information Technology
250
4 Conclusion
A three-dimensional stationary NavierndashStokes computer code for laminar flow developed
by the author has been briefly described The code is mainly intended to calculate super-
and hypersonic flows over bodies accounting for high temperature real gas effects with
special emphasis on convective heat transfer Three gas models perfect gas equilibrium and
nonequilibrium gas mixture can be used in the calculations
In the chapter a comparison of code calculation results with experimental data is made for
two perfect gas hypersonic flow cases at wind tunnel conditions First case is a simulation of
an anomalous heat transfer on the windward side a delta wing with blunt edges On the
whole the calculation correctly predicts the magnitude and position of local maximum of
heat flux near the wing symmetry plane taking into account a small asymmetry in the
experimental data Second case is a computation of heat transfer on a test model of the Pre-X
demonstrator Satisfactory agreement with thermovision heat fluxes on the smooth
windward side and on the flaps is obtained except for the largest deflection angle of flaps
= 15deg when the level of heat flux in the experiment is about one and a half times more than
in the calculation This discrepancy is apparently due to laminar-turbulent transition in
separation region induced by the deflected flaps which takes place in the experiment
Third flow case concerns chemically reacting air flow at equilibrium or nonequilibrium
conditions Flowfield and convective heat transfer parameters for a winged shape of a small-
scale reentry vehicle are calculated for two points of a reentry trajectory in the Earthrsquos
atmosphere Heat flux and equilibrium radiation temperature distributions on the vehicle
surface are obtained Also regions of maximal thermal loadings are localized
Calculations show that for nonequilibrium air flow the use of a low catalytic coating (with
probability of heterogeneous recombination of atoms А = 001) on the vehicle surface
enables to decrease considerably the level of heat fluxes in regions of maximal heat transfer
in the nose part and on the wing edges in comparison with equilibrium air flow For
example for trajectory points with maximal thermal load a reduction of up to 40 in heat
flux (which results in a 15 reduction of equilibrium radiation wall temperature) can be
obtained at the vehicle nose
5 Acknowledgments
The author is grateful to Kovalev RV Marinin VP and Vlasov VI for delivering
thermovision data on test model of Pre-X vehicle and also to Churakov DA and Mihalin
VA for providing computational grids
6 References
Baiocco P Guedron S Plotard P amp Moulin J (2006) The Pre-X atmospheric re-entry
experimental lifting body Program status and system synthesis Proceedings of 57th
International Astronautical Congress 2-6 October 2006 IAC-06-D2P22
Churakov DA Gorshkov AB Kovalev RV Vlasov VI Beloshitsky AV Dyadkin
AA amp Zhurin SV (2008) Heat Transfer of Reentry Vehicles during Atmosphere
Flight Proceedings of 6-th European Symposium on Aerothermodynamics for Space
Vehicles Versailles France 3 - 6 November 2008
wwwintechopencom
Aerodynamic Heating at Hypersonic Speed
251
Dmitriev VG Vaganov AV Gorshkov AB Lapygin VI Galaktionov AYu amp
Mikhalin VA (2007) Analysis of Aerothermodynamic Parameters of Reusable
Space Wing Vehicle Proceedings of 2nd European Conference for Aero-Space Sciences
Brussels Belgium July 1-6 2007
Gorshkov AB (1997) Calculation of Base Heat Transfer Behind Thin Cone-Shaped Bodies
Cosmonautics and Rocket Engineering No 11 (1997) pp 13-20 (in Russian)
Gorshkov AB Kovalev R V Vlasov V I amp Zemlyanskiy B A (2008a) Simulation of
Heat Transfer to Space Vehicles during a Gliding Reentry into Earthrsquos
Atmosphere Proceedings of 14th International Conference on Methods of Aerophysical
Research (ICMAR-2008) Novosibirsk Russia 30 June - 06 July 2008
Gorshkov AB Kovalev R V Vlasov amp V I Zemlyanskiy B A (2008b) Heat Transfer
Investigation for Hypersonic Flow over Experimental Model of Pre-X Reentry
Vehicle Proceedings of 7th Sino-Russian High-Speed Flow Conference (SRHFC-7)
Novosibirsk Russia 1 - 3 July 2008
Grantham WL (1970) Flight results of a 25000 fps re-entry experiment NASA TN D 6062
Gubanova OI Zemlyansky BA Lessin AB Lunev VV Nikulin AN amp Syusin AV
(1992) Anomalous heat transfer on the windward side of a delta wing with a blunt
tip in hypersonic flow In Aerothermodynamics of aerospace systems Pt 1 pp 188-196
Moscow TsAGI (in Russian)
Hoffmann KA Chiang ST (2000) Computational fluid dynamics Vol 2 Engineering
Educational Systems ISBN 0-9623731-3-3 Kansas USA
Inouye Y (1995) OREX flight ndash quick report and lessons learned Proceedings of 2nd
European Symposium on Aerothermodynamics for Space Vehicles pp 271-279 ESTEC
Noordwik The Netherlands Europe Space Agency (November 1994)
Kovalev RV Kislykh VV Kolozezniy AE Kudryavtsev VV Marinin VP Vlasov
VI amp Zemliansky BA (2009) Experimental studies of Pre-X vehicle heat transfer
in PGU-7 test facility 3rd European Conference for Aerospace Sciences (EUCASS-2009)
Versailles France 6-9 July 2009
Lesin AB amp Lunev VV (1994) Heat transfer peaks on a blunt-nosed triangular plate in
hypersonic flow Fluid Dynamics Vol 29 No 2 (April 1994) pp 258-262 ISSN
0015-4628
Mason EA amp Saxena SC (1958) Approximate Formula for the Thermal Conductivity of
Gas Mixtures Phys Fluids Vol 1 No 5 (1958) pp 361-369
Pulliam TH (1986) Artificial dissipation models for the Euler equations AIAA Journal
Vol24 No 12 (December 1986) pp 1931-1940 ISSN 0001-1452
Vaganov AV Dmitriev VG Zadonsky SM Kireev AY Skuratov AS amp Stepanov
EA (2006) Estimations of low-sized winged reentry vehicle heat regimes on the
stage of its designing Physico-chemical kinetics in gas dynamics
wwwchemphysedurupdf2006-11-20-002pdf (in Russian)
Vlasov VI Gorshkov AB Kovalev RV amp Plastinin YuA (1997) Theoretical studies of
air ionization and NO vibrational excitation in low density hypersonic flow around
re-entry bodies AIAA Paper No 97-2582 (1997)
Vlasov V I amp Gorshkov A B (2001) Comparison of the Calculated Results for Hypersonic
Flow Past Blunt Bodies with the OREX Flight Test Data Fluid Dynamics Vol 36
No 5 (October 2001) pp 812-819 ISSN 0015-4628
wwwintechopencom
Heat Transfer - Mathematical Modelling Numerical Methods and Information Technology
252
Vlasov VI Gorshkov AB Kovalev RV amp Lunev VV (2009) Thin triangular blunt-
nosed plate in a viscous hypersonic flow Fluid Dynamics Vol 44 No 4 (August
2009) pp 596-605 ISSN 0015-4628
Wilke C (1950) A Viscosity Equation for Gas Mixtures JChemPhys Vol 18 No 4 (1950)
pp517-519
Yoon S amp Jameson A (1987) An LU-SSOR Scheme for the Euler and Navier-Stokes
Equations AIAA Paper No 87-0600 (1987)
wwwintechopencom
Heat Transfer - Mathematical Modelling Numerical Methods andInformation TechnologyEdited by Prof Aziz Belmiloudi
ISBN 978-953-307-550-1Hard cover 642 pagesPublisher InTechPublished online 14 February 2011Published in print edition February 2011
InTech EuropeUniversity Campus STeP Ri Slavka Krautzeka 83A 51000 Rijeka Croatia Phone +385 (51) 770 447 Fax +385 (51) 686 166
InTech ChinaUnit 405 Office Block Hotel Equatorial Shanghai No65 Yan An Road (West) Shanghai 200040 China
Phone +86-21-62489820 Fax +86-21-62489821
Over the past few decades there has been a prolific increase in research and development in area of heattransfer heat exchangers and their associated technologies This book is a collection of current research inthe above mentioned areas and describes modelling numerical methods simulation and informationtechnology with modern ideas and methods to analyse and enhance heat transfer for single and multiphasesystems The topics considered include various basic concepts of heat transfer the fundamental modes ofheat transfer (namely conduction convection and radiation) thermophysical properties computationalmethodologies control stabilization and optimization problems condensation boiling and freezing with manyreal-world problems and important modern applications The book is divided in four sections InverseStabilization and Optimization Problems Numerical Methods and Calculations Heat Transfer in MiniMicroSystems Energy Transfer and Solid Materials and each section discusses various issues methods andapplications in accordance with the subjects The combination of fundamental approach with many importantpractical applications of current interest will make this book of interest to researchers scientists engineers andgraduate students in many disciplines who make use of mathematical modelling inverse problemsimplementation of recently developed numerical methods in this multidisciplinary field as well as toexperimental and theoretical researchers in the field of heat and mass transfer
How to referenceIn order to correctly reference this scholarly work feel free to copy and paste the following
Andrey B Gorshkov (2011) Aerodynamic Heating at Hypersonic Speed Heat Transfer - MathematicalModelling Numerical Methods and Information Technology Prof Aziz Belmiloudi (Ed) ISBN 978-953-307-550-1 InTech Available from httpwwwintechopencombooksheat-transfer-mathematical-modelling-numerical-methods-and-information-technologyaerodynamic-heating-at-hypersonic-speed
wwwintechopencom
wwwintechopencom
copy 2011 The Author(s) Licensee IntechOpen This chapter is distributedunder the terms of the Creative Commons Attribution-NonCommercial-ShareAlike-30 License which permits use distribution and reproduction fornon-commercial purposes provided the original is properly cited andderivative works building on this content are distributed under the samelicense
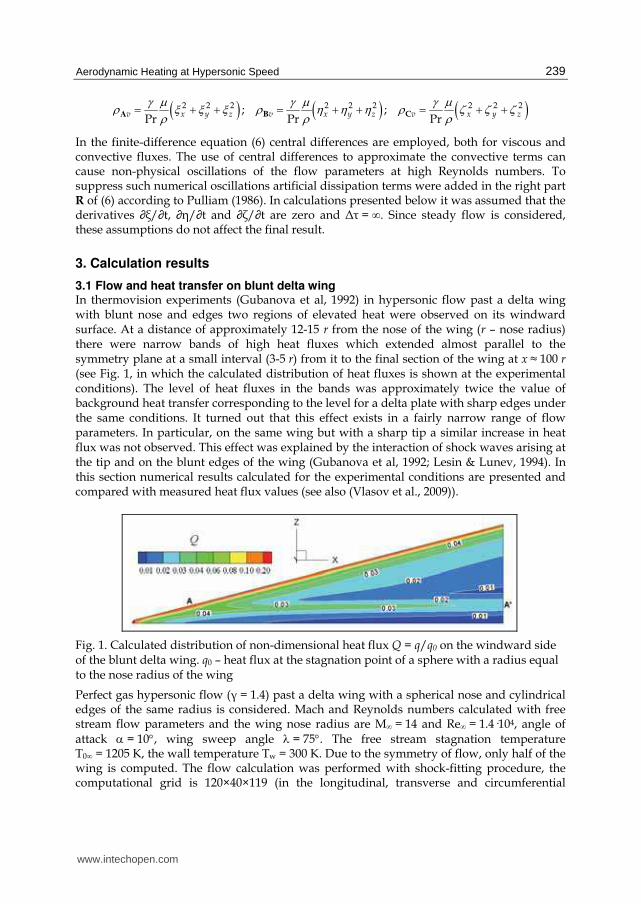
Aerodynamic Heating at Hypersonic Speed
239
( ) ( ) ( )2 2 2 2 2 2 2 2 2 Pr Pr Pr
v x y z v x y z v x y z
γ μ γ μ γ μρ ξ ξ ξ ρ η η η ρ ζ ζ ζρ ρ ρ= + + = + + = + +CA B
In the finite-difference equation (6) central differences are employed both for viscous and convective fluxes The use of central differences to approximate the convective terms can cause non-physical oscillations of the flow parameters at high Reynolds numbers To suppress such numerical oscillations artificial dissipation terms were added in the right part R of (6) according to Pulliam (1986) In calculations presented below it was assumed that the derivatives partξpartt partpartt and partpartt are zero and Δ = infin Since steady flow is considered these assumptions do not affect the final result
3 Calculation results
31 Flow and heat transfer on blunt delta wing In thermovision experiments (Gubanova et al 1992) in hypersonic flow past a delta wing with blunt nose and edges two regions of elevated heat were observed on its windward surface At a distance of approximately 12-15 r from the nose of the wing (r ndash nose radius) there were narrow bands of high heat fluxes which extended almost parallel to the symmetry plane at a small interval (3-5 r) from it to the final section of the wing at х asymp 100 r (see Fig 1 in which the calculated distribution of heat fluxes is shown at the experimental conditions) The level of heat fluxes in the bands was approximately twice the value of background heat transfer corresponding to the level for a delta plate with sharp edges under the same conditions It turned out that this effect exists in a fairly narrow range of flow parameters In particular on the same wing but with a sharp tip a similar increase in heat flux was not observed This effect was explained by the interaction of shock waves arising at the tip and on the blunt edges of the wing (Gubanova et al 1992 Lesin amp Lunev 1994) In this section numerical results calculated for the experimental conditions are presented and compared with measured heat flux values (see also (Vlasov et al 2009))
Fig 1 Calculated distribution of non-dimensional heat flux Q = qq0 on the windward side of the blunt delta wing q0 ndash heat flux at the stagnation point of a sphere with a radius equal to the nose radius of the wing
Perfect gas hypersonic flow ( = 14) past a delta wing with a spherical nose and cylindrical edges of the same radius is considered Mach and Reynolds numbers calculated with free stream flow parameters and the wing nose radius are Minfin = 14 and Reinfin = 14middot104 angle of attack α = 10deg wing sweep angle λ = 75deg The free stream stagnation temperature T0infin = 1205 K the wall temperature Tw = 300 K Due to the symmetry of flow only half of the wing is computed The flow calculation was performed with shock-fitting procedure the computational grid is 120times40times119 (in the longitudinal transverse and circumferential
wwwintechopencom
Heat Transfer - Mathematical Modelling Numerical Methods and Information Technology
240
directions respectively see Fig 2) Below in this section all quantities with a dimension of length unless otherwise specified are normalized to the wing nose radius r
Fig 2 The computational grid on the wing surface in the plane of symmetry (z = 0) and in the exit section for the converged numerical solution
Fig 3 Streamlines near the windward surface of the wing Top ndash at a distance of one grid step from the wall bottom ndash at the outer edge of the boundary layer
Calculated patterns of streamlines near the windward surface of the wing at a distance of one grid step from the wall and at the outer edge of the boundary layer are shown in Fig 3 The streamlines flowing down from the wing edge on the windward plane at almost constant pressure form the line of diverging flow (line A-A) along which there are bands of elevated heat fluxes At the symmetry plane a line of converging streamlines is realized along the entire length of the wing but upstream the shock interaction point A flow impinges on the symmetry plane from the edges and downstream from A ndash from the diverging line A-A A characteristic feature of the considered case is that the distribution of heat fluxes on the windward side is mainly determined by the values of convergence and divergence of streamlines at almost constant pressure (see Fig 4 which shows the distribution of pressure and heat flux on the windward side in several sections x = const) Local maxima of heat fluxes near symmetry plane appear only at xgt 15 near the line z = 4 (after the nose shock wave intersects with the shock wave from the edges) and the relative intensity of these heat peaks grows with increasing distance from the nose (Fig 4b)
wwwintechopencom
Aerodynamic Heating at Hypersonic Speed
241
003
008
0 05 1
P
1
2 34
5
z
0
005
01
015
0 5 10
Q
z
12
34
(a) (b)
Fig 4 Pressure distribution Р = pρinfinVinfin2 (a) and heat flux Q = qq0 (b) on windward side of wing in sections 1-5 ndash x = 10 20 30 50 90 z= zzmax zmax ndash wingspan in section х = const
Comparison of the upper and lower parts of Fig 3 shows that the flow near the wall and at the outer edge of the boundary layer are noticeably different the streamlines near the wall are directed to the symmetry plane (converging) and in inviscid region ndash from it (diverging) It follows that the velocity component directed along the wing chord changes sign across the boundary layer which indicates the existence of transverse vortex (cross separation flow) in the boundary layer This is illustrated in Fig 5a which shows the projection of streamlines on the plane of the cross section at x = 90
400
1200
1200
700
1000T
0
(a) (b)
Fig 5 Projection of streamlines (a) and isolines of stagnation temperature T0 K (b) in cross section x = 90
The distribution of the boundary layer thickness is clearly seen in Fig 5b which shows the contours of the stagnation temperature T0 in the cross section x = 90 On the windward side of the wing minimum thickness of the boundary layer is located on the diverging line (line A-A in Fig 3) On the left and on the right sides of the diverging line there are converging lines with a thicker boundary layer (about 2 and 3 times respectively) One of the
wwwintechopencom
Heat Transfer - Mathematical Modelling Numerical Methods and Information Technology
242
converging lines is the symmetry plane Here the boundary layer thickness on the windward side reaches a maximum amounting to about one-third of the shock layer thickness Near the wing edge because of the expansion and acceleration of the flow the boundary layer thickness decreases sharply (at the edge it is almost 20 times less than at the symmetry plane on the windward side) On the leeward side of the wing flow separation occurs and the concept of the boundary layer loses its meaning Here scope of viscous flow is half the shock layer The shape of calculated shock wave in Fig 6a induced by the wing nose as a blunt body is determined by the law of the explosive analogy so that some front part of the wing
x le xA asymp 15 will be located inside the initially axisymmetric shock wave The coordinate of point A (xA) is located in the vicinity of interaction region of shock waves induced by the nose and the edges of the wing Here the profiles of pressure and heat flux along the edge are local maxima
0
10
000
005
0 15 30
zP
Q2
x
shock wing edge
P
Q
xA
0
005
-1 -05 0 05 1
Q
z
calculation
experiment
(a) (b)
Fig 6 Profiles of pressure heat flux and the shock wave along the wing edge (a) and distribution of heat fluxes in cross section x = 90 (b)
In Fig 6b the distribution of computed heat fluxes qq0 in the neighborhood of the wing end section at x = 90 is presented in comparison with the experiment of Gubanova et al (1992) depending on the transverse coordinate z On the whole the calculation correctly predicts the magnitude and position of local maximum of heat flux near the symmetry plane taking into account the small asymmetry in the experimental data Note that near the minima of heat fluxes calculated values are lower than experimental ones probably due to effect of smoothing of experimental data in these narrow regions
32 Heat transfer on test model of Pre-X space vehicle Currently developed hypersonic aircraft have dimensions several times smaller than previously created space vehicles Shuttle and Buran This results in increase of heat load on a vehicle during flight and therefore the problem of reliable calculation of heat fluxes on the surface for such relatively small bodies is particularly important Thus the problem arises of verification of the employed physical models and numerical methods by comparing calculation results with experimental data
wwwintechopencom
Aerodynamic Heating at Hypersonic Speed
243
In 2006-2007 on TsNIImashrsquos experimental base in a piston gasdynamic wind tunnel PGU-7 a heat transfer study has been conducted on a small-scale model of Pre-X reentry demonstrator (Baiocco 2006) This vehicle is designed to obtain in flight conditions experimental data pertaining to aerothermodynamic phenomena that are not modeled in ground tests but they are critical for design of a vehicle returning from the Earthrsquos orbit In particular Pre-X demonstrator is developed to test in a real flight and in specified locations on the vehicle surface samples of reusable thermal protection materials and to assess their durability During the study thermovision measurements have been conducted of heat fluxes on the model of scale 115 at various flow regimes ndash M = 10 Re = 1106-5106 1m (Kovalev et al 2009) Processing of thermovision measurements was carried out in accordance with standard technique and composed of determination of the model surface temperature during experiment extraction from these data distributions of heat fluxes on the observed model surface and binding of the resulting thermovision frame to a three-dimensional CAD model of the demonstrator The same CAD model has been used for numerical simulation of heat transfer on the Pre-X test model As a normalizing value the heat flux q0 at the stagnation point of a sphere with radius of 70 mm is adopted which is determined using the Fay-Riddell formula Advantage of data presentation in this form is due to invariability of the relative values Q = qq0 on most model surface at variations of flow parameters
Fig 7 Calculated distributions of pressure Р = ちρinfinVinfin2 (left) and stagnation temperature T0 K (right) on surface and in shock layer (in symmetry plane and in exit section) for test model of Pre-X vehicle
On the base of the numerical solution of the Navier-Stokes equations a study was carried out of flow parameters and heat transfer for laminar flow over a test model of Pre-X space
wwwintechopencom
Heat Transfer - Mathematical Modelling Numerical Methods and Information Technology
244
vehicle for experimental conditions in the piston gasdynamic wind tunnel Mach and Reynolds numbers calculated from the free-stream parameters and the length of the model (330 mm) are Minfin = 10 and Reinfin = 7middot105 Angle of attack ndash 45deg The flap deflection angle was (as in the experiment) = 5 10 and 15deg The stagnation temperature of the free-stream flow and the wing surface temperature ndash T0infin = 1000 K and Tw = 300 K respectively An approximation of a perfect gas was used with ratio of specific heats = 14 The calculations were performed with a shock-fitting procedure ie the bow shock was considered as a discontinuity with implementation of the Rankine-Hugoniot relations (4) across it On the model surface no-slip and fixed temperature conditions were set Note that in view of the flow symmetry computations were made only for a half of the model although in the figures below for comparison with experiment the calculated data (upon reflection in the symmetry plane) are presented on the entire model The overall flow pattern obtained in the calculations over the test model of Pre-X space vehicle is shown in Fig 7 where for the case of the flap deflection angle = 15deg pressure and stagnation temperature Т0 isolines in the shock layer and on the model surface are shown It is seen that there are two areas of high pressure on the nose tip of the model (P asymp 092) and on the deflection flaps In the latter case the pressure in the flow passing through the two shock waves reaches P asymp 13 Isolines of Т0 show the size of regions where viscous forces are significant a thin boundary layer on the windward side of the model and an extensive separation zone on the leeward side The small separation zone appearing at deflection flaps although about four times thicker than the boundary layer upstream of it is almost not visible in the scale of the figure Fig 8 shows the distributions of relative heat flow Q on the windward side of the model obtained in the experiments and in the calculations at deflection angles of flaps = 5 10 and 15deg For the case = 5deg it can be noted rather good agreement between experiment and calculation in the values of heat flux in the central part of the model and on the flaps It is evident that before deflected flaps there is a region of low heat fluxes caused by near separation state (according to calculation results) of the boundary layer In analyzing the experimental data it should be taken into account the effect of apparent temperature reduction of the surface area with a large angle to the thermovision observation line It is precisely this effect that explains the fact that in the nose part of the model the experimental values of heat flux are less than the calculated ones Also narrow zones of high (at the sharp edges of the flaps) or low (in the separation zone at the root of the flaps) values of heat flux are smoothed or not visible in the experiment due to insufficient resolution of thermovision equipment The resolution capability of thermovisor is clearly visible by the size of cells in the experimental isoline pattern of heat flux in Fig 8 It should be noted that the calculations do not take into account a slit between the deflection flaps available on the test model the presence of which should lead to a decrease in the separation region in front of the flaps At an angle of flap deflection = 10deg as in the previous case = 5deg there is fairly good agreement between calculation and experiment for the values of heat flux in the central part of the model and on the flaps The calculations show that the growth of the flap deflection angle from 5deg to 10deg results in the formation of a large separation zone in front of the flaps and in a decrease in heat flux value Q from 02 to 01 At the largest angle of flap deflection = 15deg the maximum of calculated heat flux occurs in the zone of impingement of the separated boundary layer where the level of Q is 2-3 times higher than its level on the undeflected flap The coincidence of calculation results with
wwwintechopencom
Aerodynamic Heating at Hypersonic Speed
245
experimental data in the front part of the model up to the separation zone before the flaps is satisfactory On the flaps the level of heat flux in the experiment is about one and a half times more than in the calculation This difference in heat flux values is apparently due to laminar-turbulent transition in separation region induced by the deflected flaps which takes place in the experiment
δ = 5deg
δ = 10deg
δ = 15deg
Fig 8 Experimental (left) and calculated (right) heat fluxes Q = qq0 on windward side of test model of Pre-X space vehicle at different deflection angles of flaps
wwwintechopencom
Heat Transfer - Mathematical Modelling Numerical Methods and Information Technology
246
33 Flow and heat transfer on a winged space vehicle at reentry to Earths atmosphere This section presents the results of numerical simulation of flow and heat transfer on a
winged version of the small-scale reentry vehicle being developed in TsAGI (Vaganov et al
2006) moving at hypersonic speed in the Earths atmosphere Calculations were made using
two physical-chemical models of the gas medium - equilibrium and non-equilibrium
chemically reacting air
The bow shock was captured in contrast to the previous two flow cases Thus on the inflow
boundary the free-stream conditions were specified On the vehicle surface no-slip and
adiabatic wall conditions were supposed In calculations with use of the nonequilibrium air
model the vehicle surface was supposed to be low catalytical with the probability of
heterogeneous recombination of O and N atoms equal to А = 001
A computational grid was provided by Mikhalin VA (Dmitriev et al 2007) and was taken
from the inviscid flow calculation The number of points in the direction normal to the
vehicle surface has been increased to resolve the wall boundary layer Part of the results
presented below was reported in (Dmitriev et al 2007 Gorshkov et al 2008a)
Calculations were performed for two points of a reentry trajectory for which thermal loads
are close to maximum (Table 1) The angle of attack α = 35deg the vehicle length L = 9m A
grid 93times50times101 in the longitudinal transverse and circumferential directions respectively
were used in the calculations The surface grid of the vehicle is shown in Fig 9
Н
km
Vinfin
msec ReinfinL Minfin Рinfin atm Тinfin K
70 5952 346middot105 200 576middot10-5 219
63 5152 684middot105 166 159middot10-4 243
Table 1 Parameters of trajectory points
Fig 9 Surface grid of the small-scale reentry vehicle
In Fig 10a contours of total enthalpy H0 on the surface and in the shock layer near the reentry vehicle are shown On the windward side one can see the shock wave the thin wall boundary layer and the inviscid flow between them in which the values of H0 are constant In the calculations the shock wave is smeared upon 3-5 grid points and has a finite thickness due to the use of artificial dissipation In particular a local decrease in H0 in a strong shock
wwwintechopencom
Aerodynamic Heating at Hypersonic Speed
247
wave on the windward side which can be seen in the figure has no physical meaning and is due to the influence of artificial dissipation Recall that the Navier-Stokes equations do not correctly describe the shock structure at Mach numbers Mgt 15 In the shock layer on the leeward side it is visible a large area with reduced values of total enthalpy Н0ltН0infin (Н0infin ndash total enthalpy in the free-stream) which arises as a result of boundary layer separation from the vehicle surface Chemical processes occurring in the shock layer over the vehicle are illustrated in Fig 10b which shows contours of mass concentrations of oxygen atoms つо Under the considered conditions in the vicinity of the vehicle nose behind the shock wave O2 dissociation is complete On the windward side downstream the nose in the shock layer and on the surface the recombination occurs and the concentration of O decreases In contrast on the leeward side where the flow is very rarefied the level of つо remains high indicating that the process of recombination of atomic oxygen is frozen
boundary layer
shock wave
(a) (b)
Fig 10 Total enthalpy MJkg (a) and mass concentration of oxygen atoms (b) on the surface and in the shock layer near the vehicle 〉 = 63 km
0001
001
01
1
0 5 10
P
x m
equilibrium air
nonequilibrium air
equilibrium air
Fig 11 Pressure distribution P = ちρinfinVinfin2 on vehicle surface overall view (left) and in symmetry plane (right) 〉 = 63 km
wwwintechopencom
Heat Transfer - Mathematical Modelling Numerical Methods and Information Technology
248
In Fig 11 and 12 isolines of pressure heat flux qw and equilibrium radiation temperature Tw
on the vehicle surface are shown for cases of equilibrium and non-equilibrium dissociating
air Comparison of qw and Tw distributions on the vehicle surface in the symmetry plane for
two air models are depicted in Fig 13
Analysis of the calculation results shows that pressure distribution on the windward surface
of the vehicle does not depend on physical-chemical model of the gas medium - the
difference in pressure values for equilibrium and non-equilibrium air flow is 1 - 2 On the
leeward side pressure on the surface for nonequilibrium flow may be nearly two times
lower than for equilibrium flow (eg in the vicinity of the tail) This is probably due to the
fact that the effective ratio of specific heats for nonequilibrium air is greater than for
equilibrium air because in the shock layer on the leeward side nonequilibrium flow is
chemically frozen and here there is a sufficiently high concentration of atoms (see Fig 10b)
equilibrium air nonequilibrium air
Fig 12 Distributions of heat flux qw kWm2 (top) and equilibrium radiation temperature TwdegC (bottom) on the vehicle surface 〉 = 63 km
Nonequilibrium chemical processes in the shock layer and finite catalytic activity of the
vehicle surface (А = 001) significantly reduce the calculated levels of heat transfer in
comparison with the case of equilibrium air flow The most significant decrease in heat flux
is observed on the vehicle nose part (for x le 1 m) and in the vicinity of the tail For example
at the nose stagnation point the level of heat flux decreases by about 40 ndash from 640 to 385
kWm2 while the surface temperature decreases by nearly 15 ndash from 1670 to 1430 degC
Note a high heat flux level on the thin edge of the wing compared with one at the nose
stagnation point Particularly intense heating occurs at the sharp bend of the wing where the
values of heat flux and surface temperature even slightly exceed their values at the front
stagnation point In the case of equilibrium air flow the exceeding for heat flux is about 10
(710 and 640 kWm2) for temperature - 3 (1720 and 1670 degC) In the case of
nonequilibrium air flow the exceeding is more significant for heat flux - 30 (540 and 385
kWm2) for temperature - 10 (1570 and 1430 deg C)
wwwintechopencom
Aerodynamic Heating at Hypersonic Speed
249
In other parts of the vehicle surface difference in heat flux levels for the two air models is somewhat less and it decreases downstream presumably due to gradual recombination of atoms in the boundary layer at flowing along the surface in case of non-equilibrium air
1
10
100
1000
0 5 10
Qw
x m
equilibrium air
nonequilibrium air
0
1000
2000
0 5 10
Tw
x m
equilibrium air
nonequilibrium air
Fig 13 Profiles of heat flux qw kWm2 (left) and equilibrium radiation temperature TwdegC (right) on vehicle surface in symmetry plane 〉 = 63 km
A similar flow and heat flux patterns are observed for the altitude H = 70 km as seen in Fig 14 where contours of heat flux and equilibrium radiation wall temperature are shown at this altitude for the two air models For equilibrium air overall level of heat flux at 70 km is slightly higher than at 63 km For example heat flux value at the nose stagnation point is increased by 5 (675 compared with 640 kWm2) The opposite situation occurs for the model of nonequilibrium air in this case the stagnation point heat flux value at 70 km is lower than at 63 km ndash by 7 (360 and 385 kWm2 respectively)
equilibrium air nonequilibrium air
Fig 14 Distributions of heat flux qw kWm2 (top) and equilibrium radiation temperature TwdegC (bottom) on the vehicle surface 〉 = 70 km
wwwintechopencom
Heat Transfer - Mathematical Modelling Numerical Methods and Information Technology
250
4 Conclusion
A three-dimensional stationary NavierndashStokes computer code for laminar flow developed
by the author has been briefly described The code is mainly intended to calculate super-
and hypersonic flows over bodies accounting for high temperature real gas effects with
special emphasis on convective heat transfer Three gas models perfect gas equilibrium and
nonequilibrium gas mixture can be used in the calculations
In the chapter a comparison of code calculation results with experimental data is made for
two perfect gas hypersonic flow cases at wind tunnel conditions First case is a simulation of
an anomalous heat transfer on the windward side a delta wing with blunt edges On the
whole the calculation correctly predicts the magnitude and position of local maximum of
heat flux near the wing symmetry plane taking into account a small asymmetry in the
experimental data Second case is a computation of heat transfer on a test model of the Pre-X
demonstrator Satisfactory agreement with thermovision heat fluxes on the smooth
windward side and on the flaps is obtained except for the largest deflection angle of flaps
= 15deg when the level of heat flux in the experiment is about one and a half times more than
in the calculation This discrepancy is apparently due to laminar-turbulent transition in
separation region induced by the deflected flaps which takes place in the experiment
Third flow case concerns chemically reacting air flow at equilibrium or nonequilibrium
conditions Flowfield and convective heat transfer parameters for a winged shape of a small-
scale reentry vehicle are calculated for two points of a reentry trajectory in the Earthrsquos
atmosphere Heat flux and equilibrium radiation temperature distributions on the vehicle
surface are obtained Also regions of maximal thermal loadings are localized
Calculations show that for nonequilibrium air flow the use of a low catalytic coating (with
probability of heterogeneous recombination of atoms А = 001) on the vehicle surface
enables to decrease considerably the level of heat fluxes in regions of maximal heat transfer
in the nose part and on the wing edges in comparison with equilibrium air flow For
example for trajectory points with maximal thermal load a reduction of up to 40 in heat
flux (which results in a 15 reduction of equilibrium radiation wall temperature) can be
obtained at the vehicle nose
5 Acknowledgments
The author is grateful to Kovalev RV Marinin VP and Vlasov VI for delivering
thermovision data on test model of Pre-X vehicle and also to Churakov DA and Mihalin
VA for providing computational grids
6 References
Baiocco P Guedron S Plotard P amp Moulin J (2006) The Pre-X atmospheric re-entry
experimental lifting body Program status and system synthesis Proceedings of 57th
International Astronautical Congress 2-6 October 2006 IAC-06-D2P22
Churakov DA Gorshkov AB Kovalev RV Vlasov VI Beloshitsky AV Dyadkin
AA amp Zhurin SV (2008) Heat Transfer of Reentry Vehicles during Atmosphere
Flight Proceedings of 6-th European Symposium on Aerothermodynamics for Space
Vehicles Versailles France 3 - 6 November 2008
wwwintechopencom
Aerodynamic Heating at Hypersonic Speed
251
Dmitriev VG Vaganov AV Gorshkov AB Lapygin VI Galaktionov AYu amp
Mikhalin VA (2007) Analysis of Aerothermodynamic Parameters of Reusable
Space Wing Vehicle Proceedings of 2nd European Conference for Aero-Space Sciences
Brussels Belgium July 1-6 2007
Gorshkov AB (1997) Calculation of Base Heat Transfer Behind Thin Cone-Shaped Bodies
Cosmonautics and Rocket Engineering No 11 (1997) pp 13-20 (in Russian)
Gorshkov AB Kovalev R V Vlasov V I amp Zemlyanskiy B A (2008a) Simulation of
Heat Transfer to Space Vehicles during a Gliding Reentry into Earthrsquos
Atmosphere Proceedings of 14th International Conference on Methods of Aerophysical
Research (ICMAR-2008) Novosibirsk Russia 30 June - 06 July 2008
Gorshkov AB Kovalev R V Vlasov amp V I Zemlyanskiy B A (2008b) Heat Transfer
Investigation for Hypersonic Flow over Experimental Model of Pre-X Reentry
Vehicle Proceedings of 7th Sino-Russian High-Speed Flow Conference (SRHFC-7)
Novosibirsk Russia 1 - 3 July 2008
Grantham WL (1970) Flight results of a 25000 fps re-entry experiment NASA TN D 6062
Gubanova OI Zemlyansky BA Lessin AB Lunev VV Nikulin AN amp Syusin AV
(1992) Anomalous heat transfer on the windward side of a delta wing with a blunt
tip in hypersonic flow In Aerothermodynamics of aerospace systems Pt 1 pp 188-196
Moscow TsAGI (in Russian)
Hoffmann KA Chiang ST (2000) Computational fluid dynamics Vol 2 Engineering
Educational Systems ISBN 0-9623731-3-3 Kansas USA
Inouye Y (1995) OREX flight ndash quick report and lessons learned Proceedings of 2nd
European Symposium on Aerothermodynamics for Space Vehicles pp 271-279 ESTEC
Noordwik The Netherlands Europe Space Agency (November 1994)
Kovalev RV Kislykh VV Kolozezniy AE Kudryavtsev VV Marinin VP Vlasov
VI amp Zemliansky BA (2009) Experimental studies of Pre-X vehicle heat transfer
in PGU-7 test facility 3rd European Conference for Aerospace Sciences (EUCASS-2009)
Versailles France 6-9 July 2009
Lesin AB amp Lunev VV (1994) Heat transfer peaks on a blunt-nosed triangular plate in
hypersonic flow Fluid Dynamics Vol 29 No 2 (April 1994) pp 258-262 ISSN
0015-4628
Mason EA amp Saxena SC (1958) Approximate Formula for the Thermal Conductivity of
Gas Mixtures Phys Fluids Vol 1 No 5 (1958) pp 361-369
Pulliam TH (1986) Artificial dissipation models for the Euler equations AIAA Journal
Vol24 No 12 (December 1986) pp 1931-1940 ISSN 0001-1452
Vaganov AV Dmitriev VG Zadonsky SM Kireev AY Skuratov AS amp Stepanov
EA (2006) Estimations of low-sized winged reentry vehicle heat regimes on the
stage of its designing Physico-chemical kinetics in gas dynamics
wwwchemphysedurupdf2006-11-20-002pdf (in Russian)
Vlasov VI Gorshkov AB Kovalev RV amp Plastinin YuA (1997) Theoretical studies of
air ionization and NO vibrational excitation in low density hypersonic flow around
re-entry bodies AIAA Paper No 97-2582 (1997)
Vlasov V I amp Gorshkov A B (2001) Comparison of the Calculated Results for Hypersonic
Flow Past Blunt Bodies with the OREX Flight Test Data Fluid Dynamics Vol 36
No 5 (October 2001) pp 812-819 ISSN 0015-4628
wwwintechopencom
Heat Transfer - Mathematical Modelling Numerical Methods and Information Technology
252
Vlasov VI Gorshkov AB Kovalev RV amp Lunev VV (2009) Thin triangular blunt-
nosed plate in a viscous hypersonic flow Fluid Dynamics Vol 44 No 4 (August
2009) pp 596-605 ISSN 0015-4628
Wilke C (1950) A Viscosity Equation for Gas Mixtures JChemPhys Vol 18 No 4 (1950)
pp517-519
Yoon S amp Jameson A (1987) An LU-SSOR Scheme for the Euler and Navier-Stokes
Equations AIAA Paper No 87-0600 (1987)
wwwintechopencom
Heat Transfer - Mathematical Modelling Numerical Methods andInformation TechnologyEdited by Prof Aziz Belmiloudi
ISBN 978-953-307-550-1Hard cover 642 pagesPublisher InTechPublished online 14 February 2011Published in print edition February 2011
InTech EuropeUniversity Campus STeP Ri Slavka Krautzeka 83A 51000 Rijeka Croatia Phone +385 (51) 770 447 Fax +385 (51) 686 166
InTech ChinaUnit 405 Office Block Hotel Equatorial Shanghai No65 Yan An Road (West) Shanghai 200040 China
Phone +86-21-62489820 Fax +86-21-62489821
Over the past few decades there has been a prolific increase in research and development in area of heattransfer heat exchangers and their associated technologies This book is a collection of current research inthe above mentioned areas and describes modelling numerical methods simulation and informationtechnology with modern ideas and methods to analyse and enhance heat transfer for single and multiphasesystems The topics considered include various basic concepts of heat transfer the fundamental modes ofheat transfer (namely conduction convection and radiation) thermophysical properties computationalmethodologies control stabilization and optimization problems condensation boiling and freezing with manyreal-world problems and important modern applications The book is divided in four sections InverseStabilization and Optimization Problems Numerical Methods and Calculations Heat Transfer in MiniMicroSystems Energy Transfer and Solid Materials and each section discusses various issues methods andapplications in accordance with the subjects The combination of fundamental approach with many importantpractical applications of current interest will make this book of interest to researchers scientists engineers andgraduate students in many disciplines who make use of mathematical modelling inverse problemsimplementation of recently developed numerical methods in this multidisciplinary field as well as toexperimental and theoretical researchers in the field of heat and mass transfer
How to referenceIn order to correctly reference this scholarly work feel free to copy and paste the following
Andrey B Gorshkov (2011) Aerodynamic Heating at Hypersonic Speed Heat Transfer - MathematicalModelling Numerical Methods and Information Technology Prof Aziz Belmiloudi (Ed) ISBN 978-953-307-550-1 InTech Available from httpwwwintechopencombooksheat-transfer-mathematical-modelling-numerical-methods-and-information-technologyaerodynamic-heating-at-hypersonic-speed
wwwintechopencom
wwwintechopencom
copy 2011 The Author(s) Licensee IntechOpen This chapter is distributedunder the terms of the Creative Commons Attribution-NonCommercial-ShareAlike-30 License which permits use distribution and reproduction fornon-commercial purposes provided the original is properly cited andderivative works building on this content are distributed under the samelicense
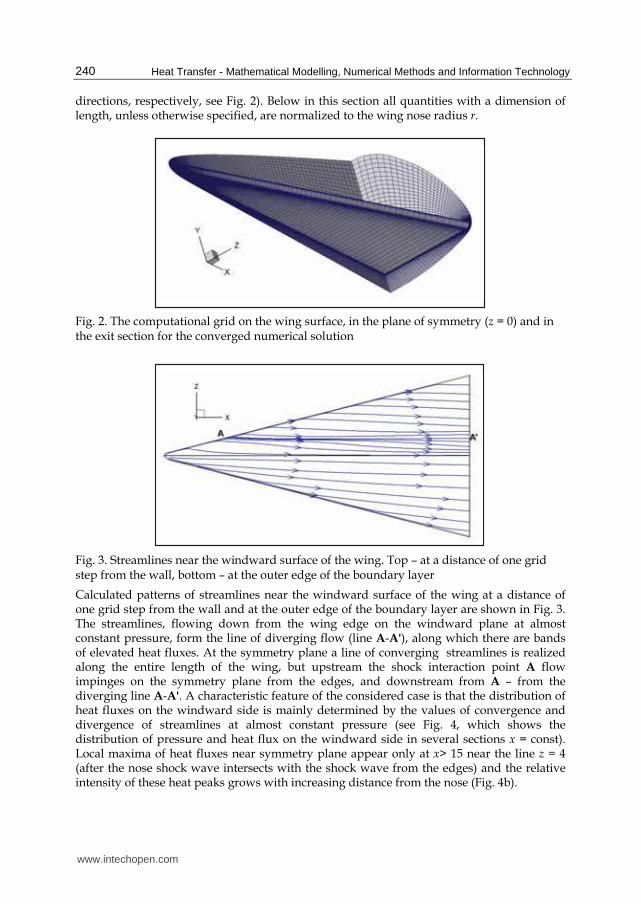
Heat Transfer - Mathematical Modelling Numerical Methods and Information Technology
240
directions respectively see Fig 2) Below in this section all quantities with a dimension of length unless otherwise specified are normalized to the wing nose radius r
Fig 2 The computational grid on the wing surface in the plane of symmetry (z = 0) and in the exit section for the converged numerical solution
Fig 3 Streamlines near the windward surface of the wing Top ndash at a distance of one grid step from the wall bottom ndash at the outer edge of the boundary layer
Calculated patterns of streamlines near the windward surface of the wing at a distance of one grid step from the wall and at the outer edge of the boundary layer are shown in Fig 3 The streamlines flowing down from the wing edge on the windward plane at almost constant pressure form the line of diverging flow (line A-A) along which there are bands of elevated heat fluxes At the symmetry plane a line of converging streamlines is realized along the entire length of the wing but upstream the shock interaction point A flow impinges on the symmetry plane from the edges and downstream from A ndash from the diverging line A-A A characteristic feature of the considered case is that the distribution of heat fluxes on the windward side is mainly determined by the values of convergence and divergence of streamlines at almost constant pressure (see Fig 4 which shows the distribution of pressure and heat flux on the windward side in several sections x = const) Local maxima of heat fluxes near symmetry plane appear only at xgt 15 near the line z = 4 (after the nose shock wave intersects with the shock wave from the edges) and the relative intensity of these heat peaks grows with increasing distance from the nose (Fig 4b)
wwwintechopencom
Aerodynamic Heating at Hypersonic Speed
241
003
008
0 05 1
P
1
2 34
5
z
0
005
01
015
0 5 10
Q
z
12
34
(a) (b)
Fig 4 Pressure distribution Р = pρinfinVinfin2 (a) and heat flux Q = qq0 (b) on windward side of wing in sections 1-5 ndash x = 10 20 30 50 90 z= zzmax zmax ndash wingspan in section х = const
Comparison of the upper and lower parts of Fig 3 shows that the flow near the wall and at the outer edge of the boundary layer are noticeably different the streamlines near the wall are directed to the symmetry plane (converging) and in inviscid region ndash from it (diverging) It follows that the velocity component directed along the wing chord changes sign across the boundary layer which indicates the existence of transverse vortex (cross separation flow) in the boundary layer This is illustrated in Fig 5a which shows the projection of streamlines on the plane of the cross section at x = 90
400
1200
1200
700
1000T
0
(a) (b)
Fig 5 Projection of streamlines (a) and isolines of stagnation temperature T0 K (b) in cross section x = 90
The distribution of the boundary layer thickness is clearly seen in Fig 5b which shows the contours of the stagnation temperature T0 in the cross section x = 90 On the windward side of the wing minimum thickness of the boundary layer is located on the diverging line (line A-A in Fig 3) On the left and on the right sides of the diverging line there are converging lines with a thicker boundary layer (about 2 and 3 times respectively) One of the
wwwintechopencom
Heat Transfer - Mathematical Modelling Numerical Methods and Information Technology
242
converging lines is the symmetry plane Here the boundary layer thickness on the windward side reaches a maximum amounting to about one-third of the shock layer thickness Near the wing edge because of the expansion and acceleration of the flow the boundary layer thickness decreases sharply (at the edge it is almost 20 times less than at the symmetry plane on the windward side) On the leeward side of the wing flow separation occurs and the concept of the boundary layer loses its meaning Here scope of viscous flow is half the shock layer The shape of calculated shock wave in Fig 6a induced by the wing nose as a blunt body is determined by the law of the explosive analogy so that some front part of the wing
x le xA asymp 15 will be located inside the initially axisymmetric shock wave The coordinate of point A (xA) is located in the vicinity of interaction region of shock waves induced by the nose and the edges of the wing Here the profiles of pressure and heat flux along the edge are local maxima
0
10
000
005
0 15 30
zP
Q2
x
shock wing edge
P
Q
xA
0
005
-1 -05 0 05 1
Q
z
calculation
experiment
(a) (b)
Fig 6 Profiles of pressure heat flux and the shock wave along the wing edge (a) and distribution of heat fluxes in cross section x = 90 (b)
In Fig 6b the distribution of computed heat fluxes qq0 in the neighborhood of the wing end section at x = 90 is presented in comparison with the experiment of Gubanova et al (1992) depending on the transverse coordinate z On the whole the calculation correctly predicts the magnitude and position of local maximum of heat flux near the symmetry plane taking into account the small asymmetry in the experimental data Note that near the minima of heat fluxes calculated values are lower than experimental ones probably due to effect of smoothing of experimental data in these narrow regions
32 Heat transfer on test model of Pre-X space vehicle Currently developed hypersonic aircraft have dimensions several times smaller than previously created space vehicles Shuttle and Buran This results in increase of heat load on a vehicle during flight and therefore the problem of reliable calculation of heat fluxes on the surface for such relatively small bodies is particularly important Thus the problem arises of verification of the employed physical models and numerical methods by comparing calculation results with experimental data
wwwintechopencom
Aerodynamic Heating at Hypersonic Speed
243
In 2006-2007 on TsNIImashrsquos experimental base in a piston gasdynamic wind tunnel PGU-7 a heat transfer study has been conducted on a small-scale model of Pre-X reentry demonstrator (Baiocco 2006) This vehicle is designed to obtain in flight conditions experimental data pertaining to aerothermodynamic phenomena that are not modeled in ground tests but they are critical for design of a vehicle returning from the Earthrsquos orbit In particular Pre-X demonstrator is developed to test in a real flight and in specified locations on the vehicle surface samples of reusable thermal protection materials and to assess their durability During the study thermovision measurements have been conducted of heat fluxes on the model of scale 115 at various flow regimes ndash M = 10 Re = 1106-5106 1m (Kovalev et al 2009) Processing of thermovision measurements was carried out in accordance with standard technique and composed of determination of the model surface temperature during experiment extraction from these data distributions of heat fluxes on the observed model surface and binding of the resulting thermovision frame to a three-dimensional CAD model of the demonstrator The same CAD model has been used for numerical simulation of heat transfer on the Pre-X test model As a normalizing value the heat flux q0 at the stagnation point of a sphere with radius of 70 mm is adopted which is determined using the Fay-Riddell formula Advantage of data presentation in this form is due to invariability of the relative values Q = qq0 on most model surface at variations of flow parameters
Fig 7 Calculated distributions of pressure Р = ちρinfinVinfin2 (left) and stagnation temperature T0 K (right) on surface and in shock layer (in symmetry plane and in exit section) for test model of Pre-X vehicle
On the base of the numerical solution of the Navier-Stokes equations a study was carried out of flow parameters and heat transfer for laminar flow over a test model of Pre-X space
wwwintechopencom
Heat Transfer - Mathematical Modelling Numerical Methods and Information Technology
244
vehicle for experimental conditions in the piston gasdynamic wind tunnel Mach and Reynolds numbers calculated from the free-stream parameters and the length of the model (330 mm) are Minfin = 10 and Reinfin = 7middot105 Angle of attack ndash 45deg The flap deflection angle was (as in the experiment) = 5 10 and 15deg The stagnation temperature of the free-stream flow and the wing surface temperature ndash T0infin = 1000 K and Tw = 300 K respectively An approximation of a perfect gas was used with ratio of specific heats = 14 The calculations were performed with a shock-fitting procedure ie the bow shock was considered as a discontinuity with implementation of the Rankine-Hugoniot relations (4) across it On the model surface no-slip and fixed temperature conditions were set Note that in view of the flow symmetry computations were made only for a half of the model although in the figures below for comparison with experiment the calculated data (upon reflection in the symmetry plane) are presented on the entire model The overall flow pattern obtained in the calculations over the test model of Pre-X space vehicle is shown in Fig 7 where for the case of the flap deflection angle = 15deg pressure and stagnation temperature Т0 isolines in the shock layer and on the model surface are shown It is seen that there are two areas of high pressure on the nose tip of the model (P asymp 092) and on the deflection flaps In the latter case the pressure in the flow passing through the two shock waves reaches P asymp 13 Isolines of Т0 show the size of regions where viscous forces are significant a thin boundary layer on the windward side of the model and an extensive separation zone on the leeward side The small separation zone appearing at deflection flaps although about four times thicker than the boundary layer upstream of it is almost not visible in the scale of the figure Fig 8 shows the distributions of relative heat flow Q on the windward side of the model obtained in the experiments and in the calculations at deflection angles of flaps = 5 10 and 15deg For the case = 5deg it can be noted rather good agreement between experiment and calculation in the values of heat flux in the central part of the model and on the flaps It is evident that before deflected flaps there is a region of low heat fluxes caused by near separation state (according to calculation results) of the boundary layer In analyzing the experimental data it should be taken into account the effect of apparent temperature reduction of the surface area with a large angle to the thermovision observation line It is precisely this effect that explains the fact that in the nose part of the model the experimental values of heat flux are less than the calculated ones Also narrow zones of high (at the sharp edges of the flaps) or low (in the separation zone at the root of the flaps) values of heat flux are smoothed or not visible in the experiment due to insufficient resolution of thermovision equipment The resolution capability of thermovisor is clearly visible by the size of cells in the experimental isoline pattern of heat flux in Fig 8 It should be noted that the calculations do not take into account a slit between the deflection flaps available on the test model the presence of which should lead to a decrease in the separation region in front of the flaps At an angle of flap deflection = 10deg as in the previous case = 5deg there is fairly good agreement between calculation and experiment for the values of heat flux in the central part of the model and on the flaps The calculations show that the growth of the flap deflection angle from 5deg to 10deg results in the formation of a large separation zone in front of the flaps and in a decrease in heat flux value Q from 02 to 01 At the largest angle of flap deflection = 15deg the maximum of calculated heat flux occurs in the zone of impingement of the separated boundary layer where the level of Q is 2-3 times higher than its level on the undeflected flap The coincidence of calculation results with
wwwintechopencom
Aerodynamic Heating at Hypersonic Speed
245
experimental data in the front part of the model up to the separation zone before the flaps is satisfactory On the flaps the level of heat flux in the experiment is about one and a half times more than in the calculation This difference in heat flux values is apparently due to laminar-turbulent transition in separation region induced by the deflected flaps which takes place in the experiment
δ = 5deg
δ = 10deg
δ = 15deg
Fig 8 Experimental (left) and calculated (right) heat fluxes Q = qq0 on windward side of test model of Pre-X space vehicle at different deflection angles of flaps
wwwintechopencom
Heat Transfer - Mathematical Modelling Numerical Methods and Information Technology
246
33 Flow and heat transfer on a winged space vehicle at reentry to Earths atmosphere This section presents the results of numerical simulation of flow and heat transfer on a
winged version of the small-scale reentry vehicle being developed in TsAGI (Vaganov et al
2006) moving at hypersonic speed in the Earths atmosphere Calculations were made using
two physical-chemical models of the gas medium - equilibrium and non-equilibrium
chemically reacting air
The bow shock was captured in contrast to the previous two flow cases Thus on the inflow
boundary the free-stream conditions were specified On the vehicle surface no-slip and
adiabatic wall conditions were supposed In calculations with use of the nonequilibrium air
model the vehicle surface was supposed to be low catalytical with the probability of
heterogeneous recombination of O and N atoms equal to А = 001
A computational grid was provided by Mikhalin VA (Dmitriev et al 2007) and was taken
from the inviscid flow calculation The number of points in the direction normal to the
vehicle surface has been increased to resolve the wall boundary layer Part of the results
presented below was reported in (Dmitriev et al 2007 Gorshkov et al 2008a)
Calculations were performed for two points of a reentry trajectory for which thermal loads
are close to maximum (Table 1) The angle of attack α = 35deg the vehicle length L = 9m A
grid 93times50times101 in the longitudinal transverse and circumferential directions respectively
were used in the calculations The surface grid of the vehicle is shown in Fig 9
Н
km
Vinfin
msec ReinfinL Minfin Рinfin atm Тinfin K
70 5952 346middot105 200 576middot10-5 219
63 5152 684middot105 166 159middot10-4 243
Table 1 Parameters of trajectory points
Fig 9 Surface grid of the small-scale reentry vehicle
In Fig 10a contours of total enthalpy H0 on the surface and in the shock layer near the reentry vehicle are shown On the windward side one can see the shock wave the thin wall boundary layer and the inviscid flow between them in which the values of H0 are constant In the calculations the shock wave is smeared upon 3-5 grid points and has a finite thickness due to the use of artificial dissipation In particular a local decrease in H0 in a strong shock
wwwintechopencom
Aerodynamic Heating at Hypersonic Speed
247
wave on the windward side which can be seen in the figure has no physical meaning and is due to the influence of artificial dissipation Recall that the Navier-Stokes equations do not correctly describe the shock structure at Mach numbers Mgt 15 In the shock layer on the leeward side it is visible a large area with reduced values of total enthalpy Н0ltН0infin (Н0infin ndash total enthalpy in the free-stream) which arises as a result of boundary layer separation from the vehicle surface Chemical processes occurring in the shock layer over the vehicle are illustrated in Fig 10b which shows contours of mass concentrations of oxygen atoms つо Under the considered conditions in the vicinity of the vehicle nose behind the shock wave O2 dissociation is complete On the windward side downstream the nose in the shock layer and on the surface the recombination occurs and the concentration of O decreases In contrast on the leeward side where the flow is very rarefied the level of つо remains high indicating that the process of recombination of atomic oxygen is frozen
boundary layer
shock wave
(a) (b)
Fig 10 Total enthalpy MJkg (a) and mass concentration of oxygen atoms (b) on the surface and in the shock layer near the vehicle 〉 = 63 km
0001
001
01
1
0 5 10
P
x m
equilibrium air
nonequilibrium air
equilibrium air
Fig 11 Pressure distribution P = ちρinfinVinfin2 on vehicle surface overall view (left) and in symmetry plane (right) 〉 = 63 km
wwwintechopencom
Heat Transfer - Mathematical Modelling Numerical Methods and Information Technology
248
In Fig 11 and 12 isolines of pressure heat flux qw and equilibrium radiation temperature Tw
on the vehicle surface are shown for cases of equilibrium and non-equilibrium dissociating
air Comparison of qw and Tw distributions on the vehicle surface in the symmetry plane for
two air models are depicted in Fig 13
Analysis of the calculation results shows that pressure distribution on the windward surface
of the vehicle does not depend on physical-chemical model of the gas medium - the
difference in pressure values for equilibrium and non-equilibrium air flow is 1 - 2 On the
leeward side pressure on the surface for nonequilibrium flow may be nearly two times
lower than for equilibrium flow (eg in the vicinity of the tail) This is probably due to the
fact that the effective ratio of specific heats for nonequilibrium air is greater than for
equilibrium air because in the shock layer on the leeward side nonequilibrium flow is
chemically frozen and here there is a sufficiently high concentration of atoms (see Fig 10b)
equilibrium air nonequilibrium air
Fig 12 Distributions of heat flux qw kWm2 (top) and equilibrium radiation temperature TwdegC (bottom) on the vehicle surface 〉 = 63 km
Nonequilibrium chemical processes in the shock layer and finite catalytic activity of the
vehicle surface (А = 001) significantly reduce the calculated levels of heat transfer in
comparison with the case of equilibrium air flow The most significant decrease in heat flux
is observed on the vehicle nose part (for x le 1 m) and in the vicinity of the tail For example
at the nose stagnation point the level of heat flux decreases by about 40 ndash from 640 to 385
kWm2 while the surface temperature decreases by nearly 15 ndash from 1670 to 1430 degC
Note a high heat flux level on the thin edge of the wing compared with one at the nose
stagnation point Particularly intense heating occurs at the sharp bend of the wing where the
values of heat flux and surface temperature even slightly exceed their values at the front
stagnation point In the case of equilibrium air flow the exceeding for heat flux is about 10
(710 and 640 kWm2) for temperature - 3 (1720 and 1670 degC) In the case of
nonequilibrium air flow the exceeding is more significant for heat flux - 30 (540 and 385
kWm2) for temperature - 10 (1570 and 1430 deg C)
wwwintechopencom
Aerodynamic Heating at Hypersonic Speed
249
In other parts of the vehicle surface difference in heat flux levels for the two air models is somewhat less and it decreases downstream presumably due to gradual recombination of atoms in the boundary layer at flowing along the surface in case of non-equilibrium air
1
10
100
1000
0 5 10
Qw
x m
equilibrium air
nonequilibrium air
0
1000
2000
0 5 10
Tw
x m
equilibrium air
nonequilibrium air
Fig 13 Profiles of heat flux qw kWm2 (left) and equilibrium radiation temperature TwdegC (right) on vehicle surface in symmetry plane 〉 = 63 km
A similar flow and heat flux patterns are observed for the altitude H = 70 km as seen in Fig 14 where contours of heat flux and equilibrium radiation wall temperature are shown at this altitude for the two air models For equilibrium air overall level of heat flux at 70 km is slightly higher than at 63 km For example heat flux value at the nose stagnation point is increased by 5 (675 compared with 640 kWm2) The opposite situation occurs for the model of nonequilibrium air in this case the stagnation point heat flux value at 70 km is lower than at 63 km ndash by 7 (360 and 385 kWm2 respectively)
equilibrium air nonequilibrium air
Fig 14 Distributions of heat flux qw kWm2 (top) and equilibrium radiation temperature TwdegC (bottom) on the vehicle surface 〉 = 70 km
wwwintechopencom
Heat Transfer - Mathematical Modelling Numerical Methods and Information Technology
250
4 Conclusion
A three-dimensional stationary NavierndashStokes computer code for laminar flow developed
by the author has been briefly described The code is mainly intended to calculate super-
and hypersonic flows over bodies accounting for high temperature real gas effects with
special emphasis on convective heat transfer Three gas models perfect gas equilibrium and
nonequilibrium gas mixture can be used in the calculations
In the chapter a comparison of code calculation results with experimental data is made for
two perfect gas hypersonic flow cases at wind tunnel conditions First case is a simulation of
an anomalous heat transfer on the windward side a delta wing with blunt edges On the
whole the calculation correctly predicts the magnitude and position of local maximum of
heat flux near the wing symmetry plane taking into account a small asymmetry in the
experimental data Second case is a computation of heat transfer on a test model of the Pre-X
demonstrator Satisfactory agreement with thermovision heat fluxes on the smooth
windward side and on the flaps is obtained except for the largest deflection angle of flaps
= 15deg when the level of heat flux in the experiment is about one and a half times more than
in the calculation This discrepancy is apparently due to laminar-turbulent transition in
separation region induced by the deflected flaps which takes place in the experiment
Third flow case concerns chemically reacting air flow at equilibrium or nonequilibrium
conditions Flowfield and convective heat transfer parameters for a winged shape of a small-
scale reentry vehicle are calculated for two points of a reentry trajectory in the Earthrsquos
atmosphere Heat flux and equilibrium radiation temperature distributions on the vehicle
surface are obtained Also regions of maximal thermal loadings are localized
Calculations show that for nonequilibrium air flow the use of a low catalytic coating (with
probability of heterogeneous recombination of atoms А = 001) on the vehicle surface
enables to decrease considerably the level of heat fluxes in regions of maximal heat transfer
in the nose part and on the wing edges in comparison with equilibrium air flow For
example for trajectory points with maximal thermal load a reduction of up to 40 in heat
flux (which results in a 15 reduction of equilibrium radiation wall temperature) can be
obtained at the vehicle nose
5 Acknowledgments
The author is grateful to Kovalev RV Marinin VP and Vlasov VI for delivering
thermovision data on test model of Pre-X vehicle and also to Churakov DA and Mihalin
VA for providing computational grids
6 References
Baiocco P Guedron S Plotard P amp Moulin J (2006) The Pre-X atmospheric re-entry
experimental lifting body Program status and system synthesis Proceedings of 57th
International Astronautical Congress 2-6 October 2006 IAC-06-D2P22
Churakov DA Gorshkov AB Kovalev RV Vlasov VI Beloshitsky AV Dyadkin
AA amp Zhurin SV (2008) Heat Transfer of Reentry Vehicles during Atmosphere
Flight Proceedings of 6-th European Symposium on Aerothermodynamics for Space
Vehicles Versailles France 3 - 6 November 2008
wwwintechopencom
Aerodynamic Heating at Hypersonic Speed
251
Dmitriev VG Vaganov AV Gorshkov AB Lapygin VI Galaktionov AYu amp
Mikhalin VA (2007) Analysis of Aerothermodynamic Parameters of Reusable
Space Wing Vehicle Proceedings of 2nd European Conference for Aero-Space Sciences
Brussels Belgium July 1-6 2007
Gorshkov AB (1997) Calculation of Base Heat Transfer Behind Thin Cone-Shaped Bodies
Cosmonautics and Rocket Engineering No 11 (1997) pp 13-20 (in Russian)
Gorshkov AB Kovalev R V Vlasov V I amp Zemlyanskiy B A (2008a) Simulation of
Heat Transfer to Space Vehicles during a Gliding Reentry into Earthrsquos
Atmosphere Proceedings of 14th International Conference on Methods of Aerophysical
Research (ICMAR-2008) Novosibirsk Russia 30 June - 06 July 2008
Gorshkov AB Kovalev R V Vlasov amp V I Zemlyanskiy B A (2008b) Heat Transfer
Investigation for Hypersonic Flow over Experimental Model of Pre-X Reentry
Vehicle Proceedings of 7th Sino-Russian High-Speed Flow Conference (SRHFC-7)
Novosibirsk Russia 1 - 3 July 2008
Grantham WL (1970) Flight results of a 25000 fps re-entry experiment NASA TN D 6062
Gubanova OI Zemlyansky BA Lessin AB Lunev VV Nikulin AN amp Syusin AV
(1992) Anomalous heat transfer on the windward side of a delta wing with a blunt
tip in hypersonic flow In Aerothermodynamics of aerospace systems Pt 1 pp 188-196
Moscow TsAGI (in Russian)
Hoffmann KA Chiang ST (2000) Computational fluid dynamics Vol 2 Engineering
Educational Systems ISBN 0-9623731-3-3 Kansas USA
Inouye Y (1995) OREX flight ndash quick report and lessons learned Proceedings of 2nd
European Symposium on Aerothermodynamics for Space Vehicles pp 271-279 ESTEC
Noordwik The Netherlands Europe Space Agency (November 1994)
Kovalev RV Kislykh VV Kolozezniy AE Kudryavtsev VV Marinin VP Vlasov
VI amp Zemliansky BA (2009) Experimental studies of Pre-X vehicle heat transfer
in PGU-7 test facility 3rd European Conference for Aerospace Sciences (EUCASS-2009)
Versailles France 6-9 July 2009
Lesin AB amp Lunev VV (1994) Heat transfer peaks on a blunt-nosed triangular plate in
hypersonic flow Fluid Dynamics Vol 29 No 2 (April 1994) pp 258-262 ISSN
0015-4628
Mason EA amp Saxena SC (1958) Approximate Formula for the Thermal Conductivity of
Gas Mixtures Phys Fluids Vol 1 No 5 (1958) pp 361-369
Pulliam TH (1986) Artificial dissipation models for the Euler equations AIAA Journal
Vol24 No 12 (December 1986) pp 1931-1940 ISSN 0001-1452
Vaganov AV Dmitriev VG Zadonsky SM Kireev AY Skuratov AS amp Stepanov
EA (2006) Estimations of low-sized winged reentry vehicle heat regimes on the
stage of its designing Physico-chemical kinetics in gas dynamics
wwwchemphysedurupdf2006-11-20-002pdf (in Russian)
Vlasov VI Gorshkov AB Kovalev RV amp Plastinin YuA (1997) Theoretical studies of
air ionization and NO vibrational excitation in low density hypersonic flow around
re-entry bodies AIAA Paper No 97-2582 (1997)
Vlasov V I amp Gorshkov A B (2001) Comparison of the Calculated Results for Hypersonic
Flow Past Blunt Bodies with the OREX Flight Test Data Fluid Dynamics Vol 36
No 5 (October 2001) pp 812-819 ISSN 0015-4628
wwwintechopencom
Heat Transfer - Mathematical Modelling Numerical Methods and Information Technology
252
Vlasov VI Gorshkov AB Kovalev RV amp Lunev VV (2009) Thin triangular blunt-
nosed plate in a viscous hypersonic flow Fluid Dynamics Vol 44 No 4 (August
2009) pp 596-605 ISSN 0015-4628
Wilke C (1950) A Viscosity Equation for Gas Mixtures JChemPhys Vol 18 No 4 (1950)
pp517-519
Yoon S amp Jameson A (1987) An LU-SSOR Scheme for the Euler and Navier-Stokes
Equations AIAA Paper No 87-0600 (1987)
wwwintechopencom
Heat Transfer - Mathematical Modelling Numerical Methods andInformation TechnologyEdited by Prof Aziz Belmiloudi
ISBN 978-953-307-550-1Hard cover 642 pagesPublisher InTechPublished online 14 February 2011Published in print edition February 2011
InTech EuropeUniversity Campus STeP Ri Slavka Krautzeka 83A 51000 Rijeka Croatia Phone +385 (51) 770 447 Fax +385 (51) 686 166
InTech ChinaUnit 405 Office Block Hotel Equatorial Shanghai No65 Yan An Road (West) Shanghai 200040 China
Phone +86-21-62489820 Fax +86-21-62489821
Over the past few decades there has been a prolific increase in research and development in area of heattransfer heat exchangers and their associated technologies This book is a collection of current research inthe above mentioned areas and describes modelling numerical methods simulation and informationtechnology with modern ideas and methods to analyse and enhance heat transfer for single and multiphasesystems The topics considered include various basic concepts of heat transfer the fundamental modes ofheat transfer (namely conduction convection and radiation) thermophysical properties computationalmethodologies control stabilization and optimization problems condensation boiling and freezing with manyreal-world problems and important modern applications The book is divided in four sections InverseStabilization and Optimization Problems Numerical Methods and Calculations Heat Transfer in MiniMicroSystems Energy Transfer and Solid Materials and each section discusses various issues methods andapplications in accordance with the subjects The combination of fundamental approach with many importantpractical applications of current interest will make this book of interest to researchers scientists engineers andgraduate students in many disciplines who make use of mathematical modelling inverse problemsimplementation of recently developed numerical methods in this multidisciplinary field as well as toexperimental and theoretical researchers in the field of heat and mass transfer
How to referenceIn order to correctly reference this scholarly work feel free to copy and paste the following
Andrey B Gorshkov (2011) Aerodynamic Heating at Hypersonic Speed Heat Transfer - MathematicalModelling Numerical Methods and Information Technology Prof Aziz Belmiloudi (Ed) ISBN 978-953-307-550-1 InTech Available from httpwwwintechopencombooksheat-transfer-mathematical-modelling-numerical-methods-and-information-technologyaerodynamic-heating-at-hypersonic-speed
wwwintechopencom
wwwintechopencom
copy 2011 The Author(s) Licensee IntechOpen This chapter is distributedunder the terms of the Creative Commons Attribution-NonCommercial-ShareAlike-30 License which permits use distribution and reproduction fornon-commercial purposes provided the original is properly cited andderivative works building on this content are distributed under the samelicense
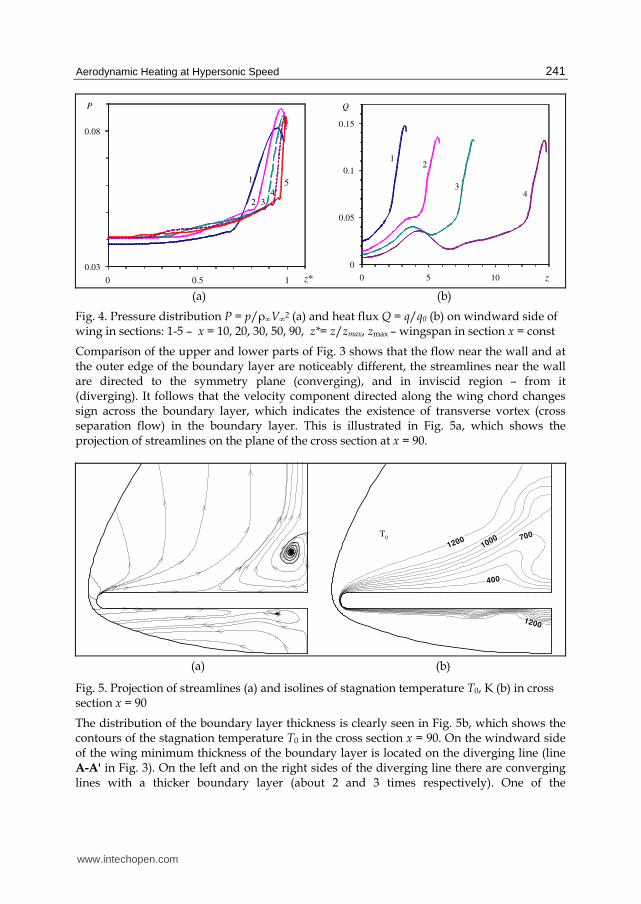
Aerodynamic Heating at Hypersonic Speed
241
003
008
0 05 1
P
1
2 34
5
z
0
005
01
015
0 5 10
Q
z
12
34
(a) (b)
Fig 4 Pressure distribution Р = pρinfinVinfin2 (a) and heat flux Q = qq0 (b) on windward side of wing in sections 1-5 ndash x = 10 20 30 50 90 z= zzmax zmax ndash wingspan in section х = const
Comparison of the upper and lower parts of Fig 3 shows that the flow near the wall and at the outer edge of the boundary layer are noticeably different the streamlines near the wall are directed to the symmetry plane (converging) and in inviscid region ndash from it (diverging) It follows that the velocity component directed along the wing chord changes sign across the boundary layer which indicates the existence of transverse vortex (cross separation flow) in the boundary layer This is illustrated in Fig 5a which shows the projection of streamlines on the plane of the cross section at x = 90
400
1200
1200
700
1000T
0
(a) (b)
Fig 5 Projection of streamlines (a) and isolines of stagnation temperature T0 K (b) in cross section x = 90
The distribution of the boundary layer thickness is clearly seen in Fig 5b which shows the contours of the stagnation temperature T0 in the cross section x = 90 On the windward side of the wing minimum thickness of the boundary layer is located on the diverging line (line A-A in Fig 3) On the left and on the right sides of the diverging line there are converging lines with a thicker boundary layer (about 2 and 3 times respectively) One of the
wwwintechopencom
Heat Transfer - Mathematical Modelling Numerical Methods and Information Technology
242
converging lines is the symmetry plane Here the boundary layer thickness on the windward side reaches a maximum amounting to about one-third of the shock layer thickness Near the wing edge because of the expansion and acceleration of the flow the boundary layer thickness decreases sharply (at the edge it is almost 20 times less than at the symmetry plane on the windward side) On the leeward side of the wing flow separation occurs and the concept of the boundary layer loses its meaning Here scope of viscous flow is half the shock layer The shape of calculated shock wave in Fig 6a induced by the wing nose as a blunt body is determined by the law of the explosive analogy so that some front part of the wing
x le xA asymp 15 will be located inside the initially axisymmetric shock wave The coordinate of point A (xA) is located in the vicinity of interaction region of shock waves induced by the nose and the edges of the wing Here the profiles of pressure and heat flux along the edge are local maxima
0
10
000
005
0 15 30
zP
Q2
x
shock wing edge
P
Q
xA
0
005
-1 -05 0 05 1
Q
z
calculation
experiment
(a) (b)
Fig 6 Profiles of pressure heat flux and the shock wave along the wing edge (a) and distribution of heat fluxes in cross section x = 90 (b)
In Fig 6b the distribution of computed heat fluxes qq0 in the neighborhood of the wing end section at x = 90 is presented in comparison with the experiment of Gubanova et al (1992) depending on the transverse coordinate z On the whole the calculation correctly predicts the magnitude and position of local maximum of heat flux near the symmetry plane taking into account the small asymmetry in the experimental data Note that near the minima of heat fluxes calculated values are lower than experimental ones probably due to effect of smoothing of experimental data in these narrow regions
32 Heat transfer on test model of Pre-X space vehicle Currently developed hypersonic aircraft have dimensions several times smaller than previously created space vehicles Shuttle and Buran This results in increase of heat load on a vehicle during flight and therefore the problem of reliable calculation of heat fluxes on the surface for such relatively small bodies is particularly important Thus the problem arises of verification of the employed physical models and numerical methods by comparing calculation results with experimental data
wwwintechopencom
Aerodynamic Heating at Hypersonic Speed
243
In 2006-2007 on TsNIImashrsquos experimental base in a piston gasdynamic wind tunnel PGU-7 a heat transfer study has been conducted on a small-scale model of Pre-X reentry demonstrator (Baiocco 2006) This vehicle is designed to obtain in flight conditions experimental data pertaining to aerothermodynamic phenomena that are not modeled in ground tests but they are critical for design of a vehicle returning from the Earthrsquos orbit In particular Pre-X demonstrator is developed to test in a real flight and in specified locations on the vehicle surface samples of reusable thermal protection materials and to assess their durability During the study thermovision measurements have been conducted of heat fluxes on the model of scale 115 at various flow regimes ndash M = 10 Re = 1106-5106 1m (Kovalev et al 2009) Processing of thermovision measurements was carried out in accordance with standard technique and composed of determination of the model surface temperature during experiment extraction from these data distributions of heat fluxes on the observed model surface and binding of the resulting thermovision frame to a three-dimensional CAD model of the demonstrator The same CAD model has been used for numerical simulation of heat transfer on the Pre-X test model As a normalizing value the heat flux q0 at the stagnation point of a sphere with radius of 70 mm is adopted which is determined using the Fay-Riddell formula Advantage of data presentation in this form is due to invariability of the relative values Q = qq0 on most model surface at variations of flow parameters
Fig 7 Calculated distributions of pressure Р = ちρinfinVinfin2 (left) and stagnation temperature T0 K (right) on surface and in shock layer (in symmetry plane and in exit section) for test model of Pre-X vehicle
On the base of the numerical solution of the Navier-Stokes equations a study was carried out of flow parameters and heat transfer for laminar flow over a test model of Pre-X space
wwwintechopencom
Heat Transfer - Mathematical Modelling Numerical Methods and Information Technology
244
vehicle for experimental conditions in the piston gasdynamic wind tunnel Mach and Reynolds numbers calculated from the free-stream parameters and the length of the model (330 mm) are Minfin = 10 and Reinfin = 7middot105 Angle of attack ndash 45deg The flap deflection angle was (as in the experiment) = 5 10 and 15deg The stagnation temperature of the free-stream flow and the wing surface temperature ndash T0infin = 1000 K and Tw = 300 K respectively An approximation of a perfect gas was used with ratio of specific heats = 14 The calculations were performed with a shock-fitting procedure ie the bow shock was considered as a discontinuity with implementation of the Rankine-Hugoniot relations (4) across it On the model surface no-slip and fixed temperature conditions were set Note that in view of the flow symmetry computations were made only for a half of the model although in the figures below for comparison with experiment the calculated data (upon reflection in the symmetry plane) are presented on the entire model The overall flow pattern obtained in the calculations over the test model of Pre-X space vehicle is shown in Fig 7 where for the case of the flap deflection angle = 15deg pressure and stagnation temperature Т0 isolines in the shock layer and on the model surface are shown It is seen that there are two areas of high pressure on the nose tip of the model (P asymp 092) and on the deflection flaps In the latter case the pressure in the flow passing through the two shock waves reaches P asymp 13 Isolines of Т0 show the size of regions where viscous forces are significant a thin boundary layer on the windward side of the model and an extensive separation zone on the leeward side The small separation zone appearing at deflection flaps although about four times thicker than the boundary layer upstream of it is almost not visible in the scale of the figure Fig 8 shows the distributions of relative heat flow Q on the windward side of the model obtained in the experiments and in the calculations at deflection angles of flaps = 5 10 and 15deg For the case = 5deg it can be noted rather good agreement between experiment and calculation in the values of heat flux in the central part of the model and on the flaps It is evident that before deflected flaps there is a region of low heat fluxes caused by near separation state (according to calculation results) of the boundary layer In analyzing the experimental data it should be taken into account the effect of apparent temperature reduction of the surface area with a large angle to the thermovision observation line It is precisely this effect that explains the fact that in the nose part of the model the experimental values of heat flux are less than the calculated ones Also narrow zones of high (at the sharp edges of the flaps) or low (in the separation zone at the root of the flaps) values of heat flux are smoothed or not visible in the experiment due to insufficient resolution of thermovision equipment The resolution capability of thermovisor is clearly visible by the size of cells in the experimental isoline pattern of heat flux in Fig 8 It should be noted that the calculations do not take into account a slit between the deflection flaps available on the test model the presence of which should lead to a decrease in the separation region in front of the flaps At an angle of flap deflection = 10deg as in the previous case = 5deg there is fairly good agreement between calculation and experiment for the values of heat flux in the central part of the model and on the flaps The calculations show that the growth of the flap deflection angle from 5deg to 10deg results in the formation of a large separation zone in front of the flaps and in a decrease in heat flux value Q from 02 to 01 At the largest angle of flap deflection = 15deg the maximum of calculated heat flux occurs in the zone of impingement of the separated boundary layer where the level of Q is 2-3 times higher than its level on the undeflected flap The coincidence of calculation results with
wwwintechopencom
Aerodynamic Heating at Hypersonic Speed
245
experimental data in the front part of the model up to the separation zone before the flaps is satisfactory On the flaps the level of heat flux in the experiment is about one and a half times more than in the calculation This difference in heat flux values is apparently due to laminar-turbulent transition in separation region induced by the deflected flaps which takes place in the experiment
δ = 5deg
δ = 10deg
δ = 15deg
Fig 8 Experimental (left) and calculated (right) heat fluxes Q = qq0 on windward side of test model of Pre-X space vehicle at different deflection angles of flaps
wwwintechopencom
Heat Transfer - Mathematical Modelling Numerical Methods and Information Technology
246
33 Flow and heat transfer on a winged space vehicle at reentry to Earths atmosphere This section presents the results of numerical simulation of flow and heat transfer on a
winged version of the small-scale reentry vehicle being developed in TsAGI (Vaganov et al
2006) moving at hypersonic speed in the Earths atmosphere Calculations were made using
two physical-chemical models of the gas medium - equilibrium and non-equilibrium
chemically reacting air
The bow shock was captured in contrast to the previous two flow cases Thus on the inflow
boundary the free-stream conditions were specified On the vehicle surface no-slip and
adiabatic wall conditions were supposed In calculations with use of the nonequilibrium air
model the vehicle surface was supposed to be low catalytical with the probability of
heterogeneous recombination of O and N atoms equal to А = 001
A computational grid was provided by Mikhalin VA (Dmitriev et al 2007) and was taken
from the inviscid flow calculation The number of points in the direction normal to the
vehicle surface has been increased to resolve the wall boundary layer Part of the results
presented below was reported in (Dmitriev et al 2007 Gorshkov et al 2008a)
Calculations were performed for two points of a reentry trajectory for which thermal loads
are close to maximum (Table 1) The angle of attack α = 35deg the vehicle length L = 9m A
grid 93times50times101 in the longitudinal transverse and circumferential directions respectively
were used in the calculations The surface grid of the vehicle is shown in Fig 9
Н
km
Vinfin
msec ReinfinL Minfin Рinfin atm Тinfin K
70 5952 346middot105 200 576middot10-5 219
63 5152 684middot105 166 159middot10-4 243
Table 1 Parameters of trajectory points
Fig 9 Surface grid of the small-scale reentry vehicle
In Fig 10a contours of total enthalpy H0 on the surface and in the shock layer near the reentry vehicle are shown On the windward side one can see the shock wave the thin wall boundary layer and the inviscid flow between them in which the values of H0 are constant In the calculations the shock wave is smeared upon 3-5 grid points and has a finite thickness due to the use of artificial dissipation In particular a local decrease in H0 in a strong shock
wwwintechopencom
Aerodynamic Heating at Hypersonic Speed
247
wave on the windward side which can be seen in the figure has no physical meaning and is due to the influence of artificial dissipation Recall that the Navier-Stokes equations do not correctly describe the shock structure at Mach numbers Mgt 15 In the shock layer on the leeward side it is visible a large area with reduced values of total enthalpy Н0ltН0infin (Н0infin ndash total enthalpy in the free-stream) which arises as a result of boundary layer separation from the vehicle surface Chemical processes occurring in the shock layer over the vehicle are illustrated in Fig 10b which shows contours of mass concentrations of oxygen atoms つо Under the considered conditions in the vicinity of the vehicle nose behind the shock wave O2 dissociation is complete On the windward side downstream the nose in the shock layer and on the surface the recombination occurs and the concentration of O decreases In contrast on the leeward side where the flow is very rarefied the level of つо remains high indicating that the process of recombination of atomic oxygen is frozen
boundary layer
shock wave
(a) (b)
Fig 10 Total enthalpy MJkg (a) and mass concentration of oxygen atoms (b) on the surface and in the shock layer near the vehicle 〉 = 63 km
0001
001
01
1
0 5 10
P
x m
equilibrium air
nonequilibrium air
equilibrium air
Fig 11 Pressure distribution P = ちρinfinVinfin2 on vehicle surface overall view (left) and in symmetry plane (right) 〉 = 63 km
wwwintechopencom
Heat Transfer - Mathematical Modelling Numerical Methods and Information Technology
248
In Fig 11 and 12 isolines of pressure heat flux qw and equilibrium radiation temperature Tw
on the vehicle surface are shown for cases of equilibrium and non-equilibrium dissociating
air Comparison of qw and Tw distributions on the vehicle surface in the symmetry plane for
two air models are depicted in Fig 13
Analysis of the calculation results shows that pressure distribution on the windward surface
of the vehicle does not depend on physical-chemical model of the gas medium - the
difference in pressure values for equilibrium and non-equilibrium air flow is 1 - 2 On the
leeward side pressure on the surface for nonequilibrium flow may be nearly two times
lower than for equilibrium flow (eg in the vicinity of the tail) This is probably due to the
fact that the effective ratio of specific heats for nonequilibrium air is greater than for
equilibrium air because in the shock layer on the leeward side nonequilibrium flow is
chemically frozen and here there is a sufficiently high concentration of atoms (see Fig 10b)
equilibrium air nonequilibrium air
Fig 12 Distributions of heat flux qw kWm2 (top) and equilibrium radiation temperature TwdegC (bottom) on the vehicle surface 〉 = 63 km
Nonequilibrium chemical processes in the shock layer and finite catalytic activity of the
vehicle surface (А = 001) significantly reduce the calculated levels of heat transfer in
comparison with the case of equilibrium air flow The most significant decrease in heat flux
is observed on the vehicle nose part (for x le 1 m) and in the vicinity of the tail For example
at the nose stagnation point the level of heat flux decreases by about 40 ndash from 640 to 385
kWm2 while the surface temperature decreases by nearly 15 ndash from 1670 to 1430 degC
Note a high heat flux level on the thin edge of the wing compared with one at the nose
stagnation point Particularly intense heating occurs at the sharp bend of the wing where the
values of heat flux and surface temperature even slightly exceed their values at the front
stagnation point In the case of equilibrium air flow the exceeding for heat flux is about 10
(710 and 640 kWm2) for temperature - 3 (1720 and 1670 degC) In the case of
nonequilibrium air flow the exceeding is more significant for heat flux - 30 (540 and 385
kWm2) for temperature - 10 (1570 and 1430 deg C)
wwwintechopencom
Aerodynamic Heating at Hypersonic Speed
249
In other parts of the vehicle surface difference in heat flux levels for the two air models is somewhat less and it decreases downstream presumably due to gradual recombination of atoms in the boundary layer at flowing along the surface in case of non-equilibrium air
1
10
100
1000
0 5 10
Qw
x m
equilibrium air
nonequilibrium air
0
1000
2000
0 5 10
Tw
x m
equilibrium air
nonequilibrium air
Fig 13 Profiles of heat flux qw kWm2 (left) and equilibrium radiation temperature TwdegC (right) on vehicle surface in symmetry plane 〉 = 63 km
A similar flow and heat flux patterns are observed for the altitude H = 70 km as seen in Fig 14 where contours of heat flux and equilibrium radiation wall temperature are shown at this altitude for the two air models For equilibrium air overall level of heat flux at 70 km is slightly higher than at 63 km For example heat flux value at the nose stagnation point is increased by 5 (675 compared with 640 kWm2) The opposite situation occurs for the model of nonequilibrium air in this case the stagnation point heat flux value at 70 km is lower than at 63 km ndash by 7 (360 and 385 kWm2 respectively)
equilibrium air nonequilibrium air
Fig 14 Distributions of heat flux qw kWm2 (top) and equilibrium radiation temperature TwdegC (bottom) on the vehicle surface 〉 = 70 km
wwwintechopencom
Heat Transfer - Mathematical Modelling Numerical Methods and Information Technology
250
4 Conclusion
A three-dimensional stationary NavierndashStokes computer code for laminar flow developed
by the author has been briefly described The code is mainly intended to calculate super-
and hypersonic flows over bodies accounting for high temperature real gas effects with
special emphasis on convective heat transfer Three gas models perfect gas equilibrium and
nonequilibrium gas mixture can be used in the calculations
In the chapter a comparison of code calculation results with experimental data is made for
two perfect gas hypersonic flow cases at wind tunnel conditions First case is a simulation of
an anomalous heat transfer on the windward side a delta wing with blunt edges On the
whole the calculation correctly predicts the magnitude and position of local maximum of
heat flux near the wing symmetry plane taking into account a small asymmetry in the
experimental data Second case is a computation of heat transfer on a test model of the Pre-X
demonstrator Satisfactory agreement with thermovision heat fluxes on the smooth
windward side and on the flaps is obtained except for the largest deflection angle of flaps
= 15deg when the level of heat flux in the experiment is about one and a half times more than
in the calculation This discrepancy is apparently due to laminar-turbulent transition in
separation region induced by the deflected flaps which takes place in the experiment
Third flow case concerns chemically reacting air flow at equilibrium or nonequilibrium
conditions Flowfield and convective heat transfer parameters for a winged shape of a small-
scale reentry vehicle are calculated for two points of a reentry trajectory in the Earthrsquos
atmosphere Heat flux and equilibrium radiation temperature distributions on the vehicle
surface are obtained Also regions of maximal thermal loadings are localized
Calculations show that for nonequilibrium air flow the use of a low catalytic coating (with
probability of heterogeneous recombination of atoms А = 001) on the vehicle surface
enables to decrease considerably the level of heat fluxes in regions of maximal heat transfer
in the nose part and on the wing edges in comparison with equilibrium air flow For
example for trajectory points with maximal thermal load a reduction of up to 40 in heat
flux (which results in a 15 reduction of equilibrium radiation wall temperature) can be
obtained at the vehicle nose
5 Acknowledgments
The author is grateful to Kovalev RV Marinin VP and Vlasov VI for delivering
thermovision data on test model of Pre-X vehicle and also to Churakov DA and Mihalin
VA for providing computational grids
6 References
Baiocco P Guedron S Plotard P amp Moulin J (2006) The Pre-X atmospheric re-entry
experimental lifting body Program status and system synthesis Proceedings of 57th
International Astronautical Congress 2-6 October 2006 IAC-06-D2P22
Churakov DA Gorshkov AB Kovalev RV Vlasov VI Beloshitsky AV Dyadkin
AA amp Zhurin SV (2008) Heat Transfer of Reentry Vehicles during Atmosphere
Flight Proceedings of 6-th European Symposium on Aerothermodynamics for Space
Vehicles Versailles France 3 - 6 November 2008
wwwintechopencom
Aerodynamic Heating at Hypersonic Speed
251
Dmitriev VG Vaganov AV Gorshkov AB Lapygin VI Galaktionov AYu amp
Mikhalin VA (2007) Analysis of Aerothermodynamic Parameters of Reusable
Space Wing Vehicle Proceedings of 2nd European Conference for Aero-Space Sciences
Brussels Belgium July 1-6 2007
Gorshkov AB (1997) Calculation of Base Heat Transfer Behind Thin Cone-Shaped Bodies
Cosmonautics and Rocket Engineering No 11 (1997) pp 13-20 (in Russian)
Gorshkov AB Kovalev R V Vlasov V I amp Zemlyanskiy B A (2008a) Simulation of
Heat Transfer to Space Vehicles during a Gliding Reentry into Earthrsquos
Atmosphere Proceedings of 14th International Conference on Methods of Aerophysical
Research (ICMAR-2008) Novosibirsk Russia 30 June - 06 July 2008
Gorshkov AB Kovalev R V Vlasov amp V I Zemlyanskiy B A (2008b) Heat Transfer
Investigation for Hypersonic Flow over Experimental Model of Pre-X Reentry
Vehicle Proceedings of 7th Sino-Russian High-Speed Flow Conference (SRHFC-7)
Novosibirsk Russia 1 - 3 July 2008
Grantham WL (1970) Flight results of a 25000 fps re-entry experiment NASA TN D 6062
Gubanova OI Zemlyansky BA Lessin AB Lunev VV Nikulin AN amp Syusin AV
(1992) Anomalous heat transfer on the windward side of a delta wing with a blunt
tip in hypersonic flow In Aerothermodynamics of aerospace systems Pt 1 pp 188-196
Moscow TsAGI (in Russian)
Hoffmann KA Chiang ST (2000) Computational fluid dynamics Vol 2 Engineering
Educational Systems ISBN 0-9623731-3-3 Kansas USA
Inouye Y (1995) OREX flight ndash quick report and lessons learned Proceedings of 2nd
European Symposium on Aerothermodynamics for Space Vehicles pp 271-279 ESTEC
Noordwik The Netherlands Europe Space Agency (November 1994)
Kovalev RV Kislykh VV Kolozezniy AE Kudryavtsev VV Marinin VP Vlasov
VI amp Zemliansky BA (2009) Experimental studies of Pre-X vehicle heat transfer
in PGU-7 test facility 3rd European Conference for Aerospace Sciences (EUCASS-2009)
Versailles France 6-9 July 2009
Lesin AB amp Lunev VV (1994) Heat transfer peaks on a blunt-nosed triangular plate in
hypersonic flow Fluid Dynamics Vol 29 No 2 (April 1994) pp 258-262 ISSN
0015-4628
Mason EA amp Saxena SC (1958) Approximate Formula for the Thermal Conductivity of
Gas Mixtures Phys Fluids Vol 1 No 5 (1958) pp 361-369
Pulliam TH (1986) Artificial dissipation models for the Euler equations AIAA Journal
Vol24 No 12 (December 1986) pp 1931-1940 ISSN 0001-1452
Vaganov AV Dmitriev VG Zadonsky SM Kireev AY Skuratov AS amp Stepanov
EA (2006) Estimations of low-sized winged reentry vehicle heat regimes on the
stage of its designing Physico-chemical kinetics in gas dynamics
wwwchemphysedurupdf2006-11-20-002pdf (in Russian)
Vlasov VI Gorshkov AB Kovalev RV amp Plastinin YuA (1997) Theoretical studies of
air ionization and NO vibrational excitation in low density hypersonic flow around
re-entry bodies AIAA Paper No 97-2582 (1997)
Vlasov V I amp Gorshkov A B (2001) Comparison of the Calculated Results for Hypersonic
Flow Past Blunt Bodies with the OREX Flight Test Data Fluid Dynamics Vol 36
No 5 (October 2001) pp 812-819 ISSN 0015-4628
wwwintechopencom
Heat Transfer - Mathematical Modelling Numerical Methods and Information Technology
252
Vlasov VI Gorshkov AB Kovalev RV amp Lunev VV (2009) Thin triangular blunt-
nosed plate in a viscous hypersonic flow Fluid Dynamics Vol 44 No 4 (August
2009) pp 596-605 ISSN 0015-4628
Wilke C (1950) A Viscosity Equation for Gas Mixtures JChemPhys Vol 18 No 4 (1950)
pp517-519
Yoon S amp Jameson A (1987) An LU-SSOR Scheme for the Euler and Navier-Stokes
Equations AIAA Paper No 87-0600 (1987)
wwwintechopencom
Heat Transfer - Mathematical Modelling Numerical Methods andInformation TechnologyEdited by Prof Aziz Belmiloudi
ISBN 978-953-307-550-1Hard cover 642 pagesPublisher InTechPublished online 14 February 2011Published in print edition February 2011
InTech EuropeUniversity Campus STeP Ri Slavka Krautzeka 83A 51000 Rijeka Croatia Phone +385 (51) 770 447 Fax +385 (51) 686 166
InTech ChinaUnit 405 Office Block Hotel Equatorial Shanghai No65 Yan An Road (West) Shanghai 200040 China
Phone +86-21-62489820 Fax +86-21-62489821
Over the past few decades there has been a prolific increase in research and development in area of heattransfer heat exchangers and their associated technologies This book is a collection of current research inthe above mentioned areas and describes modelling numerical methods simulation and informationtechnology with modern ideas and methods to analyse and enhance heat transfer for single and multiphasesystems The topics considered include various basic concepts of heat transfer the fundamental modes ofheat transfer (namely conduction convection and radiation) thermophysical properties computationalmethodologies control stabilization and optimization problems condensation boiling and freezing with manyreal-world problems and important modern applications The book is divided in four sections InverseStabilization and Optimization Problems Numerical Methods and Calculations Heat Transfer in MiniMicroSystems Energy Transfer and Solid Materials and each section discusses various issues methods andapplications in accordance with the subjects The combination of fundamental approach with many importantpractical applications of current interest will make this book of interest to researchers scientists engineers andgraduate students in many disciplines who make use of mathematical modelling inverse problemsimplementation of recently developed numerical methods in this multidisciplinary field as well as toexperimental and theoretical researchers in the field of heat and mass transfer
How to referenceIn order to correctly reference this scholarly work feel free to copy and paste the following
Andrey B Gorshkov (2011) Aerodynamic Heating at Hypersonic Speed Heat Transfer - MathematicalModelling Numerical Methods and Information Technology Prof Aziz Belmiloudi (Ed) ISBN 978-953-307-550-1 InTech Available from httpwwwintechopencombooksheat-transfer-mathematical-modelling-numerical-methods-and-information-technologyaerodynamic-heating-at-hypersonic-speed
wwwintechopencom
wwwintechopencom
copy 2011 The Author(s) Licensee IntechOpen This chapter is distributedunder the terms of the Creative Commons Attribution-NonCommercial-ShareAlike-30 License which permits use distribution and reproduction fornon-commercial purposes provided the original is properly cited andderivative works building on this content are distributed under the samelicense
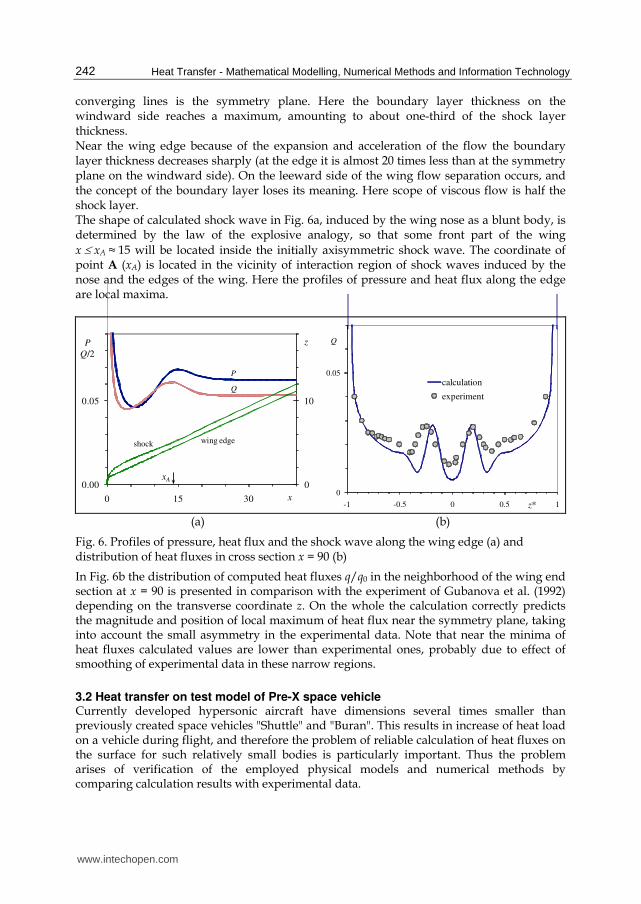
Heat Transfer - Mathematical Modelling Numerical Methods and Information Technology
242
converging lines is the symmetry plane Here the boundary layer thickness on the windward side reaches a maximum amounting to about one-third of the shock layer thickness Near the wing edge because of the expansion and acceleration of the flow the boundary layer thickness decreases sharply (at the edge it is almost 20 times less than at the symmetry plane on the windward side) On the leeward side of the wing flow separation occurs and the concept of the boundary layer loses its meaning Here scope of viscous flow is half the shock layer The shape of calculated shock wave in Fig 6a induced by the wing nose as a blunt body is determined by the law of the explosive analogy so that some front part of the wing
x le xA asymp 15 will be located inside the initially axisymmetric shock wave The coordinate of point A (xA) is located in the vicinity of interaction region of shock waves induced by the nose and the edges of the wing Here the profiles of pressure and heat flux along the edge are local maxima
0
10
000
005
0 15 30
zP
Q2
x
shock wing edge
P
Q
xA
0
005
-1 -05 0 05 1
Q
z
calculation
experiment
(a) (b)
Fig 6 Profiles of pressure heat flux and the shock wave along the wing edge (a) and distribution of heat fluxes in cross section x = 90 (b)
In Fig 6b the distribution of computed heat fluxes qq0 in the neighborhood of the wing end section at x = 90 is presented in comparison with the experiment of Gubanova et al (1992) depending on the transverse coordinate z On the whole the calculation correctly predicts the magnitude and position of local maximum of heat flux near the symmetry plane taking into account the small asymmetry in the experimental data Note that near the minima of heat fluxes calculated values are lower than experimental ones probably due to effect of smoothing of experimental data in these narrow regions
32 Heat transfer on test model of Pre-X space vehicle Currently developed hypersonic aircraft have dimensions several times smaller than previously created space vehicles Shuttle and Buran This results in increase of heat load on a vehicle during flight and therefore the problem of reliable calculation of heat fluxes on the surface for such relatively small bodies is particularly important Thus the problem arises of verification of the employed physical models and numerical methods by comparing calculation results with experimental data
wwwintechopencom
Aerodynamic Heating at Hypersonic Speed
243
In 2006-2007 on TsNIImashrsquos experimental base in a piston gasdynamic wind tunnel PGU-7 a heat transfer study has been conducted on a small-scale model of Pre-X reentry demonstrator (Baiocco 2006) This vehicle is designed to obtain in flight conditions experimental data pertaining to aerothermodynamic phenomena that are not modeled in ground tests but they are critical for design of a vehicle returning from the Earthrsquos orbit In particular Pre-X demonstrator is developed to test in a real flight and in specified locations on the vehicle surface samples of reusable thermal protection materials and to assess their durability During the study thermovision measurements have been conducted of heat fluxes on the model of scale 115 at various flow regimes ndash M = 10 Re = 1106-5106 1m (Kovalev et al 2009) Processing of thermovision measurements was carried out in accordance with standard technique and composed of determination of the model surface temperature during experiment extraction from these data distributions of heat fluxes on the observed model surface and binding of the resulting thermovision frame to a three-dimensional CAD model of the demonstrator The same CAD model has been used for numerical simulation of heat transfer on the Pre-X test model As a normalizing value the heat flux q0 at the stagnation point of a sphere with radius of 70 mm is adopted which is determined using the Fay-Riddell formula Advantage of data presentation in this form is due to invariability of the relative values Q = qq0 on most model surface at variations of flow parameters
Fig 7 Calculated distributions of pressure Р = ちρinfinVinfin2 (left) and stagnation temperature T0 K (right) on surface and in shock layer (in symmetry plane and in exit section) for test model of Pre-X vehicle
On the base of the numerical solution of the Navier-Stokes equations a study was carried out of flow parameters and heat transfer for laminar flow over a test model of Pre-X space
wwwintechopencom
Heat Transfer - Mathematical Modelling Numerical Methods and Information Technology
244
vehicle for experimental conditions in the piston gasdynamic wind tunnel Mach and Reynolds numbers calculated from the free-stream parameters and the length of the model (330 mm) are Minfin = 10 and Reinfin = 7middot105 Angle of attack ndash 45deg The flap deflection angle was (as in the experiment) = 5 10 and 15deg The stagnation temperature of the free-stream flow and the wing surface temperature ndash T0infin = 1000 K and Tw = 300 K respectively An approximation of a perfect gas was used with ratio of specific heats = 14 The calculations were performed with a shock-fitting procedure ie the bow shock was considered as a discontinuity with implementation of the Rankine-Hugoniot relations (4) across it On the model surface no-slip and fixed temperature conditions were set Note that in view of the flow symmetry computations were made only for a half of the model although in the figures below for comparison with experiment the calculated data (upon reflection in the symmetry plane) are presented on the entire model The overall flow pattern obtained in the calculations over the test model of Pre-X space vehicle is shown in Fig 7 where for the case of the flap deflection angle = 15deg pressure and stagnation temperature Т0 isolines in the shock layer and on the model surface are shown It is seen that there are two areas of high pressure on the nose tip of the model (P asymp 092) and on the deflection flaps In the latter case the pressure in the flow passing through the two shock waves reaches P asymp 13 Isolines of Т0 show the size of regions where viscous forces are significant a thin boundary layer on the windward side of the model and an extensive separation zone on the leeward side The small separation zone appearing at deflection flaps although about four times thicker than the boundary layer upstream of it is almost not visible in the scale of the figure Fig 8 shows the distributions of relative heat flow Q on the windward side of the model obtained in the experiments and in the calculations at deflection angles of flaps = 5 10 and 15deg For the case = 5deg it can be noted rather good agreement between experiment and calculation in the values of heat flux in the central part of the model and on the flaps It is evident that before deflected flaps there is a region of low heat fluxes caused by near separation state (according to calculation results) of the boundary layer In analyzing the experimental data it should be taken into account the effect of apparent temperature reduction of the surface area with a large angle to the thermovision observation line It is precisely this effect that explains the fact that in the nose part of the model the experimental values of heat flux are less than the calculated ones Also narrow zones of high (at the sharp edges of the flaps) or low (in the separation zone at the root of the flaps) values of heat flux are smoothed or not visible in the experiment due to insufficient resolution of thermovision equipment The resolution capability of thermovisor is clearly visible by the size of cells in the experimental isoline pattern of heat flux in Fig 8 It should be noted that the calculations do not take into account a slit between the deflection flaps available on the test model the presence of which should lead to a decrease in the separation region in front of the flaps At an angle of flap deflection = 10deg as in the previous case = 5deg there is fairly good agreement between calculation and experiment for the values of heat flux in the central part of the model and on the flaps The calculations show that the growth of the flap deflection angle from 5deg to 10deg results in the formation of a large separation zone in front of the flaps and in a decrease in heat flux value Q from 02 to 01 At the largest angle of flap deflection = 15deg the maximum of calculated heat flux occurs in the zone of impingement of the separated boundary layer where the level of Q is 2-3 times higher than its level on the undeflected flap The coincidence of calculation results with
wwwintechopencom
Aerodynamic Heating at Hypersonic Speed
245
experimental data in the front part of the model up to the separation zone before the flaps is satisfactory On the flaps the level of heat flux in the experiment is about one and a half times more than in the calculation This difference in heat flux values is apparently due to laminar-turbulent transition in separation region induced by the deflected flaps which takes place in the experiment
δ = 5deg
δ = 10deg
δ = 15deg
Fig 8 Experimental (left) and calculated (right) heat fluxes Q = qq0 on windward side of test model of Pre-X space vehicle at different deflection angles of flaps
wwwintechopencom
Heat Transfer - Mathematical Modelling Numerical Methods and Information Technology
246
33 Flow and heat transfer on a winged space vehicle at reentry to Earths atmosphere This section presents the results of numerical simulation of flow and heat transfer on a
winged version of the small-scale reentry vehicle being developed in TsAGI (Vaganov et al
2006) moving at hypersonic speed in the Earths atmosphere Calculations were made using
two physical-chemical models of the gas medium - equilibrium and non-equilibrium
chemically reacting air
The bow shock was captured in contrast to the previous two flow cases Thus on the inflow
boundary the free-stream conditions were specified On the vehicle surface no-slip and
adiabatic wall conditions were supposed In calculations with use of the nonequilibrium air
model the vehicle surface was supposed to be low catalytical with the probability of
heterogeneous recombination of O and N atoms equal to А = 001
A computational grid was provided by Mikhalin VA (Dmitriev et al 2007) and was taken
from the inviscid flow calculation The number of points in the direction normal to the
vehicle surface has been increased to resolve the wall boundary layer Part of the results
presented below was reported in (Dmitriev et al 2007 Gorshkov et al 2008a)
Calculations were performed for two points of a reentry trajectory for which thermal loads
are close to maximum (Table 1) The angle of attack α = 35deg the vehicle length L = 9m A
grid 93times50times101 in the longitudinal transverse and circumferential directions respectively
were used in the calculations The surface grid of the vehicle is shown in Fig 9
Н
km
Vinfin
msec ReinfinL Minfin Рinfin atm Тinfin K
70 5952 346middot105 200 576middot10-5 219
63 5152 684middot105 166 159middot10-4 243
Table 1 Parameters of trajectory points
Fig 9 Surface grid of the small-scale reentry vehicle
In Fig 10a contours of total enthalpy H0 on the surface and in the shock layer near the reentry vehicle are shown On the windward side one can see the shock wave the thin wall boundary layer and the inviscid flow between them in which the values of H0 are constant In the calculations the shock wave is smeared upon 3-5 grid points and has a finite thickness due to the use of artificial dissipation In particular a local decrease in H0 in a strong shock
wwwintechopencom
Aerodynamic Heating at Hypersonic Speed
247
wave on the windward side which can be seen in the figure has no physical meaning and is due to the influence of artificial dissipation Recall that the Navier-Stokes equations do not correctly describe the shock structure at Mach numbers Mgt 15 In the shock layer on the leeward side it is visible a large area with reduced values of total enthalpy Н0ltН0infin (Н0infin ndash total enthalpy in the free-stream) which arises as a result of boundary layer separation from the vehicle surface Chemical processes occurring in the shock layer over the vehicle are illustrated in Fig 10b which shows contours of mass concentrations of oxygen atoms つо Under the considered conditions in the vicinity of the vehicle nose behind the shock wave O2 dissociation is complete On the windward side downstream the nose in the shock layer and on the surface the recombination occurs and the concentration of O decreases In contrast on the leeward side where the flow is very rarefied the level of つо remains high indicating that the process of recombination of atomic oxygen is frozen
boundary layer
shock wave
(a) (b)
Fig 10 Total enthalpy MJkg (a) and mass concentration of oxygen atoms (b) on the surface and in the shock layer near the vehicle 〉 = 63 km
0001
001
01
1
0 5 10
P
x m
equilibrium air
nonequilibrium air
equilibrium air
Fig 11 Pressure distribution P = ちρinfinVinfin2 on vehicle surface overall view (left) and in symmetry plane (right) 〉 = 63 km
wwwintechopencom
Heat Transfer - Mathematical Modelling Numerical Methods and Information Technology
248
In Fig 11 and 12 isolines of pressure heat flux qw and equilibrium radiation temperature Tw
on the vehicle surface are shown for cases of equilibrium and non-equilibrium dissociating
air Comparison of qw and Tw distributions on the vehicle surface in the symmetry plane for
two air models are depicted in Fig 13
Analysis of the calculation results shows that pressure distribution on the windward surface
of the vehicle does not depend on physical-chemical model of the gas medium - the
difference in pressure values for equilibrium and non-equilibrium air flow is 1 - 2 On the
leeward side pressure on the surface for nonequilibrium flow may be nearly two times
lower than for equilibrium flow (eg in the vicinity of the tail) This is probably due to the
fact that the effective ratio of specific heats for nonequilibrium air is greater than for
equilibrium air because in the shock layer on the leeward side nonequilibrium flow is
chemically frozen and here there is a sufficiently high concentration of atoms (see Fig 10b)
equilibrium air nonequilibrium air
Fig 12 Distributions of heat flux qw kWm2 (top) and equilibrium radiation temperature TwdegC (bottom) on the vehicle surface 〉 = 63 km
Nonequilibrium chemical processes in the shock layer and finite catalytic activity of the
vehicle surface (А = 001) significantly reduce the calculated levels of heat transfer in
comparison with the case of equilibrium air flow The most significant decrease in heat flux
is observed on the vehicle nose part (for x le 1 m) and in the vicinity of the tail For example
at the nose stagnation point the level of heat flux decreases by about 40 ndash from 640 to 385
kWm2 while the surface temperature decreases by nearly 15 ndash from 1670 to 1430 degC
Note a high heat flux level on the thin edge of the wing compared with one at the nose
stagnation point Particularly intense heating occurs at the sharp bend of the wing where the
values of heat flux and surface temperature even slightly exceed their values at the front
stagnation point In the case of equilibrium air flow the exceeding for heat flux is about 10
(710 and 640 kWm2) for temperature - 3 (1720 and 1670 degC) In the case of
nonequilibrium air flow the exceeding is more significant for heat flux - 30 (540 and 385
kWm2) for temperature - 10 (1570 and 1430 deg C)
wwwintechopencom
Aerodynamic Heating at Hypersonic Speed
249
In other parts of the vehicle surface difference in heat flux levels for the two air models is somewhat less and it decreases downstream presumably due to gradual recombination of atoms in the boundary layer at flowing along the surface in case of non-equilibrium air
1
10
100
1000
0 5 10
Qw
x m
equilibrium air
nonequilibrium air
0
1000
2000
0 5 10
Tw
x m
equilibrium air
nonequilibrium air
Fig 13 Profiles of heat flux qw kWm2 (left) and equilibrium radiation temperature TwdegC (right) on vehicle surface in symmetry plane 〉 = 63 km
A similar flow and heat flux patterns are observed for the altitude H = 70 km as seen in Fig 14 where contours of heat flux and equilibrium radiation wall temperature are shown at this altitude for the two air models For equilibrium air overall level of heat flux at 70 km is slightly higher than at 63 km For example heat flux value at the nose stagnation point is increased by 5 (675 compared with 640 kWm2) The opposite situation occurs for the model of nonequilibrium air in this case the stagnation point heat flux value at 70 km is lower than at 63 km ndash by 7 (360 and 385 kWm2 respectively)
equilibrium air nonequilibrium air
Fig 14 Distributions of heat flux qw kWm2 (top) and equilibrium radiation temperature TwdegC (bottom) on the vehicle surface 〉 = 70 km
wwwintechopencom
Heat Transfer - Mathematical Modelling Numerical Methods and Information Technology
250
4 Conclusion
A three-dimensional stationary NavierndashStokes computer code for laminar flow developed
by the author has been briefly described The code is mainly intended to calculate super-
and hypersonic flows over bodies accounting for high temperature real gas effects with
special emphasis on convective heat transfer Three gas models perfect gas equilibrium and
nonequilibrium gas mixture can be used in the calculations
In the chapter a comparison of code calculation results with experimental data is made for
two perfect gas hypersonic flow cases at wind tunnel conditions First case is a simulation of
an anomalous heat transfer on the windward side a delta wing with blunt edges On the
whole the calculation correctly predicts the magnitude and position of local maximum of
heat flux near the wing symmetry plane taking into account a small asymmetry in the
experimental data Second case is a computation of heat transfer on a test model of the Pre-X
demonstrator Satisfactory agreement with thermovision heat fluxes on the smooth
windward side and on the flaps is obtained except for the largest deflection angle of flaps
= 15deg when the level of heat flux in the experiment is about one and a half times more than
in the calculation This discrepancy is apparently due to laminar-turbulent transition in
separation region induced by the deflected flaps which takes place in the experiment
Third flow case concerns chemically reacting air flow at equilibrium or nonequilibrium
conditions Flowfield and convective heat transfer parameters for a winged shape of a small-
scale reentry vehicle are calculated for two points of a reentry trajectory in the Earthrsquos
atmosphere Heat flux and equilibrium radiation temperature distributions on the vehicle
surface are obtained Also regions of maximal thermal loadings are localized
Calculations show that for nonequilibrium air flow the use of a low catalytic coating (with
probability of heterogeneous recombination of atoms А = 001) on the vehicle surface
enables to decrease considerably the level of heat fluxes in regions of maximal heat transfer
in the nose part and on the wing edges in comparison with equilibrium air flow For
example for trajectory points with maximal thermal load a reduction of up to 40 in heat
flux (which results in a 15 reduction of equilibrium radiation wall temperature) can be
obtained at the vehicle nose
5 Acknowledgments
The author is grateful to Kovalev RV Marinin VP and Vlasov VI for delivering
thermovision data on test model of Pre-X vehicle and also to Churakov DA and Mihalin
VA for providing computational grids
6 References
Baiocco P Guedron S Plotard P amp Moulin J (2006) The Pre-X atmospheric re-entry
experimental lifting body Program status and system synthesis Proceedings of 57th
International Astronautical Congress 2-6 October 2006 IAC-06-D2P22
Churakov DA Gorshkov AB Kovalev RV Vlasov VI Beloshitsky AV Dyadkin
AA amp Zhurin SV (2008) Heat Transfer of Reentry Vehicles during Atmosphere
Flight Proceedings of 6-th European Symposium on Aerothermodynamics for Space
Vehicles Versailles France 3 - 6 November 2008
wwwintechopencom
Aerodynamic Heating at Hypersonic Speed
251
Dmitriev VG Vaganov AV Gorshkov AB Lapygin VI Galaktionov AYu amp
Mikhalin VA (2007) Analysis of Aerothermodynamic Parameters of Reusable
Space Wing Vehicle Proceedings of 2nd European Conference for Aero-Space Sciences
Brussels Belgium July 1-6 2007
Gorshkov AB (1997) Calculation of Base Heat Transfer Behind Thin Cone-Shaped Bodies
Cosmonautics and Rocket Engineering No 11 (1997) pp 13-20 (in Russian)
Gorshkov AB Kovalev R V Vlasov V I amp Zemlyanskiy B A (2008a) Simulation of
Heat Transfer to Space Vehicles during a Gliding Reentry into Earthrsquos
Atmosphere Proceedings of 14th International Conference on Methods of Aerophysical
Research (ICMAR-2008) Novosibirsk Russia 30 June - 06 July 2008
Gorshkov AB Kovalev R V Vlasov amp V I Zemlyanskiy B A (2008b) Heat Transfer
Investigation for Hypersonic Flow over Experimental Model of Pre-X Reentry
Vehicle Proceedings of 7th Sino-Russian High-Speed Flow Conference (SRHFC-7)
Novosibirsk Russia 1 - 3 July 2008
Grantham WL (1970) Flight results of a 25000 fps re-entry experiment NASA TN D 6062
Gubanova OI Zemlyansky BA Lessin AB Lunev VV Nikulin AN amp Syusin AV
(1992) Anomalous heat transfer on the windward side of a delta wing with a blunt
tip in hypersonic flow In Aerothermodynamics of aerospace systems Pt 1 pp 188-196
Moscow TsAGI (in Russian)
Hoffmann KA Chiang ST (2000) Computational fluid dynamics Vol 2 Engineering
Educational Systems ISBN 0-9623731-3-3 Kansas USA
Inouye Y (1995) OREX flight ndash quick report and lessons learned Proceedings of 2nd
European Symposium on Aerothermodynamics for Space Vehicles pp 271-279 ESTEC
Noordwik The Netherlands Europe Space Agency (November 1994)
Kovalev RV Kislykh VV Kolozezniy AE Kudryavtsev VV Marinin VP Vlasov
VI amp Zemliansky BA (2009) Experimental studies of Pre-X vehicle heat transfer
in PGU-7 test facility 3rd European Conference for Aerospace Sciences (EUCASS-2009)
Versailles France 6-9 July 2009
Lesin AB amp Lunev VV (1994) Heat transfer peaks on a blunt-nosed triangular plate in
hypersonic flow Fluid Dynamics Vol 29 No 2 (April 1994) pp 258-262 ISSN
0015-4628
Mason EA amp Saxena SC (1958) Approximate Formula for the Thermal Conductivity of
Gas Mixtures Phys Fluids Vol 1 No 5 (1958) pp 361-369
Pulliam TH (1986) Artificial dissipation models for the Euler equations AIAA Journal
Vol24 No 12 (December 1986) pp 1931-1940 ISSN 0001-1452
Vaganov AV Dmitriev VG Zadonsky SM Kireev AY Skuratov AS amp Stepanov
EA (2006) Estimations of low-sized winged reentry vehicle heat regimes on the
stage of its designing Physico-chemical kinetics in gas dynamics
wwwchemphysedurupdf2006-11-20-002pdf (in Russian)
Vlasov VI Gorshkov AB Kovalev RV amp Plastinin YuA (1997) Theoretical studies of
air ionization and NO vibrational excitation in low density hypersonic flow around
re-entry bodies AIAA Paper No 97-2582 (1997)
Vlasov V I amp Gorshkov A B (2001) Comparison of the Calculated Results for Hypersonic
Flow Past Blunt Bodies with the OREX Flight Test Data Fluid Dynamics Vol 36
No 5 (October 2001) pp 812-819 ISSN 0015-4628
wwwintechopencom
Heat Transfer - Mathematical Modelling Numerical Methods and Information Technology
252
Vlasov VI Gorshkov AB Kovalev RV amp Lunev VV (2009) Thin triangular blunt-
nosed plate in a viscous hypersonic flow Fluid Dynamics Vol 44 No 4 (August
2009) pp 596-605 ISSN 0015-4628
Wilke C (1950) A Viscosity Equation for Gas Mixtures JChemPhys Vol 18 No 4 (1950)
pp517-519
Yoon S amp Jameson A (1987) An LU-SSOR Scheme for the Euler and Navier-Stokes
Equations AIAA Paper No 87-0600 (1987)
wwwintechopencom
Heat Transfer - Mathematical Modelling Numerical Methods andInformation TechnologyEdited by Prof Aziz Belmiloudi
ISBN 978-953-307-550-1Hard cover 642 pagesPublisher InTechPublished online 14 February 2011Published in print edition February 2011
InTech EuropeUniversity Campus STeP Ri Slavka Krautzeka 83A 51000 Rijeka Croatia Phone +385 (51) 770 447 Fax +385 (51) 686 166
InTech ChinaUnit 405 Office Block Hotel Equatorial Shanghai No65 Yan An Road (West) Shanghai 200040 China
Phone +86-21-62489820 Fax +86-21-62489821
Over the past few decades there has been a prolific increase in research and development in area of heattransfer heat exchangers and their associated technologies This book is a collection of current research inthe above mentioned areas and describes modelling numerical methods simulation and informationtechnology with modern ideas and methods to analyse and enhance heat transfer for single and multiphasesystems The topics considered include various basic concepts of heat transfer the fundamental modes ofheat transfer (namely conduction convection and radiation) thermophysical properties computationalmethodologies control stabilization and optimization problems condensation boiling and freezing with manyreal-world problems and important modern applications The book is divided in four sections InverseStabilization and Optimization Problems Numerical Methods and Calculations Heat Transfer in MiniMicroSystems Energy Transfer and Solid Materials and each section discusses various issues methods andapplications in accordance with the subjects The combination of fundamental approach with many importantpractical applications of current interest will make this book of interest to researchers scientists engineers andgraduate students in many disciplines who make use of mathematical modelling inverse problemsimplementation of recently developed numerical methods in this multidisciplinary field as well as toexperimental and theoretical researchers in the field of heat and mass transfer
How to referenceIn order to correctly reference this scholarly work feel free to copy and paste the following
Andrey B Gorshkov (2011) Aerodynamic Heating at Hypersonic Speed Heat Transfer - MathematicalModelling Numerical Methods and Information Technology Prof Aziz Belmiloudi (Ed) ISBN 978-953-307-550-1 InTech Available from httpwwwintechopencombooksheat-transfer-mathematical-modelling-numerical-methods-and-information-technologyaerodynamic-heating-at-hypersonic-speed
wwwintechopencom
wwwintechopencom
copy 2011 The Author(s) Licensee IntechOpen This chapter is distributedunder the terms of the Creative Commons Attribution-NonCommercial-ShareAlike-30 License which permits use distribution and reproduction fornon-commercial purposes provided the original is properly cited andderivative works building on this content are distributed under the samelicense
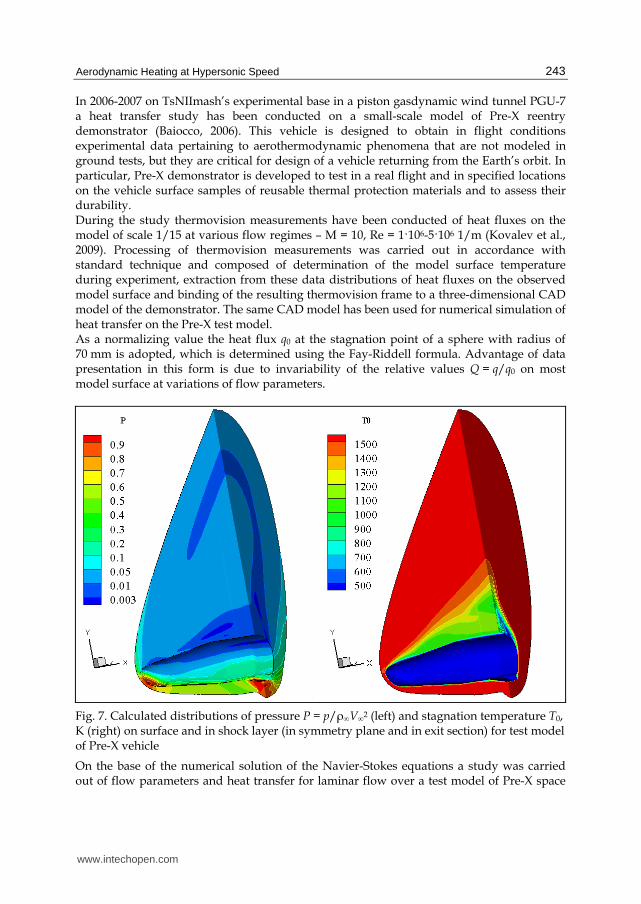
Aerodynamic Heating at Hypersonic Speed
243
In 2006-2007 on TsNIImashrsquos experimental base in a piston gasdynamic wind tunnel PGU-7 a heat transfer study has been conducted on a small-scale model of Pre-X reentry demonstrator (Baiocco 2006) This vehicle is designed to obtain in flight conditions experimental data pertaining to aerothermodynamic phenomena that are not modeled in ground tests but they are critical for design of a vehicle returning from the Earthrsquos orbit In particular Pre-X demonstrator is developed to test in a real flight and in specified locations on the vehicle surface samples of reusable thermal protection materials and to assess their durability During the study thermovision measurements have been conducted of heat fluxes on the model of scale 115 at various flow regimes ndash M = 10 Re = 1106-5106 1m (Kovalev et al 2009) Processing of thermovision measurements was carried out in accordance with standard technique and composed of determination of the model surface temperature during experiment extraction from these data distributions of heat fluxes on the observed model surface and binding of the resulting thermovision frame to a three-dimensional CAD model of the demonstrator The same CAD model has been used for numerical simulation of heat transfer on the Pre-X test model As a normalizing value the heat flux q0 at the stagnation point of a sphere with radius of 70 mm is adopted which is determined using the Fay-Riddell formula Advantage of data presentation in this form is due to invariability of the relative values Q = qq0 on most model surface at variations of flow parameters
Fig 7 Calculated distributions of pressure Р = ちρinfinVinfin2 (left) and stagnation temperature T0 K (right) on surface and in shock layer (in symmetry plane and in exit section) for test model of Pre-X vehicle
On the base of the numerical solution of the Navier-Stokes equations a study was carried out of flow parameters and heat transfer for laminar flow over a test model of Pre-X space
wwwintechopencom
Heat Transfer - Mathematical Modelling Numerical Methods and Information Technology
244
vehicle for experimental conditions in the piston gasdynamic wind tunnel Mach and Reynolds numbers calculated from the free-stream parameters and the length of the model (330 mm) are Minfin = 10 and Reinfin = 7middot105 Angle of attack ndash 45deg The flap deflection angle was (as in the experiment) = 5 10 and 15deg The stagnation temperature of the free-stream flow and the wing surface temperature ndash T0infin = 1000 K and Tw = 300 K respectively An approximation of a perfect gas was used with ratio of specific heats = 14 The calculations were performed with a shock-fitting procedure ie the bow shock was considered as a discontinuity with implementation of the Rankine-Hugoniot relations (4) across it On the model surface no-slip and fixed temperature conditions were set Note that in view of the flow symmetry computations were made only for a half of the model although in the figures below for comparison with experiment the calculated data (upon reflection in the symmetry plane) are presented on the entire model The overall flow pattern obtained in the calculations over the test model of Pre-X space vehicle is shown in Fig 7 where for the case of the flap deflection angle = 15deg pressure and stagnation temperature Т0 isolines in the shock layer and on the model surface are shown It is seen that there are two areas of high pressure on the nose tip of the model (P asymp 092) and on the deflection flaps In the latter case the pressure in the flow passing through the two shock waves reaches P asymp 13 Isolines of Т0 show the size of regions where viscous forces are significant a thin boundary layer on the windward side of the model and an extensive separation zone on the leeward side The small separation zone appearing at deflection flaps although about four times thicker than the boundary layer upstream of it is almost not visible in the scale of the figure Fig 8 shows the distributions of relative heat flow Q on the windward side of the model obtained in the experiments and in the calculations at deflection angles of flaps = 5 10 and 15deg For the case = 5deg it can be noted rather good agreement between experiment and calculation in the values of heat flux in the central part of the model and on the flaps It is evident that before deflected flaps there is a region of low heat fluxes caused by near separation state (according to calculation results) of the boundary layer In analyzing the experimental data it should be taken into account the effect of apparent temperature reduction of the surface area with a large angle to the thermovision observation line It is precisely this effect that explains the fact that in the nose part of the model the experimental values of heat flux are less than the calculated ones Also narrow zones of high (at the sharp edges of the flaps) or low (in the separation zone at the root of the flaps) values of heat flux are smoothed or not visible in the experiment due to insufficient resolution of thermovision equipment The resolution capability of thermovisor is clearly visible by the size of cells in the experimental isoline pattern of heat flux in Fig 8 It should be noted that the calculations do not take into account a slit between the deflection flaps available on the test model the presence of which should lead to a decrease in the separation region in front of the flaps At an angle of flap deflection = 10deg as in the previous case = 5deg there is fairly good agreement between calculation and experiment for the values of heat flux in the central part of the model and on the flaps The calculations show that the growth of the flap deflection angle from 5deg to 10deg results in the formation of a large separation zone in front of the flaps and in a decrease in heat flux value Q from 02 to 01 At the largest angle of flap deflection = 15deg the maximum of calculated heat flux occurs in the zone of impingement of the separated boundary layer where the level of Q is 2-3 times higher than its level on the undeflected flap The coincidence of calculation results with
wwwintechopencom
Aerodynamic Heating at Hypersonic Speed
245
experimental data in the front part of the model up to the separation zone before the flaps is satisfactory On the flaps the level of heat flux in the experiment is about one and a half times more than in the calculation This difference in heat flux values is apparently due to laminar-turbulent transition in separation region induced by the deflected flaps which takes place in the experiment
δ = 5deg
δ = 10deg
δ = 15deg
Fig 8 Experimental (left) and calculated (right) heat fluxes Q = qq0 on windward side of test model of Pre-X space vehicle at different deflection angles of flaps
wwwintechopencom
Heat Transfer - Mathematical Modelling Numerical Methods and Information Technology
246
33 Flow and heat transfer on a winged space vehicle at reentry to Earths atmosphere This section presents the results of numerical simulation of flow and heat transfer on a
winged version of the small-scale reentry vehicle being developed in TsAGI (Vaganov et al
2006) moving at hypersonic speed in the Earths atmosphere Calculations were made using
two physical-chemical models of the gas medium - equilibrium and non-equilibrium
chemically reacting air
The bow shock was captured in contrast to the previous two flow cases Thus on the inflow
boundary the free-stream conditions were specified On the vehicle surface no-slip and
adiabatic wall conditions were supposed In calculations with use of the nonequilibrium air
model the vehicle surface was supposed to be low catalytical with the probability of
heterogeneous recombination of O and N atoms equal to А = 001
A computational grid was provided by Mikhalin VA (Dmitriev et al 2007) and was taken
from the inviscid flow calculation The number of points in the direction normal to the
vehicle surface has been increased to resolve the wall boundary layer Part of the results
presented below was reported in (Dmitriev et al 2007 Gorshkov et al 2008a)
Calculations were performed for two points of a reentry trajectory for which thermal loads
are close to maximum (Table 1) The angle of attack α = 35deg the vehicle length L = 9m A
grid 93times50times101 in the longitudinal transverse and circumferential directions respectively
were used in the calculations The surface grid of the vehicle is shown in Fig 9
Н
km
Vinfin
msec ReinfinL Minfin Рinfin atm Тinfin K
70 5952 346middot105 200 576middot10-5 219
63 5152 684middot105 166 159middot10-4 243
Table 1 Parameters of trajectory points
Fig 9 Surface grid of the small-scale reentry vehicle
In Fig 10a contours of total enthalpy H0 on the surface and in the shock layer near the reentry vehicle are shown On the windward side one can see the shock wave the thin wall boundary layer and the inviscid flow between them in which the values of H0 are constant In the calculations the shock wave is smeared upon 3-5 grid points and has a finite thickness due to the use of artificial dissipation In particular a local decrease in H0 in a strong shock
wwwintechopencom
Aerodynamic Heating at Hypersonic Speed
247
wave on the windward side which can be seen in the figure has no physical meaning and is due to the influence of artificial dissipation Recall that the Navier-Stokes equations do not correctly describe the shock structure at Mach numbers Mgt 15 In the shock layer on the leeward side it is visible a large area with reduced values of total enthalpy Н0ltН0infin (Н0infin ndash total enthalpy in the free-stream) which arises as a result of boundary layer separation from the vehicle surface Chemical processes occurring in the shock layer over the vehicle are illustrated in Fig 10b which shows contours of mass concentrations of oxygen atoms つо Under the considered conditions in the vicinity of the vehicle nose behind the shock wave O2 dissociation is complete On the windward side downstream the nose in the shock layer and on the surface the recombination occurs and the concentration of O decreases In contrast on the leeward side where the flow is very rarefied the level of つо remains high indicating that the process of recombination of atomic oxygen is frozen
boundary layer
shock wave
(a) (b)
Fig 10 Total enthalpy MJkg (a) and mass concentration of oxygen atoms (b) on the surface and in the shock layer near the vehicle 〉 = 63 km
0001
001
01
1
0 5 10
P
x m
equilibrium air
nonequilibrium air
equilibrium air
Fig 11 Pressure distribution P = ちρinfinVinfin2 on vehicle surface overall view (left) and in symmetry plane (right) 〉 = 63 km
wwwintechopencom
Heat Transfer - Mathematical Modelling Numerical Methods and Information Technology
248
In Fig 11 and 12 isolines of pressure heat flux qw and equilibrium radiation temperature Tw
on the vehicle surface are shown for cases of equilibrium and non-equilibrium dissociating
air Comparison of qw and Tw distributions on the vehicle surface in the symmetry plane for
two air models are depicted in Fig 13
Analysis of the calculation results shows that pressure distribution on the windward surface
of the vehicle does not depend on physical-chemical model of the gas medium - the
difference in pressure values for equilibrium and non-equilibrium air flow is 1 - 2 On the
leeward side pressure on the surface for nonequilibrium flow may be nearly two times
lower than for equilibrium flow (eg in the vicinity of the tail) This is probably due to the
fact that the effective ratio of specific heats for nonequilibrium air is greater than for
equilibrium air because in the shock layer on the leeward side nonequilibrium flow is
chemically frozen and here there is a sufficiently high concentration of atoms (see Fig 10b)
equilibrium air nonequilibrium air
Fig 12 Distributions of heat flux qw kWm2 (top) and equilibrium radiation temperature TwdegC (bottom) on the vehicle surface 〉 = 63 km
Nonequilibrium chemical processes in the shock layer and finite catalytic activity of the
vehicle surface (А = 001) significantly reduce the calculated levels of heat transfer in
comparison with the case of equilibrium air flow The most significant decrease in heat flux
is observed on the vehicle nose part (for x le 1 m) and in the vicinity of the tail For example
at the nose stagnation point the level of heat flux decreases by about 40 ndash from 640 to 385
kWm2 while the surface temperature decreases by nearly 15 ndash from 1670 to 1430 degC
Note a high heat flux level on the thin edge of the wing compared with one at the nose
stagnation point Particularly intense heating occurs at the sharp bend of the wing where the
values of heat flux and surface temperature even slightly exceed their values at the front
stagnation point In the case of equilibrium air flow the exceeding for heat flux is about 10
(710 and 640 kWm2) for temperature - 3 (1720 and 1670 degC) In the case of
nonequilibrium air flow the exceeding is more significant for heat flux - 30 (540 and 385
kWm2) for temperature - 10 (1570 and 1430 deg C)
wwwintechopencom
Aerodynamic Heating at Hypersonic Speed
249
In other parts of the vehicle surface difference in heat flux levels for the two air models is somewhat less and it decreases downstream presumably due to gradual recombination of atoms in the boundary layer at flowing along the surface in case of non-equilibrium air
1
10
100
1000
0 5 10
Qw
x m
equilibrium air
nonequilibrium air
0
1000
2000
0 5 10
Tw
x m
equilibrium air
nonequilibrium air
Fig 13 Profiles of heat flux qw kWm2 (left) and equilibrium radiation temperature TwdegC (right) on vehicle surface in symmetry plane 〉 = 63 km
A similar flow and heat flux patterns are observed for the altitude H = 70 km as seen in Fig 14 where contours of heat flux and equilibrium radiation wall temperature are shown at this altitude for the two air models For equilibrium air overall level of heat flux at 70 km is slightly higher than at 63 km For example heat flux value at the nose stagnation point is increased by 5 (675 compared with 640 kWm2) The opposite situation occurs for the model of nonequilibrium air in this case the stagnation point heat flux value at 70 km is lower than at 63 km ndash by 7 (360 and 385 kWm2 respectively)
equilibrium air nonequilibrium air
Fig 14 Distributions of heat flux qw kWm2 (top) and equilibrium radiation temperature TwdegC (bottom) on the vehicle surface 〉 = 70 km
wwwintechopencom
Heat Transfer - Mathematical Modelling Numerical Methods and Information Technology
250
4 Conclusion
A three-dimensional stationary NavierndashStokes computer code for laminar flow developed
by the author has been briefly described The code is mainly intended to calculate super-
and hypersonic flows over bodies accounting for high temperature real gas effects with
special emphasis on convective heat transfer Three gas models perfect gas equilibrium and
nonequilibrium gas mixture can be used in the calculations
In the chapter a comparison of code calculation results with experimental data is made for
two perfect gas hypersonic flow cases at wind tunnel conditions First case is a simulation of
an anomalous heat transfer on the windward side a delta wing with blunt edges On the
whole the calculation correctly predicts the magnitude and position of local maximum of
heat flux near the wing symmetry plane taking into account a small asymmetry in the
experimental data Second case is a computation of heat transfer on a test model of the Pre-X
demonstrator Satisfactory agreement with thermovision heat fluxes on the smooth
windward side and on the flaps is obtained except for the largest deflection angle of flaps
= 15deg when the level of heat flux in the experiment is about one and a half times more than
in the calculation This discrepancy is apparently due to laminar-turbulent transition in
separation region induced by the deflected flaps which takes place in the experiment
Third flow case concerns chemically reacting air flow at equilibrium or nonequilibrium
conditions Flowfield and convective heat transfer parameters for a winged shape of a small-
scale reentry vehicle are calculated for two points of a reentry trajectory in the Earthrsquos
atmosphere Heat flux and equilibrium radiation temperature distributions on the vehicle
surface are obtained Also regions of maximal thermal loadings are localized
Calculations show that for nonequilibrium air flow the use of a low catalytic coating (with
probability of heterogeneous recombination of atoms А = 001) on the vehicle surface
enables to decrease considerably the level of heat fluxes in regions of maximal heat transfer
in the nose part and on the wing edges in comparison with equilibrium air flow For
example for trajectory points with maximal thermal load a reduction of up to 40 in heat
flux (which results in a 15 reduction of equilibrium radiation wall temperature) can be
obtained at the vehicle nose
5 Acknowledgments
The author is grateful to Kovalev RV Marinin VP and Vlasov VI for delivering
thermovision data on test model of Pre-X vehicle and also to Churakov DA and Mihalin
VA for providing computational grids
6 References
Baiocco P Guedron S Plotard P amp Moulin J (2006) The Pre-X atmospheric re-entry
experimental lifting body Program status and system synthesis Proceedings of 57th
International Astronautical Congress 2-6 October 2006 IAC-06-D2P22
Churakov DA Gorshkov AB Kovalev RV Vlasov VI Beloshitsky AV Dyadkin
AA amp Zhurin SV (2008) Heat Transfer of Reentry Vehicles during Atmosphere
Flight Proceedings of 6-th European Symposium on Aerothermodynamics for Space
Vehicles Versailles France 3 - 6 November 2008
wwwintechopencom
Aerodynamic Heating at Hypersonic Speed
251
Dmitriev VG Vaganov AV Gorshkov AB Lapygin VI Galaktionov AYu amp
Mikhalin VA (2007) Analysis of Aerothermodynamic Parameters of Reusable
Space Wing Vehicle Proceedings of 2nd European Conference for Aero-Space Sciences
Brussels Belgium July 1-6 2007
Gorshkov AB (1997) Calculation of Base Heat Transfer Behind Thin Cone-Shaped Bodies
Cosmonautics and Rocket Engineering No 11 (1997) pp 13-20 (in Russian)
Gorshkov AB Kovalev R V Vlasov V I amp Zemlyanskiy B A (2008a) Simulation of
Heat Transfer to Space Vehicles during a Gliding Reentry into Earthrsquos
Atmosphere Proceedings of 14th International Conference on Methods of Aerophysical
Research (ICMAR-2008) Novosibirsk Russia 30 June - 06 July 2008
Gorshkov AB Kovalev R V Vlasov amp V I Zemlyanskiy B A (2008b) Heat Transfer
Investigation for Hypersonic Flow over Experimental Model of Pre-X Reentry
Vehicle Proceedings of 7th Sino-Russian High-Speed Flow Conference (SRHFC-7)
Novosibirsk Russia 1 - 3 July 2008
Grantham WL (1970) Flight results of a 25000 fps re-entry experiment NASA TN D 6062
Gubanova OI Zemlyansky BA Lessin AB Lunev VV Nikulin AN amp Syusin AV
(1992) Anomalous heat transfer on the windward side of a delta wing with a blunt
tip in hypersonic flow In Aerothermodynamics of aerospace systems Pt 1 pp 188-196
Moscow TsAGI (in Russian)
Hoffmann KA Chiang ST (2000) Computational fluid dynamics Vol 2 Engineering
Educational Systems ISBN 0-9623731-3-3 Kansas USA
Inouye Y (1995) OREX flight ndash quick report and lessons learned Proceedings of 2nd
European Symposium on Aerothermodynamics for Space Vehicles pp 271-279 ESTEC
Noordwik The Netherlands Europe Space Agency (November 1994)
Kovalev RV Kislykh VV Kolozezniy AE Kudryavtsev VV Marinin VP Vlasov
VI amp Zemliansky BA (2009) Experimental studies of Pre-X vehicle heat transfer
in PGU-7 test facility 3rd European Conference for Aerospace Sciences (EUCASS-2009)
Versailles France 6-9 July 2009
Lesin AB amp Lunev VV (1994) Heat transfer peaks on a blunt-nosed triangular plate in
hypersonic flow Fluid Dynamics Vol 29 No 2 (April 1994) pp 258-262 ISSN
0015-4628
Mason EA amp Saxena SC (1958) Approximate Formula for the Thermal Conductivity of
Gas Mixtures Phys Fluids Vol 1 No 5 (1958) pp 361-369
Pulliam TH (1986) Artificial dissipation models for the Euler equations AIAA Journal
Vol24 No 12 (December 1986) pp 1931-1940 ISSN 0001-1452
Vaganov AV Dmitriev VG Zadonsky SM Kireev AY Skuratov AS amp Stepanov
EA (2006) Estimations of low-sized winged reentry vehicle heat regimes on the
stage of its designing Physico-chemical kinetics in gas dynamics
wwwchemphysedurupdf2006-11-20-002pdf (in Russian)
Vlasov VI Gorshkov AB Kovalev RV amp Plastinin YuA (1997) Theoretical studies of
air ionization and NO vibrational excitation in low density hypersonic flow around
re-entry bodies AIAA Paper No 97-2582 (1997)
Vlasov V I amp Gorshkov A B (2001) Comparison of the Calculated Results for Hypersonic
Flow Past Blunt Bodies with the OREX Flight Test Data Fluid Dynamics Vol 36
No 5 (October 2001) pp 812-819 ISSN 0015-4628
wwwintechopencom
Heat Transfer - Mathematical Modelling Numerical Methods and Information Technology
252
Vlasov VI Gorshkov AB Kovalev RV amp Lunev VV (2009) Thin triangular blunt-
nosed plate in a viscous hypersonic flow Fluid Dynamics Vol 44 No 4 (August
2009) pp 596-605 ISSN 0015-4628
Wilke C (1950) A Viscosity Equation for Gas Mixtures JChemPhys Vol 18 No 4 (1950)
pp517-519
Yoon S amp Jameson A (1987) An LU-SSOR Scheme for the Euler and Navier-Stokes
Equations AIAA Paper No 87-0600 (1987)
wwwintechopencom
Heat Transfer - Mathematical Modelling Numerical Methods andInformation TechnologyEdited by Prof Aziz Belmiloudi
ISBN 978-953-307-550-1Hard cover 642 pagesPublisher InTechPublished online 14 February 2011Published in print edition February 2011
InTech EuropeUniversity Campus STeP Ri Slavka Krautzeka 83A 51000 Rijeka Croatia Phone +385 (51) 770 447 Fax +385 (51) 686 166
InTech ChinaUnit 405 Office Block Hotel Equatorial Shanghai No65 Yan An Road (West) Shanghai 200040 China
Phone +86-21-62489820 Fax +86-21-62489821
Over the past few decades there has been a prolific increase in research and development in area of heattransfer heat exchangers and their associated technologies This book is a collection of current research inthe above mentioned areas and describes modelling numerical methods simulation and informationtechnology with modern ideas and methods to analyse and enhance heat transfer for single and multiphasesystems The topics considered include various basic concepts of heat transfer the fundamental modes ofheat transfer (namely conduction convection and radiation) thermophysical properties computationalmethodologies control stabilization and optimization problems condensation boiling and freezing with manyreal-world problems and important modern applications The book is divided in four sections InverseStabilization and Optimization Problems Numerical Methods and Calculations Heat Transfer in MiniMicroSystems Energy Transfer and Solid Materials and each section discusses various issues methods andapplications in accordance with the subjects The combination of fundamental approach with many importantpractical applications of current interest will make this book of interest to researchers scientists engineers andgraduate students in many disciplines who make use of mathematical modelling inverse problemsimplementation of recently developed numerical methods in this multidisciplinary field as well as toexperimental and theoretical researchers in the field of heat and mass transfer
How to referenceIn order to correctly reference this scholarly work feel free to copy and paste the following
Andrey B Gorshkov (2011) Aerodynamic Heating at Hypersonic Speed Heat Transfer - MathematicalModelling Numerical Methods and Information Technology Prof Aziz Belmiloudi (Ed) ISBN 978-953-307-550-1 InTech Available from httpwwwintechopencombooksheat-transfer-mathematical-modelling-numerical-methods-and-information-technologyaerodynamic-heating-at-hypersonic-speed
wwwintechopencom
wwwintechopencom
copy 2011 The Author(s) Licensee IntechOpen This chapter is distributedunder the terms of the Creative Commons Attribution-NonCommercial-ShareAlike-30 License which permits use distribution and reproduction fornon-commercial purposes provided the original is properly cited andderivative works building on this content are distributed under the samelicense
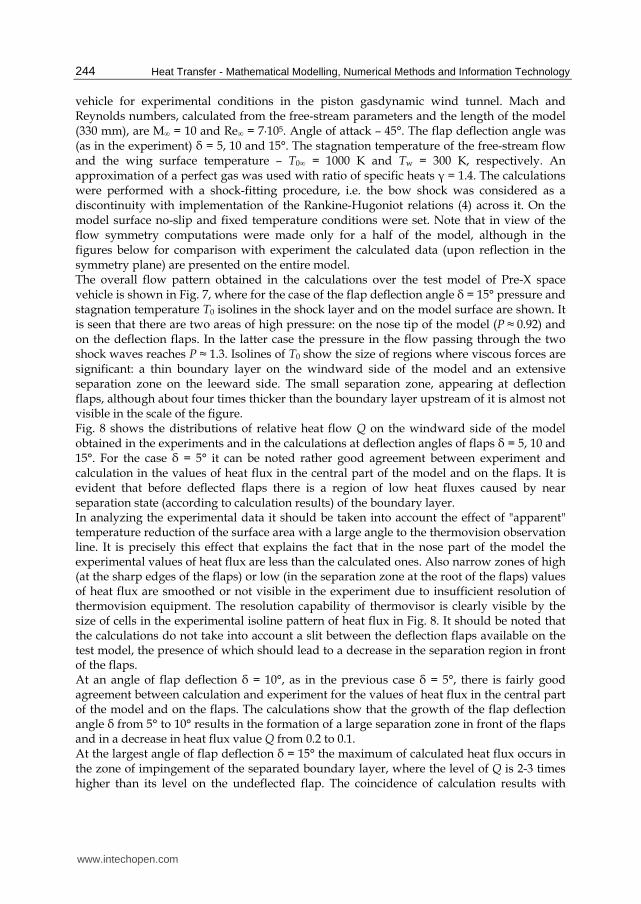
Heat Transfer - Mathematical Modelling Numerical Methods and Information Technology
244
vehicle for experimental conditions in the piston gasdynamic wind tunnel Mach and Reynolds numbers calculated from the free-stream parameters and the length of the model (330 mm) are Minfin = 10 and Reinfin = 7middot105 Angle of attack ndash 45deg The flap deflection angle was (as in the experiment) = 5 10 and 15deg The stagnation temperature of the free-stream flow and the wing surface temperature ndash T0infin = 1000 K and Tw = 300 K respectively An approximation of a perfect gas was used with ratio of specific heats = 14 The calculations were performed with a shock-fitting procedure ie the bow shock was considered as a discontinuity with implementation of the Rankine-Hugoniot relations (4) across it On the model surface no-slip and fixed temperature conditions were set Note that in view of the flow symmetry computations were made only for a half of the model although in the figures below for comparison with experiment the calculated data (upon reflection in the symmetry plane) are presented on the entire model The overall flow pattern obtained in the calculations over the test model of Pre-X space vehicle is shown in Fig 7 where for the case of the flap deflection angle = 15deg pressure and stagnation temperature Т0 isolines in the shock layer and on the model surface are shown It is seen that there are two areas of high pressure on the nose tip of the model (P asymp 092) and on the deflection flaps In the latter case the pressure in the flow passing through the two shock waves reaches P asymp 13 Isolines of Т0 show the size of regions where viscous forces are significant a thin boundary layer on the windward side of the model and an extensive separation zone on the leeward side The small separation zone appearing at deflection flaps although about four times thicker than the boundary layer upstream of it is almost not visible in the scale of the figure Fig 8 shows the distributions of relative heat flow Q on the windward side of the model obtained in the experiments and in the calculations at deflection angles of flaps = 5 10 and 15deg For the case = 5deg it can be noted rather good agreement between experiment and calculation in the values of heat flux in the central part of the model and on the flaps It is evident that before deflected flaps there is a region of low heat fluxes caused by near separation state (according to calculation results) of the boundary layer In analyzing the experimental data it should be taken into account the effect of apparent temperature reduction of the surface area with a large angle to the thermovision observation line It is precisely this effect that explains the fact that in the nose part of the model the experimental values of heat flux are less than the calculated ones Also narrow zones of high (at the sharp edges of the flaps) or low (in the separation zone at the root of the flaps) values of heat flux are smoothed or not visible in the experiment due to insufficient resolution of thermovision equipment The resolution capability of thermovisor is clearly visible by the size of cells in the experimental isoline pattern of heat flux in Fig 8 It should be noted that the calculations do not take into account a slit between the deflection flaps available on the test model the presence of which should lead to a decrease in the separation region in front of the flaps At an angle of flap deflection = 10deg as in the previous case = 5deg there is fairly good agreement between calculation and experiment for the values of heat flux in the central part of the model and on the flaps The calculations show that the growth of the flap deflection angle from 5deg to 10deg results in the formation of a large separation zone in front of the flaps and in a decrease in heat flux value Q from 02 to 01 At the largest angle of flap deflection = 15deg the maximum of calculated heat flux occurs in the zone of impingement of the separated boundary layer where the level of Q is 2-3 times higher than its level on the undeflected flap The coincidence of calculation results with
wwwintechopencom
Aerodynamic Heating at Hypersonic Speed
245
experimental data in the front part of the model up to the separation zone before the flaps is satisfactory On the flaps the level of heat flux in the experiment is about one and a half times more than in the calculation This difference in heat flux values is apparently due to laminar-turbulent transition in separation region induced by the deflected flaps which takes place in the experiment
δ = 5deg
δ = 10deg
δ = 15deg
Fig 8 Experimental (left) and calculated (right) heat fluxes Q = qq0 on windward side of test model of Pre-X space vehicle at different deflection angles of flaps
wwwintechopencom
Heat Transfer - Mathematical Modelling Numerical Methods and Information Technology
246
33 Flow and heat transfer on a winged space vehicle at reentry to Earths atmosphere This section presents the results of numerical simulation of flow and heat transfer on a
winged version of the small-scale reentry vehicle being developed in TsAGI (Vaganov et al
2006) moving at hypersonic speed in the Earths atmosphere Calculations were made using
two physical-chemical models of the gas medium - equilibrium and non-equilibrium
chemically reacting air
The bow shock was captured in contrast to the previous two flow cases Thus on the inflow
boundary the free-stream conditions were specified On the vehicle surface no-slip and
adiabatic wall conditions were supposed In calculations with use of the nonequilibrium air
model the vehicle surface was supposed to be low catalytical with the probability of
heterogeneous recombination of O and N atoms equal to А = 001
A computational grid was provided by Mikhalin VA (Dmitriev et al 2007) and was taken
from the inviscid flow calculation The number of points in the direction normal to the
vehicle surface has been increased to resolve the wall boundary layer Part of the results
presented below was reported in (Dmitriev et al 2007 Gorshkov et al 2008a)
Calculations were performed for two points of a reentry trajectory for which thermal loads
are close to maximum (Table 1) The angle of attack α = 35deg the vehicle length L = 9m A
grid 93times50times101 in the longitudinal transverse and circumferential directions respectively
were used in the calculations The surface grid of the vehicle is shown in Fig 9
Н
km
Vinfin
msec ReinfinL Minfin Рinfin atm Тinfin K
70 5952 346middot105 200 576middot10-5 219
63 5152 684middot105 166 159middot10-4 243
Table 1 Parameters of trajectory points
Fig 9 Surface grid of the small-scale reentry vehicle
In Fig 10a contours of total enthalpy H0 on the surface and in the shock layer near the reentry vehicle are shown On the windward side one can see the shock wave the thin wall boundary layer and the inviscid flow between them in which the values of H0 are constant In the calculations the shock wave is smeared upon 3-5 grid points and has a finite thickness due to the use of artificial dissipation In particular a local decrease in H0 in a strong shock
wwwintechopencom
Aerodynamic Heating at Hypersonic Speed
247
wave on the windward side which can be seen in the figure has no physical meaning and is due to the influence of artificial dissipation Recall that the Navier-Stokes equations do not correctly describe the shock structure at Mach numbers Mgt 15 In the shock layer on the leeward side it is visible a large area with reduced values of total enthalpy Н0ltН0infin (Н0infin ndash total enthalpy in the free-stream) which arises as a result of boundary layer separation from the vehicle surface Chemical processes occurring in the shock layer over the vehicle are illustrated in Fig 10b which shows contours of mass concentrations of oxygen atoms つо Under the considered conditions in the vicinity of the vehicle nose behind the shock wave O2 dissociation is complete On the windward side downstream the nose in the shock layer and on the surface the recombination occurs and the concentration of O decreases In contrast on the leeward side where the flow is very rarefied the level of つо remains high indicating that the process of recombination of atomic oxygen is frozen
boundary layer
shock wave
(a) (b)
Fig 10 Total enthalpy MJkg (a) and mass concentration of oxygen atoms (b) on the surface and in the shock layer near the vehicle 〉 = 63 km
0001
001
01
1
0 5 10
P
x m
equilibrium air
nonequilibrium air
equilibrium air
Fig 11 Pressure distribution P = ちρinfinVinfin2 on vehicle surface overall view (left) and in symmetry plane (right) 〉 = 63 km
wwwintechopencom
Heat Transfer - Mathematical Modelling Numerical Methods and Information Technology
248
In Fig 11 and 12 isolines of pressure heat flux qw and equilibrium radiation temperature Tw
on the vehicle surface are shown for cases of equilibrium and non-equilibrium dissociating
air Comparison of qw and Tw distributions on the vehicle surface in the symmetry plane for
two air models are depicted in Fig 13
Analysis of the calculation results shows that pressure distribution on the windward surface
of the vehicle does not depend on physical-chemical model of the gas medium - the
difference in pressure values for equilibrium and non-equilibrium air flow is 1 - 2 On the
leeward side pressure on the surface for nonequilibrium flow may be nearly two times
lower than for equilibrium flow (eg in the vicinity of the tail) This is probably due to the
fact that the effective ratio of specific heats for nonequilibrium air is greater than for
equilibrium air because in the shock layer on the leeward side nonequilibrium flow is
chemically frozen and here there is a sufficiently high concentration of atoms (see Fig 10b)
equilibrium air nonequilibrium air
Fig 12 Distributions of heat flux qw kWm2 (top) and equilibrium radiation temperature TwdegC (bottom) on the vehicle surface 〉 = 63 km
Nonequilibrium chemical processes in the shock layer and finite catalytic activity of the
vehicle surface (А = 001) significantly reduce the calculated levels of heat transfer in
comparison with the case of equilibrium air flow The most significant decrease in heat flux
is observed on the vehicle nose part (for x le 1 m) and in the vicinity of the tail For example
at the nose stagnation point the level of heat flux decreases by about 40 ndash from 640 to 385
kWm2 while the surface temperature decreases by nearly 15 ndash from 1670 to 1430 degC
Note a high heat flux level on the thin edge of the wing compared with one at the nose
stagnation point Particularly intense heating occurs at the sharp bend of the wing where the
values of heat flux and surface temperature even slightly exceed their values at the front
stagnation point In the case of equilibrium air flow the exceeding for heat flux is about 10
(710 and 640 kWm2) for temperature - 3 (1720 and 1670 degC) In the case of
nonequilibrium air flow the exceeding is more significant for heat flux - 30 (540 and 385
kWm2) for temperature - 10 (1570 and 1430 deg C)
wwwintechopencom
Aerodynamic Heating at Hypersonic Speed
249
In other parts of the vehicle surface difference in heat flux levels for the two air models is somewhat less and it decreases downstream presumably due to gradual recombination of atoms in the boundary layer at flowing along the surface in case of non-equilibrium air
1
10
100
1000
0 5 10
Qw
x m
equilibrium air
nonequilibrium air
0
1000
2000
0 5 10
Tw
x m
equilibrium air
nonequilibrium air
Fig 13 Profiles of heat flux qw kWm2 (left) and equilibrium radiation temperature TwdegC (right) on vehicle surface in symmetry plane 〉 = 63 km
A similar flow and heat flux patterns are observed for the altitude H = 70 km as seen in Fig 14 where contours of heat flux and equilibrium radiation wall temperature are shown at this altitude for the two air models For equilibrium air overall level of heat flux at 70 km is slightly higher than at 63 km For example heat flux value at the nose stagnation point is increased by 5 (675 compared with 640 kWm2) The opposite situation occurs for the model of nonequilibrium air in this case the stagnation point heat flux value at 70 km is lower than at 63 km ndash by 7 (360 and 385 kWm2 respectively)
equilibrium air nonequilibrium air
Fig 14 Distributions of heat flux qw kWm2 (top) and equilibrium radiation temperature TwdegC (bottom) on the vehicle surface 〉 = 70 km
wwwintechopencom
Heat Transfer - Mathematical Modelling Numerical Methods and Information Technology
250
4 Conclusion
A three-dimensional stationary NavierndashStokes computer code for laminar flow developed
by the author has been briefly described The code is mainly intended to calculate super-
and hypersonic flows over bodies accounting for high temperature real gas effects with
special emphasis on convective heat transfer Three gas models perfect gas equilibrium and
nonequilibrium gas mixture can be used in the calculations
In the chapter a comparison of code calculation results with experimental data is made for
two perfect gas hypersonic flow cases at wind tunnel conditions First case is a simulation of
an anomalous heat transfer on the windward side a delta wing with blunt edges On the
whole the calculation correctly predicts the magnitude and position of local maximum of
heat flux near the wing symmetry plane taking into account a small asymmetry in the
experimental data Second case is a computation of heat transfer on a test model of the Pre-X
demonstrator Satisfactory agreement with thermovision heat fluxes on the smooth
windward side and on the flaps is obtained except for the largest deflection angle of flaps
= 15deg when the level of heat flux in the experiment is about one and a half times more than
in the calculation This discrepancy is apparently due to laminar-turbulent transition in
separation region induced by the deflected flaps which takes place in the experiment
Third flow case concerns chemically reacting air flow at equilibrium or nonequilibrium
conditions Flowfield and convective heat transfer parameters for a winged shape of a small-
scale reentry vehicle are calculated for two points of a reentry trajectory in the Earthrsquos
atmosphere Heat flux and equilibrium radiation temperature distributions on the vehicle
surface are obtained Also regions of maximal thermal loadings are localized
Calculations show that for nonequilibrium air flow the use of a low catalytic coating (with
probability of heterogeneous recombination of atoms А = 001) on the vehicle surface
enables to decrease considerably the level of heat fluxes in regions of maximal heat transfer
in the nose part and on the wing edges in comparison with equilibrium air flow For
example for trajectory points with maximal thermal load a reduction of up to 40 in heat
flux (which results in a 15 reduction of equilibrium radiation wall temperature) can be
obtained at the vehicle nose
5 Acknowledgments
The author is grateful to Kovalev RV Marinin VP and Vlasov VI for delivering
thermovision data on test model of Pre-X vehicle and also to Churakov DA and Mihalin
VA for providing computational grids
6 References
Baiocco P Guedron S Plotard P amp Moulin J (2006) The Pre-X atmospheric re-entry
experimental lifting body Program status and system synthesis Proceedings of 57th
International Astronautical Congress 2-6 October 2006 IAC-06-D2P22
Churakov DA Gorshkov AB Kovalev RV Vlasov VI Beloshitsky AV Dyadkin
AA amp Zhurin SV (2008) Heat Transfer of Reentry Vehicles during Atmosphere
Flight Proceedings of 6-th European Symposium on Aerothermodynamics for Space
Vehicles Versailles France 3 - 6 November 2008
wwwintechopencom
Aerodynamic Heating at Hypersonic Speed
251
Dmitriev VG Vaganov AV Gorshkov AB Lapygin VI Galaktionov AYu amp
Mikhalin VA (2007) Analysis of Aerothermodynamic Parameters of Reusable
Space Wing Vehicle Proceedings of 2nd European Conference for Aero-Space Sciences
Brussels Belgium July 1-6 2007
Gorshkov AB (1997) Calculation of Base Heat Transfer Behind Thin Cone-Shaped Bodies
Cosmonautics and Rocket Engineering No 11 (1997) pp 13-20 (in Russian)
Gorshkov AB Kovalev R V Vlasov V I amp Zemlyanskiy B A (2008a) Simulation of
Heat Transfer to Space Vehicles during a Gliding Reentry into Earthrsquos
Atmosphere Proceedings of 14th International Conference on Methods of Aerophysical
Research (ICMAR-2008) Novosibirsk Russia 30 June - 06 July 2008
Gorshkov AB Kovalev R V Vlasov amp V I Zemlyanskiy B A (2008b) Heat Transfer
Investigation for Hypersonic Flow over Experimental Model of Pre-X Reentry
Vehicle Proceedings of 7th Sino-Russian High-Speed Flow Conference (SRHFC-7)
Novosibirsk Russia 1 - 3 July 2008
Grantham WL (1970) Flight results of a 25000 fps re-entry experiment NASA TN D 6062
Gubanova OI Zemlyansky BA Lessin AB Lunev VV Nikulin AN amp Syusin AV
(1992) Anomalous heat transfer on the windward side of a delta wing with a blunt
tip in hypersonic flow In Aerothermodynamics of aerospace systems Pt 1 pp 188-196
Moscow TsAGI (in Russian)
Hoffmann KA Chiang ST (2000) Computational fluid dynamics Vol 2 Engineering
Educational Systems ISBN 0-9623731-3-3 Kansas USA
Inouye Y (1995) OREX flight ndash quick report and lessons learned Proceedings of 2nd
European Symposium on Aerothermodynamics for Space Vehicles pp 271-279 ESTEC
Noordwik The Netherlands Europe Space Agency (November 1994)
Kovalev RV Kislykh VV Kolozezniy AE Kudryavtsev VV Marinin VP Vlasov
VI amp Zemliansky BA (2009) Experimental studies of Pre-X vehicle heat transfer
in PGU-7 test facility 3rd European Conference for Aerospace Sciences (EUCASS-2009)
Versailles France 6-9 July 2009
Lesin AB amp Lunev VV (1994) Heat transfer peaks on a blunt-nosed triangular plate in
hypersonic flow Fluid Dynamics Vol 29 No 2 (April 1994) pp 258-262 ISSN
0015-4628
Mason EA amp Saxena SC (1958) Approximate Formula for the Thermal Conductivity of
Gas Mixtures Phys Fluids Vol 1 No 5 (1958) pp 361-369
Pulliam TH (1986) Artificial dissipation models for the Euler equations AIAA Journal
Vol24 No 12 (December 1986) pp 1931-1940 ISSN 0001-1452
Vaganov AV Dmitriev VG Zadonsky SM Kireev AY Skuratov AS amp Stepanov
EA (2006) Estimations of low-sized winged reentry vehicle heat regimes on the
stage of its designing Physico-chemical kinetics in gas dynamics
wwwchemphysedurupdf2006-11-20-002pdf (in Russian)
Vlasov VI Gorshkov AB Kovalev RV amp Plastinin YuA (1997) Theoretical studies of
air ionization and NO vibrational excitation in low density hypersonic flow around
re-entry bodies AIAA Paper No 97-2582 (1997)
Vlasov V I amp Gorshkov A B (2001) Comparison of the Calculated Results for Hypersonic
Flow Past Blunt Bodies with the OREX Flight Test Data Fluid Dynamics Vol 36
No 5 (October 2001) pp 812-819 ISSN 0015-4628
wwwintechopencom
Heat Transfer - Mathematical Modelling Numerical Methods and Information Technology
252
Vlasov VI Gorshkov AB Kovalev RV amp Lunev VV (2009) Thin triangular blunt-
nosed plate in a viscous hypersonic flow Fluid Dynamics Vol 44 No 4 (August
2009) pp 596-605 ISSN 0015-4628
Wilke C (1950) A Viscosity Equation for Gas Mixtures JChemPhys Vol 18 No 4 (1950)
pp517-519
Yoon S amp Jameson A (1987) An LU-SSOR Scheme for the Euler and Navier-Stokes
Equations AIAA Paper No 87-0600 (1987)
wwwintechopencom
Heat Transfer - Mathematical Modelling Numerical Methods andInformation TechnologyEdited by Prof Aziz Belmiloudi
ISBN 978-953-307-550-1Hard cover 642 pagesPublisher InTechPublished online 14 February 2011Published in print edition February 2011
InTech EuropeUniversity Campus STeP Ri Slavka Krautzeka 83A 51000 Rijeka Croatia Phone +385 (51) 770 447 Fax +385 (51) 686 166
InTech ChinaUnit 405 Office Block Hotel Equatorial Shanghai No65 Yan An Road (West) Shanghai 200040 China
Phone +86-21-62489820 Fax +86-21-62489821
Over the past few decades there has been a prolific increase in research and development in area of heattransfer heat exchangers and their associated technologies This book is a collection of current research inthe above mentioned areas and describes modelling numerical methods simulation and informationtechnology with modern ideas and methods to analyse and enhance heat transfer for single and multiphasesystems The topics considered include various basic concepts of heat transfer the fundamental modes ofheat transfer (namely conduction convection and radiation) thermophysical properties computationalmethodologies control stabilization and optimization problems condensation boiling and freezing with manyreal-world problems and important modern applications The book is divided in four sections InverseStabilization and Optimization Problems Numerical Methods and Calculations Heat Transfer in MiniMicroSystems Energy Transfer and Solid Materials and each section discusses various issues methods andapplications in accordance with the subjects The combination of fundamental approach with many importantpractical applications of current interest will make this book of interest to researchers scientists engineers andgraduate students in many disciplines who make use of mathematical modelling inverse problemsimplementation of recently developed numerical methods in this multidisciplinary field as well as toexperimental and theoretical researchers in the field of heat and mass transfer
How to referenceIn order to correctly reference this scholarly work feel free to copy and paste the following
Andrey B Gorshkov (2011) Aerodynamic Heating at Hypersonic Speed Heat Transfer - MathematicalModelling Numerical Methods and Information Technology Prof Aziz Belmiloudi (Ed) ISBN 978-953-307-550-1 InTech Available from httpwwwintechopencombooksheat-transfer-mathematical-modelling-numerical-methods-and-information-technologyaerodynamic-heating-at-hypersonic-speed
wwwintechopencom
wwwintechopencom
copy 2011 The Author(s) Licensee IntechOpen This chapter is distributedunder the terms of the Creative Commons Attribution-NonCommercial-ShareAlike-30 License which permits use distribution and reproduction fornon-commercial purposes provided the original is properly cited andderivative works building on this content are distributed under the samelicense
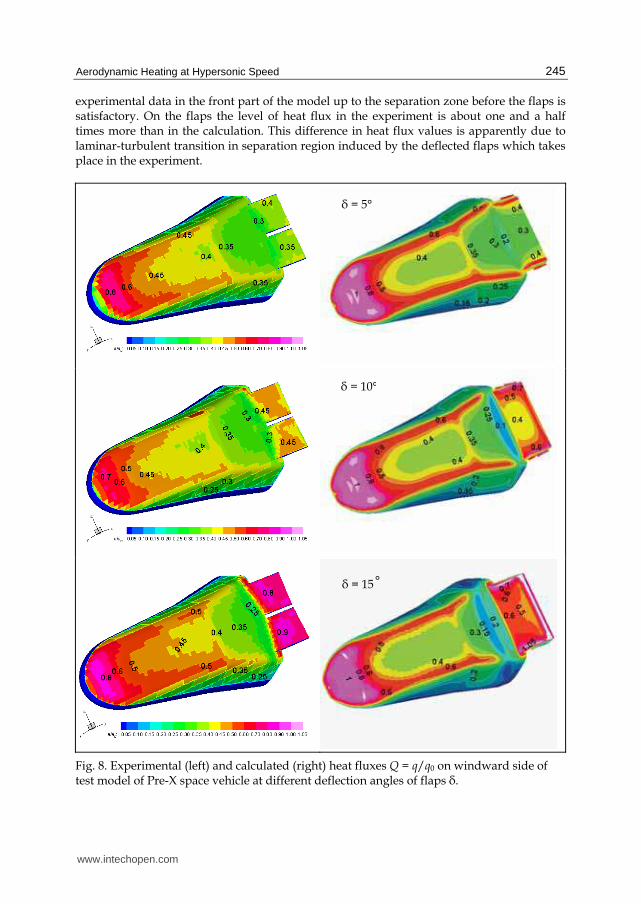
Aerodynamic Heating at Hypersonic Speed
245
experimental data in the front part of the model up to the separation zone before the flaps is satisfactory On the flaps the level of heat flux in the experiment is about one and a half times more than in the calculation This difference in heat flux values is apparently due to laminar-turbulent transition in separation region induced by the deflected flaps which takes place in the experiment
δ = 5deg
δ = 10deg
δ = 15deg
Fig 8 Experimental (left) and calculated (right) heat fluxes Q = qq0 on windward side of test model of Pre-X space vehicle at different deflection angles of flaps
wwwintechopencom
Heat Transfer - Mathematical Modelling Numerical Methods and Information Technology
246
33 Flow and heat transfer on a winged space vehicle at reentry to Earths atmosphere This section presents the results of numerical simulation of flow and heat transfer on a
winged version of the small-scale reentry vehicle being developed in TsAGI (Vaganov et al
2006) moving at hypersonic speed in the Earths atmosphere Calculations were made using
two physical-chemical models of the gas medium - equilibrium and non-equilibrium
chemically reacting air
The bow shock was captured in contrast to the previous two flow cases Thus on the inflow
boundary the free-stream conditions were specified On the vehicle surface no-slip and
adiabatic wall conditions were supposed In calculations with use of the nonequilibrium air
model the vehicle surface was supposed to be low catalytical with the probability of
heterogeneous recombination of O and N atoms equal to А = 001
A computational grid was provided by Mikhalin VA (Dmitriev et al 2007) and was taken
from the inviscid flow calculation The number of points in the direction normal to the
vehicle surface has been increased to resolve the wall boundary layer Part of the results
presented below was reported in (Dmitriev et al 2007 Gorshkov et al 2008a)
Calculations were performed for two points of a reentry trajectory for which thermal loads
are close to maximum (Table 1) The angle of attack α = 35deg the vehicle length L = 9m A
grid 93times50times101 in the longitudinal transverse and circumferential directions respectively
were used in the calculations The surface grid of the vehicle is shown in Fig 9
Н
km
Vinfin
msec ReinfinL Minfin Рinfin atm Тinfin K
70 5952 346middot105 200 576middot10-5 219
63 5152 684middot105 166 159middot10-4 243
Table 1 Parameters of trajectory points
Fig 9 Surface grid of the small-scale reentry vehicle
In Fig 10a contours of total enthalpy H0 on the surface and in the shock layer near the reentry vehicle are shown On the windward side one can see the shock wave the thin wall boundary layer and the inviscid flow between them in which the values of H0 are constant In the calculations the shock wave is smeared upon 3-5 grid points and has a finite thickness due to the use of artificial dissipation In particular a local decrease in H0 in a strong shock
wwwintechopencom
Aerodynamic Heating at Hypersonic Speed
247
wave on the windward side which can be seen in the figure has no physical meaning and is due to the influence of artificial dissipation Recall that the Navier-Stokes equations do not correctly describe the shock structure at Mach numbers Mgt 15 In the shock layer on the leeward side it is visible a large area with reduced values of total enthalpy Н0ltН0infin (Н0infin ndash total enthalpy in the free-stream) which arises as a result of boundary layer separation from the vehicle surface Chemical processes occurring in the shock layer over the vehicle are illustrated in Fig 10b which shows contours of mass concentrations of oxygen atoms つо Under the considered conditions in the vicinity of the vehicle nose behind the shock wave O2 dissociation is complete On the windward side downstream the nose in the shock layer and on the surface the recombination occurs and the concentration of O decreases In contrast on the leeward side where the flow is very rarefied the level of つо remains high indicating that the process of recombination of atomic oxygen is frozen
boundary layer
shock wave
(a) (b)
Fig 10 Total enthalpy MJkg (a) and mass concentration of oxygen atoms (b) on the surface and in the shock layer near the vehicle 〉 = 63 km
0001
001
01
1
0 5 10
P
x m
equilibrium air
nonequilibrium air
equilibrium air
Fig 11 Pressure distribution P = ちρinfinVinfin2 on vehicle surface overall view (left) and in symmetry plane (right) 〉 = 63 km
wwwintechopencom
Heat Transfer - Mathematical Modelling Numerical Methods and Information Technology
248
In Fig 11 and 12 isolines of pressure heat flux qw and equilibrium radiation temperature Tw
on the vehicle surface are shown for cases of equilibrium and non-equilibrium dissociating
air Comparison of qw and Tw distributions on the vehicle surface in the symmetry plane for
two air models are depicted in Fig 13
Analysis of the calculation results shows that pressure distribution on the windward surface
of the vehicle does not depend on physical-chemical model of the gas medium - the
difference in pressure values for equilibrium and non-equilibrium air flow is 1 - 2 On the
leeward side pressure on the surface for nonequilibrium flow may be nearly two times
lower than for equilibrium flow (eg in the vicinity of the tail) This is probably due to the
fact that the effective ratio of specific heats for nonequilibrium air is greater than for
equilibrium air because in the shock layer on the leeward side nonequilibrium flow is
chemically frozen and here there is a sufficiently high concentration of atoms (see Fig 10b)
equilibrium air nonequilibrium air
Fig 12 Distributions of heat flux qw kWm2 (top) and equilibrium radiation temperature TwdegC (bottom) on the vehicle surface 〉 = 63 km
Nonequilibrium chemical processes in the shock layer and finite catalytic activity of the
vehicle surface (А = 001) significantly reduce the calculated levels of heat transfer in
comparison with the case of equilibrium air flow The most significant decrease in heat flux
is observed on the vehicle nose part (for x le 1 m) and in the vicinity of the tail For example
at the nose stagnation point the level of heat flux decreases by about 40 ndash from 640 to 385
kWm2 while the surface temperature decreases by nearly 15 ndash from 1670 to 1430 degC
Note a high heat flux level on the thin edge of the wing compared with one at the nose
stagnation point Particularly intense heating occurs at the sharp bend of the wing where the
values of heat flux and surface temperature even slightly exceed their values at the front
stagnation point In the case of equilibrium air flow the exceeding for heat flux is about 10
(710 and 640 kWm2) for temperature - 3 (1720 and 1670 degC) In the case of
nonequilibrium air flow the exceeding is more significant for heat flux - 30 (540 and 385
kWm2) for temperature - 10 (1570 and 1430 deg C)
wwwintechopencom
Aerodynamic Heating at Hypersonic Speed
249
In other parts of the vehicle surface difference in heat flux levels for the two air models is somewhat less and it decreases downstream presumably due to gradual recombination of atoms in the boundary layer at flowing along the surface in case of non-equilibrium air
1
10
100
1000
0 5 10
Qw
x m
equilibrium air
nonequilibrium air
0
1000
2000
0 5 10
Tw
x m
equilibrium air
nonequilibrium air
Fig 13 Profiles of heat flux qw kWm2 (left) and equilibrium radiation temperature TwdegC (right) on vehicle surface in symmetry plane 〉 = 63 km
A similar flow and heat flux patterns are observed for the altitude H = 70 km as seen in Fig 14 where contours of heat flux and equilibrium radiation wall temperature are shown at this altitude for the two air models For equilibrium air overall level of heat flux at 70 km is slightly higher than at 63 km For example heat flux value at the nose stagnation point is increased by 5 (675 compared with 640 kWm2) The opposite situation occurs for the model of nonequilibrium air in this case the stagnation point heat flux value at 70 km is lower than at 63 km ndash by 7 (360 and 385 kWm2 respectively)
equilibrium air nonequilibrium air
Fig 14 Distributions of heat flux qw kWm2 (top) and equilibrium radiation temperature TwdegC (bottom) on the vehicle surface 〉 = 70 km
wwwintechopencom
Heat Transfer - Mathematical Modelling Numerical Methods and Information Technology
250
4 Conclusion
A three-dimensional stationary NavierndashStokes computer code for laminar flow developed
by the author has been briefly described The code is mainly intended to calculate super-
and hypersonic flows over bodies accounting for high temperature real gas effects with
special emphasis on convective heat transfer Three gas models perfect gas equilibrium and
nonequilibrium gas mixture can be used in the calculations
In the chapter a comparison of code calculation results with experimental data is made for
two perfect gas hypersonic flow cases at wind tunnel conditions First case is a simulation of
an anomalous heat transfer on the windward side a delta wing with blunt edges On the
whole the calculation correctly predicts the magnitude and position of local maximum of
heat flux near the wing symmetry plane taking into account a small asymmetry in the
experimental data Second case is a computation of heat transfer on a test model of the Pre-X
demonstrator Satisfactory agreement with thermovision heat fluxes on the smooth
windward side and on the flaps is obtained except for the largest deflection angle of flaps
= 15deg when the level of heat flux in the experiment is about one and a half times more than
in the calculation This discrepancy is apparently due to laminar-turbulent transition in
separation region induced by the deflected flaps which takes place in the experiment
Third flow case concerns chemically reacting air flow at equilibrium or nonequilibrium
conditions Flowfield and convective heat transfer parameters for a winged shape of a small-
scale reentry vehicle are calculated for two points of a reentry trajectory in the Earthrsquos
atmosphere Heat flux and equilibrium radiation temperature distributions on the vehicle
surface are obtained Also regions of maximal thermal loadings are localized
Calculations show that for nonequilibrium air flow the use of a low catalytic coating (with
probability of heterogeneous recombination of atoms А = 001) on the vehicle surface
enables to decrease considerably the level of heat fluxes in regions of maximal heat transfer
in the nose part and on the wing edges in comparison with equilibrium air flow For
example for trajectory points with maximal thermal load a reduction of up to 40 in heat
flux (which results in a 15 reduction of equilibrium radiation wall temperature) can be
obtained at the vehicle nose
5 Acknowledgments
The author is grateful to Kovalev RV Marinin VP and Vlasov VI for delivering
thermovision data on test model of Pre-X vehicle and also to Churakov DA and Mihalin
VA for providing computational grids
6 References
Baiocco P Guedron S Plotard P amp Moulin J (2006) The Pre-X atmospheric re-entry
experimental lifting body Program status and system synthesis Proceedings of 57th
International Astronautical Congress 2-6 October 2006 IAC-06-D2P22
Churakov DA Gorshkov AB Kovalev RV Vlasov VI Beloshitsky AV Dyadkin
AA amp Zhurin SV (2008) Heat Transfer of Reentry Vehicles during Atmosphere
Flight Proceedings of 6-th European Symposium on Aerothermodynamics for Space
Vehicles Versailles France 3 - 6 November 2008
wwwintechopencom
Aerodynamic Heating at Hypersonic Speed
251
Dmitriev VG Vaganov AV Gorshkov AB Lapygin VI Galaktionov AYu amp
Mikhalin VA (2007) Analysis of Aerothermodynamic Parameters of Reusable
Space Wing Vehicle Proceedings of 2nd European Conference for Aero-Space Sciences
Brussels Belgium July 1-6 2007
Gorshkov AB (1997) Calculation of Base Heat Transfer Behind Thin Cone-Shaped Bodies
Cosmonautics and Rocket Engineering No 11 (1997) pp 13-20 (in Russian)
Gorshkov AB Kovalev R V Vlasov V I amp Zemlyanskiy B A (2008a) Simulation of
Heat Transfer to Space Vehicles during a Gliding Reentry into Earthrsquos
Atmosphere Proceedings of 14th International Conference on Methods of Aerophysical
Research (ICMAR-2008) Novosibirsk Russia 30 June - 06 July 2008
Gorshkov AB Kovalev R V Vlasov amp V I Zemlyanskiy B A (2008b) Heat Transfer
Investigation for Hypersonic Flow over Experimental Model of Pre-X Reentry
Vehicle Proceedings of 7th Sino-Russian High-Speed Flow Conference (SRHFC-7)
Novosibirsk Russia 1 - 3 July 2008
Grantham WL (1970) Flight results of a 25000 fps re-entry experiment NASA TN D 6062
Gubanova OI Zemlyansky BA Lessin AB Lunev VV Nikulin AN amp Syusin AV
(1992) Anomalous heat transfer on the windward side of a delta wing with a blunt
tip in hypersonic flow In Aerothermodynamics of aerospace systems Pt 1 pp 188-196
Moscow TsAGI (in Russian)
Hoffmann KA Chiang ST (2000) Computational fluid dynamics Vol 2 Engineering
Educational Systems ISBN 0-9623731-3-3 Kansas USA
Inouye Y (1995) OREX flight ndash quick report and lessons learned Proceedings of 2nd
European Symposium on Aerothermodynamics for Space Vehicles pp 271-279 ESTEC
Noordwik The Netherlands Europe Space Agency (November 1994)
Kovalev RV Kislykh VV Kolozezniy AE Kudryavtsev VV Marinin VP Vlasov
VI amp Zemliansky BA (2009) Experimental studies of Pre-X vehicle heat transfer
in PGU-7 test facility 3rd European Conference for Aerospace Sciences (EUCASS-2009)
Versailles France 6-9 July 2009
Lesin AB amp Lunev VV (1994) Heat transfer peaks on a blunt-nosed triangular plate in
hypersonic flow Fluid Dynamics Vol 29 No 2 (April 1994) pp 258-262 ISSN
0015-4628
Mason EA amp Saxena SC (1958) Approximate Formula for the Thermal Conductivity of
Gas Mixtures Phys Fluids Vol 1 No 5 (1958) pp 361-369
Pulliam TH (1986) Artificial dissipation models for the Euler equations AIAA Journal
Vol24 No 12 (December 1986) pp 1931-1940 ISSN 0001-1452
Vaganov AV Dmitriev VG Zadonsky SM Kireev AY Skuratov AS amp Stepanov
EA (2006) Estimations of low-sized winged reentry vehicle heat regimes on the
stage of its designing Physico-chemical kinetics in gas dynamics
wwwchemphysedurupdf2006-11-20-002pdf (in Russian)
Vlasov VI Gorshkov AB Kovalev RV amp Plastinin YuA (1997) Theoretical studies of
air ionization and NO vibrational excitation in low density hypersonic flow around
re-entry bodies AIAA Paper No 97-2582 (1997)
Vlasov V I amp Gorshkov A B (2001) Comparison of the Calculated Results for Hypersonic
Flow Past Blunt Bodies with the OREX Flight Test Data Fluid Dynamics Vol 36
No 5 (October 2001) pp 812-819 ISSN 0015-4628
wwwintechopencom
Heat Transfer - Mathematical Modelling Numerical Methods and Information Technology
252
Vlasov VI Gorshkov AB Kovalev RV amp Lunev VV (2009) Thin triangular blunt-
nosed plate in a viscous hypersonic flow Fluid Dynamics Vol 44 No 4 (August
2009) pp 596-605 ISSN 0015-4628
Wilke C (1950) A Viscosity Equation for Gas Mixtures JChemPhys Vol 18 No 4 (1950)
pp517-519
Yoon S amp Jameson A (1987) An LU-SSOR Scheme for the Euler and Navier-Stokes
Equations AIAA Paper No 87-0600 (1987)
wwwintechopencom
Heat Transfer - Mathematical Modelling Numerical Methods andInformation TechnologyEdited by Prof Aziz Belmiloudi
ISBN 978-953-307-550-1Hard cover 642 pagesPublisher InTechPublished online 14 February 2011Published in print edition February 2011
InTech EuropeUniversity Campus STeP Ri Slavka Krautzeka 83A 51000 Rijeka Croatia Phone +385 (51) 770 447 Fax +385 (51) 686 166
InTech ChinaUnit 405 Office Block Hotel Equatorial Shanghai No65 Yan An Road (West) Shanghai 200040 China
Phone +86-21-62489820 Fax +86-21-62489821
Over the past few decades there has been a prolific increase in research and development in area of heattransfer heat exchangers and their associated technologies This book is a collection of current research inthe above mentioned areas and describes modelling numerical methods simulation and informationtechnology with modern ideas and methods to analyse and enhance heat transfer for single and multiphasesystems The topics considered include various basic concepts of heat transfer the fundamental modes ofheat transfer (namely conduction convection and radiation) thermophysical properties computationalmethodologies control stabilization and optimization problems condensation boiling and freezing with manyreal-world problems and important modern applications The book is divided in four sections InverseStabilization and Optimization Problems Numerical Methods and Calculations Heat Transfer in MiniMicroSystems Energy Transfer and Solid Materials and each section discusses various issues methods andapplications in accordance with the subjects The combination of fundamental approach with many importantpractical applications of current interest will make this book of interest to researchers scientists engineers andgraduate students in many disciplines who make use of mathematical modelling inverse problemsimplementation of recently developed numerical methods in this multidisciplinary field as well as toexperimental and theoretical researchers in the field of heat and mass transfer
How to referenceIn order to correctly reference this scholarly work feel free to copy and paste the following
Andrey B Gorshkov (2011) Aerodynamic Heating at Hypersonic Speed Heat Transfer - MathematicalModelling Numerical Methods and Information Technology Prof Aziz Belmiloudi (Ed) ISBN 978-953-307-550-1 InTech Available from httpwwwintechopencombooksheat-transfer-mathematical-modelling-numerical-methods-and-information-technologyaerodynamic-heating-at-hypersonic-speed
wwwintechopencom
wwwintechopencom
copy 2011 The Author(s) Licensee IntechOpen This chapter is distributedunder the terms of the Creative Commons Attribution-NonCommercial-ShareAlike-30 License which permits use distribution and reproduction fornon-commercial purposes provided the original is properly cited andderivative works building on this content are distributed under the samelicense
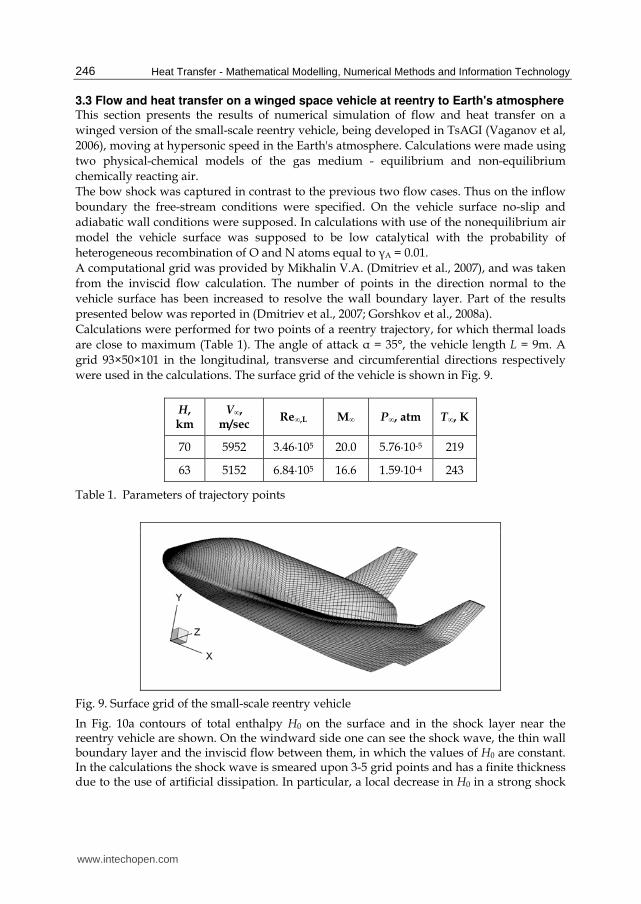
Heat Transfer - Mathematical Modelling Numerical Methods and Information Technology
246
33 Flow and heat transfer on a winged space vehicle at reentry to Earths atmosphere This section presents the results of numerical simulation of flow and heat transfer on a
winged version of the small-scale reentry vehicle being developed in TsAGI (Vaganov et al
2006) moving at hypersonic speed in the Earths atmosphere Calculations were made using
two physical-chemical models of the gas medium - equilibrium and non-equilibrium
chemically reacting air
The bow shock was captured in contrast to the previous two flow cases Thus on the inflow
boundary the free-stream conditions were specified On the vehicle surface no-slip and
adiabatic wall conditions were supposed In calculations with use of the nonequilibrium air
model the vehicle surface was supposed to be low catalytical with the probability of
heterogeneous recombination of O and N atoms equal to А = 001
A computational grid was provided by Mikhalin VA (Dmitriev et al 2007) and was taken
from the inviscid flow calculation The number of points in the direction normal to the
vehicle surface has been increased to resolve the wall boundary layer Part of the results
presented below was reported in (Dmitriev et al 2007 Gorshkov et al 2008a)
Calculations were performed for two points of a reentry trajectory for which thermal loads
are close to maximum (Table 1) The angle of attack α = 35deg the vehicle length L = 9m A
grid 93times50times101 in the longitudinal transverse and circumferential directions respectively
were used in the calculations The surface grid of the vehicle is shown in Fig 9
Н
km
Vinfin
msec ReinfinL Minfin Рinfin atm Тinfin K
70 5952 346middot105 200 576middot10-5 219
63 5152 684middot105 166 159middot10-4 243
Table 1 Parameters of trajectory points
Fig 9 Surface grid of the small-scale reentry vehicle
In Fig 10a contours of total enthalpy H0 on the surface and in the shock layer near the reentry vehicle are shown On the windward side one can see the shock wave the thin wall boundary layer and the inviscid flow between them in which the values of H0 are constant In the calculations the shock wave is smeared upon 3-5 grid points and has a finite thickness due to the use of artificial dissipation In particular a local decrease in H0 in a strong shock
wwwintechopencom
Aerodynamic Heating at Hypersonic Speed
247
wave on the windward side which can be seen in the figure has no physical meaning and is due to the influence of artificial dissipation Recall that the Navier-Stokes equations do not correctly describe the shock structure at Mach numbers Mgt 15 In the shock layer on the leeward side it is visible a large area with reduced values of total enthalpy Н0ltН0infin (Н0infin ndash total enthalpy in the free-stream) which arises as a result of boundary layer separation from the vehicle surface Chemical processes occurring in the shock layer over the vehicle are illustrated in Fig 10b which shows contours of mass concentrations of oxygen atoms つо Under the considered conditions in the vicinity of the vehicle nose behind the shock wave O2 dissociation is complete On the windward side downstream the nose in the shock layer and on the surface the recombination occurs and the concentration of O decreases In contrast on the leeward side where the flow is very rarefied the level of つо remains high indicating that the process of recombination of atomic oxygen is frozen
boundary layer
shock wave
(a) (b)
Fig 10 Total enthalpy MJkg (a) and mass concentration of oxygen atoms (b) on the surface and in the shock layer near the vehicle 〉 = 63 km
0001
001
01
1
0 5 10
P
x m
equilibrium air
nonequilibrium air
equilibrium air
Fig 11 Pressure distribution P = ちρinfinVinfin2 on vehicle surface overall view (left) and in symmetry plane (right) 〉 = 63 km
wwwintechopencom
Heat Transfer - Mathematical Modelling Numerical Methods and Information Technology
248
In Fig 11 and 12 isolines of pressure heat flux qw and equilibrium radiation temperature Tw
on the vehicle surface are shown for cases of equilibrium and non-equilibrium dissociating
air Comparison of qw and Tw distributions on the vehicle surface in the symmetry plane for
two air models are depicted in Fig 13
Analysis of the calculation results shows that pressure distribution on the windward surface
of the vehicle does not depend on physical-chemical model of the gas medium - the
difference in pressure values for equilibrium and non-equilibrium air flow is 1 - 2 On the
leeward side pressure on the surface for nonequilibrium flow may be nearly two times
lower than for equilibrium flow (eg in the vicinity of the tail) This is probably due to the
fact that the effective ratio of specific heats for nonequilibrium air is greater than for
equilibrium air because in the shock layer on the leeward side nonequilibrium flow is
chemically frozen and here there is a sufficiently high concentration of atoms (see Fig 10b)
equilibrium air nonequilibrium air
Fig 12 Distributions of heat flux qw kWm2 (top) and equilibrium radiation temperature TwdegC (bottom) on the vehicle surface 〉 = 63 km
Nonequilibrium chemical processes in the shock layer and finite catalytic activity of the
vehicle surface (А = 001) significantly reduce the calculated levels of heat transfer in
comparison with the case of equilibrium air flow The most significant decrease in heat flux
is observed on the vehicle nose part (for x le 1 m) and in the vicinity of the tail For example
at the nose stagnation point the level of heat flux decreases by about 40 ndash from 640 to 385
kWm2 while the surface temperature decreases by nearly 15 ndash from 1670 to 1430 degC
Note a high heat flux level on the thin edge of the wing compared with one at the nose
stagnation point Particularly intense heating occurs at the sharp bend of the wing where the
values of heat flux and surface temperature even slightly exceed their values at the front
stagnation point In the case of equilibrium air flow the exceeding for heat flux is about 10
(710 and 640 kWm2) for temperature - 3 (1720 and 1670 degC) In the case of
nonequilibrium air flow the exceeding is more significant for heat flux - 30 (540 and 385
kWm2) for temperature - 10 (1570 and 1430 deg C)
wwwintechopencom
Aerodynamic Heating at Hypersonic Speed
249
In other parts of the vehicle surface difference in heat flux levels for the two air models is somewhat less and it decreases downstream presumably due to gradual recombination of atoms in the boundary layer at flowing along the surface in case of non-equilibrium air
1
10
100
1000
0 5 10
Qw
x m
equilibrium air
nonequilibrium air
0
1000
2000
0 5 10
Tw
x m
equilibrium air
nonequilibrium air
Fig 13 Profiles of heat flux qw kWm2 (left) and equilibrium radiation temperature TwdegC (right) on vehicle surface in symmetry plane 〉 = 63 km
A similar flow and heat flux patterns are observed for the altitude H = 70 km as seen in Fig 14 where contours of heat flux and equilibrium radiation wall temperature are shown at this altitude for the two air models For equilibrium air overall level of heat flux at 70 km is slightly higher than at 63 km For example heat flux value at the nose stagnation point is increased by 5 (675 compared with 640 kWm2) The opposite situation occurs for the model of nonequilibrium air in this case the stagnation point heat flux value at 70 km is lower than at 63 km ndash by 7 (360 and 385 kWm2 respectively)
equilibrium air nonequilibrium air
Fig 14 Distributions of heat flux qw kWm2 (top) and equilibrium radiation temperature TwdegC (bottom) on the vehicle surface 〉 = 70 km
wwwintechopencom
Heat Transfer - Mathematical Modelling Numerical Methods and Information Technology
250
4 Conclusion
A three-dimensional stationary NavierndashStokes computer code for laminar flow developed
by the author has been briefly described The code is mainly intended to calculate super-
and hypersonic flows over bodies accounting for high temperature real gas effects with
special emphasis on convective heat transfer Three gas models perfect gas equilibrium and
nonequilibrium gas mixture can be used in the calculations
In the chapter a comparison of code calculation results with experimental data is made for
two perfect gas hypersonic flow cases at wind tunnel conditions First case is a simulation of
an anomalous heat transfer on the windward side a delta wing with blunt edges On the
whole the calculation correctly predicts the magnitude and position of local maximum of
heat flux near the wing symmetry plane taking into account a small asymmetry in the
experimental data Second case is a computation of heat transfer on a test model of the Pre-X
demonstrator Satisfactory agreement with thermovision heat fluxes on the smooth
windward side and on the flaps is obtained except for the largest deflection angle of flaps
= 15deg when the level of heat flux in the experiment is about one and a half times more than
in the calculation This discrepancy is apparently due to laminar-turbulent transition in
separation region induced by the deflected flaps which takes place in the experiment
Third flow case concerns chemically reacting air flow at equilibrium or nonequilibrium
conditions Flowfield and convective heat transfer parameters for a winged shape of a small-
scale reentry vehicle are calculated for two points of a reentry trajectory in the Earthrsquos
atmosphere Heat flux and equilibrium radiation temperature distributions on the vehicle
surface are obtained Also regions of maximal thermal loadings are localized
Calculations show that for nonequilibrium air flow the use of a low catalytic coating (with
probability of heterogeneous recombination of atoms А = 001) on the vehicle surface
enables to decrease considerably the level of heat fluxes in regions of maximal heat transfer
in the nose part and on the wing edges in comparison with equilibrium air flow For
example for trajectory points with maximal thermal load a reduction of up to 40 in heat
flux (which results in a 15 reduction of equilibrium radiation wall temperature) can be
obtained at the vehicle nose
5 Acknowledgments
The author is grateful to Kovalev RV Marinin VP and Vlasov VI for delivering
thermovision data on test model of Pre-X vehicle and also to Churakov DA and Mihalin
VA for providing computational grids
6 References
Baiocco P Guedron S Plotard P amp Moulin J (2006) The Pre-X atmospheric re-entry
experimental lifting body Program status and system synthesis Proceedings of 57th
International Astronautical Congress 2-6 October 2006 IAC-06-D2P22
Churakov DA Gorshkov AB Kovalev RV Vlasov VI Beloshitsky AV Dyadkin
AA amp Zhurin SV (2008) Heat Transfer of Reentry Vehicles during Atmosphere
Flight Proceedings of 6-th European Symposium on Aerothermodynamics for Space
Vehicles Versailles France 3 - 6 November 2008
wwwintechopencom
Aerodynamic Heating at Hypersonic Speed
251
Dmitriev VG Vaganov AV Gorshkov AB Lapygin VI Galaktionov AYu amp
Mikhalin VA (2007) Analysis of Aerothermodynamic Parameters of Reusable
Space Wing Vehicle Proceedings of 2nd European Conference for Aero-Space Sciences
Brussels Belgium July 1-6 2007
Gorshkov AB (1997) Calculation of Base Heat Transfer Behind Thin Cone-Shaped Bodies
Cosmonautics and Rocket Engineering No 11 (1997) pp 13-20 (in Russian)
Gorshkov AB Kovalev R V Vlasov V I amp Zemlyanskiy B A (2008a) Simulation of
Heat Transfer to Space Vehicles during a Gliding Reentry into Earthrsquos
Atmosphere Proceedings of 14th International Conference on Methods of Aerophysical
Research (ICMAR-2008) Novosibirsk Russia 30 June - 06 July 2008
Gorshkov AB Kovalev R V Vlasov amp V I Zemlyanskiy B A (2008b) Heat Transfer
Investigation for Hypersonic Flow over Experimental Model of Pre-X Reentry
Vehicle Proceedings of 7th Sino-Russian High-Speed Flow Conference (SRHFC-7)
Novosibirsk Russia 1 - 3 July 2008
Grantham WL (1970) Flight results of a 25000 fps re-entry experiment NASA TN D 6062
Gubanova OI Zemlyansky BA Lessin AB Lunev VV Nikulin AN amp Syusin AV
(1992) Anomalous heat transfer on the windward side of a delta wing with a blunt
tip in hypersonic flow In Aerothermodynamics of aerospace systems Pt 1 pp 188-196
Moscow TsAGI (in Russian)
Hoffmann KA Chiang ST (2000) Computational fluid dynamics Vol 2 Engineering
Educational Systems ISBN 0-9623731-3-3 Kansas USA
Inouye Y (1995) OREX flight ndash quick report and lessons learned Proceedings of 2nd
European Symposium on Aerothermodynamics for Space Vehicles pp 271-279 ESTEC
Noordwik The Netherlands Europe Space Agency (November 1994)
Kovalev RV Kislykh VV Kolozezniy AE Kudryavtsev VV Marinin VP Vlasov
VI amp Zemliansky BA (2009) Experimental studies of Pre-X vehicle heat transfer
in PGU-7 test facility 3rd European Conference for Aerospace Sciences (EUCASS-2009)
Versailles France 6-9 July 2009
Lesin AB amp Lunev VV (1994) Heat transfer peaks on a blunt-nosed triangular plate in
hypersonic flow Fluid Dynamics Vol 29 No 2 (April 1994) pp 258-262 ISSN
0015-4628
Mason EA amp Saxena SC (1958) Approximate Formula for the Thermal Conductivity of
Gas Mixtures Phys Fluids Vol 1 No 5 (1958) pp 361-369
Pulliam TH (1986) Artificial dissipation models for the Euler equations AIAA Journal
Vol24 No 12 (December 1986) pp 1931-1940 ISSN 0001-1452
Vaganov AV Dmitriev VG Zadonsky SM Kireev AY Skuratov AS amp Stepanov
EA (2006) Estimations of low-sized winged reentry vehicle heat regimes on the
stage of its designing Physico-chemical kinetics in gas dynamics
wwwchemphysedurupdf2006-11-20-002pdf (in Russian)
Vlasov VI Gorshkov AB Kovalev RV amp Plastinin YuA (1997) Theoretical studies of
air ionization and NO vibrational excitation in low density hypersonic flow around
re-entry bodies AIAA Paper No 97-2582 (1997)
Vlasov V I amp Gorshkov A B (2001) Comparison of the Calculated Results for Hypersonic
Flow Past Blunt Bodies with the OREX Flight Test Data Fluid Dynamics Vol 36
No 5 (October 2001) pp 812-819 ISSN 0015-4628
wwwintechopencom
Heat Transfer - Mathematical Modelling Numerical Methods and Information Technology
252
Vlasov VI Gorshkov AB Kovalev RV amp Lunev VV (2009) Thin triangular blunt-
nosed plate in a viscous hypersonic flow Fluid Dynamics Vol 44 No 4 (August
2009) pp 596-605 ISSN 0015-4628
Wilke C (1950) A Viscosity Equation for Gas Mixtures JChemPhys Vol 18 No 4 (1950)
pp517-519
Yoon S amp Jameson A (1987) An LU-SSOR Scheme for the Euler and Navier-Stokes
Equations AIAA Paper No 87-0600 (1987)
wwwintechopencom
Heat Transfer - Mathematical Modelling Numerical Methods andInformation TechnologyEdited by Prof Aziz Belmiloudi
ISBN 978-953-307-550-1Hard cover 642 pagesPublisher InTechPublished online 14 February 2011Published in print edition February 2011
InTech EuropeUniversity Campus STeP Ri Slavka Krautzeka 83A 51000 Rijeka Croatia Phone +385 (51) 770 447 Fax +385 (51) 686 166
InTech ChinaUnit 405 Office Block Hotel Equatorial Shanghai No65 Yan An Road (West) Shanghai 200040 China
Phone +86-21-62489820 Fax +86-21-62489821
Over the past few decades there has been a prolific increase in research and development in area of heattransfer heat exchangers and their associated technologies This book is a collection of current research inthe above mentioned areas and describes modelling numerical methods simulation and informationtechnology with modern ideas and methods to analyse and enhance heat transfer for single and multiphasesystems The topics considered include various basic concepts of heat transfer the fundamental modes ofheat transfer (namely conduction convection and radiation) thermophysical properties computationalmethodologies control stabilization and optimization problems condensation boiling and freezing with manyreal-world problems and important modern applications The book is divided in four sections InverseStabilization and Optimization Problems Numerical Methods and Calculations Heat Transfer in MiniMicroSystems Energy Transfer and Solid Materials and each section discusses various issues methods andapplications in accordance with the subjects The combination of fundamental approach with many importantpractical applications of current interest will make this book of interest to researchers scientists engineers andgraduate students in many disciplines who make use of mathematical modelling inverse problemsimplementation of recently developed numerical methods in this multidisciplinary field as well as toexperimental and theoretical researchers in the field of heat and mass transfer
How to referenceIn order to correctly reference this scholarly work feel free to copy and paste the following
Andrey B Gorshkov (2011) Aerodynamic Heating at Hypersonic Speed Heat Transfer - MathematicalModelling Numerical Methods and Information Technology Prof Aziz Belmiloudi (Ed) ISBN 978-953-307-550-1 InTech Available from httpwwwintechopencombooksheat-transfer-mathematical-modelling-numerical-methods-and-information-technologyaerodynamic-heating-at-hypersonic-speed
wwwintechopencom
wwwintechopencom
copy 2011 The Author(s) Licensee IntechOpen This chapter is distributedunder the terms of the Creative Commons Attribution-NonCommercial-ShareAlike-30 License which permits use distribution and reproduction fornon-commercial purposes provided the original is properly cited andderivative works building on this content are distributed under the samelicense
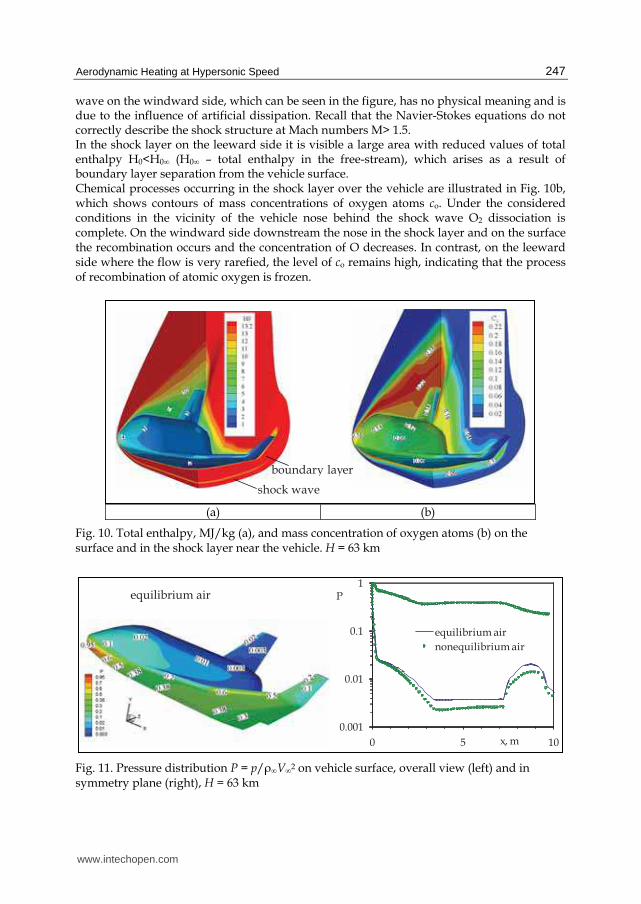
Aerodynamic Heating at Hypersonic Speed
247
wave on the windward side which can be seen in the figure has no physical meaning and is due to the influence of artificial dissipation Recall that the Navier-Stokes equations do not correctly describe the shock structure at Mach numbers Mgt 15 In the shock layer on the leeward side it is visible a large area with reduced values of total enthalpy Н0ltН0infin (Н0infin ndash total enthalpy in the free-stream) which arises as a result of boundary layer separation from the vehicle surface Chemical processes occurring in the shock layer over the vehicle are illustrated in Fig 10b which shows contours of mass concentrations of oxygen atoms つо Under the considered conditions in the vicinity of the vehicle nose behind the shock wave O2 dissociation is complete On the windward side downstream the nose in the shock layer and on the surface the recombination occurs and the concentration of O decreases In contrast on the leeward side where the flow is very rarefied the level of つо remains high indicating that the process of recombination of atomic oxygen is frozen
boundary layer
shock wave
(a) (b)
Fig 10 Total enthalpy MJkg (a) and mass concentration of oxygen atoms (b) on the surface and in the shock layer near the vehicle 〉 = 63 km
0001
001
01
1
0 5 10
P
x m
equilibrium air
nonequilibrium air
equilibrium air
Fig 11 Pressure distribution P = ちρinfinVinfin2 on vehicle surface overall view (left) and in symmetry plane (right) 〉 = 63 km
wwwintechopencom
Heat Transfer - Mathematical Modelling Numerical Methods and Information Technology
248
In Fig 11 and 12 isolines of pressure heat flux qw and equilibrium radiation temperature Tw
on the vehicle surface are shown for cases of equilibrium and non-equilibrium dissociating
air Comparison of qw and Tw distributions on the vehicle surface in the symmetry plane for
two air models are depicted in Fig 13
Analysis of the calculation results shows that pressure distribution on the windward surface
of the vehicle does not depend on physical-chemical model of the gas medium - the
difference in pressure values for equilibrium and non-equilibrium air flow is 1 - 2 On the
leeward side pressure on the surface for nonequilibrium flow may be nearly two times
lower than for equilibrium flow (eg in the vicinity of the tail) This is probably due to the
fact that the effective ratio of specific heats for nonequilibrium air is greater than for
equilibrium air because in the shock layer on the leeward side nonequilibrium flow is
chemically frozen and here there is a sufficiently high concentration of atoms (see Fig 10b)
equilibrium air nonequilibrium air
Fig 12 Distributions of heat flux qw kWm2 (top) and equilibrium radiation temperature TwdegC (bottom) on the vehicle surface 〉 = 63 km
Nonequilibrium chemical processes in the shock layer and finite catalytic activity of the
vehicle surface (А = 001) significantly reduce the calculated levels of heat transfer in
comparison with the case of equilibrium air flow The most significant decrease in heat flux
is observed on the vehicle nose part (for x le 1 m) and in the vicinity of the tail For example
at the nose stagnation point the level of heat flux decreases by about 40 ndash from 640 to 385
kWm2 while the surface temperature decreases by nearly 15 ndash from 1670 to 1430 degC
Note a high heat flux level on the thin edge of the wing compared with one at the nose
stagnation point Particularly intense heating occurs at the sharp bend of the wing where the
values of heat flux and surface temperature even slightly exceed their values at the front
stagnation point In the case of equilibrium air flow the exceeding for heat flux is about 10
(710 and 640 kWm2) for temperature - 3 (1720 and 1670 degC) In the case of
nonequilibrium air flow the exceeding is more significant for heat flux - 30 (540 and 385
kWm2) for temperature - 10 (1570 and 1430 deg C)
wwwintechopencom
Aerodynamic Heating at Hypersonic Speed
249
In other parts of the vehicle surface difference in heat flux levels for the two air models is somewhat less and it decreases downstream presumably due to gradual recombination of atoms in the boundary layer at flowing along the surface in case of non-equilibrium air
1
10
100
1000
0 5 10
Qw
x m
equilibrium air
nonequilibrium air
0
1000
2000
0 5 10
Tw
x m
equilibrium air
nonequilibrium air
Fig 13 Profiles of heat flux qw kWm2 (left) and equilibrium radiation temperature TwdegC (right) on vehicle surface in symmetry plane 〉 = 63 km
A similar flow and heat flux patterns are observed for the altitude H = 70 km as seen in Fig 14 where contours of heat flux and equilibrium radiation wall temperature are shown at this altitude for the two air models For equilibrium air overall level of heat flux at 70 km is slightly higher than at 63 km For example heat flux value at the nose stagnation point is increased by 5 (675 compared with 640 kWm2) The opposite situation occurs for the model of nonequilibrium air in this case the stagnation point heat flux value at 70 km is lower than at 63 km ndash by 7 (360 and 385 kWm2 respectively)
equilibrium air nonequilibrium air
Fig 14 Distributions of heat flux qw kWm2 (top) and equilibrium radiation temperature TwdegC (bottom) on the vehicle surface 〉 = 70 km
wwwintechopencom
Heat Transfer - Mathematical Modelling Numerical Methods and Information Technology
250
4 Conclusion
A three-dimensional stationary NavierndashStokes computer code for laminar flow developed
by the author has been briefly described The code is mainly intended to calculate super-
and hypersonic flows over bodies accounting for high temperature real gas effects with
special emphasis on convective heat transfer Three gas models perfect gas equilibrium and
nonequilibrium gas mixture can be used in the calculations
In the chapter a comparison of code calculation results with experimental data is made for
two perfect gas hypersonic flow cases at wind tunnel conditions First case is a simulation of
an anomalous heat transfer on the windward side a delta wing with blunt edges On the
whole the calculation correctly predicts the magnitude and position of local maximum of
heat flux near the wing symmetry plane taking into account a small asymmetry in the
experimental data Second case is a computation of heat transfer on a test model of the Pre-X
demonstrator Satisfactory agreement with thermovision heat fluxes on the smooth
windward side and on the flaps is obtained except for the largest deflection angle of flaps
= 15deg when the level of heat flux in the experiment is about one and a half times more than
in the calculation This discrepancy is apparently due to laminar-turbulent transition in
separation region induced by the deflected flaps which takes place in the experiment
Third flow case concerns chemically reacting air flow at equilibrium or nonequilibrium
conditions Flowfield and convective heat transfer parameters for a winged shape of a small-
scale reentry vehicle are calculated for two points of a reentry trajectory in the Earthrsquos
atmosphere Heat flux and equilibrium radiation temperature distributions on the vehicle
surface are obtained Also regions of maximal thermal loadings are localized
Calculations show that for nonequilibrium air flow the use of a low catalytic coating (with
probability of heterogeneous recombination of atoms А = 001) on the vehicle surface
enables to decrease considerably the level of heat fluxes in regions of maximal heat transfer
in the nose part and on the wing edges in comparison with equilibrium air flow For
example for trajectory points with maximal thermal load a reduction of up to 40 in heat
flux (which results in a 15 reduction of equilibrium radiation wall temperature) can be
obtained at the vehicle nose
5 Acknowledgments
The author is grateful to Kovalev RV Marinin VP and Vlasov VI for delivering
thermovision data on test model of Pre-X vehicle and also to Churakov DA and Mihalin
VA for providing computational grids
6 References
Baiocco P Guedron S Plotard P amp Moulin J (2006) The Pre-X atmospheric re-entry
experimental lifting body Program status and system synthesis Proceedings of 57th
International Astronautical Congress 2-6 October 2006 IAC-06-D2P22
Churakov DA Gorshkov AB Kovalev RV Vlasov VI Beloshitsky AV Dyadkin
AA amp Zhurin SV (2008) Heat Transfer of Reentry Vehicles during Atmosphere
Flight Proceedings of 6-th European Symposium on Aerothermodynamics for Space
Vehicles Versailles France 3 - 6 November 2008
wwwintechopencom
Aerodynamic Heating at Hypersonic Speed
251
Dmitriev VG Vaganov AV Gorshkov AB Lapygin VI Galaktionov AYu amp
Mikhalin VA (2007) Analysis of Aerothermodynamic Parameters of Reusable
Space Wing Vehicle Proceedings of 2nd European Conference for Aero-Space Sciences
Brussels Belgium July 1-6 2007
Gorshkov AB (1997) Calculation of Base Heat Transfer Behind Thin Cone-Shaped Bodies
Cosmonautics and Rocket Engineering No 11 (1997) pp 13-20 (in Russian)
Gorshkov AB Kovalev R V Vlasov V I amp Zemlyanskiy B A (2008a) Simulation of
Heat Transfer to Space Vehicles during a Gliding Reentry into Earthrsquos
Atmosphere Proceedings of 14th International Conference on Methods of Aerophysical
Research (ICMAR-2008) Novosibirsk Russia 30 June - 06 July 2008
Gorshkov AB Kovalev R V Vlasov amp V I Zemlyanskiy B A (2008b) Heat Transfer
Investigation for Hypersonic Flow over Experimental Model of Pre-X Reentry
Vehicle Proceedings of 7th Sino-Russian High-Speed Flow Conference (SRHFC-7)
Novosibirsk Russia 1 - 3 July 2008
Grantham WL (1970) Flight results of a 25000 fps re-entry experiment NASA TN D 6062
Gubanova OI Zemlyansky BA Lessin AB Lunev VV Nikulin AN amp Syusin AV
(1992) Anomalous heat transfer on the windward side of a delta wing with a blunt
tip in hypersonic flow In Aerothermodynamics of aerospace systems Pt 1 pp 188-196
Moscow TsAGI (in Russian)
Hoffmann KA Chiang ST (2000) Computational fluid dynamics Vol 2 Engineering
Educational Systems ISBN 0-9623731-3-3 Kansas USA
Inouye Y (1995) OREX flight ndash quick report and lessons learned Proceedings of 2nd
European Symposium on Aerothermodynamics for Space Vehicles pp 271-279 ESTEC
Noordwik The Netherlands Europe Space Agency (November 1994)
Kovalev RV Kislykh VV Kolozezniy AE Kudryavtsev VV Marinin VP Vlasov
VI amp Zemliansky BA (2009) Experimental studies of Pre-X vehicle heat transfer
in PGU-7 test facility 3rd European Conference for Aerospace Sciences (EUCASS-2009)
Versailles France 6-9 July 2009
Lesin AB amp Lunev VV (1994) Heat transfer peaks on a blunt-nosed triangular plate in
hypersonic flow Fluid Dynamics Vol 29 No 2 (April 1994) pp 258-262 ISSN
0015-4628
Mason EA amp Saxena SC (1958) Approximate Formula for the Thermal Conductivity of
Gas Mixtures Phys Fluids Vol 1 No 5 (1958) pp 361-369
Pulliam TH (1986) Artificial dissipation models for the Euler equations AIAA Journal
Vol24 No 12 (December 1986) pp 1931-1940 ISSN 0001-1452
Vaganov AV Dmitriev VG Zadonsky SM Kireev AY Skuratov AS amp Stepanov
EA (2006) Estimations of low-sized winged reentry vehicle heat regimes on the
stage of its designing Physico-chemical kinetics in gas dynamics
wwwchemphysedurupdf2006-11-20-002pdf (in Russian)
Vlasov VI Gorshkov AB Kovalev RV amp Plastinin YuA (1997) Theoretical studies of
air ionization and NO vibrational excitation in low density hypersonic flow around
re-entry bodies AIAA Paper No 97-2582 (1997)
Vlasov V I amp Gorshkov A B (2001) Comparison of the Calculated Results for Hypersonic
Flow Past Blunt Bodies with the OREX Flight Test Data Fluid Dynamics Vol 36
No 5 (October 2001) pp 812-819 ISSN 0015-4628
wwwintechopencom
Heat Transfer - Mathematical Modelling Numerical Methods and Information Technology
252
Vlasov VI Gorshkov AB Kovalev RV amp Lunev VV (2009) Thin triangular blunt-
nosed plate in a viscous hypersonic flow Fluid Dynamics Vol 44 No 4 (August
2009) pp 596-605 ISSN 0015-4628
Wilke C (1950) A Viscosity Equation for Gas Mixtures JChemPhys Vol 18 No 4 (1950)
pp517-519
Yoon S amp Jameson A (1987) An LU-SSOR Scheme for the Euler and Navier-Stokes
Equations AIAA Paper No 87-0600 (1987)
wwwintechopencom
Heat Transfer - Mathematical Modelling Numerical Methods andInformation TechnologyEdited by Prof Aziz Belmiloudi
ISBN 978-953-307-550-1Hard cover 642 pagesPublisher InTechPublished online 14 February 2011Published in print edition February 2011
InTech EuropeUniversity Campus STeP Ri Slavka Krautzeka 83A 51000 Rijeka Croatia Phone +385 (51) 770 447 Fax +385 (51) 686 166
InTech ChinaUnit 405 Office Block Hotel Equatorial Shanghai No65 Yan An Road (West) Shanghai 200040 China
Phone +86-21-62489820 Fax +86-21-62489821
Over the past few decades there has been a prolific increase in research and development in area of heattransfer heat exchangers and their associated technologies This book is a collection of current research inthe above mentioned areas and describes modelling numerical methods simulation and informationtechnology with modern ideas and methods to analyse and enhance heat transfer for single and multiphasesystems The topics considered include various basic concepts of heat transfer the fundamental modes ofheat transfer (namely conduction convection and radiation) thermophysical properties computationalmethodologies control stabilization and optimization problems condensation boiling and freezing with manyreal-world problems and important modern applications The book is divided in four sections InverseStabilization and Optimization Problems Numerical Methods and Calculations Heat Transfer in MiniMicroSystems Energy Transfer and Solid Materials and each section discusses various issues methods andapplications in accordance with the subjects The combination of fundamental approach with many importantpractical applications of current interest will make this book of interest to researchers scientists engineers andgraduate students in many disciplines who make use of mathematical modelling inverse problemsimplementation of recently developed numerical methods in this multidisciplinary field as well as toexperimental and theoretical researchers in the field of heat and mass transfer
How to referenceIn order to correctly reference this scholarly work feel free to copy and paste the following
Andrey B Gorshkov (2011) Aerodynamic Heating at Hypersonic Speed Heat Transfer - MathematicalModelling Numerical Methods and Information Technology Prof Aziz Belmiloudi (Ed) ISBN 978-953-307-550-1 InTech Available from httpwwwintechopencombooksheat-transfer-mathematical-modelling-numerical-methods-and-information-technologyaerodynamic-heating-at-hypersonic-speed
wwwintechopencom
wwwintechopencom
copy 2011 The Author(s) Licensee IntechOpen This chapter is distributedunder the terms of the Creative Commons Attribution-NonCommercial-ShareAlike-30 License which permits use distribution and reproduction fornon-commercial purposes provided the original is properly cited andderivative works building on this content are distributed under the samelicense
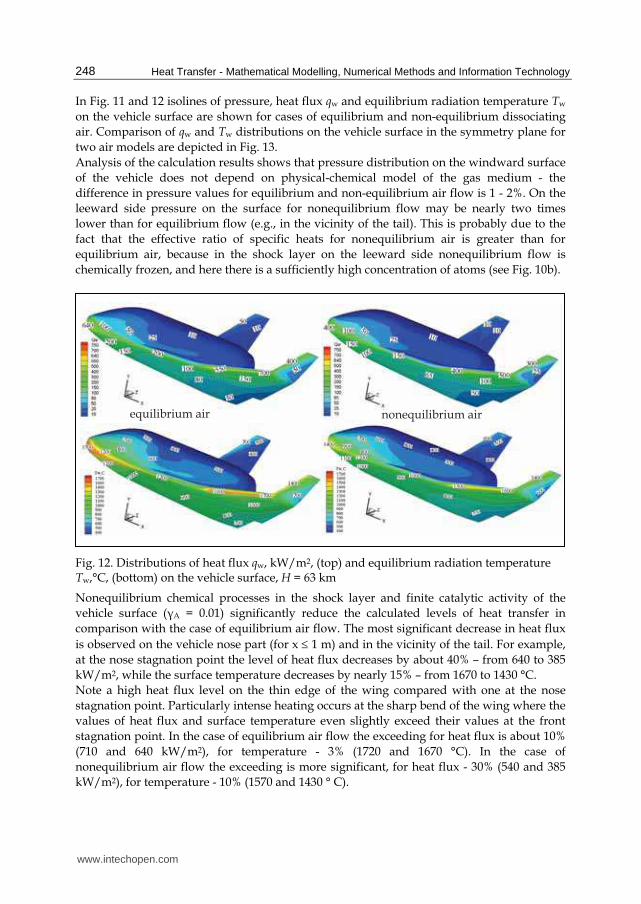
Heat Transfer - Mathematical Modelling Numerical Methods and Information Technology
248
In Fig 11 and 12 isolines of pressure heat flux qw and equilibrium radiation temperature Tw
on the vehicle surface are shown for cases of equilibrium and non-equilibrium dissociating
air Comparison of qw and Tw distributions on the vehicle surface in the symmetry plane for
two air models are depicted in Fig 13
Analysis of the calculation results shows that pressure distribution on the windward surface
of the vehicle does not depend on physical-chemical model of the gas medium - the
difference in pressure values for equilibrium and non-equilibrium air flow is 1 - 2 On the
leeward side pressure on the surface for nonequilibrium flow may be nearly two times
lower than for equilibrium flow (eg in the vicinity of the tail) This is probably due to the
fact that the effective ratio of specific heats for nonequilibrium air is greater than for
equilibrium air because in the shock layer on the leeward side nonequilibrium flow is
chemically frozen and here there is a sufficiently high concentration of atoms (see Fig 10b)
equilibrium air nonequilibrium air
Fig 12 Distributions of heat flux qw kWm2 (top) and equilibrium radiation temperature TwdegC (bottom) on the vehicle surface 〉 = 63 km
Nonequilibrium chemical processes in the shock layer and finite catalytic activity of the
vehicle surface (А = 001) significantly reduce the calculated levels of heat transfer in
comparison with the case of equilibrium air flow The most significant decrease in heat flux
is observed on the vehicle nose part (for x le 1 m) and in the vicinity of the tail For example
at the nose stagnation point the level of heat flux decreases by about 40 ndash from 640 to 385
kWm2 while the surface temperature decreases by nearly 15 ndash from 1670 to 1430 degC
Note a high heat flux level on the thin edge of the wing compared with one at the nose
stagnation point Particularly intense heating occurs at the sharp bend of the wing where the
values of heat flux and surface temperature even slightly exceed their values at the front
stagnation point In the case of equilibrium air flow the exceeding for heat flux is about 10
(710 and 640 kWm2) for temperature - 3 (1720 and 1670 degC) In the case of
nonequilibrium air flow the exceeding is more significant for heat flux - 30 (540 and 385
kWm2) for temperature - 10 (1570 and 1430 deg C)
wwwintechopencom
Aerodynamic Heating at Hypersonic Speed
249
In other parts of the vehicle surface difference in heat flux levels for the two air models is somewhat less and it decreases downstream presumably due to gradual recombination of atoms in the boundary layer at flowing along the surface in case of non-equilibrium air
1
10
100
1000
0 5 10
Qw
x m
equilibrium air
nonequilibrium air
0
1000
2000
0 5 10
Tw
x m
equilibrium air
nonequilibrium air
Fig 13 Profiles of heat flux qw kWm2 (left) and equilibrium radiation temperature TwdegC (right) on vehicle surface in symmetry plane 〉 = 63 km
A similar flow and heat flux patterns are observed for the altitude H = 70 km as seen in Fig 14 where contours of heat flux and equilibrium radiation wall temperature are shown at this altitude for the two air models For equilibrium air overall level of heat flux at 70 km is slightly higher than at 63 km For example heat flux value at the nose stagnation point is increased by 5 (675 compared with 640 kWm2) The opposite situation occurs for the model of nonequilibrium air in this case the stagnation point heat flux value at 70 km is lower than at 63 km ndash by 7 (360 and 385 kWm2 respectively)
equilibrium air nonequilibrium air
Fig 14 Distributions of heat flux qw kWm2 (top) and equilibrium radiation temperature TwdegC (bottom) on the vehicle surface 〉 = 70 km
wwwintechopencom
Heat Transfer - Mathematical Modelling Numerical Methods and Information Technology
250
4 Conclusion
A three-dimensional stationary NavierndashStokes computer code for laminar flow developed
by the author has been briefly described The code is mainly intended to calculate super-
and hypersonic flows over bodies accounting for high temperature real gas effects with
special emphasis on convective heat transfer Three gas models perfect gas equilibrium and
nonequilibrium gas mixture can be used in the calculations
In the chapter a comparison of code calculation results with experimental data is made for
two perfect gas hypersonic flow cases at wind tunnel conditions First case is a simulation of
an anomalous heat transfer on the windward side a delta wing with blunt edges On the
whole the calculation correctly predicts the magnitude and position of local maximum of
heat flux near the wing symmetry plane taking into account a small asymmetry in the
experimental data Second case is a computation of heat transfer on a test model of the Pre-X
demonstrator Satisfactory agreement with thermovision heat fluxes on the smooth
windward side and on the flaps is obtained except for the largest deflection angle of flaps
= 15deg when the level of heat flux in the experiment is about one and a half times more than
in the calculation This discrepancy is apparently due to laminar-turbulent transition in
separation region induced by the deflected flaps which takes place in the experiment
Third flow case concerns chemically reacting air flow at equilibrium or nonequilibrium
conditions Flowfield and convective heat transfer parameters for a winged shape of a small-
scale reentry vehicle are calculated for two points of a reentry trajectory in the Earthrsquos
atmosphere Heat flux and equilibrium radiation temperature distributions on the vehicle
surface are obtained Also regions of maximal thermal loadings are localized
Calculations show that for nonequilibrium air flow the use of a low catalytic coating (with
probability of heterogeneous recombination of atoms А = 001) on the vehicle surface
enables to decrease considerably the level of heat fluxes in regions of maximal heat transfer
in the nose part and on the wing edges in comparison with equilibrium air flow For
example for trajectory points with maximal thermal load a reduction of up to 40 in heat
flux (which results in a 15 reduction of equilibrium radiation wall temperature) can be
obtained at the vehicle nose
5 Acknowledgments
The author is grateful to Kovalev RV Marinin VP and Vlasov VI for delivering
thermovision data on test model of Pre-X vehicle and also to Churakov DA and Mihalin
VA for providing computational grids
6 References
Baiocco P Guedron S Plotard P amp Moulin J (2006) The Pre-X atmospheric re-entry
experimental lifting body Program status and system synthesis Proceedings of 57th
International Astronautical Congress 2-6 October 2006 IAC-06-D2P22
Churakov DA Gorshkov AB Kovalev RV Vlasov VI Beloshitsky AV Dyadkin
AA amp Zhurin SV (2008) Heat Transfer of Reentry Vehicles during Atmosphere
Flight Proceedings of 6-th European Symposium on Aerothermodynamics for Space
Vehicles Versailles France 3 - 6 November 2008
wwwintechopencom
Aerodynamic Heating at Hypersonic Speed
251
Dmitriev VG Vaganov AV Gorshkov AB Lapygin VI Galaktionov AYu amp
Mikhalin VA (2007) Analysis of Aerothermodynamic Parameters of Reusable
Space Wing Vehicle Proceedings of 2nd European Conference for Aero-Space Sciences
Brussels Belgium July 1-6 2007
Gorshkov AB (1997) Calculation of Base Heat Transfer Behind Thin Cone-Shaped Bodies
Cosmonautics and Rocket Engineering No 11 (1997) pp 13-20 (in Russian)
Gorshkov AB Kovalev R V Vlasov V I amp Zemlyanskiy B A (2008a) Simulation of
Heat Transfer to Space Vehicles during a Gliding Reentry into Earthrsquos
Atmosphere Proceedings of 14th International Conference on Methods of Aerophysical
Research (ICMAR-2008) Novosibirsk Russia 30 June - 06 July 2008
Gorshkov AB Kovalev R V Vlasov amp V I Zemlyanskiy B A (2008b) Heat Transfer
Investigation for Hypersonic Flow over Experimental Model of Pre-X Reentry
Vehicle Proceedings of 7th Sino-Russian High-Speed Flow Conference (SRHFC-7)
Novosibirsk Russia 1 - 3 July 2008
Grantham WL (1970) Flight results of a 25000 fps re-entry experiment NASA TN D 6062
Gubanova OI Zemlyansky BA Lessin AB Lunev VV Nikulin AN amp Syusin AV
(1992) Anomalous heat transfer on the windward side of a delta wing with a blunt
tip in hypersonic flow In Aerothermodynamics of aerospace systems Pt 1 pp 188-196
Moscow TsAGI (in Russian)
Hoffmann KA Chiang ST (2000) Computational fluid dynamics Vol 2 Engineering
Educational Systems ISBN 0-9623731-3-3 Kansas USA
Inouye Y (1995) OREX flight ndash quick report and lessons learned Proceedings of 2nd
European Symposium on Aerothermodynamics for Space Vehicles pp 271-279 ESTEC
Noordwik The Netherlands Europe Space Agency (November 1994)
Kovalev RV Kislykh VV Kolozezniy AE Kudryavtsev VV Marinin VP Vlasov
VI amp Zemliansky BA (2009) Experimental studies of Pre-X vehicle heat transfer
in PGU-7 test facility 3rd European Conference for Aerospace Sciences (EUCASS-2009)
Versailles France 6-9 July 2009
Lesin AB amp Lunev VV (1994) Heat transfer peaks on a blunt-nosed triangular plate in
hypersonic flow Fluid Dynamics Vol 29 No 2 (April 1994) pp 258-262 ISSN
0015-4628
Mason EA amp Saxena SC (1958) Approximate Formula for the Thermal Conductivity of
Gas Mixtures Phys Fluids Vol 1 No 5 (1958) pp 361-369
Pulliam TH (1986) Artificial dissipation models for the Euler equations AIAA Journal
Vol24 No 12 (December 1986) pp 1931-1940 ISSN 0001-1452
Vaganov AV Dmitriev VG Zadonsky SM Kireev AY Skuratov AS amp Stepanov
EA (2006) Estimations of low-sized winged reentry vehicle heat regimes on the
stage of its designing Physico-chemical kinetics in gas dynamics
wwwchemphysedurupdf2006-11-20-002pdf (in Russian)
Vlasov VI Gorshkov AB Kovalev RV amp Plastinin YuA (1997) Theoretical studies of
air ionization and NO vibrational excitation in low density hypersonic flow around
re-entry bodies AIAA Paper No 97-2582 (1997)
Vlasov V I amp Gorshkov A B (2001) Comparison of the Calculated Results for Hypersonic
Flow Past Blunt Bodies with the OREX Flight Test Data Fluid Dynamics Vol 36
No 5 (October 2001) pp 812-819 ISSN 0015-4628
wwwintechopencom
Heat Transfer - Mathematical Modelling Numerical Methods and Information Technology
252
Vlasov VI Gorshkov AB Kovalev RV amp Lunev VV (2009) Thin triangular blunt-
nosed plate in a viscous hypersonic flow Fluid Dynamics Vol 44 No 4 (August
2009) pp 596-605 ISSN 0015-4628
Wilke C (1950) A Viscosity Equation for Gas Mixtures JChemPhys Vol 18 No 4 (1950)
pp517-519
Yoon S amp Jameson A (1987) An LU-SSOR Scheme for the Euler and Navier-Stokes
Equations AIAA Paper No 87-0600 (1987)
wwwintechopencom
Heat Transfer - Mathematical Modelling Numerical Methods andInformation TechnologyEdited by Prof Aziz Belmiloudi
ISBN 978-953-307-550-1Hard cover 642 pagesPublisher InTechPublished online 14 February 2011Published in print edition February 2011
InTech EuropeUniversity Campus STeP Ri Slavka Krautzeka 83A 51000 Rijeka Croatia Phone +385 (51) 770 447 Fax +385 (51) 686 166
InTech ChinaUnit 405 Office Block Hotel Equatorial Shanghai No65 Yan An Road (West) Shanghai 200040 China
Phone +86-21-62489820 Fax +86-21-62489821
Over the past few decades there has been a prolific increase in research and development in area of heattransfer heat exchangers and their associated technologies This book is a collection of current research inthe above mentioned areas and describes modelling numerical methods simulation and informationtechnology with modern ideas and methods to analyse and enhance heat transfer for single and multiphasesystems The topics considered include various basic concepts of heat transfer the fundamental modes ofheat transfer (namely conduction convection and radiation) thermophysical properties computationalmethodologies control stabilization and optimization problems condensation boiling and freezing with manyreal-world problems and important modern applications The book is divided in four sections InverseStabilization and Optimization Problems Numerical Methods and Calculations Heat Transfer in MiniMicroSystems Energy Transfer and Solid Materials and each section discusses various issues methods andapplications in accordance with the subjects The combination of fundamental approach with many importantpractical applications of current interest will make this book of interest to researchers scientists engineers andgraduate students in many disciplines who make use of mathematical modelling inverse problemsimplementation of recently developed numerical methods in this multidisciplinary field as well as toexperimental and theoretical researchers in the field of heat and mass transfer
How to referenceIn order to correctly reference this scholarly work feel free to copy and paste the following
Andrey B Gorshkov (2011) Aerodynamic Heating at Hypersonic Speed Heat Transfer - MathematicalModelling Numerical Methods and Information Technology Prof Aziz Belmiloudi (Ed) ISBN 978-953-307-550-1 InTech Available from httpwwwintechopencombooksheat-transfer-mathematical-modelling-numerical-methods-and-information-technologyaerodynamic-heating-at-hypersonic-speed
wwwintechopencom
wwwintechopencom
copy 2011 The Author(s) Licensee IntechOpen This chapter is distributedunder the terms of the Creative Commons Attribution-NonCommercial-ShareAlike-30 License which permits use distribution and reproduction fornon-commercial purposes provided the original is properly cited andderivative works building on this content are distributed under the samelicense
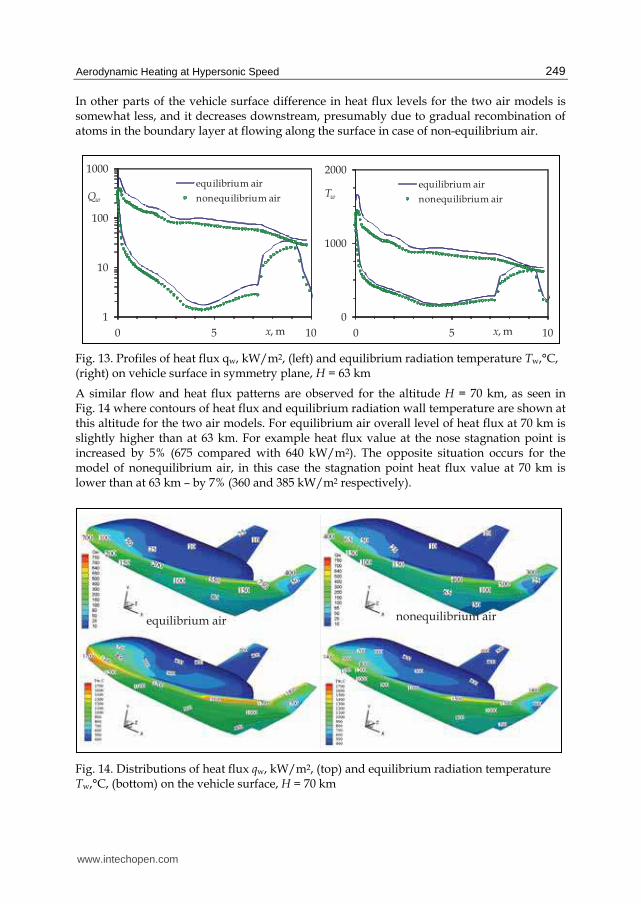
Aerodynamic Heating at Hypersonic Speed
249
In other parts of the vehicle surface difference in heat flux levels for the two air models is somewhat less and it decreases downstream presumably due to gradual recombination of atoms in the boundary layer at flowing along the surface in case of non-equilibrium air
1
10
100
1000
0 5 10
Qw
x m
equilibrium air
nonequilibrium air
0
1000
2000
0 5 10
Tw
x m
equilibrium air
nonequilibrium air
Fig 13 Profiles of heat flux qw kWm2 (left) and equilibrium radiation temperature TwdegC (right) on vehicle surface in symmetry plane 〉 = 63 km
A similar flow and heat flux patterns are observed for the altitude H = 70 km as seen in Fig 14 where contours of heat flux and equilibrium radiation wall temperature are shown at this altitude for the two air models For equilibrium air overall level of heat flux at 70 km is slightly higher than at 63 km For example heat flux value at the nose stagnation point is increased by 5 (675 compared with 640 kWm2) The opposite situation occurs for the model of nonequilibrium air in this case the stagnation point heat flux value at 70 km is lower than at 63 km ndash by 7 (360 and 385 kWm2 respectively)
equilibrium air nonequilibrium air
Fig 14 Distributions of heat flux qw kWm2 (top) and equilibrium radiation temperature TwdegC (bottom) on the vehicle surface 〉 = 70 km
wwwintechopencom
Heat Transfer - Mathematical Modelling Numerical Methods and Information Technology
250
4 Conclusion
A three-dimensional stationary NavierndashStokes computer code for laminar flow developed
by the author has been briefly described The code is mainly intended to calculate super-
and hypersonic flows over bodies accounting for high temperature real gas effects with
special emphasis on convective heat transfer Three gas models perfect gas equilibrium and
nonequilibrium gas mixture can be used in the calculations
In the chapter a comparison of code calculation results with experimental data is made for
two perfect gas hypersonic flow cases at wind tunnel conditions First case is a simulation of
an anomalous heat transfer on the windward side a delta wing with blunt edges On the
whole the calculation correctly predicts the magnitude and position of local maximum of
heat flux near the wing symmetry plane taking into account a small asymmetry in the
experimental data Second case is a computation of heat transfer on a test model of the Pre-X
demonstrator Satisfactory agreement with thermovision heat fluxes on the smooth
windward side and on the flaps is obtained except for the largest deflection angle of flaps
= 15deg when the level of heat flux in the experiment is about one and a half times more than
in the calculation This discrepancy is apparently due to laminar-turbulent transition in
separation region induced by the deflected flaps which takes place in the experiment
Third flow case concerns chemically reacting air flow at equilibrium or nonequilibrium
conditions Flowfield and convective heat transfer parameters for a winged shape of a small-
scale reentry vehicle are calculated for two points of a reentry trajectory in the Earthrsquos
atmosphere Heat flux and equilibrium radiation temperature distributions on the vehicle
surface are obtained Also regions of maximal thermal loadings are localized
Calculations show that for nonequilibrium air flow the use of a low catalytic coating (with
probability of heterogeneous recombination of atoms А = 001) on the vehicle surface
enables to decrease considerably the level of heat fluxes in regions of maximal heat transfer
in the nose part and on the wing edges in comparison with equilibrium air flow For
example for trajectory points with maximal thermal load a reduction of up to 40 in heat
flux (which results in a 15 reduction of equilibrium radiation wall temperature) can be
obtained at the vehicle nose
5 Acknowledgments
The author is grateful to Kovalev RV Marinin VP and Vlasov VI for delivering
thermovision data on test model of Pre-X vehicle and also to Churakov DA and Mihalin
VA for providing computational grids
6 References
Baiocco P Guedron S Plotard P amp Moulin J (2006) The Pre-X atmospheric re-entry
experimental lifting body Program status and system synthesis Proceedings of 57th
International Astronautical Congress 2-6 October 2006 IAC-06-D2P22
Churakov DA Gorshkov AB Kovalev RV Vlasov VI Beloshitsky AV Dyadkin
AA amp Zhurin SV (2008) Heat Transfer of Reentry Vehicles during Atmosphere
Flight Proceedings of 6-th European Symposium on Aerothermodynamics for Space
Vehicles Versailles France 3 - 6 November 2008
wwwintechopencom
Aerodynamic Heating at Hypersonic Speed
251
Dmitriev VG Vaganov AV Gorshkov AB Lapygin VI Galaktionov AYu amp
Mikhalin VA (2007) Analysis of Aerothermodynamic Parameters of Reusable
Space Wing Vehicle Proceedings of 2nd European Conference for Aero-Space Sciences
Brussels Belgium July 1-6 2007
Gorshkov AB (1997) Calculation of Base Heat Transfer Behind Thin Cone-Shaped Bodies
Cosmonautics and Rocket Engineering No 11 (1997) pp 13-20 (in Russian)
Gorshkov AB Kovalev R V Vlasov V I amp Zemlyanskiy B A (2008a) Simulation of
Heat Transfer to Space Vehicles during a Gliding Reentry into Earthrsquos
Atmosphere Proceedings of 14th International Conference on Methods of Aerophysical
Research (ICMAR-2008) Novosibirsk Russia 30 June - 06 July 2008
Gorshkov AB Kovalev R V Vlasov amp V I Zemlyanskiy B A (2008b) Heat Transfer
Investigation for Hypersonic Flow over Experimental Model of Pre-X Reentry
Vehicle Proceedings of 7th Sino-Russian High-Speed Flow Conference (SRHFC-7)
Novosibirsk Russia 1 - 3 July 2008
Grantham WL (1970) Flight results of a 25000 fps re-entry experiment NASA TN D 6062
Gubanova OI Zemlyansky BA Lessin AB Lunev VV Nikulin AN amp Syusin AV
(1992) Anomalous heat transfer on the windward side of a delta wing with a blunt
tip in hypersonic flow In Aerothermodynamics of aerospace systems Pt 1 pp 188-196
Moscow TsAGI (in Russian)
Hoffmann KA Chiang ST (2000) Computational fluid dynamics Vol 2 Engineering
Educational Systems ISBN 0-9623731-3-3 Kansas USA
Inouye Y (1995) OREX flight ndash quick report and lessons learned Proceedings of 2nd
European Symposium on Aerothermodynamics for Space Vehicles pp 271-279 ESTEC
Noordwik The Netherlands Europe Space Agency (November 1994)
Kovalev RV Kislykh VV Kolozezniy AE Kudryavtsev VV Marinin VP Vlasov
VI amp Zemliansky BA (2009) Experimental studies of Pre-X vehicle heat transfer
in PGU-7 test facility 3rd European Conference for Aerospace Sciences (EUCASS-2009)
Versailles France 6-9 July 2009
Lesin AB amp Lunev VV (1994) Heat transfer peaks on a blunt-nosed triangular plate in
hypersonic flow Fluid Dynamics Vol 29 No 2 (April 1994) pp 258-262 ISSN
0015-4628
Mason EA amp Saxena SC (1958) Approximate Formula for the Thermal Conductivity of
Gas Mixtures Phys Fluids Vol 1 No 5 (1958) pp 361-369
Pulliam TH (1986) Artificial dissipation models for the Euler equations AIAA Journal
Vol24 No 12 (December 1986) pp 1931-1940 ISSN 0001-1452
Vaganov AV Dmitriev VG Zadonsky SM Kireev AY Skuratov AS amp Stepanov
EA (2006) Estimations of low-sized winged reentry vehicle heat regimes on the
stage of its designing Physico-chemical kinetics in gas dynamics
wwwchemphysedurupdf2006-11-20-002pdf (in Russian)
Vlasov VI Gorshkov AB Kovalev RV amp Plastinin YuA (1997) Theoretical studies of
air ionization and NO vibrational excitation in low density hypersonic flow around
re-entry bodies AIAA Paper No 97-2582 (1997)
Vlasov V I amp Gorshkov A B (2001) Comparison of the Calculated Results for Hypersonic
Flow Past Blunt Bodies with the OREX Flight Test Data Fluid Dynamics Vol 36
No 5 (October 2001) pp 812-819 ISSN 0015-4628
wwwintechopencom
Heat Transfer - Mathematical Modelling Numerical Methods and Information Technology
252
Vlasov VI Gorshkov AB Kovalev RV amp Lunev VV (2009) Thin triangular blunt-
nosed plate in a viscous hypersonic flow Fluid Dynamics Vol 44 No 4 (August
2009) pp 596-605 ISSN 0015-4628
Wilke C (1950) A Viscosity Equation for Gas Mixtures JChemPhys Vol 18 No 4 (1950)
pp517-519
Yoon S amp Jameson A (1987) An LU-SSOR Scheme for the Euler and Navier-Stokes
Equations AIAA Paper No 87-0600 (1987)
wwwintechopencom
Heat Transfer - Mathematical Modelling Numerical Methods andInformation TechnologyEdited by Prof Aziz Belmiloudi
ISBN 978-953-307-550-1Hard cover 642 pagesPublisher InTechPublished online 14 February 2011Published in print edition February 2011
InTech EuropeUniversity Campus STeP Ri Slavka Krautzeka 83A 51000 Rijeka Croatia Phone +385 (51) 770 447 Fax +385 (51) 686 166
InTech ChinaUnit 405 Office Block Hotel Equatorial Shanghai No65 Yan An Road (West) Shanghai 200040 China
Phone +86-21-62489820 Fax +86-21-62489821
Over the past few decades there has been a prolific increase in research and development in area of heattransfer heat exchangers and their associated technologies This book is a collection of current research inthe above mentioned areas and describes modelling numerical methods simulation and informationtechnology with modern ideas and methods to analyse and enhance heat transfer for single and multiphasesystems The topics considered include various basic concepts of heat transfer the fundamental modes ofheat transfer (namely conduction convection and radiation) thermophysical properties computationalmethodologies control stabilization and optimization problems condensation boiling and freezing with manyreal-world problems and important modern applications The book is divided in four sections InverseStabilization and Optimization Problems Numerical Methods and Calculations Heat Transfer in MiniMicroSystems Energy Transfer and Solid Materials and each section discusses various issues methods andapplications in accordance with the subjects The combination of fundamental approach with many importantpractical applications of current interest will make this book of interest to researchers scientists engineers andgraduate students in many disciplines who make use of mathematical modelling inverse problemsimplementation of recently developed numerical methods in this multidisciplinary field as well as toexperimental and theoretical researchers in the field of heat and mass transfer
How to referenceIn order to correctly reference this scholarly work feel free to copy and paste the following
Andrey B Gorshkov (2011) Aerodynamic Heating at Hypersonic Speed Heat Transfer - MathematicalModelling Numerical Methods and Information Technology Prof Aziz Belmiloudi (Ed) ISBN 978-953-307-550-1 InTech Available from httpwwwintechopencombooksheat-transfer-mathematical-modelling-numerical-methods-and-information-technologyaerodynamic-heating-at-hypersonic-speed
wwwintechopencom
wwwintechopencom
copy 2011 The Author(s) Licensee IntechOpen This chapter is distributedunder the terms of the Creative Commons Attribution-NonCommercial-ShareAlike-30 License which permits use distribution and reproduction fornon-commercial purposes provided the original is properly cited andderivative works building on this content are distributed under the samelicense
Heat Transfer - Mathematical Modelling Numerical Methods and Information Technology
250
4 Conclusion
A three-dimensional stationary NavierndashStokes computer code for laminar flow developed
by the author has been briefly described The code is mainly intended to calculate super-
and hypersonic flows over bodies accounting for high temperature real gas effects with
special emphasis on convective heat transfer Three gas models perfect gas equilibrium and
nonequilibrium gas mixture can be used in the calculations
In the chapter a comparison of code calculation results with experimental data is made for
two perfect gas hypersonic flow cases at wind tunnel conditions First case is a simulation of
an anomalous heat transfer on the windward side a delta wing with blunt edges On the
whole the calculation correctly predicts the magnitude and position of local maximum of
heat flux near the wing symmetry plane taking into account a small asymmetry in the
experimental data Second case is a computation of heat transfer on a test model of the Pre-X
demonstrator Satisfactory agreement with thermovision heat fluxes on the smooth
windward side and on the flaps is obtained except for the largest deflection angle of flaps
= 15deg when the level of heat flux in the experiment is about one and a half times more than
in the calculation This discrepancy is apparently due to laminar-turbulent transition in
separation region induced by the deflected flaps which takes place in the experiment
Third flow case concerns chemically reacting air flow at equilibrium or nonequilibrium
conditions Flowfield and convective heat transfer parameters for a winged shape of a small-
scale reentry vehicle are calculated for two points of a reentry trajectory in the Earthrsquos
atmosphere Heat flux and equilibrium radiation temperature distributions on the vehicle
surface are obtained Also regions of maximal thermal loadings are localized
Calculations show that for nonequilibrium air flow the use of a low catalytic coating (with
probability of heterogeneous recombination of atoms А = 001) on the vehicle surface
enables to decrease considerably the level of heat fluxes in regions of maximal heat transfer
in the nose part and on the wing edges in comparison with equilibrium air flow For
example for trajectory points with maximal thermal load a reduction of up to 40 in heat
flux (which results in a 15 reduction of equilibrium radiation wall temperature) can be
obtained at the vehicle nose
5 Acknowledgments
The author is grateful to Kovalev RV Marinin VP and Vlasov VI for delivering
thermovision data on test model of Pre-X vehicle and also to Churakov DA and Mihalin
VA for providing computational grids
6 References
Baiocco P Guedron S Plotard P amp Moulin J (2006) The Pre-X atmospheric re-entry
experimental lifting body Program status and system synthesis Proceedings of 57th
International Astronautical Congress 2-6 October 2006 IAC-06-D2P22
Churakov DA Gorshkov AB Kovalev RV Vlasov VI Beloshitsky AV Dyadkin
AA amp Zhurin SV (2008) Heat Transfer of Reentry Vehicles during Atmosphere
Flight Proceedings of 6-th European Symposium on Aerothermodynamics for Space
Vehicles Versailles France 3 - 6 November 2008
wwwintechopencom
Aerodynamic Heating at Hypersonic Speed
251
Dmitriev VG Vaganov AV Gorshkov AB Lapygin VI Galaktionov AYu amp
Mikhalin VA (2007) Analysis of Aerothermodynamic Parameters of Reusable
Space Wing Vehicle Proceedings of 2nd European Conference for Aero-Space Sciences
Brussels Belgium July 1-6 2007
Gorshkov AB (1997) Calculation of Base Heat Transfer Behind Thin Cone-Shaped Bodies
Cosmonautics and Rocket Engineering No 11 (1997) pp 13-20 (in Russian)
Gorshkov AB Kovalev R V Vlasov V I amp Zemlyanskiy B A (2008a) Simulation of
Heat Transfer to Space Vehicles during a Gliding Reentry into Earthrsquos
Atmosphere Proceedings of 14th International Conference on Methods of Aerophysical
Research (ICMAR-2008) Novosibirsk Russia 30 June - 06 July 2008
Gorshkov AB Kovalev R V Vlasov amp V I Zemlyanskiy B A (2008b) Heat Transfer
Investigation for Hypersonic Flow over Experimental Model of Pre-X Reentry
Vehicle Proceedings of 7th Sino-Russian High-Speed Flow Conference (SRHFC-7)
Novosibirsk Russia 1 - 3 July 2008
Grantham WL (1970) Flight results of a 25000 fps re-entry experiment NASA TN D 6062
Gubanova OI Zemlyansky BA Lessin AB Lunev VV Nikulin AN amp Syusin AV
(1992) Anomalous heat transfer on the windward side of a delta wing with a blunt
tip in hypersonic flow In Aerothermodynamics of aerospace systems Pt 1 pp 188-196
Moscow TsAGI (in Russian)
Hoffmann KA Chiang ST (2000) Computational fluid dynamics Vol 2 Engineering
Educational Systems ISBN 0-9623731-3-3 Kansas USA
Inouye Y (1995) OREX flight ndash quick report and lessons learned Proceedings of 2nd
European Symposium on Aerothermodynamics for Space Vehicles pp 271-279 ESTEC
Noordwik The Netherlands Europe Space Agency (November 1994)
Kovalev RV Kislykh VV Kolozezniy AE Kudryavtsev VV Marinin VP Vlasov
VI amp Zemliansky BA (2009) Experimental studies of Pre-X vehicle heat transfer
in PGU-7 test facility 3rd European Conference for Aerospace Sciences (EUCASS-2009)
Versailles France 6-9 July 2009
Lesin AB amp Lunev VV (1994) Heat transfer peaks on a blunt-nosed triangular plate in
hypersonic flow Fluid Dynamics Vol 29 No 2 (April 1994) pp 258-262 ISSN
0015-4628
Mason EA amp Saxena SC (1958) Approximate Formula for the Thermal Conductivity of
Gas Mixtures Phys Fluids Vol 1 No 5 (1958) pp 361-369
Pulliam TH (1986) Artificial dissipation models for the Euler equations AIAA Journal
Vol24 No 12 (December 1986) pp 1931-1940 ISSN 0001-1452
Vaganov AV Dmitriev VG Zadonsky SM Kireev AY Skuratov AS amp Stepanov
EA (2006) Estimations of low-sized winged reentry vehicle heat regimes on the
stage of its designing Physico-chemical kinetics in gas dynamics
wwwchemphysedurupdf2006-11-20-002pdf (in Russian)
Vlasov VI Gorshkov AB Kovalev RV amp Plastinin YuA (1997) Theoretical studies of
air ionization and NO vibrational excitation in low density hypersonic flow around
re-entry bodies AIAA Paper No 97-2582 (1997)
Vlasov V I amp Gorshkov A B (2001) Comparison of the Calculated Results for Hypersonic
Flow Past Blunt Bodies with the OREX Flight Test Data Fluid Dynamics Vol 36
No 5 (October 2001) pp 812-819 ISSN 0015-4628
wwwintechopencom
Heat Transfer - Mathematical Modelling Numerical Methods and Information Technology
252
Vlasov VI Gorshkov AB Kovalev RV amp Lunev VV (2009) Thin triangular blunt-
nosed plate in a viscous hypersonic flow Fluid Dynamics Vol 44 No 4 (August
2009) pp 596-605 ISSN 0015-4628
Wilke C (1950) A Viscosity Equation for Gas Mixtures JChemPhys Vol 18 No 4 (1950)
pp517-519
Yoon S amp Jameson A (1987) An LU-SSOR Scheme for the Euler and Navier-Stokes
Equations AIAA Paper No 87-0600 (1987)
wwwintechopencom
Heat Transfer - Mathematical Modelling Numerical Methods andInformation TechnologyEdited by Prof Aziz Belmiloudi
ISBN 978-953-307-550-1Hard cover 642 pagesPublisher InTechPublished online 14 February 2011Published in print edition February 2011
InTech EuropeUniversity Campus STeP Ri Slavka Krautzeka 83A 51000 Rijeka Croatia Phone +385 (51) 770 447 Fax +385 (51) 686 166
InTech ChinaUnit 405 Office Block Hotel Equatorial Shanghai No65 Yan An Road (West) Shanghai 200040 China
Phone +86-21-62489820 Fax +86-21-62489821
Over the past few decades there has been a prolific increase in research and development in area of heattransfer heat exchangers and their associated technologies This book is a collection of current research inthe above mentioned areas and describes modelling numerical methods simulation and informationtechnology with modern ideas and methods to analyse and enhance heat transfer for single and multiphasesystems The topics considered include various basic concepts of heat transfer the fundamental modes ofheat transfer (namely conduction convection and radiation) thermophysical properties computationalmethodologies control stabilization and optimization problems condensation boiling and freezing with manyreal-world problems and important modern applications The book is divided in four sections InverseStabilization and Optimization Problems Numerical Methods and Calculations Heat Transfer in MiniMicroSystems Energy Transfer and Solid Materials and each section discusses various issues methods andapplications in accordance with the subjects The combination of fundamental approach with many importantpractical applications of current interest will make this book of interest to researchers scientists engineers andgraduate students in many disciplines who make use of mathematical modelling inverse problemsimplementation of recently developed numerical methods in this multidisciplinary field as well as toexperimental and theoretical researchers in the field of heat and mass transfer
How to referenceIn order to correctly reference this scholarly work feel free to copy and paste the following
Andrey B Gorshkov (2011) Aerodynamic Heating at Hypersonic Speed Heat Transfer - MathematicalModelling Numerical Methods and Information Technology Prof Aziz Belmiloudi (Ed) ISBN 978-953-307-550-1 InTech Available from httpwwwintechopencombooksheat-transfer-mathematical-modelling-numerical-methods-and-information-technologyaerodynamic-heating-at-hypersonic-speed
wwwintechopencom
wwwintechopencom
copy 2011 The Author(s) Licensee IntechOpen This chapter is distributedunder the terms of the Creative Commons Attribution-NonCommercial-ShareAlike-30 License which permits use distribution and reproduction fornon-commercial purposes provided the original is properly cited andderivative works building on this content are distributed under the samelicense

copy 2011 The Author(s) Licensee IntechOpen This chapter is distributedunder the terms of the Creative Commons Attribution-NonCommercial-ShareAlike-30 License which permits use distribution and reproduction fornon-commercial purposes provided the original is properly cited andderivative works building on this content are distributed under the samelicense