aeolian vibration aeolian vibration of damped …...1 1 aeolian vibration chuck rawlins • single...
TRANSCRIPT
1
1
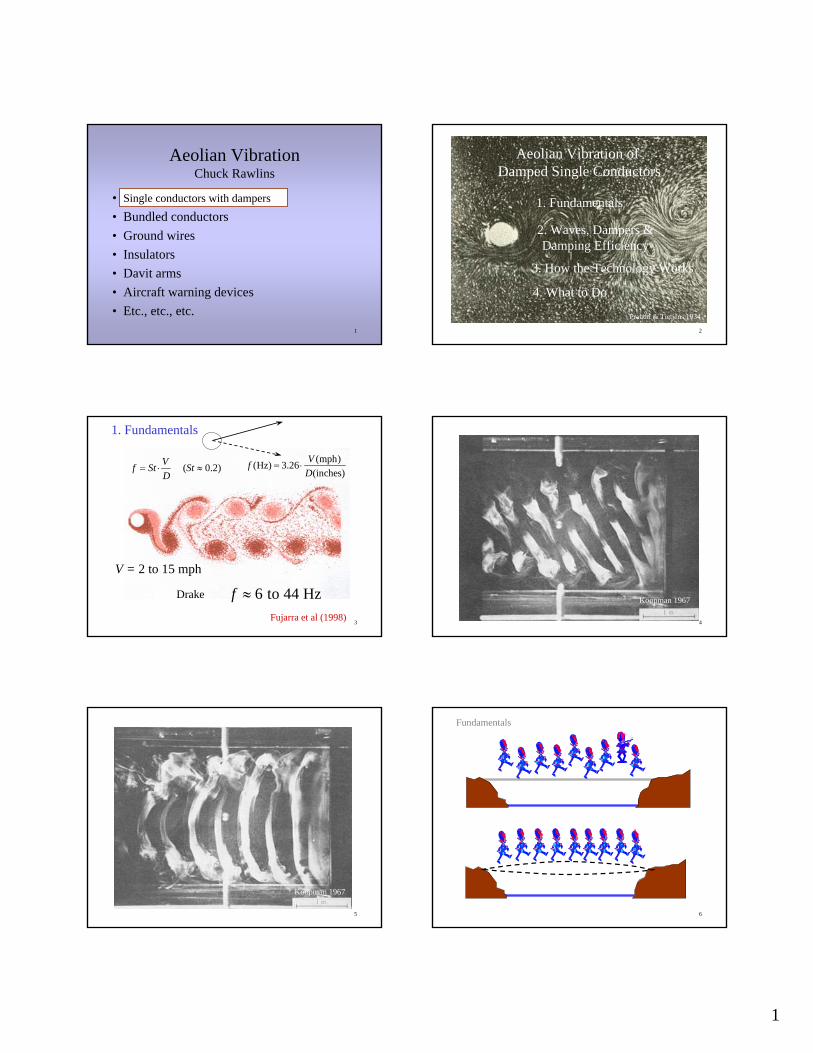
Aeolian VibrationChuck Rawlins
• Single conductors• Bundled conductors• Ground wires• Insulators• Davit arms• Aircraft warning devices• Etc., etc., etc.
Single conductors with dampers
2
Prandtl & Tietjens 1934
Aeolian Vibration of Damped Single Conductors
1. Fundamentals
2. Waves, Dampers &Damping Efficiency
3. How the Technology Works
4. What to Do
3
( 0.2)Vf St StD
= ⋅ ≈(mph)(Hz) 3.26
(inches)Vf
D= ⋅
V = 2 to 15 mph
6 to 44 Hzf ≈Drake
Fujarra et al (1998)
1. Fundamentals
4
Koopman 1967
5
Koopman 1967
6
Fundamentals
2
7
P D
P
P
W
C
P W
P DP C- - = 00w c DP P P− − =
Fundamentals
8
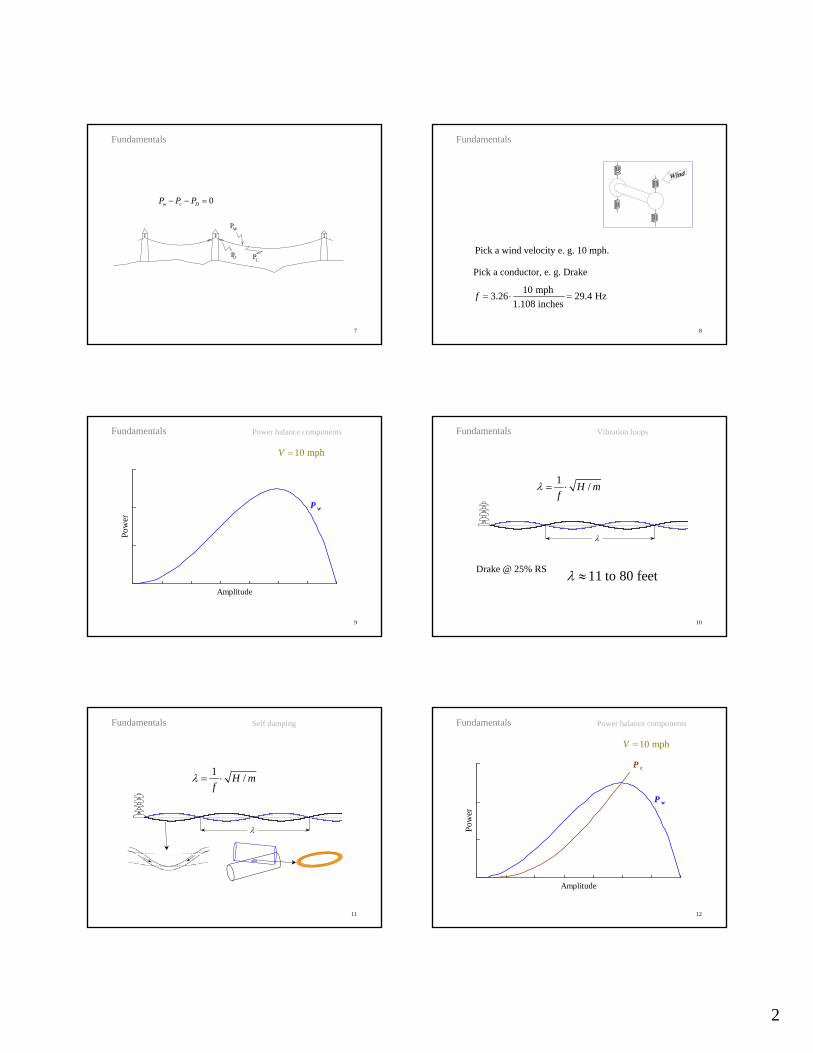
Pick a wind velocity e. g. 10 mph.
Pick a conductor, e. g. Drake
10 mph3.26 29.4 Hz1.108 inches
f = ⋅ =
Fundamentals
9
Power Balance Components
Amplitude
Pow
er
P w
Power balance components
10 mphV =
Fundamentals
10
λ
1 /H mf
λ = ⋅
Drake @ 25% RS 11 to 80 feetλ ≈
Vibration loopsFundamentals
11
λ
1 /H mf
λ = ⋅
Self dampingFundamentals
12
Power Balance Components
Amplitude
Pow
er
P w
P c
Power balance components
10 mphV =
Fundamentals
3
13
Power Balance Components
Amplitude
Pow
er
P w
P c
P w - P c
Power balance components
10 mphV =
Fundamentals
14
Power Balance Components
Amplitude
Pow
er
P w
P D
P w - P c
Power balance
10 mphV =
Fundamentals
15
Power Balance Components
Amplitude
Pow
er
P D
P w - P c ( )w cp p L− ⋅
Power balance
10 mphV =
Fundamentals
16
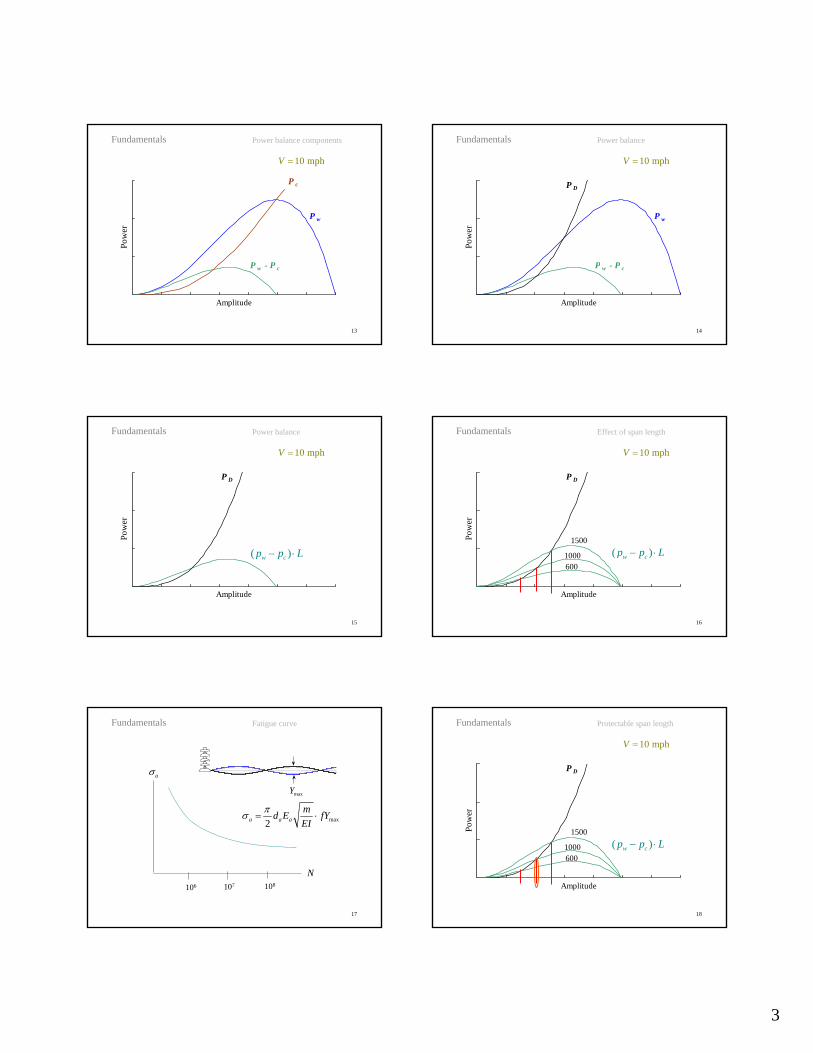
Power Balance Components
Amplitude
Pow
erP D
( )w cp p L− ⋅6001000
1500
Effect of span length
10 mphV =
Fundamentals
17
aσ
N106 107 108
maxY
Fatigue curveFundamentals
max2a a amd E fYEI
πσ = ⋅
18
Power Balance Components
Amplitude
Pow
er
P D
( )w cp p L− ⋅6001000
1500
Protectable span length
10 mphV =
Fundamentals
4
19
Prot
ecta
ble
span
leng
th -
feet
Wind velocity - mph2 15
1000
2000
3000
Maximum safe span lengthFundamentals
20
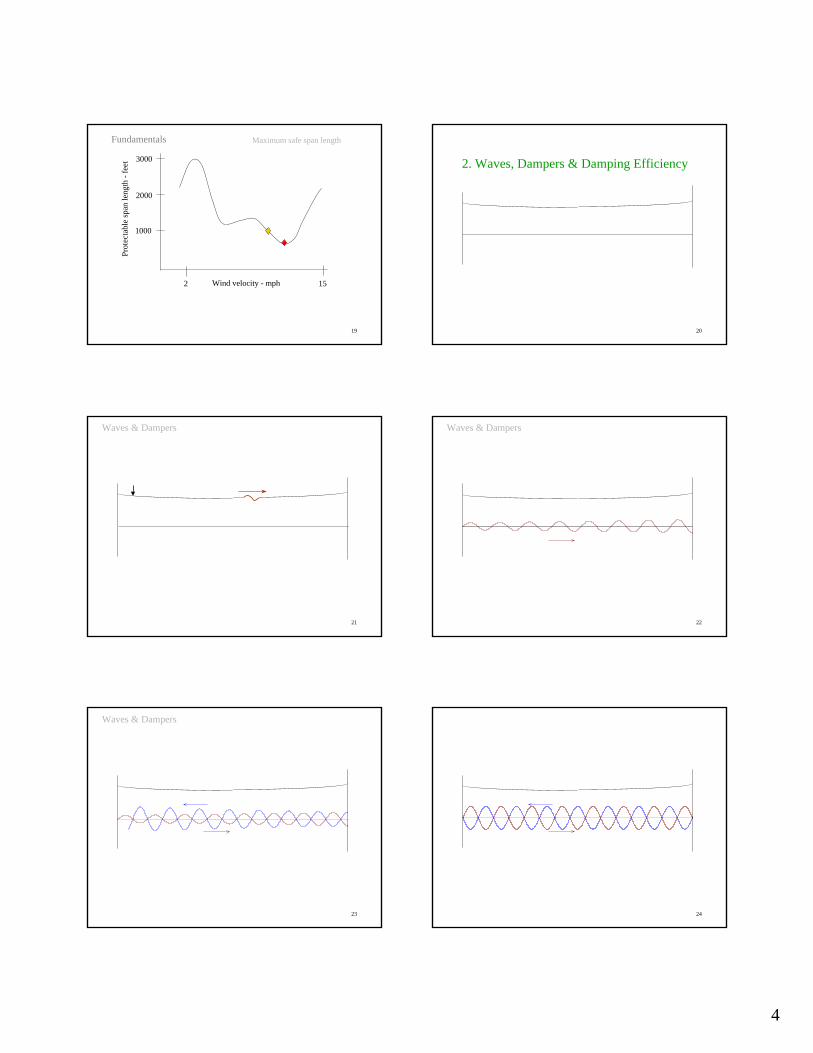
2. Waves, Dampers & Damping Efficiency
21
Waves & Dampers
22
Waves & Dampers
23
Waves & Dampers
24
5
25
Waves & Dampers
26
∞
A
B
maxy A B= +
Waves & Dampers
( )2 2 20
12
P Z A Bω= −
2 20
12AP Z Aω= 2 2
012BP Z Bω=
Characteristic Impedance
0Z H m= ⋅
2 fω π=
Fixed rails
Frictionless roller
Z0 DashpotR
27
A
y max
B
0
2 2max 0 max
12
P Z yω=
( )2 2 20
12
P Z A Bω= −maxy A B= +
max
Damping efficiency PP
= A BA B−
=+
Waves & Dampers
0Z
28
Ymax
Ymin
Waves & Dampers
( )max 2Y A B= + ( )min 2Y A B= −
29
Fixed rails
R Dashpot
X
Waves & Dampers Damper resistance & reactanceF
30
Waves & Dampers
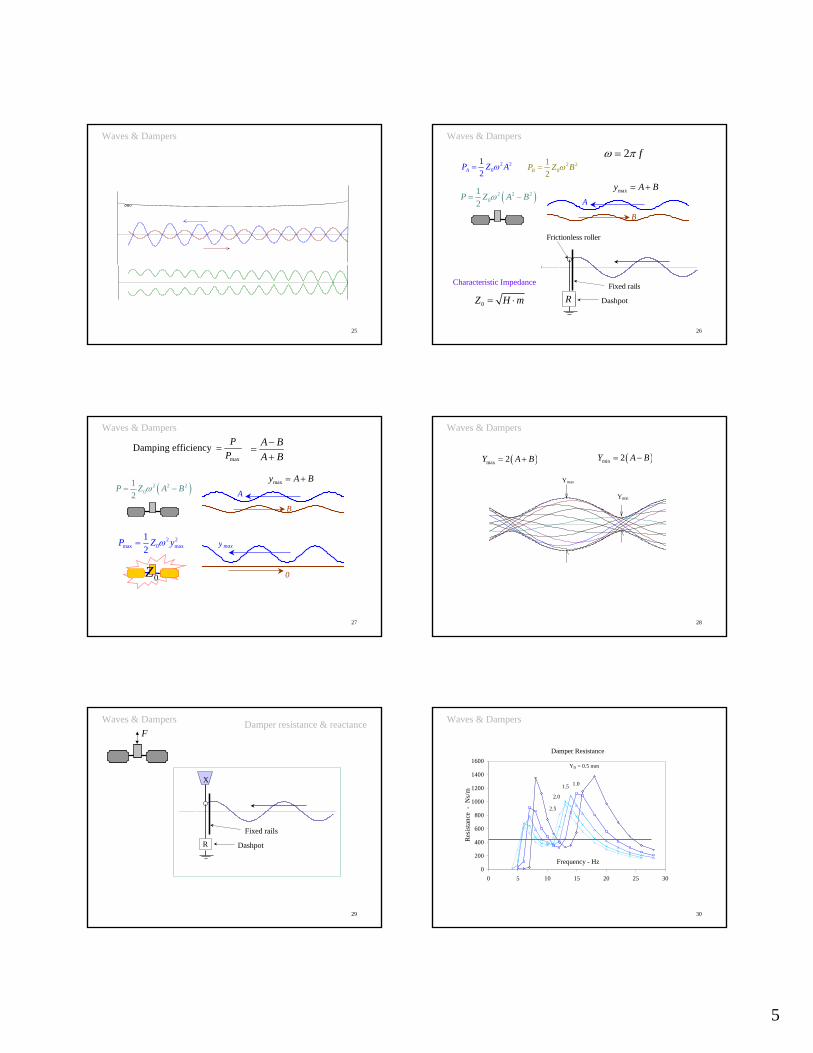
Damper Resistance
0
200
400
600
800
1000
1200
1400
1600
0 5 10 15 20 25 30
Frequency - Hz
Res
ista
nce
- N
s/m
YD = 0.5 mm
1.01.5
2.0
2.5
6
31
Waves & Dampers
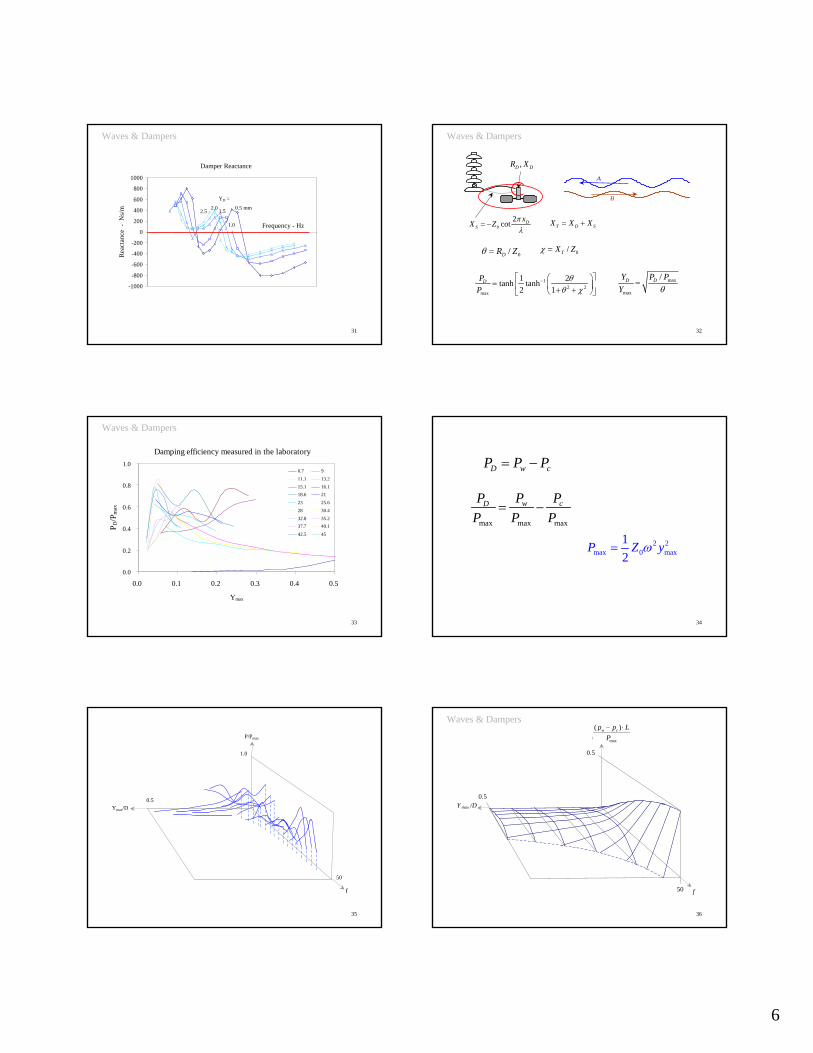
Damper Reactance
-1000
-800
-600
-400
-200
0
200
400
600
800
1000
Frequency - Hz
Rea
ctan
ce -
Ns/
m 0.5 mm
YD =
1.0
1.52.02.5
32
A
B
T D SX X X= +
0/DR Zθ = 0/TX Zχ =
12 2
max
1 2tanh tanh2 1
DPP
θθ χ
−⎡ ⎤⎛ ⎞= ⎢ ⎥⎜ ⎟+ +⎝ ⎠⎣ ⎦
max
max
/DD P PYY θ
=
,D DR X
02cot D
SxX Z πλ
= −
Waves & Dampers
33
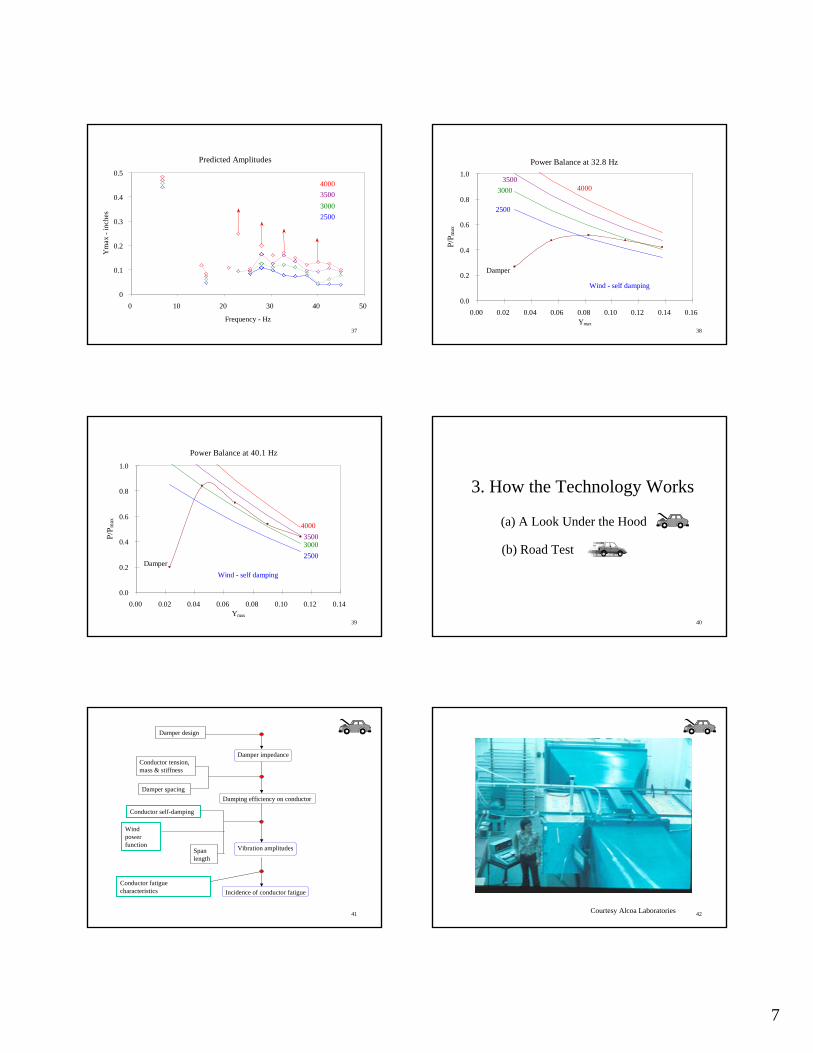
Damping efficiency measured in the laboratory
0.0
0.2
0.4
0.6
0.8
1.0
0.0 0.1 0.2 0.3 0.4 0.5
Ymax
P D/P
max
6.7 911.1 13.215.1 16.118.6 2123 25.628 30.432.8 35.237.7 40.142.5 45
Waves & Dampers
34
D w cP P P= −
max max max
w cD P PPP P P
= −
2 2max 0 max
12
P Z yω=
35
1.0
50
Ymax/D0.5
P/Pmax
f
36
Waves & Dampers
(P w -P c )/P max
Y max /D
f50
0.5
0.5
max
( )w cp p LP− ⋅
7
37
Predicted Amplitudes
0
0.1
0.2
0.3
0.4
0.5
0 10 20 30 40 50
Frequency - Hz
Ym
ax -
inch
es 2500300035004000
38
Power Balance at 32.8 Hz
0.0
0.2
0.4
0.6
0.8
1.0
0.00 0.02 0.04 0.06 0.08 0.10 0.12 0.14 0.16Ymax
P/P m
ax
Damper
Wind - self damping
2500
30003500
4000
39
Power Balance at 40.1 Hz
0.0
0.2
0.4
0.6
0.8
1.0
0.00 0.02 0.04 0.06 0.08 0.10 0.12 0.14Ymax
P/P m
ax
Wind - self dampingDamper
250030003500
4000
40
3. How the Technology Works
(a) A Look Under the Hood
(b) Road Test
41
Damper impedance
Damping efficiency on conductor
Vibration amplitudes
Incidence of conductor fatigue
Damper design
Conductor tension,mass & stiffness
Damper spacing
Conductor self-damping
Windpowerfunction
Spanlength
Conductor fatiguecharacteristics
42Courtesy Alcoa Laboratories
8
43
Tunnel throat
44
Brika & Laneville 1995
45
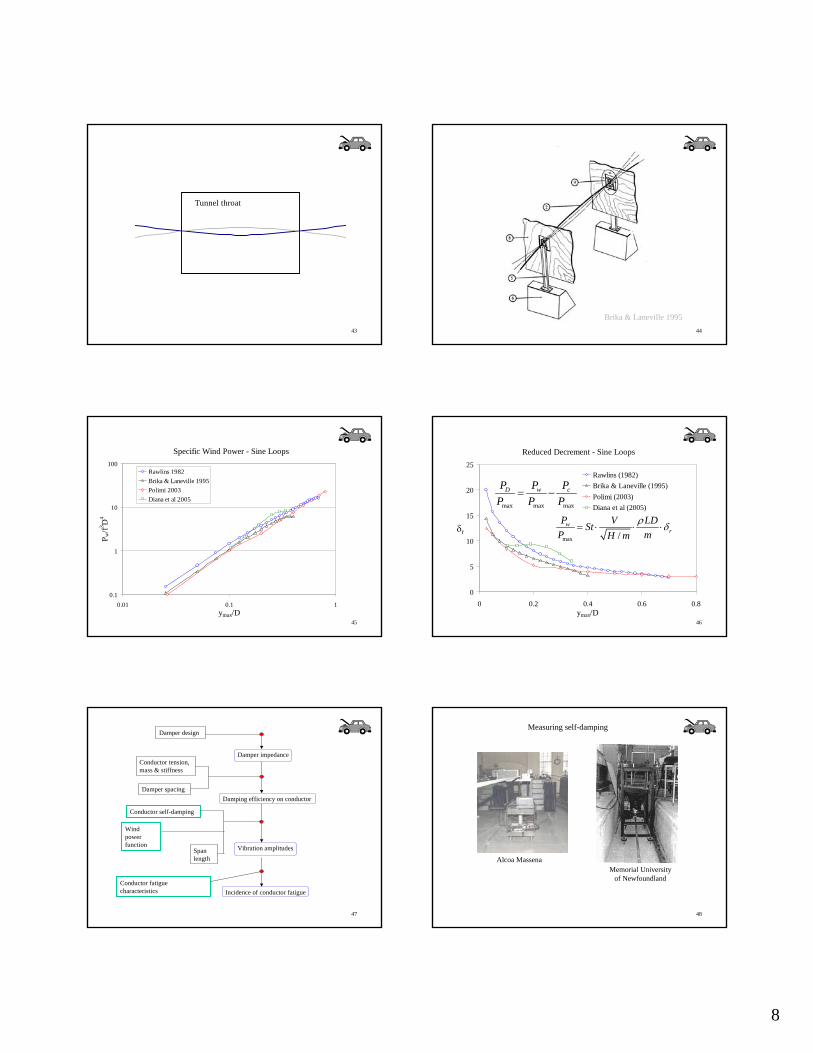
Specific Wind Power - Sine Loops
0.1
1
10
100
0.01 0.1 1ymax/D
P w/f3 D
4
Rawlins 1982Brika & Laneville 1995Polimi 2003Diana et al 2005
46
Reduced Decrement - Sine Loops
0
5
10
15
20
25
0 0.2 0.4 0.6 0.8ymax/D
δr
Rawlins (1982)Brika & Laneville (1995)Polimi (2003)Diana et al (2005)
max /w
rP V LDSt
P mH mρ δ= ⋅ ⋅ ⋅
max max max
w cD P PPP P P
= −
47
Damper impedance
Damping efficiency on conductor
Vibration amplitudes
Incidence of conductor fatigue
Damper design
Conductor tension,mass & stiffness
Damper spacing
Conductor self-damping
Windpowerfunction
Spanlength
Conductor fatiguecharacteristics
48
Alcoa MassenaMemorial University
of Newfoundland
Measuring self-damping
9
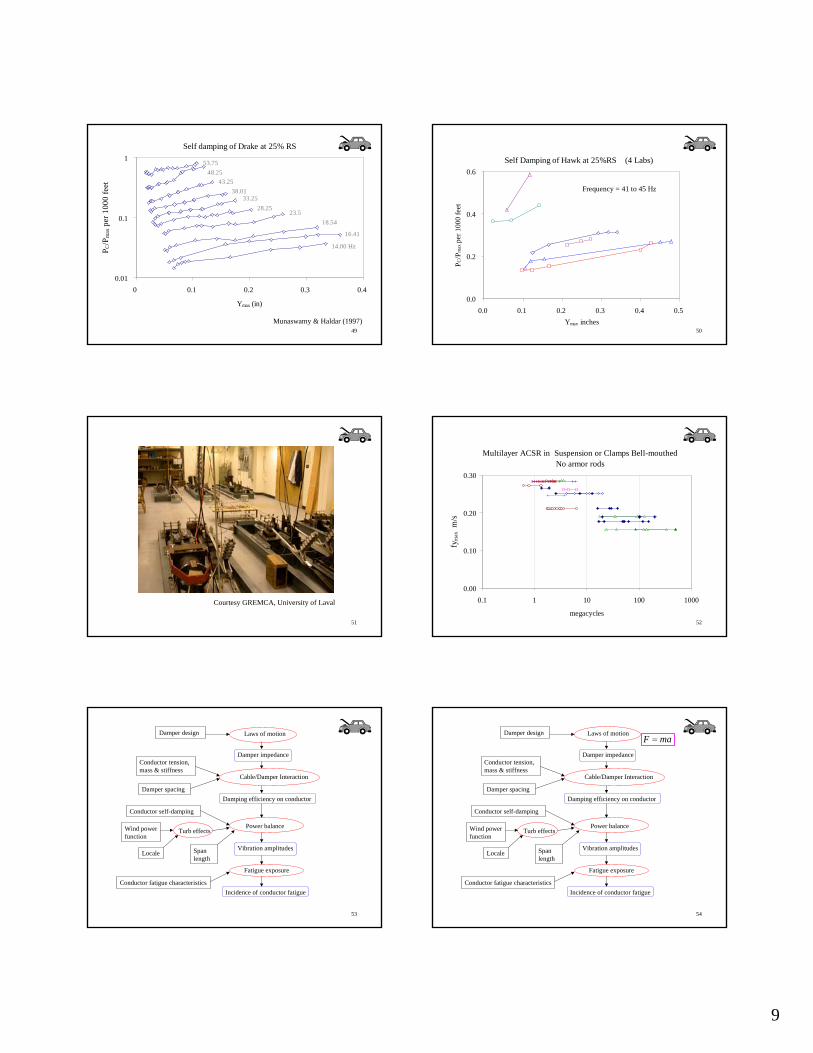
49Munaswamy & Haldar (1997)
Self damping of Drake at 25% RS
0.01
0.1
1
0 0.1 0.2 0.3 0.4
Ymax (in)
P C/P
max
per
100
0 fe
et
14.00 Hz
16.41
18.5423.5
28.2533.25
38.0143.25
48.2553.75
50
Self Damping of Hawk at 25%RS (4 Labs)
0.0
0.2
0.4
0.6
0.0 0.1 0.2 0.3 0.4 0.5Ymax inches
P C/P
max
per
100
0 fe
et
Frequency = 41 to 45 Hz
51
Courtesy GREMCA, University of Laval
52
Multilayer ACSR in Suspension or Clamps Bell-mouthedNo armor rods
0.00
0.10
0.20
0.30
0.1 1 10 100 1000
megacycles
fym
ax m
/s
53
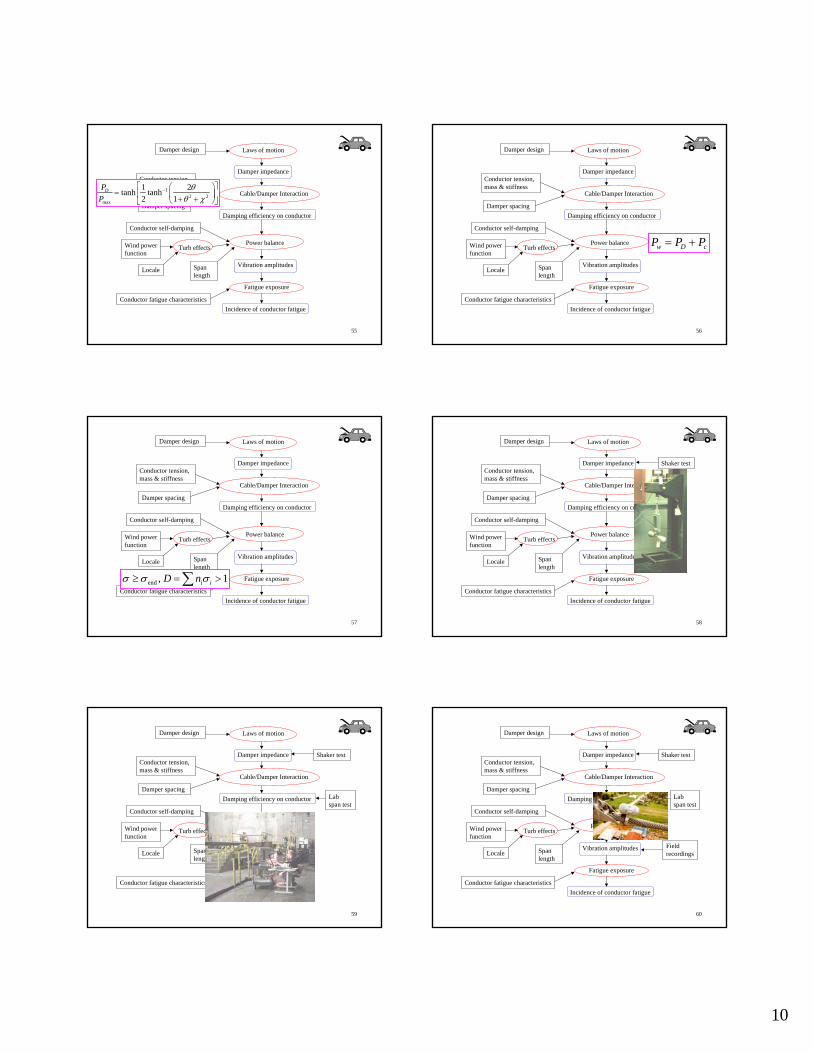
Laws of motion
Cable/Damper Interaction
Power balance
Fatigue exposure
Damper impedance
Damping efficiency on conductor
Vibration amplitudes
Incidence of conductor fatigue
Damper design
Conductor tension,mass & stiffness
Damper spacing
Conductor self-damping
Wind powerfunction
Locale Spanlength
Turb effects
Conductor fatigue characteristics
54
Power balance
Fatigue exposure
Damper impedance
Damping efficiency on conductor
Vibration amplitudes
Incidence of conductor fatigue
Damper design
Conductor tension,mass & stiffness
Damper spacing
Conductor self-damping
Wind powerfunction
Locale Spanlength
Turb effects
Conductor fatigue characteristics
Laws of motionF ma=
Cable/Damper Interaction
10
55
Power balance
Fatigue exposure
Damper impedance
Damping efficiency on conductor
Vibration amplitudes
Incidence of conductor fatigue
Damper design
Conductor tension,mass & stiffness
Damper spacing
Conductor self-damping
Wind powerfunction
Locale Spanlength
Turb effects
Conductor fatigue characteristics
12 2
max
1 2tanh tanh2 1
DPP
θθ χ
−⎡ ⎤⎛ ⎞= ⎢ ⎥⎜ ⎟+ +⎝ ⎠⎣ ⎦
Cable/Damper Interaction
Laws of motion
56
Fatigue exposure
Damper impedance
Damping efficiency on conductor
Vibration amplitudes
Incidence of conductor fatigue
Damper design
Conductor tension,mass & stiffness
Damper spacing
Conductor self-damping
Wind powerfunction
Locale Spanlength
Turb effects
Conductor fatigue characteristics
w D cP P P= +
Laws of motion
Cable/Damper Interaction
Power balance
57
Damper impedance
Damping efficiency on conductor
Vibration amplitudes
Incidence of conductor fatigue
Damper design
Conductor tension,mass & stiffness
Damper spacing
Conductor self-damping
Wind powerfunction
Locale Spanlength
Turb effects
Conductor fatigue characteristicsend , 1i iD nσ σ σ≥ = >∑
Laws of motion
Cable/Damper Interaction
Power balance
Fatigue exposure
58
Damper impedance
Damping efficiency on conductor
Vibration amplitudes
Incidence of conductor fatigue
Damper design
Conductor tension,mass & stiffness
Damper spacing
Conductor self-damping
Wind powerfunction
Locale Spanlength
Turb effects
Conductor fatigue characteristics
Shaker test
Laws of motion
Cable/Damper Interaction
Power balance
Fatigue exposure
59
Damper impedance
Damping efficiency on conductor
Vibration amplitudes
Incidence of conductor fatigue
Damper design
Conductor tension,mass & stiffness
Damper spacing
Conductor self-damping
Wind powerfunction
Locale Spanlength
Turb effects
Conductor fatigue characteristics
Shaker test
Labspan test
Laws of motion
Cable/Damper Interaction
Power balance
Fatigue exposure
60
Damper impedance
Damping efficiency on conductor
Vibration amplitudes
Incidence of conductor fatigue
Damper design
Conductor tension,mass & stiffness
Damper spacing
Conductor self-damping
Wind powerfunction
Locale Spanlength
Turb effects
Conductor fatigue characteristics
Shaker test
Labspan test
Fieldrecordings
Laws of motion
Cable/Damper Interaction
Power balance
Fatigue exposure
11
61
Damper impedance
Damping efficiency on conductor
Vibration amplitudes
Incidence of conductor fatigue
Damper design
Conductor tension,mass & stiffness
Damper spacing
Conductor self-damping
Wind powerfunction
Locale Spanlength
Turb effects
Conductor fatigue characteristics
Shaker test
Labspan test
Fieldrecordings
Inspectionof line
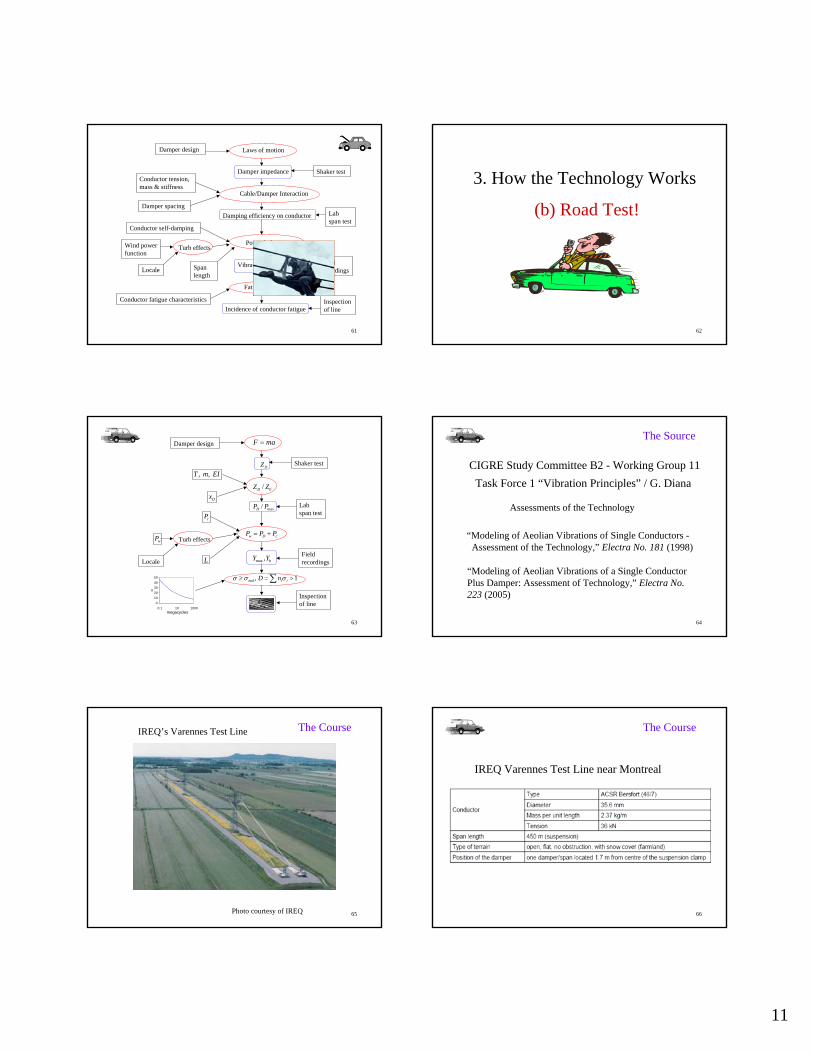
Laws of motion
Cable/Damper Interaction
Power balance
Fatigue exposure
62
(b) Road Test!
3. How the Technology Works
63
Damper design
Locale
Turb effects
Shaker test
Labspan test
Fieldrecordings
Inspectionof line
F ma=
DZ
0/DZ Z
max/DP P
w D cP P P= +
cP
wP
, , T m EI
Dx
L
01020304050
0.1 10 1000megacycles
σ
max , bY Y
end , 1i iD nσ σ σ≥ = >∑
64
CIGRE Study Committee B2 - Working Group 11Task Force 1 “Vibration Principles” / G. Diana
Assessments of the Technology
“Modeling of Aeolian Vibrations of Single Conductors - Assessment of the Technology,” Electra No. 181 (1998)
“Modeling of Aeolian Vibrations of a Single ConductorPlus Damper: Assessment of Technology,” Electra No.223 (2005)
The Source
65Photo courtesy of IREQ
IREQ’s Varennes Test Line The Course
66
IREQ Varennes Test Line near Montreal
The Course
12
67
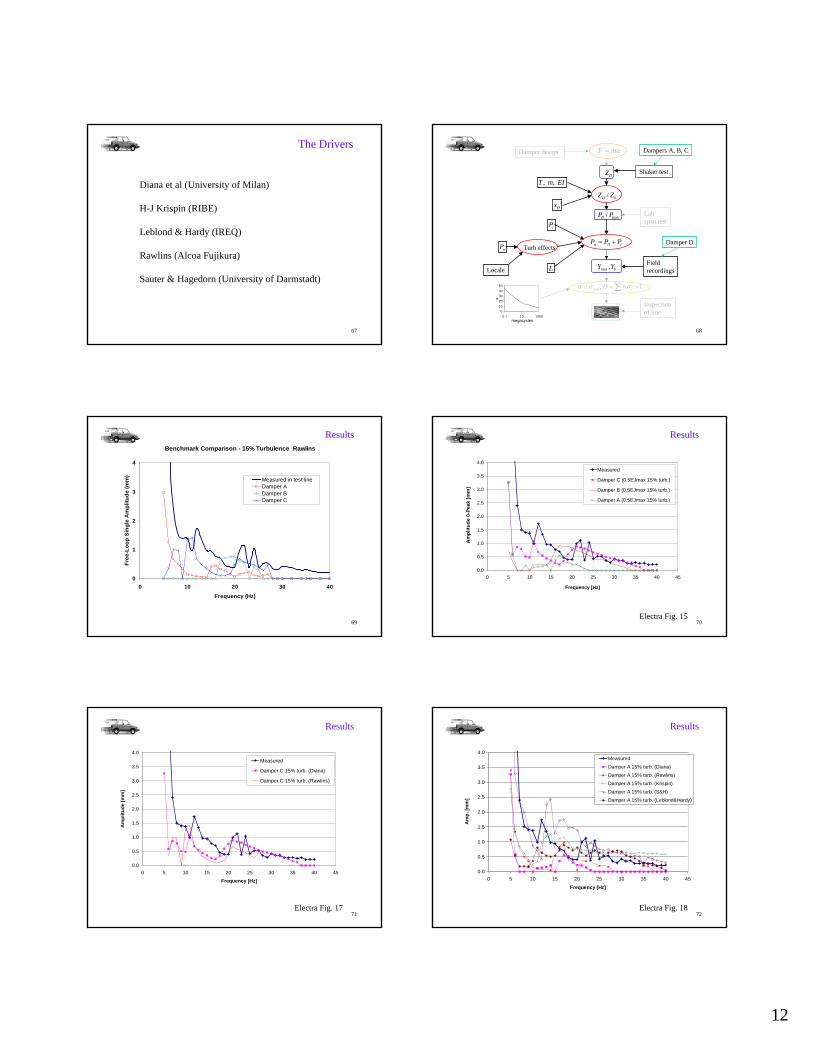
Diana et al (University of Milan)
H-J Krispin (RIBE)
Leblond & Hardy (IREQ)
Rawlins (Alcoa Fujikura)
Sauter & Hagedorn (University of Darmstadt)
The Drivers
68
Damper design
Locale
Turb effects
Shaker test
Labspan test
Fieldrecordings
Inspectionof line
F ma=
DZ
0/DZ Z
max/DP P
w D cP P P= +
cP
wP
, , T m EI
Dx
L
01020304050
0.1 10 1000megacycles
σ
max , bY Y
end , 1i iD nσ σ σ≥ = >∑
Dampers A, B, C
Damper D
69
Benchmark Comparison - 15% Turbulence Rawlins
0
1
2
3
4
0 10 20 30 40Frequency (Hz)
Free
-Loo
p Si
ngle
Am
plitu
de (m
m)
Measured in test lineDamper ADamper BDamper C
Results
70
0.0
0.5
1.0
1.5
2.0
2.5
3.0
3.5
4.0
0 5 10 15 20 25 30 35 40 45
Frequency [Hz]
Am
plitu
de 0
-Pea
k [m
m]
Measured
Damper C (0.5EJmax 15% turb.)
Damper B (0.5EJmax 15% turb.)
Damper A (0.5EJmax 15% turb.)
Electra Fig. 15
Results
71
0.0
0.5
1.0
1.5
2.0
2.5
3.0
3.5
4.0
0 5 10 15 20 25 30 35 40 45
Frequency [Hz]
Am
plitu
de [m
m]
Measured
Damper C 15% turb. (Diana)
Damper C 15% turb. (Rawlins)
Electra Fig. 17
Results
72
0.0
0.5
1.0
1.5
2.0
2.5
3.0
3.5
4.0
0 5 10 15 20 25 30 35 40 45
Frequency [Hz]
Am
p. [m
m]
Measured
Damper A 15% turb. (Diana)Damper A 15% turb. (Rawlins)Damper A 15% turb. (Krispin)
Damper A 15% turb. (S&H)Damper A 15% turb. (Leblond&Hardy)
Electra Fig. 18
Results
13
73
0
0.5
1
1.5
2
2.5
3
Raw
lins
- C T
15%
Dia
na -
C T
15%
0.5
*EJm
ax
Har
dy -
A c
on E
J
Raw
lins
- A T
10%
Raw
lins
- C T
10%
Dia
na -
B T
15%
0.5
*EJm
ax
Raw
lins
- A T
15%
Har
dy -
A fu
ne
Raw
lins
- A T
5%
Kris
pin
- A T
15%
EJm
in
Dia
na -
A T
15%
0.5
*EJm
ax
Kris
pin
- A T
15%
0.5
*EJm
ax
Raw
lins
- B T
15%
S&H
- A
T15
%
Kris
pin
- A T
10%
EJm
in
Raw
lins
- B T
10%
Kris
pin
- A T
10%
0.5
*EJm
ax
Dia
na -
A T
5% 0
.5*E
Jmax
Dia
na -
A T
5% 0
.05*
EJm
ax
Raw
lins
- C T
5%
Raw
lins
- B T
5%
S&H
- C
T1%
S&H
- B
T1%
Dia
na -
B T
5% 0
.5*E
Jmax
Dia
na -
C T
5% 0
.5*E
Jmax
Dia
na -
B T
5% 0
.05*
EJm
ax
Dia
na -
C T
5% 0
.05*
EJm
ax
S&H
- A
T5%
RM
S (E
rror
% (A
-M)/M
)
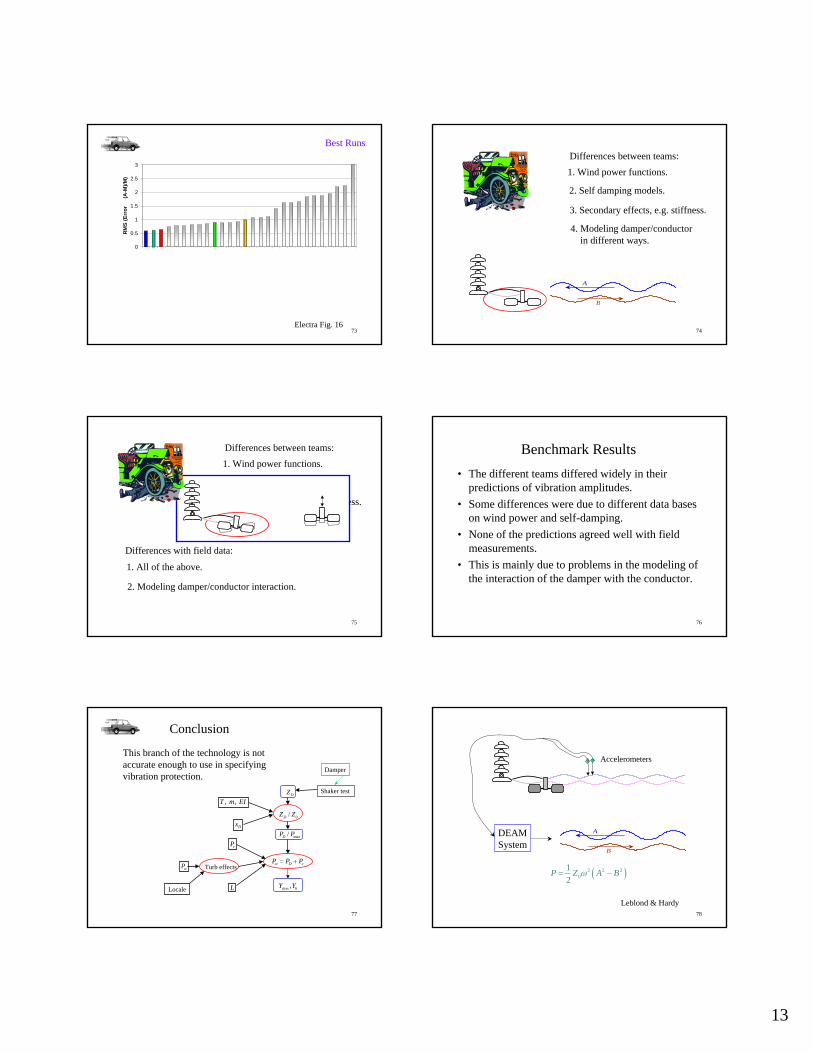
Electra Fig. 16
Best Runs
74
Differences between teams:1. Wind power functions.
2. Self damping models.
3. Secondary effects, e.g. stiffness.
4. Modeling damper/conductor in different ways.
A
B
75
Differences between teams:1. Wind power functions.
2. Self damping models.
3. Secondary effects, e.g. stiffness.
4. Modeling damper/conductor in different ways.
Differences with field data:
1. All of the above.
2. Modeling damper/conductor interaction.
76
Benchmark Results• The different teams differed widely in their
predictions of vibration amplitudes.• Some differences were due to different data bases
on wind power and self-damping.• None of the predictions agreed well with field
measurements.• This is mainly due to problems in the modeling of
the interaction of the damper with the conductor.
77
Locale
Turb effects
Shaker testDZ
0/DZ Z
max/DP P
w D cP P P= +
cP
wP
, , T m EI
Dx
L max , bY Y
Damper
Conclusion
This branch of the technology is notaccurate enough to use in specifyingvibration protection.
78
A
B
Accelerometers
Leblond & Hardy
DEAMSystem
( )2 2 20
12
P Z A Bω= −
14
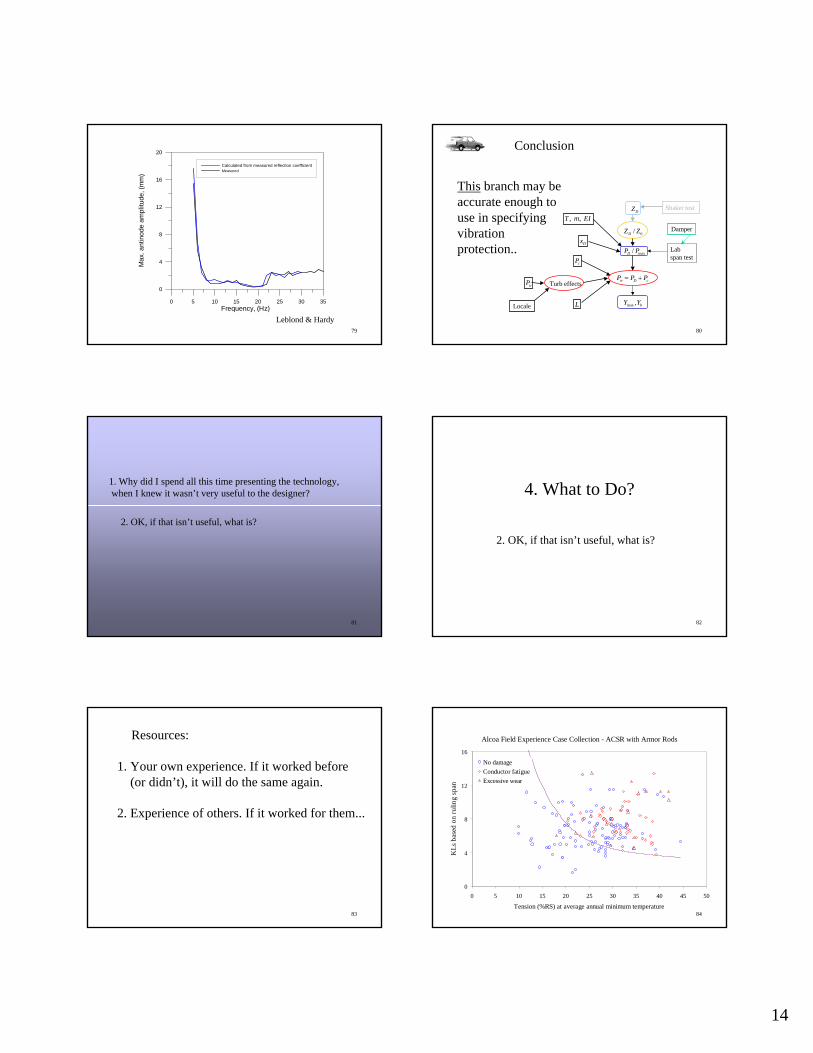
79
0 5 10 15 20 25 30 35Frequency, (Hz)
0
4
8
12
16
20
Max
. ant
inod
e am
plitu
de, (
mm
)
Calculated from measured reflection coefficientMeasured
Leblond & Hardy80
Locale
Turb effects
Shaker testDZ
0/DZ Z
max/DP P
w D cP P P= +
cP
wP
, , T m EI
Dx
L max , bY Y
Damper
Conclusion
This branch may beaccurate enough touse in specifyingvibrationprotection.. Lab
span test
81
1. Why did I spend all this time presenting the technology, when I knew it wasn’t very useful to the designer?
2. OK, if that isn’t useful, what is?
82
4. What to Do?
2. OK, if that isn’t useful, what is?
83
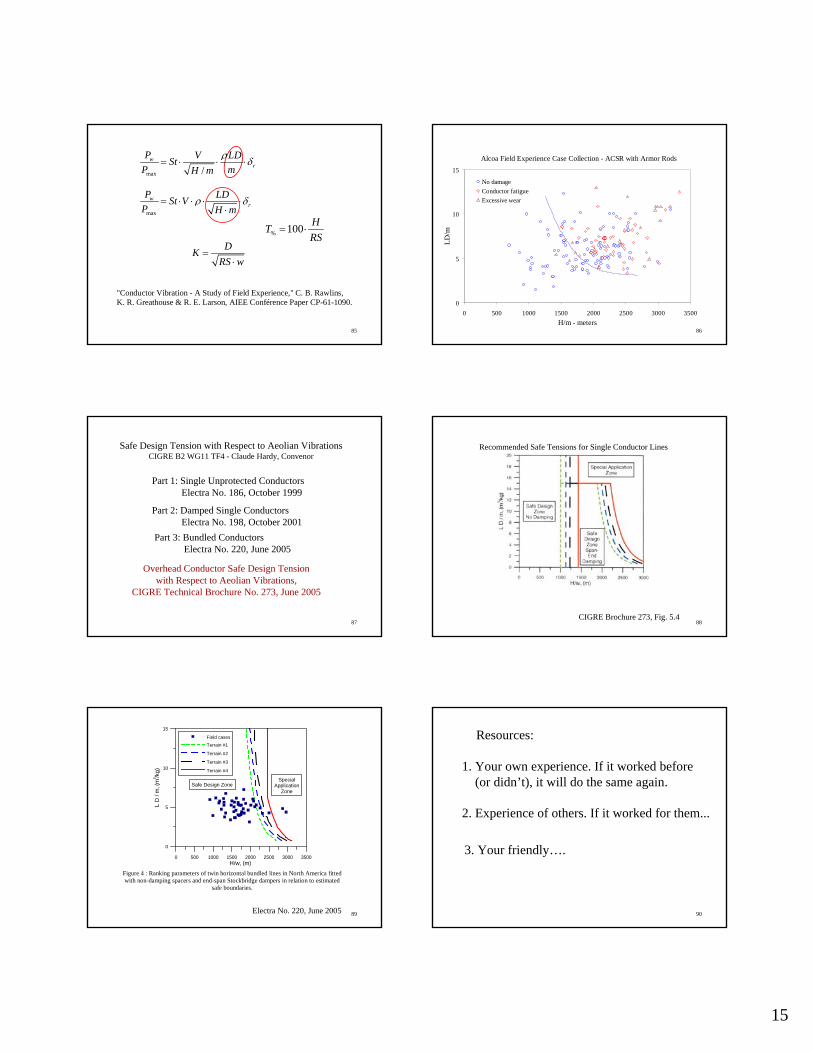
Resources:
1. Your own experience. If it worked before (or didn’t), it will do the same again.
2. Experience of others. If it worked for them...
84
Alcoa Field Experience Case Collection - ACSR with Armor Rods
0
4
8
12
16
0 5 10 15 20 25 30 35 40 45 50
Tension (%RS) at average annual minimum temperature
KLs
bas
ed o
n ru
ling
span
No damageConductor fatigueExcessive wear
15
85
max /w
rP V LDSt
P mH mρ δ= ⋅ ⋅ ⋅
max
wr
P LDSt VP H m
ρ δ= ⋅ ⋅ ⋅ ⋅⋅
% 100 HTRS
= ⋅
DKRS w
=⋅
"Conductor Vibration - A Study of Field Experience," C. B. Rawlins,K. R. Greathouse & R. E. Larson, AIEE Conférence Paper CP-61-1090.
86
Alcoa Field Experience Case Collection - ACSR with Armor Rods
0
5
10
15
0 500 1000 1500 2000 2500 3000 3500H/m - meters
LD/m
No damageConductor fatigueExcessive wear
87
Safe Design Tension with Respect to Aeolian VibrationsCIGRE B2 WG11 TF4 - Claude Hardy, Convenor
Part 1: Single Unprotected Conductors Electra No. 186, October 1999
Part 2: Damped Single Conductors Electra No. 198, October 2001Part 3: Bundled Conductors Electra No. 220, June 2005
Overhead Conductor Safe Design Tensionwith Respect to Aeolian Vibrations,
CIGRE Technical Brochure No. 273, June 2005
88CIGRE Brochure 273, Fig. 5.4
Recommended Safe Tensions for Single Conductor Lines
89
Safe Design Zone
3
0 500 1000 1500 2000 2500 3000 3500H/w, (m)
0
5
10
15
L D
/ m
, (m
/kg)
Field casesTerrain #1
Terrain #2
Terrain #3
Terrain #4
SpecialApplication
Zone
Figure 4 : Ranking parameters of twin horizontal bundled lines in North America fittedwith non-damping spacers and end-span Stockbridge dampers in relation to estimated
safe boundaries.
Electra No. 220, June 2005 90
Resources:
1. Your own experience. If it worked before (or didn’t), it will do the same again.
2. Experience of others. If it worked for them...
3. Your friendly….

16
91 92
Why???!!All suppliers have some system for makingrecommendations.
They have the most comprehensive knowledge oftheir system’s performance.
They are well motivated to avoid repetition ofany unsatisfactory performance.
They are in the best position to maintain thesystem to achieve that.
93
Protection recommendations will not agree.
2. Their damper designs are different.
1. Suppliers have different technical approaches.
3. Their exposures to field experience have differed.
1. Why did I spend all that time presenting the technology, when I knew it wasn’t very useful?
94
The End