aegon q2 2015 results presentation
TRANSCRIPT

Alex Wynaendts Darryl Button
CEO CFO
The Hague – August 13, 2015
Q2 2015 Results Increase in earnings, sales and
cash flows
2
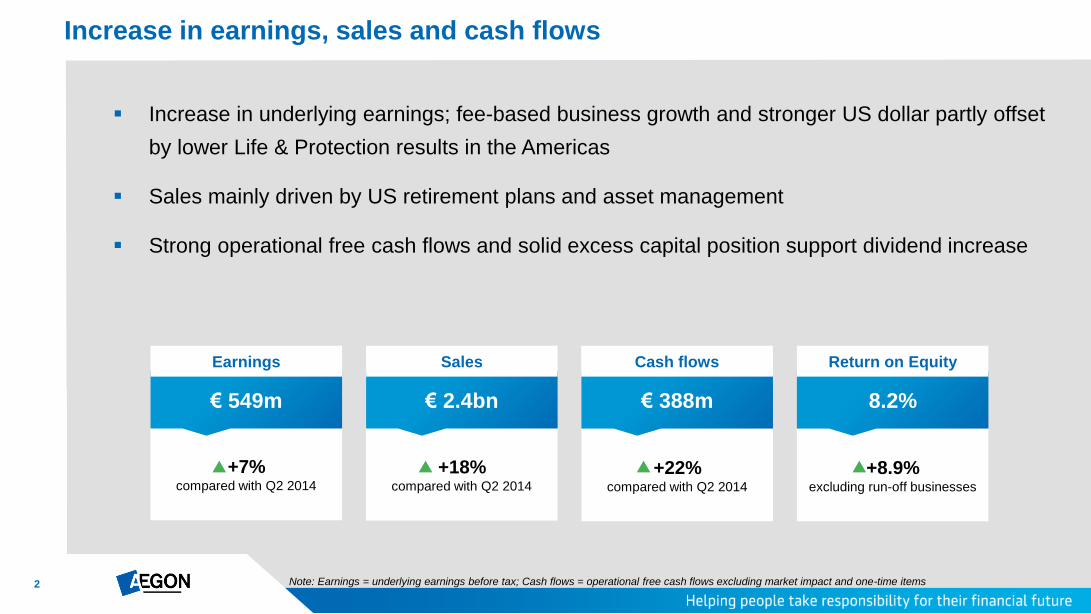
Increase in underlying earnings; fee-based business growth and stronger US dollar partly offset
by lower Life & Protection results in the Americas
Sales mainly driven by US retirement plans and asset management
Strong operational free cash flows and solid excess capital position support dividend increase
Increase in earnings, sales and cash flows
Note: Earnings = underlying earnings before tax; Cash flows = operational free cash flows excluding market impact and one-time items
+22% compared with Q2 2014
+8.9% excluding run-off businesses
8.2% € 388m
Cash flows Return on Equity
+7% compared with Q2 2014
+18%
compared with Q2 2014
€ 2.4bn € 549m
Earnings Sales
3
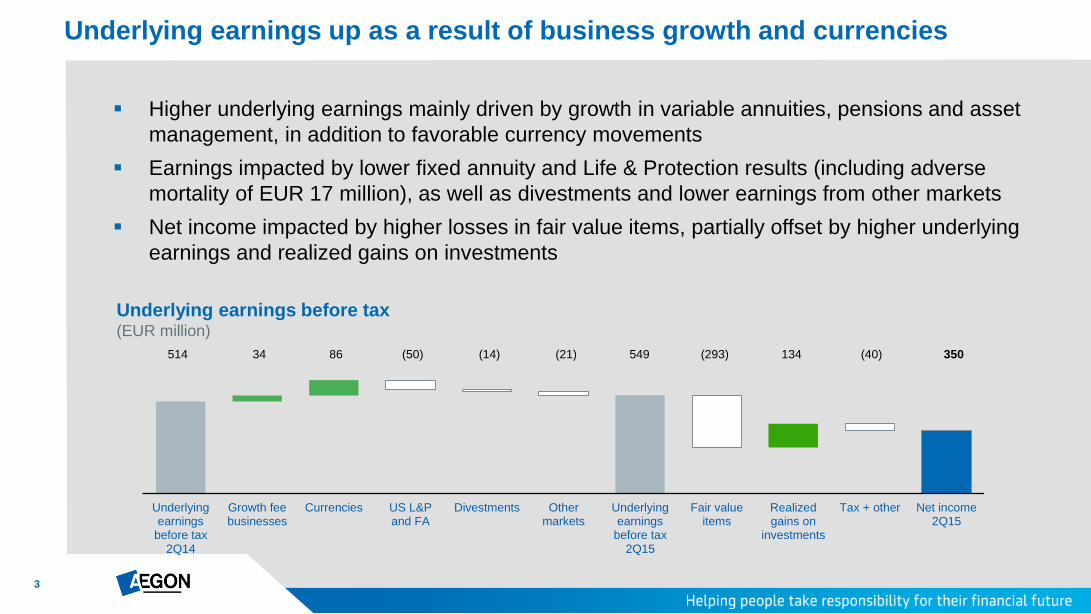
Underlyingearnings
before tax2Q14
Growth feebusinesses
Currencies US L&Pand FA
Divestments Othermarkets
Underlyingearnings
before tax2Q15
Fair valueitems
Realizedgains on
investments
Tax + other Net income2Q15
Higher underlying earnings mainly driven by growth in variable annuities, pensions and asset
management, in addition to favorable currency movements
Earnings impacted by lower fixed annuity and Life & Protection results (including adverse
mortality of EUR 17 million), as well as divestments and lower earnings from other markets
Net income impacted by higher losses in fair value items, partially offset by higher underlying
earnings and realized gains on investments
Underlying earnings up as a result of business growth and currencies
514 34 86 (50) (14) (21) 549 (293) 134 (40) 350
Underlying earnings before tax (EUR million)
4
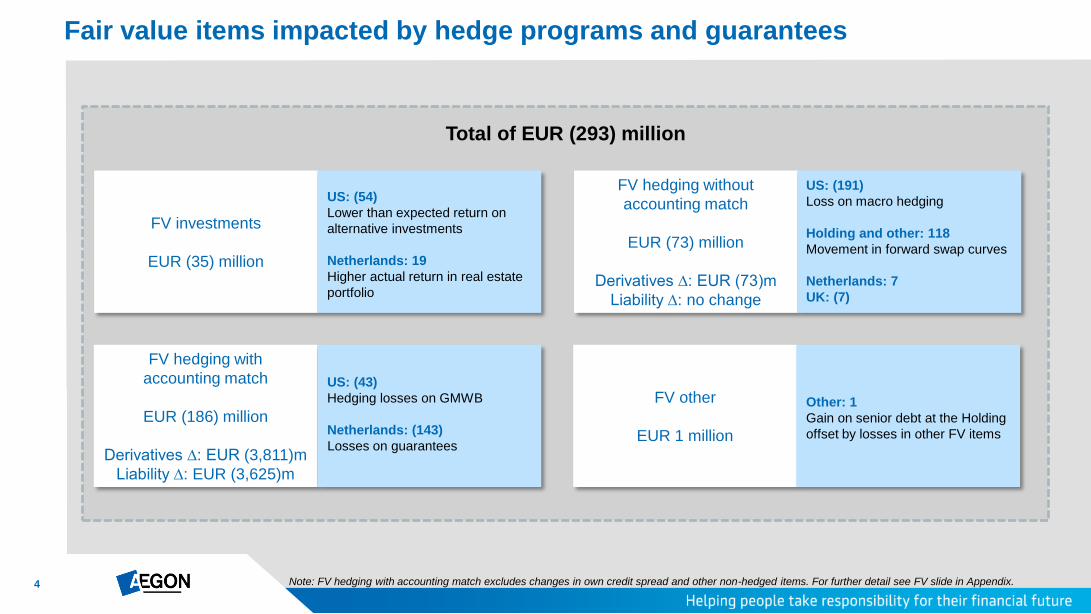
Total of EUR (293) million
Fair value items impacted by hedge programs and guarantees
Note: FV hedging with accounting match excludes changes in own credit spread and other non-hedged items. For further detail see FV slide in Appendix.
FV hedging without
accounting match
EUR (73) million
Derivatives ∆: EUR (73)m
Liability ∆: no change
FV investments
EUR (35) million
FV other
EUR 1 million
US: (54)
Lower than expected return on
alternative investments
Netherlands: 19
Higher actual return in real estate
portfolio
US: (191)
Loss on macro hedging
Holding and other: 118
Movement in forward swap curves
Netherlands: 7
UK: (7)
Other: 1
Gain on senior debt at the Holding
offset by losses in other FV items
FV hedging with
accounting match
EUR (186) million
Derivatives ∆: EUR (3,811)m
Liability ∆: EUR (3,625)m
US: (43)
Hedging losses on GMWB
Netherlands: (143)
Losses on guarantees
5
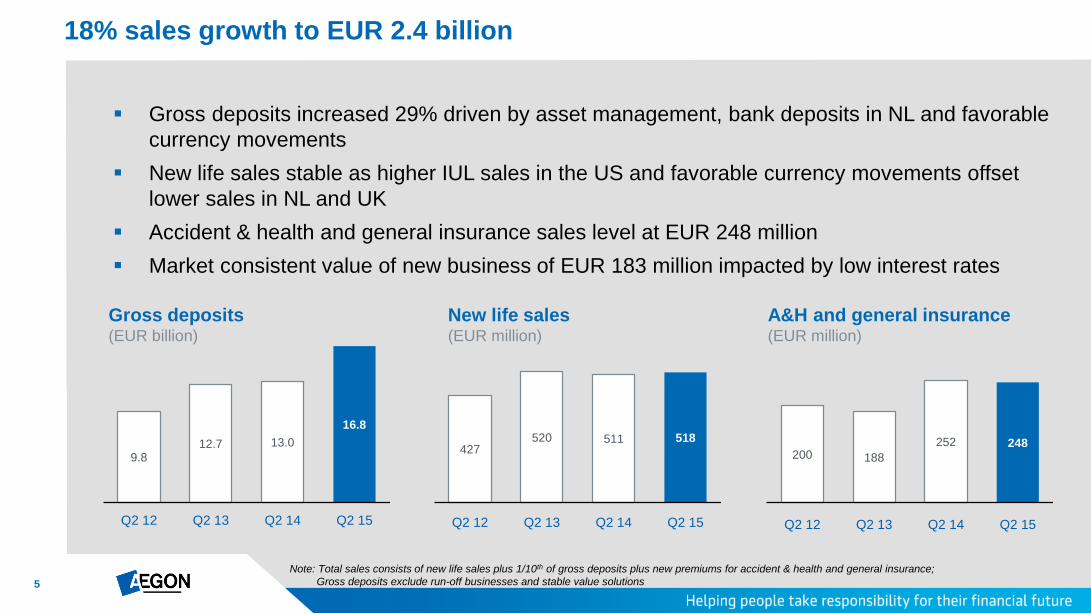
Gross deposits increased 29% driven by asset management, bank deposits in NL and favorable
currency movements
New life sales stable as higher IUL sales in the US and favorable currency movements offset
lower sales in NL and UK
Accident & health and general insurance sales level at EUR 248 million
Market consistent value of new business of EUR 183 million impacted by low interest rates
18% sales growth to EUR 2.4 billion
A&H and general insurance (EUR million)
New life sales (EUR million)
9.8 12.7 13.0
16.8
Q2 12 Q2 13 Q2 14 Q2 15
Gross deposits (EUR billion)
427 520 511 518
Q2 12 Q2 13 Q2 14 Q2 15
200 188
252 248
Q2 12 Q2 13 Q2 14 Q2 15
Note: Total sales consists of new life sales plus 1/10th of gross deposits plus new premiums for accident & health and general insurance;
Gross deposits exclude run-off businesses and stable value solutions
6 6
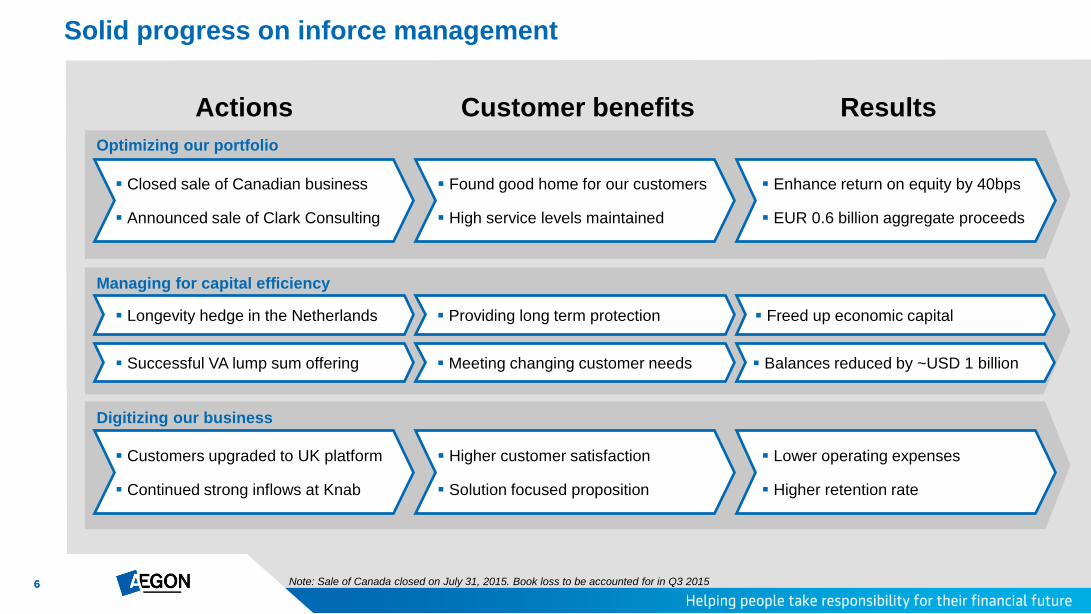
Solid progress on inforce management
Actions Customer benefits Results
Note: Sale of Canada closed on July 31, 2015. Book loss to be accounted for in Q3 2015
Closed sale of Canadian business
Announced sale of Clark Consulting
Found good home for our customers
High service levels maintained
Enhance return on equity by 40bps
EUR 0.6 billion aggregate proceeds
Optimizing our portfolio
Managing for capital efficiency
Customers upgraded to UK platform
Continued strong inflows at Knab
Higher customer satisfaction
Solution focused proposition
Lower operating expenses
Higher retention rate
Digitizing our business
Longevity hedge in the Netherlands
Successful VA lump sum offering
Providing long term protection
Meeting changing customer needs
Freed up economic capital
Balances reduced by ~USD 1 billion
7
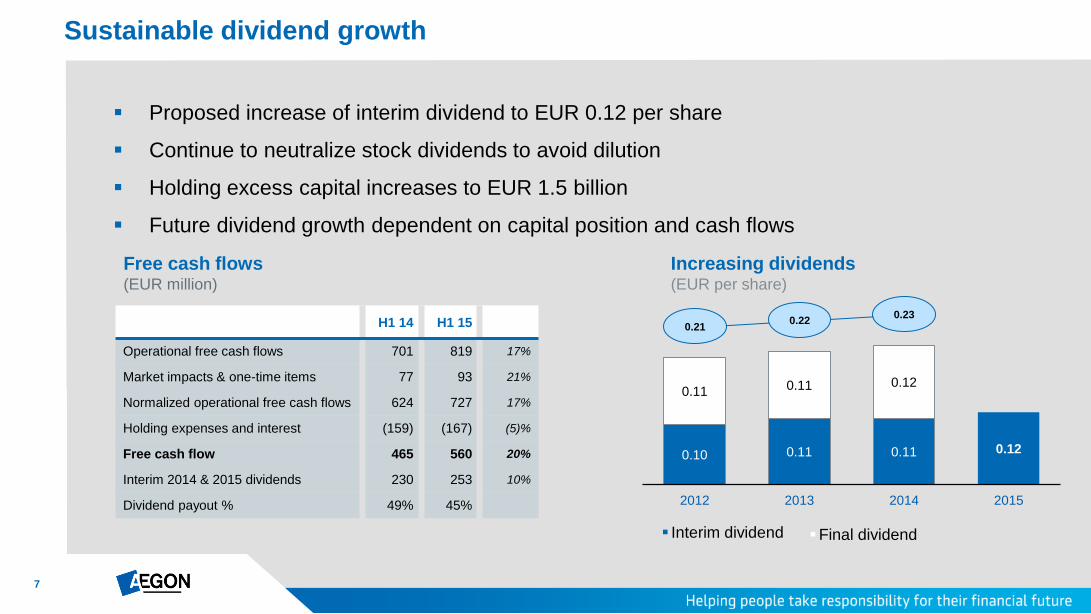
0.10 0.11 0.11 0.12
0.11 0.11 0.12
2012 2013 2014 2015
Final dividend
Proposed increase of interim dividend to EUR 0.12 per share
Continue to neutralize stock dividends to avoid dilution
Holding excess capital increases to EUR 1.5 billion
Future dividend growth dependent on capital position and cash flows
Sustainable dividend growth
Increasing dividends (EUR per share)
Interim dividend
H1 14 H1 15
Operational free cash flows 701 819 17%
Market impacts & one-time items 77 93 21%
Normalized operational free cash flows 624 727 17%
Holding expenses and interest (159) (167) (5)%
Free cash flow 465 560 20%
Interim 2014 & 2015 dividends 230 253 10%
Dividend payout % 49% 45%
Free cash flows (EUR million)
0.21 0.23
0.22
8
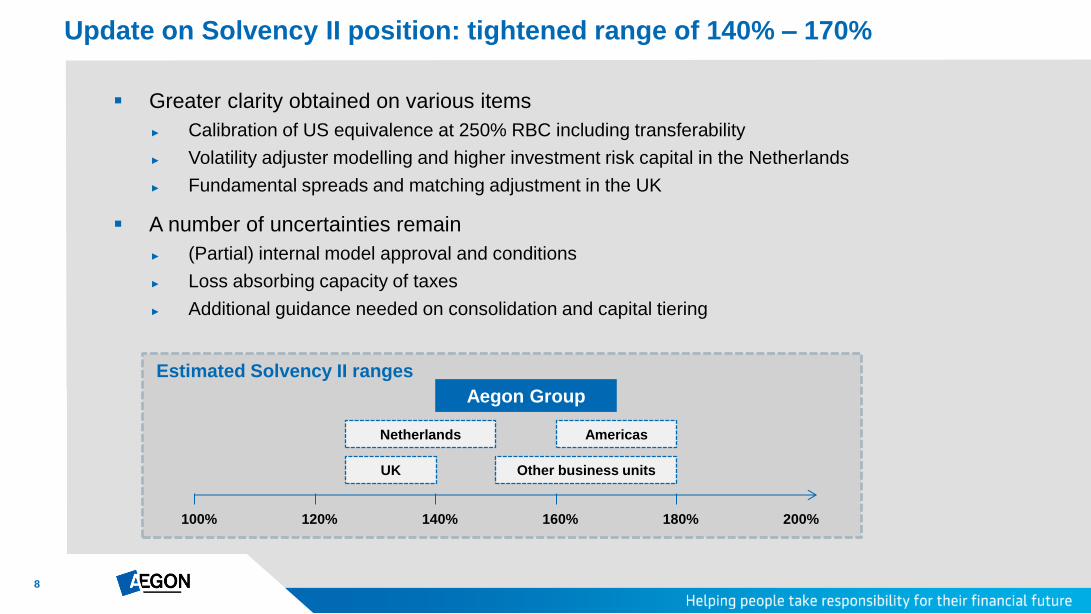
Update on Solvency II position: tightened range of 140% – 170%
Greater clarity obtained on various items
► Calibration of US equivalence at 250% RBC including transferability
► Volatility adjuster modelling and higher investment risk capital in the Netherlands
► Fundamental spreads and matching adjustment in the UK
A number of uncertainties remain
► (Partial) internal model approval and conditions
► Loss absorbing capacity of taxes
► Additional guidance needed on consolidation and capital tiering
Americas
UK
Aegon Group
Netherlands
Estimated Solvency II ranges
Other business units
100% 120% 140% 160% 180% 200%
9 9
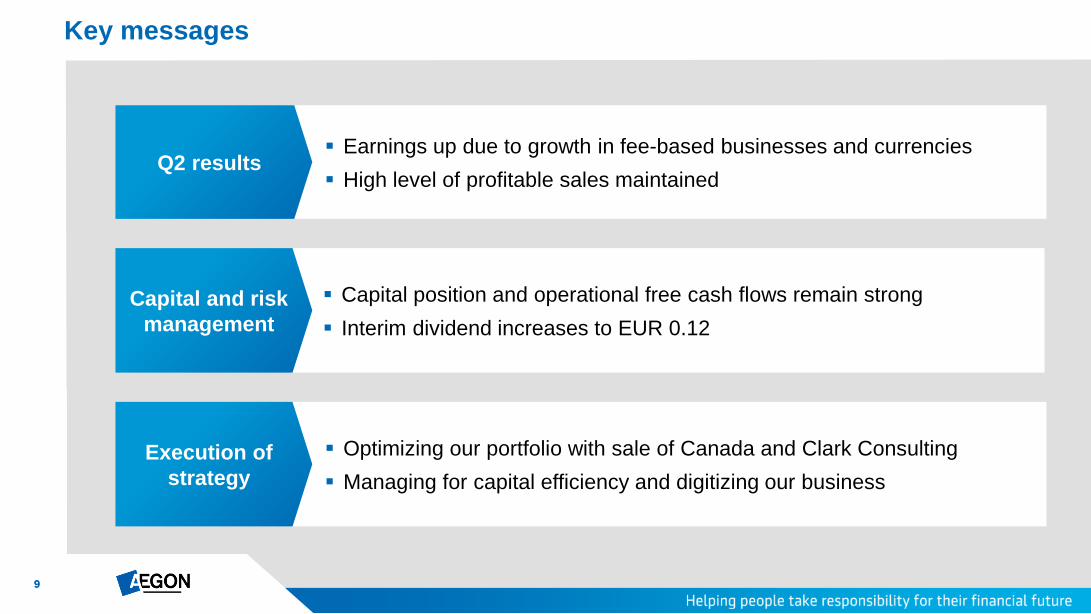
Earnings up due to growth in fee-based businesses and currencies
High level of profitable sales maintained Q2 results
Optimizing our portfolio with sale of Canada and Clark Consulting
Managing for capital efficiency and digitizing our business
Execution of
strategy
Capital position and operational free cash flows remain strong
Interim dividend increases to EUR 0.12
Capital and risk
management
Key messages
Appendix
Q2 2015 results continued
For questions please contact Investor Relations
+31 70 344 8305
P.O. Box 85
2501 CB The Hague
The Netherlands
11
Index
2Q15
Financials
Slide 15-22
2Q15
Country
specific
Slide 23-26
2Q15
Reconciliation
tables,
assumptions &
sensitivities
Slide 27-31
2Q15
Strategy
support
Slide 12-14
Press subject to go directly to the slides
or continue with presentation
12
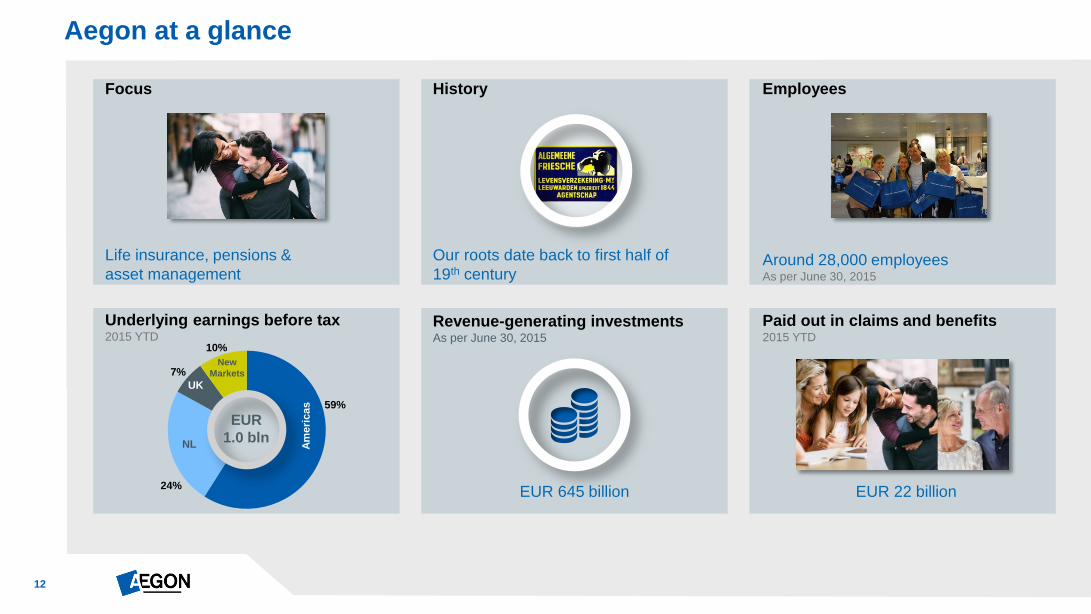
Aegon at a glance
Focus
Life insurance, pensions &
asset management
Our roots date back to first half of
19th century
History Employees
Around 28,000 employees As per June 30, 2015
Underlying earnings before tax 2015 YTD
59%
24%
7%
10%
Am
eri
cas
NL
UK
New
Markets
EUR
1.0 bln
Revenue-generating investments As per June 30, 2015
EUR 645 billion EUR 22 billion
Paid out in claims and benefits 2015 YTD
13
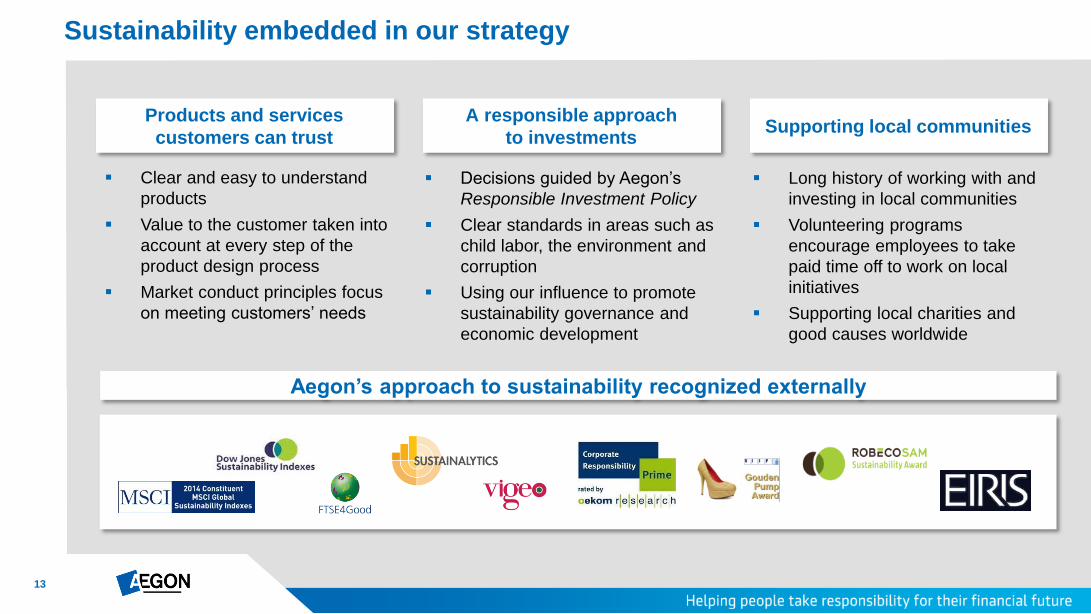
Sustainability embedded in our strategy
Clear and easy to understand
products
Value to the customer taken into
account at every step of the
product design process
Market conduct principles focus
on meeting customers’ needs
Decisions guided by Aegon’s
Responsible Investment Policy
Clear standards in areas such as
child labor, the environment and
corruption
Using our influence to promote
sustainability governance and
economic development
Long history of working with and
investing in local communities
Volunteering programs
encourage employees to take
paid time off to work on local
initiatives
Supporting local charities and
good causes worldwide
Aegon’s approach to sustainability recognized externally
Products and services
customers can trust
A responsible approach
to investments Supporting local communities
14
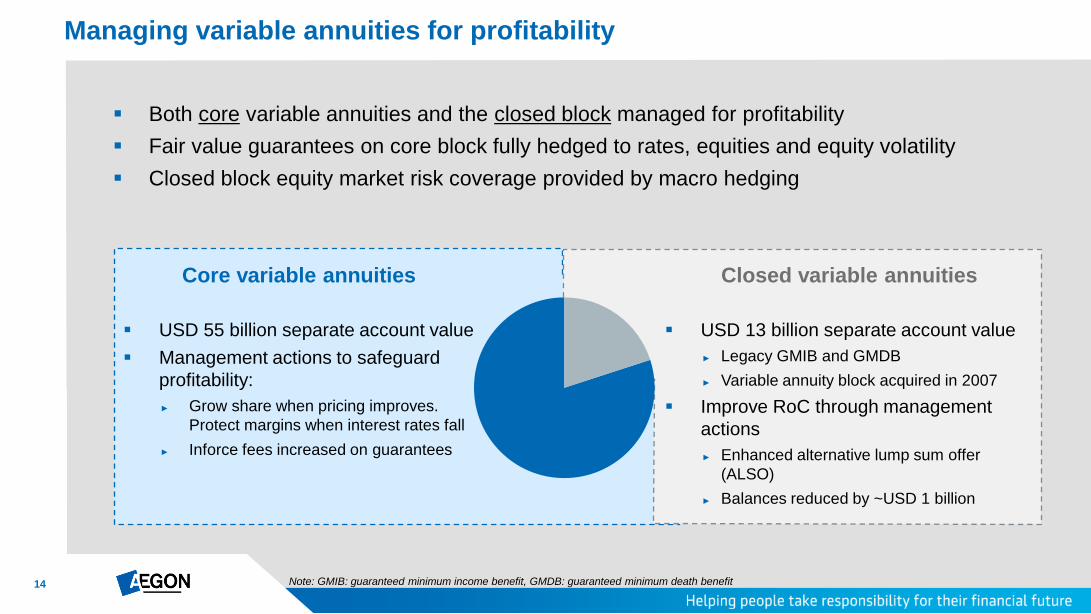
Both core variable annuities and the closed block managed for profitability
Fair value guarantees on core block fully hedged to rates, equities and equity volatility
Closed block equity market risk coverage provided by macro hedging
Managing variable annuities for profitability
Core variable annuities
USD 55 billion separate account value
Management actions to safeguard
profitability:
► Grow share when pricing improves.
Protect margins when interest rates fall
► Inforce fees increased on guarantees
Closed variable annuities
USD 13 billion separate account value
► Legacy GMIB and GMDB
► Variable annuity block acquired in 2007
Improve RoC through management
actions
► Enhanced alternative lump sum offer
(ALSO)
► Balances reduced by ~USD 1 billion
Note: GMIB: guaranteed minimum income benefit, GMDB: guaranteed minimum death benefit
15
62 51
62
Q2 14 Q1 15 Q2 15
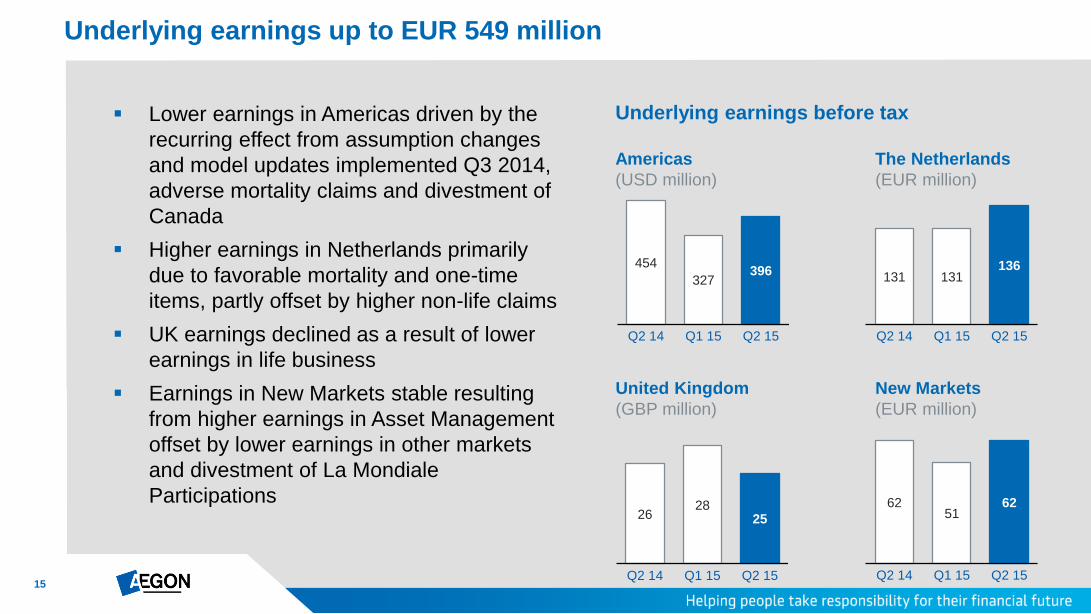
Lower earnings in Americas driven by the
recurring effect from assumption changes
and model updates implemented Q3 2014,
adverse mortality claims and divestment of
Canada
Higher earnings in Netherlands primarily
due to favorable mortality and one-time
items, partly offset by higher non-life claims
UK earnings declined as a result of lower
earnings in life business
Earnings in New Markets stable resulting
from higher earnings in Asset Management
offset by lower earnings in other markets
and divestment of La Mondiale
Participations
Underlying earnings up to EUR 549 million
Americas
(USD million)
United Kingdom
(GBP million)
New Markets
(EUR million)
The Netherlands
(EUR million)
131 131 136
Q2 14 Q1 15 Q2 15
454
327 396
Q2 14 Q1 15 Q2 15
26 28
25
Q2 14 Q1 15 Q2 15
Underlying earnings before tax
16
Underlyingearnings before tax
Q2 15
Fair value items Realized gainson investments
Impairmentcharges
Other charges Run-off businesses Income tax Net incomeQ2 15
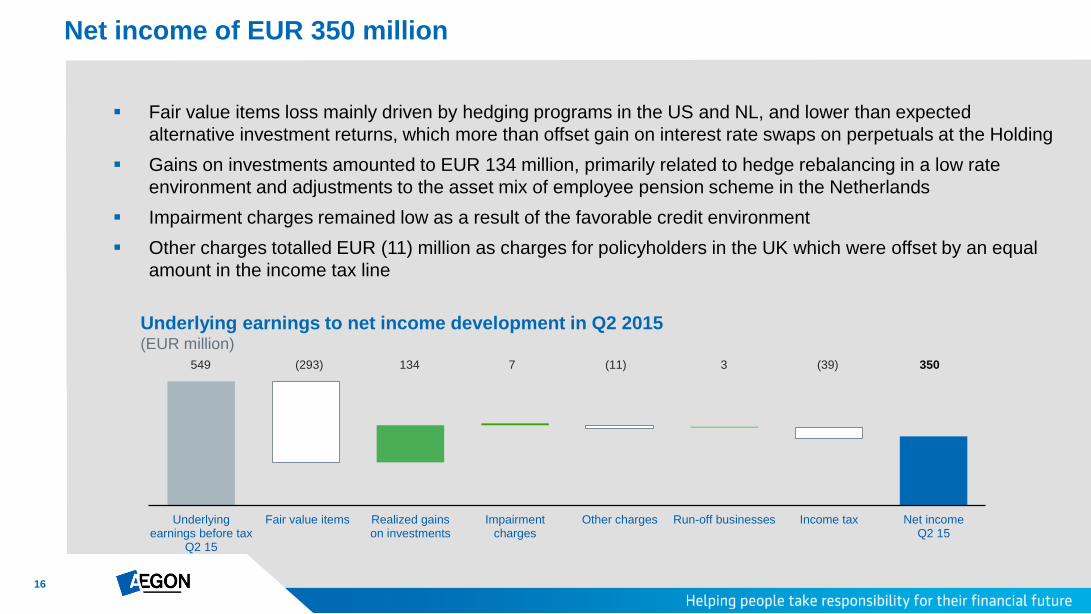
Fair value items loss mainly driven by hedging programs in the US and NL, and lower than expected
alternative investment returns, which more than offset gain on interest rate swaps on perpetuals at the Holding
Gains on investments amounted to EUR 134 million, primarily related to hedge rebalancing in a low rate
environment and adjustments to the asset mix of employee pension scheme in the Netherlands
Impairment charges remained low as a result of the favorable credit environment
Other charges totalled EUR (11) million as charges for policyholders in the UK which were offset by an equal
amount in the income tax line
Net income of EUR 350 million
549 (293) 134 7 (11) 3 (39) 350
Underlying earnings to net income development in Q2 2015 (EUR million)
17
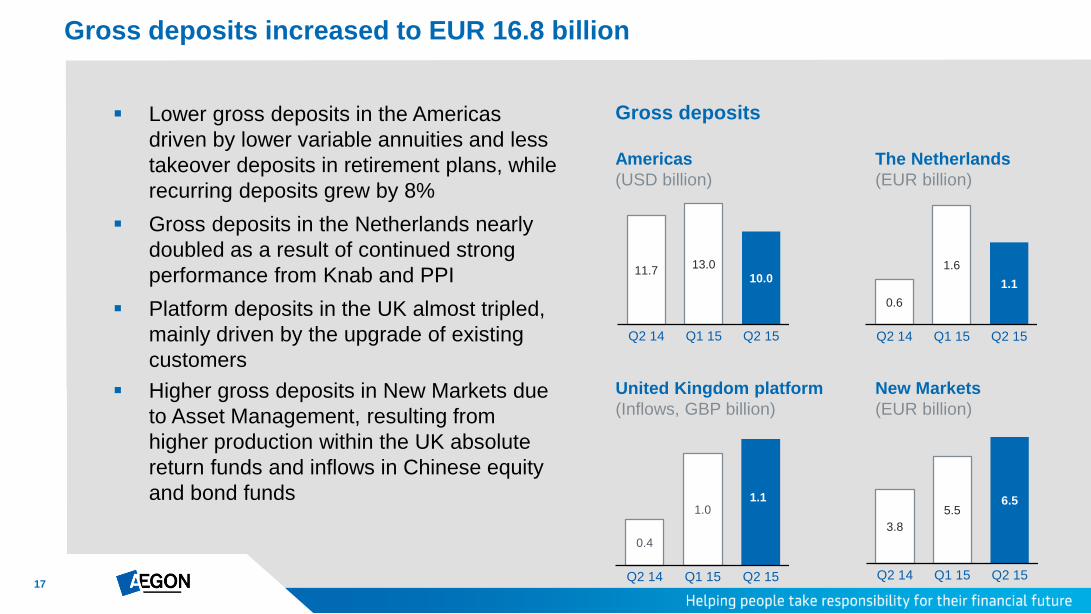
Lower gross deposits in the Americas
driven by lower variable annuities and less
takeover deposits in retirement plans, while
recurring deposits grew by 8%
Gross deposits in the Netherlands nearly
doubled as a result of continued strong
performance from Knab and PPI
Platform deposits in the UK almost tripled,
mainly driven by the upgrade of existing
customers
Higher gross deposits in New Markets due
to Asset Management, resulting from
higher production within the UK absolute
return funds and inflows in Chinese equity
and bond funds
Gross deposits increased to EUR 16.8 billion
Americas
(USD billion)
United Kingdom platform
(Inflows, GBP billion)
New Markets
(EUR billion)
The Netherlands
(EUR billion)
Gross deposits
0.6
1.6
1.1
Q2 14 Q1 15 Q2 15
0.4
1.0 1.1
Q2 14 Q1 15 Q2 15
11.7 13.0
10.0
Q2 14 Q1 15 Q2 15
3.8
5.5 6.5
Q2 14 Q1 15 Q2 15
18
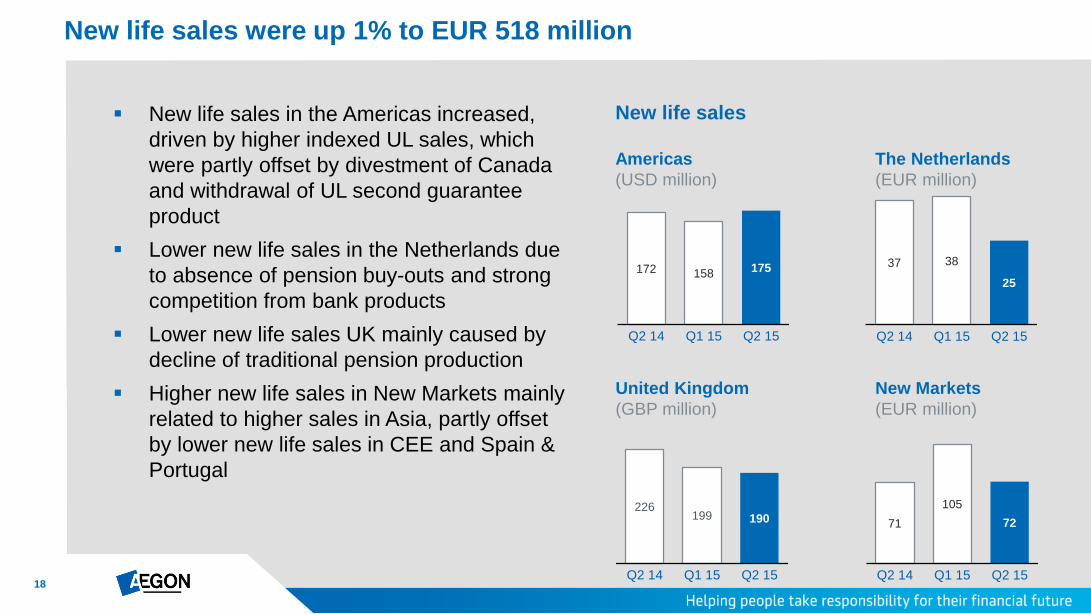
New life sales in the Americas increased,
driven by higher indexed UL sales, which
were partly offset by divestment of Canada
and withdrawal of UL second guarantee
product
Lower new life sales in the Netherlands due
to absence of pension buy-outs and strong
competition from bank products
Lower new life sales UK mainly caused by
decline of traditional pension production
Higher new life sales in New Markets mainly
related to higher sales in Asia, partly offset
by lower new life sales in CEE and Spain &
Portugal
New life sales were up 1% to EUR 518 million
Americas
(USD million)
United Kingdom
(GBP million)
New Markets
(EUR million)
The Netherlands
(EUR million)
New life sales
37 38
25
Q2 14 Q1 15 Q2 15
172 158 175
Q2 14 Q1 15 Q2 15
226 199 190
Q2 14 Q1 15 Q2 15
71
105
72
Q2 14 Q1 15 Q2 15
19
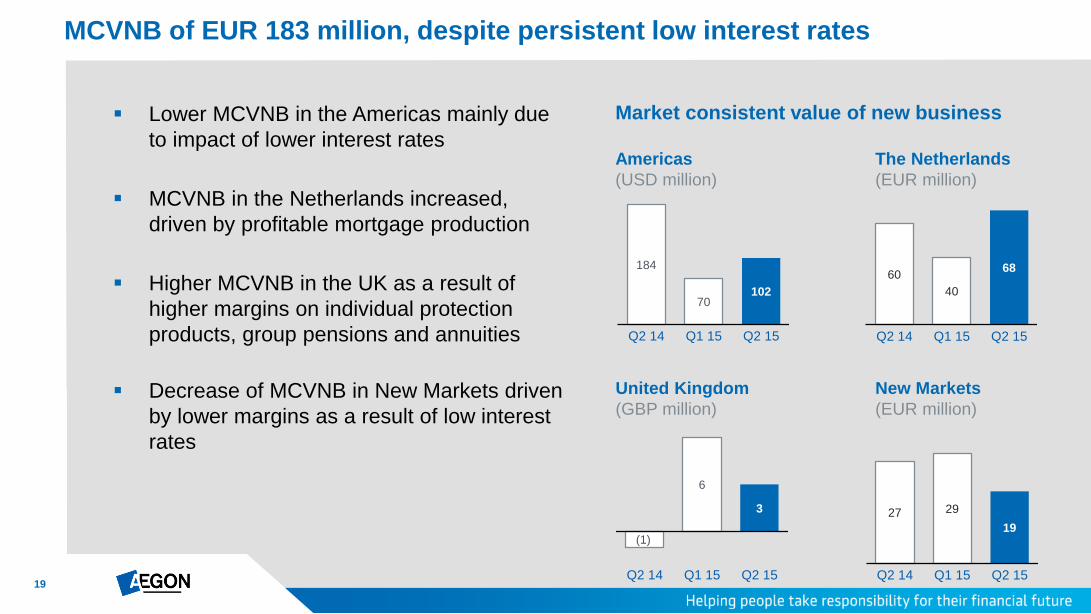
Lower MCVNB in the Americas mainly due
to impact of lower interest rates
MCVNB in the Netherlands increased,
driven by profitable mortgage production
Higher MCVNB in the UK as a result of
higher margins on individual protection
products, group pensions and annuities
Decrease of MCVNB in New Markets driven
by lower margins as a result of low interest
rates
MCVNB of EUR 183 million, despite persistent low interest rates
Americas
(USD million)
United Kingdom
(GBP million)
New Markets
(EUR million)
The Netherlands
(EUR million)
Market consistent value of new business
60
40
68
Q2 14 Q1 15 Q2 15
184
70 102
Q2 14 Q1 15 Q2 15
(1)
6
3
Q2 14 Q1 15 Q2 15
27 29
19
Q2 14 Q1 15 Q2 15
20
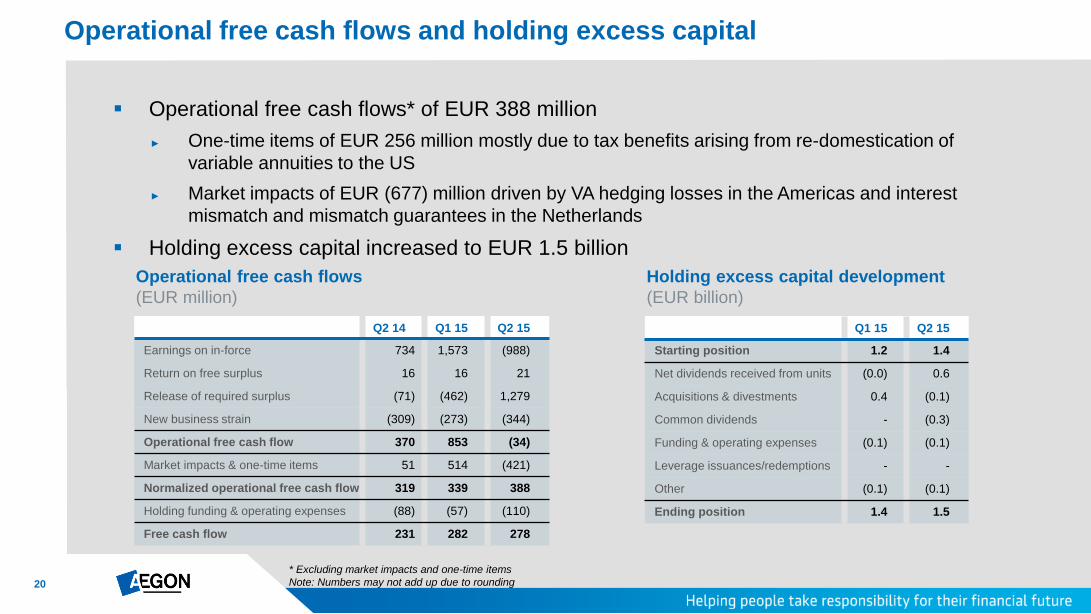
Operational free cash flows* of EUR 388 million
► One-time items of EUR 256 million mostly due to tax benefits arising from re-domestication of
variable annuities to the US
► Market impacts of EUR (677) million driven by VA hedging losses in the Americas and interest
mismatch and mismatch guarantees in the Netherlands
Holding excess capital increased to EUR 1.5 billion
Operational free cash flows and holding excess capital
Q2 14 Q1 15 Q2 15
Earnings on in-force 734 1,573 (988)
Return on free surplus 16 16 21
Release of required surplus (71) (462) 1,279
New business strain (309) (273) (344)
Operational free cash flow 370 853 (34)
Market impacts & one-time items 51 514 (421)
Normalized operational free cash flow 319 339 388
Holding funding & operating expenses (88) (57) (110)
Free cash flow 231 282 278
Q1 15 Q2 15
Starting position 1.2 1.4
Net dividends received from units (0.0) 0.6
Acquisitions & divestments 0.4 (0.1)
Common dividends - (0.3)
Funding & operating expenses (0.1) (0.1)
Leverage issuances/redemptions - -
Other (0.1) (0.1)
Ending position 1.4 1.5
Holding excess capital development
(EUR billion)
Operational free cash flows
(EUR million)
* Excluding market impacts and one-time items
Note: Numbers may not add up due to rounding
21
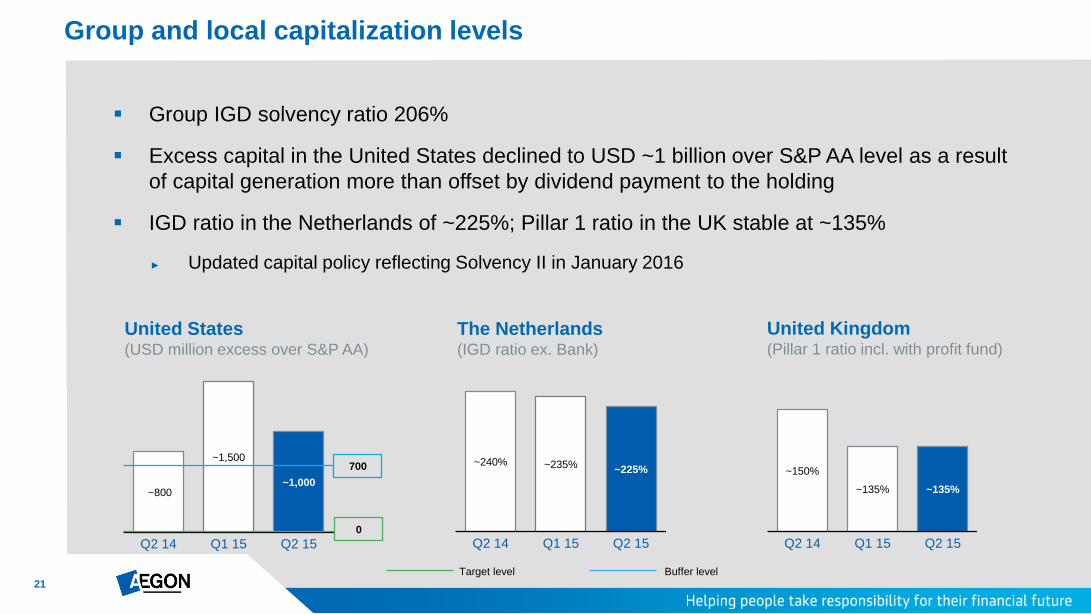
Group IGD solvency ratio 206%
Excess capital in the United States declined to USD ~1 billion over S&P AA level as a result
of capital generation more than offset by dividend payment to the holding
IGD ratio in the Netherlands of ~225%; Pillar 1 ratio in the UK stable at ~135%
► Updated capital policy reflecting Solvency II in January 2016
Group and local capitalization levels
United Kingdom (Pillar 1 ratio incl. with profit fund)
United States (USD million excess over S&P AA)
~150%
~135% ~135%
Q2 14 Q1 15 Q2 15
Target level Buffer level
700
~800
~1,500
~1,000
Q2 14 Q1 15 Q2 15
The Netherlands (IGD ratio ex. Bank)
~240% ~235% ~225%
Q2 14 Q1 15 Q2 150
22
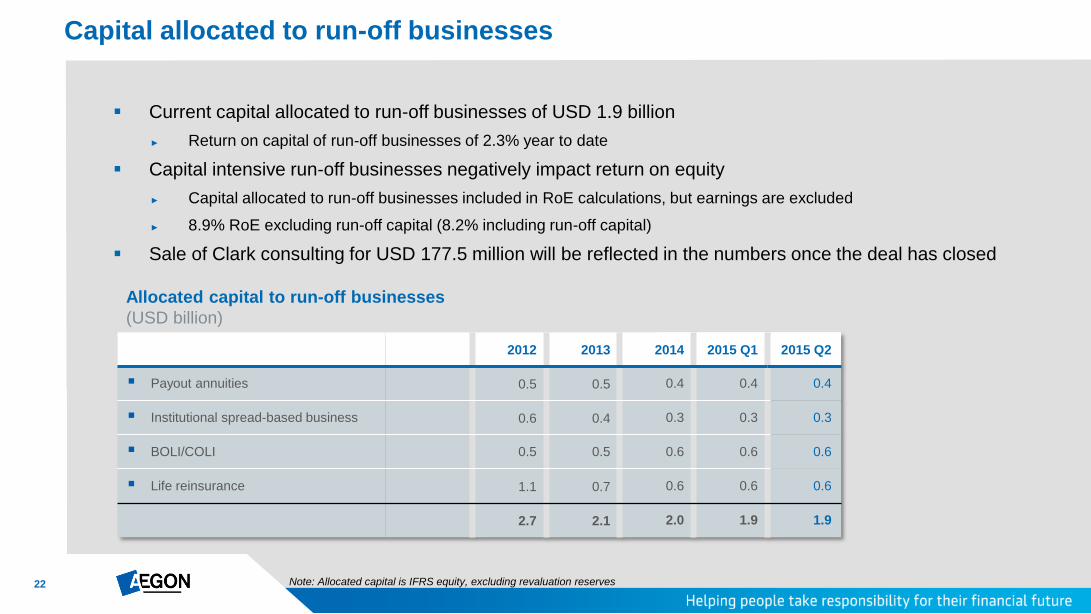
Current capital allocated to run-off businesses of USD 1.9 billion
► Return on capital of run-off businesses of 2.3% year to date
Capital intensive run-off businesses negatively impact return on equity
► Capital allocated to run-off businesses included in RoE calculations, but earnings are excluded
► 8.9% RoE excluding run-off capital (8.2% including run-off capital)
Sale of Clark consulting for USD 177.5 million will be reflected in the numbers once the deal has closed
Capital allocated to run-off businesses
2012 2013 2014 2015 Q1 2015 Q2
Payout annuities 0.5 0.5 0.4 0.4 0.4
Institutional spread-based business 0.6 0.4 0.3 0.3 0.3
BOLI/COLI 0.5 0.5 0.6 0.6 0.6
Life reinsurance 1.1 0.7 0.6 0.6 0.6
2.7 2.1 2.0 1.9 1.9
Note: Allocated capital is IFRS equity, excluding revaluation reserves
Allocated capital to run-off businesses
(USD billion)
23
11.7 13.0
10.0
Q2 14 Q1 15 Q2 15
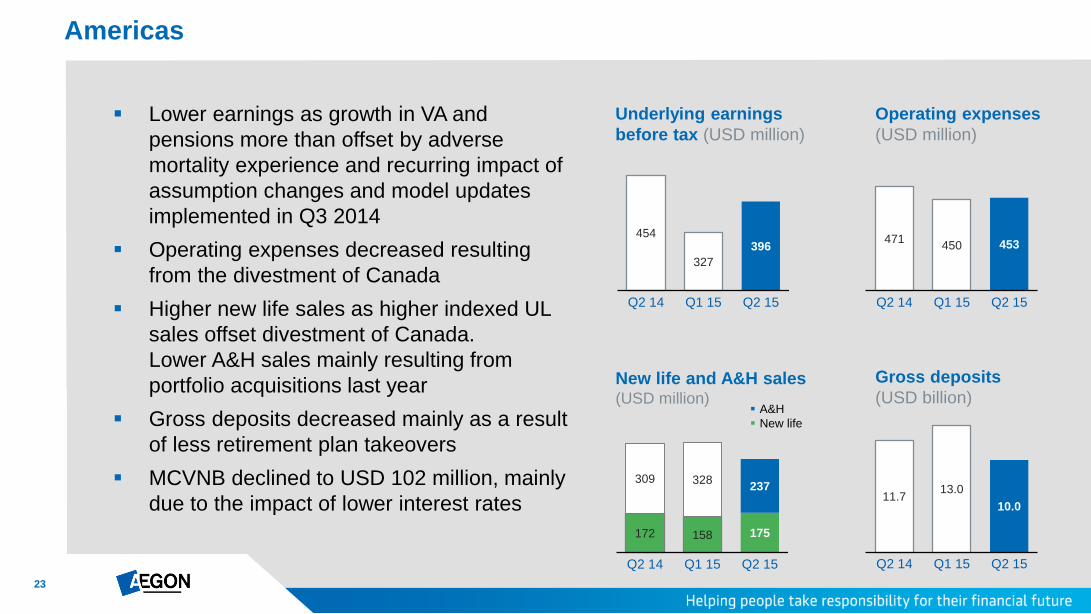
Lower earnings as growth in VA and
pensions more than offset by adverse
mortality experience and recurring impact of
assumption changes and model updates
implemented in Q3 2014
Operating expenses decreased resulting
from the divestment of Canada
Higher new life sales as higher indexed UL
sales offset divestment of Canada.
Lower A&H sales mainly resulting from
portfolio acquisitions last year
Gross deposits decreased mainly as a result
of less retirement plan takeovers
MCVNB declined to USD 102 million, mainly
due to the impact of lower interest rates
Americas
Underlying earnings
before tax (USD million)
Gross deposits
(USD billion)
Operating expenses
(USD million)
471 450 453
Q2 14 Q1 15 Q2 15
454
327
396
Q2 14 Q1 15 Q2 15
New life and A&H sales (USD million)
172 158 175
309 328 237
Q2 14 Q1 15 Q2 15
A&H
New life
24
0.6
1.6
1.1
Q2 14 Q1 15 Q2 15
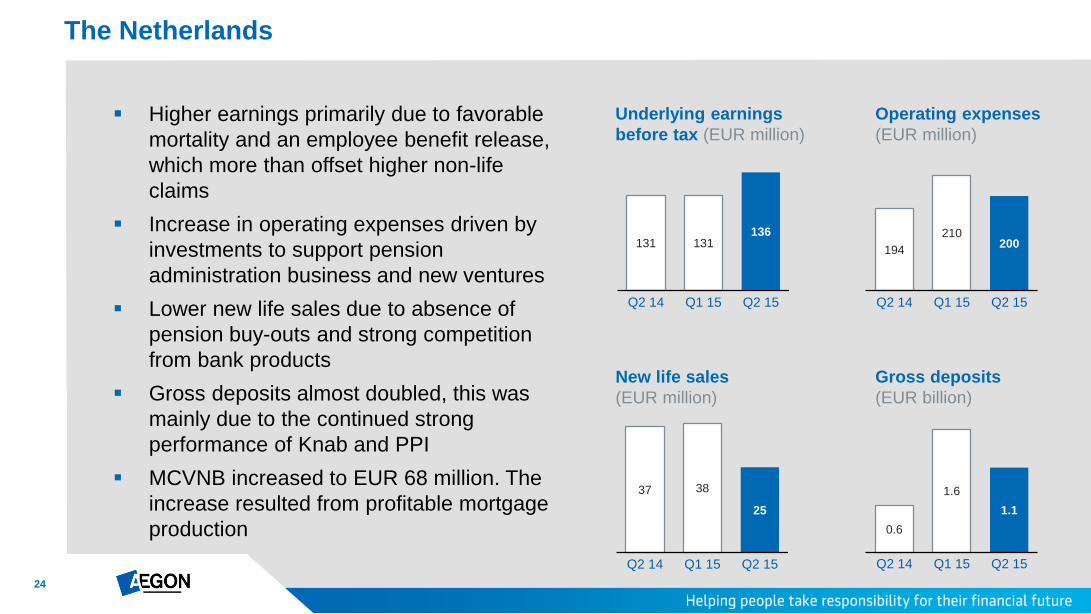
Higher earnings primarily due to favorable
mortality and an employee benefit release,
which more than offset higher non-life
claims
Increase in operating expenses driven by
investments to support pension
administration business and new ventures
Lower new life sales due to absence of
pension buy-outs and strong competition
from bank products
Gross deposits almost doubled, this was
mainly due to the continued strong
performance of Knab and PPI
MCVNB increased to EUR 68 million. The
increase resulted from profitable mortgage
production
The Netherlands
Underlying earnings
before tax (EUR million)
New life sales
(EUR million)
Gross deposits
(EUR billion)
Operating expenses
(EUR million)
194
210 200
Q2 14 Q1 15 Q2 15
131 131 136
Q2 14 Q1 15 Q2 15
37 38
25
Q2 14 Q1 15 Q2 15
25
0.4
1.0 1.1
Q2 14 Q1 15 Q2 15
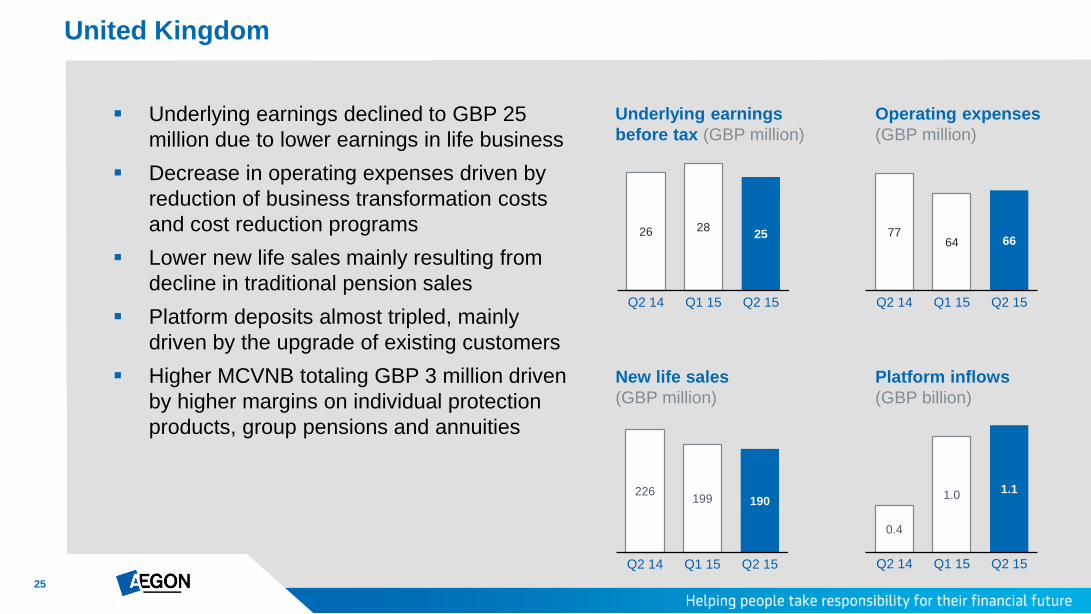
Underlying earnings declined to GBP 25
million due to lower earnings in life business
Decrease in operating expenses driven by
reduction of business transformation costs
and cost reduction programs
Lower new life sales mainly resulting from
decline in traditional pension sales
Platform deposits almost tripled, mainly
driven by the upgrade of existing customers
Higher MCVNB totaling GBP 3 million driven
by higher margins on individual protection
products, group pensions and annuities
United Kingdom
Underlying earnings
before tax (GBP million)
New life sales
(GBP million)
Platform inflows
(GBP billion)
Operating expenses
(GBP million)
77 64 66
Q2 14 Q1 15 Q2 15
26 28 25
Q2 14 Q1 15 Q2 15
226 199 190
Q2 14 Q1 15 Q2 15
26
3.8
5.5 6.5
Q2 14 Q1 15 Q2 15
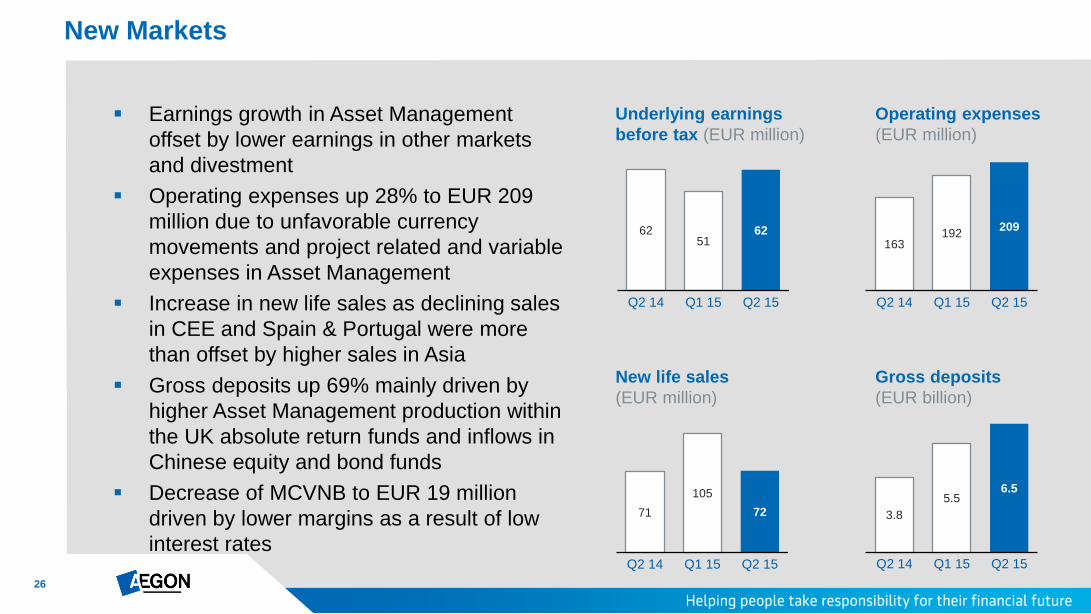
Earnings growth in Asset Management
offset by lower earnings in other markets
and divestment
Operating expenses up 28% to EUR 209
million due to unfavorable currency
movements and project related and variable
expenses in Asset Management
Increase in new life sales as declining sales
in CEE and Spain & Portugal were more
than offset by higher sales in Asia
Gross deposits up 69% mainly driven by
higher Asset Management production within
the UK absolute return funds and inflows in
Chinese equity and bond funds
Decrease of MCVNB to EUR 19 million
driven by lower margins as a result of low
interest rates
New Markets
Underlying earnings
before tax (EUR million)
New life sales
(EUR million)
Gross deposits
(EUR billion)
Operating expenses
(EUR million)
163 192
209
Q2 14 Q1 15 Q2 15
62 51
62
Q2 14 Q1 15 Q2 15
71
105
72
Q2 14 Q1 15 Q2 15
27
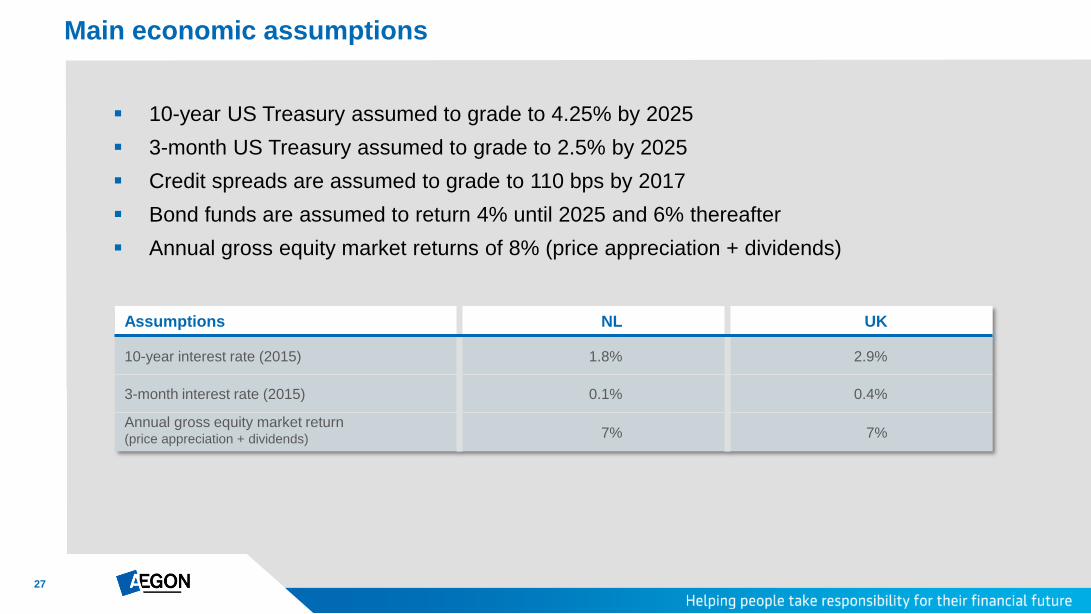
10-year US Treasury assumed to grade to 4.25% by 2025
3-month US Treasury assumed to grade to 2.5% by 2025
Credit spreads are assumed to grade to 110 bps by 2017
Bond funds are assumed to return 4% until 2025 and 6% thereafter
Annual gross equity market returns of 8% (price appreciation + dividends)
Main economic assumptions
Assumptions NL UK
10-year interest rate (2015) 1.8% 2.9%
3-month interest rate (2015) 0.1% 0.4%
Annual gross equity market return (price appreciation + dividends) 7% 7%
28
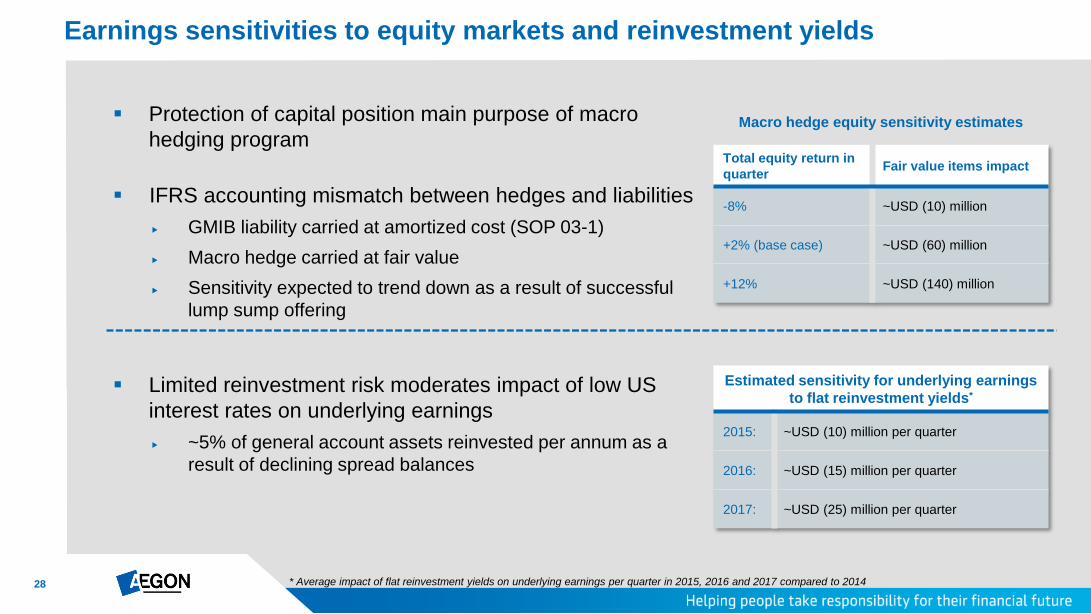
Earnings sensitivities to equity markets and reinvestment yields
Protection of capital position main purpose of macro
hedging program
IFRS accounting mismatch between hedges and liabilities
GMIB liability carried at amortized cost (SOP 03-1)
Macro hedge carried at fair value
Sensitivity expected to trend down as a result of successful
lump sump offering
Macro hedge equity sensitivity estimates
Total equity return in
quarter Fair value items impact
-8% ~USD (10) million
+2% (base case) ~USD (60) million
+12% ~USD (140) million
Limited reinvestment risk moderates impact of low US
interest rates on underlying earnings
~5% of general account assets reinvested per annum as a
result of declining spread balances
Estimated sensitivity for underlying earnings
to flat reinvestment yields*
2015: ~USD (10) million per quarter
2016: ~USD (15) million per quarter
2017: ~USD (25) million per quarter
* Average impact of flat reinvestment yields on underlying earnings per quarter in 2015, 2016 and 2017 compared to 2014
29
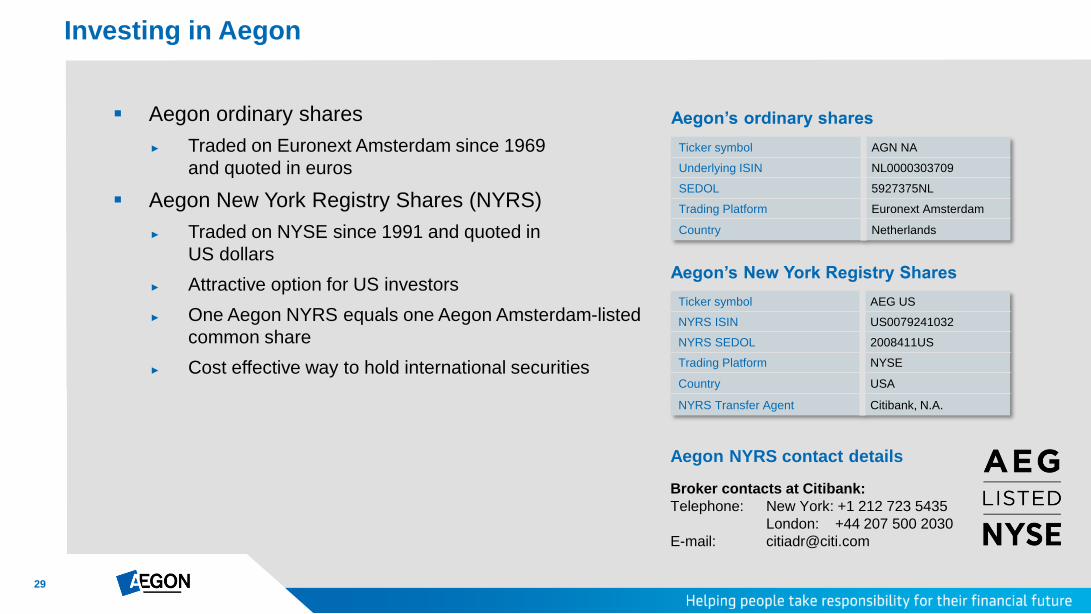
Aegon ordinary shares
► Traded on Euronext Amsterdam since 1969
and quoted in euros
Aegon New York Registry Shares (NYRS)
► Traded on NYSE since 1991 and quoted in
US dollars
► Attractive option for US investors
► One Aegon NYRS equals one Aegon Amsterdam-listed
common share
► Cost effective way to hold international securities
Investing in Aegon
Aegon’s ordinary shares
Aegon’s New York Registry Shares
Ticker symbol AGN NA
Underlying ISIN NL0000303709
SEDOL 5927375NL
Trading Platform Euronext Amsterdam
Country Netherlands
Aegon NYRS contact details
Broker contacts at Citibank:
Telephone: New York: +1 212 723 5435
London: +44 207 500 2030
E-mail: [email protected]
Ticker symbol AEG US
NYRS ISIN US0079241032
NYRS SEDOL 2008411US
Trading Platform NYSE
Country USA
NYRS Transfer Agent Citibank, N.A.

30
Upcoming events
September Morgan Stanley conference
Dublin
September 3, 2015
ING Benelux conference
London
September 10, 2015
KBW insurance conference
London
September 16, 2015
Kepler Cheuvreux Autumn
conference
Paris
September 18, 2015
Bank of America Merrill
Lynch conference
London
September 30, 2015
31
Cautionary note regarding non-IFRS measures
This document includes the following non-IFRS financial measures: underlying earnings before tax, income tax, income before tax and market consistent value of new business. These non-IFRS measures are calculated by consolidating on a proportionate basis Aegon’s joint ventures and
associated companies. The reconciliation of these measures, except for market consistent value of new business, to the most comparable IFRS measure is provided in note 3 ‘Segment information’ of Aegon’s Condensed Consolidated Interim Financial Statements. Market consistent value of
new business is not based on IFRS, which are used to report Aegon’s primary financial statements and should not be viewed as a substitute for IFRS financial measures. Aegon may define and calculate market consistent value of new business differently than other companies. Aegon believes
that these non-IFRS measures, together with the IFRS information, provide meaningful information about the underlying operating results of Aegon’s business including insight into the financial measures that senior management uses in managing the business. In addition, return on equity is a
ratio using a non-GAAP measure and is calculated by dividing the net underlying earnings after cost of leverage by the average shareholders’ equity excluding the preferred shares, the revaluation reserve and the reserves related to defined benefit plans.
Local currencies and constant currency exchange rates
This document contains certain information about Aegon’s results, financial condition and revenue generating investments presented in USD for the Americas and GBP for the United Kingdom, because those businesses operate and are managed primarily in those currencies. Certain
comparative information presented on a constant currency basis eliminates the effects of changes in currency exchange rates. None of this information is a substitute for or superior to financial information about Aegon presented in EUR, which is the currency of Aegon’s primary financial
statements.
Forward-looking statements
The statements contained in this document that are not historical facts are forward-looking statements as defined in the US Private Securities Litigation Reform Act of 1995. The following are words that identify such forward-looking statements: aim, believe, estimate, target, intend, may,
expect, anticipate, predict, project, counting on, plan, continue, want, forecast, goal, should, would, is confident, will, and similar expressions as they relate to Aegon. These statements are not guarantees of future performance and involve risks, uncertainties and assumptions that are difficult to
predict. Aegon undertakes no obligation to publicly update or revise any forward-looking statements. Readers are cautioned not to place undue reliance on these forward-looking statements, which merely reflect company expectations at the time of writing. Actual results may differ materially
from expectations conveyed in forward-looking statements due to changes caused by various risks and uncertainties. Such risks and uncertainties include but are not limited to the following:
Changes in general economic conditions, particularly in the United States, the Netherlands and the United Kingdom;
Changes in the performance of financial markets, including emerging markets, such as with regard to:
► The frequency and severity of defaults by issuers in Aegon’s fixed income investment portfolios;
► The effects of corporate bankruptcies and/or accounting restatements on the financial markets and the resulting decline in the value of equity and debt securities Aegon holds; and
► The effects of declining creditworthiness of certain private sector securities and the resulting decline in the value of sovereign exposure that Aegon holds;
Changes in the performance of Aegon’s investment portfolio and decline in ratings of Aegon’s counterparties;
Consequences of a potential (partial) break-up of the euro;
The frequency and severity of insured loss events;
Changes affecting longevity, mortality, morbidity, persistence and other factors that may impact the profitability of Aegon’s insurance products;
Reinsurers to whom Aegon has ceded significant underwriting risks may fail to meet their obligations;
Changes affecting interest rate levels and continuing low or rapidly changing interest rate levels;
Changes affecting currency exchange rates, in particular the EUR/USD and EUR/GBP exchange rates;
Changes in the availability of, and costs associated with, liquidity sources such as bank and capital markets funding, as well as conditions in the credit markets in general such as changes in borrower and counterparty creditworthiness;
Increasing levels of competition in the United States, the Netherlands, the United Kingdom and emerging markets;
Changes in laws and regulations, particularly those affecting Aegon’s operations, ability to hire and retain key personnel, the products Aegon sells, and the attractiveness of certain products to its consumers;
Regulatory changes relating to the insurance industry in the jurisdictions in which Aegon operates;
Changes in customer behavior and public opinion in general related to, among other things, the type of products also Aegon sells, including legal, regulatory or commercial necessity to meet changing customer expectations;
Acts of God, acts of terrorism, acts of war and pandemics;
Changes in the policies of central banks and/or governments;
Lowering of one or more of Aegon’s debt ratings issued by recognized rating organizations and the adverse impact such action may have on Aegon’s ability to raise capital and on its liquidity and financial condition;
Lowering of one or more of insurer financial strength ratings of Aegon’s insurance subsidiaries and the adverse impact such action may have on the premium writings, policy retention, profitability and liquidity of its insurance subsidiaries;
The effect of the European Union’s Solvency II requirements and other regulations in other jurisdictions affecting the capital Aegon is required to maintain;
Litigation or regulatory action that could require Aegon to pay significant damages or change the way Aegon does business;
As Aegon’s operations support complex transactions and are highly dependent on the proper functioning of information technology, a computer system failure or security breach may disrupt Aegon’s business, damage its reputation and adversely affect its results of operations, financial
condition and cash flows;
Customer responsiveness to both new products and distribution channels;
Competitive, legal, regulatory, or tax changes that affect profitability, the distribution cost of or demand for Aegon’s products;
Changes in accounting regulations and policies or a change by Aegon in applying such regulations and policies, voluntarily or otherwise, may affect Aegon’s reported results and shareholders’ equity;
The impact of acquisitions and divestitures, restructurings, product withdrawals and other unusual items, including Aegon’s ability to integrate acquisitions and to obtain the anticipated results and synergies from acquisitions;
Catastrophic events, either manmade or by nature, could result in material losses and significantly interrupt Aegon’s business; and
Aegon’s failure to achieve anticipated levels of earnings or operational efficiencies as well as other cost saving and excess capital and leverage ratio management initiatives.
Further details of potential risks and uncertainties affecting Aegon are described in its filings with the Netherlands Authority for the Financial Markets and the US Securities and Exchange Commission, including the Annual Report. These forward-looking statements speak only as of the date of
this document. Except as required by any applicable law or regulation, Aegon expressly disclaims any obligation or undertaking to release publicly any updates or revisions to any forward-looking statements contained herein to reflect any change in Aegon’s expectations with regard thereto or
any change in events, conditions or circumstances on which any such statement is based.
Disclaimers