adverse impacts of drought - agecon searchageconsearch.umn.edu/bitstream/27974/1/02010009.pdf ·...
TRANSCRIPT


ADVERSE IMPACTS OF DROUGHT ON CROPS AND CROP PRODUCERS IN THE WEST
James Johnson and Vince Smith Montana State University
Department of Agricultural Economics and Economics Introduction
Drought often creates economic and financial difficulties for agricultural producers. Drought that persists for several years can create substantial and devastating agronomic difficulties and genuine economic hardship for agricultural producers and agriculturally-based businesses in rural communities. Agricultural producers experience crop production losses and concomitant losses in revenues from crop sales. Upstream and downstream, agribusinesses experience reductions in the demand for agricultural inputs such as fertilizer and machinery and reductions in throughput in grain and other crop handling facilities. Other rural businesses also face declines in the need for their products.
Several areas of Montana have experienced extensive and persistent drought during the four-year period 1998 through 2001 that adversely affected farm revenues and economic activity in rural communities. Estimating the size and scope of these adverse economic effects is a real challenge to economists. It requires data that is sometimes difficult to obtain. In addition, accurately assessing the net effects of drought on farm incomes also requires the economist to take account of the consequences of permanent government programs such as crop insurance and counter-cyclical payments that are designed to offset yield and/or revenue shortfalls and ad hoc programs that compensate for crop yield losses due to natural disaster.
We use publicly-available National Agricultural Statistics Service (NASS) data to qualitatively evaluate the impacts of drought on crop producer decisions and crop production. Then we briefly describe several public programs available to ameliorate to some degree the adverse financial impacts of drought on crop producers. Finally, we discuss the economic benefits that accrue to producers from these programs and the impacts of drought on certain program provisions. Assessing Drought Impacts Using NASS Data
Through state offices NASS provides estimates of acres planted and harvested, crop yields per acre, and total production for many crops. These data are usually available for major annually-planted crops at state, crop reporting district and county levels. Sometimes the data are further stratified by cropping practice (for example, following fallow versus planting on stubble).
To provide context for the usefulness of NASS data in assessing drought impacts, we examine wheat production in Montana’s North Central crop reporting district. This district is a major wheat producing area the shape of an isosceles triangle, referred to as the “Golden Triangle”, with its apex at Great Falls and other corners at Cut Bank and Chinook along the U.S.-Canadian border.
In Montana’s Golden Triangle the acres planted to all wheat declined by about seven percent between 1999 and 2000. Decisions to reduce planted acres were certainly affected by agronomic considerations such as soil moisture but were also linked to producer expectations about the prices of crops and major variable inputs. Wheat prices were low relative to historical norms during the 1998 through 2001 period. Careful econometric analysis would be needed to determine the extent to which decreases in planted acreage were influenced by changes in relative prices and other economic considerations.
2
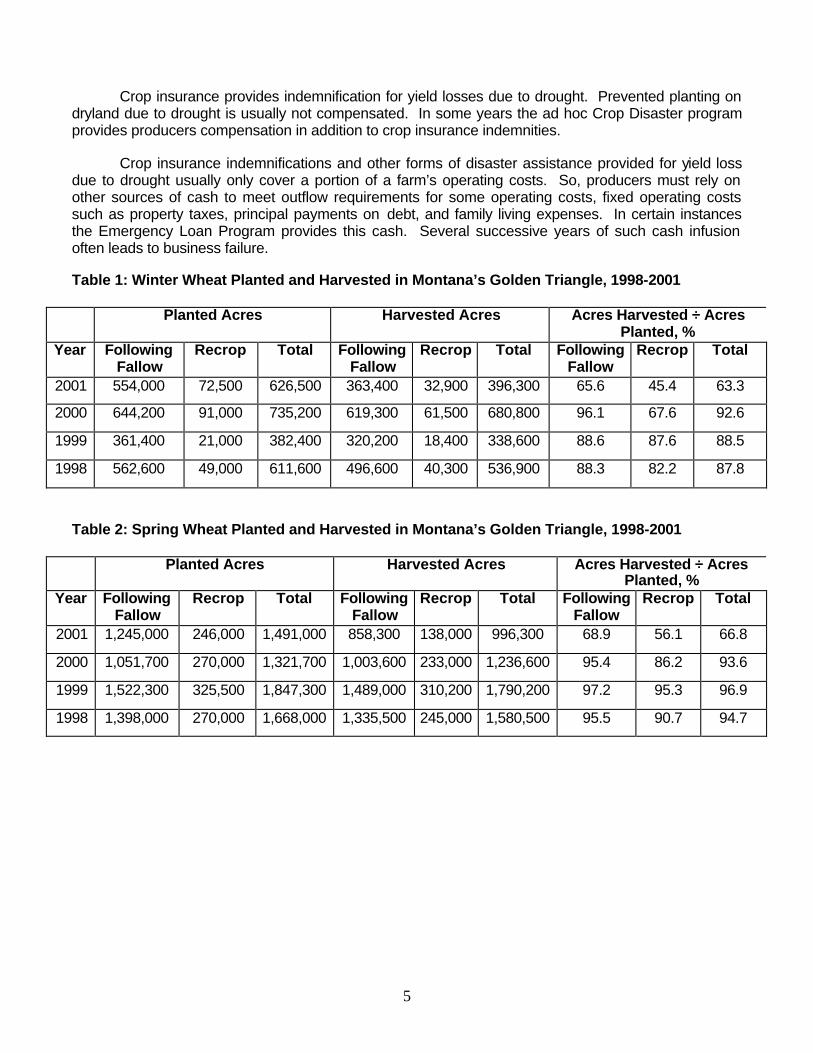
Where several classes of wheat can often be produced profitability under “average” weather/climatic conditions, the timing of precipitation events may influence the acres planted to each wheat class. In the Golden Triangle acres planted to winter wheat acres were 35 percent lower in the fall of 1998 than acres planted in the fall of 1997 (Table1). Producer planting decisions in these semi-arid areas depend in large part on soil moisture conditions at the time of planting and expectations of growing season precipitation. In the fall of 1998 soil moisture conditions were extremely poor in the Golden Triangle. The decline in acres planted resulted in less potential income from sales for producers and declines in sales for agribusiness suppliers.
In contrast to winter wheat, in 1999 the acres planted to spring wheat by Golden Triangle producers were greater than those in 1998 (Table 2). Soil moisture conditions had improved over the winter months and producers generally expected average growing season precipitation. The decline in acres of winter wheat- planted was partially offset by the increase in acres planted to spring wheat. Nevertheless, the total acres of all wheat planted declined.
Total production is determined by total acres planted, acres planted but not harvested, and yields on acres harvested. The proportion of all wheat acres planted that were harvested in 2001 was much lower than in preceding years. Only about 67 percent of winter and spring wheat acres planted on land fallowed in 2000 were harvested in 2001 and only about 50 percent of winter and spring wheat acres planted back into stubble (recrop) were harvested in 2001 (Tables 1 and 2). Growing season precipitation was well below average. In the three previous growing seasons 96 percent of spring wheat planted on fallow and 91 percent of spring wheat planted into stubble was harvested (Table 2). Acres of wheat planted but not harvested represent abandoned acres and a total loss in grain production. Producers gross revenues from sales are reduced and agribusinesses and firms such as grain merchandisers likely suffer gross income reductions because of lower volumes handled.
Total production losses are also affected by poor yields on the acres that are harvested. Crop year 2001 winter and spring wheat yields in the Golden Triangle were relatively low compared to immediately previous years, especially for wheat produced on land previously fallowed. Sales revenues of wheat producers and agribusinesses that handle grain were adversely impacted.
These data are somewhat useful ex post in tracing the aggregate of producer choices relative to planting and harvesting decisions and crop production.
Percentage shifts at the state-level in acres planted and harvested and percentage changes in yields due to drought are generally lower than at the crop reporting district level. This indicates, among other things, that drought is often not state-wide but concentrated in certain crop reporting districts or counties. Most disaster-related declarations are made at the county level and the NASS county data appear useful in administering these disaster programs. Variation in acres planted and harvested, and in crop yields, is usually greater at the county level than for the pertinent crop reporting district. Programs that Ameliorate Adverse Economic Impacts of Drought
Three programs that explicitly ameliorate the adverse impacts of drought are available to many crop producers: (1) crop insurance; (2) the Emergency Loan Program; and (3), the Crop Disaster Program.
Producers seeking to shift some of their production risk can often obtain crop insurance underwritten by the Federal Crop Insurance Corporation (FCIC). Multiple peril crop insurance is available in most counties for major annual and perennial crops and for minor land use crops in many counties from actuarial tables or from written agreements that provide individualized policies. Federally-subsidized crop revenue insurance products are available for some crops in some counties. The Farm Service Agency’s Noninsured Disaster Assistance Program provides some financial assistance for
3
producers of crops in counties where federally-subsidized crop insurance actuarial coverage does not exist.
The preponderance of federally-subsidized crop insurance coverage has been through individual farm yield policies offered to crop producers at reduced premium rates. Premium rates are relatively inexpensive to producers. Producers can usually elect a yield coverage of 50 to 75 percent of their actual proven history. Indemnifications occurs when actual yields fall below elected yield coverage levels.
The Farm Service Agency provides emergency loans at relatively low interest rates to help producers in declared disaster areas recover from production and physical losses due to drought and other natural disasters. To be eligible for the Emergency Loan Program a farm must have suffered at least a 30 percent loss in crop production and the producer must also have an acceptable credit history, be able to provide full collateral to secure the loan, and be able to demonstrate repayment ability.
Prior to the 2003 Agricultural Assistance Act, the most recent ad hoc disaster program was for the 2000 crop year. The Crop Disaster Program funded in the 2003 Act will provide payment to producers for qualifying losses to agricultural commodities due to damaging weather or related conditions. Losses in excess of 35 percent of a normal crop will be compensated. Producers may elect to receive payment for crop year 2001 or 2002, but will not be compensated for losses in both years.
The programs described above are designed to explicitly assist crop producers in event of drought. The commodity title of the Farm Security and Rural Investment Act of 2002 includes programs that not only augment farm income, but address some of the production and marketing risks of covered commodities. These are the marketing assistance loan, direct payment, and counter-cyclical payment programs. Benefits from Public Programs for Drought-Impacted Producers
In the Great Plains and West regions crop insurance payments are seldom made when a dryland producer is unable to plant due to drought. In large part this is because 60 to 80 percent of the annual precipitation occurs during the growing season in many production areas. Thus many producers plant even when soil moisture is limited at planting time.
Producers with individual farm yield multiple peril crop insurance receive indemnities when drought-impacted crop yields are less than their guaranteed yields. But crop insurance indemnifications do not fully replace total expected gross sales revenue under normal production conditions. These indemnities may cover operating costs incurred prior to the yield loss and make some contribution to the costs of fixed factors. However, under continuous drought a producer’s actual production history is likely to erode and result in a reduction in the income protection provided by crop insurance.
The erosion of a producer’s actual production history can be limited to some extent by the use of what FCIC labels "plug" yields. During years within the consecutive 10 years of yield history when a producer’s yield is less than 60 percent of the FCIC-specified transition yield, producers can request the use of the plug yields equal to 60 percent of the transition or “T’ yields. In many counties the T yield is similar to a NASS county yield. But T yields tend to be quite stationary; consequently, recent drought in a county often does not immediately impact T yields or diminish a producer’s plug yields.
In many years producers receive Crop Disaster Program payments in addition to crop insurance indemnities on yield losses due to drought. Under the current Crop Disaster Program a producer’s joint compensation from the sale of a partial crop, crop insurance indemnities, and disaster assistance will be limited to 95 percent of the revenues from sales under normal yield conditions. The concern
4
producers most often express is that disaster programs are ad hoc and depend on special legislation. But the only cost of disaster assistance to producers is the increase in their tax liabilities.
Crop insurance and disaster payments provide cash to a producer and increase the likelihood that input suppliers will be paid. But as one regional manager of a malting barley firm recently told us–“It is hard to make malt out of insurance and disaster payments”. As a group, product merchandisers, handlers and processors settle for less income and individual firms try to expand their service areas just as they did in response to implementation of the Conservation Reserve Program. Some agribusinesses will be permanently displaced. One long-term consequence of this process may be higher input prices and lower product prices for producers due to increased transportation costs.
The Farm Service Agency’s Emergency Loan Program provides relatively low interest rate loans to qualified borrowers impacted by drought. In the mid and late 1980s some producers used these loans subsequent to droughts and they never recovered. (Nominal interest rates during this era were several times current interest rates). Farmers did not recover from “terming” loans for operating costs and cash for family living expenses over a five to seven year amortization period. Problems with repayment of emergency loans are only exacerbated with successive droughts, shortfalls in income, and additional loans.
Drought impacts the marketing assistance loan program. If there is no production, there is no loan collateral. Furthermore, there is no opportunity to participate in this program’s income enhancement provisions during periods when cash prices are low relative to county loan rates by taking out a loan deficiency payment in lieu of a loan or settling a loan with a marketing loan gain.
There are no drought-related production risks for participants in an ongoing direct payment program. Direct payments in an ongoing program are totally decoupled from current production. Producers with the appropriate production history will receive direct payments with certainty if they sign up each year.
Drought during the 1998 through 2001 crop years may have impacted land owners who recently made crop acreage base decisions for covered commodities under the Farm Security and Rural Investment Act of 2002. Under these provisions producers were allowed to adjust acres bases for direct and counter-cyclical payments. Larger bases for the appropriate commodities could provide larger income transfers to those who share in the production and marketing risks for these commodities.
If drought reduced the number of acres planted to covered commodities in the 1998 through
2001 crop years relative to the existing base established under the prior statute, then a land owner might not have been able to improve the farm’s base acres for crops such as wheat, barley and corn or add base for soybeans and other oilseeds.
Producers were allowed to establish program yields for oilseeds for both the direct and counter-cyclical programs and improve yields for traditional program crops under the counter-cyclical program if they established new bases. Some producers used old yields for traditional program crops and drought-impacted oilseed yields for oilseeds.
Conclusions
Persistent drought can be devastating financially for agricultural producers and have substantial adverse economic impacts on agribusinesses.
NASS data permit ex post tracing of the aggregate of producer planting and harvesting decisions and yield performance. Higher levels of geographic aggregation can mask the adverse impacts of drought. Finally, publicly available data useful for tracing the adverse impacts of drought on agribusinesses are sparse.
5
Crop insurance provides indemnification for yield losses due to drought. Prevented planting on
dryland due to drought is usually not compensated. In some years the ad hoc Crop Disaster program provides producers compensation in addition to crop insurance indemnities.
Crop insurance indemnifications and other forms of disaster assistance provided for yield loss due to drought usually only cover a portion of a farm’s operating costs. So, producers must rely on other sources of cash to meet outflow requirements for some operating costs, fixed operating costs such as property taxes, principal payments on debt, and family living expenses. In certain instances the Emergency Loan Program provides this cash. Several successive years of such cash infusion often leads to business failure. Table 1: Winter Wheat Planted and Harvested in Montana’s Golden Triangle, 1998-2001
Planted Acres Harvested Acres Acres Harvested ÷ Acres Planted, %
Year Following Fallow
Recrop Total Following Fallow
Recrop Total Following Fallow
Recrop Total
2001 554,000 72,500 626,500 363,400 32,900 396,300 65.6 45.4 63.3
2000 644,200 91,000 735,200 619,300 61,500 680,800 96.1 67.6 92.6
1999 361,400 21,000 382,400 320,200 18,400 338,600 88.6 87.6 88.5
1998 562,600 49,000 611,600 496,600 40,300 536,900 88.3 82.2 87.8
Table 2: Spring Wheat Planted and Harvested in Montana’s Golden Triangle, 1998-2001
Planted Acres Harvested Acres Acres Harvested ÷ Acres Planted, %
Year Following Fallow
Recrop Total Following Fallow
Recrop Total Following Fallow
Recrop Total
2001 1,245,000 246,000 1,491,000 858,300 138,000 996,300 68.9 56.1 66.8
2000 1,051,700 270,000 1,321,700 1,003,600 233,000 1,236,600 95.4 86.2 93.6
1999 1,522,300 325,500 1,847,300 1,489,000 310,200 1,790,200 97.2 95.3 96.9
1998 1,398,000 270,000 1,668,000 1,335,500 245,000 1,580,500 95.5 90.7 94.7
