advanced technology to meet california's climate goals ... · advanced technology to meet...
TRANSCRIPT

Advanced Technology to Meet California's Climate Goals: Opportunities, Barriers &
Policy Solutions
A report of the California ETAAC Advanced Technology Sub-Group focusing on clean transportation, energy efficiency and renewable energy
and updating selected sections of the February 2008 ETAAC report.
FINAL December 14, 2009

The statements and conclusions in this Report are those of the Committee and not necessarily those of the California Air Resources Board. The mention of commercial products, their source, or their use in connection with material reported herein is not to be construed as actual or implied endorsement of
such products.

TABLE OF CONTENTS
Executive Summary……………………………………………….………… Page ES‐1 1. Introduction
1.1 The Need For Advanced Technology Development To Meet GHG Goals …………………………………………………………………………… Page 1‐2 1.2 Technology Development & Commercialization Challenges …... Page 1‐6 1.3 ETAAC Perspective on Technology Development and Deployment Challenges ……………………………………………..……….. Page 1‐8 1.4 Example Programs to Overcome Barriers to Advanced Technology Development and Deployment…………… Page 1‐12
2. Economic Opportunities and Challenges 2.1 Advanced Technology Development and Deployment Economic
Opportunities……………………………………………………………………….Page 2‐2 2.2 Policy Recommendations On Facilitating Manufacturing’s Role In Advanced Technology Development and Deployment ……….Page 2‐6
3. Innovative Financing 3.1 Financial Strategies to Support Emerging Clean Energy Technologies ………………………………………………………………………. Page 3‐2 3.2 Mortgage and Home‐Equity Financing ………………………………….. Page 3‐4 3.3 Financial Aggregation Strategies to Support Energy Efficiency: Municipal, Utility, and Private financing ………………………………. Page 3‐5
4. Renewable Energy 4.1 General Renewable Technology Issues ………………………………… Page 4‐2 4.2 Technology‐specific Issues ……………………………………………….…. Page 4‐7
5. Energy Efficiency 5.1 Existing Policy Framework ………………………………………………….. Page 5‐2 5.2 Promising New Technologies for Enhanced Energy Use and GHG Reductions ………………………………………………………………….. Page 5‐3
6. Transportation 6.1 Near‐Term and Longer‐Term Strategies for Achieving Dramatic Light Duty Vehicle GHG Reduction Goals ………………………………. Page 6‐2 6.2 Near‐Term and Longer‐Term Strategies for Achieving Medium and Heavy Duty Vehicle Emission Reductions ………………………. Page 6‐9 6.3 Advanced Biofuels ……………………………………………………………….. Page 6‐11

APPENDICES Appendix I: Summary Table of February 2008 ETAAC Report Recommendations
Related to Advanced Technology Development Appendix II: Inventory of Advanced Technology Development Programs Related to Climate Change Appendix III: Biofuels Pathways Appendix IV: Glossary Appendix V: Committee Member Biographies Appendix VI: DOE Recovery Act Table

ETAAC Advanced Technology steering committee members:
Alan Lloyd, Chair
Dan Adler Chris Busch Jim Hawley
Dorothy Rothrock Hank Ryan
Jan SmutnyJones Fong Wan
Jonathan Weisgall Rick Zalesky
This final report reflects consensus views when consensus was reached, and reflects a range of differing pointsofviews when there was general support that fell short of a consensus. Each recommendation may not necessarily reflect the views of every ETAAC member. Lead technical staff: Ed Pike, International Council on Clean Transportation Lead CARB staff: Steve Church Acknowledgements: The ETAAC Advanced Technology group would like to thank and acknowledge the following contributors - Anil Baral, Kate Blumberg, Susan Buller, Morrow Cater, Matthew Crenson, Jamie Hall, Sarah Henry, Bob Hinkle, Sherry Hu, Roland Hwang, John Katz, Hal LaFlash, Anna LaRue, LeAndra MacDonald, Ryan Matley, Ray Minjares, Ralph Moran, Megan O'Brien, Noel Perry, Scott Samuelson, John Shears, Thor Scordelis, Ruth Scotti, Ben Sharpe, Mike Tollstrup, Rich Vincent, Mona Yew, Mazyar Zeilani. The ETAAC Chair would like to acknowledge the generous financial support of the ClimateWorks Foundation, the Energy Foundation and the William and Flora Hewlett Foundation. Cover and report layout: Joseph Chapman, California Air Resources Board Cover Photos: AC Transit, David AmsterOlszewski, LED Power

ES ‐ 1
Executive Summary
Introduction The California Global Warming Solutions Act of 2006 (AB32) and the Governor’s Executive Order (S‐03‐5) collectively require that California reduce greenhouse gas (GHG) emissions to 1990 levels by 2020 and reduce a further 80 percent by 2050. AB32 also establishes the Economic and Technology Advancement Advisory Committee to advise on opportunities for technology development. Meeting California’s long‐term GHG goals will require the development and deployment of low and zero GHG advanced technologies in addition to the accelerated diffusion of currently available technologies. Advanced technology development and deployment will also contribute to California’s economic development, air quality goals, and continued global leadership.
The California Global Warming Solutions Act of 2006 states that “[I]nvesting in the development of innovative and pioneering technologies will assist California in achieving the 2020 statewide limit on emissions of greenhouse gases … and will provide an opportunity for the state to take a global economic and technological leadership role in reducing emissions of greenhouse gases” (section 38501(e)).
FIGURE ES-1: California GHG Goals versus historic Global GHG emissions
Figure ES1: GHG Emission Comparison

Executive Summary
ES ‐ 2
There are substantial market, information, government and industry/infrastructure barriers to low‐ and zero‐GHG advanced technologies. While injection of federal stimulus dollars will address some of these obstacles, California can play a central role by providing the sustained complementary policies that are often needed. Given the multitude of barriers, the magnitude of the climate change problem, and the long lead times for technology development, these policies to overcome other barriers are needed immediately if we are to reach our GHG reduction goals. This report builds on the original February 2008 ETAAC report in a number of areas where the ETAAC Advanced Technology sub‐group felt that it could best advise California policy‐makers on advanced technology development and strategies to overcome barriers to advanced technology development and deployment. The five focus areas for this report are economic development, innovative financing, renewable energy, energy efficiency, and transportation. A summary table of action items is provided at the end of this Executive Summary. Economic Development Opportunities & Challenges
Low‐ and zero‐carbon technologies are an estimated $4 trillion market globally1. Private sector “CleanTech” investment reached $150 billion globally in 2008, and government investments are expected to reach $200 billion globally by the end of 2009. California also has more than 100,000 direct green jobs, creating additional spillover economic benefits. California has several unique advantages in the competition for low‐ and zero‐carbon markets and investment capital. They include strong research and investment communities, strong climate and environmental policies, and a business community that has responded to meet these protective policies. There are also many challenges for California to capture economic opportunities. State and US labor costs exceed those of many global competitors, and real estate and manufacturing equipment sales tax costs are higher in California than in many other states. Though California’s economy is better suited for advanced technologies than high‐volume, low‐margin production, it would be unwise to take for granted that California will continue to capture the same proportion of new green jobs and investment.
“[T]echnologies that reduce greenhouse gas emissions are increasingly in demand in the worldwide marketplace, and California companies investing in these technologies are well‐positioned to profit from this demand, thereby boosting California’s economy, creating more jobs and providing increased tax revenue” (California Executive Order S‐3‐05)

Executive Summary
ES ‐ 3
Figure ES2: Sectors in $4 Trillion Global Low/Zero GHG Market (source: UK BERR 2009 report)
There are several options to help California businesses become more competitive by reducing their own carbon footprint and also transitioning to providing the products and services demanded by a low carbon economy. The United Kingdom’s Climate Levy provides one helpful example. Much of the Climate Levy paid by businesses (based on their energy usage) has been recycled to provide them with technical and capital assistance transitioning to a lower GHG footprint. GHG allowances (and fees on high global warming gases) could be used to help California businesses apply technologies that reduce their own costs and GHG footprint and transition to providing zero and low GHG technologies. Federal stimulus dollars are another important resource. While federal stimulus dollars will provide some immediate capital, effective coordination with California businesses on stimulus funding (including workforce training) is important, particularly for smaller businesses. Innovative Financing The upfront costs of more efficient advanced technologies are often a barrier to low and zero GHG technologies, even when those investments pay for themselves over time. This report identifies a number of innovative financing strategies that can “pull” advanced technologies into the market and reinforce economic development by improving efficiency.

Executive Summary
ES ‐ 4
Many of these strategies provide upfront capital that is repaid out of downstream savings. One type of approach is utility on‐bill financing and related off‐bill loans where customers repay up‐front costs from energy savings. This approach has been tested in California, generally with a focus on energy efficiency, and broad deployment over the next three years will set an important precedent for other areas. Municipal financing approaches backed by property tax repayments are another encouraging approach for energy efficiency and renewable energy. California’s experience should also be tracked for potential application to the transportation sector, for example in home‐ or business‐based vehicle charging or fueling infrastructure. Financing strategies are also needed for renewable energy technologies that face a potential “valley of death” at the demonstration phase. California offers funding through the Public Interest Energy Research program at the pilot plant scale, which typically requires far less funding than the demonstration phase. Debt markets are available once technologies have successfully been demonstrated. Innovative strategies are needed to bridge the financial gap between those two stages and to help facilitate demonstration of promising emerging renewable energy technologies. Renewable Energy Renewable energy must play a key role to meet California’s GHG reduction goals (in addition to meeting California’s 2020 33% renewable energy target) and, as it is the third‐largest sector specific GHG reduction strategy,2 to put the state on a trajectory for longer‐term reductions. Advanced technology renewable resources also have an important role in meeting California’s air quality challenges. Developing renewable energy in California offers economic opportunities as well. Renewable energy is already a large international market – the global market for wind, solar, biomass, and geothermal technologies is estimated at about $1.5 trillion US dollars annually3 ‐ and renewables are a leading sector with high market growth potential. Over two‐thirds of venture capital invested in California in 2008 was invested in renewable energy (primarily solar). Locally developed renewable energy can also produce economic benefits by replacing fossil fuel imports and boosting job growth. The ETAAC examined both crosscutting and technology‐specific issues to renewable energy advanced technology development. The key crosscutting issues are grid upgrades and expansion and energy storage. There is broad recognition today that the nation’s transmission infrastructure needs to be expanded to accommodate renewable energy. Many renewable technologies are site‐specific, distant from load centers and lacking sufficient transmission to get energy to market. A key to accomplishing grid expansion is updating the standard policy framework governing interstate transmission financing and cost recovery. Distribution system upgrades will also be necessary to accommodate a major ramp‐up of distributed renewable generation such as photovoltaic solar, which can avoid
Executive Summary
ES ‐ 5
transmission bottlenecks and help achieve Zero Net Energy homes. Smart Grid‐related technology and especially “smart inverters” are key distribution system technologies to effectively manage local power distribution. Energy storage is another important enabling technology. Energy generated outside of peak demand periods can be stored through stationary or vehicle batteries, compressed air, pumped storage (hydro‐electric) or hydrogen for use during peak demand. The US Department of Energy’s proposed $200 million investment in energy storage demonstration projects is an important first step. New storage technologies will also present new planning, rate recovery and ratemaking issues. Regulators will need to better define how costs should be allocated among different jurisdictions and how owners of storage assets will be compensated for grid benefits. This report also examines the progress of several individual technologies. Photovoltaic solar technology has advanced with technology using thin films moving to the production line and producers announcing that they have broken the $1/Watt cell cost barrier. To further improve PV solar’s competitiveness, California can support technology developments in more efficient inverters, power optimization, solar concentrators, and tracking devices as well as mounting systems that are easier to install. In addition, policies such as feed‐in tariffs and net metering would facilitate increased PV deployment in addition to the current “California Solar Initiative.” The other solar generating technology, solar thermal, has also progressed and a number of projects have applied for licenses from the California Energy Commission (CEC). However, the technology faces land use challenges, and also transmission challenges if the generating facility is located far away from customers. Wind power, an integral part of California’s renewable resources, is subject to these same types of constraints. Additional solutions that would facilitate increasing levels of wind power in California include further technology development and greater understanding of impacts on birds and bats. Cross‐cutting solutions on energy storage may benefit wind most of all due to a peak wind potential that generally does not match the periods of peak electricity demand. Geothermal power is another important part of the Western United States energy supply mix, producing 4.5% of California’s electricity in 2007. Moreover, a recent study by researchers at Stern School of Business at New York University concludes that geothermal energy is on the verge of becoming a better investment than fossil fuel.4 Credit challenges and relatively high project development costs remain constraints to geothermal development, along with recent concerns that certain technologies could induce low‐magnitude seismic events known as “microearthquakes”. Ongoing federal research and resource leasing can help advanced geothermal technology development and deployment. Solutions to crosscutting issues with transmission and energy storage of off‐peak power

Executive Summary
ES ‐ 6
(geothermal production is generally constant year‐round) will also help facilitate geothermal power. Biomass is another type of technology that can offer constant generation. Challenges for biomass power plant technologies include siting and permitting as well as feedstock availability and transportation. Converting woody feedstock to pellets can help overcome transportation barriers for combustion technologies. Feedstock (including organic wastes) converted into biogas can be used for power generation on‐site or off‐site, or transported via pipeline to end‐users to displace natural gas combustion. Finally, new highly‐efficient fuel cell technologies are being developed and deployed in California. Fuel cells dramatically reduce emissions of traditional pollutants such as ozone and particulate forming compounds. Fuel cells running on renewable fuels, or running on natural gas with effective waste heat utilization, also have lower GHG emissions than grid‐supplied electricity. As a result, fuel cells can provide viable clean energy solutions for a broad range of applications. Energy Efficiency California has long supported energy efficiency as a low‐cost means of achieving critical air quality, energy use reduction and greenhouse gas mitigation goals. The success of existing programs has played a major part in California’s ability to keep electricity demand flat, rather than follow the national trend of increasing per‐capita demand for electricity. Energy efficiency is the second largest sector‐specific GHG reduction strategy for 2020 in CARB’s scoping plan, and the development and deployment of new advanced technologies for both electricity and natural gas efficiency will be required for meeting California’s long‐term post‐2020 GHG goals. Like renewable energy, energy efficiency investments also play a role in meeting broader air quality goals by avoiding emissions from fossil fuel fired power plants. Energy efficiency can also lower energy bills over time, which in turn could promote the competitiveness of California business. A wide variety of promising new energy efficiency technologies for California homes, industries, and businesses can help meet GHG reduction goals and promote economic development. Several examples are solid‐state lighting, more efficient air conditioning and heating, and home area networks that give commercial and residential customers real‐time information about their electricity usage. These technologies will also support the ambitious goal of net‐zero energy residential and commercial buildings. There are three common obstacles to adoption of these energy efficient advanced technologies: (1) higher upfront costs that often accompany more energy‐efficient technologies, (2) lack of familiarity with a new technology combined with risk aversion discourages adoption, and (3) split incentives, such as when the owner of a

Executive Summary
ES ‐ 7
residential rental property is responsible for the cost of upgrades but is not responsible for energy bills. The financing strategies described earlier are one important part of the solution. California’s energy efficiency programs implemented in collaboration with utility, federal and other partners also have a key role to play in the success of these technologies. Transportation Transportation is the largest sector of GHG emissions in California and passenger vehicle GHG emissions are the biggest source‐specific category for GHG reductions in the CARB scoping plan. The role of standards and incentives will be key for meeting passenger vehicles GHG reduction goals for 2020 (relying mainly on technologies such as more efficient internal combustion engines and non‐plug‐in hybrids) and promoting electric‐drive vehicle technologies that are vital over the longer term. Significant technology challenges remain for tackling the leap to dramatic carbon reductions. For plug‐in hybrids (PHEVs) and battery electric vehicles (BEVs), reducing battery cost and size are key vehicle challenges. Fuel cell electric vehicle (FCEV) costs have come down substantially, but further reducing fuel cell cost is a remaining challenge. Durability and public acceptance are additional challenges for these three technologies. Electric drive vehicles will get a large boost from over $10 billion in US federal and state funding, as well as large investments overseas. Current pilot‐scale deployments of PHEVs and BEVs are expected to broaden rapidly into early commercialization over the next few years, followed by FCEVs in 2015 if FCEV technology and infrastructure development remains on track. For California, electric‐drive technology is critical for both economic and environmental reasons. California is expected to lose jobs from conventional vehicle manufacturing, despite aggressive efforts to keep them, and gain jobs through electric drive vehicle and infrastructure manufacturing. The state can play an important role making these deployments a success through infrastructure policies and investments, which will require effective decision‐making and coordination among various actors. Public education will also help facilitate the implementation of this technology. For medium and heavy duty vehicles, California will be best served by a comprehensive long‐term vision. In the near term, California should leverage state leadership on black carbon for federal funding to accelerate progress and continue inspiring international efforts to reduce this climate change‐forcing pollutant while improving public health. California can also use incentive programs to demonstrate new technologies such as medium duty hybrid vehicles and potential future heavy‐duty technologies that emerge from federally funded research and development (R&D) as well as fuel cell buses.

Executive Summary
ES ‐ 8
Advanced biofuels are another opportunity for state leadership. California standards and federal standards and R&D will help promote advanced biofuels technologies, and California is home to some leading biofuels companies, though there are no assurances on how much production of biofuels will occur in California. Further study on in‐state feedstock availability and advanced technology biofuels production will help inform both public and private decision‐making and investments. Conclusion Promoting long‐term technology development is a critical and immediate opportunity for California. While there are many remaining challenges, California cannot afford to step back and take a wait‐and‐see attitude while others attempt to surmount these obstacles. Pursuing the abundant opportunities for innovative approaches will promote advanced technology development and deployment for energy efficiency, renewable energy, transportation and other sectors of the economy. By pursuing advanced technology development, California will continue its global leadership role while simultaneously making giants steps forwards towards its GHG, air pollution and economic development goals.

Executive Summary
ES ‐ 9
Summary of Action Items for California PolicyMakers Below is a list summarizing issues, key strategies, and key state agencies for implementing these strategies (along with their federal partners). Sustained policies and funding mechanisms are essential to the success of these recommendations. Please note that these items are listed chronologically, and please see the main report to see the full strategies as the summary is not intended to fully describe these strategies. Chapter & page number
Issue Key Strategies
Key California Agencies (and
federal partners5)
2‐6 Transition businesses to low/zero carbon
footprint
Transition assistance such as use of some GHG allowances
CARB (also US EPA, US DOE)
2‐7
Stimulus funding for CA workforce training
and other opportunities
Outreach to small and medium businesses
CWIB, CEC, (also US DOE) other
agencies implementing stimulus funding
3‐2 Clean energy technology
demonstrations
Funding strategies coordinated with siting
and verification
CARB, CEC, CPUC (also US DOE)
3‐4 Upfront costs to homeowners Energy Star Mortgages CEC (also US EPA)
3‐6 Upfront costs to property owners
Municipal financing backed by voluntary
property tax assessments
California cities
3‐7
Upfront costs to homeowners and
small businesses (and potentially also
renters)
Implement on‐bill financing and related utility programs; and coordinate with other energy efficiency
programs
CPUC, CEC (implemented by
utilities)
3‐10
Upfront energy efficiency costs to commercial and
institutional building owners
Tax revisions to encourage private
funding
N/A – primarily federal issues

Executive Summary
ES ‐ 10
4‐2 Provide transmission infrastructure for
renewable electricity
Address land use & environmental concerns; update financing and cost recovery policies
CAISO, CEC, CPUC (also US DOE, US Department of Interior, FERC)
4‐3
Enhance electric grid infrastructure for
distributed renewables
Develop and deploy technologies
CEC, CPUC (also US DOE)
4‐5 Energy storage development and deployment
Integrate storage into RPS; address cost issues
CPUC, CEC, CAISO (also US DOE)
4‐7 Photovaltaic solar development and deployment
Technology development; feed‐in tariffs; net metering
CPUC, CEC (also US DOE)
4‐10 Solar thermal
development and deployment
Technology development and
deployment; balancing renewable energy goals with land use impacts
CEC, CDFG (also US DOE, US
Department of Interior)
4‐10 Biomass development and deployment
Facilitate permitting of digesters; support development and deployment of technologies
CARB (and air districts); CEC for
technology development & demonstration and potentially also CPUC (also
US DOE)
4‐13 Wind development and deployment
Technology development; grid
integration; research on avian impacts
CAISO, CEC, CDFG (also US DOE, US Department of Interior)
4‐16 Geothermal
development and deployment
Federal land leasing; technology
development; resource identification; financing, other
CEC (also US DOE, US Department of
Interior)
5‐3 Solar thermal heating development and deployment
Implement California Solar Incentive thermal
track CPUC
5‐4
Wastewater treatment efficiency & methane capture development and deployment
Efficiency incentives and GHG regulations
CARB, CPUC (also US EPA)

Executive Summary
ES ‐ 11
5‐5 Solid state lighting development and deployment
Federal partnerships & state incentives
CPUC (also US DOE)
5‐6 Home Area Networks development and deployment
Technical standards primarily national
(US DOE)
5‐7
Zero Net Energy Buildings
development and deployment
Roadmap & multi‐component
implementation strategy
CEC, CPUC (also US DOE)
5‐9
Advanced residential & commercial air conditioning
development and deployment
Technology demonstration followed
by incentives
CEC, CPUC (also US DOE)
5‐10
Low global warming potential refrigerants development and deployment
Replace high‐GWP gases and design alternatives to
maximize efficiency
CARB; potentially also CEC and CPUC (also US
EPA and US DOE)
6‐2
Passenger vehicle advanced technology development and deployment
GHG standards and incentives, including ZEV incentives and
subsidies
CARB, CEC (also US EPA and US
DOE)
6‐7 Electric drive vehicle deployment (PHEV,
BEV, FCEV)
Infrastructure funding and coordination and
education
CARB, CEC, CPUC, local
governments, private sector
(also US EPA and US DOE)
6‐9
Heavy duty engine black carbon
reductions (on‐ and off‐road)
Scientific update and leveraging federal funds
CARB, air districts (also US EPA and
US DOE)
6‐10
Medium and heavy duty fuel efficiency advanced technology development and deployment
Incentive programs funding and coordination
CARB, CEC (also US EPA and US
DOE)
6‐11 Advanced biofuels
production
Study in‐state feedstock production and processing
CARB, CEC (also US EPA and US
DOE) w/California Department of Food and Agriculture

Executive Summary
ES ‐ 12
Acronyms: BEV= Battery Electric Vehicle CAISO= California Independent System Operator CARB= California Air Resources Board CEC= California Energy Commission CDFG= California Department of Fish & Game CPUC= California Public Utilities Commission CWIB= California Workforce Investment Board CDFG= California Department of Fish & Game FCEV= Fuel Cell Electric Vehicle FERC= Federal Energy Regulatory Commission PHEV= Plug‐in Hybrid Electric Vehicle RPS= Renewable Portfolio Standard US EPA= US Environmental Protection Agency US DOE= US Department of Energy ZEV= Zero Emissions Vehicle
1 UK BERR 2009 Report. Additional references are included in the main report. 2 The ARB’s Scoping Plan shows that a 33% RPS could contribute up to 21.3 million metric tons per year of carbon dioxide (equivalent) emission reductions. 3 Low Carbon and Environmental Goods and Services: an industry analysis, page 75, Innovas, May 6, 2009, commissioned by the United Kingdom’s Department for Business Enterprise & Regulatory Reform. Exchange rate of 1 US dollar to .611 UK pounds as of 10‐18‐09. 4 See Melissa A. Schilling and Melissa Esmundo, “Technology S‐curves in Renewable Energy Alternatives: Analysis and Implications for Industry and Government,” in “Energy Policy 37 (2009)” pp. 1767–1781. 5 See list of acronyms following this table for state and federal agencies. Potential roles for federal partners could include but are not limited to funding, performance standards, national coordination, technical standards and technical information sharing. The potential need for agencies to seek any additional legislative authority is not addressed in this table.

Chapter One ‐ Introduction
1‐1
Chapter One Introduction This report focuses on the challenges & opportunities for development and deployment of advanced technologies needed to meet California’s long‐term GHG reduction and air quality goals and to compete in the marketplace. This report updates the original Economic and Technology Advancement Advisory Committee (ETAAC) February 2008 report with information on technology developments and policy developments available since its publication such as the federal stimulus bill. ETAAC finds that while these programs and developments play an important role addressing some of challenges identified by the February 2008 ETAAC report, the State of California still holds a critical role for technological innovation1.
This introductory chapter discusses the need for advanced technology development and deployment, relevant barriers, and examples of several existing programs intended to overcome those barriers. Subsequent chapters in this report contain information and recommendations on technologies and relevant policy drivers where the ETAAC Advanced Technology Development steering committee felt it could best advise California policy‐makers. Chapters covering cross‐sector economic development and innovative financing topics are followed by technology‐specific chapters on renewable energy, energy efficiency, and transportation. These sectors are expected to achieve the largest sector‐specific GHG reductions under CARB’s GHG reduction “scoping plan”. The Executive Summary contains a table of action items from the report. These updates and recommendations are intended to help California continue its leadership role and
Southern California (Source: Edison.com)

Chapter One ‐ Introduction
1‐2
promote advanced technology development and deployment while capturing economic opportunities. 1.1 The Need For Advanced Technology Development To Meet GHG Goals The California Global Warming Solutions Act of 2006 (also known as AB32) and the Governor’s Executive Order recognize the importance of technology development and deployment for meeting California’s own greenhouse gas (GHG) reduction goals, and also demonstrating international leadership. AB32 also establishes the Economic and Technology Advancement Advisory Committee to advise on opportunities for technology development. Meeting climate change goals will require the rapid deployment of existing technology as well as the commercialization and deployment of technologies that have not yet been commercialized or do not yet exist.
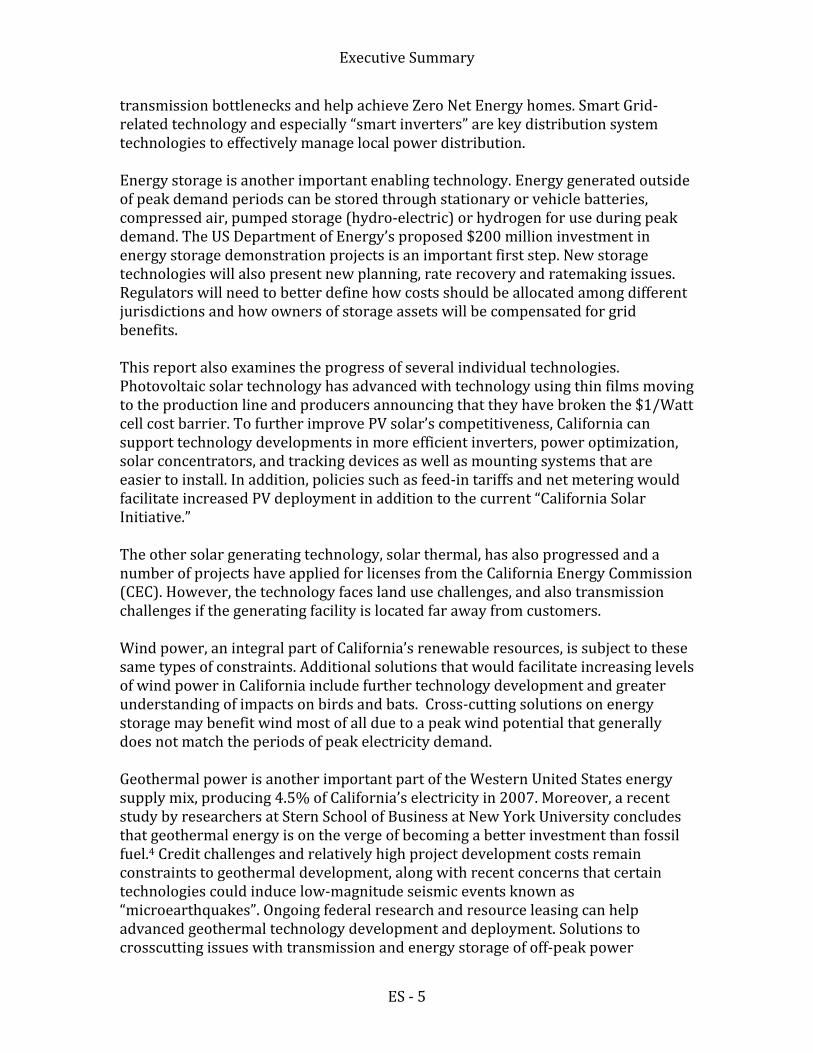
For instance, CARB determined in 2004 that existing technology options could cost‐effectively reduce passenger vehicle emissions by about one third by 2016 under Pavley GHG regulations (Pavley). Coupled with CARB’s upcoming longer‐term GHG reduction program, existing technologies for passenger vehicles will make a major contribution to 2020 GHG reduction goals. On the other hand, achieving long‐term GHG emission reduction goals out to 2050, shown in Figure 1‐1, will require a dramatic shift to zero and ultra‐low GHG transportation technologies that do not yet exist at commercial scale. While transportation is the largest sector in terms of GHG emissions as seen below in Figure 1‐2, a comparable shift to zero and low‐carbon technologies will be needed across all major sectors to meet long‐term GHG reduction goals as well as 2020 goals.
The California Global Warming Solutions Act of 2006 states that “[I]nvesting in the development of innovative and pioneering technologies will assist California in achieving the 2020 statewide limit on emissions of greenhouse gases … and will provide an opportunity for the state to take a global economic and technological leadership role in reducing emissions of greenhouse gases” (section 38501(e)).
“[T]echnologies that reduce greenhouse gas emissions are increasingly in demand in the worldwide marketplace, and California companies investing in these technologies are well‐positioned to profit from this demand, thereby boosting California’s economy, creating more jobs and providing increased tax revenue” (California Executive Order S‐3‐05)
Chapter One ‐ Introduction
1‐3
While these technologies are needed to meet long‐term goals, California must act to facilitate technology development and deployment pathways now. New technologies require a significant lead‐time for development and commercialization. In the meanwhile, new fossil fuel fired power plants are likely to have a 30‐50 year lifetime. Passenger vehicles have a 10‐20 year lifespan, and it has taken a decade for hybrid passenger vehicle technology to reach a 5% market share in California. Infrastructure built to serve today’s technologies may last a lifetime. Clearly, deploying the best technologies that are on the shelf today and then going about “business as usual” will not be sufficient to develop the advanced technologies needed to meet long‐term GHG reduction goals and other environmental and economic goals.
Figure 11: California GHG Goals versus historic emissions

Chapter One ‐ Introduction
1‐4
In addition, “green jobs” are a leading job generation sector in California2. While these industries are not immune to the global recession, California environmental policies can continue to serve as a long‐term driver for job creation. Renewable energy and other low and zero greenhouse gas technologies are estimated to be a $4 trillion market globally3 as seen below in Figure 1‐3. However, the global technology race in areas such as electric vehicles and renewable energy is dramatically escalating. In addition to providing zero and low‐greenhouse gas products and services, California businesses will themselves need to implement innovative methods for cutting energy consumption and costs to remain competitive. As noted by the United Kingdom’s Stern Report4, the cost of inaction would sharply escalate the inevitable economic costs of transitioning, even before considering the severe economic and environmental damage that would be inflicted by unmitigated climate change. Later sections of this report will provide a more detailed look at the economic development opportunities and challenges in general, as they apply to the development and deployment of specific technologies covered in individual chapters.
Figure 12: Greenhouse Gas Emissions

Chapter One ‐ Introduction
1‐5
Figure 13: Global “Green” Markets by Country (Source: UK 2009 BERR report) Advanced technology development and deployment is also necessary to meet local air quality goals. For instance, air quality attainment plans for the San Joaquin Valley and South Coast Air Quality Management Districts inhabited by about twenty million California residents rely on technology development to fill in a “black box” of unspecified emission reduction pathways. Many of the advanced technologies needed to achieve GHG goals are likely also to reduce other air pollutants by increasing efficiency and shifting to non‐polluting resources. For instance, reducing future in‐state power generation emissions by 25% in 2020 through energy efficiency and renewable energy technologies would provide similar quantities of GHG reductions as well as avoid over 6,000 tons per year of emissions that cause ozone and fine particulates5. Cutting on‐road emissions by 5% through electric drive vehicles powered by zero emission renewable energy would avoid over 20,000 tons per year of these pollutants in 20206. These actions would achieve from several percent to approximately a quarter of the “black box” emission reductions needed for smog‐forming compounds in these areas7. Advanced technology development and deployment that creates appealing low and zero carbon transportation and energy technologies is also critical to creating economic development trajectories that allow developing nations to address their own local and

Chapter One ‐ Introduction
1‐6
national air quality issues while avoiding the worst effects of climate change globally. As seen in figure 1‐4, global energy demand in developing nations is forecast to increase by over 70% between 2006 and 2030.
0
100
200
300
400
500
600
700
800
1990 2000 2006 2010 2015 2020 2025 2030
Central/South America
Africa
Middle East
Other Non‐OECD Asia
India
China
Other non‐OECD Europe/ Eurasia
Russia
Australia/New Zealand
South Korea
Japan
European Union
Mexico
Canada
United States
1.2 Technology Development & Commercialization Challenges This report focuses on technologies that have developed to the point where their potential GHG reduction benefits can be assessed, but have not yet reached full commercialization. This may be a particularly important stage for California to bridge the traditional federal focus on basic scientific research and industry’s focus on commercializing available technology and product development. Later sections of this report focus on economic development opportunities & challenges, and technologies within the transportation, energy efficiency, and renewable energy sectors that will play an important role in meeting California’s long‐term GHG and environmental goals. (Please see the original February 2008 ETAAC report for a number of important recommendations in other sectors as well. Appendix I of this report contains a summary of ETAAC’s February 2008 recommendations for overcoming barriers to promote R&D and technology development.)
Figure 14 Global Energy Consumption in quadrillion BTUs (EIA, http://www.eia.doe.gov/oiaf/ieo/ieorefcase.html)

Chapter One ‐ Introduction
1‐7
Technology development & commercialization involves challenges that are described in the Oak Ridge National Laboratory’s “Carbon Lock‐in” report8.
’The commercialization and deployment process begins with “basic research” and “science,” which provides the underlying foundation of knowledge that can lead to fundamental new discoveries. This part of the research continuum tends not to be problem‐driven, but rather involves scientific study and experimentation to advance understanding. The next stage of “applied research” is problem‐driven and is intended primarily to solve specific technical challenges impeding progress in technology development. This “strategic” research applies knowledge gained from more fundamental science research to the more practical problems associated with technology R&D.
‘The following stage of “development” includes applications engineering and possibly field testing. “Demonstrations” are then needed to evaluate the technology’s performance in real‐world operating systems. This may be followed by further production engineering to improve the fit between market conditions and technology characteristics. Finally, “deployment” activities are undertaken, including the development of distribution channels, targeted niche marketing and supply chain
Figure 15: Valley of Death (source: “Carbon Lockin, Barriers to Deploying Climate Change Mitigation Technologies”)

Chapter One ‐ Introduction
1‐8
alignment, followed by cost reductions and broader market development to ultimately achieve widespread “market saturation.” Time and effort spent in each stage along this path to market saturation varies by technology, and innovation does not occur without interaction with external forces. ’
In addition to technical challenges, there are also financial challenges throughout the R&D, demonstration, early commercialization, and mass market stages. New technologies must navigate most, if not all, of these stages and each stage presents different policy, technology and financial challenges. No technologies remain unchanged through this cycle; no entrepreneur has mastered the dynamics of each stage; and no financier is comfortable with the risks inherent in each category.9 The “Valley of Death” seen in figure 1‐5 represents a formidable financial challenge where the amount of capital needed is greater than typically available as equity. Technologies not yet proven at scale are unlikely to qualify for traditional commercial loans for demonstration projects, creating serious barriers as noted below. Financial challenges continue through the initial deployment stage. For instance, UK Carbon Trust analysis of several representative technologies found that deployment required 40 times the resources of projects at the RD&D stage10. 1.3 ETAAC Perspective on Technology Development and Deployment Challenges ETAAC recognizes that public policy solutions are needed if new technologies are to overcome a daunting array of potential barriers identified at the national and international level. (See the “Carbon Lock‐in, Barriers to Deploying Climate Change Mitigation Technologies” report for additional description of these and other potential barriers.) As part of this ETAAC research effort, ETAAC examined barriers from a California perspective, in four categories: Cost and Market Barriers; Information Barriers; Government Barriers; and Industry Structure and Infrastructure Barriers. The first question is how frequently a particular barrier is likely to occur in California. The second is how severe the barrier tends to be when it does occur. The results of this assessment, shown below in Table 1‐1, provide useful background when confronting advanced technology development and deployment challenges. Later chapters on specific technologies will identify which are most specifically relevant to individual technologies, as key barriers can vary by technology.

Chapter One ‐ Introduction
1‐9
Potential Barriers to the Commercialization and Deployment of Low and Zero Greenhouse Gas Technologies
Cost and Market Barriers
External Benefits
Frequency‐ high
Severity‐ high, in some cases considered medium
GHG‐reducing technology external benefits that are not available to the owners of the technologies, as well as other environmental benefits and employment & other spill‐over
economic benefits are examples.
UpFront Capital Costs Frequency – high
Severity ‐ high
Up‐front capital costs are higher for the production and purchase of many zero and low‐carbon technologies. While capital costs are often repaid over time, lack of access to capital and short term planning by industries, small
businesses, and households can compound this barrier. Capital‐intensive demonstrations may be particularly
challenging.
Demonstration Costs & Risks
Frequency – high/med
Severity‐ high/med
Technologies in the development & demonstration phase may have higher capital cost, higher labor/operating cost,
increased downtime & lower reliability, lack of standardization, and/or lack of engineering, procurement and construction capacity. Private investments in reducing these
costs & risks through demonstration projects may be disincentivized by benefits that can be shared by competitors.
Market Demand Frequency – med/high
Severity‐med/high
Customers may be risk/change‐averse; “chicken and egg” dilemma of low demand for emerging technologies prior to full commercialization may inhibit production at scale necessary
to achieve full commercialization.
Misplaced Incentives
Frequency‐medium
Severity‐medium (in some cases considered low or
high )
Misplaced incentives occur when the buyer/owner is not the consumer/user (e.g., landlords and tenants in the rental
market and speculative construction in the buildings industry) – also known as the principal‐agent problem.
Information Barriers
Incomplete and Imperfect Information
Frequency‐ high/ med
Severity‐ med/high
Lack of information about technology performance (especially trusted information), increased decision‐making complexities, and cost of gathering and processing information about new technologies are potential barriers. This barrier may be
compounded to the extent that shared benefits of customer education are a disincentive for private investments.
Lack of Specialized Knowledge
Frequency – med/high
Severity‐ in some cases considered low, med, and
high
Inadequate workforce training/expertise, cost of developing a knowledge base for available workforce, and inadequate reference knowledge for decision makers are examples.
Categories developed from Oak Ridge National Laboratory Report “Carbon Lock‐in, Barriers to Deploying Climate Change Mitigation Technologies”, Dr. Marilyn Brown et. al as revised January 2008; February 2008
ETAAC report; ETAAC April & June 2009 meetings

Chapter One ‐ Introduction
1‐10
ETAAC Review of Potential Barriers to the Commercialization and Deployment of Low and Zero Greenhouse Gas Technologies
Government Barriers
Unfavorable Standards
Frequency‐ med
Severity‐ med (in some cases considered high)
Standards that “grandfather” existing infrastructure and facilities; programs that operate in “silos” rather than integrating relevant concerns such as air quality,
climate change, and energy security; and rules granting access to water rights and other resources on a “first come first served” basis can create barriers. These barriers can be legislative or regulatory.
Uncertain Standards Frequency – med
Severity‐ med
Examples of uncertainty about future regulations of greenhouse gases including emission levels, potential GHG emission subsidies through free GHG allowances allocations, and ownership/liability of underground
sequestered carbon.
Unfavorable Fiscal Policy Frequency – med
Severity – med (in some cases considered low)
Fiscal policies that slow the pace of capital stock turnover; state and local variability in fiscal policies such as tax incentives and property tax policies; distortionary tax subsidies that favor conventional
energy sources and high levels of energy consumption are potential barriers.
Uncertain Fiscal Policy
Frequency – med (in some cases considered high)
Severity‐ med (in some cases considered high)
Short‐duration tax & fiscal policies (such as production tax credits); uncertainty over future costs for GHG emissions; market‐development oriented
incentive programs with uncertain lifespan & funding levels are examples.
Unfavorable Approval Processes
Frequency – med
Severity – high (in some cases considered med)
Approval processes may favor incumbents if agencies lack familiarity & established processes for new technologies such as off‐shore renewable energy development. Permitting/approval procedures
serving valuable public purposes that apply to new but not existing facilities & infrastructure may favor incumbents that are grandfathered, especially when
approval processes are not coordinated.
Uncertain Approval Processes
Frequency – med
Severity – med/high Uncertain timing and outcome of approval processes
may be a potential barrier.

Chapter One ‐ Introduction
1‐11
ETAAC Review of Potential Barriers to the Commercialization and Deployment of Low and Zero Greenhouse Gas Technologies
Industry Structure &
Infrastructure Barriers
Existing Infrastructure “Lockin”
Frequency‐ med/high (even split)
Severity‐ med/high (even split)
Existing large investments such as long‐term power and transportation fuels production and distribution infrastructure can “lock‐in” existing technologies.
Lack of Needed Infrastructure for New
Technology
Frequency – high/med
Severity‐high
Renewable electricity transmission capacity, alternative transportation energy supply distribution, and other infrastructure needs are examples. Lack of manufacturing facilities and distribution/supply
channels and other supply chain shortfalls can also be a barrier.
Incumbent Industry Market Dominance
Frequency‐ high , in some cases considered low and
med
Severity‐mostly high, in some cases considered low
Natural monopolies or large incumbents with market power may disenable technological innovation to prevent disruption of existing profitable markets &
investments.
Industry Segmentation or Fragmentation
Frequency‐ med
Severity‐ med/low
Industry segmentation can inhibit change. For instance, manufacturing a single long‐haul truck is often split among independent engine, chassis, and body manufacturers segments, with a variety of
manufacturers within each segment. Small business owners may be harder to reach with information
about new energy efficiency technologies, especially as their needs often vary based on business type.
Intellectual Property Frequency‐med
Severity‐low/med
High transaction costs for patent filing and enforcement, conflicting views of a patent’s value, and techniques such as patent warehousing, suppression,
and blocking can create barriers.
Table 11: Prioritizing Barriers

Chapter One ‐ Introduction
1‐12
ETAAC members have identified barriers within the cost and market category as the most frequent and severe market barriers. For instance, higher up‐front costs are a universally frequent and severe concern, closely coupled with a lack of financial return for “externality” benefits such as lower emissions of GHG and other pollutants. For instance, renewable energy, energy efficiency, and transportation technologies frequently have a higher up‐front capital cost that is repaid from energy savings over time. Demonstration costs & risks are generally (although not universally) considered to be a frequent and severe barrier as well. Barriers to developing market demand for new technologies are medium to high frequency and severity, along with related information barriers to customer adoption of new technologies. The industry structure & infrastructure category also contains a number of barriers that are both frequent and severe. Investment in long‐term infrastructure, coupled with lack of investment in new infrastructure, is generally (although not universally) considered to be both frequent and severe. Lack of fueling stations for alternative fuel vehicles is one clear example and transmission for new renewable electricity is another. Additionally, large incumbent industries with market power may have significant long‐term investments in existing infrastructure and markets and are often, though not universally, seen as a significant barrier to technology development by committee members. There appears to be a common view that government standards, fiscal policies, and approval processes are sometimes a barrier to development of new technologies. The severity of these barriers is usually considered moderate when they do occur with the exception of the approval process itself. Barriers related to the approval process and/or uncertainties about timing and outcomes sometimes occur, and were most often ‐though not always‐ considered a serious barrier when they do occur. For instance, the original ETAAC report notes that siting new renewable energy technologies typically involves approval processes that do not apply to existing fossil‐fuel power plants. The follow section of this chapter will explain how the federal stimulus bill and other existing programs play an important role addressing some of these barriers and offer some valuable lessons learned. The following chapters of this report will describe where barriers have been overcome or where gaps remain for manufacturing and for examples of advanced technology development in the transportation, renewable energy, and energy efficiency sectors. 1.4 Example Programs to Overcome Barriers to Advanced Technology Development and Deployment This section describes several examples of programs to overcome barriers to advance technology development. Please see Appendix II of this report for an update to the ETAAC 2008 report summary of selected state and other advanced technology development programs.

Chapter One ‐ Introduction
1‐13
UK Carbon Trust Report The UK Carbon Trust recently issued a report “Focus for success: A new approach to commercializing low carbon technologies.”11 The report emphasizes the challenges of moving clean energy innovations from the laboratory to the marketplace, and suggests a range of focused strategies for UK policy makers to consider. ETAAC finds this work to be relevant to California’s efforts under AB32, including the discussion and proposals around demonstration finance that follow in the Innovative Financing chapter of this report. Similar to the UK Carbon Trust proposal, ETAAC believes that a concerted effort needs to be made to assist emerging technologies in crossing the “valley of death” between venture‐backed, equity‐supported innovations and debt‐financed, large‐scale proven technologies. We highlight some of the findings of the Carbon Trust here, to provide further context to the discussion that follows. The Carbon Trust report outlines the evolution of technology development philosophy from a policy of picking specific hardware and companies, which resulted in expensive “white elephants” such as Concorde and specific nuclear technology. In response a “free market” technology neutral approach was adopted, such as general renewables obligation, but did not succeed in developing new technologies. As a result, the report recommends a “technology‐focused” approach of selecting promising sectors but not individual companies. The report also recommends a focus on “sunrise” instead of “sunset” industries. In the past, a policy focus on “sunset” industries – which are very visible due to the loss of existing jobs ‐ was an expensive mistake that merely prolonged their demise. The technology‐focused approach recommended by the UK Carbon Trust proceeds as follows:
Identify priority low and zero GHG technologies for commercialization through systematic and transparent assessments – the demonstration stage allows a better assessment of prospects than during R&D, and there is also a need to differentiate at this stage because capital cost is much higher than R&D for the technologies studied by the Carbon Trust
Designing a customized range of policy support for each of the prioritized technology families
Recognizing the differences between earlier and later lifecycle stages & the different policies needed for each
Create strong competition for support between companies within a technology family
Carefully monitor against milestones to keep waste to a minimum. The ETAAC demonstration finance proposal in the Innovative Finance chapter accounts for these challenges by integrating a technology support program. Competition among emerging renewables can provide a market‐based screen that avoids unjustified support of

Chapter One ‐ Introduction
1‐14
low‐priority technologies. The transportation chapter explains the need for complementary policies, and recognition of technologies at different stages of development. Many of the other chapters also provide other examples. Lessons Learned for Residential Solar Hot Water Heater Tax Credits Residential solar hot water heaters have a long history in California. By 1897 a third of Pasadena homes had installed a solar water system, which provided savings on relatively expensive fuel supplies at the time. Large natural gas discoveries in the 1920’s and 1930’s in the L.A. Basin eliminated the California market at that time,12 though not the potential for residential solar hot water heating in California. After the oil shocks of the 1970’s, large federal and California tax credits totaling 80% of system costs were offered to home owners to overcome the initial higher capital costs of the systems. However, there were no certification or other quality assurance requirements and many companies jumped into a boom market based on these lucrative tax credits without the necessary experience. As a result, quality was inconsistent13 and the technologys’ reputation for reliability suffered greatly. Quality issues, declining oil prices, and the abrupt end of tax credits in the mid‐1980’s led to a market bust and a lingering negative consumer perception. Quality assurance (QA) remains an equally or greater concern among consumers than cost‐effectiveness14 despite a technology that has matured with 46 million units installed globally.15 Current sales in California are below 2,000 units annually16 – not much higher than the number of units in place at the beginning of the 20th century over a hundred years ago. This experience provides several lessons for ensuring the successful long‐term roll‐out of technologies that reduce energy consumption along with air emissions and GHG. First, quality standards are needed to offset lack of information about technologies that are new to consumers (even if the technologies themselves are not new), and in some cases to overcome negative perceptions about past failures. For instance both the current California solar initiative for photovolatics and the pilot solar water heating incentive set certification and QA standards and set incentives based on performance levels determined from installation‐specific data. Secondly, government incentives that create a “boom‐bust” cycle can be counterproductive. Another examples of “boom‐bust” cycles can also be seen from past expirations & renewals of federal production tax credits for renewable electricity as shown in figure 1‐6 from the Gigaton Throw‐Down report. The current California PV solar and the new solar hot water heating program (Solar Hot Water Heating and Efficiency Act of 2007, AB1470) phase‐out incentives on a predictable schedule over a decade long‐timeframe. In contrast, the federal stimulus bill is designed to pump resources into the economy as soon as possible. Federal one‐time stimulus money is often focused on immediate up‐front capital costs for manufacturing and purchasing but may not address other market barriers to long‐term success. Later chapters on specific energy technologies will note where complementary policies are needed to avoid “boom‐bust” cycles after federal stimulus money ends.

Chapter One ‐ Introduction
1‐15
Figure 16, Wind and Production Tax Credit (Source: Gigaton Throwdown)
The American Recovery and Reinvestment Act and Relevance to California The American Recovery and Reinvestment Act (ARRA) provides a major pulse of resources that can potentially overcome capital cost, demonstration, and other barriers to manufacturing and commercialization of many low and zero GHG advanced technologies (in addition to “shovel‐ready” projects). The ARRA contains some elements that are similar to the “technology‐focused” approach recommended by the Carbon Trust. For instance, a general incentive for renewable energy is also coupled with funding to develop and demonstrate several advanced technology elements. It also includes a call for significant investment in specific companies selected through a competitive process. This section of the ETAAC Advanced Technology report provides an overview of resources related to advanced technology development from the ARRA. Technology‐specific discussions later in this report will identify what barriers will likely be overcome by ARRA spending for specific technologies and what barriers will most likely require additional attention by California policy‐makers at the state level or in cooperation with federal and/or other partners. National Programs The Department of Energy’s Office of Energy Efficiency and Renewable Energy is administering $16.8 billion in ARRA funding. While much of this funding focuses on “shovel‐ready” projects (such as weatherization for low‐income homes) it also contains a

Chapter One ‐ Introduction
1‐16
number of aspects that can also help advanced technology development. Technology development funding opportunities announced in June and July of 2009 include but are not limited to:
Solid‐sate lighting (see ETAAC 2008 report recommendation 5‐B) and energy efficiency technology development for buildings
Solar market development & high deployment rate (ETAAC 2008 report chapter 5‐H)
Development of algal/advanced biofuels Wind turbine development (ETAAC 2008 report chapter 5) Carbon capture and storage (ETAAC 2008 report chapter 5) Smart grid technology (ETAAC 2008 report chapter 5‐C) Heavy duty truck technologies (ETAAC 2008 report chapter 3)
The ARRA also provides manufacturing tax credits that will help address the capital cost of manufacturing low and zero GHG technologies across a number of sectors. The ARRA provides $2.3 billion in tax credits equal to 30% of the cost of manufacturing facilities for renewable energy; plug‐in vehicles and batteries and fuel cells; carbon capture and sequestration; renewable energy storage & transmission; renewable fuels refining; energy conservation technologies (including lighting); and other technologies that are certified to reduce greenhouse gases. A number of these technologies were identified as priorities in the 2008 ETAAC report and will contribute to meeting 2020 AB32 GHG goals as well as long‐term GHG reduction objectives. The lower cost of manufacturing would presumably also trickle down to help consumers afford these technologies, as up‐front costs to consumers have been identified as a prevalent and severe barrier to low and zero GHG advanced technology development. Tax credits for renewable energy projects were renewed, as recommended by ETAAC (ETAAC 2008 report page 10‐46), through the end of 2013 with an expected value of $16 billion. The credits provide approximately 2.0 cents per kilowatt hour over the first ten years of production. These incentives will help overcome capital‐cost and externality barriers identified by ETAAC as frequent and serious, and will go part way toward avoiding the “boom‐bust” problem identified earlier in the report. In addition to the scale‐up of existing technologies for renewables such as wind, PV solar, and geothermal, this financing will help develop technologies such as the thermal solar demonstration projects (see ETAAC 2008 report p. 10‐40) that are in the California project development pipeline (http://www.energy.ca.gov/sitingcases/all_projects.html). In addition $1.6 billion in new bonding authority for Clean Renewable Energy Bonds can be used to finance new renewable power projects by public power, municipal, and government entities. The bill also contains $6.9 billion for transit capital construction, $4.5 billion for green buildings and over $14 billion in other building renovations that can include energy efficiency improvements. While these projects will rely on off‐the‐shelf technologies, some of them could also incorporate demonstrations of energy efficiency & renewable energy advanced technologies.

Chapter One ‐ Introduction
1‐17
State Programs and ARRA Funding Much of the ARRA money will be deployed through state and local government. California was awarded $90 million to provide a statewide energy efficiency retrofit program and cost effective clean energy systems for residential, commercial, and industrial buildings and facilities under the State Energy Program. The revenue savings from these efficiency measures will be recycled for additional efficiency measures, and this type of long‐term broadening of efficiency markets can create “market‐pull” for advanced technologies for energy efficiency over the long‐term. California also plans to develop and implement a public education, marketing, and outreach effort to ensure the benefits and value of energy efficiency are well understood, with $15 million in CEC Green Jobs Training Program and $20 million in ARRA funding (ETAAC 2008 report Cleantech Workforce Development recommendation 2‐D. Information barriers have been identified as sometimes a major barrier to low/zero carbon technology development in California). After successful implementation the state will be funded up to$226 million for the entire program.17 California is also expecting $351.5 million in ARRA block grants via US DOE, with $49 million received at the state level and the remaining $301 million is distributed to large cities and counties for energy conservation. The purposes are very broad and can include developing programs (such as ETAAC on‐bill financing recommendation 2‐G) that encourage the adoption of low and zero carbon technology as well as potentially also implementing projects for distributed generation (which could include distributed solar and digester‐gas‐to energy, ETAAC recommendations 4‐D and 6‐A). California ARRA facility funding Several significant awards have been issued for California facilities. Two are related to ETAAC recommendations for low GHG new vehicles (chapter 3‐E) and plug‐in electric drive vehicles (chapter 5‐F&G). Tesla Motors will receive a $465 million loan to finance a manufacturing facility for the Tesla Model S sedan. In addition, the Electric Transportation Engineering Corp. received a $100 million grant to manufacture with partner Nissan 5,000 electric vehicles in Phoenix, Arizona and Northern California for deployment along with charging stations in California (San Diego) and five other states. Fisker received a loan of $528 million for manufacturing that will be supported from its California headquarters. Solyndra in Fresno, California received a $535 million loan guarantee for the first phase of a new manufacturing facility. Each year plant production could power the equivalent of 24,000 homes. The facility could manufacture up to 7 gigawatts of cylindrical solar photovoltaic panels, equivalent to as many as 3 to 4 coal fired power plants over its lifetime and about as many new solar panels as the entire US production in 200518. Hydrogen Energy International LLC, a joint venture owned by BP Alternative Energy and Rio Tinto, received $308 million to begin construction in 2011 and begin operation in 2015

Chapter One ‐ Introduction
1‐18
of an integrated gasification combined cycle power plant in Kern County. The plant would convert coal and petroleum coke into hydrogen burned for power. It would inject 90% of the resulting CO2 into nearby oil reservoirs for storage and enhanced oil recovery, equivalent to more than 2,000,000 tons per year of CO2. This award is related to the ETAAC carbon capture & storage recommendation (ETAAC 2008 report 5‐I). As noted in the following sections of this report, these investments will help overcome some of the barriers to Advanced Technology Development but others still need to be addressed. 1 Time, “Why California is Still America’s Future”, Michael Grunwald, November 2, 2009 2 California Green Innovation Index, Next 10, 2009, page 70 3 “Low Carbon and Environmental Goods and Services: an industry analysis”, Innovas, May 6, 2009, commissioned by the United Kingdom’s Department for Business Enterprise & Regulatory Reform. 4 "Stern Review on The Economics of Climate Change". Stern, N. HM Treasury, London. 2006. 5 Emissions reductions are ICCT calculations based on CARB’s CEFS database available at http://www.arb.ca.gov/app/emsinv/fcemssumcat2009.php. The CARB scoping plan calls for a 26% reduction from “business as usual” electric sector emissions from renewable energy and electrical energy efficiency (not including combined heat & power). 6 Emissions reductions are ICCT calculations based on CARB’s CEFS database available at http://www.arb.ca.gov/app/emsinv/fcemssumcat2009.php. 7 Emissions reductions are ICCT calculations based on CARB’s CEFS database available at http://www.arb.ca.gov/app/emsinv/fcemssumcat2009.php and California air quality plan emissions inventory data. 8 “Carbon Lock‐in: Barriers to Deploying Climate Change Mitigation Technologies”, Oak Ridge National Laboratory, sponsored by US Climate Technologies program, revised January 2008, Marilyn Brown et. al. 9 CalCEF presentation to ETAAC April 29, 2009. Available at http://www.arb.ca.gov/cc/etaac/meetings/042909pubmeet/mtgmaterials042909/Adler.pdf. 10 “Focus for success: A new approach to commercializing low carbon technologies”. UK Carbon Trust, July 2009, p. 10 http://www.carbontrust.co.uk/default.ct. 11 “Focus for success: A new approach to commercializing low carbon technologies” 12California Solar Center, at http://www.californiasolarcenter.org/history_solarthermal.html last accessed September 1, 2009. The leading system at the time was the “Climax”. 13 “Solar Water Heating: How California Can Reduce its Dependence on Natural Gas”, Environment California, Bernadette Del Chiaro and Timothy Tellen‐Lawton, April 2007. Accessed September 1, 2009 at http://www.environmentcalifornia.org/uploads/at/56/at563bKwmfrtJI6fKl9U_w/Solar‐Water‐Heating.pdf 14 ibid 15 ibid 16 Andrew McAllister, California Center for Solar Energy, Solar America Cities Annual Meeting, April 1, 2009. http://www.solaramericacities.energy.gov/PDFs/2009_Annual_Meeting/Maximizing_Use_Solar_Water_Heating/Lessons_San_Diego_SWH_Pilot_Program.pdf, accessed September 1, 2009. 17 US DOE, http://www.energy.ca.gov/recovery/sep.html 18 California Green Innovation Index, Next 10, 2009, page 70

Chapter Two – Economic Opportunities and Challenges
2-1
Chapter Two Economic Opportunities and Challenges Overview The economic development opportunities of advanced technology development have taken even greater importance with California’s severe economic downturn. The purpose of this chapter is to highlight the status of California’s economy regarding “green” jobs today, to identify economic opportunities for California to develop low and zero GHG advanced technologies, and to provide recommendations related to manufacturing advanced technologies generally. The global four trillion dollar market1 for low and zero carbon technology contains many opportunities that are closely aligned with strategies in California Air Resources Board’s AB32 climate change plan and with air quality goals.
(Source: greenjobsphilly.org)

Chapter Two – Economic Opportunities and Challenges
2-2
2.1 Advanced Technology Development And Deployment Economic Opportunities “Green” jobs today are an increasingly important component of the workforce, exceeding 100,000 jobs as of 2007 (including zero and low‐GHG jobs and other environmental jobs)2 as seen in figure 2‐1. While this sector is not yet large enough to offset the state’s severe economic downturn, it is important to continue growing jobs in this sector.
In 2008 California venture capital firms received $3.3 billion (over half of the US total VC capital)3, with about half of that ultimately spent in California. While these levels dropped in the first quarter of 2009 to $334m/quarter4, that is still approximately equal to 2006 levels on a per quarter basis. In addition, global government 2009 investment in “cleantech” is projected to reach $200 billion, exceeding the $150 billion in private capital expenditure in 2008. US incentives include $60 billion in direct spending and subsidies, $7.6 billion in financing, and a variety of tax credits5. Every $100 million in venture capital investment is estimated to create an average of 2,700 jobs6, highlighting the importance of policies that continue to attract venture capital. Leading California sectors are energy generation (especially solar), energy efficiency, transportation, green buildings, and energy storage (related to renewable energy).7
Figure 21 (Source: Next 10)

Chapter Two – Economic Opportunities and Challenges
2-3
California VC Investment 2008
4%5%
6%
8% 69%
1%2%
2%
Energy Generation
Transportation
Energy Infrastructure
Energy Efficiency
Materials
Energy Storage
Recycling & Waste
Water & Wastewater
Air & Environment
Agriculture
Manufacturing/Industrial
There are important opportunities for California to both encourage advanced technology development and deployment, and receive economic returns. Examples of policies that create California markets (including suppliers) include AB32, the California Solar Initiative, and AB118 transportation incentives. These policies together with investments and research in California can help form clean technology ”clusters” that facilitate further investment and economic development. This capability can help tilt the state toward energy efficiency & renewable energy technologies that displace imported energy supplies and create more in‐state jobs8. There are also challenges, as explained for the manufacturing sector in this chapter and in the technology‐specific chapters.
Figure 22: California VC Investments 2008 Distributed by cleantech segment, Source: Next10

Chapter Two – Economic Opportunities and Challenges
2-4
Service jobs are the most prominent category when environmental consulting is included. Manufacturing rises to approximately half of the total jobs for the low and zero carbon technology categories of transportation, energy efficiency, and renewable energy, which are covered in later chapters of this report.9 Several categories of job creation resulting from policies to promote advanced technology development and deployment are very likely to expand in‐state jobs in categories typically paying above‐average wages10. Installation and supplier jobs need to be located close to in‐state customers, along with the operation and maintenance portion of service jobs. Consulting and research jobs also have ties to in‐state customers, although they are to some extent mobile. Perhaps the largest potential for job mobility into or out of California is in the manufacturing sector, as discussed below. California’s manufacturing sector has shrunk about a fifth in the last decade, several percent more than the rest of the US manufacturing sector, yet still continues to play an important role in the state’s economy by providing a total of 1.5 million direct jobs11 and important additional indirect benefits. Roughly half of California “Green” jobs for energy generation, energy efficiency, and transportation technologies are in manufacturing
Figure 23: Global “Green” Sectors in $4 Trillion Global Low/Zero GHG Market (source: UK BERR 2009 report)
Global Green Markets

Chapter Two – Economic Opportunities and Challenges
2-5
(including assembly) – approximately 13,000 overall12. Sectors related to renewable energy (largely PV solar), lighting, environmental controls, and electric drive transportation are top sectors for the most “Green” manufacturing jobs (along with heating & other machinery)13. This shows that California has an existing platform to compete for advanced technology manufacturing jobs such as renewable energy, solid‐state lighting, monitoring & controls for energy efficiency, and electric drive transportation covered in more detail in following chapters. California manufacturing enjoys competitive advantages and also suffers competitive disadvantages for capturing these jobs. An emphasis on “specialty” & flexible manufacturing may fit well with the emergence of new advanced technologies14. The proximity to financiers, markets, suppliers, and researchers is a potential advantage to California advanced technology manufacturers. On the other hand, these advantages may be offset or outweighed by California’s expensive and challenging business climate, including higher U.S. labor rates compared to international competitors (CA varies when compared to other states)15, tax rates such as sales tax for manufacturing equipment16, and higher real estate prices. Energy costs can be a serious disadvantage, in particular for energy‐intensive industries. Energy rates are higher (such as cents per kilowatt hour) than US averages and those of many international competitors17. Energy efficiency programs can offset some of this premium for industrial sectors18, and ETAAC has recommended a number of opportunities
Figure 24 (Source: Next 10)
Chapter Two – Economic Opportunities and Challenges
2-6
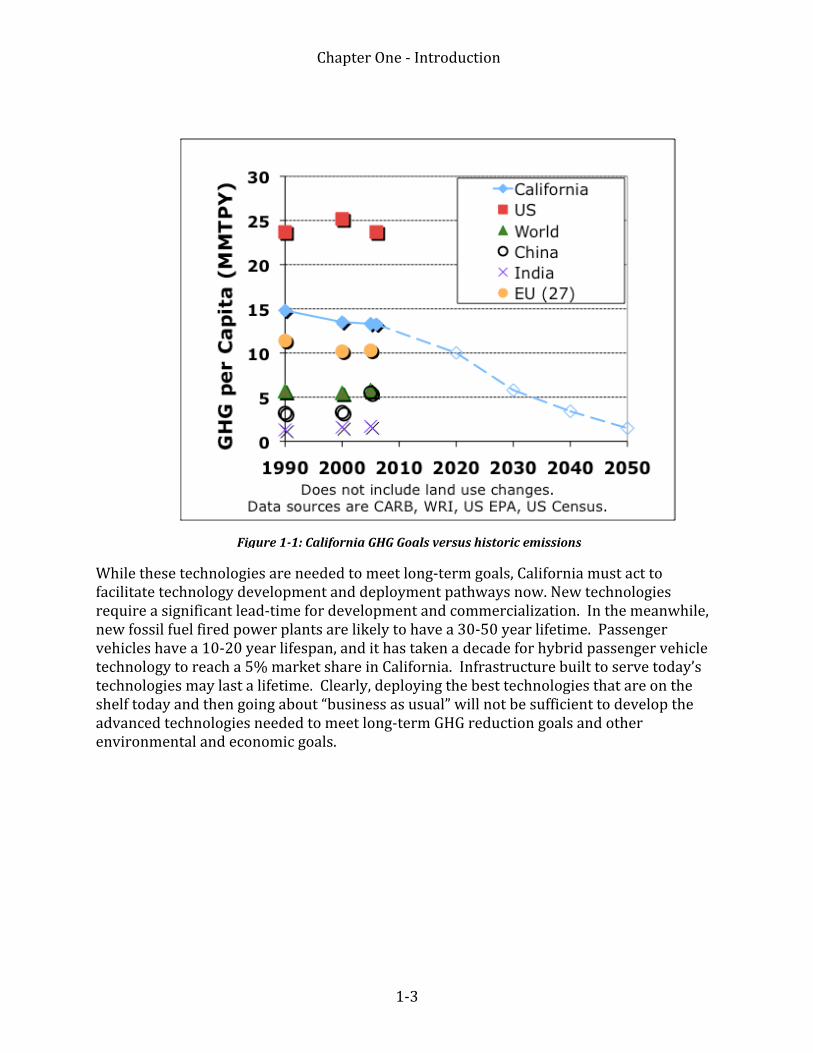
to increase these savings further in both our original February 2008 report and in the Innovative Financing and Energy Efficiency Chapters of this report. This landscape favors manufacturing advanced technologies with low input costs and healthy profit margins and disfavors those that are more labor and energy‐intensive and in some cases capital‐intensive firms. While conditions may be better for manufacturers of advanced technology than for other manufacturers, there are few assurances that even advanced technology manufacturing will be located in‐state.
2.2 Policy Recommendations On Facilitating Manufacturing’s Role In Advanced Technology Development And Deployment Access to capital and the higher upfront capital costs for low and zero carbon technologies may be the most significant barrier limiting technology development and associated economic development. ETAAC believes that capital costs combined with other barriers identified in chapter one are the reason why technologies identified as cost‐effective, such as in the McKinsey Report, are often not implemented. AB32 is likely to require significant capital investments both for manufacturers that become more efficient in response to GHG costs in their own supply chain and for companies responding to customer demand and market opportunities created by AB32. For instance, the capital cost of manufacturing facilities for plug‐in hybrid battery packs may be $3 million per 1,000 packs annual capacity or more.19. Companies in California must also pay sales tax on manufacturing capital equipment, which is exempt in most other states20. Potential solutions could be modeled on a successful program in the United Kingdom. The UK Climate Levy imposed since 2001 recycles revenues back to businesses to help them with the capital costs of making transitions that lower their carbon footprint. Companies can depreciate 100% of capital costs in the first year21, offsetting much of incremental up‐front costs of transitioning to efficient low and zero carbon equipment. Small businesses can access zero interest loans, and companies that meet reduction targets receive a major discount on the levy. AB32 cap & trade allowances paid for by California businesses could be similarly be used in part to help California businesses transition to most efficient “best in class” operations while also helping create markets for advanced zero and low GHG
Global top technology growth areas:
Wind Turbines and Systems
Photovoltaics
Alternative Fuels for Vehicles
Energy Efficient Windows
Other Alternate Fuels
Figure 25: Background on California’s “CleanTech” Manufacturing (source: UK BERR 2009 report)

Chapter Two – Economic Opportunities and Challenges
2-7
technologies. Examples of financial vehicles may include tax incentives or low/zero cost loans. Allowance value may be the best opportunity at the state level due to the difficulty of finding available state revenues ‐ although there is a potential obstacle if federal legislation is adopted that constrains how the value of allowances are used. (AB32 scoping plan fees for high global warming potential gases could be used for a similar purpose.) Another important step is making sure that small and medium sized businesses receive informational assistance accessing stimulus funding that supports advanced technology development and deployment. A UK study found that “small businesses generally have fewer resources with which to monitor government policy so are less aware of new announcements”22, which is also true in the United States. Prioritizing outreach in California, including efforts underway at some state agencies, is especially critical due to the combination of a major push to spend one‐time stimulus money and severe state agency budget constraints. It is also important to make sure that workforce training dollars from the stimulus bill or other sources are spent on high‐priority workplace needs and not just spent quickly on temporary jobs. The original ETAAC report recommended workforce training, (a major barrier identified in chapter one of this report) to address the following priorities:
Assess anticipated technological changes and workforce and training needs in advanced energy‐related fields at all skill levels;
Coordinate with relevant workforce agencies to prioritize public and private training funding in high‐growth sectors;
Identify gaps for training in emerging Cleantech sectors and existing training funding that could support Cleantech workforce development;
Promote skilled trades in construction, manufacturing and utilities to serve the specific needs of the New Energy economy;
Encourage resource‐sharing and best practice models. As noted in the 2008 ETAAC report23, demonstration project funding & partnerships will also benefit advanced technology development & deployment in California by overcoming demonstration project barriers noted by ETAAC. These programs can also help California manufacturers improve their own efficiency and competitiveness. These recommendations will facilitate the manufacturing of advanced technologies to meet environmental and economic goals, and can be best implemented as part of a comprehensive long‐term economic strategy for the state. 1 “Low Carbon and Environmental Goods and Services: an industry analysis”, Innovas, May 6, 2009, commissioned by the United Kingdom’s Department for Business Enterprise & Regulatory Reform (BERR). The accounting method for this data groups nuclear energy under “alternative fuel” in the BERR‐sponsored report. A separate value for nuclear energy was not provided. Top categories are alternative fuels, alternatively fueled vehicles, renewable energy technologies and energy efficiency technologies as shown in figure 2‐3. 2 “California Green Innovation Index”, Next 10, 2009, page 71

Chapter Two – Economic Opportunities and Challenges
2-8
3 “California Cleantech 2009: The Emergence of a Low Carbon Economy”, Environmental Entrepreneurs and CleanTech Group, page 1. Available on‐line at http://www.e2.org/ext/doc/Cleantech2009CA.pdf; last accessed 10‐19‐09. 4 Venture capital declines have been due to (1) a general concern about investment risk, (2) the lack of capital from traditional investors such as university endowments and public pension funds, (3) the collapse of the market for new public offerings (4) the collapse in valuations from mergers and acquisitions, (5) more cash required by existing portfolio companies due to a shortfall in their revenues, and (6) decline in energy prices from cyclical highs in the first half of 2008. 5 “California Cleantech 2009: The Emergence of a Low Carbon Economy”, page 3. 6 Cleantech 2009: The Emergence of a Low Carbon Economy”, Environmental Entrepreneurs and CleanTech Group, page 1. Available at http://www.e2.org/ext/doc/Cleantech2009.pdf, last accessed 10‐19‐09. 7 Clean Technology and the Growing Economy”, prepared by Collaborative Economics for the California Economic Strategy Panel, March 2008 p.13. 8“Energy Pathways for the California Economy”, David Roland‐Holst and Fredrich Kahrl, UC Berkeley, prepared for Next 10, June 2009. Executive summary p.5; “Harvesting California’s Renewable Energy Resources: A Green Jobs Business Plan”, Peter Asmus, p.8, Center for Energy Efficiency and Renewable Energy Technology February 7, 2009; “Green Jobs and the Clean Energy Economy”, Ditlev Engel and Daniel Kammen, Copenhagen Climate Council, p. 20. See also California power plant licensing applications data on transportation impacts due to job growth, which show that solar thermal electric plants are expected to have higher job growth per megawatt than fossil thermal electric plants of comparable size. 9 “California Green Innovation Index”, Next 10, 2009, page 71 10 Clean Technology and the Growing Economy” 11 ”One Million Jobs at Risk: The Future of Manufacturing in California”, Bay Area Economic Forum, March 2005, p2. 12 This number does not reflect recent job loses due to the recession nor job gains due to federal stimulus spending described in other chapters of this report. 13 Clean Technology and the Growing Economy”, prepared by Collaborative Economics for the California Economic Strategy Panel, March 2008p.17 California Green Innovation Index”, Next 10, 2009, page 71; see also federal stimulus spending section of Chapter One of this report. 14 ”One Million Jobs at Risk: The Future of Manufacturing in California”, Bay Area Economic Forum, March 2005, p.1 15 ”One Million Jobs at Risk: The Future of Manufacturing in California”, p.8 16 ETAAC February 2008 report p2‐16 17 ”One Million Jobs at Risk: The Future of Manufacturing in California”, p9 18 ETAAC February 2008 report p4‐1 19 “Redefining What’s Possible for Clean Energy by 2020”, Gigaton Throw‐down, June 2009, p. 108. 20California Performance Review, GG17 – Tax on Manufacturing Equipment, available on‐line at http://cpr.ca.gov/CPR_Report/Issues_and_Recommendations/Chapter_1_General_Government/Improving_Business_Climate/GG17.html. Last accessed 10‐19‐09. 21 This program is considered effective though not universally known and does not always completely offset the increased capital costs (HC 354, “Reducing Carbon Emissions from UK Business: The role the Climate Change Levy and Agreements”, ) and a 80% discount for meeting climate targets is another significant incentive – see also UK Climate Levy description in Next10/ ICCT Allocations Workshop Background packgrounded, April 2009 summary at http://www.next10.org/next10/pdf/allocations/FINAL_BACKGROUNDER.pdf

Chapter Two – Economic Opportunities and Challenges
2-9
22 HC 354, “Reducing Carbon Emissions from UK Business: The role the Climate Change Levy and Agreements”, p 13 and pp 29‐30 with regard to UK Climate “Levy” and associated small business interest‐free loans to reduce energy use 23 See February 2008 ETAAC report p2‐7, 2‐11, 4‐11, 4‐12, 9‐5.

Chapter Three – Innovative Financing Strategies
3‐1
Chapter Three – Innovative Financing Strategies Overview This chapter addresses innovative financing strategies to promote advanced technology development and deployment. These strategies are needed to overcome the higher advanced technology upfront costs that are often repaid over time from lower energy costs. These strategies also promote market creation by lowering the cost to consumers of technologies and products. This chapter addresses a range of market segments from renewable energy technology demonstrations to residential mortgages. It also addresses other strategies including municipal assessments, on‐bill financing, and other strategies that can benefit both California businesses and residents. We recommend that CARB evaluate and recommend complementary innovative financing mechanisms with state agency partners during the process of adopting new regulations to reduce GHG when appropriate.
(Source: SBCTechnologies)

Chapter Three – Innovative Financing Strategies
3‐2
3.1 Financial Strategies to Support Emerging Clean Energy Technologies The challenge of financing unproven technologies at scale is a large and growing component of the clean energy transition. In brief, and as discussed in the ETAAC report adopted in February of 2008, the issue arises due to a structural weakness in the clean energy finance industry: risk equity, in the form of venture capital, finances technology development while debt markets will support proven technologies in achieving infrastructure scale. The crucial intermediate step, the provision of funding for a maturing but not fully‐proven technology to demonstrate its viability in real‐world settings, is missing from the financial marketplace. As clean energy technologies mature, the absence of this financial support will only become more detrimental. The existence of this problem is well known, and potential solutions are emerging1. The purpose of this section is to explain financing and related policy options to overcome these hurdles. This section does not present a conclusive recommendation; rather it is intended to identify options and spur discussion involving ETAAC and interested stakeholders as the State engages solutions to the problems identified in ETAAC’s previous undertakings. Emerging Technologies Plan to Overcome Financial and other Barriers California does not presently have a structured plan for the consideration of interesting innovations. Absent this plan, regulators and utilities must consider each emerging technology on a standalone basis, with little means for determining the potential programmatic benefits of sponsoring one technology project over another. Formation of a statewide plan for the integration of emerging technologies with renewable energy policies and programs may encourage more strategic choices of demonstration opportunities. The CEC Public Interest Energy Research (PIER) program provides one source of R&D funding for emerging technologies. Once a technology moves beyond lab or limited field testing and is ready for a large scale demonstration (e.g., the first MW stage of deploying a new power generation technology), however, technology developers typically rely on obtaining utility power purchase agreements (PPAs) to help them secure financing. Considering that some commercially available renewable technologies already carry a cost premium (e.g., solar PV) compared to conventional fossil fuel generation, the utilities and the California Public Utilities Commission (CPUC) may be reluctant to grant PPAs for emerging technologies that could have even higher costs or carry greater uncertainties. Given the generally higher cost of emerging renewable technologies, it may be reasonable for California to develop an emerging renewables financing plan that considers different options and determines what would be best for California. A comprehensive program strategy should identify the funding source, scope, maximum amount and process for funding above‐market emerging renewable projects. The plan should also consider the potential ratepayer or taxpayer impact of any public or ratepayer funding or risk while reasonably balancing the public interest in clean energy deployment. Furthermore, the plan should consider the availability and the advantages and disadvantages of the following funding mechanisms:

Chapter Three – Innovative Financing Strategies
3‐3
Integration with the CEC PIER program for the funding of emerging technologies.
However, the PIER program as currently structured is not funded at a level that would support actually funding demonstration projects. Thus, going beyond coordination to provide any state funding through PIER or another mechanism for demonstrating renewable technologies would likely require additional resources.
Leveraging Federal Funding. Multiple federal programs exist that can aid in the progression of developing technologies, principally including direct grants, direct loans, and indirect loan guarantees as noted in chapter one. The state could consider staff to coordinate with federal agencies (US DOE and Treasury) with purview over the relevant funding programs to educate federal agencies about California’s demonstration program and potentially streamline awarding funds to worthy demonstration technologies. For example, a loan guarantee award to a technology maturing through the demonstration program could be made contingent upon verifying benchmarks as described below.
Leveraging Private Funding. Overcoming the related policy barriers identified in this
report (see examples below and for additional discussion see chapter 4) and also in the original February 2008 report may increase the viability of privately funded projects.
Set Asides. Set‐asides to promote certain technologies, such as solar, have been used
to foster their development in states that have adopted them2. In California, this could include Power Purchase Agreements with utilities subject to the Renewable Portfolio Standard (RPS). Feed‐in tariffs are a related tool that has been used to encourage specific renewable technologies. The above market cost could be covered by funding from the sources listed above if available. The rate impact of passing any above market costs passed through to ratepayers must be considered.
If taxpayers or ratepayers participate in funding above‐market costs of a demonstration finance program, they may be exposed to significant financial risk. The risks can be bounded via the planning and funding process described above. In addition, a mechanism could be created to allow ratepayers to share in the benefits and potentially recover part of the above market costs, such as through royalty payments. The royalties can be paid into a utility balancing account when projects are developed and operational, where the funds could then be credited to ratepayers to reduce rate burdens, recycled into future iterations of the demonstration finance program, or both. Integrating Strategies to Overcome Financial Barriers with Programs to Overcome Other Barriers. A core component of the demonstration challenge is the inability of new technologies to be sited and tested in real‐world operating conditions. Performance under these conditions, including the inevitable failures and the attendant systems repair and learning that occur, must be closely monitored over extended periods in order to provide project lenders

Chapter Three – Innovative Financing Strategies
3‐4
(Source: Mediabistro)
sufficient data against which to lend. It is unlikely, however, that a single demonstration facility will be optimal for the range of potential renewable technologies; a potential solution might be to set aside a dedicated portion of existing or planned resource areas for specific technology types – e.g., a wind sub‐park in the Tehachapi or solar thermal park in the Mojave, taking advantage of existing resource assessments, transmission interconnections, and other high‐cost logistical issues that demonstration‐stage companies are unlikely to be able to address. The establishment of dedicated demonstration facilities helps to address a major integration issue for small projects. Further streamlining initiatives could include:
Ensuring that land use and permitting issues are addressed at the demonstration
facility level, as opposed to being placed solely on the technology provider, creating a true “plug and play” environment for emerging technologies. This is reflective of efforts such as the Renewable Energy Transmission Initiative (RETI) to identify barriers to sites suitable for renewable development as early as possible.
Collecting the necessary performance monitoring data at the demonstration facility,
to assess technology viability and in preparation for scale‐up. If appropriate, establishing a milestone‐driven process where an emerging
technology can be validated and “graduate” to participating in the regular utility RPS procurement process, where the technology would be evaluated on equal footing with other renewable technologies.
3.2 Mortgage and HomeEquity Financing Mortgage and other home‐equity products can also play an important role in broadening the market for deployment of energy efficiency, renewable energy, and potentially also advanced transportation technologies by lowering up‐front costs and increasing customer demand. Energy Star mortgages are available for both home buyers, and for energy‐efficiency retrofits by current homeowners. Energy Star mortgage pilots in Colorado and Maine provide homeowners with significant discounts on loan costs. For instance, the Colorado Governor’s Office3 has taken a leadership role in their pilot for 2009. If successful, California should take a leadership role to also offer such loans in California and tie them into existing energy efficiency strategies. These mortgages can complement on‐bill financing and municipal

Chapter Three – Innovative Financing Strategies
3‐5
assessments described above since some homeowners may prefer a more traditional bank financing approach, or may not have access to these other alternatives. Currently, energy efficient mortgages are available to reflect the higher value of energy efficient loans and increased ability of homeowners to pay for them due to lower energy costs4. The increased use of home energy efficiency ratings can further enhance the use of these loans. The initial home‐purchase loan can also be used to finance improvements to the efficiency of a home after purchase. While the housing market has taken a significant downturn in California, the opportunity for energy efficiency savings is still very important. Transportation‐efficient loans are also available in areas where transportation costs are lower due to transit service and compact development. Alternate‐fueled vehicles which have significantly lower operating costs (such as electricity vs. petroleum) may also increase ability to repay mortgage costs, although not all of the same cost‐savings would occur compared to avoiding a car altogether. To the extent that CARB can certify operating cost savings, this may facilitate the incremental expansion of location‐efficient mortgages to transportation‐efficient mortgages. An emerging type of financial tool is Shared Equity notes. A number of entrepreneurial financial intermediaries are offering Shared Equity notes for the bulk purchase of lender‐owned or REO (real estate owned) homes and the restructuring of existing pre‐foreclosure and troubled mortgage obligations. Shared Equity‐financed REO homes can be refurbished and made energy efficient to add value to the property, the community, and the environment. Unlike a traditional mortgage lender, a Shared Equity investor participates in the future growth of a home’s value. With these notes, there is no lender but rather an investor who is entitled to a fixed percentage of the value of the home when the note matures, generally upon sale or refinancing of the home. There are no monthly payments, and accordingly, no risk to the owner of losing their home to the investor for failing to make such payments. Market participants believe that cities which are likely to have 1) a high number of REO or near‐foreclosure properties, 2) high energy costs, 3) less efficient buildings, and 4) communities already showing interest in sustainability, would be the best places to enter the market. Providing customers with the ability to learn about and compare financing to other options could accelerate market adoption, and entities seeking to invest in energy efficiency could consider a portfolio of shared equity loans. 3.3 Financial Aggregation Strategies to Support Energy Efficiency: Municipal, Utility, and Private financing 5 This section explores the need for financial aggregation to unlock the development and implementation of advanced technology by grouping multiple projects in order to lower transaction costs. Despite the broad array of market participants in the California energy efficiency and renewable energy marketplace, their activities have been largely confined to a relatively narrow band of services that are tailored to the needs of public sector tax exempt municipal customers and large companies. While it is true that local utilities and

Chapter Three – Innovative Financing Strategies
3‐6
state agencies offer programs that serve industrial and large commercial customers, large portions of the market remain underserved. Limited financial products and business solutions are available to meet the needs of key small commercial and residential customers, groups that represent a significant portion of the energy savings potential in California. Although this disconnect between market segments with the largest energy reduction potential and the foci of major market participants is a hurdle in and of itself, numerous sector‐specific barriers also limit the widespread adoption of energy efficiency. What follows is an overview of the selected financing products and approaches, a summary of existing barriers to their implementation, and a review of strategies and actions that can lead to their widespread utilization. Financial and Geographic Aggregation: Municipal Programs for Residential & Small Businesses Overview California Assembly Bill (AB) 811 (passed in July 2008) allows local cities and municipalities to finance projects by issuing a bond (or raising funds through other means) to pay for initial installation costs of distributed generation renewable energy sources (such as rooftop solar) or energy efficiency improvements. Property owners who volunteer to participate then make repayment through a property tax that remains with a property until paid off, regardless of changes in ownership. Berkeley has adopted a similar program by using its own legal authority to create a “Special Tax Financing District” that applies to property owners who volunteer for the program (there are some legalistic differences between the two approaches). Several cities are already incorporating these strategies into their energy efficiency and renewable energy initiatives, such as Palm Desert (contractual assessment), Sonoma County (contractual assessment) and Berkeley (voluntary special tax). Other cities like San Francisco, Chula Vista and Santa Monica, are also considering doing so. New York, Texas, and 11 other states have also passed similar legislation to facilitate municipal programs based on this model, and the federal government is looking at this system as a national model.6 Barriers to Contractual Assessments Although AB 811 can help remove first cost hurdles to energy efficiency and renewable investments, it does not address the challenges that a local entity faces in raising capital to fund projects and cover administrative costs. Recent recommendations made by officials in Sonoma County to take a phased approach to implementing an AB 811 initiative highlight the uncertainties surrounding the availability of county‐based sources of funding. Further, public bonds which are utilized for AB 811‐type activities would not be tax exempt.

Chapter Three – Innovative Financing Strategies
3‐7
Expansion Strategies and Areas of Support City and municipal agencies, in cooperation with local utilities, should work to formally integrate property tax‐based and other contractual assessments as a financing option under any public, private, and utility energy efficiency and renewable energy program. To the extent possible, any best practices that emerge from the Palm Desert and City of Berkeley programs, and other ongoing AB 811 motivated initiatives, should be replicated statewide. The California Energy Commission has allocated a portion of the State Energy Program funds to assist cities, counties and groups of cities and counties in implementing or continuing their own municipal financing programs. The California Public Utilities Commission, through their decision to the 2010‐2012 Utilities Energy Efficiency Portfolio and Budget, has also directed their Energy Division to conduct an “Energy Efficiency Financing Study”. On the national level, the Clinton Global Initiative has also announced the launch of a national campaign to duplicate California’s energy financing district model in 50 cities, which may help pave the way for federal bond guarantees for the bonds issued to fund energy financing districts. Use alternative sources of funds to finance projects. Federal stimulus funds for energy efficiency would be an ideal source of capital for programs to create revolving loan funds, as they would achieve shared federal and state objectives, would be quickly deployed, and would return to the local agencies for use in subsequent rounds of energy efficiency financing. Under ARRA, the CEC has expanded the amount of loans available under the existing Energy Conservation Assistance Account Program (ECAA). The Energy Commission is providing loans with a low interest rate of 1 percent that can help local public jurisdictions invest in energy efficiency, save money, reduce greenhouse gas emissions, and build new jobs and industries for their communities. The current ECAA Loan Program is still offering a low interest rate of 3 percent for energy efficiency projects that do not qualify for ARRA funding. Financial Aggregation: Utility OnBill Financing (OBF) – Residential & Small Commercial Overview Utilities’ OBF programs have proven successful for residential and small business facilities in New England, California, and some Midwestern markets. The majority of existing programs allow customers to finance efficiency projects through payments on their monthly utility bill and typically include the following elements:
No capital outlay to purchase and install equipment and implement energy efficiency measures through the receipt of an interest‐free, or low‐interest loan;

Chapter Three – Innovative Financing Strategies
3‐8
(Source: rd.com)
Customer repayments are based on estimated energy savings and are set to a “cash flow neutral” level compared to their previous energy bills; and
Ability to receive a cash rebate or incentive that can be utilized to lower the required loan amount.
A variation of OBF known as a tariffed installation program (TIP) uses a utility’s bill collection system to collect a charge that has been attached to the meter as a special tariff. TIPs may offer a mechanism for rented premises where the split incentives between landlords and tenants chronically lead to under‐investment in energy efficiency. With a TIP, the obligation is borne by the meter customer, not necessarily the building owner, and current residents can feel comfortable that they will only have to pay for improvements from which they directly benefit. Likewise, TIPs provide a mechanism for building owners to install measures in their property that may outlast the tenure of any particular tenant. Because the payment is tied to the meter, not the homeowner, TIPs allow for the current occupant to move, with the next occupant responsible for repayment. As a tariff, TIPs require the support of implementing utilities and approval from the utility regulators. In some states, legislation may be required to make TIPs enforceable. On‐bill financing is gaining ground in California. As the CPUC recently stated, “Financing was assumed to be the domain of banks, credit card companies, or special purpose government loan programs, the latter intended to make energy capital loans to state and local government facilities with presumed excellent repayment prospects. Actual experience has shown that in many customer markets the lack of access to capital for energy improvements on attractive terms may be holding back substantial levels of potential efficiency investments.” It has remained under the radar as a potential funding mechanism for energy efficiency improvements, but has gained some attention since 2005 when Sempra began its first OBF program. On Bill Financing (OBF), can address some areas and property assessment based AB811 type financing can move many other projects forward where longer loan timeframes are needed to achieve more comprehensive energy savings. Not all OBF programs are in place yet and the same applies to AB811 type financing OBF initiatives have typically been funded through a combination of sources including internal utility funds, incentive monies from system benefits charges, or state‐funded programs. Funding for the improvements can also come from the issuance of bonds, public funds, or private sources of capital. In the future, there may be additional funding pools such as using IOU ratepayer funds. The cost of individual energy efficiency installations implemented through OBF programs in the U.S. ranges from an average of $5,000 up to a total allowed project size of $250,000. The current average loan amount for Sempra’s

Chapter Three – Innovative Financing Strategies
3‐9
OBF program is $28,000. Program requirements vary according to available collateral or recourse to customers. For example, SDG&E and SoCalGas offer unsecured loans, while others, such as First Electric Cooperative, require an equipment or property mortgage lien. These utilities and SCE and PG&E have proposed including OBF as part of their 2009‐2011 program portfolio for business but not residential customers. The CPUC has issued a proposed decision for 2010‐2012 that would direct all California Investor Owned Utilities to use ratepayer funds for OBF, which would broaden the funding pool using a resource which carriers minimal costs. The proposed decision would allow utilities to raise the maximum institutional loan amount to one million dollars. Some examples of other OBF programs from which we can draw lessons include:
SCE, SoCalGas, and SDG&E offered OBF as part of their 2006‐2008 programs to small businesses; SoCalGas and SDG&E included local governments.
SDG&E and SoCalGas also offer OBF for non‐owner occupied multi‐family common areas.
SMUD offers an off‐bill loan program that operates much like on‐bill finance for residential and business customer energy efficiency needs, as well as PV solar.
PG&E is developing an interim off‐bill financing program for Institutional (governmental) customers, to be launched in 2010. A subsequent phase will include on‐bill financing for Institutional and Commercial customers in 2011.
Barriers to OBF Utilities are generally reluctant to perform what are considered traditional banking functions for their customers, which can force compliance with state consumer lending laws, and see a risk in making loans to customers using their own capital or ratepayer funds. Utilities that offer on‐bill financing limit their risk by requiring short repayment periods, typically five years or less—too short for most residential projects, which have typical payback periods of ten years or more. OBF programs in the residential sector also face the added challenge of having to comply with CPUC cost‐effectiveness tests. Expansion Strategies and Areas of Support Areas of adaptation and expansion to the plans currently being developed by the IOUs, or future iterations of on‐bill financing, include:
Develop customized energy efficiency utility programs integrated with OBF designed to provide residential and small commercial customers with the turnkey solutions (financial and technical) that are often required to implement efficiency measures. The increased levels of services associated with turnkey programs come with increased costs. Developing a specialized program that offers OBF as a centerpiece alongside a suite of technical assistance would streamline the project
Chapter Three – Innovative Financing Strategies
3‐10
development process for customers and could potentially be managed by private firms that are active in small commercial market segments.
Establish partnerships between local utilities and ESPs that can deliver engineering
and technical services to small commercial customers. Partnering with a group of pre‐screened firms would provide utilities with multiple channels to access new program participants. Private services providers would benefit from being able to offer customers an OBF option, and local utilities would benefit from having the sales and business development teams of partner firms identify and bring customers into utility programs.
Adjust cost‐effectiveness requirements for residential energy efficiency programs
that include OBF, so that repayment periods offered to customers are consistent with the time horizons required by the full range of customer classes that might benefit from the service.
Partner With Consumer Finance Institutions: In some instances utilities may not
wish to be in the business of loaning money to their customers. Therefore, one option is for utilities to partner with banks that are in the business of making loans and can manage the consumer credit evaluation and lending portions of OBF.
Financial and Technological Aggregation: Efficiency Services Agreement (ESA) – Large Commercial & Industrial Following the recent trend of the increased utilization of power purchase agreements (PPAs) as a vehicle to finance renewable energy projects, efficiency services agreements (ESAs) are starting to emerge as an attractive structure to provide comprehensive financing solutions that enable end‐users to avoid the capital outlay associated with the implementation of energy efficiency measures. Via an ESA, customers can receive 100% financing for engineering, design, construction, equipment, installation, maintenance and ongoing monitoring of energy efficiency projects. Project financing is structured as a services agreement whereby customer repayment is based on an agreed‐upon cost of avoided energy (e.g., $/avoided kWh of electricity) or share of energy savings. The ESA provider finances and develops projects via contractual agreements with a customer and an ESCO (Energy Services Company) or ESP (Energy Service Provider). Under this model, an ESA provider serves as financier and owner of energy efficiency assets and partners with service providers to carry out required project installation and maintenance activities. Customers make regular payments (e.g., semi‐annually) that are based on the energy and operating savings realized by a project. ESA payments are structured to be less than the customer’s baseline utility costs and escalate at a fixed rate. While the characteristics of individual deals vary, the fundamental framework of the ESA is consistently applied across all projects to help minimize transaction costs. Key elements of projects financed using an ESA include:

Chapter Three – Innovative Financing Strategies
3‐11
(Source: lehawes.files.wordpress)
Ownership of Project Assets, Contract Length & Pricing. The ESA provider holds title to project‐related assets during the contract period. At contract end date, customers have an option to purchase a project’s assets at fair market value. The price is set as a services charge based on a cost per unit of avoided energy or share of energy savings. An escalation schedule, based on a constant percentage rate, is defined in the ESA. ESA contract periods can vary but typically range from five to 12 years.
Measurement & Verification. An M&V plan is set forth in each ESA contract with customers and is typically prepared semi‐annually or quarterly.
Performance Guarantees. To mitigate project performance risks, the ESA provider typically obtains a performance guarantee from an ESCO or ESP. The ESA product is well suited for end‐users in the commercial, industrial, manufacturing, private higher education and health care sectors. Typical project sizes for ESAs exceed $1 million and include a variety of commercially proven energy efficiency technologies: heating, ventilation, and air conditioning (HVAC), building and equipment controls, motors, pumps, process equipment, and lighting.
Barriers to Expansion of Energy Services Agreements The ESA is a relatively new product and requires significant front‐end customer and ESCO and ESP education. The attractiveness of the ESA is constrained by the poor depreciation treatment of energy efficiency assets in commercial facilities, which are typically classified as “general building” items by the IRS that are depreciated on a straight line 39‐year property basis. In addition, third‐party owners of energy efficiency assets are not allowed to claim the EPACT28 tax deduction for energy efficiency equipment in commercial buildings per §179D of the Internal Revenue Code. Expansion Strategies and Areas of Support Integrate the ESA offering into third‐party‐run
utility programs that would provide large commercial and industrial end‐users with a comprehensive set of technical assistance and financial services.
Allow investors that hold title to energy
efficiency equipment installed at 501(c)(3) or state / municipal facilities under an ESA to be exempt from paying property tax on energy efficiency property. Third‐party owners of solar PV are exempt from any property tax payments on such equipment. However, even though energy efficiency is a higher loading order priority in California, currently, even if energy

Chapter Three – Innovative Financing Strategies
3‐12
efficiency property is being installed at a tax exempt facility under an ESA, state property taxes are still levied since an outside investor owns the energy efficiency assets. This tax burden adds an average annual expense that is equivalent to one to two percent of the total project cost and limits the applicability of the ESA in tax exempt and municipal markets.
Foster federal action to allow energy efficiency assets to receive the same
depreciation treatment and tax deduction allowances as solar and other sources of renewable energy. Specifically, in order to encourage installation of energy efficient technologies in commercial buildings: 1) Section 168 of the Internal Revenue Code should be amended to designate energy efficiency property installed in or on a commercial building as 5‐year depreciation property; and 2) Section 179D of the Internal Revenue Code should be amended to extend the allowance of the energy efficiency commercial building property tax deduction to owners of energy efficiency commercial building property who are not owners or lessees of entire buildings.
Conduct marketing and outreach activities to California industry groups and
business associations to promote the ESA structure as an alternative source of financing efficiency improvements.
1 The February 2008 ETAAC report, E2 Carbon Trust report, and pending CalCEF and CEG reports address this topic. 2 US DOE Solar Cities websiteat http://www.solaramericacities.energy.gov/resources/guide_for_local_governments/2/2/, last accessed 11‐6‐09; see also the “Go Solar” website, sponsored by the California Energy Commission and the California Public Utilities Commission, http://www.gosolarcalifornia.org/csi/index.html, last accessed 11‐6‐09. 3 http://www.nocoenergystarhomes.org/mortgages/index.html, viewed 9‐17‐09 4http://www.energystar.gov/index.cfm?c=bldrs_lenders_raters.energy_efficient_mortgage, viewed 9‐17‐09 5 This section is drawn from the white paper “New Business Models for Energy Efficiency,” produced by CalCEF Innovations in 2009 (www.calcef.org/innovations) 6 “Biden to use solar plan for model”, San Francisco Chronicle, October 20, 2009 p. C2.

Chapter Four – Renewable Energy
4-1
Chapter Four Renewable Energy Overview California’s 33% renewable energy target will play a key role in meeting both CARB’s 2020 GHG reduction goals1 and in putting the state on a trajectory for longer‐term GHG reductions. With the issuance of Executive Order S‐21‐09, directing the California Air Resources Board to adopt regulations to achieve 33% renewable electricity on a statewide basis, California’s commitment to aggressive renewables development as a core climate change mitigation strategy has never been more clear. While much of the technology needed to achieve this goal is presently available, the ARB process for developing these regulations is pending, and further innovation and deployment is essential through the 2020 timeframe and beyond. Moreover, technological development is also critical for meeting AB32’s goal of serving as a model for other countries to implement economic development along a low and zero carbon pathway. Advanced technology renewable resources also have an important role to play in meeting California’s air quality challenges – especially in regions where identified air pollution control technologies fall short of air quality goals. Developing renewable energy in California also offers important economic opportunities. Over two‐thirds of venture capital invested in California in 2008 went to renewable energy, primarily solar, stimulating important job‐creation. Locally developed renewable energy can replace fossil fuel imports with in‐state natural resources, and a number of reports have found that it provides significantly more jobs per megawatt than fossil fuel technologies2. In addition, renewable energy is already a large international market. For instance the global market for wind, solar, biomass, and geothermal technologies is estimated at about $1.5 trillion US dollars annually3 and renewables are a leading sector for high market growth potential. This chapter addresses the challenges and opportunities for the development of renewable technologies in two parts. The first part addresses issues that are faced by a number of different technologies including the proper distribution of renewable energy to load; grid expansion; and energy storage. The second part recognizes that individual technologies also face technology‐specific issues and addresses issues for solar, geothermal, biomass, and wind energy.
(source: apolloalliance.org)

Chapter Four – Renewable Energy
4-2
4.1 General Renewable Technology Issues Grid Expansion: Transmission Efforts are Key to Renewable Energy Production Goals There is broad recognition today that the nation’s interstate transmission infrastructure needs to be expanded to accommodate existing and new sources of renewable energy. This is a key example of infrastructure barriers described in chapter 1 of this report. (For more details on transmission challenges please see chapter 5 of the February 2008 ETAAC report.) Many renewable technologies are site‐specific, distant from load centers and lacking sufficient transmission to get energy to market. Expanding renewable energy production, particularly on the scale required to meet California’s goals, hinges on a renewed and significant investment in our country’s bulk electric transmission infrastructure. Simply put, without a more robust bulk transmission grid, the economic, environmental and energy security benefits that would come from the country’s immense renewable energy potential will not be captured. This transmission challenge is particularly acute for prospective project sponsors looking to build so‐called green interstate transmission superhighways in areas without regional transmission organizations, an area that includes the entire interior West. These projects can be designed and built specifically to access cost‐effective in state and out of state renewable energy resources, while at the same time minimizing land use and wildlife impacts. A key to accomplishing this vision is updating the standard policy framework governing interstate transmission financing and cost recovery. These changes will lead to a regulatory environment for transmission and enable technology investments that enhance development and utilization of location‐constrained renewable resources. In addition, federal stimulus legislation under the American Recovery and Reinvestment Act will provide additional funding to support innovative transmission efforts. Active California and regional transmission planning processes reflect these priorities. Transmission planning is a dynamic process where location of new generation and patterns of load growth affect the need to add new transmission facilities. The key barriers associated with transmission are environmental siting concerns raised as specific projects are proposed. Conflicting land use and environmental goals are issues that policy makers will need to continue addressing. California has developed a stakeholder process known as the “Renewable Energy Transmission Initiative (RETI)” designed to identify new transmission needs and to create Competitive Renewable Energy Zones. This process has produced two reports with specific mapping that is useful in identifying key areas for renewable energy development and related transmission (see http://www.energy.ca.gov/reti/documents/index.html), consistent with the recommendations contained in the February 2008 ETAAC Report.
Chapter Four – Renewable Energy
4-3
Siting and construction are also underway for some projects. Southern California Edison is currently constructing the first segment of the Tehachapi Transmission line. When fully operational, these new transmission facilities will access up to 4500 MWs of new wind generation. San Diego Gas and Electric has approval to construct the “Sunrise Transmission Line” connecting San Diego to resources to the east. There are significant opportunities for wind and other resources in southern San Diego County and Northern Baja California in Mexico. In addition, transmission upgrades that can also help open access to thousands of megawatts of undeveloped geothermal reserves have been identified. These resources would help California (and Nevada) meet their ambitious renewable portfolio standard goals with these baseload resources. Distribution System Upgrades Renewable distributed generation offers benefits to the electrical system and is a high‐priority resource in the state’s Loading Order. Growth of these resources, if properly managed, can continue to play a major role in achieving the goals of AB32. However, there are technical issues associated with the expansion of distributed generation which must be addressed as distributed generation resources continue to scale up and play an increasingly meaningful role in the state’s energy system. For example, while the number of distributed PV installations is currently low, the California Solar Initiative calls for the installation of 3000 MWs of PV by 20164. Most utility‐scale renewable facilities, by nature, are generally built in remote areas and thus require long distance transmission to transport the power to load centers (for example, wind farms). In contrast, distributed renewable generation such as solar PV provides a local generation resource that can usually be accessed much more quickly and without some concerns such as those associated with building utility scale power plants in ecologically sensitive areas. At sufficiently high levels of penetration, distributed generation can potentially help alleviate transmission congestion and/or avoid the need to build new long distance transmission, provided there is sufficient back‐up generation, energy storage and/or demand response capability to offset the load when intermittent distributed generation resources drop off. Balancing the amount of utility scale versus distributed generation would involve a complex set of variables and trade‐offs among resource quality, technology efficiency, economies of scale, transmission and distribution system upgrade costs/savings, environmental factors, equipment and installation costs, among others. This section specifically examines how distributed generation can affect the local grid and what modifications to the local grid may be appropriate. The existing electric distribution system uses a top‐down, one‐way hierarchy. Any energy that is generated must be used up by other loads on the same local feeder distributing energy to a group of homes or other customers, because the current substation protection

Chapter Four – Renewable Energy
4-4
mechanisms do not allow back feeding of excess energy. Adding large amounts of distributed generation such as photovoltaic solar onto the distribution feeders can avoid transmission bottlenecks, but at high levels may require the following modifications to the distribution system:
Voltage regulation: Feeders are not designed to accommodate on‐off energy sources. A high concentration of distributed generation from intermittent resources could cause voltage sags if the generation drops off suddenly (e.g. from cloud cover over PV systems). Conversely, the lines could become over‐energized if the amount of generation is much greater than available load on the system. The voltage distortions created by PVs as they come on line and off during operation could cause the line voltage to exceed acceptable limits.
Protection coordination: Distribution feeders are designed to isolate affected areas during a system disruption. As PV units are added to the distribution system, the adequacy of the protection devices must be reviewed for each successive installation to determine what, if any, modifications are needed to the protection scheme. As the number of PV installations increase, the level of review and coordination will also increase, which could add considerable time and cost burden to distribution planning.
Anti‐islanding: During fault events when power is shut off to a feeder circuit, any
generating equipment on the feeder must also disconnect to prevent power flow to the line. PVs are designed to shut off when “bumps” in line frequency are detected and come back on after a timed delay (generally 5 minutes) if there is no actual power outage. This also means that PV systems could and indeed do trip when frequency fluctuations occur on the line for various reasons. A large amount of distributed generation coming on and off the grid could cause PVs in the same or nearby circuits to constantly trip off and on.
Advanced Technology Solutions: Smart Grid and Smart Inverters Various Smart Grid‐related technology research and developments are underway within the State and nationally. Among these, smart inverters may have the potential to enable higher penetration of PVs and provide a number of services to optimize grid operation such as:
Enabling installed PVs to act as a resource to provide additional grid service. Communicating with the grid to integrate distributed generation and storage
facilities – for example, sending the power generated to energy storage devices or charging plug‐in EVs at specified times.
Allowing PV generation to remain connected during some grid disturbances, while meeting safety operation requirements.
Providing voltage regulation by injecting power into or absorbing reactive power from the grid. This can help prevent voltage disturbances that in benign cases cause dimming of lights or in worse cases, computer crashes or damage to equipment.

Chapter Four – Renewable Energy
4-5
However, current interconnection standards were developed for current capabilities and penetration levels, thus prohibiting inverters from providing reactive power or anything that impacts line voltage. As technological capabilities improve and penetration levels increase, standards will need to change at the national level in order for the grid to use smart inverters for voltage support (IEEE 1547 and UL inverter standards). In addition, there is no communication capability in inverters sold today (although they can be manufactured to include communication capability). California will be the first market to reach a PV penetration level that would make smart inverters useful. This will provide the potential to transform the market, but the policy framework to enable technology development and commercialization must be developed.
DOE’s Solar Energy Grid Integration Systems (SEGIS) program is studying and supporting the development of smart inverters. However, the technology development is at R&D phase. Additional support will be needed at each technology development phase, from lab testing to field demonstration, to eventual commercialization. These advanced technologies solutions are less well understood (than Home Area Network or HAN, for example, described in the Energy Efficiency section) in terms of how they should be applied and what value they create. At this early stage in the technology lifecycle, state and federal governments need to fund/support efforts that seek to demonstrate the applicability and value of these technologies to a broad set of industry stakeholders (e.g., utilities, vendors). Furthermore, similar to the situation with HAN, every effort must be made to support the development of standards that will enable interoperability and an efficient market for these technologies. By taking this approach, California will not only benefit from the deployment of advanced technology solutions but positions itself as a fertile ground for economic opportunities from smart grid innovation and advancement. Energy Storage to Facilitate Renewable Expansion and Integration Storage was identified in the ETAAC Report as an important game changing enabling technology which has significant impacts on the wind industry. Storage, utilizing batteries, compressed air, or pumped storage (hydro‐electric), uses excess generation to charge batteries, compress air or pump water which can then be used by the grid operator at a later time to generate power. The need for storage to meet California’s aggressive renewables goals is being more widely understood and has been recognized by the federal government. The Department of Energy recently issued a Funding Opportunity Announcement under the American Recovery and Reinvestment Act (ARRA) to solicit proposals for advanced energy storage. DOE noted that “Electric grid operators can utilize electricity storage devices to manage the amount of power required to supply customers at times when the need is greatest (during peak load). Electricity storage devices can also help make renewable energy resources, whose power output cannot be controlled by grid operators, more manageable. They can also balance microgrids to achieve a good match between generation and load. Storage devices can provide frequency regulation to maintain the balance between the network's load and power generated, increase asset

Chapter Four – Renewable Energy
4-6
utilization of both renewables and electric systems, defer transmission and distribution investments, and achieve a more reliable power supply for high tech industrial facilities.”5 DOE’s proposed funding of up to $200 million in energy storage demonstration projects is an important first step in providing more storage on the utility grid to allow the integration of low‐carbon resources. However, there are non‐technology challenges that must be overcome. The original ETAAC report noted the importance of energy storage to meet GHG reduction goals by helping integrate larger quantities of renewable energy from technologies that are not dispatchable (e.g. cannot be turned on & off to match demand). The report also identified the potential for synergies between electric vehicles as a potential energy storage solution, as vehicles can accept off‐peak renewables if the timing for charging is right. Energy storage can also provide many different beneficial services, including some combination of: 1) interruption avoidance, 2) outage avoidance, 3) congestion relief, 4) transmission upgrade deferral, 5) distribution upgrade deferral, 6) generation deferral, 7) time‐of‐day price arbitrage, 8) peak demand reduction, 9) renewables firming, and 10) several forms of ancillary generation service. The wealth of opportunities present two challenges: “How do you optimize between the benefits (e.g., how much ancillary services support can be provided while providing other services)?” and “How should the cost of those services be recovered?” The latter challenge results because there may be four different recipients of value: the transmission ratepayer class (Federal Energy Regulatory Commission jurisdiction), the distribution ratepayer class (CPUC jurisdiction), the generation market (CAISO recovery or energy market recovery), and/or individual customers (services market recovery). Allocating costs between some combinations of the four possible “markets” is not an easy or common task. PG&E recently was recently awarded $25 million in federal funding under the ARRA program for a $356 million project in Kern County designed to store wind energy generated in the Tehachapi Wind Resource Area.6 The Compressed Air Energy Storage project would have a 300 MW capacity with 10 hours of storage. PG&E proposes to use saline porous rock formation as storage media. Saline aquifers are abundant in California. If approved, this demonstration project may be an important advancement in energy storage. Southern California Edison was recently awarded $25 million in funding under the ARRA for a $53.5 million project to use large‐scale lithium ion batteries to store wind energy in the Tehachapi area7, and several other California energy storage projects also were awarded funding with total ARRA funding of $71 million for the state8. AES Corporation has recently added several new battery installations in Southern California and is looking for additional opportunities.9 Ultimately, the advent of plug‐in hybrid and other electric cars (see chapter six for more information) will provide a meaningful opportunity for utilizing renewable energy generation such as wind, for transportation. This will require additional investments in new infrastructure integrating wind resources with individual vehicles.
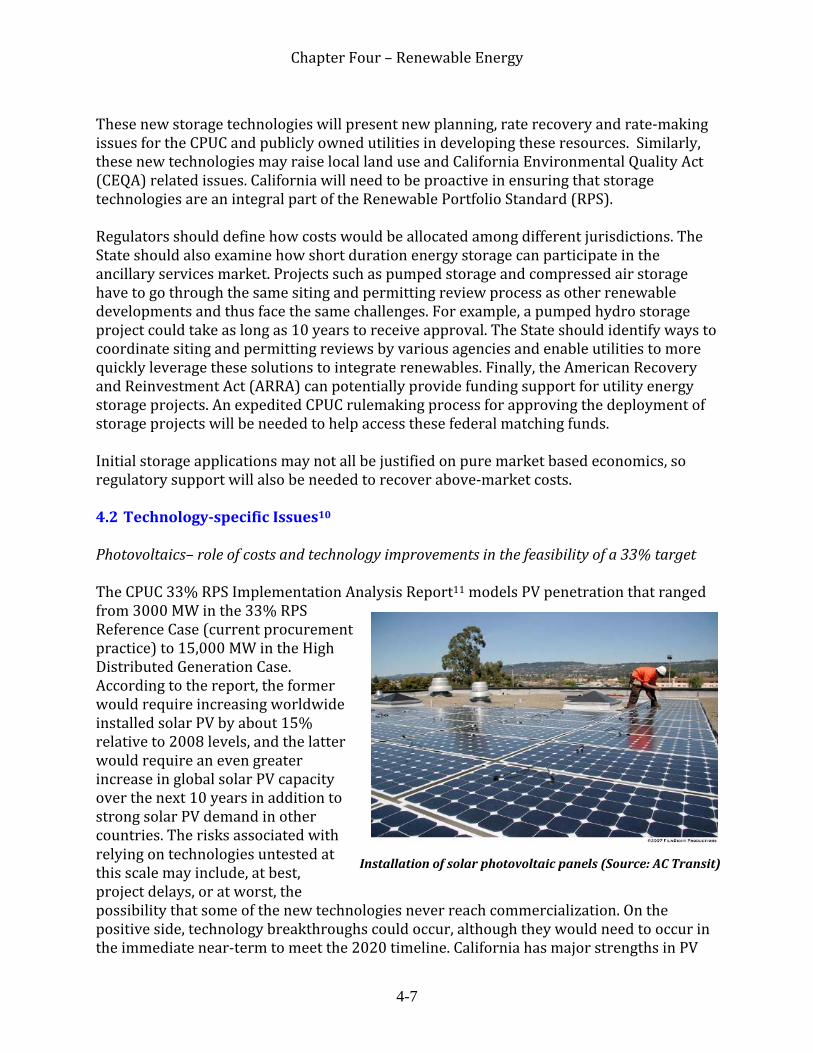
Chapter Four – Renewable Energy
4-7
These new storage technologies will present new planning, rate recovery and rate‐making issues for the CPUC and publicly owned utilities in developing these resources. Similarly, these new technologies may raise local land use and California Environmental Quality Act (CEQA) related issues. California will need to be proactive in ensuring that storage technologies are an integral part of the Renewable Portfolio Standard (RPS). Regulators should define how costs would be allocated among different jurisdictions. The State should also examine how short duration energy storage can participate in the ancillary services market. Projects such as pumped storage and compressed air storage have to go through the same siting and permitting review process as other renewable developments and thus face the same challenges. For example, a pumped hydro storage project could take as long as 10 years to receive approval. The State should identify ways to coordinate siting and permitting reviews by various agencies and enable utilities to more quickly leverage these solutions to integrate renewables. Finally, the American Recovery and Reinvestment Act (ARRA) can potentially provide funding support for utility energy storage projects. An expedited CPUC rulemaking process for approving the deployment of storage projects will be needed to help access these federal matching funds. Initial storage applications may not all be justified on pure market based economics, so regulatory support will also be needed to recover above‐market costs. 4.2 Technologyspecific Issues10 Photovoltaics– role of costs and technology improvements in the feasibility of a 33% target The CPUC 33% RPS Implementation Analysis Report11 models PV penetration that ranged from 3000 MW in the 33% RPS Reference Case (current procurement practice) to 15,000 MW in the High Distributed Generation Case. According to the report, the former would require increasing worldwide installed solar PV by about 15% relative to 2008 levels, and the latter would require an even greater increase in global solar PV capacity over the next 10 years in addition to strong solar PV demand in other countries. The risks associated with relying on technologies untested at this scale may include, at best, project delays, or at worst, the possibility that some of the new technologies never reach commercialization. On the positive side, technology breakthroughs could occur, although they would need to occur in the immediate near‐term to meet the 2020 timeline. California has major strengths in PV
Installation of solar photovoltaic panels (Source: AC Transit)

Chapter Four – Renewable Energy
4-8
solar technology development, such as leadership in venture capital investment, public and private research, and interconnections with the semi‐conductor industry – providing opportunities for economic development as well. The State needs to make a coordinated and concerted effort to remove barriers to project development and implementation and support commercialization of emerging technologies. Photovoltaic technology has made progress on several fronts since the ETAAC report was written. New ways of making thin film PV materials have moved from prototypes to production lines, increasing competition for industry‐leading silicon. The current thin film leader announced that it had broken the $1/Watt cell cost barrier at the end of 200812, followed by a competitor opening a new factory a few months later using the same material with a claimed ability to achieve even lower costs13. The cost progress with the greatest impact occurred within the silicon market. Four factors contributed to the lowest silicon cell cost in history. First, silicon shortages in the last few years created the market signal to build new silicon production factories, which went into operation recently. Second, the global recession has had some effect on demand for PV. The third factor affecting silicon cell costs was a policy change in Spain. The Spanish government reviewed the last few years’ activity in and costs of its feed‐in tariff and decided to put in place a cap that severely reduced activity in 2009. It also lowered feed‐in tariff prices in an attempt to reduce the "tariff deficit" that had forced utilities to sell electricity under cost, at an estimated loss of €4.85 billion in 200814. As the industry had planned on the continuation of a 1 to 2 GW market, the much lower cap effectively created an instant significant excess of PV modules. The fourth factor in the silicon PV market is the growth of the Chinese solar industry. The Chinese solar industry has grown quickly. In 2008 for example, 5 of the top 10 PV suppliers in the world were from China or Taiwan15 and China now has a 40% share of the world’s PV manufacturing capability16. These cell cost improvements have not produced significantly lower installed system prices, except in a few large‐scale applications. One factor affecting how little system installation costs have changed is that labor and other non‐module costs are a major part of system costs and they have not seen substantial cost reductions. Other economic factors may also be involved. One study of PV cost trends in California suggests that heavy subsidies can dampen the motivation of installers to provide, and or customers to seek, lower installed costs.17 IC Insights, a researcher specializing in the semiconductor sector, issued a report in July 2009 that summarized the net effect of the above events18. The report states that global PV production capacity in 2009 will grow 32% while installations worldwide will decline 22% on a MW basis. As a result, panel and module costs will be reduced by 28% while installed system prices will only fall by 9%. California is providing substantial financial support to promote PV. The State authorized a 10‐year, $3.3 billion19 ratepayer funded program in 2007 which aims to install 3,000 MW of new grid‐connected solar and encompasses the California Solar Initiative (CSI), the New Solar Homes Partnership (NSHP), and programs offered through publicly‐owned utilities

Chapter Four – Renewable Energy
4-9
Kramer Junction, CA (source: New York Times)
(POUs). The California grid now has nearly 50,000 sites with distributed solar PV with nameplate capacity of more than 515 MW, about 44% of which were installed under the CSI and the rest installed primarily under prior programs.20 To further improve solar PV’s competitiveness, the State can support technology developments in areas such as more efficient inverters, solar concentrators, and tracking devices, as well as mounting systems that are more labor efficient to install. In addition, the State could continue to support policies that enable greater PV penetration such as feed‐in tariffs and net metering. The State is in the process of expanding feed‐in tariffs for solar PV installations. Feed‐in tariffs offer price certainty over the long run (10‐20 years) and help improve project economics. The existing California feed‐in tariff is available to solar projects sized at 1.5 MW or below and is based on a market price referent set by the CPUC, up to a combined total of 500 MW statewide. California recently enacted legislation that expands the eligibility to projects up to 3 MW and raises the statewide cap to 750 MW. In addition, the CPUC is separately considering a feed‐in tariff for renewable projects potentially up to 10 MW. As for net energy metering (NEM), each utility has a cap of 2.5% of the utility’s aggregate customer peak demand. This cap is likely to be reached before the CSI goals have been attained – according to the CPUC, the current weighted average NEM penetration is just about 1 percent, but will be 4.5 percent if the CSI Program achieves its goal of installing 1,940 MW statewide21. The CPUC is conducting a study on the cost and benefits of NEM to participating and non‐participating customers. The State legislature is considering raising the cap to keep the CSI program going while the study is being completed. In addition, a new law requires investor owned utilities to establish a tariff by January 1, 2011, for net surplus electricity delivered to the grid by customer‐generators, at a value to be determined by the CPUC. Publicly owned utilities must establish a similar program. Further, California enacted legislation that would modify the definition of low income and expand the eligibility pool for the Single‐family Affordable Solar Homes (SASH) Program under CSI. Finally, it should be noted that the State’s RPS rules currently do not allow the inclusion of renewable energy credits (RECs) such as those generated from PV installations at customer sites. The CPUC is currently addressing the issue of tradeable RECs.

Chapter Four – Renewable Energy
4-10
Centralized Solar Thermal Progress on the concentrating solar thermal front has occurred. For instance, there are a number of solar thermal projects that have applied for a license from the California Energy Commission (CEC), but it has not been as obvious nor as widely, systematically, and transparently tracked as PV progress. Individual companies have publicized their technology developments, but most cost information is still proprietary. Applications to the CEC confirm other studies showing that solar thermal electric generation provides at least twice the in‐state jobs of fossil thermal generation per MW. Two issues slowing concentrating solar thermal are land‐use and environmental impacts (which also apply to utility‐scale PV projects). Finding a site with the best solar resources and adequate land (5‐10 acres per MW) tends to lead to project sites away from population centers, necessitating major transmission expansions. The substantial footprint requirement and the need for transmission both create environmental impacts. Policy makers need to work towards finding a balance of mitigating environmental impacts while still allowing a level of development. An additional challenge for concentrating solar thermal is the need for cooling the working fluid that runs through a turbine to produce electricity. In traditional designs, the working fluid is cooled in a “wet” evaporative cooling process that consumes large quantities of water. Many projects have addressed the issue by designing enclosed “dry‐cooled” systems similar to automotive radiators, or minimal‐water cooled plants. This is a particularly difficult issue in the desert where there is a lack of cooling water but the high ambient temperatures make dry cooling inefficient and costly. Solar thermal also has industrial and on‐site building applications. Please see chapter five for more information. Biomass Biomethane The siting and permitting of biomass power plants are becoming increasingly difficult due to air quality regulation for pollutants such as nitrogen oxides. Converting biomass and biogas to pipeline quality natural gas (biomethane) allows the biomethane to be transported to and burned in highly efficient natural gas combined cycled power plants with state of the art emissions control technologies. This turns the biomass feedstock into a flexible resource that can be stored and dispatched as needed. Biomethane is thus an effective way to increase renewable generation by displacing natural gas at existing combined cycle power plants. There are two technology options for producing biomethane: biologic conversion through anaerobic digestion and chemical processes such as pyrolysis and gasification.
Anaerobic Digestion: Anaerobic digestion processes produce biomethane from organic matter such as wastewater and animal and food waste. While anaerobic

Chapter Four – Renewable Energy
4-11
digestion technology is not new, regulatory and permitting hurdles limit the economic and project feasibility of biomethane projects. Research is on‐going to improve digester efficiency as well as upgrading the produced gases to eliminate impurities. Technologies to increase methane yield or increase throughput include co‐digestion of various feedstock, e.g. food waste, and the selection of an optimal mix of bacteria, as well as improvements in digester design and controls. These technology improvements need in‐field demonstration and technology validation before they can be scaled up. More importantly, the State needs to streamline and expedite the permitting process as noted in the February 2008 ETAAC report.
Gasification: Anaerobic digestion is suitable for wet feedstock such as animal and
food waste and sewage sludge. Gasification, on the hand, applies to dry, lignin‐rich biomass such as forest residues, straw and orchard prunings, and major portions of the MSW stream. Gasification is a thermochemical process that converts biomass into a hydrogen and carbon monoxide rich gas, which can then be converted to methane (bio‐synthetic natural gas or Bio‐SNG) through the use of a catalyst or used for other purposes. While biomass gasification for power production has been under development for some time, it has yet to reach commercial success. There are small scale biomass gasifier‐generators being deployed for power production; however, the same air regulation and other onsite generation constraints exist. Biomass gasification combined with biomethane conversion is an emerging field, and as such, many of the same barriers to entry apply – in particular, high capital cost and the need for demonstration financing.
Pyrolysis: Pyrolysis refers to the thermal decomposition of biomass in the absence of
oxygen to produce syngas or bio‐oils that can be used for heat and power production or conversion to liquid fuels or industrial chemicals. As with gasification, the pyrolysis process is suitable for agricultural or forestry residue; however, pyrolysis operates at a lower temperature than gasification and produces lower bioenergy output. Pyrolysis produces biochar as a residue. Research has shown that biochar has value as a soil amendment to increase soil productivity. By adding biochar to the soil, it can also effectively sequester carbon in the soil for hundreds of years. Additional research, validation, and protocol development are needed in this area.
Torrefaction/Pelletization One technology solution to address the biomass transport and storage issue is to pelletize woody biomass – drying, shredding and compressing the biomass into small cylinders or pellets which can then be transported to biomass power plants and burned as fuel. Wood pellets can be made from sawdust or soft wood grown in industrial plantations. This practice is generally used in Europe and the eastern US. A newer technology solution involves torrefaction – a process of heating woody biomass in an oxygen‐free environment to a mild temperature (200‐300 degrees C) and then

Chapter Four – Renewable Energy
4-12
compressing the “roasted” product into pellet form. The torrefaction process increases the energy density of the biomass to that similar to coal and also makes it brittle. This means that the torrefied pellets – also called bio pellets or biocoal – are ideal for co‐firing in coal plants. Depending on the amount used, co‐firing of biocoal has the potential to bring the GHG emissions of coal plants down significantly. Dedicated Energy Crops Dedicated biomass energy crops may provide one solution to dispersed and inconsistent biomass supply. Some crops can be purposely selected to have certain properties such as the ability to grow on marginal land, withstand drought, and produce high yield. Such crops help improve project economics by requiring less land and lowering costs associated with harvesting and transporting the feedstock, thus making dedicated energy crops a viable source for biopower. Additionally, biomass crops can be used for remediation of degraded or impaired land. For example, biomass crops can be selected to absorb selenium and grown in areas where excess selenium is an issue. Fuel Cells Using Renewable Fuels Biomethane can be used in stationary onsite fuel cells and provide a source of low emission renewable base load distributed generation. This is especially important as many of the dairies in California, which are potential biomethane sources, are located in the San Joaquin Valley and subject to stricter emissions standards due to EPA non‐attainment status for several criteria pollutants. Over half a dozen wastewater plants use biomethane from digester gas in commercial fuel cell installations ranging from several hundred kilowatts up to 1.2 megawatts.22 The food processing industry is another growing commercial application of fuel cells. Gill’s Onions in Oxnard uses onion waste to produce digester gas for two 300 kilowatt systems providing electricity, process heat, and also reducing food processing waste and waste hauling costs.23 Sierra Nevada Brewery has installed 1000 kilowatts of fuel cells that can operate on natural gas and digester gas from brewery waste. Use of waste heat can lead to efficiencies of up to 80%. Microbial fuel cells are another form of fuel cells that can be applied at wastewater treatment plants. Rather than biomethane produced by wastewater digestors as discussed above, biologic fuel cells generate electricity by harvesting the electrons produced by bacteria during the digestion of organic feedstock such as wastewater or sludge. Microbial fuel cells can serve the dual benefit of clean power production and wastewater treatment. As the injection of biogas from wastewater treatment plants and landfill gas into utility gas pipelines can be either expensive due to clean up requirements or prohibited (in the case of landfill gas), microbial fuel cells provide an ideal solution where onsite generation is not feasible, e.g. due to air emissions regulations. The development of microbial fuel cells is at an early stage with relatively low power output of less than 1 KW demonstrated thus far.

Chapter Four – Renewable Energy
4-13
High Efficiency Fuel Cell Technology Fuel cells provide many benefits: greater efficiency than distributed generation combustion technologies, ultra‐low emissions of traditional pollutants like nitrogen oxides, fuel diversity, ease of siting, and high end‐user reliability. The potential use of fuel cells is broad covering stationary, automotive, portable, emergency back‐up (such as cell tower back‐up), and motive (e.g. forklifts) applications. Fuel cell technology can also provide lower GHG emissions than commonly used distributed combustion generation. Fuel cells running on renewable fuels, or running on natural gas with effective waste heat utilization, have lower GHG emissions than grid‐supplied electricity24. Future general availability of hydrogen generated from renewable energy would create another promising opportunity. Today new, highly‐efficient fuel cell technologies being deployed in California include: Proton Exchange Membrane fuel cells (PEM) used in automotive, heavy duty truck, motive, and back‐up power applications; and molten carbonate (MCFC) and solid oxide (SOFC) fuel cells used for stationary electrical generation, combined heat and power (CHP), and combined cooling, heat, and power (CCHP) applications. Electrical efficiencies of MCFC and SOFC fuel cells currently being deployed exceed 50% and with the addition of CHP or CCHP can approach or exceed 80% overall efficiency. Fuel cell‐gas turbine systems are currently in the development and testing phase and are expected to achieve electrical efficiencies of 70% or higher. The National Fuel Cell Research Center is finalizing research on market and technical barriers and potential additional policy responses (under a California Energy Commission grant)25 and research on the monetary value of stationary fuel cells relative to other generation technologies in collaboration with a number of fuel cell companies. [For additional information on fuel cell technologies and implementation barriers, see 2008 ETAAC Report, Appendix IV: Background Status Report on Energy Technologies, Section K. Fuel Cells, p.10‐56/57] Two main programs in California support broader deployment of fuel cell technology. Fuel cells qualify for self generation incentive program (SGIP) incentives; and California recently enacted legislation (AB 1110) that allows the most efficient distributed electricity generation fuel cells to take advantage of subsidized natural gas delivery rates formerly only available for combined heat and power (CHP).26 Wind Wind energy is an integral part of California’s renewable resources. California was an early leader in incorporating wind resources as a part of the energy mix with contracts, tax policies and other incentives to encourage wind development. California was the primary wind market for many years. The California Public Utilities Commission estimates27 that between 7500 MWs (reference case) and 9500 MWs (high wind scenario) of new in‐state wind generation would be needed to meet California’s 33% RPS goals.

Chapter Four – Renewable Energy
4-14
(source: Wagner Christian)
Today, California’s wind capacity ranks third behind Texas and Iowa. While there is continued interest in building new wind generation, as well as repowering existing sites with newer technology, wind faces several infrastructure and environmental challenges. These include:
Technology Development Integration of intermittent wind into the grid Avian impacts Transmission to wind resource areas (as addressed above)
The CARB Scoping Plan calls for a 33% Renewable Portfolio Standard. Wind energy resources will be an important component in meeting this RPS policy. Therefore, it is essential that these challenges be expeditiously addressed. Technology Development Wind technology development has played an important role in bringing wind energy costs down dramatically. While the technology is fairly mature, there are also further technological developments that can play an important role in expanding wind energy further. The Wind Energy Research and Development Act of 200928 was passed by the US House of Representatives in September 2009. The bill directs the Secretary of Energy to carry out a research and development program focusing on specified areas, including: (1) new materials and designs to make larger, lighter, less expensive, and more reliable rotor blades; (2) technologies to improve gearbox performance and reliability; (3) automation, materials, and assembly of large‐scale components to reduce manufacturing costs; (4) advanced generators; (5) wind technology for offshore applications; (6) methods to assess and mitigate the effects of wind energy systems on radar and electromagnetic fields; and (7) wind turbines with a maximum electric power production capacity of 100 kilowatts or less. Improving the reliability and capacity of wind while reducing costs through this research program and associated demonstration financing would help make wind even more competitive with fossil energy in California and other areas.

Chapter Four – Renewable Energy
4-15
Grid Integration Wind energy is an intermittent resource due to meteorological conditions, which can change seasonally, or even over the course of the day. Therefore, integrating wind generation into the grid is an important issue for fully developing potential wind energy resources. The grid operators, also known as “balancing authorities” are responsible for keeping the transmission grid balanced in real time at 60 hertz line frequency. This is a very dynamic process as load fluctuates throughout a day with generation dispatched to follow it. The “integration” challenge for wind is matching its availability to demand. There are several strategies for addressing this issue. Operationally, wind availability is not a random event. Wind resource areas have been well studied as to wind patterns so that wind availability is generally understood. Sophisticated software predicting wind is available to grid operators for dispatch decision‐making. The larger the operating area of the grid operator the less significant the integration issue may be, because the wind resources will be geographically dispersed. Wind may not be available in one area, yet still could be blowing hard in another. Managing intermittent resources over a larger geographical area with multiple grid operators may be an effective integration strategy. Back‐up generation is also available. The CAISO (California Independent System Operator) will dispatch fossil fuel “peaking” plants to meet the ramping needs of wind resources. The wind resources displace this fossil generation in other times of the day. However, it is important that electricity products in the form of ancillary services are available to meet this growing need. Avian Issues A California wind developer will generally spend three to six years to obtain a permit to build a wind project, and spend on the order of $1 ‐ $3 million to conduct the required environmental studies and navigate the permitting process. Avian issues are a substantial part of that process. Substantial research (at least $5 million over three years) is needed to improve the efficiency and efficacy of the environmental study and permitting process. In 2007, the California Energy Commission and California Department of Fish and Game released the document “California Guidelines for Reducing Impacts to Birds and Bats from Wind Energy Development” (Guidelines) to provide recommended protocols for assessing and minimizing impacts from wind energy development to birds and bats. The Guidelines also recommended mitigation measures. In October 2008, the CEC released a “Roadmap for PIER Research on Methods to Assess and Mitigate Impacts of Wind Energy Development on Birds and Bats in California” (Roadmap). The Roadmap identifies scientific uncertainties and several short‐ and long‐term research needs to determine the methods that are most effective in predicting fatalities at sites of various types.

Chapter Four – Renewable Energy
4-16
Absent this research, wind energy developers must comply with voluminous recommendations in the Guidelines while also conducting the studies that are necessary and appropriate for a particular site. The result is an inefficient, unduly expensive, and time‐consuming process. Further, the Guidelines lack any structure for determining which studies should be conducted, to what extent, at any particular site. Such a framework should involve asking and answering questions like: What are we trying to determine with the data we are collecting? How much data is needed of what quality to be confident in the predicted mortality? Which sites need less study and which sites more? Developing such a framework should be rigorously tested with real data. The wind industry believes that a relatively modest research effort, aimed at ensuring the effectiveness and efficiency of study techniques in accurately predicting and mitigating avian/bat impacts, could significantly reduce both the time and expense of the permitting process while improving environmental outcomes. Geothermal Power Background Geothermal power continues to be an important and growing part of the energy supply mix in the Western United States, as grid‐connected geothermal power plants currently provide baseload power in California, Nevada, Utah, and Idaho with reliability of 90% or greater29. Geothermal energy produced 4.5% of California’s electricity in 2007, producing 24 hours a day (although energy storage could also benefit this technology to the extent that it allows shifting off‐peak electricity to peak periods of demand). Moreover, a recent study by researchers at Stern School of Business at New York University concludes that geothermal energy is on the verge of becoming a better investment than fossil fuel.30 In September 2008, the U.S. Geological Survey estimated that geothermal reservoirs in 13 states could produce upwards of 9,000 megawatts of electricity—as much as nine nuclear reactors. The actual potential of geothermal power may be much greater, though, because scientists have never fully assessed the moderate‐to‐high‐temperature resources that are available. The U.S. Geological Survey report suggests that it may be possible to generate an additional 30,000 megawatts of power from moderate‐to‐hot geothermal resources that have yet to be discovered. The Western Governor’s Association found that adding new geothermal power capacity of 5,600 MW by 2015 could add nearly 10,000 jobs, and also generate about 36,000 person‐years of construction and manufacturing business31. Geothermal Development Despite the lagging economy, interest in new geothermal power projects remains strong. The Geothermal Energy Association’s (GEA) most recent industry update in March 2009 showed a 25% increase in new geothermal projects since August 2008 and a 35% increase in overall power production potential of new geothermal projects. The GEA report identified 126 geothermal projects under development with the potential to put 5,500

Chapter Four – Renewable Energy
4-17
megawatts of new capacity on line. Nevada has the most production under development, with 60 projects totaling potential capacity of 1,765‐3,300 megawatts, with California second with 28 projects and potential capacity of 1,050‐1,350 megawatts. Many Native American tribes in California and elsewhere are also now considering geothermal power for their energy needs. For instance California’s Fort Bidwell Indian community received Department of Energy funding to assess geothermal potential. Impact of the American Recovery and Reinvestment Act 32 The recently enacted federal stimulus package (the American Recovery and Reinvestment Act of 2009) is a direct and positive driver for increased geothermal energy development, through tax incentives, loan guarantees, and research and development funding. In addition to the tax and loan incentives for renewable energy described in chapter 1, the legislation also provided $400 million in new funding for the U.S. Department of Energy’s (DOE) Geothermal Technologies Program to implement a wide range of research, development, demonstration, and deployment activities that will fund important and unique opportunities for the geothermal industry. This DOE program will spur new jobs in the industry, the development and deployment of new technology, and growth in new applications for the geothermal marketplace. The DOE has announced a series of specific funding solicitations targeting key areas for near‐term and long‐term industry and technology advancement, including the following:
Geothermal demonstration projects ($140 million) – Funding will support demonstrations of cutting‐edge technologies to advance geothermal energy in new geographic areas, as well as geothermal energy production from oil and natural gas fields, geo‐pressured fields, and low‐ to moderate‐temperature geothermal resources.
Enhanced geothermal systems technology research and development ($80 million)
– Funding will support research of enhanced geothermal systems (EGS) technology to allow geothermal power generation across the country. Conventional geothermal energy systems must be located near easily accessible geothermal water resources, limiting its nationwide use. EGS makes use of available heat resources by technologically engineering reservoirs so they are capable of producing electricity in otherwise untappable areas. While the long‐term goal of EGS is to generate cost‐competitive clean electricity, enabling research and development is needed to demonstrate the technology’s readiness in the near term.
Innovative exploration techniques ($100 million) – Funding will support projects
that include exploration, siting, drilling, and characterization of a series of exploration wells utilizing innovative exploration techniques. Funding the exploration of geothermal energy resources can carry a high upfront risk. By investing in and validating innovative exploration technologies and methods, the Department of Energy can help reduce the level of upfront risk for the private

Chapter Four – Renewable Energy
4-18
sector, allowing for increased investment and discovery of new geothermal resources.
In total, geothermal funding to the DOE under the American Recovery and Reinvestment Act is expected to support up to 90 new projects. The DOE will select up to 20 demonstration projects to bring 20 megawatts in new applications on‐line, such as oil and gas co‐production. The DOE expects to select 30 new research and demonstration projects and will support exploration at 40 projects anticipated to involve up to 400 megawatts of new capacity. All of these projects are in addition to the 126 new industry projects identified above. The DOE hopes to complete an expedited review of the numerous applications it has received under these solicitations and expects to announce decisions by late summer or early fall 2009. Geothermal Leasing Improvements Facilitate Growth A strong market, financial incentives, and technology and deployment support are all important measures. But with roughly half of the geothermal power production taking place on public lands, federal agency leasing and permitting activities are also important for the industry’s future. There are currently 39 geothermal power plants operating on 354 federal geothermal leases. The US Bureau of Land Management (BLM) has been moving forward with a strong program intended to support geothermal production on appropriate public lands following the enactment of changes in the federal geothermal leasing laws in the Energy Policy Act of 2005. The BLM published a programmatic environmental impact statement (PEIS) for geothermal leasing on public lands and held a competitive geothermal lease sale for 255,354 acres in California, Nevada, and Utah earlier this year. The plan allocates approximately 111 million acres of BLM lands and 79 million acres of National Forest System lands for leasing and allows pre‐existing studies on specific lands to be used along with best management practices. The change should help reduce the processing time of future geothermal power development. Up until recently (before the issuance of the PEIS) most leases were processed in 2‐3 years and BLM hopes the PEIS will reduce the process to 6 months.33 Emerging Geothermal Technologies As geothermal technology progresses, resources that were previously not considered viable are now receiving new scrutiny. The term enhanced geothermal systems (EGS), often categorized under the term “hot dry rock,” refers to any resource that requires artificial stimulation. This includes resources that have to be fully engineered or that produce sub‐commercial hydrothermal fluid. One technique involves drilling down at least three miles, pumping water to the hot rock there to capture the heat, and then forcing the hot water back to the surface to run electricity‐generation turbines. Although EGS technology is still young and many aspects remain unproven, several projects are currently underway. If EGS technology proves commercially successful, it will significantly increase the output from existing geothermal fields and result in the development of geothermal

Chapter Four – Renewable Energy
4-19
(source: greenoptomistic.com)
energy in previously unproductive locations. In 2008, the DOE selected 21 recipients for the research, development and demonstration of EGS including a Nevada project that could lead to the first EGS plant, producing 5 MW. Subject to annual appropriations, the DOE will provide up to $43.1 million over a four year period to the awardees, including universities, which should help promote innovation. With cost‐share by the recipients, the public‐private investments will be up to $78 million. Barriers to the Development and Expansion of Geothermal Resources Conventional energy industry investors may continue considering geothermal a challenging investment option due to the high cost of development and exploratory risk with long cost recovery time frames. Geothermal exploration and development is similar to the high risk profile in oil and gas exploration, but without high return potential, as geothermal profits are usually subject to more regulated electricity markets. The high upfront risk, coupled with the moderate return on investment, has detracted from investment over the years, but new policies and technology possibilities are increasing interest in geothermal once again. One of the greatest near‐term barriers to geothermal development is the scale of its power plants compared to the feasibility of development. The large resources at The Geysers in Northern California, for example, have been largely developed, so geothermal power plants are becoming smaller – using technology breakthroughs to generate electricity from lower temperature resources. The small‐scale plant itself can be profitable and cost feasible allowing construction of these projects in time to meet the frequently‐expiring federal production tax credit. However, transmission access and infrastructure build‐out requirements as noted earlier pose problems regarding feasibility of scale for a long‐term geothermal strategy. EGS, expected to be the new generation of geothermal technology, is receiving significant government funding. The current challenges of EGS regard reservoir management, connectivity and feasibility of drilling at extended depths and low permeability. As these technical challenges are being addressed, EGS will open new possibilities while at the same time magnify current constraints. EGS will attempt to improve returns by expanding the location and scalability currently limited by resource requirements. Exploration risks, however, will be magnified as EGS continues to expand the boundaries of the current terrain by potentially drilling deeper wells, engineering subsurface reservoirs or expanding current reservoirs.

Chapter Four – Renewable Energy
4-20
Despite increased focus and investment, the following market penetration challenges persist:
Access to capital – High risk capital requirements in the early stages of project development are a barrier for geothermal exploration.
Drilling – Rising drilling costs and competition with the oil and gas industry for similar talent and capital reduce the attractiveness of geothermal investment.
Leasing and permitting – Land lease and permit processing may not be able to keep up with demand.
Skilled labor – Experienced scientists and engineers are aging and retiring while the industry demands more skilled labor.
Water supply –EGS areas of the Western United States with potential geothermal development are susceptible to water supply shortages and constraints.
At a July 2009 meeting of geothermal developers, operators, suppliers and consultants sponsored by the Geothermal Energy Association, participants listed the following factors as impediments to the development and expansion of geothermal resources (from most significant to least significant):
Lack of financing High total project costs High risk of development Inadequate transmission Permitting delays Need for better resource information Federal/state policy changes Drilling risks Inadequate government support Environmental restrictions, and Other.
Areas for Further Research and Development At the July 2009 geothermal meeting, participants listed the following as the most critical areas for further research support (from most critical to least):
Resource identification More successful drilling Lower cost drilling Finding hidden resources New exploration technology Reservoir engineering techniques Higher efficiency cooling systems Lower temperature power production

Chapter Four – Renewable Energy
4-21
Enhanced geothermal systems, and Higher efficiency power systems.
Geothermal Energy and Induced Seismicity One controversial issue associated with EGS is the impact of induced seismicity, which has been the cause of delays and cancellation threats of at least two EGS projects worldwide. The oil, gas, mining, hydropower, and other extractive industries have long histories and substantial experience with seismicity due to hydrofracturing and other surface and subsurface activities. Earthquake activity, or seismicity, can be induced by human activity, including development of geothermal fields, which can result in low magnitude events known as “microearthquakes” which have Richter magnitudes below 2 or 3 and are generally not felt by humans. A recent New York Times article (June 24, 2009) on a microearthquake set off by EGS drilling in Basel, Switzerland has raised some concerns in California about the possibility of a similar event at The Geysers as a start‐up company intended to begin drilling using the same techniques to fracture hard rock more than two miles deep to extract its heat. Residents of the region, which straddles Lake and Sonoma Counties, have already protested smaller earthquakes set off by a less geologically invasive set of energy projects there. Some seismologists believe that breaking rock that far down carries more serious risk. Because geothermal operations usually take place in areas that are also tectonically active, it is often difficult to distinguish between geothermal‐induced and naturally occurring events and many regions where geothermal development has occurred or has been planned are already known as areas with high levels of fault activity. A seismic monitoring committee has been established at The Geysers to provide an open forum for concerned individuals. The environmental impact report prepared in connection with the project to bring in supplemental water from Lake County for injection at The Geysers determined that a geothermal facility would induce less than significant increases in seismic activity. The Australian government has published a report on the risks associated with hydrofracturing.34 Its findings are consistent with the findings of a Lawrence Berkeley Laboratory study published in 2006, which concluded that “EGS‐induced seismicity need not pose a threat to the development of geothermal energy resources if site selection is carried out properly, community issues are properly handled and operators understand the underlying mechanisms causing the events.”35 The Geothermal Energy Association’s website has five new issue briefs on this topic and others.36 1 The ARB’s Scoping Plan shows that a 33% RPS could contribute up to 21.3 MMT out of 169 MMT of CO2e reduction. 2 for instance, see Deloitte report for US DOE, http://www.geo‐energy.org/publications/reports/Geothermal_Energy_and_Jobs_Issue_Brief.pdf 3 Low Carbon and Environmental Goods and Services: an industry analysis, page 75, Innovas, May 6, 2009, commissioned by the United Kingdom’s Department for Business Enterprise & Regulatory Reform. Exchange rate of 1 US dollar to .611 UK pounds as of 10‐18‐09.
Chapter Four – Renewable Energy
4-22
4 http://www.cpuc.ca.gov/puc/energy/solar/aboutsolar.htm 5 U. S. Department of Energy National Energy Technology Laboratory Recovery Act – Smart Grid Demonstrations Funding Opportunity Number: DE‐FOA‐0000036 6 http://www.next100.com/2009/08/pge‐opts‐for‐energy‐storage.php 7 Ibid. 8 US Department of Energy, November 25, 2009. http://www.energy.gov/news2009/documents2009/SG_Demo_Project_List_11.24.09.pdf 9 http://ir.a123systems.com/releasedetail.cfm?ReleaseID=403097 10 Categorized based on CPUC 33% RPS Report categories 11 http://www.cpuc.ca.gov/NR/rdonlyres/1865C207‐FEB5‐43CF‐99EB‐A212B78467F6/0/33PercentRPSImplementationAnalysisInterimReport.pdf 12 http://investor.firstsolar.com/phoenix.zhtml?c=201491&p=irol‐newsArticle&ID=1259614 13 http://earth2tech.com/2009/04/14/new‐name‐same‐ambition‐abound‐solar‐hot‐on‐first‐solars‐heels/ 14 http://www.planetark.com/dailynewsstory.cfm/newsid/50395/story.htm 15 http://www.icinsights.com/news/bulletins/bulletins2009/bulletin20090720.html 16 US‐Jiangsu Solar Business Summit 2009 17 The Gigaton Throwdown report, 2009,(http://www.gigatonthrowdown.org/files/Gigaton_EntireReport.pdf) 18 IC Insights, "Solar Energy: Growth Opportunities for the Semiconductor Industry", 2009 19 CSI: $2.167 billion, 1940 MW; NSHP: $400 million, 360 MW; POU programs: $784 million, 700 MW. 20 California Public Utilities Commission, California Solar Initiative Annual Program Assessment, June 30, 2009. http://docs.cpuc.ca.gov/PUBLISHED/GRAPHICS/103079.PDF 21 California Public Utilities Commission, California Solar Initiative Annual Program Assessment, June 30, 2009. http://docs.cpuc.ca.gov/PUBLISHED/GRAPHICS/103079.PDF 22 Jonathon Foster, California Air Resources Board, personal communication October 27, 2009. 23 Source: Reuters, “U.S. company converts onion juice to electricity”, Fri Jul 17, 2009; available via web at http://www.reuters.com/article/lifestyleMolt/idUSTRE56G4IF20090717, last accessed October 27, 2009; for more information see also http://www.gillsonions.com/video/ 24 This discussion uses a 0.40 MTCO2/MWh rate, based on a marginal heat rate of 7,000 Btu/kWh for marginal generation and avoided 6.9% transmission and distribution loses assuming all power generated is consumed onsite with no export 25 “Exploration and Prioritization of Fuel Cell Commercialization Barriers for the Use in the Development of a Fuel Cell Roadmap and Action Plan for California”; Josh Eichman Jack Brouwer, Scott Samuelsen; National Fuel Cell Research Center, Mechanical and Aerospace Engineering, University of California, Irvine: Proceedings of ASME 2009 Seventh International Fuel Cell Science, Engineering and Technology Conference. 26 National Fuel Cell Research Center (May 2008). Two reports: Large Fuel Cells (>100kW)—“Build‐Up of Distributed Fuel Cell Value In California,” Small Fuel Cells (<100kW), “PEM Fuel Cells: Value in California,” Lori Schell, Scott Samuelsen http://www.casfcc.org/2/StationaryFuelCells/MonetizingFuelCells.aspx 27 California Public Utilities Commission 33% Renewables Portfolio Standard Implementation Analysis Preliminary Results, June 2009. http://www.cpuc.ca.gov/NR/rdonlyres/1865C207‐FEB5‐43CF‐99EB‐A212B78467F6/0/33PercentRPSImplementationAnalysisInterimReport.pdf 28 http://www.opencongress.org/bill/111‐h3165/text

Chapter Four – Renewable Energy
4-23
29 http://www.westgov.org/wga/initiatives/cdeac/Geothermal‐text.pdf 30 See Melissa A. Schilling and Melissa Esmundo, “Technology S‐curves in Renewable Energy Alternatives: Analysis and Implications for Industry and Government,” in “Energy Policy 37” (2009) pp. 1767–1781. 31 http://www.westgov.org/wga/initiatives/cdeac/Geothermal‐text.pdf 32 For more information about some of these projects, go to http://www.eere.energy.gov/tribalenergy/projects_technology.cfm. 33 More information on the BLM’s plan is located at http://www.blm.gov/wo/st/en/info/newsroom/2008/december/NR_12_18_2008.html 34 “Induced Seismicity and Geothermal Power Development in Australia”, at: www.ga.gov.au/minerals/research/national/geothermal/ 35 See “Induced Seismicity Associated with Enhanced Geothermal Systems,” Ernest L. Majer, Lawrence Berkeley National Laboratory, 2006, LBNL‐LBNL‐61681, at http://repositories.cdlib.org/lbnl/LBNL‐61681/. 36 available at http://www.geo‐energy.org/publications/reports.asp

Chapter Five ‐ Energy Efficiency
5-1
Chapter Five Energy Efficiency Overview of Energy Efficiency: A Critical Path to GHG Reductions California has long supported programs, technologies, and policies that promote energy efficiency as a cost‐savings means of achieving critical air quality, energy use reduction, and greenhouse gas (GHG) mitigation goals. The success of existing programs has played a major part in California’s ability to keep per‐capita electricity demand flat rather than following the national trend of increasing per‐capita demand for electricity. While California will continue to enjoy the cost‐savings and environmental benefits of electricity consumption a third less than other areas of the country, meeting California’s GHG goals will require accelerating that trend with development and deployment of advanced technologies for both electricity and natural gas efficiency. These technologies will also play a role in meeting air quality goals and helping keep California’s businesses competitive while promoting the development of new markets that can help California’s economy. This chapter provides a brief overview of critical advanced technologies for California homes, industries, and businesses.
(Source: LED Power)

Chapter Five ‐ Energy Efficiency
5-2
5.1 Existing Policy Framework The following brief overview of relevant California activities underscores the State’s commitment to energy efficiency. In 2003, the California Energy Action Plan—a joint publication of the California Public Utilities Commission (CPUC) and the California Energy Commission (CEC) —established energy efficiency as California’s top‐priority resource for meeting energy demand. A 2005 update to the Plan reiterated this policy, noting, “Energy efficiency is the least cost, most reliable, and most environmentally‐sensitive resource, and minimizes our contribution to climate change.”1 The CPUC’s Long‐Term Energy Efficiency Strategic Plan, published in 2008, focuses on technologies and actions that will significantly optimize California’s energy use—and dramatically decrease GHG emissions—over the next 10 years. Other state activities, including legislation and the Governor’s Green Building Executive Order, further highlight California’s reliance on advanced energy efficiency technologies to achieve significant GHG reductions. California’s investor‐owned utilities (IOUs) and publicly‐owned utilities (POUs) have implemented effective approaches to energy efficiency for the past 30 years. The most recently proposed three‐year program for California’s IOUs could achieve significant cost‐savings and carbon dioxide reductions over the lives of the measures installed during a 3‐year portfolio. Similar programs run by the State’s POUs, as required by AB2021, will also yield GHG reductions. In addition, POU energy efficiency expenditures for FY08/09 are expected to increase to over $150 million resulting in 128 megawatts of savings during the summer peak in addition to the savings shown below.2
Entity and Years
Annual Electric Savings
Annual Gas Savings
Annual CO2 Saved
CA IOUs 2010‐20123 6,965 GWh 150.3 Million
Therms 3,070,00 Mt
CA POUs POUs 2009 625 GWh N/A 270,000 MT4
Building on this momentum, the Climate Change Scoping Plan (Scoping Plan) published in December 2008 by the California Air Resources Board (CARB) envisions applying energy efficiency to reduce electricity demand by 32,000 gigawatt‐hours and gas use by 800 million therms, cutting GHG emissions by more than 26 million metric tons by 2020.5 However, the Plan cautions, “Achieving the energy efficiency target will require redoubled efforts to target industrial, agricultural, commercial, and residential end‐user sectors, comprised of both new initiatives … and improvements to California’s traditional approaches of improved building standards and utility programs.”6 The American Recovery and Reinvestment Act is making an estimated $35.5 billion7 available for energy efficiency nationally. Of this, California state and local agencies, as well

Chapter Five ‐ Energy Efficiency
5-3
as local governments expect to receive an estimated $3.1 billion8 , which will be distributed through numerous agencies including the US Department of Energy (DOE), California Energy Commission, Department of Housing and Urban Development, Department of Agriculture, and General Services Administration. Part of the funding coming to California includes $3.2 billion9 from DOE slated for block grants to local governments. This money can help pay for energy efficiency retrofits using advanced technologies to help overcome the incremental costs ‐ a barrier that ETAAC has recognized as both prevalent and significant ‐ of energy efficiency technologies. Finally, California’s long‐term planning process, embodied in the Integrated Energy Policy Report and the long‐term procurement plan, provides a basis for both assessing GHG potential as well as the mechanisms—described above—that lead to the promised GHG reductions. 5.2 Promising New Technologies for Enhanced Energy Use and GHG Reductions Among the new initiatives called for in the Scoping Plan are advanced technologies that can help California retain its leadership in energy efficiency and GHG reductions. Described below are the key new technologies either on the horizon or recently introduced that could, with additional support, join the State’s arsenal of energy efficiency measures and lead to significant GHG reductions. Table 1 at the end of this chapter provides a brief summary of these technologies including GHG savings, potential barriers and policies to address those barriers. Industrial and Commercial Solar Thermal Hot Water and Steam Systems Many are looking to solar thermal systems—which convert the sun’s radiation into usable heat—as a means of sharply reducing natural gas consumption. Typical solar thermal systems employ lenses, a concentrating mirror, or other emerging technologies to concentrate the sun’s radiation. This concentrated heat in turn heats a fluid (often water/glycol mixtures or mineral oils) to almost 400°F or higher. The hot fluid is then fed into a boiler to generate steam or hot water for process needs, in place of on‐site natural gas combustion or to generate electricity. These solar thermal steam generators eliminate the need for much of the natural gas now consumed by boilers and heaters used for industrial processes and commercial buildings in California—a reduction that directly decreases GHG emissions. One example is a snack food plant with solar thermal troughs to make steam10. Another application uses a solar thermal power tower to make steam for enhanced oil recovery11. Both are good examples of ways to harvest the sun’s energy to reduce the use of fossil fuels and greenhouse gas emissions. Commercial and industrial users can currently expect a payback of five to ten years. That payback period will likely shrink as costs are assigned to GHG emissions, lowering a primary barrier to implementation. In addition, several current cost reducing innovations (e.g., new materials, modular installation) are specific to smaller scale hot water and steam systems.

Chapter Five ‐ Energy Efficiency
5-4
An interesting opportunity may occur if new utility scale electricity generation cross‐fertilizes with other sectors with significant thermal and electrical needs. The Renewable Portfolio Standard (RPS) driving the solar thermal electricity generation sector is resulting in some spill‐over in that the companies drawn to that market‐place are also expanding into systems for commercial/industrial customers. Some technology developments from utility scale solar thermal electric generation can spill‐over into thermal solar technologies located on‐site for end‐users. In terms of implementation, non‐residential customers currently are eligible for incentives of $1.00 per therm of natural gas saved over a year of operation through the California IOUs energy efficiency programs. In addition, the CPUC has recently proposed a California Solar Initiative – Thermal Program that is intended to parallel the successful California Solar Initiative (CSI) program for solar PV systems. The exact details of this program are still in discussion, but it may offer incentives above $1.00 per therm for commercial/industrial systems in early 2010. Benefits to California companies include cost‐savings and improved competitiveness for companies that adopt this technology, potential for increased job density in California when imported fuels are displaced, and installer and other potential jobs. Wastewater Treatment Technologies now coming to market can decrease the energy consumed in wastewater treatment and open the door to interrelated approaches that reduce the GHGs—primarily methane—released from wastewater treatment processes. Wastewater treatment falls primarily into two categories:
Municipal systems: Taking the form of either a plant or a large lagoon (where land is available), municipal systems are operated by a city or county and receive waste from the municipal sewer system, which generally mixes wastes from many residential, commercial and industrial sources.
Industrial systems: Typically smaller lagoons, industrial systems are operated on‐
site at an industrial or food processing facility. These systems treat waste generated only by that facility prior to discharge to land, water, or sewer.
Both municipal and industrial systems depend on two principal methods for treating wastewater: aerobic and anaerobic. The aerobic process treats waste in the presence of oxygen (supplied by electrically powered aerators); anaerobic digestion treats waste in the absence of oxygen. GHG emissions result from both the electricity required to power the treatment processes and from the treatment process itself, which can generate “fugitive” GHG emissions. Aerobic treatment generates CO2, and anaerobic treatment generates methane (CH4), a much more potent GHG than CO2. The methane produced in the anaerobic

Chapter Five ‐ Energy Efficiency
5-5
(Source: ecoscraps.com)
treatment process can be flared or used for onsite generation (see chapter 4 discussion of biomethane) of electricity and other potential production. Solar‐powered water circulators and other new technologies aim to reduce the electricity needed in lagoon processes. However, technologies that capture fugitive emissions—especially methane—and enable its re‐use to generate heat or fuel processes could yield far greater GHG reductions. Strict GHG regulations are needed to drive research and development of, and market shifts toward, technologies that improve methane capture at a variety of points, from sludge handling and treatment through anaerobic digestion. Such technologies include cogeneration systems, gas purification technologies, and anaerobic digestion systems. Also needed is additional research to address the challenging problem of quantifying GHG savings from reductions in fugitive emissions. Increased use of anaerobic digestion can increase the supply of electricity and can result in wastewater solids or process waste (food scraps) having economic value. Technologies to reduce the energy use of aerobic treatment can reduce operating cost for wastewater treatment processing, and create jobs and business opportunities for the companies supplying those solutions. Technologies that save electricity or natural gas (without generating electricity) at a wastewater treatment facility are eligible for energy efficiency incentives through the California IOUs. Some advanced technologies for generating electricity at a wastewater treatment facility, are eligible for support through the California Self‐Generation Incentive Program.12 SolidState Lighting (SSL) Because lighting accounts for a large amount of overall energy use, expectations are high for the next generation of lighting technologies. By saving energy, such technologies will also lead to decreased GHG emissions. Solid‐state lighting—comprising light‐emitting diode (LED) and organic light‐emitting diode technologies—is the exclusive focus of Department of Energy (DOE) lighting research. Similarly, private companies based the majority of new products displayed at Lightfair 2009—the lighting industry’s premier event—on solid‐state technologies. However, reliable, low‐cost, high‐performing products for many consumer applications may still be years away. And as LED technology advances, conventional technologies will also improve, narrowing the comparable benefits of solid‐state options – although there is less room for improvement on existing technologies. Perhaps even more significant, the

Chapter Five ‐ Energy Efficiency
5-6
price of LED fixtures is not likely to compete with that of fluorescents in the near term except in applications where the superior longevity of LEDs yields other cost savings. The foundation of California’s strategy, in particular, the California IOU's SSL implementation strategy, is its partnership with the US Department of Energy and US EPA's Solid State Lighting Program. This program, widely supported by utilities and industry nationwide, is designed to accelerate the commercialization of SSL technology and realize the associated energy saving benefits. Already, California IOU's have begun to launch SSL incentive programs. The CPUC supports a “strategic shift toward more advanced lighting technologies" as stated in the CPUC approved decision on September 24, 2009.13 California's high tech infrastructure and entrepreneurial culture has fostered numerous solid‐state start ups, and as noted in chapter two, lighting is one of the main sectors for “green” jobs in California. The California presence tends to focus on R&D and product development, as well as serving as a beach‐head for U.S. sales and marketing. This technology is also important from a California manufacturing perspective, as lighting fixture manufacturing accounts for two of the top four “green” manufacturing sectors in California.14 The major international LED chip manufacturers are Nichia, Seoul Semiconductor, Osram Sylvania, Phillips, GE, and CREE; the major U.S. fixture manufacturers (LED integrators) are Hubbell, Acuity, Cooper Industries, and Phillips Lighting. Developing the California market may help pull this technology to full commercialization and set a leadership example for others to follow. Home Area Networks15 Sometime in the not‐too‐distant future, both residential and business premises across the U.S. may be equipped with smart networks—called Home Area Networks or HAN—that give consumers near real‐time information and control of their electricity usage. Studies have shown that real‐time usage information not only heightens awareness, but can often trigger behavior changes that result in lower energy use and GHG reductions. These changes can be as simple as turning off devices and/or unplugging them, or more complex such as using an energy management system to turn appliances off/on in response to pricing and other signals provided by the energy provider. Furthermore, consumers can obtain device level consumption information for specific appliances to identify “energy hogs”, which can lead to energy efficiency measures such as replacing equipment with newer more energy efficient equipment. Small and medium businesses and commercial and industrial customers also benefit from the ability to increase their market competiveness by helping them identify and reduce wasted energy and improve process management. While California does not have a large manufacturing base for related technologies such as smart meters and programmable thermostats, Silicon Valley is home to many start‐ups and venture capitol firms focusing on HAN solutions in utility and consumer markets. The HAN ecosystem encompasses many device and energy management solution providers, developing innovative and low‐cost ways to provide energy management tools.

Chapter Five ‐ Energy Efficiency
5-7
DOE has identified “ZigBee+HomePlug SE 2.0” as a Smart Grid communication standard within consumer premises. Still under development, this standard may be available in consumer devices as early as 2011. CA IOUs are beginning proof of concept demonstrations in 2010, with potential for broader deployment in 2011 to support small businesses. Smart meter infrastructure, now available and being installed in many areas, is a key requirement for HAN deployment. In addition, while many of the component technologies required to implement HAN are available and reasonably well‐understood, the full set of standards required to enable integration and broad‐based interoperability are still not yet mature. That said, countless standards bodies with broad industry participation (e.g., OpenHAN) are actively working to develop and refine these standards. The state and federal governments can support these efforts by endorsing HAN‐related initiatives that are consistent with the emerging standards. Furthermore, funding of additional resources to support work on standards will also likely accelerate the development timeline. ZeroNet Energy Homes and Commercial Buildings Two of the innovative strategies advanced in the CPUC’s Strategic Plan focus on zero‐net energy (ZNE) buildings. Specifically, the Plan envisions that all new homes will be ZNE by 2020 and all new commercial construction will be ZNE by 2030. The CPUC defines ZNE as “ . . . a combination of building energy efficiency design features and on‐site clean distributed generation that result in no net purchases from the electricity or gas grid, at the level of a single ‘project’ seeking development entitlements and building code permits.”16 Because ZNE buildings would use far less energy than conventional buildings, their GHG footprint would be considerably smaller. This broad definition enables utility programs, which are charged with making ZNE construction a reality, to analyze and implement a wide range of energy efficiency and renewable options. At the most basic level, these programs aim to design buildings with very low energy demand and enough distributed renewable generation technologies to balance out energy usage, usually on an annual basis. Reducing building loads will require advances in construction materials, systems, and technologies as well as advances in design processes and strategies for integrating these elements. For example, advanced building envelope design and construction methods lower the overall need for heating, cooling, and lighting; advanced lighting and heating, ventilation and air conditioning systems can meet the lower demand more efficiently and appropriately than today’s systems; and integration of all can weave together individual systems to enhance the energy performance of the structure as a whole. Also needed is optimum integration with the renewable generation technology—at either the project site or a remote location—selected to net out the low building loads. Thus achieving ZNE will require maintaining a consistent vision of design and performance goals throughout the entire design and construction process.

Chapter Five ‐ Energy Efficiency
5-8
(Source: Adam Joseph Lewis Center For Environmental Studies from Inhabitat.com)
There are a few instances where split incentives could come up in the context of ZNE, generally involving rental properties where a tenant pays the utilities but is not able to modify the building systems without owner consent and participation. This would most likely occur in a building developed on spec or in a retrofit situation. For most new development, owners/developers are generally pursuing ZNE either because they will directly benefit from a lower utility bill (and the bragging rights of having a ZNE building), or because they believe that the ZNE property will be worth more to prospective tenants or owners, and they will therefore directly benefit from higher rent, an increased sales price, faster sales, etc. Building energy use is a large percentage of national energy consumption and significant reductions in the loads of zero net energy projects will result in corresponding greenhouse gas reductions. Ultimately, as advanced building systems, technologies, and design strategies evolve and transform the market, they will become part of standard design practice, and pushing the built environment towards the CPUC goals described by the CPUC as “big and bold”. The recent CPUC decision approved and allocated resources to ZNE programs and activities for all the California IOUs. The utilities proposed a range of approaches to reach the state's ZNE goals, including design assistance, performance incentives, research, demonstration projects, workshops and training, technology evaluations, code recommendations, and market studies. Some utilities have proposed new programs to focus specifically on ZNE. The utilities have also included ZNE goals in their new construction and sustainable communities programs. Resources for looking at ZNE issues have been included in programs such as the IOU Emerging Technology Program and third party programs. Results of program activities, such as technology assessments, demonstration projects, and research, will be disseminated through workforce education and training, and outreach to major market actors such as planners, developers, building designers, and building operators. A number of state agencies and other stakeholders are working to push buildings towards zero net energy. As part of the recent CPUC decision, the staff of CPUC Energy Division is working with the utilities and other stakeholders to put together a statewide Zero Energy Pathway Working Group to focus on setting priorities and milestones for reaching the state's ambitious ZNE goals. The California Energy Commission (CEC) is working to establish a roadmap for pushing Title 24, the state energy code, to ZNE by 2030 (over the next six code cycles). The CEC is also working to expand the scope of Title 20 and Title 24

Chapter Five ‐ Energy Efficiency
5-9
to address other pieces of the ZNE puzzle, such as consumer electronics, distributed generation, and water use. Utilities and state agencies are or will be offering incentives to reach higher energy efficiency performance standards along the path to ZNE and include distributed generation in projects that meet certain performance thresholds. In addition, some utility programs will offer design and technical assistance for a number of building owners and design teams that are trying innovative building designs, building systems, and technologies that will push the market and increase the ZNE knowledge base. Another piece of the implementation strategy is to benchmark the performance of as many buildings as possible, to get an accurate picture of how much energy is used, where it is used, and how best to reduce that energy use in the future. In order to further learn about how the buildings are performing, some design firms are revisiting projects intended to be zero net energy or very low energy to evaluate their actual performance and to share lessons learned as case studies and classes. Researchers, such as those at the National Renewable Energy Laboratory and Lawrence Berkeley National Laboratory, are working with those designers, state agencies, and utility staff to create or modify tools to meet design needs, incorporating new technologies and design and analysis methods. Advanced Residential & Commercial Air Conditioning Residential Hot Dry Air Conditioners California’s peak electric demand dominates the need for additional power plants, transmission infrastructure and related environmental issues. California and other states with hot dry climates need air conditioners that maximize indoor temperature reductions for the expended energy. This is particularly true at high outdoor temperatures. Commercially available air conditioners are designed to meet national performance standards that are roughly based on “average” cooling season weather conditions across the United States. The goal of the Hot Dry Air Conditioner Project sponsored by several California utilities is to build peak‐reducing split and package system air conditioners for hot and dry climates and to subsequently produce and promote a performance standard for air conditioners with superior performance in these climates. The primary technical methods of producing an air conditioner particularly suited to hot dry climates are: higher efficiency evaporator coils, higher efficiency condenser coils, more efficient evaporator fan motors, smaller compressors, and evaporator fan motor controls that evaporate the moisture on the evaporator coil to provide additional cooling after the compressor cycle ends. Methods of improving the sensible performance of air conditioners at high temperatures include the above items as well as evaporatively cooled condensers and improved condenser coil airflow. Studies show that the top tier Hot Dry Air Conditioners can provide savings of 44% at peak and 33% annual energy savings over baseline (SEER 13) energy consumption. Aggressive adoption of Hot Dry Air Conditioner performance standards could provide tremendous energy savings.

Chapter Five ‐ Energy Efficiency
5-10
(Source: Kinglar.com)
The California IOUs have completed an assessment of this technology and are designing a pilot program which will serve as basis for a future incentive program in 2010‐2012. Advanced Residential & Commercial Air ConditioningAdvanced Commercial Rooftop Units Central packaged rooftop units (RTU) are the most commonly used air‐conditioning systems in commercial buildings. RTUs consume about half of all the energy used to cool commercial buildings. Surveys indicate that most RTUs have some degree of undetected malfunctions, particularly in air‐side economizers. California Energy Commission initiated the advanced packaged rooftop unit project under the Public Interest Energy Research program. New features have been specified into advanced RTUs, which include: improved outdoor air control, improved economizer reliability, on‐board self‐diagnostics and troubleshooting capability, and fault‐tolerant design. Advanced RTUs with these features will be more reliable, will have improved long‐term energy performance and will ensure the equipment meets the current efficiency benchmarks at the desired levels throughout its lifetime. The Consortium for Energy Efficiency, an association of utilities and efficiency advocates, will adopt new features for an advanced HVAC performance specification, thus encouraging the manufacturers to build them. California IOUs are coordinating with the California Energy Commission’s Public Interest Energy Research (PIER) program on product specifications and testing of Advanced RTUs. The IOUs will incorporate this technology into their incentive programs when the research and study phase has successfully completed. Industrial and Commercial Refrigeration Replacing today’s refrigerants with new fluids specifically fabricated for low global warming potential (GWP) appears a straightforward approach to reducing GHG. However, some caution is merited. Currently, the performance of these new GWP refrigerants is not well understood, and most commercial and industrial refrigeration systems are custom engineered. Systems based on the new refrigerants are therefore likely to be more expensive and time‐consuming to design and install than conventional systems—and may not perform to targeted levels. Further, changing the refrigerant may lead to either a small increase or decrease in refrigeration system energy use, in turn leading to an increase in indirect emissions. The challenge—and opportunity—lies in influencing designers to engineer systems that

Chapter Five ‐ Energy Efficiency
5-11
simultaneously reduce energy use and GHG emissions. These benefits can come from coordinating GHG regulations limiting high‐GWP refrigerant usage with energy‐efficient equipment redesigns. The potential GHG reductions promise to be significant. For example, replacing 1 pound of conventional refrigerant (such as R‐404a) with one pound of low GWP refrigerant can reduce GHG emissions by 3,784 pounds CO2‐equivalent. Incentives are available in California for emerging and existing refrigeration technologies that save energy in existing or new facilities. In addition, Title 24 Codes will apply to new build refrigerated warehouses beginning in January 2010. IOU incentives and demonstrations are available for new low GHG refrigerants, but only when they save energy. Support for low GWP refrigerants will be driven by regulations from CARB that will either encourage the use of low GWP refrigerants, or penalize the use of high GWP refrigerants.

Chapter Five ‐ Energy Efficiency
5-12
Table 1. Promising Advanced Energy Efficiency Technologies
Technology
Market Introduction/ Penetration Timeline
GHG Reduction Potential
Implementation Strategy
Barriers/Risks to Implementation
Solar thermal hot water and
steam
1 year to introduction and ~1‐5 years
penetration
600 MM therms/yr x 0.0053 MT CO2/therm = 3.19 MMT
CO2/yr (derived from CARB Scoping Plan
2009)
CA energy efficiency
programs, CA Solar Initiative
First cost, lack of experience with technology
Split incentives between who pays (such as building owners) and who
benefits (such as tenants).
Solid State Lighting 2007‐2020
Technical potential of 189 TWh for U.S.
(DOE/ Navigant 2008)
Partnership with DOE Consortium
Relative size of near term market potential (lack of qualified product
& high initial cost).
Split incentives issue same as above.
Efficient Aerobic Treatment for Wastewater Lagoons
Currently in the market
1,000 GWh/yr x 0.00044 MT
CO2/kWh = 0.44 MMT CO2/yr (derived from CARB Scoping Plan 2009)
CA energy efficiency programs
First cost and split incentives issues same as above.

Chapter Five ‐ Energy Efficiency
5-13
(Table 1 Continued)
Low GWP Refrigerant
1 year to introduction and ~1‐5 years penetration
1 lb low GWP refrigerant can reduce GHG by 3,784 tons
compared to 1 lb of a
typical CO2 refrigerant, such ‐404a
GHG regulations
Limited understanding of new refrigerant performance
characteristics
Split incentives issue same as above.
Home Area Network
1 year to introduction and ~1‐5 years penetration
May lead to a 5% ‐ 8%
reduction in energy use
CA IOU proof of concept
demonstrations expected in
2010; potential for broader
deployment in 2011 and beyond
Standards still in development. Enabling technology, HAN gateway , which can be located in the smart
meter, is required.
Split incentives issue same as above.
Hot Dry Air Conditioner
1 year to introduction and ~1‐5 years penetration
May lead to 17 MW demand reduction, 9 GWh energy savings, and 2139 Metric Tons CO2/yr reduction.
CA energy efficiency programs
First cost and split incentives issues same as above.
Advanced Rooftop Units
1 year to introduction and ~1‐5 years
penetration
May lead to 20% reduction in energy use.
CA energy efficiency programs
First cost and split incentives issues same as above.

Chapter Five ‐ Energy Efficiency
5-14
1 California Energy Action Plan II, page 3 2 http://www.ncpa.com/images/stories/LegReg/2009SB1037ReportFINAL031609.pdf 3 CPUC approved the IOUs 2009‐11 Energy Efficiency Portfolio on September 24, 2009 (http://docs.cpuc.ca.gov/PUBLISHED/Graphics/107829.PDF), but changed the timeframe to 2010‐2011. In response, the IOUs are preparing Compliance filings to finalize budget and savings and begin implementation. The savings presented here (CPUC Decision, page 4) reflect the CPUC approved goals for the 2010‐2012 Program Cycle, but do not reflect any changes according to the Compliance filings. 4 “Energy Efficiency in Calfiornia’s Public Power Sector”, March 2009, page 18. GHG reductions annualized based on GHG per KWh for lifecycle emission reductions. 5 CARB Scoping Plan, Tables 7 and 8, page 44 6 CARB Scoping Plan, Tables 7 and 8, page 42 7 http://www.recovery.ca.gov/HTML/InvestmentCategory/Energy/energy.shtml 8 http://www.recovery.ca.gov/HTML/InvestmentCategory/Energy/energy.shtml 9 http://www.recovery.ca.gov/HTML/InvestmentCategory/Energy/energy.shtml 10 http://www.abengoasolar.com/sites/solar/en/our_projects/usa/california/index.html 11 http://www.greentechmedia.com/articles/read/brightsource‐snags‐chevron‐deal‐in‐stealthy‐move‐into‐solar‐steam/ 12 http://www.cpuc.ca.gov/PUC/energy/DistGen/sgip/ 13 http://docs.cpuc.ca.gov/PUBLISHED/Graphics/107829.PDF 14 “Clean Technology and the Green Economy”, Prepared for the California Economic Strategy Panel by Collaborative Economics, March 2008, p.17. 15 Pertains to both business and residential, but is referred to in this document by its common nomenclature. 16 Interim Opinion on Issues Relating to Future Savings Goals and Program Planning for 2009‐2011 Energy Efficiency and Beyond, Decision 07‐10‐032, October 18, 2007, page 38.

Chapter 6 – Transportation
6‐1
(Source:ICCT)
Chapter Six Transportation Overview This chapter discusses strategies for developing and deploying technologies achieving dramatic reductions in GHG emission in both the near and the long term from light duty vehicles and medium and heavy duty vehicles. This chapter also discusses the potential for advanced technology biofuels production. The transportation sector in California is the largest in‐state source of GHG (as seen in chapter one) and is critical to meeting California’s long‐term GHG reduction goals. Transportation also constitutes nearly half of air pollutants contributing to ozone and fine particulate pollution in areas such as the South Coast Air Quality Management District. California has long been a leader in clean transportation technology, and successes in California’s efforts to reduce greenhouse gases will be followed closely by decision‐makers both in the United States and internationally. In addition, responding effectively to market opportunities and federal spending on advanced vehicle technology development offers important opportunities to expand the state’s “Green” jobs. California has significant innovation capital and capacity, and a culture of “early adopters” who lead the nation in hybrid passenger car ownership1. California also has the capability to manufacture clean transportation technologies2. CALSTART has identified over 200 California companies and organizations that are part of or else support California’s clean transportation industry.3 In addition, transitioning to more efficient transportation will also reduce a significant cost for businesses in the state. The refinement of conventional vehicle technologies is unlikely to lead to the same level of California job creation as technology capable of dramatic GHG reductions because there are fewer market growth opportunities, and because California businesses are more focused on newer generations of technology. In addition to job creation in the vehicle arena, the next generation of technologies involving plug‐in hybrid electric vehicles, battery electric vehicles and fuel‐cell electric vehicles will all require substantial infrastructure improvements and developments. This in turn will also lead to significant additional opportunities for creation of high quality jobs and dollars retained within the California economy instead of exported to purchase imported energy supplies. Creation of advanced biofuels may also create further opportunities.

Chapter 6 – Transportation
6‐2
6.1 NearTerm and LongerTerm Strategies for Achieving Dramatic Light Duty Vehicle GHG Reduction Goals Roadmap to Achieving LongTerm GHG Reductions California has a variety of regulatory programs to address both greenhouse gases and conventional air pollutants. Currently CARB staff are developing a strategy to integrate the greenhouse gas and zero emission vehicle programs. According to CARB’s Tom Cackette4, CARB staff are working on a multi‐phased approach to reach the 80% reduction in greenhouse gases by 2050, including a 28% reduction from 1990 levels by 2020. The specific actions required are:
increase fuel efficiency by a factor of three (see feebate and standards discussion
below) transition to electric drive (see electric drive discussion below) transition from petroleum to ultralow carbon fuels (see biofuels discussion in
Section 6.3) reduce vehicle miles traveled by about 20% (See ETAAC February 2008 report
chapter 3) The implementation of these strategies should achieve opportunities for technological growth, leadership and job creation in California. In the transportation sector, the introduction of electric drive and decarbonization of fuels (particularly focusing on use of electricity and hydrogen) offer the potential for substantial job creation in California as noted earlier. Therefore, a continuing and consistent strategy coupled with adequate funding is critical to ensure that industry can respond in a way that provides some certainty about implementation. Such a system will provide the industry with correct market signals for investment in these advanced technologies and a return on investments in successful technology development. California can build on its history of leadership established over past decades of criteria pollutant technology development, as well as more recently on promoting GHG reduction technology. Standards and Financial Strategies, including NearTerm Strategies In addition to strong regulations, which are typically implemented over a period of years, market mechanisms such as those incorporated in a "feebate" system can provide immediate fiscal incentives for technology development. The US EPA has proposed GHG standards (working with the US Department of Transportation, which is responsible for fuel‐economy standards) for model years 2012 through 2016 that as are stringent as the California standards in model year 2016. These standards are estimated to decrease GHG emission from new passenger vehicles by approximately 25‐30% by model year 2016 and can be met by deploying existing technologies. The federal government has recently granted California a waiver to
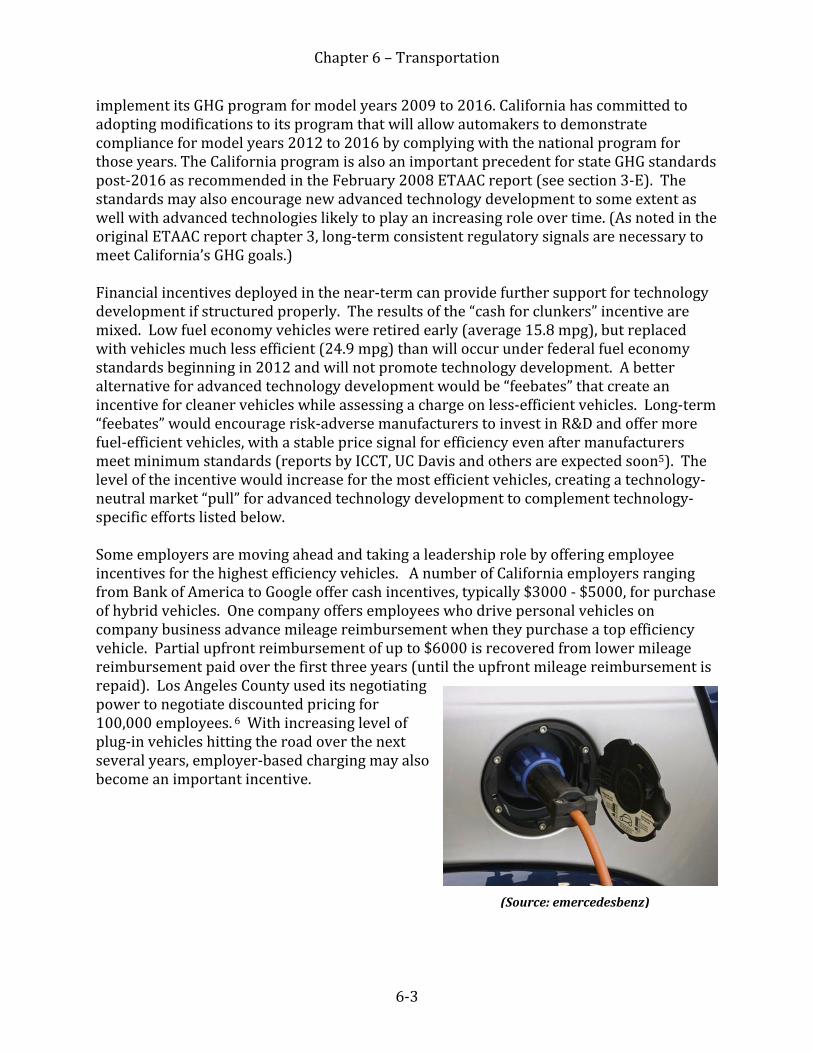
Chapter 6 – Transportation
6‐3
implement its GHG program for model years 2009 to 2016. California has committed to adopting modifications to its program that will allow automakers to demonstrate compliance for model years 2012 to 2016 by complying with the national program for those years. The California program is also an important precedent for state GHG standards post‐2016 as recommended in the February 2008 ETAAC report (see section 3‐E). The standards may also encourage new advanced technology development to some extent as well with advanced technologies likely to play an increasing role over time. (As noted in the original ETAAC report chapter 3, long‐term consistent regulatory signals are necessary to meet California’s GHG goals.) Financial incentives deployed in the near‐term can provide further support for technology development if structured properly. The results of the “cash for clunkers” incentive are mixed. Low fuel economy vehicles were retired early (average 15.8 mpg), but replaced with vehicles much less efficient (24.9 mpg) than will occur under federal fuel economy standards beginning in 2012 and will not promote technology development. A better alternative for advanced technology development would be “feebates” that create an incentive for cleaner vehicles while assessing a charge on less‐efficient vehicles. Long‐term “feebates” would encourage risk‐adverse manufacturers to invest in R&D and offer more fuel‐efficient vehicles, with a stable price signal for efficiency even after manufacturers meet minimum standards (reports by ICCT, UC Davis and others are expected soon5). The level of the incentive would increase for the most efficient vehicles, creating a technology‐neutral market “pull” for advanced technology development to complement technology‐specific efforts listed below. Some employers are moving ahead and taking a leadership role by offering employee incentives for the highest efficiency vehicles. A number of California employers ranging from Bank of America to Google offer cash incentives, typically $3000 ‐ $5000, for purchase of hybrid vehicles. One company offers employees who drive personal vehicles on company business advance mileage reimbursement when they purchase a top efficiency vehicle. Partial upfront reimbursement of up to $6000 is recovered from lower mileage reimbursement paid over the first three years (until the upfront mileage reimbursement is repaid). Los Angeles County used its negotiating power to negotiate discounted pricing for 100,000 employees. 6 With increasing level of plug‐in vehicles hitting the road over the next several years, employer‐based charging may also become an important incentive.
(Source: emercedesbenz)

Chapter 6 – Transportation
6‐4
Overview of ElectricDrive Technologies The goal of achieving an 80% reduction in greenhouse gases by 2050 will drive the introduction of advanced technologies into the light duty fleet in California. This section of the report will provide a technology overview, report on global investments in manufacturing and consumer incentives, and recommend specific policies for California to promote environmental and economic benefits. According to the California Air Resources Board, over two thirds of on‐road vehicles with full range capacity will be powered by electricity or hydrogen by 2050. In the near term, conventional hybrid electric vehicles will likely continue to be the dominant form of electric‐drive vehicle in the fleet. As we move to greater electrification, such as Plug‐in Electric Vehicles (PHEV), Battery Electric Vehicles (BEV), and Fuel Cell Electric Vehicles (FCEV), there will be an increasing need for the development of infrastructure to provide for the electricity to recharge vehicles and to supply hydrogen. The implications of this strategy are discussed below. Advanced technology vehicles have achieved significant cost reductions, but are likely to still exceed the cost of conventional vehicles even when produced at scale. Table 6‐1 shows one estimate comparing the cost of different electric drive vehicles and showing the potential future incremental costs of BEVs, PHEVs, FCEV in mass production. For plug‐in vehicles, reducing battery cost – with $500/KW‐hr a key target set by the US Department of Energy ‐ and increasing performance through additional research and development and successful manufacturing at scale will be necessary to fully commercialize this technology. For fuel cells, reducing fuel cell stack costs and on‐board hydrogen storage costs are two examples of key challenges on the vehicle side. There are incentives in place to offset the cost differential of these vehicles and facilitate their entry into the marketplace, as discussed below.

Chapter 6 – Transportation
6‐5
Table 61 from Kromer & Heywood, May 20077
“Estimated Incremental OEM Costs for vehicle technologies compared to the 2030 NASI [Naturally aspirated spark ignition]. The impact of optimistic battery projection (based on $150/kWh for a highenergy battery) and conservative fuelcell projection (based on $75/kW) are reflected in parentheses.” The increasing use of electric drive will also occur in parts of the heavy‐duty sector, particularly for buses. This change is already happening in California with hybrid, pure electric and fuel cell vehicles. The global electricdrive passenger vehicle technology race Competition to develop and manufacture electric‐drive passenger vehicles is a global technology race with well over $12 billion in new investments identified to develop battery electric (including plug‐in hybrids) vehicles committed globally since the original February 2008 ETAAC report. These investments will help address manufacturing capital costs – a key potential barrier to advanced technology development – and in some cases will also reduce the upfront capital costs to consumers as well. The United States is providing a massive surge of funding. The federal government and states such as Michigan and Kentucky (and to a smaller degree California) combined will spend $7.7 billion on 1) manufacturing, 2) federal tax credits up to $7,500 per vehicles, and 3) demonstrations of electric vehicles and charging infrastructure. Matching private sector dollars for grants will boost that total close to if not over $10 billion, not including the portion of public funding to keep GM and Chrysler in business that is also used for this

Chapter 6 – Transportation
6‐6
purpose. The federal climate bill passed by the House of Representative could provide billions of dollars in additional funding beginning as soon as 2011. The first round of $2 billion in federal loans through the Advanced Technology Vehicle Manufacturing Program and private matching dollars (announced in June 20098) is intended to result in the production of 170,000 electric vehicles (most of which will be electric vehicles with a 100‐mile range) by Tesla and Nissan, and an additional 10,000 battery packs. US DOE is also providing over $500 million in loans to help Fisker Automotive manufacture an electric vehicle in 2010, and up to 75,000‐100,000 plug‐in hybrids beginning in late 2012 – together, they would make up about 3% of new car sales in the United States. (An additional $5.9 billion was awarded to Ford for more efficient conventional and hybrid vehicles.) In August, DOE announced an additional $2.4 billion in grants under the ARRA. The grants will provide $1.5 billion for US manufacturing of batteries, components, and recycling, and $500 million for electric drive components. While the grant announcements did not specific manufacturing volumes, the total (including matching private sector dollars) is roughly four times the total of the Telsa and Fisher Automotive grants. While ETAAC has not independently researched capital costs, these loans, grants, and matching funds should provide sufficient manufacturing capital investment for production of at least several hundred thousand PHEV‐40 battery packs and perhaps a million or more PHEV‐15 battery packs annually. An additional $400 million will be provided for electrification, primarily demonstration of vehicles and infrastructure such as a South Coast demonstration project for Class 2 through Class 5 vehicles (i.e. up to medium duty sized trucks) across 50 different utility fleets. European and Asian governments in countries with significant auto industries are also investing billions into electric drive vehicle manufacturing (as noted in the Appendix). International manufacturers will compete with, and in some cases form alliances with, manufacturers in California and the United States. Japanese companies have a strong lead in advanced battery manufacturing for other applications, but are facing strong competition on the automotive side. China is hoping to “leapfrog” existing conventional automotive technology, where it is less competitive, into electric‐drive vehicles and battery manufacturing through purchase subsidies and other incentives. South Korea is forming its own consortium, and LG Chem has announced separately that it will invest approximately $800 million in manufacturing EV batteries for GM by 2013. Germany, France, and the United Kingdom are also each investing upwards of half a billion dollars to develop electric vehicle technology on top of other types of support to automakers. The UK is investing in R&D, demonstrations, and purchase incentives. The German government is focused on providing research funding and capital for manufacturing, with a small tax break for purchasers. The French government is supporting vehicle and charging infrastructure demonstrations. Looking longer term, Congress has re‐established funding for hydrogen fuel cell technology. DOE and others report that this technology has made important steps towards

Chapter 6 – Transportation
6‐7
commercialization, such as fuel cell stacks projected at $73 kilowatt/hour at mass production – a 75% reduction since 20029. Honda and Toyota announced in September at CARB’s 2009 ZEV symposium that they are aiming for fuel cell vehicle commercialization beginning in 2015 – while noting the need for additional technology development and infrastructure for fueling in order to successfully begin commercialization.10 German automakers have also announced that they are targeting mass production in 2015 and onwards to achieve production levels in the hundreds of thousands of vehicles11. Hydrogen fueling infrastructure will be a major challenge as shown in Table 6‐2 below. While EVs potentially could compete with fuel cells, they are also complementary technologies because expanding commercialization for EVs and PHEVs will likely facilitate fuel cells by driving down the costs of shared components. In addition, fuel cells may serve a niche for vehicles with a longer‐range than many initial pure EVs (although Tesla has announced that customers will have an option to buy an expanded battery pack to extend the 160 mile range of its sedan to 230 or 300 miles)12. “In the future we may use electric vehicles for short‐distance travel and fuel‐cell cars for long drives,” according to Toyota’s president, Akio Toyoda13. CARB predicts that these three technologies – PHEVs, EVs, and FCEVs ‐ will together make up a third of the California vehicle fleet by 203014. Policy Recommendations for California Regarding ElectricDrive Technology This change in the motor vehicle fleet is likely to lead to significant opportunities for job creation in California. CALSTART has identified over sixty California companies that research and/or manufacture electric‐drive vehicles and/or components15. In addition to the increasing investment in research into electric drive components and manufacturing of these components in California, $1.1 billion in federal investment will go to companies such as Tesla, Fisker, and Electric Transportation Engineering that will have their primary electric vehicle production facilities, or part of their operations, in California. Tesla intends to begin production of the Model S in 2011 and ramp up to 20,000 vehicles per year by the end of 2013, creating 1,000 jobs in Southern California. Early pilot battery pack production is expected to begin in 2011, reaching about 10,000 by 2012 and 30,000 packs in 2013 with 650 workers in Northern California. Fisker Automotive will provide support from its California headquarter as it scales‐up manufacturing in Michigan. (The state of California is also offering $9 million in incentives from AB118 for vehicle or component manufacturing in‐state16). The required change in infrastructure as a result of the increasing numbers of electric and fuel cell vehicles will also provide significant additional job growth opportunities throughout California. Infrastructure and EV charging policies are necessary to complement these investments in vehicle manufacturing and California’s standards for deployment of electric‐drive EVs/PHEVs. California is a leader in the introduction of new technologies such as hybrid vehicles and can play a similar role for other advanced technologies as they become available for deployment but will need to have the proper infrastructure and policies in place. California’s ZEV and LEV programs, including extension of the original Pavley GHG standards, can provide a long‐term market and incentive to demonstrate technologies in California and then commercialize them at scale.

Chapter 6 – Transportation
6‐8
Usage will be constrained by the availability of charging infrastructure, both at the “home base” and at workplaces and public locations. For example, the California Energy Commission has proposed to upgrade 4,500 existing charging stations and install 2,000 new charging stations with $12 million in AB118 funding as well as cost‐sharing of up to $40 million in funding hydrogen fueling infrastructure based on the needs of vehicle deployments17. As noted earlier, the South Coast AQMD has received an award to demonstrate this technology in California and nationally for several hundred medium‐duty vehicles. (California is a natural recipient for federal funding because its low‐carbon grid and commitment to renewable energy will maximize GHG reductions compared to states with more coal and less renewables.) In addition, the California Public Utilities Commission is currently considering options for charging stations provided by existing electric utilities or other entities. These efforts are a positive start for the sustained efforts that will be needed for determine the type of charging infrastructure (including vehicle‐electric grid communications) needed to meet the evolving infrastructure requirements of advanced technology vehicles, as well as the policies and investments needed. Meeting these needs will also require effective coordination among these California agencies and CARB, and between California agencies and different levels of government and other private sector and non‐profit agencies.
Table 62: Retail Fueling Stations (from CALSTART 2009, data sources listed above)
While some on‐peak charging is probably inevitable, the right policies and infrastructure will promote off‐peak charging and help integrate intermittent renewable resources like wind into California’s electric grid (see Renewable Energy Chapter of this report). As full battery electric vehicles are commercialized, demand for “fast charging” that exceeds

Chapter 6 – Transportation
6‐9
typical household load (in KW/hr) will increase. This is both an opportunity – to the extent that charging occurs based on renewable energy and off‐peak generation– as well as a challenge, in cases where it does not. The California Public Utilities Commission is currently investigating a number of important questions such as these about EV charging infrastructure, pricing, and related topics that need to be addressed. This dramatic reduction in greenhouse gases and change in the technology and the marketplace will also require that the public accept this new technology and buy these vehicles. Based on past experience this is should not be taken for granted. A key part of the overall program is to educate the public on options and needs for such a transformation, as well as general information about the technology. Therefore ETAAC, as it did in its earlier report, strongly endorses a comprehensive outreach program so that the California public is fully aware all of the challenges posed by climate change and the actions required to mitigate or adapt to those changes. Successful demonstration and deployment will be critical to meeting both environmental and economic development needs. 6.2 NearTerm and LongerTerm Strategies for Achieving Medium and Heavy Duty Vehicle Emission Reductions Immediate Opportunities to Reduce Black Carbon, Other Criteria Pollutants and Greenhouse Gases Fine particulate matter (PM 2.5) from the exhaust of diesel engines is well recognized as a significant health hazard and has been identified in California as a toxic air contaminant. The California Air Resources Board has extensive documentation on the role of fine particles in causing well over ten thousand excess deaths in California every year18. Diesel particulates from transportation in California are an important contributor to these PM2.5 health impacts. Black carbon is the solid fraction of PM 2.5 that strongly absorbs light and converts that energy to heat when emitted into the atmosphere (and further impacts occur when deposits on ice or snow result in additional warming). Black carbon contributes to changes in global temperature, geographic landmass of snow and ice and precipitation patterns. According to the International Panel on Climate Change, black carbon is the third‐largest contributor to positive radiative forcing on climate change19. The International Council on Clean Transportation has recently prepared a report (see www.theicct.org) that addresses the role of black carbon in climate change and lays out the basis for actions to reduce black carbon emissions.
(Source: Tampa Bay Post)

Chapter 6 – Transportation
6‐10
The transportation sector, especially the heavy‐duty vehicle sector, is an important source of emissions globally and reductions in emissions of these gases will have significant impact in reducing GHG. Transportation accounts for about a quarter of black carbon globally; open burning (including wildfires – see chapter ETAAC’s February 2008 report for forestry related issues) is the largest single source. While black carbon is not included within the set of pollutants defined in AB 32, growing scientific understanding and evidence of its warming effects20 has led to support from some that it should be recognized as such. California recently instituted a mandatory heavy‐duty vehicle retrofit or replacement program aimed at reducing oxides of nitrogen (NOx) and PM2.5. Recognition of the role of black carbon as a GHG would reinforce the importance of continuing California’s leadership on programs for heavy‐duty vehicles and off‐road sources in California, providing a global leadership example in addition to in‐state public health benefits. If California can leverage this leadership to secure additional resources such as federal funds (or if additional state funding becomes available), providing incentives could accelerate this process. California’s existing clean diesel technology cluster is well positioned to create economic growth in California from the expansion of these technologies.21 California should also integrate efforts to reduce emissions of GHG and more traditional pollutants, such as incentive programs, as recommended in the original ETAAC report (chapter 3). Co‐funding projects from GHG/petroleum reduction programs (such as AB 118) and criteria pollutant funding (such as Proposition 1B /Carl Moyer programs) if incremental benefits are achieved and cost‐effectiveness levels are met is one example. For instance, truck owners could choose between an incentive for a cleaner diesel truck or a higher incentive levels for achieving black carbon, NOx, and GHG reductions with a hybrid diesel truck or a natural gas truck. Incentive programs are one way to overcome the up‐front capital costs of advanced technologies that are often a barrier to deployment as noted in Chapter One. Agencies such as the California Air Resources Board and the California Energy Commission should seek to achieve this type of coordination between incentive programs and identify any additional legal authority that is needed. Importance of California LongTerm Strategies and Technology Development Funding In addition to existing Smartway and anti‐idling programs, California can continue to play a leadership role developing long‐term strategies and working with partners including the Western Climate Initiative, the US Environmental Protection Agency, and the US Department of Energy. CARB and state partners such as the California Energy Commissions should continue to work cooperatively to develop a long‐term coordinated strategy for medium and heavy duty vehicle emission reductions to meet 2050 GHG emission reduction goals. Efforts by the California Public Utilities Commission (CPUC) should also be coordinated with these agencies, to the extent that the CPUC engages in infrastructure and policy development for these vehicles. For example, the federal stimulus bill does not appear to provide major new resources for development of medium‐duty truck technology such as non‐plug in hybrids. ARB has

Chapter 6 – Transportation
6‐11
announced that it will provide between $20 and $25 million for purchase of medium‐duty and heavy‐duty vehicle hybrids from AB 118 funding, demonstrating the importance of maintaining a state‐level capacity to promote technologies that are important to California. Creating an early commercialization market is expected to cut incremental costs by 50%, and the California Energy Commission will allocate $12 million in R,D&D to further reduce technologies costs. These and other GHG reduction programs funded by AB118 demonstrate the benefits of state‐level funding and are likely to be an important step towards achieving the emission reductions from technologies needed to meet the goals of AB32 while helping businesses become more efficient. For larger heavy‐duty Class 8 trucks, the US DOE has announced $90 million ‐ $160 million in “Super Truck” federal research, development and demonstration funding over the next three to five years. Cost‐sharing by recipients would likely double the total research effort. California has a successful track record of helping commercialize clean technologies through programs such as Carl Moyer, and California now also has AB118 funding to promote GHG reduction technology. Future program development for incentive programs such as AB 118 should track these new Class 8 truck technologies for opportunities to demonstrate and commercialize new technologies that cut GHG and costs and help meet AB32 goods movement GHG reduction goals. This is another potential example of how a long‐term technology development program such as AB118 (authorized through 2014) can benefit California, in addition to other examples for passenger vehicles noted earlier. 6.3 Advanced Biofuels Background on Biofuels The California Energy Commission estimates that the majority of the $35 billion invested annually by the federal and state governments and private investors in advanced vehicle technology is spent on biofuels.22 California is home to some leading biofuels companies. For instance, a cluster of 500 biotech companies in San Diego has attracted large investment in biofuels23, while additional large investments are also taking place in the San Francisco Bay Area. There are a number of technologically feasible feedstocks and production methods for biofuels in different stages of commercialization. The Appendix contains a technical description of pathways from feedstocks to biofuels through the following processes:
ethanol or butanol produced by fermentation, preceded by hydrolysis for cellulosic or starch feedstocks;
various potential products produced by thermochemical conversions;
(Source: Stanford GCEP)

Chapter 6 – Transportation
6‐12
bio‐oil or renewable diesel produced by hydrotreatment; bio‐diesel produced by trans‐esterification; and renewable natural gas produced by biomethane production.
Standards for Transitioning to Lower Carbon Fuels Meeting the 80% GHG reduction by 2050 target requires incorporating large volumes of ultra low carbon fuels such as advanced biofuels, electricity, low carbon natural gas, and hydrogen into the California transportation system. Due to the long timeframes involved in changing fuel infrastructure, CARB is aggressively pursuing programs intended to put the fuel sector on the necessary trajectory to meet the 2050 target. To address challenges in the transport sector specifically, CARB recently adopted the nation’s first Low Carbon Fuel Standard (LCFS) as part of the overall strategy described earlier.24,25 CARB has developed a range of future technology scenarios which if met would achieve the 10% reduction requirements in 2020 based on proposed carbon intensity factors.26 The LCFS compliance scenarios developed by CARB estimate that meeting the 10% reduction requirements in 2020 would require 2.18 to 3.08 billion gallons of low carbon ethanol and another 0.8 billion gallons of biodiesel and renewable diesel27 (as well as 0.6 to 1.3 million plug‐in electric, battery electrics, and fuel cell vehicles fueled on low‐carbon electricity or hydrogen28). The California Energy Commission estimates biomethane production also has the technical potential to create large GHG emission reductions.29 Section 6.3 focuses on the biofuels sub‐set of low‐carbon transportation fuels. (Chapter 4 focuses on low and zero‐carbon electricity, which can also be used to create hydrogen as a transportation fuel.) If the California LCFS is met predominantly by biofuels and does not result in significant deployment of non‐liquid fuels, the LCFS could create a larger market in 2020 for ultra‐low carbon biofuels in California compared to California’s proportional share of the federal Renewable Fuel Standard 2 (RFS 2). The federal RFS 2 mandates specific volumes and types of biofuels to be used nationwide. 30 California’s proportional share of the federal RFS 2 mandates for advanced and cellulosic biofuels would result in about 1.7 billion gallons of ethanol use in the state, lower than the 2.18 to 3.08 billion gallons that CARB estimates could be required for the LCFS in 2020.31 Another key difference between the LCFS and the RFS 2 is that RFS 2 does not provide any regulatory value to improve the carbon intensity of ethanol beyond the minimum qualification standards of 50% and 60% for advanced and cellulosic ethanol respectively.32 Under the LCFS, carbon intensity improvements beyond these levels provide carbon benefits towards compliance to the fuel provider. For example, under the RFS 2, cellulosic ethanol must meet a 60% reduction in greenhouse gases, even though CARB estimates the reductions could be as high as 80%.33 While some believe that the LCFS provides greater benefits and incentives for innovation than does the federal RFS 2, others believe that the RFS 2 is a superior fuels policy. From the later perspective RFS 2 has the advantages of a clear focus on biofuels (acknowledging

Chapter 6 – Transportation
6‐13
that liquid fuels in existing infrastructure will offer the overwhelming contribution to compliance in the 2020 timeframe), the more focused innovation objective of the cellulosic ethanol portion of the RFS 2 (as opposed to multiple objectives of the LCFS), and the clearer alignment of regulated parties and regulated fuels. From this perspective, there is concern as to whether the incremental burden and complexity of a California LCFS outweighs the limited incentives for innovation given these attributes of the RFS 2, combined with other policies potentially available to address other (non innovation) desired objectives of a LCFS. It should be acknowledged that there remains uncertainty as to the timeline for innovation in fuels and therefore in the ability of industry to comply with the LCFS. CARB acknowledges that the LCFS is a “technology‐forcing” standard and that fuels necessary to meet the targets are not currently at commercial scale. Industry has raised concerns about feasibility of the carbon intensity reduction targets. Industry has also raised concerns that in practice the LCFS is not a fuel neutral standard, demonstrates biases for and against various fuels, and creates uncertainty for some advanced biofuels regarding GHG emissions attributed to indirect land use change. In all of the CARB LCFS compliance scenarios, production of low‐carbon biofuel volumes to meet the 2020 levels will necessitate building additional biofuel production facilities (or potentially modifying existing facilities). The 2020 standard will necessitate the construction or conversion of roughly 60 to 80 mid‐sized, commercial‐scale biofuel facilities.34 The LCFS creates some cost incentive to locate these facilities in or near California to reduce transportation cost, though this incentive is modest and likely cannot by itself justify in‐state production of cellulosic ethanol. CARB estimates that thirty facilities could be operational in California by 202035 producing corn ethanol (6), cellulosic ethanol (18), and biodiesel (6). A pilot plant will produce biomethane at Waste Management’s Altamont landfill, and the CEC plans to support up to 10 plants with $10 million in funding. (See chapter 4 for information on the use of biomethane for electricity production). The federal stimulus bill targets some areas of advanced biofuels production, including but not limited to cellulosic and algal biofuels, which should help both state and federal efforts.36 However, ETAAC is not aware that estimates of the fundamental cost‐structure of feedstock production relative to other states has been included as part of the LCFS analysis or planned as part of future R&D funding. Therefore, there is a need for additional data to help establish the economic feasibility of producing biofuels in‐state. Feedstock Study to Support instate Biofuels Contribution to Lower Carbon Fuels Production of advanced biofuels requires suitable and abundant biomass that can be delivered at scale and on a sustainable basis over time; capability to collect and transport the biomass; and sufficient conversion capacity (bio‐refineries) using technology that is appropriate for the biomass and the delivery infrastructure to move the biofuels to market.
ETAAC recommends that CARB commission a study by experts to evaluate several aspects of the potential for creating a California‐focused advanced biofuels industry to help meet

Chapter 6 – Transportation
6‐14
California’s LCFS and also maximize economic development opportunities. This information will help inform policy‐makers and the private sector on the need for potential actions and investments. Specifically, ETAAC has identified two high priority areas: 1) assessment and development of in‐state biomass feedstock resources; and 2) assessment of technologies and economics of siting biorefinery facilities in California.
1. California Feedstock Resource Assessment and Development
Resource potential: What types of biomass could potentially be grown in California and what are their technical resource potentials? What land/resources would be required to produce this feedstock (e.g., crop waste, forest waste, municipal waste, purpose‐grown energy crops, algae)? What are the competing uses of this biomass (e.g., forage, biopower, process heat, food)?
Feedstock market development: What agricultural or other feedstock programs could encourage the development and production of new biomass crops in‐state? What technological hurdles would need to be overcome to make this a competitive industry on an unsubsidized basis vs. other states?
Feedstock sustainability: How do we define and demonstrate environmental “sustainability” of the potential feedstock resource? How would applying sustainability screens impact the feedstock resource potential? For instance, are limitations or mitigation needed to protect water supply and/or water quality impacts, prevent impacts on endangered species, or limit indirect land‐use effects?
Feedstock cost: How much would each biomass source cost to develop (e.g., capital investment, labor, water, etc.)? How can it be efficiently and economically grown, collected, and/or harvested? How much time would be needed for each source to reach commercial production levels (e.g., research and development time and cost)? How would the biomass be collected and transported (See Chapter 4 for discussion on biomass “pelletization”)? How much would it cost?
2. Assessment of Feasibility of Locating Biorefineries in California Conversion technologies: What conversion technology would be appropriate for each
type of biomass? How much time is needed to commercialize these technologies? How much R&D is required?
Biorefinery feasibility: How much would it cost to build commercial‐scale advanced technology bio‐refineries? How would the financing, design, permitting, and construction occur? How long would this take, and where could they be located? What effects on air quality, water quality, and other environmental effects are expected? Do the current codes and standards exist to facilitate the siting, construction and operation of bio‐refineries? Would legislative or regulatory changes be required at the state and/or municipal levels?
This potential study would provide valuable information to help guide public policy decisions, as well as investments, research, and other decisions by the private sector.

Chapter 6 – Transportation
6‐15
1 California demand for the Toyota Prius is more than double that of any other state. Michael O’Brian, Toyota Motor Sales USA, CARB ZEV Symposium September 22, 2009. 2 Currently there is no major manufacturing facility for advanced conventional cars or light duty trucks in California. 3 CALSTART, Clean Transportation Technology in California, 2009, Appendix B 4 Endicott House, August 2009 5 The ICCT is preparing a report on feebates, and a global fiscal incentives paper. UC Davis is leading a research project that will include analysis of feedbates and research into consumer behavior. ETAAC also received a public comment from Ken Johnson that he intends to prepare a paper on a related topic. 6 http://file.lacounty.gov/lac/VPSP%20Board%20Approved%20Board%20Letter.pdf, accessed 10‐16‐2009; http://www.hybridcars.com/corporate‐incentives.html accessed 10‐16‐2009; personal communication, Mahlon Aldridge, Ecology Action to Hank Ryan, October 6, 2009 7 Matthew A. Kromer and John B. Heywood, “Electric Powertrains: Opportunities and Challenges in the U.S. Light‐Duty Vehicle Fleet”, MIT, May 2007, Table 53. Underlying assumptions are summarized in Table 51 and Table 52 of that report. 8 http://www.atvmloan.energy.gov/public/pr‐062309.pdf, accessed September 10, 2009. 9 Salvador Aceves, Overview of Hydrogen and Fuel Cell Activities, CARB ZEV Symposium September 21, 2009. Web: http://www.arb.ca.gov/msprog/zevprog/2009symposium/presentations/aceves.pdf (accessed 10‐9‐09) 10 “Fuel Cell Vehicle Technology Performance & Steps Ahead”, Ben Knight, Honda CARB ZEV Symposium September 21, 2009; “Progress and Challenges for Toyota’s Fuel Cell Vehicle Development”, Tatsuaki Yokoyama Toyota Motor Engineering & Manufacturing North America CARB ZEV Symposium September 21, 2009. 11See “Initiative H2 Mobility” joint press release, September 10, 2009, available on Daimler website at http://www.daimler.com/dccom/0‐5‐658451‐1‐1236356‐1‐0‐0‐0‐0‐0‐12080‐7165‐0‐0‐0‐0‐0‐0‐0.html#bm1252583426, last accessed 11‐24‐09. 12 JB Straubel, Vehicle Fleet Experience Overview, CARB ZEV Symposium September 22, 2009. Web: http://www.arb.ca.gov/msprog/zevprog/2009symposium/presentations/straubel.pdf (accessed 10‐9‐09) 13 Jim Motavalli, B‐Net, October 14, 2009. “Batteries vs. Fuel Cells: A Tale of Unequal Federal Funding”http://industry.bnet.com/auto/10002666/batteries‐vs‐fuel‐cells‐a‐tale‐of‐unequal‐federal‐funding/?tag=shell;content, accessed 10‐16‐09. 14 CARB scoping plan page 119 (version posted on‐line as of 9‐9‐09 at http://www.arb.ca.gov/cc/scopingplan/document/adopted_scoping_plan.pdf) 15 CALSTART, Clean Transportation Technology in California, 2009, Appendix B 16 California Energy Commission, Investment Plan for the Alternative and Renewable Fuel and Vehicle Technology Program, April 2009, CEC‐600‐2009‐008‐CMF 17 California Energy Commission, Investment Plan for the Alternative and Renewable Fuel and Vehicle Technology Program, April 2009, CEC‐600‐2009‐008‐CMF, pages 17 and 23. 18 http://www.arb.ca.gov/research/health/pm‐mort/pm‐mort.htm 19 See Table 2.5 of chapter 2, Working Group 1 20 For instance see Molina et al, Proceedings of the National Academy of Sciences, October 2009. 21 “Clean Transportation Technology in California”, Calstart, 2009; and Manufacturers Emission Control Association, 2008. 22 CEC, “Investment Plan for the Alternative and Renewable Fuel and Vehicle Technology Program”, April 2009, page C‐1.

Chapter 6 – Transportation
6‐16
23 Time, “Why California is Still America’s Future”, Michael Grunwald, November 2, 2009 page 30. 24 See CARB website at http://www.arb.ca.gov/fuels/lcfs/lcfs.htm. 25 The LCFS is a performance‐based standard, fuel‐neutral approach to reducing the carbon intensity of gasoline and diesel fuel pools over time. The LCFS requires oil refineries and importers to steadily reduce the carbon‐intensity of their fuels starting in 2011 and by 2020, to achieve a 10 percent reduction in the carbon‐intensity of their fuels. The standard provides fuel providers the flexibility to either supply a mix of fuels that, on average, meets the requirement or to purchase low carbon fuel credits. Companies that produce low‐carbon fuels such as advanced biofuels, electricity, natural gas, and hydrogen, and biomethane will benefit because they can generate LCFS credits. 26 CARB, “Proposed Regulation to Implement the Low Carbon Fuel Standard”, Volume II, Appendices, release date: March 5, 2009, Tables E‐1a to E‐8a. 27 Low‐carbon ethanol includes low carbon‐intensity corn‐starch based ethanol and cellulosic ethanol or other advanced biofuel replacing gasoline. 28 CARB, “Proposed Regulation to Implement the Low Carbon Fuel Standard”, Volume II, Appendices, release date: March 5, 2009, Tables E‐1a to E‐8a. 29 CEC, “Investment Plan for the Alternative and Renewable Fuel and Vehicle Technology Program”, April 2009, page 35. 30 http://www.epa.gov/otaq/renewablefuels/index.htm 31 CARB estimate based on 15 billion gallons of advanced and cellulosic ethanol as required by the RFS 2 and a California market share of the national gasoline market of 11.3% (see See CARB Table VIII‐23, “Proposed Regulations to Implement the Low Carbon Fuel Standard, Volume I, Staff Report”, Initial Statement of Reasons, release date: March 5, 2009.) 32 The EPA Administrator is allowed by statute to relax the standard by up to 10%. 33 See CARB Table VI‐3, “Proposed Regulations to Implement the Low Carbon Fuel Standard, Volume I, Staff Report”, Initial Statement of Reasons, release date: March 5, 2009. 34 This assumes a mid‐sized, advanced biofuel facility produces 50 million gallons per annum. 35 CARB, “ Proposed Regulation to Implement the Low Carbon Fuel Standard”, Volume I, Staff Report: Initial Statement of Reasons, release date: March 5, 2009, page VII‐2. 36 See “Demonstration of Integrated Biorefinery Operations”, $480 million which closed 6/30/2009; and “Development of Algal/Advanced Biofuels Consortia”, $85 million which closed 9/15/2009. Available at http://www.energy.gov/recovery/renewablefunding.htm#BIOMASS, last accessed 10/14/2009.