advanced capnography. objectives list three indications for capnography. differentiate between...
TRANSCRIPT

ADVANCED CAPNOGRAPHY
Objectives
• List three indications for capnography.• Differentiate between mainstream and
sidestream capnography.• Given a time-based capnogram, identify
and distinguish between the phases.• Given a time-based capnogram, interpret
any abnormality present.• Given a volume-based capnogram, identify
and distinguish between the phases.• Given a volume-based capnogram, state
the significance of each phase.
Objectives• Given a volume-based capnogram, interpret
any abnormality present.• List two instances where volume-based
capnography can lead to improved patient management.
• State the formula used for the calculation of non-invasive cardiac output via the CO2 Partial-Rebreathing method.
• Describe the set-up used to measure cardiac output via the CO2 Partial-Rebreathing method.
• List two additional uses for capnography.

Physiology of Carbon Dioxide
METABOLISM PERFUSION VENTILATION
ALL THREE ARE IMPORTANT!

Carbon Dioxide Monitoring Technology
• Mass Spectroscopy
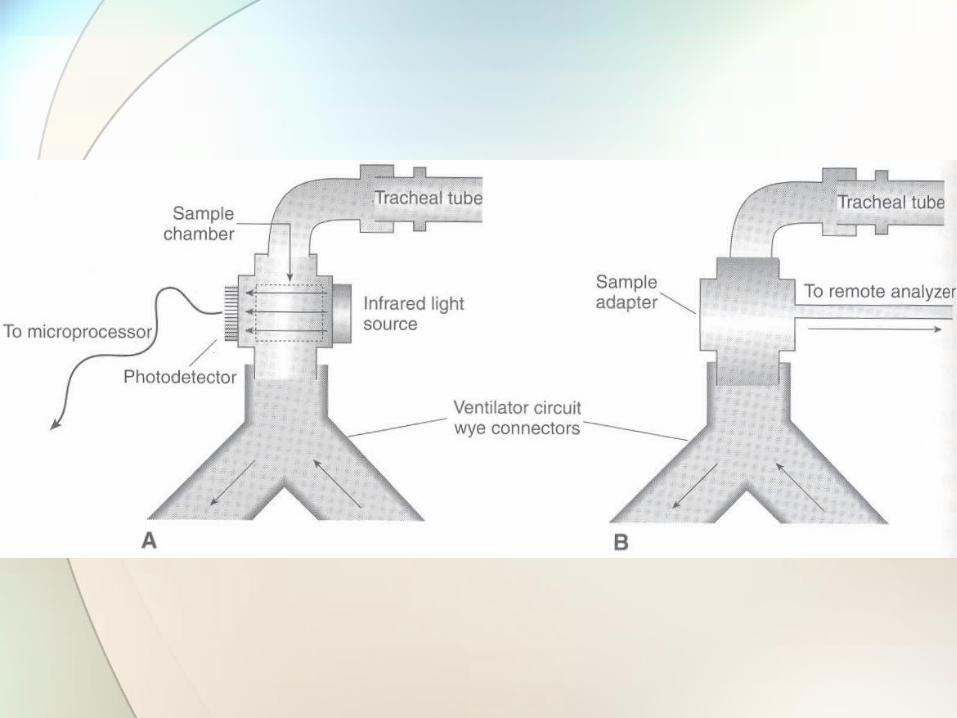
• Methods of Sampling• Mainstream• Sidestream• Microstream

Key Technological Issues
• Calibration
• Moisture Control
• Sample flow rate
• Transit time
• Response time
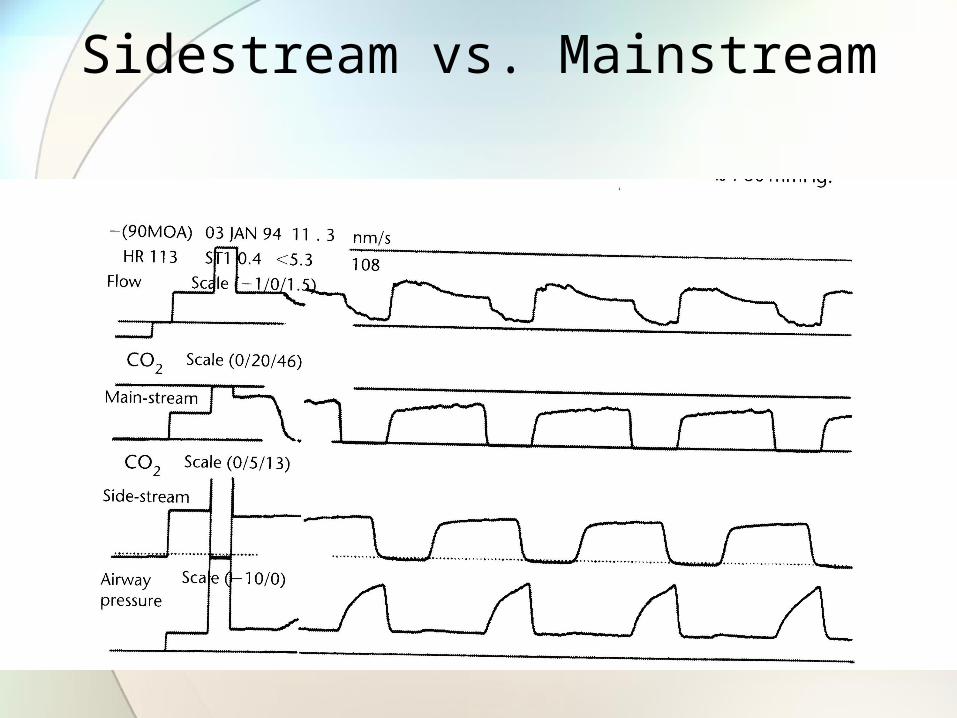
Sidestream vs. Mainstream
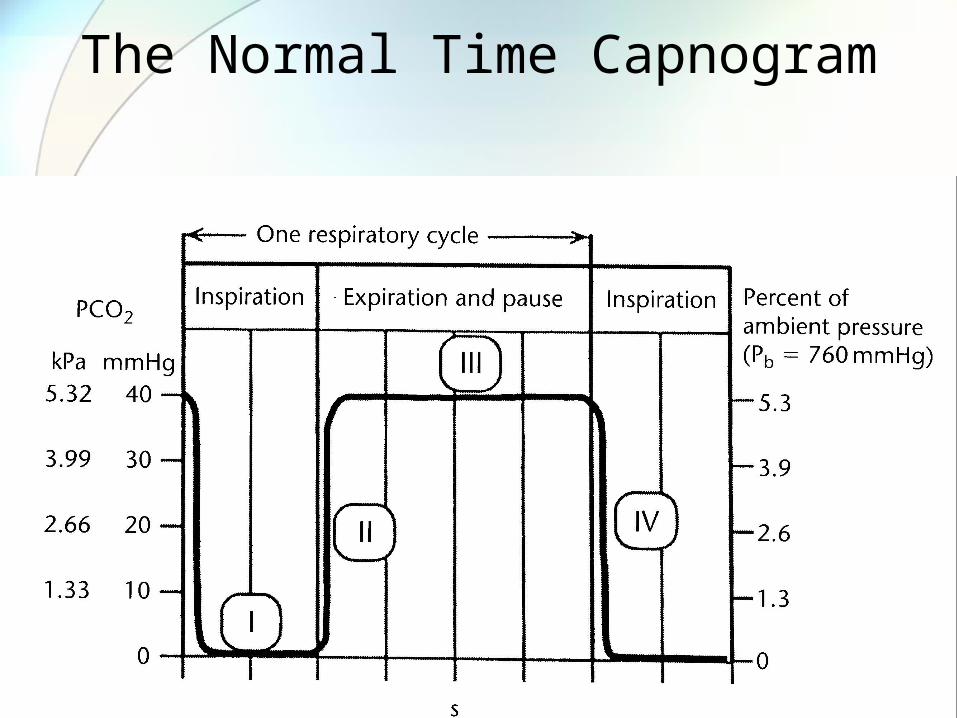
The Normal Time Capnogram
Phases of the Time Capnogram
• Phase I: Inspiration • No CO2 detected (hopefully)
• Phase II: Appearance of CO2 in the system.• Mixed alveolar and deadspace gas.
• Phase III: Plateau• Constant emptying of alveolar gas.• Presence of CO2 through the end of the
breath.
• Phase IV: Washout of CO2 from subsequent inspiration.
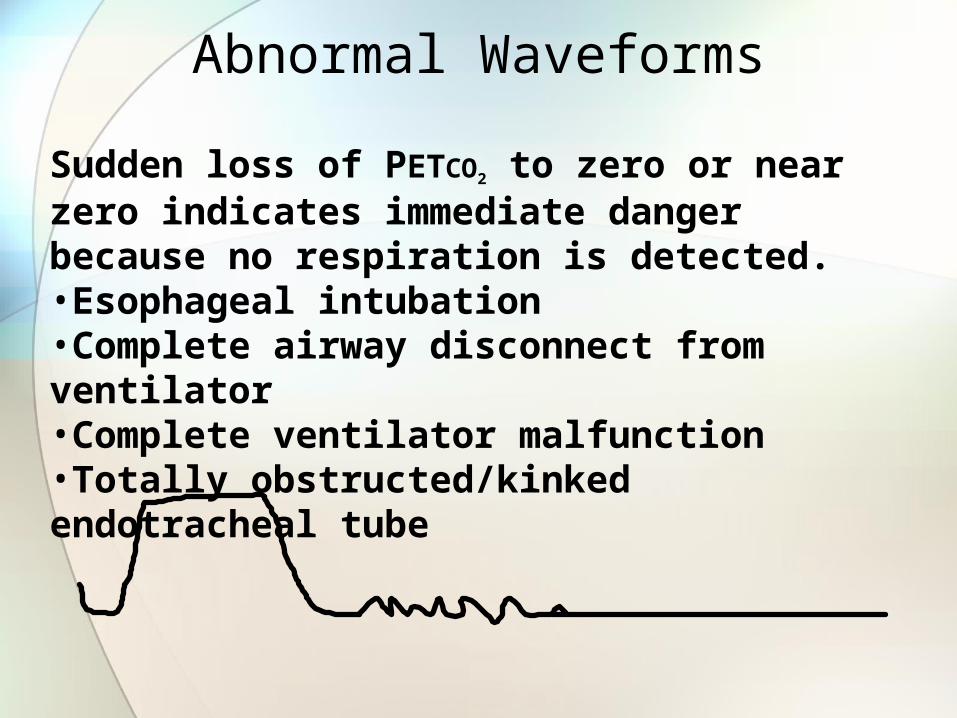
Abnormal Waveforms
Sudden loss of PETCO2 to zero or near zero indicates immediate danger because no respiration is detected. •Esophageal intubation•Complete airway disconnect from ventilator•Complete ventilator malfunction•Totally obstructed/kinked endotracheal tube

Abnormal Waveforms
Exponential decrease in PETCO2 reflects a catastrophic event in the patient’s cardiopulmonary system.•Sudden Hypotension/massive blood loss•Circulatory arrest with continued ventilation•Pulmonary embolism•Cardiopulmonary Bypass
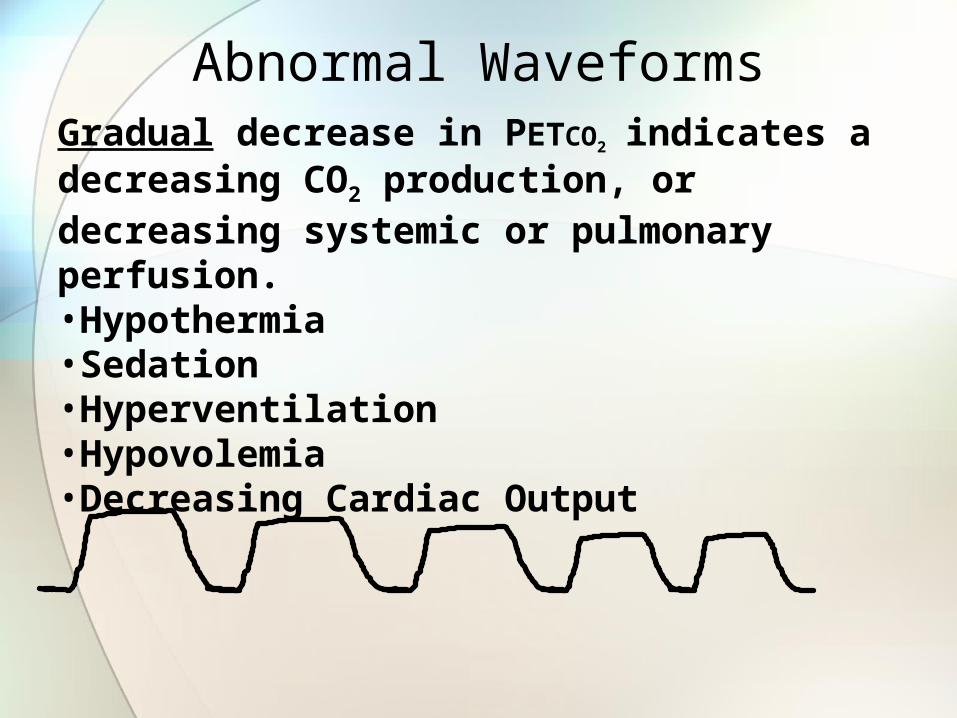
Abnormal WaveformsGradual decrease in PETCO2 indicates a decreasing CO2 production, or decreasing systemic or pulmonary perfusion.•Hypothermia•Sedation•Hyperventilation•Hypovolemia•Decreasing Cardiac Output
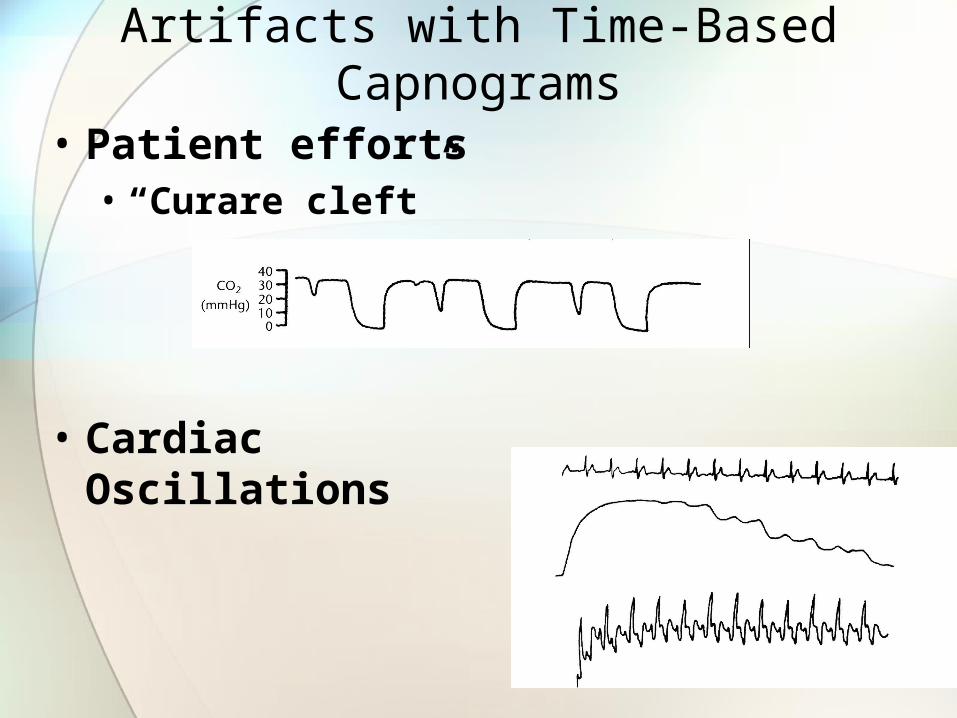
Artifacts with Time-Based Capnograms
• Patient efforts• “Curare cleft”
• Cardiac Oscillations
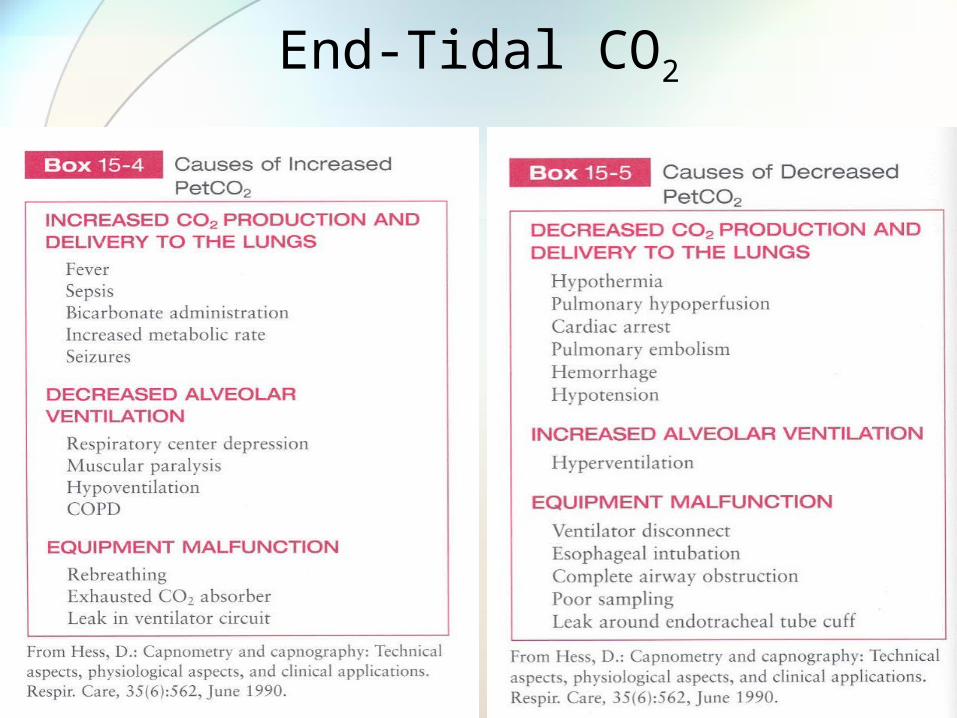
End-Tidal CO2
Clinical Uses of Capnography
• Weaning
• Hyperventilation monitoring
• Use in Cardiac Arrest• Intubation verification• Restoration of Spontaneous Circulation• Easy Cap
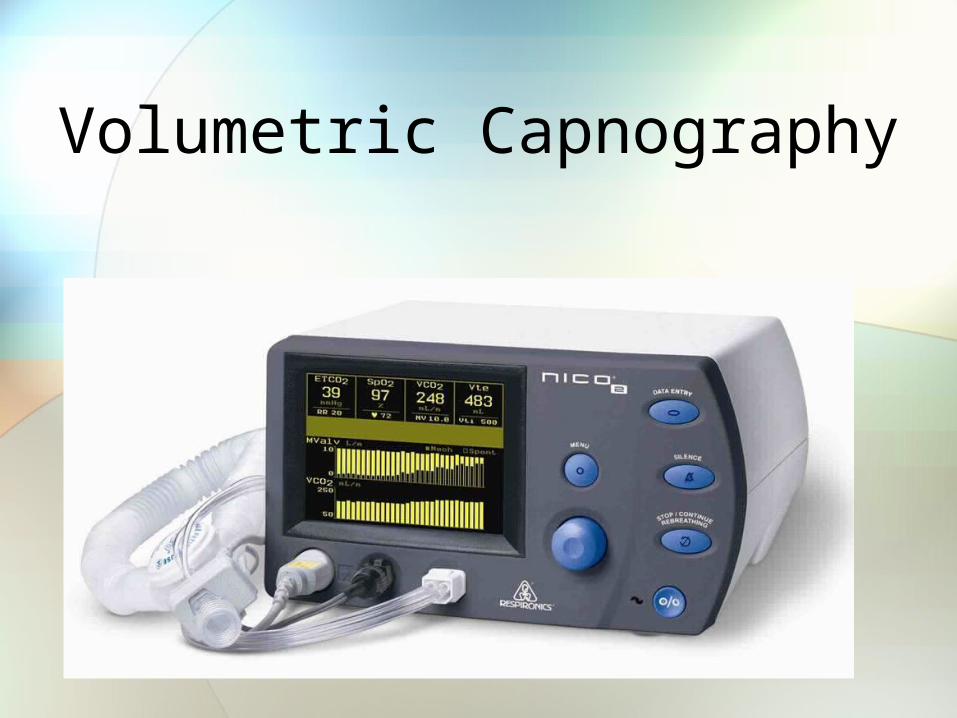
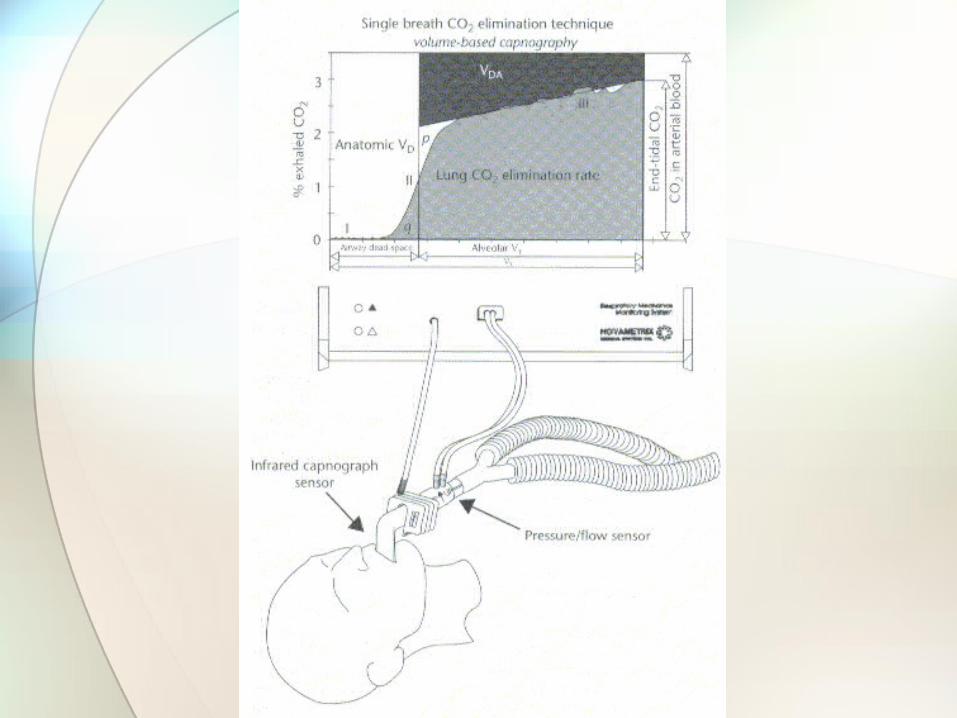
Volumetric Capnography
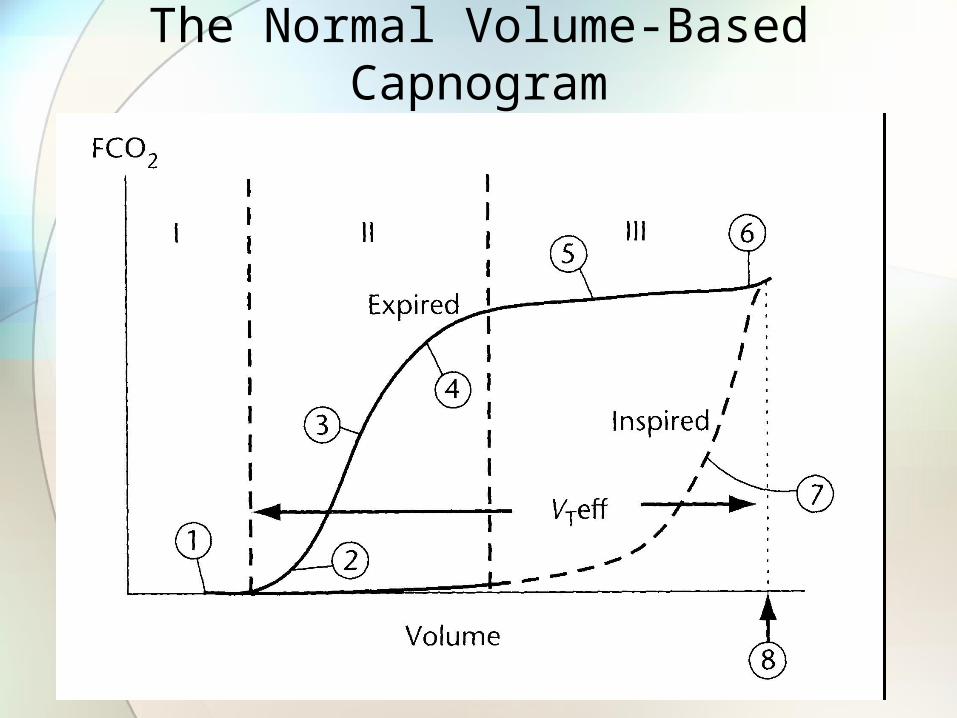
The Normal Volume-Based Capnogram

Checklist for Interpreting a Volume-Based Capnogram
• Phase I – Deadspace Gas• Rebreathing? (1)• Deadspace seem right?
• Phase II – Transitional Phase• Transition from upper to lower airways. • Should be steep. (3)• Represents changes in perfusion.
• Phase III – Alveolar Gas Exchange• Changes in gas distribution.• Increased slope = mal-distribution of gas delivery. (5)• End of Phase III is the PETCO2. (6)• Area under the curve represents the volume of expired CO2
(VCO2).
• Exhaled volume (8)

The Normal Volume-Based Capnogram
Vd
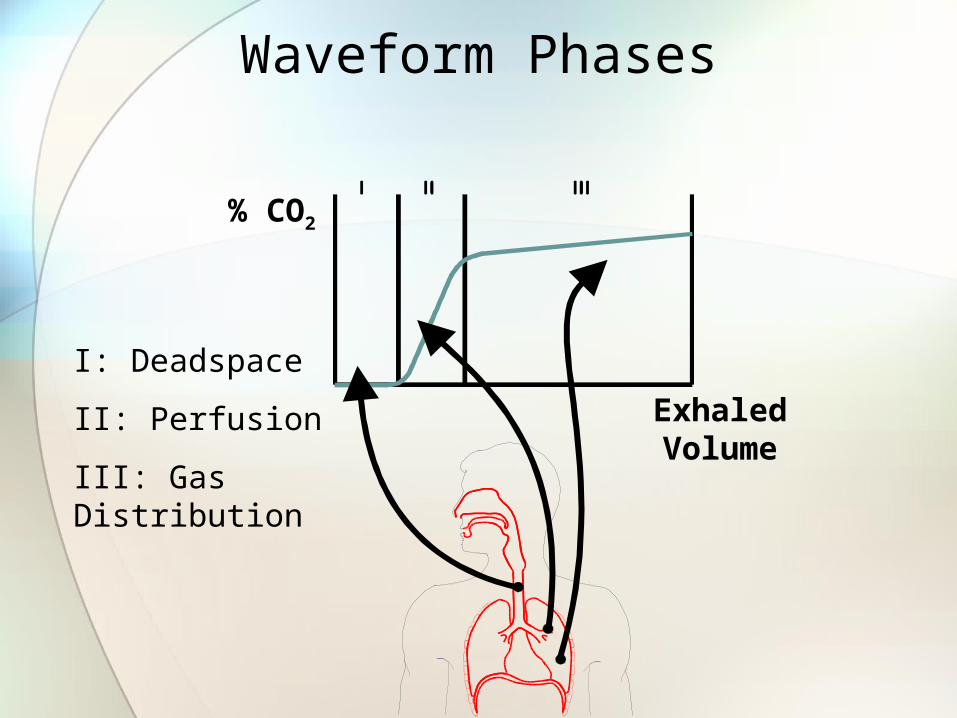
Waveform Phases
% CO2
ExhaledVolume
I: Deadspace
II: Perfusion
III: Gas Distribution
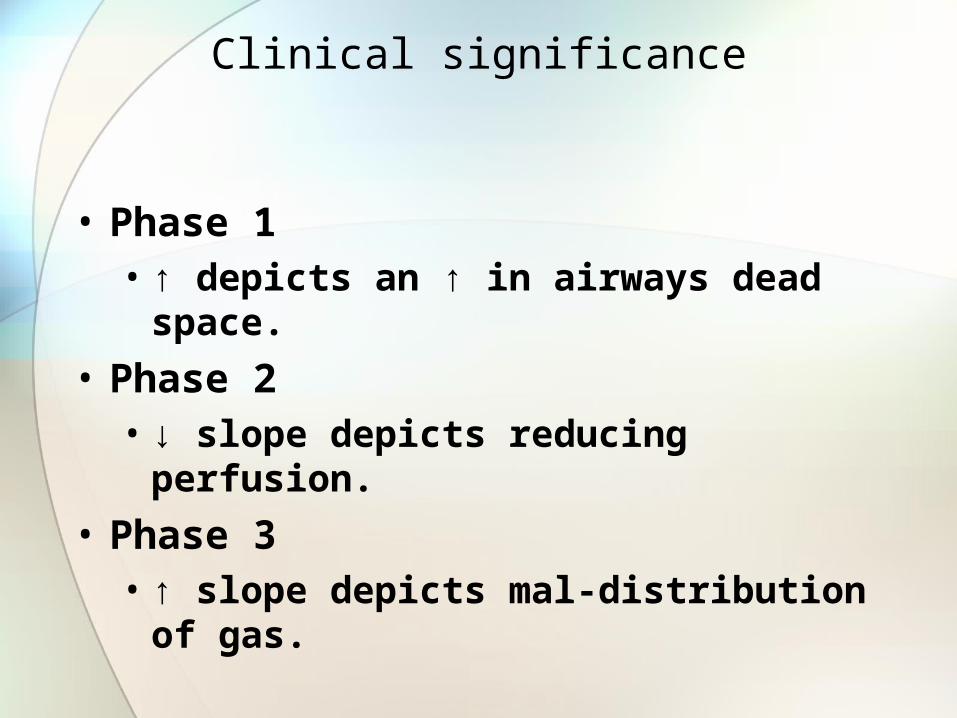
Clinical significance
• Phase 1• ↑ depicts an ↑ in airways dead space.
• Phase 2 • ↓ slope depicts reducing perfusion.
• Phase 3 • ↑ slope depicts mal-distribution of gas.
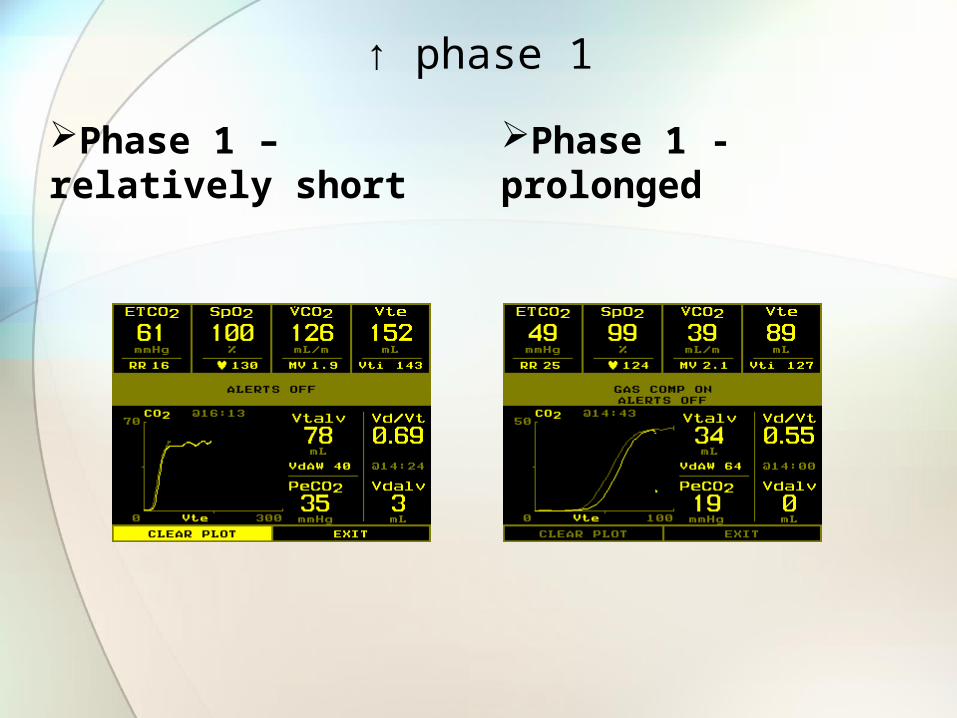
↑ phase 1
Phase 1 – relatively short
Phase 1 - prolonged
Phase 2 assessment
If in phase 2– Assure stable minute ventilation• Assess PEEP level
• ↑ intrathoracic pressure may cause venous return
• Assess hemodynamic status• Is minute ventilation stable?• Volume resuscitation or vasopressors may be indicated
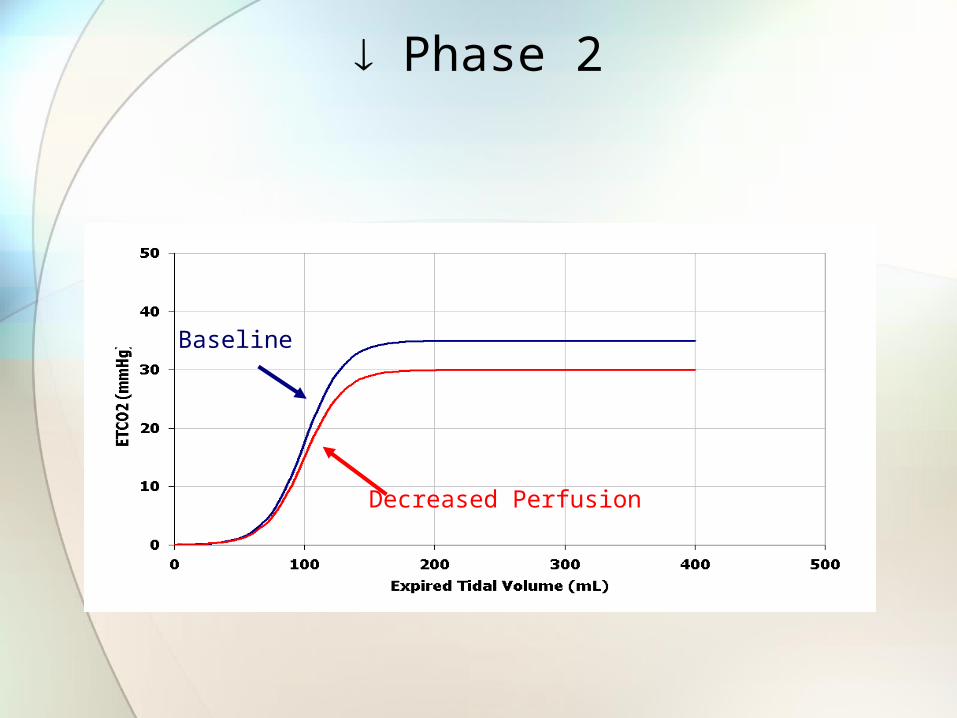
Phase 2
Decreased Perfusion
Baseline
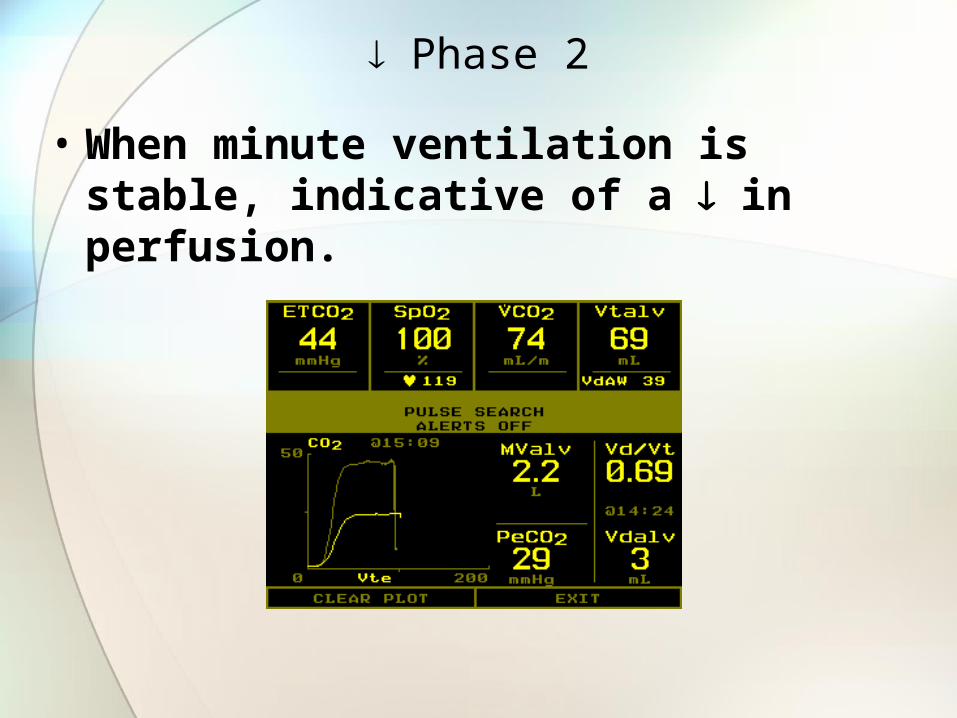
Phase 2
• When minute ventilation is stable, indicative of a in perfusion.

Phase 3 assessment
If ↑ or absent phase 3 mal-distribution of gas at alveolar level exists • Assess for appropriate PEEP level
• Inadequate PEEP may be present
• Bronchospasm• Bronchodilator tx my be indicated
• Structure damage at alveolar level may be present
• Pnuemothorax?

↑Phase 3
CO2
Exhaled Volume
increased phase 3
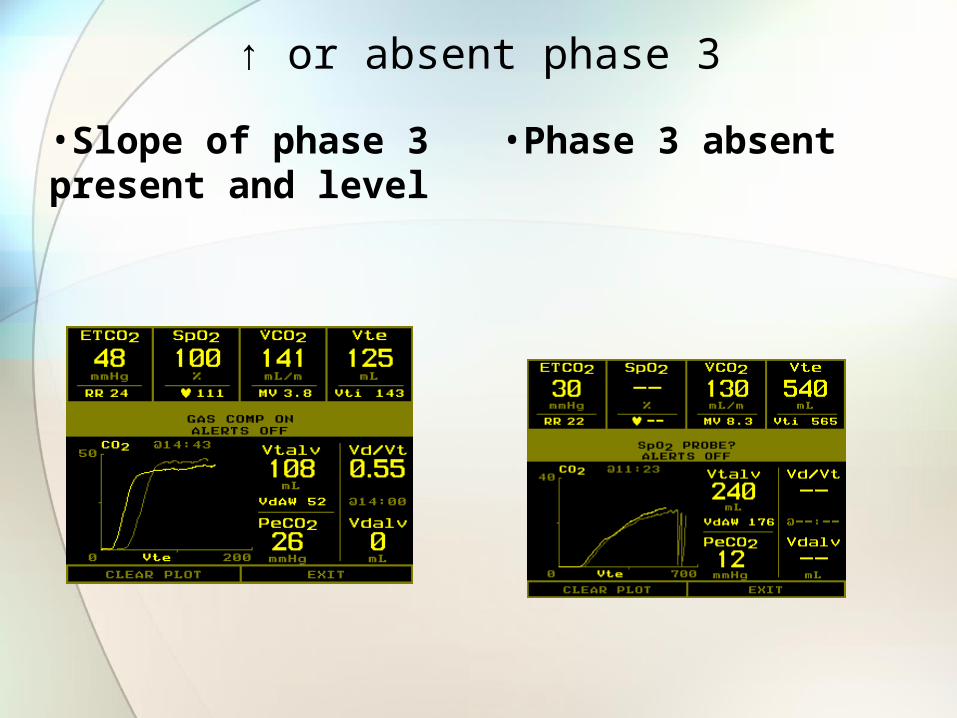
↑ or absent phase 3
•Slope of phase 3 present and level
•Phase 3 absent
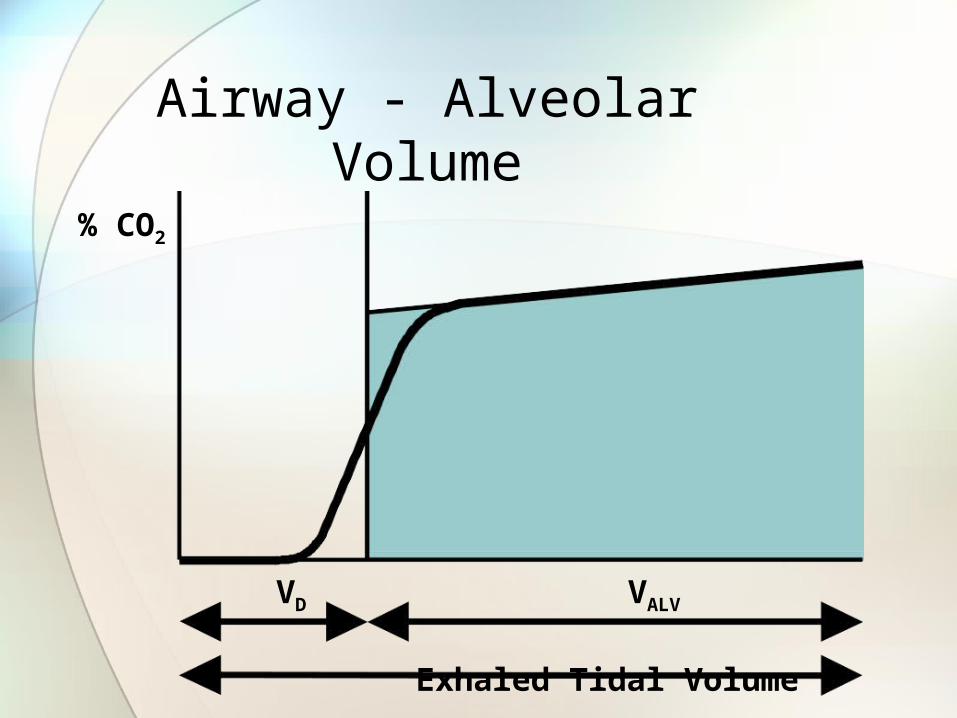
Airway - Alveolar Volume
% CO2
VD VALV
Exhaled Tidal Volume

Effective Tidal Volume
• The volume of gas between the end of Phase I and the end of Phase III.
• Phase I represents the volume of gas being delivered from the ventilator which doesn’t participate in gas exchange.• Monitoring of the effective tidal volume (and
A) can indicate on a breath-by-breath basis when PaCO2 changes will be occurring before they actually rise.
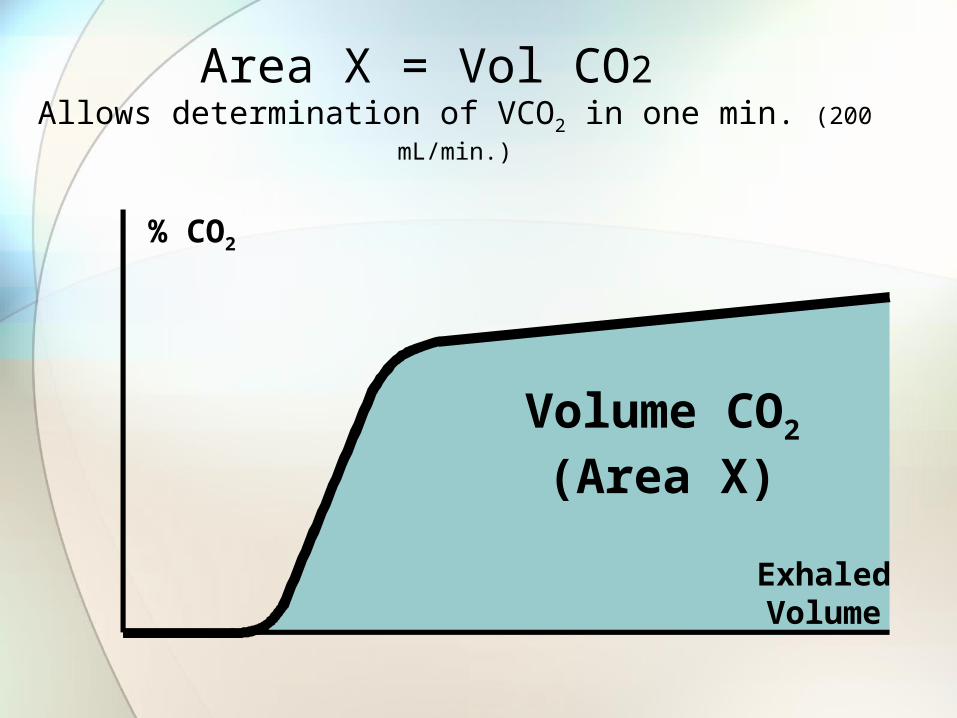
Area X = Vol CO2 Allows determination of VCO2 in one min. (200 mL/min.)
ExhaledVolume
% CO2
Volume CO2
(Area X)
CO2
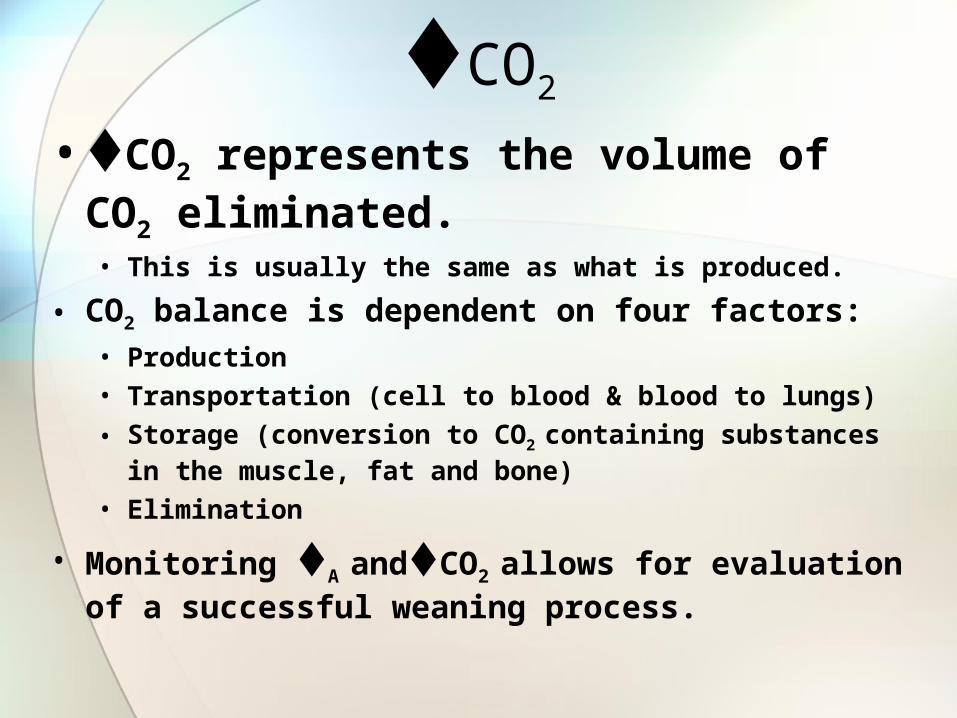
• CO2 represents the volume of CO2 eliminated.• This is usually the same as what is produced.
• CO2 balance is dependent on four factors:• Production• Transportation (cell to blood & blood to lungs)
• Storage (conversion to CO2 containing substances in the muscle, fat and bone)
• Elimination
• Monitoring A andCO2 allows for evaluation of a successful weaning process.

Waveform RegionsZ = anatomic VD; Y = VD Alveolar
% CO2
VD VALV
%CO2 in Arterial Blood
ZX
Y
Exhaled Tidal Volume

Sum of VDanat (Z) and VDalv (Y) is Physiologic VD
X
Y
Z
PaCO2 - PeCO2
PaCO2
Y + Z
X + Y + Z=• Phys VD / VT
• Alveolar Ventilation
• Min. Vol. CO2
( VCO2 )

Uses of Volumetric Capnography
• Assess work of breathing during weaning trial.

EXPECTED
Using Vtalv and VCO2 to Recruit Alveoli in a
Postoperative CABG Patient Suffering from Hypoxemia
Submitted by Douglas C. Oberly, MS, RRT
Manager Respiratory Care Department Hartford Hospital, Hartford, CT
Using Vtalv and VCO2 to Recruit Alveoli
• Patient Profile• 72 yo male, post-op CABG, MV
• Clinical Challenge• Developed a low SpO2 within 2 hours of
arrival into the ICU• FIO2 and PEEP increased, no acceptable
change in PaO2 and SpO2
• Clinical Intervention• Lung recruitment

•Clinical Course•PEEP increased by 2 cm H2O every 10 minutes•Observed Vtalv, VCO2 and SpO2
•Monitoring Data•Red arrows show PEEP increases•No deterioration in VCO2,
oV/Q stable
•Vtalv starts to increase at 16 cm H2O, alveoli are being recruited•SpO2 responded at 20cm H2O
Using Vtalv and VCO2 to Recruit Alveoli
• Summary• Vtalv is an ideal parameter to show
alveolar recruitment
• VCO2 indicates V/Q status during the procedure
• SpO2 did not show improvement until best PEEP
• Vtalv combined with VCO2 were best to indicate increased PEEP levels were working
Using Vtalv and VCO2 to Recruit Alveoli
Uses of Volumetric Capnography
• Optimal PEEP• Overdistension leads to increased
Vdanat and reduced perfusion.• Increased Vdanat can be assessed by an
increase in Phase I volume.• Reduced perfusion can be assessed by a
decrease in Phase II slope combined with a decrease in VCO2.

Increasing PEEP –
•Expanded Airways increase Vdanat.(zone Y)•Expanded alveoli restrict perfusion so increased Vdalv. (Zone Z)
Exhaled Volume
0 3 6 9 12 15 cmH2O
VCO2 to Determine Optimal PEEP
Submitted by
Douglas C. Oberly MS, RRT
Manager, Respiratory Care Department
Hartford Hospital, Hartford, CT
VCO2 to Determine Optimal PEEP
• Patient Profile• 25 yo male, motorcycle accident
• Head injury, rib fractures
• Pentobarbital induced coma
• Clinical Challenge• Developed acute lung injury• Low PaO2, SpO2
• Clinical Intervention• Maximize lung recruitment
• Determine optimal PEEP• Without aversely affecting intracranial
pressures
• Clinical Course• Monitor VCO2 and VA
• Increase PEEP in 2 cm H2O increments
VCO2 to Determine Optimal PEEP
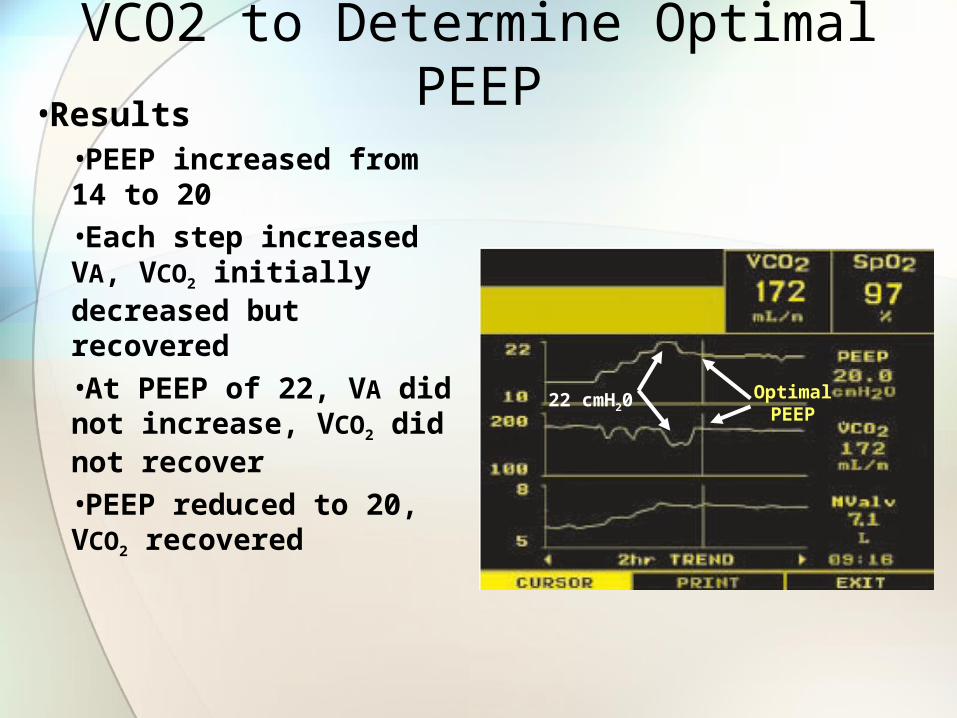
•Results•PEEP increased from 14 to 20•Each step increased VA, VCO2 initially decreased but recovered•At PEEP of 22, VA did not increase, VCO2 did not recover•PEEP reduced to 20, VCO2 recovered
22 cmH20Optimal
PEEP
VCO2 to Determine Optimal PEEP
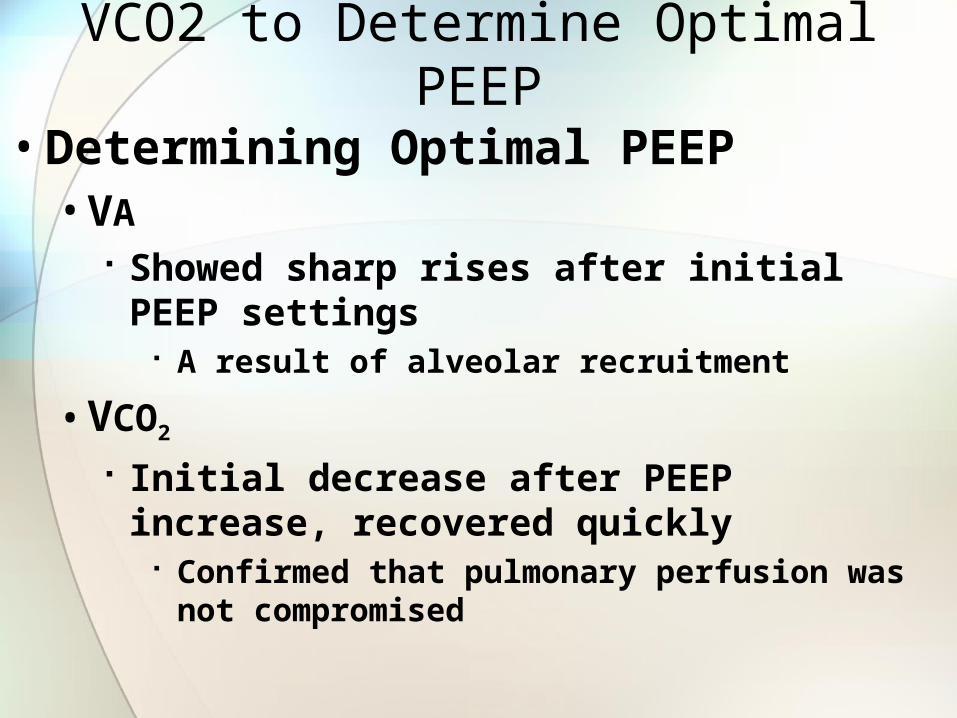
• Determining Optimal PEEP• VA
Showed sharp rises after initial PEEP settings A result of alveolar recruitment
• VCO2
Initial decrease after PEEP increase, recovered quickly
Confirmed that pulmonary perfusion was not compromised
VCO2 to Determine Optimal PEEP
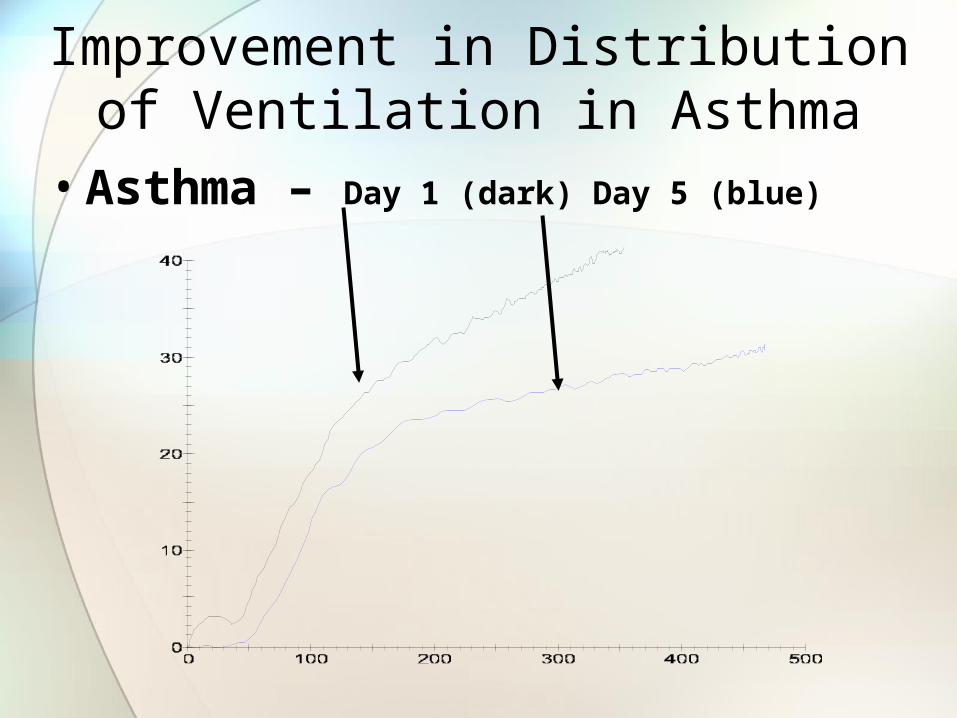
Improvement in Distribution of Ventilation in Asthma
• Asthma – Day 1 (dark) Day 5 (blue)
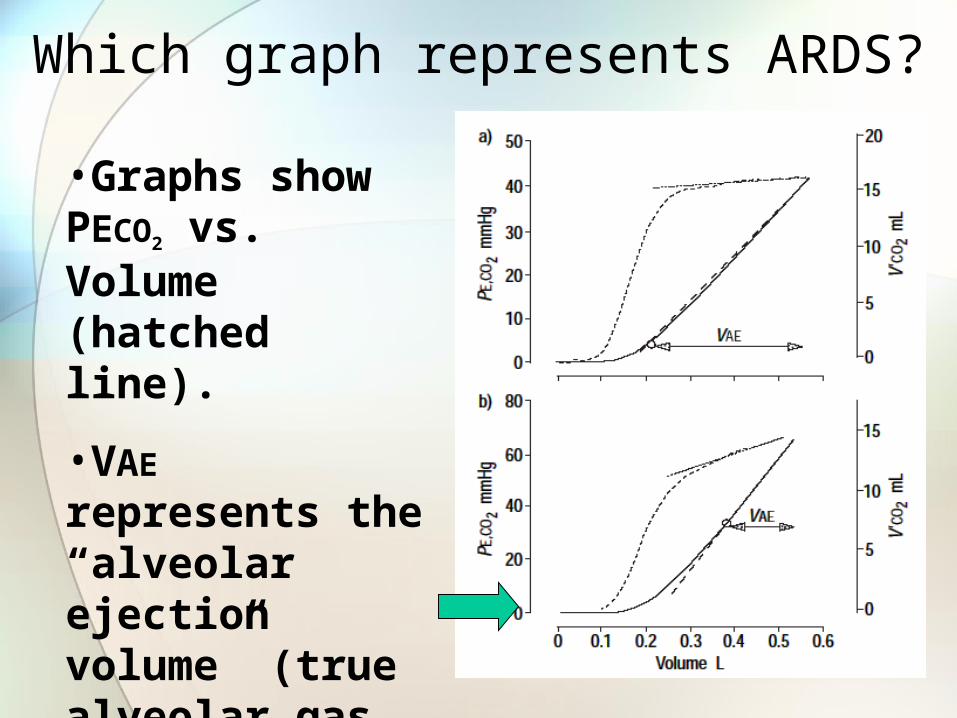
Which graph represents ARDS?
•Graphs show PECO2 vs. Volume (hatched line).
•VAE represents the “alveolar ejection volume” (true alveolar gas mixing volume).

Uses of Volumetric Capnography
• Pulmonary Embolism• 650,000 cases/year in US• 50,000 to 200,000 die.• Most deaths occur within first hour.
• Prompt therapy can reduce mortality from 30% to 2.5 to 10%.
• 70% of deaths from PE identified by autopsy were not identified before death.
• Methods of PE detection• Evaluation of Vd/Vt
• PaCO2-PETCO2 gradient with maximum exhalation.
• Late deadspace fraction (Fdlate)
Uses of Volumetric Capnography
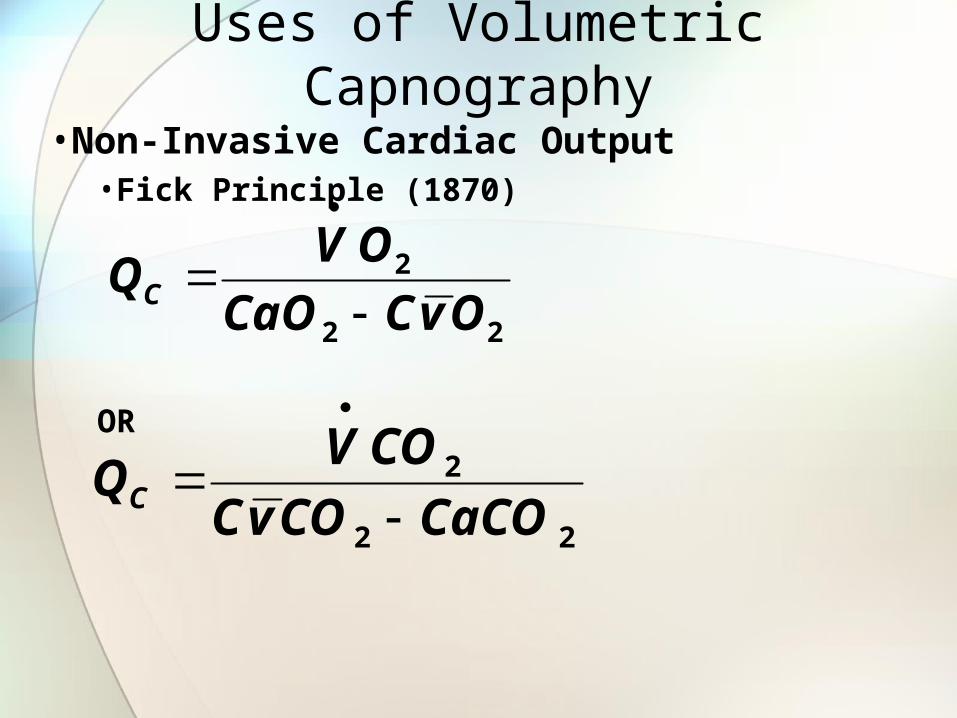
•Non-Invasive Cardiac Output •Fick Principle (1870)
OR
22
2
OvCCaO
OVQC
22
2
CaCOCOvC
COVQC
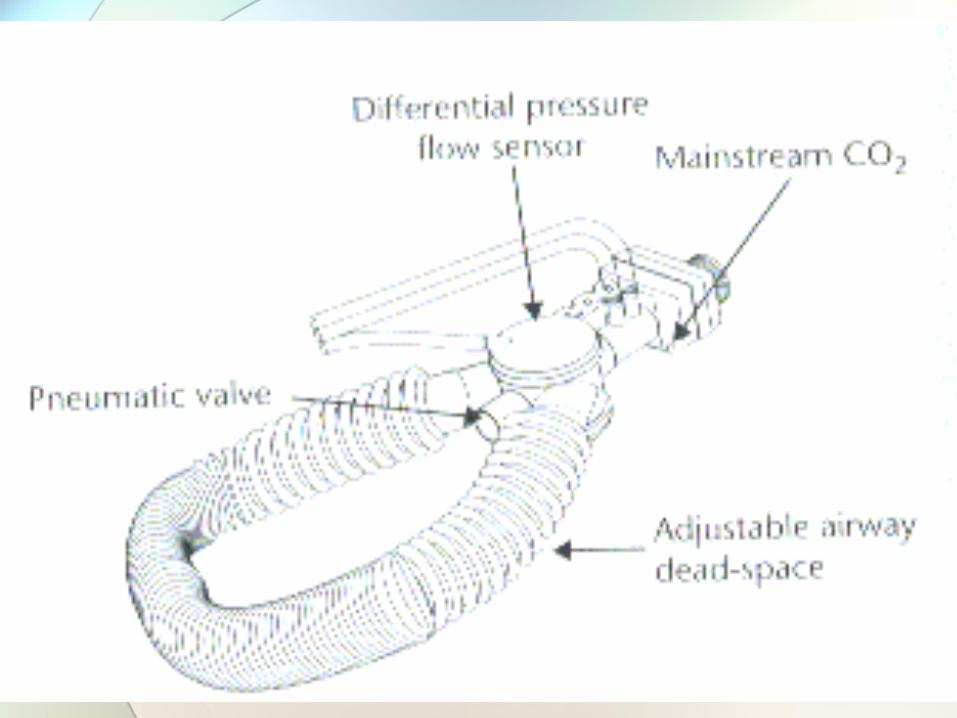

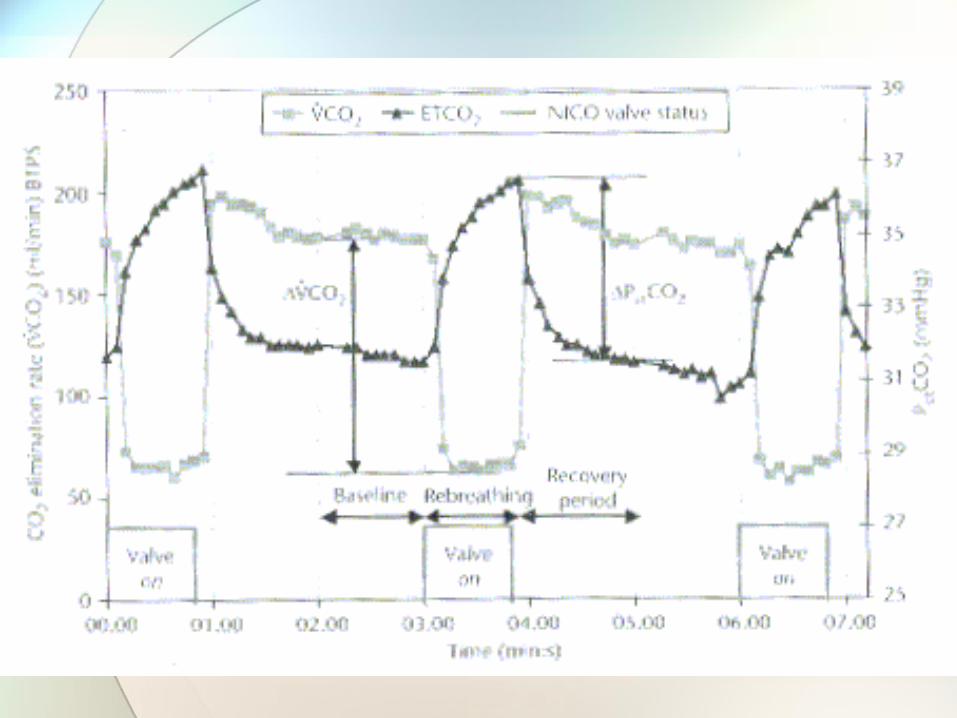
Calculation involved with NICO
22
2
CaCOCOvC
COVQC
2
2
PetCO
COVQC

Other uses for Capnography• During Apnea Testing in Brain-dead patients.
• Eur J Anaesthesia Oct 2007, 24(10):868-75 • Evaluating DKA in children.
• No patients with a PETCO2 >30 had DKA.• J Paeditr Child Health Oct 2007, 43(10):677-680
• Vd/Vt ratio and ARDS Mortality• Elevated Vd/Vt early in the course of ARDS was
correlated with increased mortality.• Chest Sep 2007, 132(3): 836-842
• PCA Administration• “Continuous respiratory monitoring is optimal for
the safe administration of PCA, because any RD event can progress to respiratory arrest if undetected.”
• Anesth Analg Aug 2007, 105(2):412-8