adsorption of natural organic polyelectrolytes by activated carbon: a size-exclusion...
TRANSCRIPT
Adsorption of Natural OrganicPolyelectrolytes by ActivatedCarbon: A Size-ExclusionChromatography StudyJ A M E S E . K I L D U F F , †
T A N J U K A R A N F I L , †
Y U - P I N G C H I N , ‡ A N DW A L T E R J . W E B E R , J R . * , †
Department of Civil and Environmental Engineering, TheUniversity of Michigan, Ann Arbor, Michigan 48109-2125, andDepartment of Geological Sciences, The Ohio State University,Columbus, Ohio 43210-1002
The adsorption of several different organic polyelec-trolytes from aqueous solution by activated carbonwas characterized. Polyelectrolytes included hu-mic acids extracted from peat and soil, polymaleic acid,a synthetic polymer identified as a fulvic acid sur-rogate, and natural organic matter in Huron River (AnnArbor, MI) water. Isotherms of individual ultrafil-tration size fractions confirmed that smaller mole-cular size components adsorb to a greater extenton an adsorbent mass basis. The molecular weightdistributions of organic polyelectrolytes remainingin solution after equilibration with various amounts ofactivated carbon were measured with high-performance size-exclusion chromatography (HPSEC).A comparison of molecular weight distributionsdemonstrated conclusively that small molecular sizecomponents are adsorbed preferentially; i.e., ad-sorptive fractionation on the basis of molecular sizeoccurs. This behavior was observed for each ofthe wide variety of samples studied, suggesting thatit may be a rather general feature of the adsorptionof polyelectrolyte mixtures from solution by activatedcarbon.
IntroductionHumic and fulvic acids are natural organic polyelectrolytesthat comprise the greatest proportion of naturally-occurringdissolved organic matter in aqueous systems (1-3). Humicmaterials may be specifically targeted for removal frompotable water supplies because they can adversely affectappearance and taste, and they can react with chlorine toform potentially carcinogenic chlorinated organic com-pounds. Further, the presence of macromolecular dissolvedorganic matter may reduce the effectiveness of watertreatment processes that employ membranes or micro-
porous adsorbents (4-6). Even when not specificallytargeted for removal, macromolecular dissolved organicmatter has been shown to compete with low molecularweight synthetic organic chemicals (SOCs), reducing theiradsorption rates and equilibrium capacities (4-9). There-fore, understanding the adsorption of humic substances iscentral to optimizing their removal from solution byactivated carbon and to minimizing their impacts on theadsorption of other compounds specifically targeted forremoval.
Natural dissolved organic matter and humic materialextracted from aqueous and terrestrial sources are poly-disperse mixtures of components having different sizes andadsorption characteristics. The behavior and reactivity ofnatural and synthetic organic polyelectrolytes may depend,in part, on their molecular weight (MW) or size in solution.The impact of molecular weight on polyelectrolyte adsorp-tion has been shown to depend on (i) the importance ofsorbate/solute interactions (10, 11); (ii) the rate of adsorp-tion (11-14); (iii) the polydispersity of the mixture (11, 12,15, 16); and (iv) the ability of the adsorbate to accessadsorbent surface area (17-20). This latter effect has beendemonstrated in studies of polyelectrolyte adsorption bya variety of porous adsorbents including activated carbon(18-21), crystalline CaCO3 (22), and ion exchange resins(23), suggesting that the ability of an adsorbate to accessadsorbent surfaces has a significant impact on the extentof adsorption.
Studies using monodisperse solutes or fractions of wholesolutions provide insight into the effects of molecular size,but they do not provide information about how differentsize components may compete when adsorbed from amixture. Several studies have revealed that isotherms forthe adsorption of humic substances on activated carbonexhibit characteristics of multicomponent competitiveadsorption from mixtures. Few studies, however, have beendirected toward identifying or characterizing the nature ofthis competition. El-Rehaili and Weber (24), using Sepha-dex gel-permeation chromatography calibrated with pro-teins, observed that the removal of total organic carbon(TOC) in smaller size fractions increased with increasingactivated carbon concentration or dose, Do. However, themolecular size distributions measured were useful only forqualitative comparisons. Further, the system requiredsample concentration by a factor of 60, which resulted ina loss of TOC ranging from 5 to 52%. Other limitations ofSephadex as a chromatography packing material arediscussed by Hine and Bursill (25). Summers and Roberts(20) used ultrafiltration fractionation to conduct a similarstudy using the same commercial humic material (Aldrich).They observed a shift in the molecular size distribution tolarger sizes with increasing adsorbent dose, but did notobserve increased removal of the smallest size fraction.Limitations of using ultrafiltration for this type of study are(i) the resolution of the technique is limited by the numberof membranes available and the range of pore sizes withina particular membrane; and (ii) the sample size requiredis relatively large. A limitation to both of the above studiesis the use of commercial humic acids, which may not beappropriate as analogues of true soil or aqueous humicsubstances (26).
* Corresponding author telephone: (313)763-1464; fax: (313)763-2275; e-mail address: [email protected].
† The University of Michigan.‡ The Ohio State University.
Environ. Sci. Technol. 1996, 30, 1336-1343
1336 9 ENVIRONMENTAL SCIENCE & TECHNOLOGY / VOL. 30, NO. 4, 1996 0013-936X/96/0930-1336$12.00/0 1996 American Chemical Society
Size-exclusion chromatography is a technique particu-larly well suited for quantifying different size componentsin a mixture. Gloor et al. (27) showed that size-exclusionchromatography could be used to measure changes inmolecular size distributions of lake dissolved organic matterremaining in solution after adsorption on colloidal alumina,γ-Al2O3. Bain et al. (12) used gel-permeation chromatog-raphy to measure changes in size distributions of sodiumpolyacrylate and sodium carboxy methyl cellulose remain-ing in solution after adsorption on BaSO4 crystals. Ram-achandran and Somasundaran (11) used size-exclusionchromatography to study the adsorption of PSS on hematite.They showed that size-exclusion chromatography can beused to monitor the effect of molecular weight polydispersityon the adsorption of polyelectrolytes.
Recent advances in HPSEC allow samples of naturalhumic materials and dissolved organic matter to be analyzedrapidly with little or no pretreatment, with high resolution,and at environmentally relevant concentrations (28).
ObjectivesThe focus of the research is to better understand thebehavior of humic substances in activated carbon adsorp-tion systems. Our objectives here were to (i) investigatethe impacts of molecular size and molecular size distribu-tion on the adsorption of natural and synthetic polyelec-trolytes by activated carbon; (ii) demonstrate the efficacyof high-performance size-exclusion chromatography(HPSEC) as a means for studying the adsorption of humicmaterials on activated carbon; and (iii) further characterizethe nature of competitive interactions among componentscomprising natural humic substances.
Materials and MethodsMunicipal water that was de-ionized, distilled, and pro-cessed through a Milli-Q system (MQ-water; Millipore Inc.,Bedford, MA) was used in all experiments.
Macromolecules. Polystyrene sulfonate (PSS), used tocalibrate the HPSEC column, was obtained in narrowmolecular weight fractions from Polysciences, Inc. Weightfractions used for adsorption and ultrafiltration studiesincluded 1.8K, 5.4K, 8K, and 18K. (Molecular weights willbe referred to using K to symbolize 1000 Da). The chemicalswere used as received and stored in a desiccator. Stocksolutions were made up in 1 × 10⁻³ M phosphate buffer.The ionic strength of PSS solutions was adjusted with NaCl,and the pH was adjusted to between 6.9 and 7.0 usingconcentrated HCl or NaOH as required. Conductivitymeasurements confirmed that the PSS did not measurablycontribute to the solution ionic strength at the PSSconcentrations used in this study.
A humic acid extracted from Laurentian soil (LaHA) wasobtained from Fredrik’s Research Products, Amsterdam,The Netherlands; and a humic acid extracted from peat(PHA) was obtained from the International Humic Sub-stance Society (IHSS). Unless otherwise noted, humicsolutions were buffered with phosphate, and NaCl was usedto adjust ionic strength. Polymaleic acid (PMA) wassynthesized in our laboratory by the method of Spitellerand Schnitzer (29) and is the same material studied by Carteret al. (6). River water (HRW) was obtained from the HuronRiver in Ann Arbor, MI. HRW was filtered through a 1-µmglass fiber filter and microbially stabilized by the additionof 100 mg/L sodium azide prior to refrigerated storage.Before use in adsorption experiments, all macromolecule
solutions were sequentially filtered through a 10-µmpolyethylene filter, a 1-µm glass fiber filter, and a 0.45-µmpolysulfone (Gelman Sciences) filter in a 122 mm diameterstainless steel filter holder. Stock solutions were storedrefrigerated in the dark. The solution pH was checked priorto adsorption experiments and adjusted to 7.0 ( 0.1 withHCl or NaOH as necessary.
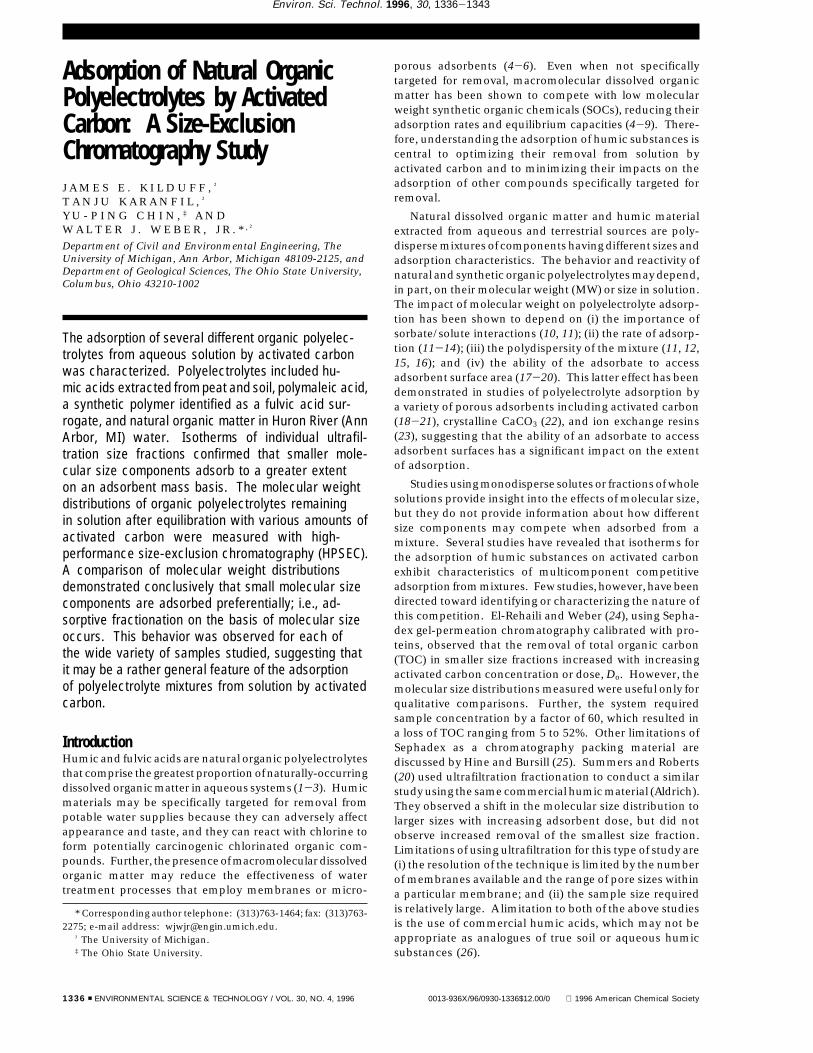
Activated Carbon. Calgon F400 activated carbon, abituminous coal-based adsorbent, was chosen for theexperimental work because it is widely used in watertreatment applications and because it has been studiedextensively by researchers in our laboratory and elsewhere.The physical properties of F400 carbon are reported in Table1.
Activated carbon obtained from the manufacturer wascrushed and mechanically sieved to yield uniform particlesizes having a mean diameter of 165 µm. Carbon waswashed with Milli-Q water, sonicated for 30 s in Milli-Qwater to reduce the amount of fines produced during theadsorption experiment (30), oven-dried at 105 °C to constantweight, and stored in a desiccator until use.
Macromolecule Adsorption Isotherms and Rate Stud-ies. Isotherms and rate studies were conducted using thebottle-point method in serum bottles sealed with Teflon-lined rubber septa and aluminum crimp seals. Rate studiesindicated that statistically significant changes in solution-phase concentration did not occur after an equilibrationperiod of 30 days. Based on the results of control vials,there was no measurable loss of macromolecular substancesfrom the reactors, and all changes in concentration in theaqueous phase of reactors containing carbon was attributedto adsorption.
After the equilibration period, samples from each reactorwere filtered through a prewashed 0.45-µm polysulfone filter(Supor, Gelman Sciences) and analyzed by total organiccarbon (TOC) analysis (Shimadzu TOC-500) and UV spec-trophotometry (Varian Optical). The TOC measurementerror as estimated by propagating the error through eachstep of the determination was 0.10 mg/L. The extent ofadsorption (qe) was measured with a precision of 3% orbetter.
Ultrafiltration Fractionation. Ultrafiltration fraction-ation of LaHA was carried out according to the protocolsdescribed by Kilduff and Weber (31). We used a semi-batch ultrafiltration system (Amicon CH2PRS) consistingof a reservoir, a peristaltic pump, and hydrophilic, neutral,cellulosic-type spiral wound membrane cartridges havingnominal molecular weight cutoffs of 3K, 10K, 30K, and 100K.In this research, the pressure drop (20 psig) and recirculationrate (0.833 L/min) were maintained constant for all experi-ments.
Size-Exclusion Chromatography. Size-exclusion chro-matography was carried out as described by Chin et al.(28). Ideally, HPSEC systems should be calibrated withcompounds having identical structure as the samples beinganalyzed. When the samples are polyelectrolytes, their
TABLE 1
Physical Characteristics of F400 Carbon% of total surface area instated pore size (Å) rangeparticle
diameter,µm
surfacearea,m2/g
av poreradius,Å
pore vol,cm3/g <10 10-50 50-100 >100
165 948 12.00 0.566 86.0 12.8 0.79 0.41
VOL. 30, NO. 4, 1996 / ENVIRONMENTAL SCIENCE & TECHNOLOGY 9 1337
structure and potential interactions with the stationaryphase may depend, in part, on solution pH and ionicstrength. Indeed, a number of researchers have noted thatmolecular weight distributions determined using size-exclusion chromatography may depend on eluent com-position (32, 33).
The use of globular proteins as molecular weightstandards may result in significant overestimates of themolecular weights of humic substances and other polymers(31, 34-36). To overcome this limitation, several inves-tigators have calibrated their systems with polymers,including polysaccharides (37) and polystyrene sulfonates(28, 31, 35). Chin and Gschwend (34) found that the coiledconfiguration of polystyrene sulfonate standards and Su-wannee fulvic acid (an IHSS standard) were nearly identicalwhen a mobile-phase ionic strength equivalent to 0.1 MNaCl and pH of 6.8 was used. Saito and Hayano (38) usedthe same mobile-phase composition and found that mo-lecular weight distributions of humic and fulvic acids wereindependent of flow rate and mass injected. In thisresearch, therefore, we used PSS standards and a mobile-phase ionic strength of 0.1 M buffered to pH 6.8. The saltcomposition of all samples was adjusted to yield an ionicstrength of 0.1 M prior to chromatographic analysis, toeliminate artifacts arising from dynamic coiling phenomenaduring sample transport through the chromatographicsystem (34).
Results and DiscussionSize-Exclusion Chromatography System Calibration andData Analysis. The HPSEC system was calibrated with fourdifferent monodisperse PSS fractions, and the column voidvolume was determined with acetone. Standard curveswere prepared daily, and an excellent linear correlation (R2
> 0.998) was found between the log10 of the molecularweight and the elution time, t.
Chromatography data was processed by first establishinga baseline. A horizontal line was constructed through theearly time data prior to sample elution, and the point wherethe chromatogram deviated from this line was taken as thebeginning of sample elution. The baseline was drawn fromthe point just prior to sample elution to the chromatogramat 13.33 min, which represented the lower limit of thestandard curve. The baseline was subtracted from thedetector response to yield a corrected chromatogram. Inall cases, baseline drift, and therefore the baseline correctionapplied, was small. The detector response at 13.33 minwas less than 2% in all chromatograms. Where necessary,chromatograms were corrected for the presence of sodiumazide by subtracting the azide spectrum.
The first moments of the chromatograms were deter-mined by numerically integrating the detector response asa function of elution time from the first point of sampleelution to 13.33 min. Approximately 500 data points wereintegrated in each chromatogram, corresponding to a timeinterval of 0.0167 min. The weight-averaged molecularweight, MW, was determined by
where MWi(t) is the molecular weight as a function of elutiontime (determined from the calibration curve); Mi(t) is the
sample mass as a function of elution time; and MT is thetotal mass of the sample. The number-averaged molecularweight, MN, was determined by
The mass of the sample is given by
where Q is the flow rate, hi(t) is the UV detector response,∆t is the time interval, and a(t) is the sample absorptivityas a function of elution time. MT was determined byintegrating Mi(t) over the entire chromatogram. For aconstant flow rate, eqs 1 and 2 are written
And the number-averaged molecular weight was deter-mined by
Sample polydispersity was determined from the ratio ofthe weight to number-averaged molecular weights.
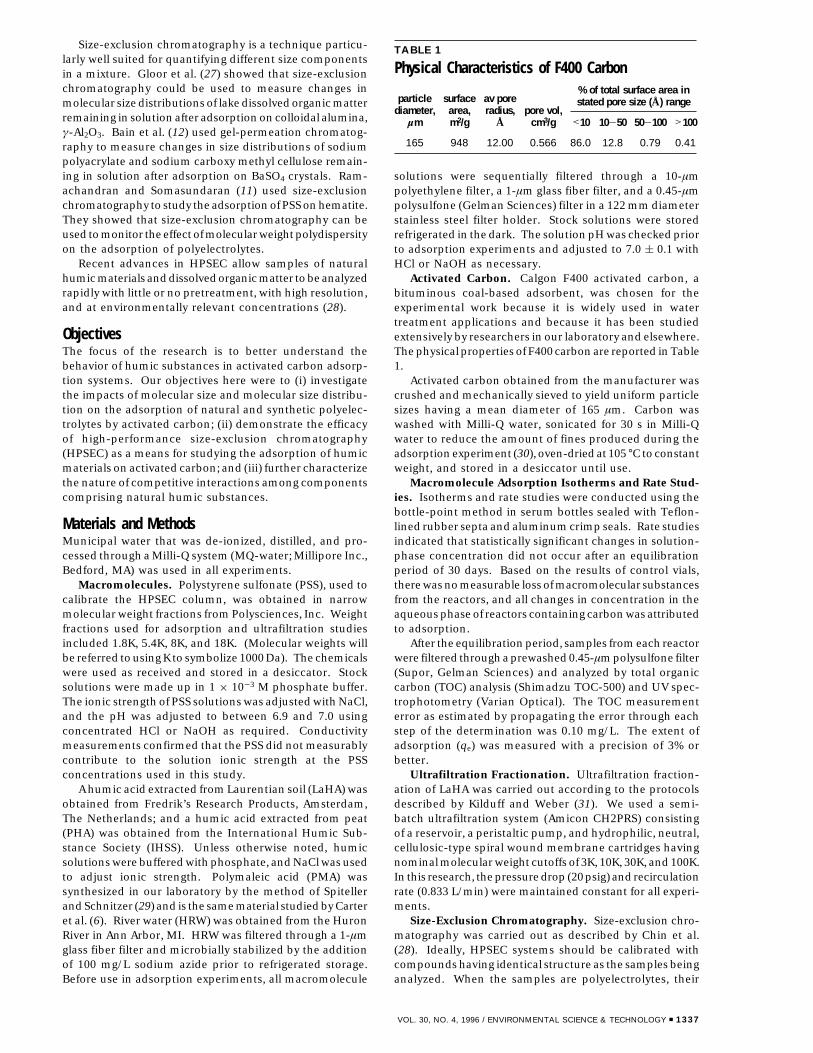
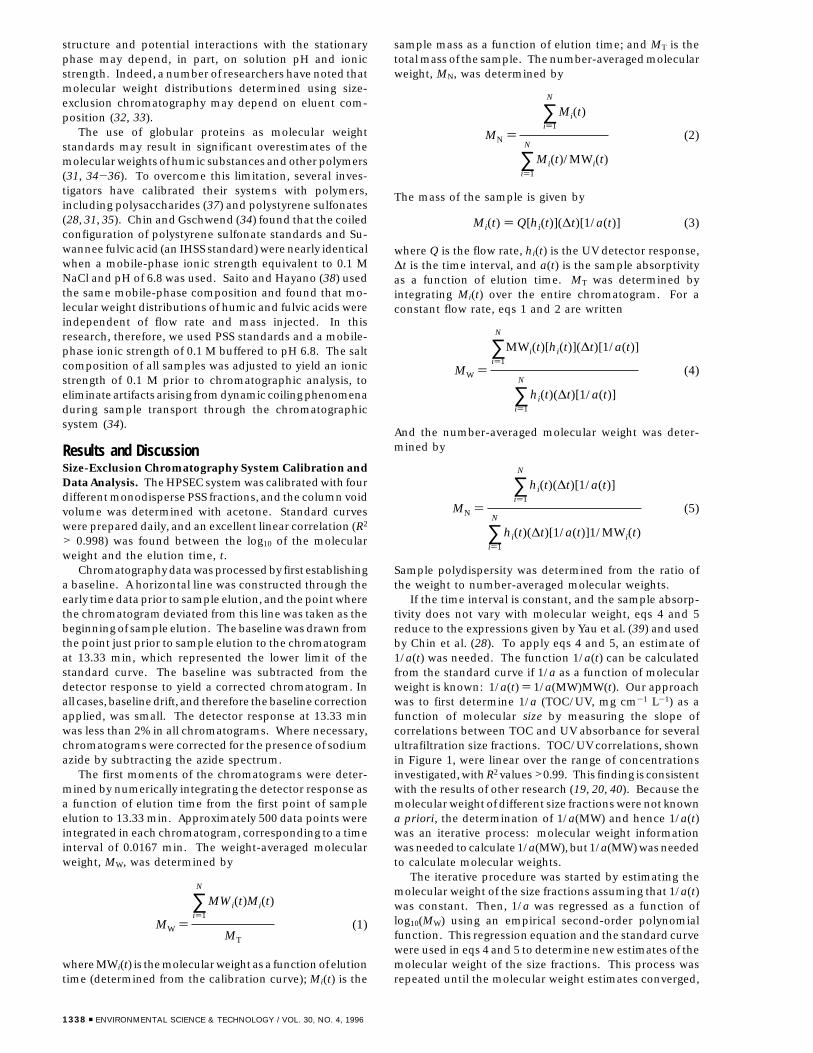
If the time interval is constant, and the sample absorp-tivity does not vary with molecular weight, eqs 4 and 5reduce to the expressions given by Yau et al. (39) and usedby Chin et al. (28). To apply eqs 4 and 5, an estimate of1/a(t) was needed. The function 1/a(t) can be calculatedfrom the standard curve if 1/a as a function of molecularweight is known: 1/a(t) ) 1/a(MW)MW(t). Our approachwas to first determine 1/a (TOC/UV, mg cm-1 L-1) as afunction of molecular size by measuring the slope ofcorrelations between TOC and UV absorbance for severalultrafiltration size fractions. TOC/UV correlations, shownin Figure 1, were linear over the range of concentrationsinvestigated, with R2 values >0.99. This finding is consistentwith the results of other research (19, 20, 40). Because themolecular weight of different size fractions were not knowna priori, the determination of 1/a(MW) and hence 1/a(t)was an iterative process: molecular weight informationwas needed to calculate 1/a(MW), but 1/a(MW) was neededto calculate molecular weights.
The iterative procedure was started by estimating themolecular weight of the size fractions assuming that 1/a(t)was constant. Then, 1/a was regressed as a function oflog10(MW) using an empirical second-order polynomialfunction. This regression equation and the standard curvewere used in eqs 4 and 5 to determine new estimates of themolecular weight of the size fractions. This process wasrepeated until the molecular weight estimates converged,
MW )
∑i)1
N
MWi(t)Mi(t)
MT
(1)
MN )
∑i)1
N
Mi(t)
∑i)1
N
Mi(t)/MWi(t)
(2)
Mi(t) ) Q[hi(t)](∆t)[1/a(t)] (3)
MW )
∑i)1
N
MWi(t)[hi(t)](∆t)[1/a(t)]
∑i)1
N
hi(t)(∆t)[1/a(t)]
(4)
MN )
∑i)1
N
hi(t)(∆t)[1/a(t)]
∑i)1
N
hi(t)(∆t)[1/a(t)]1/MWi(t)
(5)
1338 9 ENVIRONMENTAL SCIENCE & TECHNOLOGY / VOL. 30, NO. 4, 1996
which took only four iterations. The final relationshipbetween 1/a and log10(MW) is shown in Figure 2. The trendof decreasing absorptivity (increasing 1/a) with increasingmolecular weight observed in this study is consistent withthe findings of several researchers (41-45). However, thiscannot be considered a general trend because otherresearch has found either no trend or an increase inabsorptivity with an increase in molecular weight (28, 46).
The molecular weight determination error was estimatedby propagating the error of each step through eqs 4 and 5.This procedure requires estimates of the standard errors ofeach variable: (i) the standard error in log10(MWi) wasestimated as the standard error of the standard curveprediction; (ii) the standard error of the absorbanceresponse was assumed to be 0.0005 absorbance unit; and(iii) the standard error for the TOC/UV was taken as 0.33mg cm-1 L-1, the largest value exhibited by any fraction.In all cases, the standard error of MW was less than 10% ofthe calculated parameter value.
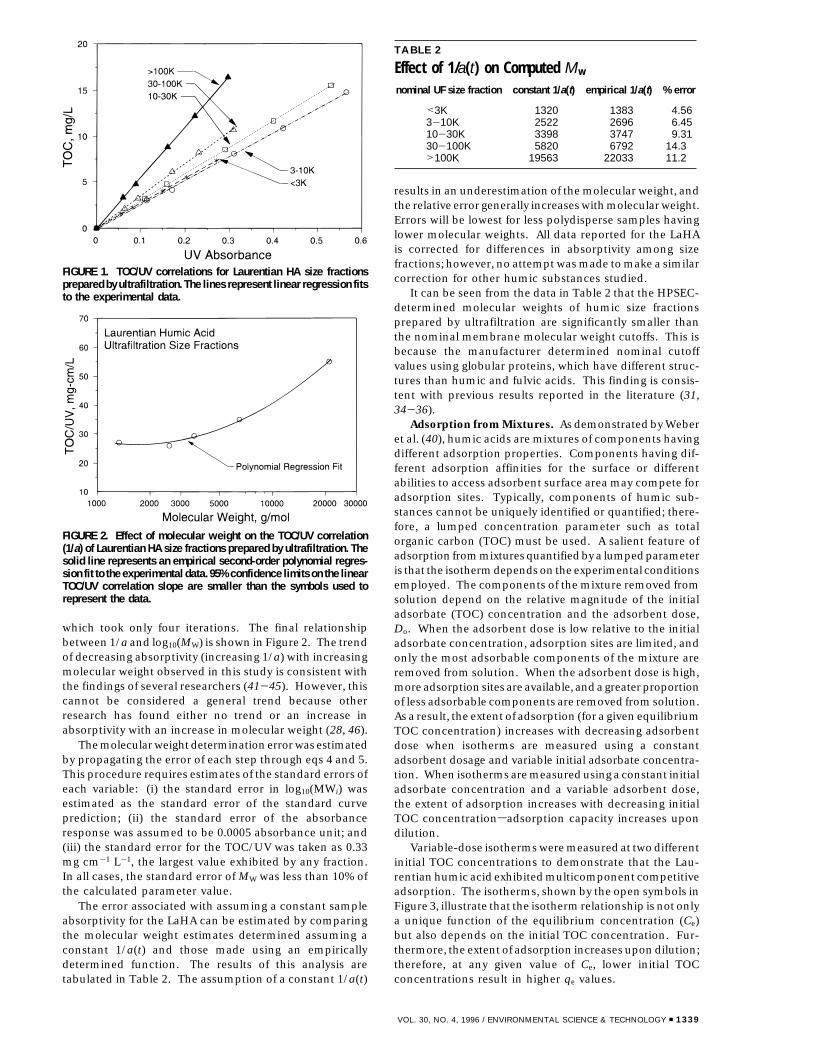
The error associated with assuming a constant sampleabsorptivity for the LaHA can be estimated by comparingthe molecular weight estimates determined assuming aconstant 1/a(t) and those made using an empiricallydetermined function. The results of this analysis aretabulated in Table 2. The assumption of a constant 1/a(t)
results in an underestimation of the molecular weight, andthe relative error generally increases with molecular weight.Errors will be lowest for less polydisperse samples havinglower molecular weights. All data reported for the LaHAis corrected for differences in absorptivity among sizefractions; however, no attempt was made to make a similarcorrection for other humic substances studied.
It can be seen from the data in Table 2 that the HPSEC-determined molecular weights of humic size fractionsprepared by ultrafiltration are significantly smaller thanthe nominal membrane molecular weight cutoffs. This isbecause the manufacturer determined nominal cutoffvalues using globular proteins, which have different struc-tures than humic and fulvic acids. This finding is consis-tent with previous results reported in the literature (31,34-36).
Adsorption from Mixtures. As demonstrated by Weberet al. (40), humic acids are mixtures of components havingdifferent adsorption properties. Components having dif-ferent adsorption affinities for the surface or differentabilities to access adsorbent surface area may compete foradsorption sites. Typically, components of humic sub-stances cannot be uniquely identified or quantified; there-fore, a lumped concentration parameter such as totalorganic carbon (TOC) must be used. A salient feature ofadsorption from mixtures quantified by a lumped parameteris that the isotherm depends on the experimental conditionsemployed. The components of the mixture removed fromsolution depend on the relative magnitude of the initialadsorbate (TOC) concentration and the adsorbent dose,Do. When the adsorbent dose is low relative to the initialadsorbate concentration, adsorption sites are limited, andonly the most adsorbable components of the mixture areremoved from solution. When the adsorbent dose is high,more adsorption sites are available, and a greater proportionof less adsorbable components are removed from solution.As a result, the extent of adsorption (for a given equilibriumTOC concentration) increases with decreasing adsorbentdose when isotherms are measured using a constantadsorbent dosage and variable initial adsorbate concentra-tion. When isotherms are measured using a constant initialadsorbate concentration and a variable adsorbent dose,the extent of adsorption increases with decreasing initialTOC concentrationsadsorption capacity increases upondilution.
Variable-dose isotherms were measured at two differentinitial TOC concentrations to demonstrate that the Lau-rentian humic acid exhibited multicomponent competitiveadsorption. The isotherms, shown by the open symbols inFigure 3, illustrate that the isotherm relationship is not onlya unique function of the equilibrium concentration (Ce)but also depends on the initial TOC concentration. Fur-thermore, the extent of adsorption increases upon dilution;therefore, at any given value of Ce, lower initial TOCconcentrations result in higher qe values.
FIGURE 1. TOC/UV correlations for Laurentian HA size fractionsprepared by ultrafiltration. The lines represent linear regression fitsto the experimental data.
FIGURE 2. Effect of molecular weight on the TOC/UV correlation(1/a) of Laurentian HA size fractions prepared by ultrafiltration. Thesolid line represents an empirical second-order polynomial regres-sion fit to the experimental data. 95% confidence limits on the linearTOC/UV correlation slope are smaller than the symbols used torepresent the data.
TABLE 2
Effect of 1/a(t) on Computed Mw
nominal UF size fraction constant 1/a(t) empirical 1/a(t) % error
<3K 1320 1383 4.563-10K 2522 2696 6.4510-30K 3398 3747 9.3130-100K 5820 6792 14.3>100K 19563 22033 11.2
VOL. 30, NO. 4, 1996 / ENVIRONMENTAL SCIENCE & TECHNOLOGY 9 1339
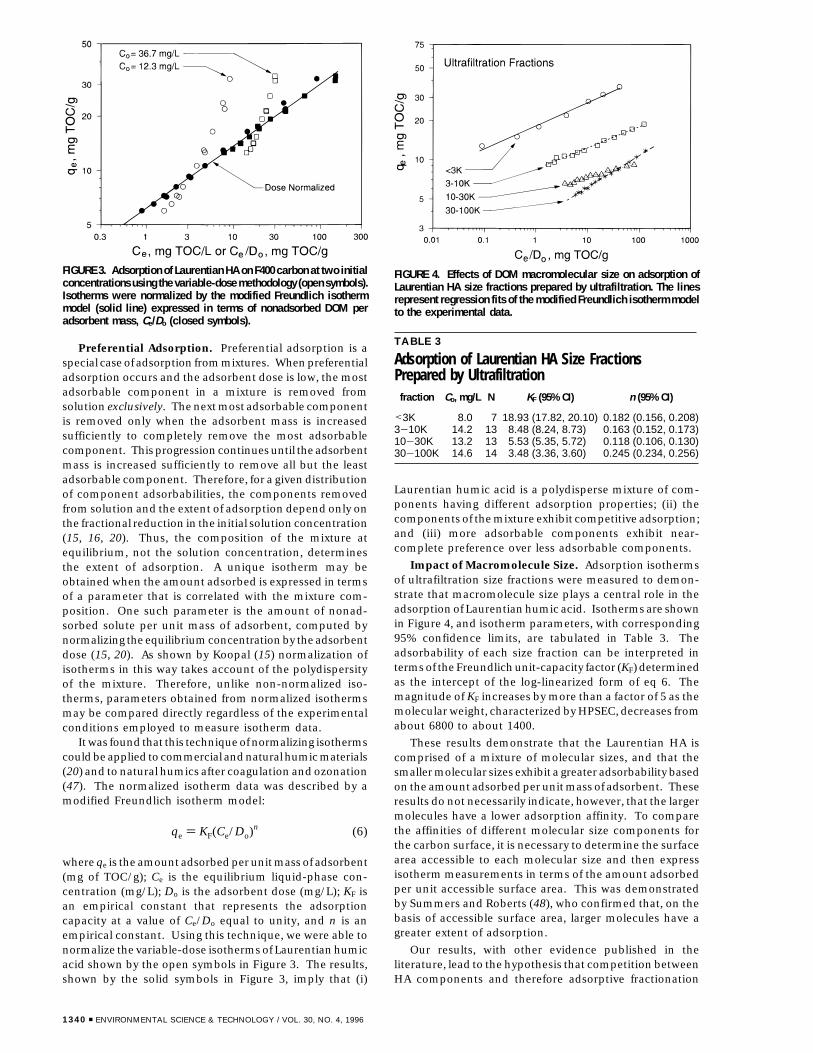
Preferential Adsorption. Preferential adsorption is aspecial case of adsorption from mixtures. When preferentialadsorption occurs and the adsorbent dose is low, the mostadsorbable component in a mixture is removed fromsolution exclusively. The next most adsorbable componentis removed only when the adsorbent mass is increasedsufficiently to completely remove the most adsorbablecomponent. This progression continues until the adsorbentmass is increased sufficiently to remove all but the leastadsorbable component. Therefore, for a given distributionof component adsorbabilities, the components removedfrom solution and the extent of adsorption depend only onthe fractional reduction in the initial solution concentration(15, 16, 20). Thus, the composition of the mixture atequilibrium, not the solution concentration, determinesthe extent of adsorption. A unique isotherm may beobtained when the amount adsorbed is expressed in termsof a parameter that is correlated with the mixture com-position. One such parameter is the amount of nonad-sorbed solute per unit mass of adsorbent, computed bynormalizing the equilibrium concentration by the adsorbentdose (15, 20). As shown by Koopal (15) normalization ofisotherms in this way takes account of the polydispersityof the mixture. Therefore, unlike non-normalized iso-therms, parameters obtained from normalized isothermsmay be compared directly regardless of the experimentalconditions employed to measure isotherm data.
It was found that this technique of normalizing isothermscould be applied to commercial and natural humic materials(20) and to natural humics after coagulation and ozonation(47). The normalized isotherm data was described by amodified Freundlich isotherm model:
where qe is the amount adsorbed per unit mass of adsorbent(mg of TOC/g); Ce is the equilibrium liquid-phase con-centration (mg/L); Do is the adsorbent dose (mg/L); KF isan empirical constant that represents the adsorptioncapacity at a value of Ce/Do equal to unity, and n is anempirical constant. Using this technique, we were able tonormalize the variable-dose isotherms of Laurentian humicacid shown by the open symbols in Figure 3. The results,shown by the solid symbols in Figure 3, imply that (i)
Laurentian humic acid is a polydisperse mixture of com-ponents having different adsorption properties; (ii) thecomponents of the mixture exhibit competitive adsorption;and (iii) more adsorbable components exhibit near-complete preference over less adsorbable components.
Impact of Macromolecule Size. Adsorption isothermsof ultrafiltration size fractions were measured to demon-strate that macromolecule size plays a central role in theadsorption of Laurentian humic acid. Isotherms are shownin Figure 4, and isotherm parameters, with corresponding95% confidence limits, are tabulated in Table 3. Theadsorbability of each size fraction can be interpreted interms of the Freundlich unit-capacity factor (KF) determinedas the intercept of the log-linearized form of eq 6. Themagnitude of KF increases by more than a factor of 5 as themolecular weight, characterized by HPSEC, decreases fromabout 6800 to about 1400.
These results demonstrate that the Laurentian HA iscomprised of a mixture of molecular sizes, and that thesmaller molecular sizes exhibit a greater adsorbability basedon the amount adsorbed per unit mass of adsorbent. Theseresults do not necessarily indicate, however, that the largermolecules have a lower adsorption affinity. To comparethe affinities of different molecular size components forthe carbon surface, it is necessary to determine the surfacearea accessible to each molecular size and then expressisotherm measurements in terms of the amount adsorbedper unit accessible surface area. This was demonstratedby Summers and Roberts (48), who confirmed that, on thebasis of accessible surface area, larger molecules have agreater extent of adsorption.
Our results, with other evidence published in theliterature, lead to the hypothesis that competition betweenHA components and therefore adsorptive fractionation
FIGURE 3. Adsorption of Laurentian HA on F400 carbon at two initialconcentrations using the variable-dose methodology (open symbols).Isotherms were normalized by the modified Freundlich isothermmodel (solid line) expressed in terms of nonadsorbed DOM peradsorbent mass, Ce/Do (closed symbols).
FIGURE 4. Effects of DOM macromolecular size on adsorption ofLaurentian HA size fractions prepared by ultrafiltration. The linesrepresent regression fits of the modified Freundlich isotherm modelto the experimental data.
TABLE 3
Adsorption of Laurentian HA Size FractionsPrepared by Ultrafiltration
fraction Co, mg/L N KF (95% CI) n (95% CI)
<3K 8.0 7 18.93 (17.82, 20.10) 0.182 (0.156, 0.208)3-10K 14.2 13 8.48 (8.24, 8.73) 0.163 (0.152, 0.173)10-30K 13.2 13 5.53 (5.35, 5.72) 0.118 (0.106, 0.130)30-100K 14.6 14 3.48 (3.36, 3.60) 0.245 (0.234, 0.256)
qe ) KF(Ce/Do)n (6)
1340 9 ENVIRONMENTAL SCIENCE & TECHNOLOGY / VOL. 30, NO. 4, 1996
occurs on the basis of molecular size. The use of HPSECto measure changes in size distributions of humic solutionsafter equilibration with activated carbon provides a directmeans of testing this hypothesis. As it applies to macro-molecular size, the concept of adsorptive fractionation canbe summarized as follows. We have shown that the HAsolution is comprised of a range of molecular sizes, andwhen fractionated, smaller molecules adsorb to a greaterextent. If smaller size fractions are preferentially adsorbedfrom the mixture, a shift in the MWD of organic matterremaining in solution toward larger molecular sizes shouldbe observed as the adsorbent dose is increased relative tothe initial humic concentration.
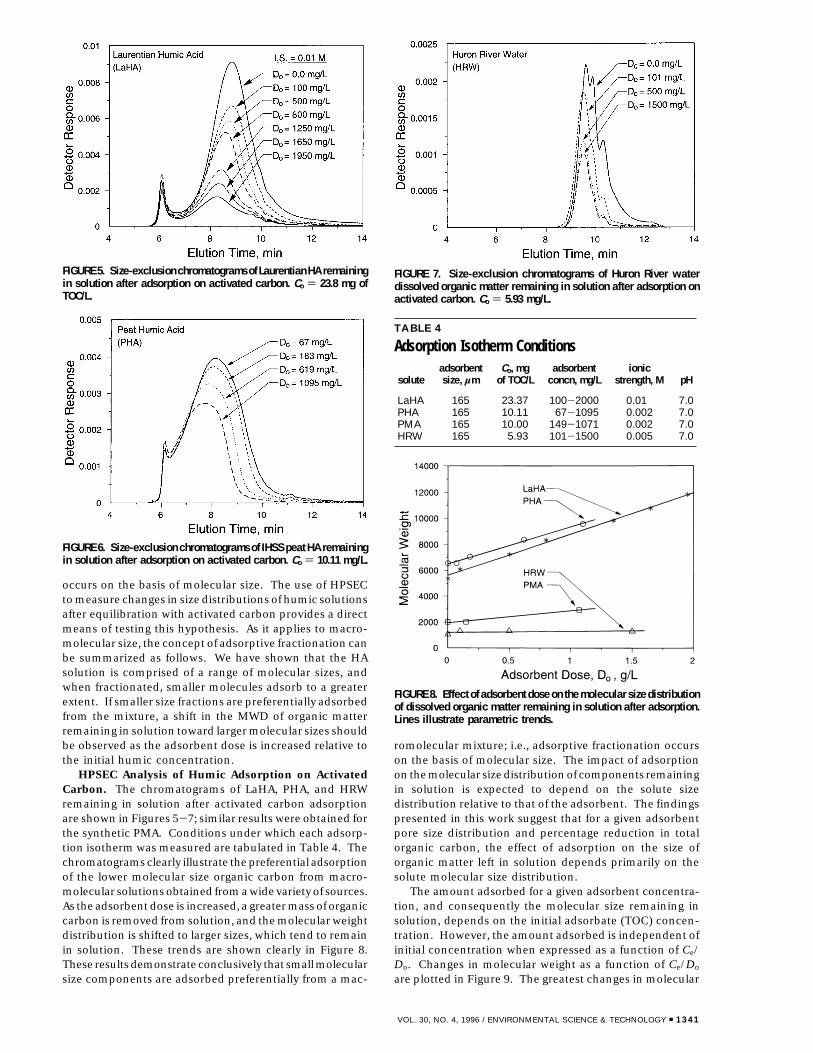
HPSEC Analysis of Humic Adsorption on ActivatedCarbon. The chromatograms of LaHA, PHA, and HRWremaining in solution after activated carbon adsorptionare shown in Figures 5-7; similar results were obtained forthe synthetic PMA. Conditions under which each adsorp-tion isotherm was measured are tabulated in Table 4. Thechromatograms clearly illustrate the preferential adsorptionof the lower molecular size organic carbon from macro-molecular solutions obtained from a wide variety of sources.As the adsorbent dose is increased, a greater mass of organiccarbon is removed from solution, and the molecular weightdistribution is shifted to larger sizes, which tend to remainin solution. These trends are shown clearly in Figure 8.These results demonstrate conclusively that small molecularsize components are adsorbed preferentially from a mac-
romolecular mixture; i.e., adsorptive fractionation occurson the basis of molecular size. The impact of adsorptionon the molecular size distribution of components remainingin solution is expected to depend on the solute sizedistribution relative to that of the adsorbent. The findingspresented in this work suggest that for a given adsorbentpore size distribution and percentage reduction in totalorganic carbon, the effect of adsorption on the size oforganic matter left in solution depends primarily on thesolute molecular size distribution.
The amount adsorbed for a given adsorbent concentra-tion, and consequently the molecular size remaining insolution, depends on the initial adsorbate (TOC) concen-tration. However, the amount adsorbed is independent ofinitial concentration when expressed as a function of Ce/Do. Changes in molecular weight as a function of Ce/Do
are plotted in Figure 9. The greatest changes in molecular
FIGURE 5. Size-exclusion chromatograms of Laurentian HA remainingin solution after adsorption on activated carbon. Co ) 23.8 mg ofTOC/L.
FIGURE 6. Size-exclusion chromatograms of IHSS peat HA remainingin solution after adsorption on activated carbon. Co ) 10.11 mg/L.
FIGURE 7. Size-exclusion chromatograms of Huron River waterdissolved organic matter remaining in solution after adsorption onactivated carbon. Co ) 5.93 mg/L.
TABLE 4
Adsorption Isotherm Conditions
soluteadsorbentsize, µm
Co, mgof TOC/L
adsorbentconcn, mg/L
ionicstrength, M pH
LaHA 165 23.37 100-2000 0.01 7.0PHA 165 10.11 67-1095 0.002 7.0PMA 165 10.00 149-1071 0.002 7.0HRW 165 5.93 101-1500 0.005 7.0
FIGURE 8. Effect of adsorbent dose on the molecular size distributionof dissolved organic matter remaining in solution after adsorption.Lines illustrate parametric trends.
VOL. 30, NO. 4, 1996 / ENVIRONMENTAL SCIENCE & TECHNOLOGY 9 1341
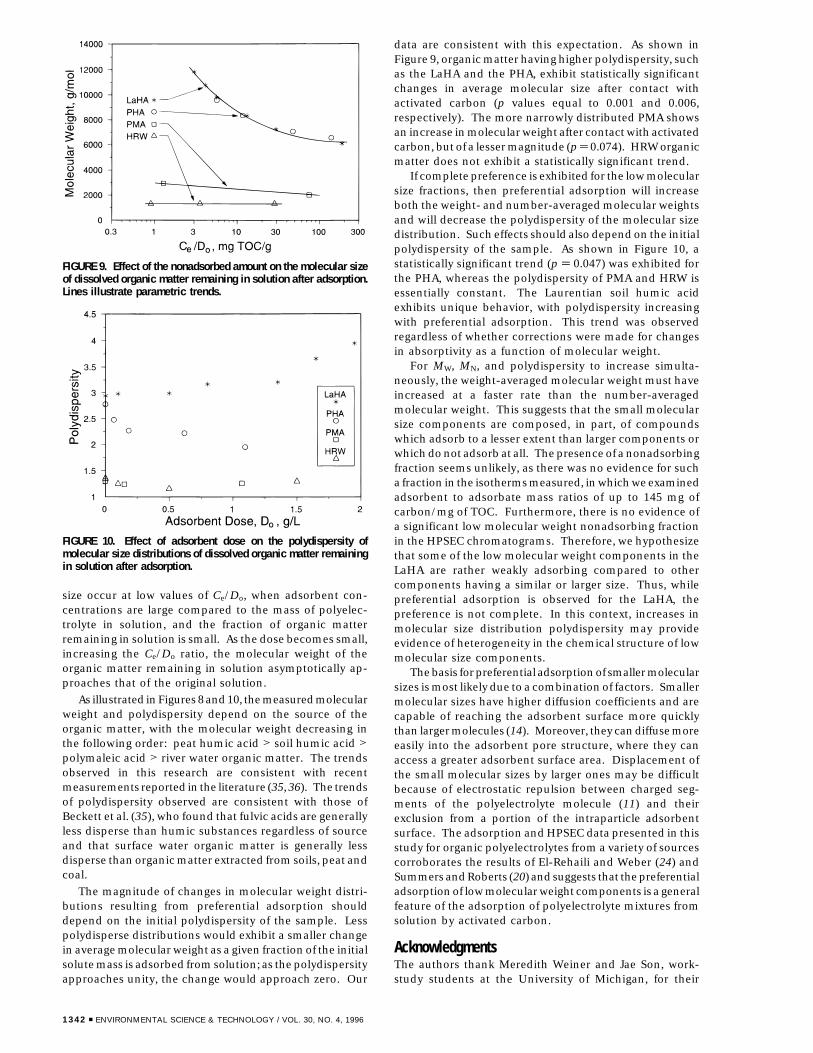
size occur at low values of Ce/Do, when adsorbent con-centrations are large compared to the mass of polyelec-trolyte in solution, and the fraction of organic matterremaining in solution is small. As the dose becomes small,increasing the Ce/Do ratio, the molecular weight of theorganic matter remaining in solution asymptotically ap-proaches that of the original solution.
As illustrated in Figures 8 and 10, the measured molecularweight and polydispersity depend on the source of theorganic matter, with the molecular weight decreasing inthe following order: peat humic acid > soil humic acid >polymaleic acid > river water organic matter. The trendsobserved in this research are consistent with recentmeasurements reported in the literature (35, 36). The trendsof polydispersity observed are consistent with those ofBeckett et al. (35), who found that fulvic acids are generallyless disperse than humic substances regardless of sourceand that surface water organic matter is generally lessdisperse than organic matter extracted from soils, peat andcoal.
The magnitude of changes in molecular weight distri-butions resulting from preferential adsorption shoulddepend on the initial polydispersity of the sample. Lesspolydisperse distributions would exhibit a smaller changein average molecular weight as a given fraction of the initialsolute mass is adsorbed from solution; as the polydispersityapproaches unity, the change would approach zero. Our
data are consistent with this expectation. As shown inFigure 9, organic matter having higher polydispersity, suchas the LaHA and the PHA, exhibit statistically significantchanges in average molecular size after contact withactivated carbon (p values equal to 0.001 and 0.006,respectively). The more narrowly distributed PMA showsan increase in molecular weight after contact with activatedcarbon, but of a lesser magnitude (p ) 0.074). HRW organicmatter does not exhibit a statistically significant trend.
If complete preference is exhibited for the low molecularsize fractions, then preferential adsorption will increaseboth the weight- and number-averaged molecular weightsand will decrease the polydispersity of the molecular sizedistribution. Such effects should also depend on the initialpolydispersity of the sample. As shown in Figure 10, astatistically significant trend (p ) 0.047) was exhibited forthe PHA, whereas the polydispersity of PMA and HRW isessentially constant. The Laurentian soil humic acidexhibits unique behavior, with polydispersity increasingwith preferential adsorption. This trend was observedregardless of whether corrections were made for changesin absorptivity as a function of molecular weight.
For MW, MN, and polydispersity to increase simulta-neously, the weight-averaged molecular weight must haveincreased at a faster rate than the number-averagedmolecular weight. This suggests that the small molecularsize components are composed, in part, of compoundswhich adsorb to a lesser extent than larger components orwhich do not adsorb at all. The presence of a nonadsorbingfraction seems unlikely, as there was no evidence for sucha fraction in the isotherms measured, in which we examinedadsorbent to adsorbate mass ratios of up to 145 mg ofcarbon/mg of TOC. Furthermore, there is no evidence ofa significant low molecular weight nonadsorbing fractionin the HPSEC chromatograms. Therefore, we hypothesizethat some of the low molecular weight components in theLaHA are rather weakly adsorbing compared to othercomponents having a similar or larger size. Thus, whilepreferential adsorption is observed for the LaHA, thepreference is not complete. In this context, increases inmolecular size distribution polydispersity may provideevidence of heterogeneity in the chemical structure of lowmolecular size components.
The basis for preferential adsorption of smaller molecularsizes is most likely due to a combination of factors. Smallermolecular sizes have higher diffusion coefficients and arecapable of reaching the adsorbent surface more quicklythan larger molecules (14). Moreover, they can diffuse moreeasily into the adsorbent pore structure, where they canaccess a greater adsorbent surface area. Displacement ofthe small molecular sizes by larger ones may be difficultbecause of electrostatic repulsion between charged seg-ments of the polyelectrolyte molecule (11) and theirexclusion from a portion of the intraparticle adsorbentsurface. The adsorption and HPSEC data presented in thisstudy for organic polyelectrolytes from a variety of sourcescorroborates the results of El-Rehaili and Weber (24) andSummers and Roberts (20) and suggests that the preferentialadsorption of low molecular weight components is a generalfeature of the adsorption of polyelectrolyte mixtures fromsolution by activated carbon.
AcknowledgmentsThe authors thank Meredith Weiner and Jae Son, work-study students at the University of Michigan, for their
FIGURE 9. Effect of the nonadsorbed amount on the molecular sizeof dissolved organic matter remaining in solution after adsorption.Lines illustrate parametric trends.
FIGURE 10. Effect of adsorbent dose on the polydispersity ofmolecular size distributions of dissolved organic matter remainingin solution after adsorption.
1342 9 ENVIRONMENTAL SCIENCE & TECHNOLOGY / VOL. 30, NO. 4, 1996
assistance in collecting laboratory data. This publicationis a result of work sponsored by the National Science Foun-dation (Grant CES-8702786) and by the National Instituteof Environmental Health Sciences (Grant 5P42E504911-02). Partial financial support for J.E.K., provided throughthe American Society of Civil Engineers Research FellowshipProgram, and for T.K., provided through the TurkishScientific Research Council (TUBITAK), is gratefully ac-knowledged.
Literature Cited(1) Thurman, E. M.; Wershaw, R. L.; Malcolm, R. L.; Pinckney, D.
J. Org. Geochem. 1982, 4, 27-35.(2) Morel, F. M. M. Principles of Aquatic Chemistry; John Wiley and
Sons: New York, 1983.(3) Buffle, J. Anal. Chim. Acta 1990, 232, 1-2.(4) Summers, R. S.; Haist, B.; Koehler, J.; Ritz, J.; Zimmer, G. J. Am.
Water Works Assoc. 1989, 81, 66-74.(5) Speth, T. F. J. Environ. Eng. 1991, 117, 66-79.(6) Carter, M. C.; Weber, W. J., Jr.; Olmstead, K. P. J. Am. Water
Works Assoc. 1992, 73, 81-91.(7) Pirbazari, M.; Weber, W. J., Jr. J. Environ. Eng. 1984, 110, 656-
669.(8) Smith, E. H.; Tseng, S.; Weber, W. J., Jr. Environ. Prog. 1987, 6,
18-25.(9) Speth, T. F.; Miltner, R. J. J. Am. Water Works Assoc. 1989, 81,
141-148.(10) Papenhuijzen, J.; Fleer, G. J.; Bijsterbosch, B. H. J. Colloid Interface
Sci. 1985, 104, 530.(11) Ramachandran, R.; Somasundaran, P. J. Colloid Interface Sci.
1987, 120, 184-188.(12) Bain, D. R.; Cafe, M. C.; Robb, I. D.; Williams, P. A. J. Colloid
Interface Sci. 1982, 88, 467-470.(13) Cosgrove, T.; Obey, T. M.; Vincent, B. J. Colloid Interface Sci.
1986, 111, 409-418.(14) Cornel, P. K.; Summers, R. S.; Roberts, P. V. J. Colloid Interface
Sci. 1986, 110, 149-164.(15) Koopal, L. J. Colloid Interface Sci. 1981, 83, 116-129.(16) Hlady, V.; Lyklema, J.; Fleer, G. J. J. Colloid Interface Sci. 1982,
87, 395-406.(17) McCreary, J. J.; Snoeyink, V. L. Water Res. 1980, 14, 151-160.(18) Lee, M. C.; Snoeyink, V. L.; Crittenden, J. C. J. Am. Water Works
Assoc. 1981, 73, 440-446.(19) Weber, W. J., Jr.; Voice, T. C.; Jodellah, A. M. J. Am. Water Works
Assoc. 1983, 75, 612-618(20) Summers, R. S.; Roberts, P. V. J. Colloid Interface Sci. 1988, 122,
367-381.(21) Ogino, K.; Yukihiro, K.; Minoura, T.; Agui, W.; Abe, M. J. Colloid
Interface Sci. 1988, 121, 161-169.(22) Adam, U. S.; Robb, I. D. J. Chem. Soc. Faraday Trans. 1 1983, 79,
2745.
(23) Fu, P. L. K.; Symons, J. M. J. Am. Water Works Assoc. 1990, 82,70-77.
(24) El-Rehaili, A. M.; Weber, W. J., Jr. Water Res. 1987, 21, 573-582.(25) Hine, P. T.; Bursill, D. B. Water Res. 1984, 11, 1461-1465.(26) Malcolm, R. L.; MacCarthy, P. Environ. Sci. Technol. 1986, 20,
904-911.(27) Gloor, R.; Leidner, K.; Wuhrmann, K.; Fleishmann, T. Water Res.
1981, 15, 457-462.(28) Chin, Y. P.; Aiken, G.; O’Loughlin, E. Environ. Sci. Technol. 1994,
28, 1853-1858.(29) Spiteller, M.; Schnitzer, M. J. Soil Sci. 1983, 34, 525-537.(30) Summers, R. S.; Cummings, L. Standardized Protocol for the
Evaluation of GAC; AWWA Research Foundation: Denver, CO,1992.
(31) Kilduff, J. E.; Weber, W. J., Jr. Environ. Sci. Technol. 1992, 26,569-577.
(32) Miles, C. J.; Brezonik, P. L. J. Chromatogr. 1983, 259, 499-503.(33) Knuutinen, J.; Virkki, L.; Mannila, P.; Mikkelson, P.; Paasivirta,
J.; Herve, S. Water Res. 1983, 22, 985-990.(34) Chin, Y. P.; Gschwend, P. M. Geochim. Cosmochim. Acta 1991,
55, 1309-1317.(35) Beckett, R.; Jue, Z.; Giddings, C. Environ. Sci. Technol. 1987, 21,
289-295.(36) Reid, P. M.; Wilkinson, A. E.; Tipping, E.; Jones, M. N. Geochim.
Cosmochim. Acta 1990, 54, 131-138.(37) Rausa, R.; Mazzolari, E.; Calemma, V. J. Chromatogr. 1991, 541,
419-429.(38) Saito, Y.; Hayano, S. J. Chromatogr. 1979, 177, 390-392.(39) Yau, W. W.; Kirkland, J. J.; Bly, D. D. Modern Size Exclusion
Chromatography; Wiley Interscience: New York, 1979.(40) Weber, W. J., Jr.; Pirbizari, M.; Long, J. B.; Barton, D. A. Act.
Carbon Adsorpt. Org. Aqueous Phase 1980, 1, 317-336.(41) Ladd, J. N. Soil Sci. 1969, 107, 303-306.(42) Butler, J. H. A.; Ladd, J. N. Aust. J. Soil Res. 1969, 7, 229-239.(43) Swift, R. S.; Thornton, B. K.; Posner, A. M. Soil Sci. 1970, 110,
93-99.(44) Stewart, A. J.; Wetzel, R. G. Limnol. Oceanogr. 1981, 26, 590-
597.(45) Swift, R. S.; Leonard, R. L.; Newman, R. H.; Theng, B. K. G. Sci.
Total Environ. 1992, 117/118, 53-61.(46) Buffle, J.; Deladoey, P.; Haerdi, W. Anal. Chim. Acta 1978, 101,
339-357.(47) Harrington, G. W.; DiGiano, F. A. J. Am. Water Works Assoc.
1989, 81, 93-101.(48) Summers, R. S.; Roberts, P. V. J. Colloid Interface Sci. 1988, 122,
382-397.
Received for review July 20, 1995. Revised manuscript re-ceived November 21, 1995. Accepted November 22, 1995.X
ES950547R
X Abstract published in Advance ACS Abstracts, February 15, 1996.
VOL. 30, NO. 4, 1996 / ENVIRONMENTAL SCIENCE & TECHNOLOGY 9 1343