adsorption of methyl tertiary butyl ether using granular ... · 1 project number che-rwt-0909...
TRANSCRIPT
1
Project Number CHE-RWT-0909
Adsorption of Methyl Tertiary Butyl Ether Using Granular ZSM-5
A Major Qualifying Project Report
Submitted to the Faculty and Staff of
WORCESTER POLYTECHNIC INSTITUTE
for requirements to achieve the
Degree of Bachelor of Science
in Chemical Engineering & Civil Engineering
by:
_____________________________
Alisha Begin
_____________________________
Stephen Shin
Date: April 30, 2009
Approved:
______________________
Professor Thompson of the
Chemical Engineering Department
______________________
Professor Bergendahl of the
Civil Engineering Department
2
Abstract
The goal of this project was to investigate the ability of polycrystalline zeolite ZSM-5
aggregates to remove MTBE from water. Powdered ZSM-5 has shown to adsorb MTBE, but is
impractical in flow systems due to very high pressure drops. This report will investigate the
adsorption of MTBE using granular ZSM-5. The adsorption of MTBE was measured through
the use of batch experiments to create an adsorption isotherm, which was used to assist in the
design of a full-scale treatment system.
3
Acknowledgements
This Major Qualifying Project could not have been completed without the continual support and
guidance from professors Robert Thompson and John Bergendahl. Special thanks also goes out
to professor Jeanine Plummer, Engin Ayturk, Boquan Li, Pranoti Navare, professor John
McDonald, Laila Abu-Lail, Professor Paul Mathisen, and Don Pellegrino.
4
Table of Contents Abstract ........................................................................................................................................... 2
Acknowledgements ......................................................................................................................... 3
Table of Contents ............................................................................................................................ 4
List of Figures ................................................................................................................................. 6
List of Tables .................................................................................................................................. 7
List of Equations ............................................................................................................................. 7
Background ..................................................................................................................................... 8
About MTBE ............................................................................................................................... 8
Cases of Contamination .............................................................................................................. 9
Current Methods of Removal .................................................................................................... 10
About Zeolites ........................................................................................................................... 11
Related Works ........................................................................................................................... 13
Project Goals ............................................................................................................................. 17
Methodology ................................................................................................................................. 18
Analysis of ZSM-5 Sample ....................................................................................................... 18
Powder X-Ray Defraction (XRD) ........................................................................................ 18
Scanning Electron Microscope (SEM) ................................................................................. 19
Thermal Gravimetric Analysis (TGA) .................................................................................. 19
COD Calibration Curve ............................................................................................................. 20
Time Trials ................................................................................................................................ 21
Adsorption Isotherm ............................................................................................................. 22
Results & Discussion .................................................................................................................... 23
Analysis of Samples .................................................................................................................. 23
Powder X-Ray Defraction..................................................................................................... 23
Scanning Electron Microscope (SEM) ................................................................................. 25
Thermal Gravimetric Analysis (TGA) .................................................................................. 30
Experimental Results ................................................................................................................. 32
COD Calibration Curve ........................................................................................................ 32
Time Trial ............................................................................................................................. 33
Adsorption Isotherm ............................................................................................................. 34
5
Design of Treatment System ................................................................................................. 36
Design Recommendations and Conclusions ............................................................................. 41
References ..................................................................................................................................... 42
Appendix ....................................................................................................................................... 44
Appendix 1: Figures .................................................................................................................. 44
Appendix 2: Tables ................................................................................................................... 45
Appendix 3: Calculations for Solutions .................................................................................... 48
Appendix 4: Chemical Oxygen Demand Procedure ................................................................. 50
Appendix 5: Reference Images ................................................................................................. 51
6
List of Figures
Figure 1: Structure of Zeolite A Unit Cell .................................................................................... 12
Figure 2: ZSM-5 Silicalite ............................................................................................................ 13
Figure 3: Time Trial Data ............................................................................................................. 16
Figure 4: XRD Results of Old Sample ......................................................................................... 23
Figure 5: XRD Patterns for Calcined Zeolite ............................................................................... 24
Figure 6: SEM – Full View of Old Sample .................................................................................. 25
Figure 7: SEM – Surfaces A and C ............................................................................................... 26
Figure 8: Surface B of Old Sample ............................................................................................... 26
Figure 9: Surface D of Old Sample................................................ Error! Bookmark not defined.
Figure 10: SEM – Surface E of Old Sample ................................................................................. 27
Figure 11: Full View of New Sample ........................................................................................... 28
Figure 12: SEM – Surface A of New Sample ............................................................................... 28
Figure 13: SEM –Surface B of New Sample ................................................................................ 29
Figure 14: SEM – Surface C of New Sample ............................................................................... 29
Figure 15: TGA Results of Old ZSM-5 Pellet .............................................................................. 30
Figure 16: COD Calibration Curve with Combined Data Points ................................................. 32
Figure 17: Time Trials for ZSM-5 Samples ................................................................................. 33
Figure 18: Adsorption Isotherm of MTBE After 72 hours ........................................................... 34
Figure 19: Ayşe Erdem-Senatalar Adsorption Isotherm ............................................................... 35
Figure 20: Design Schematic ........................................................................................................ 37
Figure 21: Michelle Slack's COD calibration curve ..................................................................... 44
Figure 22: Theoretical XRD for Calcined ZSM-5 ........................................................................ 51
7
List of Tables
Table 1: Zeolite Properties and Sources ....................................................................................... 15
Table 2: Cost Analysis of System Design..................................................................................... 39
Table 3: COD All Calibration Curve Data ................................................................................... 45
Table 4: Weights of Pellets for Time Trial ................................................................................... 45
Table 5: Raw Data from Time Trial Calculations ........................................................................ 46
Table 6: Summary of Calculations for Amounts Used in Solutions for the Adsorption Isotherm
Samples ......................................................................................................................................... 47
Table 7: Raw Data from Adsorption Isotherm Calculations ........................................................ 47
List of Equations
Equation 1: Amount of MTBE adsorbed ...................................................................................... 22
Equation 2: Equation from adsorption isotherm ........................................................................... 37
Equation 3: Equation for Diameter ............................................................................................... 38
Equation 4: Bed Life Design Equation ......................................................................................... 38
Equation 5: Head Loss to Pump.................................................................................................... 39
Equation 6: Power for Pump ......................................................................................................... 40
8
Background
About MTBE
Fuel oxygenates are chemicals containing oxygen that are added to fuels, specifically
gasoline, to allow them to burn more efficiently. Adding oxygen raises the octane level of
gasoline and helps it burn more completely, which reduces harmful atmospheric pollution
associated with automobile emissions (U.S. Geological Survey). MTBE (Methyl tertiary butyl
ether) has been used in gasoline in the United States at low levels since the late 1970’s to replace
lead as an octane enhancer. In 1990, Congress passed the Clean Air Act Amendment, which
mandated the use of oxygenated gasoline. In order to fulfill these oxygenate requirements,
MTBE was used in higher concentrations in some gasoline (Environmental Protection Agency,
Methyl Tertiary Butyl Ether).
Federal and state regulators have acknowledged that addition of MTBE to gasoline has
provided many air quality benefits. EPA has stated that since the reformulated gasoline (RFG)
program in 1995, it has resulted in annual reductions of 105,000 tons of smog-producing
emissions and at least 24,000 tons of toxic air pollutants such as benzene. According to the EPA,
this is equivalent to removing 16 million cars from the road (Meissner & Voll). Despite the
benefits of MTBE, there are many tradeoffs that are involved.
MTBE is a volatile, colorless, and flammable liquid that is highly soluble in water, which
makes it very difficult to clean up. The high solubility and persistence of MTBE causes it to
travel very quickly when released into an aquifer or soil. MTBE was produced in very large
quantities, but due to widespread spillage of MTBE-containing gasoline in underground storage
tanks, regulatory action was passed under the Toxic Substances Control Act on March 20, 2000
9
to significantly reduce or eliminate the use of MTBE. Contamination of drinking water aquifers
became a very serious concern; the first major incidence was in the city of Santa Monica
(Environmental Protection Agency, Methyl Tertiary Butyl Ether).
Cases of Contamination
In 1996, two drinking water aquifers in the city of Santa Monica, Charnock and Arcadia,
were contaminated with MTBE at levels as high as 610 ppb and 86 ppb respectively. These two
aquifers represented 50 percent of the city’s drinking water. In response, the city shut down the
two aquifers and began purchasing replacement water. This incident was the first major water
contamination that brought public attention to the issue of MTBE (Environmental Protection
Agency, Methyl Tertiary Butyl Ether). Since 1999, MTBE has been phased out as a gasoline
additive, because of groundwater contamination (California Enivronmental Protection Agency).
Recent state laws have been passed banning MTBE in certain states. California and New York
combined to account for 40% of MTBE usage in the United States, and both states banned it in
January, 2004. In September of 2005, twenty-five states signed legislation to ban MTBE
(Energy Information Administration).
One of the largest cases of MTBE contamination in the United States is in the town of
Pascoag, Rhode Island. The Pascoag Water District serves about 5,000 people, and is pumped
from one 16” well, drawing 350 GPM from bedrock and aquifers (Allen & Boving, 2006).
Following the detection of the MTBE contamination in 2001, residents were notified not to drink
the town water and to reduce skin contact. Despite the warning, residents complained about
severe headaches, vomiting, wheezing, and blisters. Since then, the drinking water supply in
Pascoag has been shut down and the residents have been without their own drinking water
10
source. Currently, Pascoag is receiving water from a local district at a cost of more than
$1,000,000 a year. The town cannot sustain this financial burden, and there has been strong
political pressure building to reactivate the Pascoag well (Allen & Boving, 2006).
Current Methods of Removal
The main risk of MTBE is that it gives water an unpleasant taste at even low
concentrations, which can easily turn large quantities of groundwater unsuitable for drinking
(Environmental Protection Agency, Methyl Tertiary Butyl Ether). The EPA concluded that at
low levels, there is not enough adequate data to quantify health risks. However, data supports
MTBE to be a potential carcinogen at high levels of exposure (Environmental Protection
Agency, Methyl Tertiary Butyl Ether).
The estimated cost of removal of groundwater and soil contamination at the national level
ranges from $1-3 billion (SIGMA). There are several current methods of treating MTBE from
water; however they are all very expensive.
1. Air Stripping is a process in which contaminated water is passed through a column
filled with packing material while upward-flowing air removes the chemicals in the
water. Generally, the resulting vapors should not be released directly into the air and
should be treated appropriately. MTBE does not easily separate from water into the
vapor phase, which often necessitates high air-to-water ratios (Environmental Protection
Agency, Methyl Tertiary Butyl Ether). .
2. Advanced oxidation uses combinations of ultraviolet light, chemical oxidants, and
catalysts to transform the contaminants. Oxidation methods have been proven to oxidize
11
wide ranges of organic chemicals, including MTBE (Environmental Protection Agency,
Methyl Tertiary Butyl Ether).
3. Granular activated carbon (GAC) pumps contaminated water through a bed of
activated carbon to remove organic compounds. Since MTBE does not adsorb well on
organics such as carbon, large volumes of the contaminated water must be passed
repeatedly through several GAC columns in order for the MTBE to be effectively
removed (Environmental Protection Agency, Methyl Tertiary Butyl Ether).
There are processes and methods that are being tested to treat MTBE and other
contaminants from water. One of the methods currently being tested is using zeolites to treat
MTBE from contaminated water using adsorption into nanoporous adsorbents.
About Zeolites
Zeolites, or molecular sieves, are micro-porous crystalline structures which mostly
contain silicon and aluminum (British Zeolite Association, What Are Zeolites?). Currently, there
are around 102 known zeolites, 45 of which are naturally occurring. The natural zeolites are
rarely used for commercial applications, mainly because there are usually contaminant minerals
within them. Natural zeolites were made when volcanic rocks and ash layers went through a
low-grade metamorphism and some others were created by changes in heat and pressure
(Mineral Gallery, The Zeolite Group).
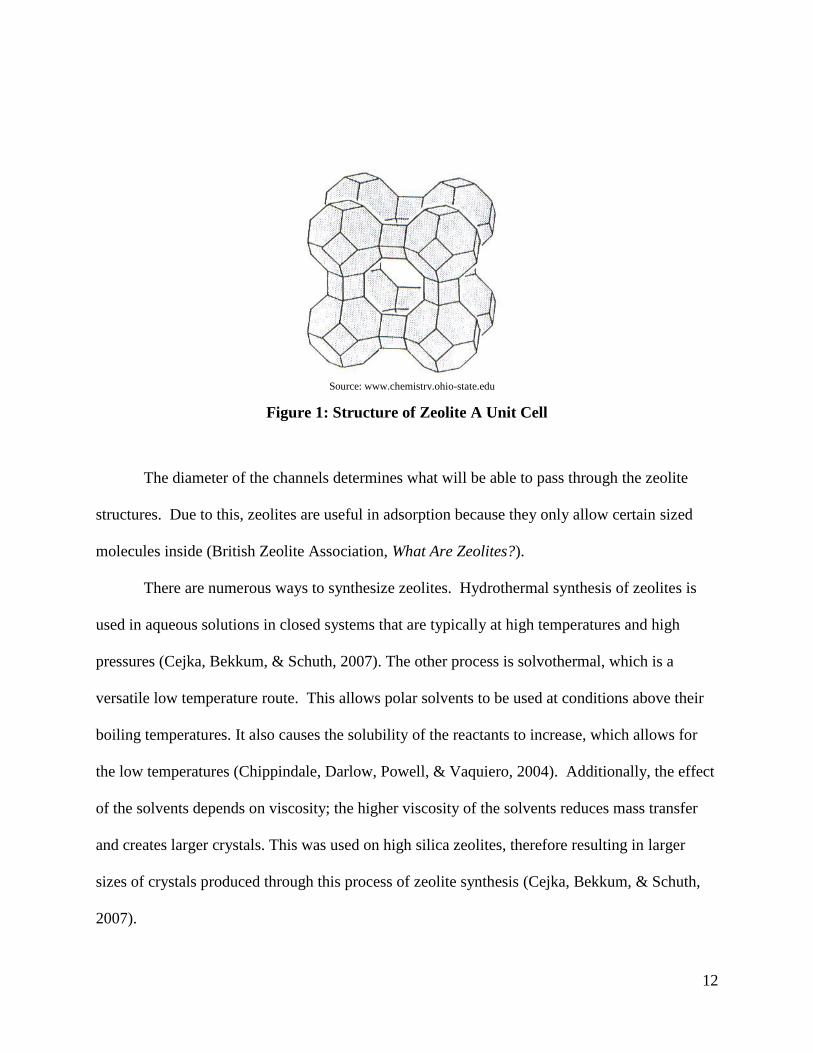
The framework of zeolites at the molecular level consists of either a silicon or aluminum
at the center of four oxygen atoms in tetrahedral coordination. These small structures then attach
at the corners and can make many different shapes with different channels within them. Figure 1
shows an example of the structure of a zeolite.
12
Figure 1: Structure of Zeolite A Unit Cell
The diameter of the channels determines what will be able to pass through the zeolite
structures. Due to this, zeolites are useful in adsorption because they only allow certain sized
molecules inside (British Zeolite Association, What Are Zeolites?).
There are numerous ways to synthesize zeolites. Hydrothermal synthesis of zeolites is
used in aqueous solutions in closed systems that are typically at high temperatures and high
pressures (Cejka, Bekkum, & Schuth, 2007). The other process is solvothermal, which is a
versatile low temperature route. This allows polar solvents to be used at conditions above their
boiling temperatures. It also causes the solubility of the reactants to increase, which allows for
the low temperatures (Chippindale, Darlow, Powell, & Vaquiero, 2004). Additionally, the effect
of the solvents depends on viscosity; the higher viscosity of the solvents reduces mass transfer
and creates larger crystals. This was used on high silica zeolites, therefore resulting in larger
sizes of crystals produced through this process of zeolite synthesis (Cejka, Bekkum, & Schuth,
2007).
Source: www.chemistry.ohio-state.edu
13
Related Works
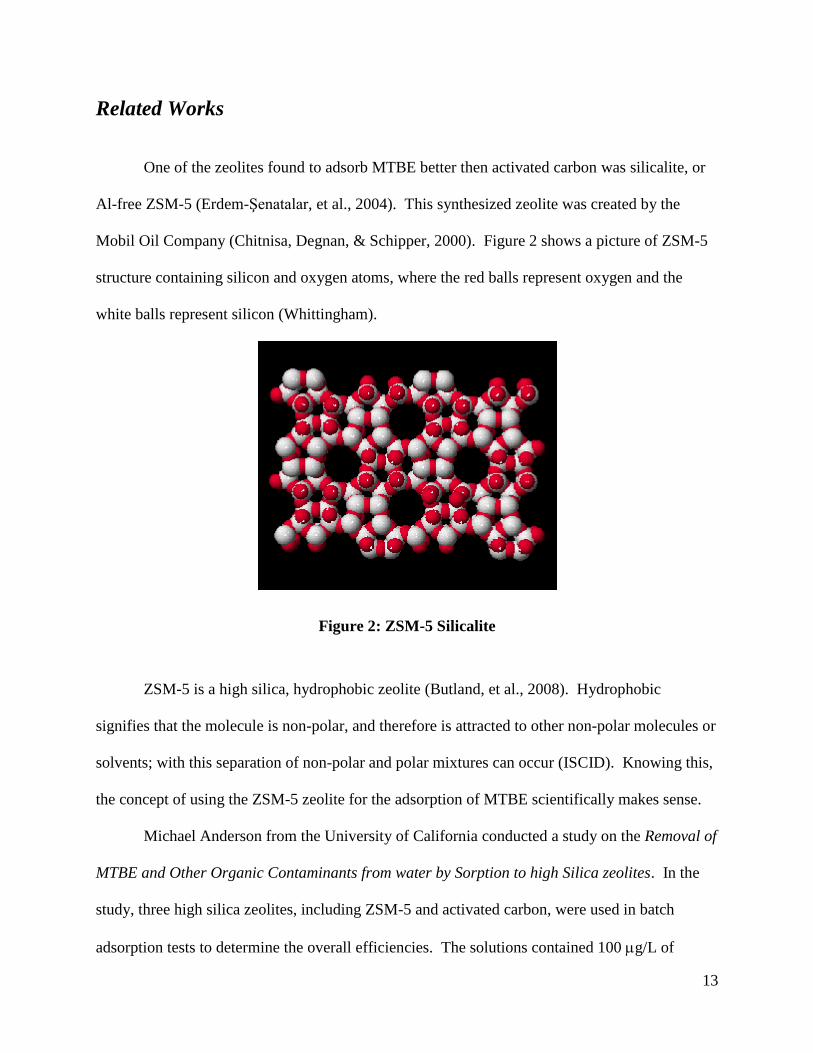
One of the zeolites found to adsorb MTBE better then activated carbon was silicalite, or
Al-free ZSM-5 (Erdem-Şenatalar, et al., 2004). This synthesized zeolite was created by the
Mobil Oil Company (Chitnisa, Degnan, & Schipper, 2000). Figure 2 shows a picture of ZSM-5
structure containing silicon and oxygen atoms, where the red balls represent oxygen and the
white balls represent silicon (Whittingham).
Figure 2: ZSM-5 Silicalite
ZSM-5 is a high silica, hydrophobic zeolite (Butland, et al., 2008). Hydrophobic
signifies that the molecule is non-polar, and therefore is attracted to other non-polar molecules or
solvents; with this separation of non-polar and polar mixtures can occur (ISCID). Knowing this,
the concept of using the ZSM-5 zeolite for the adsorption of MTBE scientifically makes sense.
Michael Anderson from the University of California conducted a study on the Removal of
MTBE and Other Organic Contaminants from water by Sorption to high Silica zeolites. In the
study, three high silica zeolites, including ZSM-5 and activated carbon, were used in batch
adsorption tests to determine the overall efficiencies. The solutions contained 100 g/L of
14
MTBE and 5 mg of zeolite or activated carbon. The results ultimately showed that the high
silica zeolites performed better then the activated carbon, which are commonly used for
adsorption of contaminants. Additionally, ZSM-5 was not the most efficient media in this study,
but mordenite was able to reduce the concentration of MTBE from 100 to 4 g/L. The study also
concluded that the pore structure of ZSM-5 was too small for the MTBE to fit in neatly
(Anderson, 2000). Arjan Giaya authored a Ph.D dissertation at Worcester Polytechnic Institute
and repeated the previous experiments at higher concentrations of MTBE. The data obtained in
these experiments contradicted the results of Anderson’s study.
Ayşe Erdem-Şenatalar, John A. Bergendahl, Arjan Giaya, and Robert W. Thompson
conducted experiments of Adsorption of Methyl Tertiary Butyl Ether on Hydrophobic Molecular
Sieves. This study used the same materials that Anderson used in the previous with the activated
carbon, ZSM-5, and dealuminated zeolite Y (DAY). The results of these experiments were that
at low concentrations the ZSM-5 adsorbed more MTBE than the other media. In high
concentrations the DAY was the preferred zeolite, but it gave poor results at low concentrations
while ZSM-5 still gave appealing values at high concentrations. The results of these data
compared to the results by Anderson in the above work were very different. One of the large
differences was a waiting period of 24 hours to reach equilibrium while the Giaya experiment
only used 8 hrs. The Giaya experiment showed that DAY was preferred with higher
concentrations and that at low concentrations it was very inefficient. The ZSM-5 was nearly
equally efficient as activated carbon in adsorbing TCE, but was slightly more effective at
adsorbing MTBE (Erdem-Şenatalar, et al., 2004). Figure 22 in Appendix 5 shows the graph of
aqueous MTBE adsorption isotherm used in this study. This study showed that ZSM-5 did have
potential and showed values that would be desirable in the MTBE adsorption process.
15
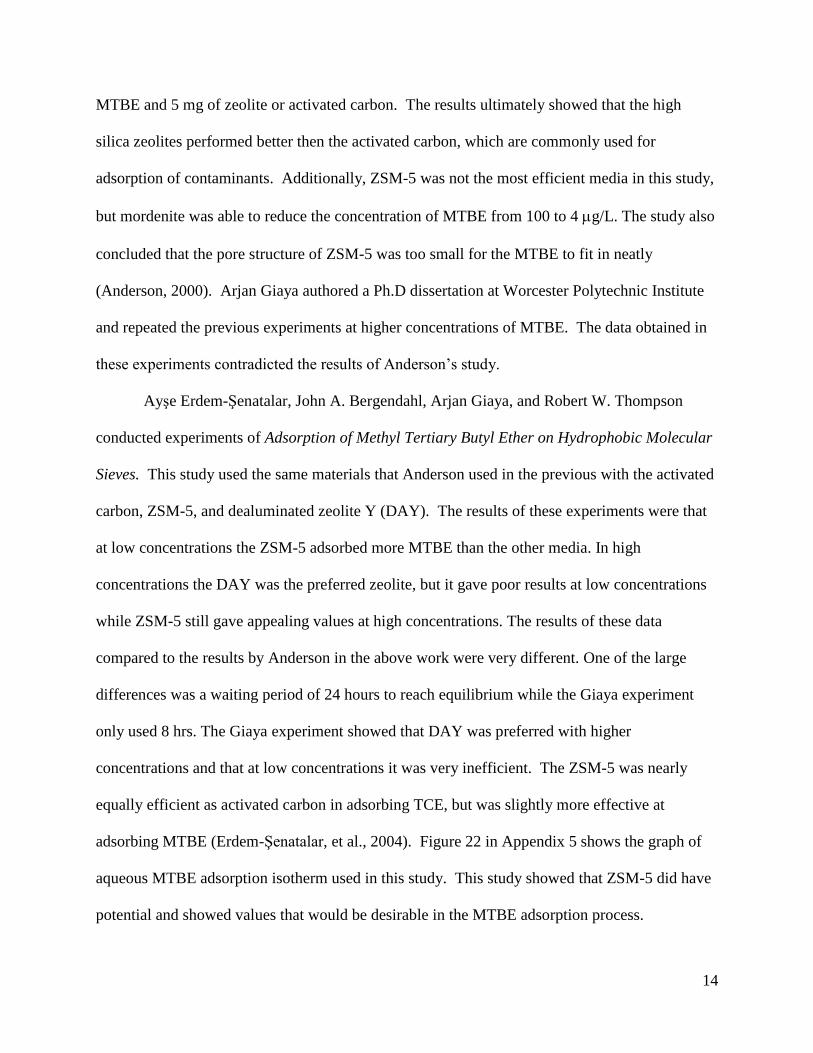
In a M.S thesis, Tricia Butland used batch and fixed bed experiments to determine the
best zeolite for Tertiary Butyl Alcohol (TBA) adsorption.
Table 1: Zeolite Properties and Sources
Powdered Sample SiO2
Al2O3
Company
Name Lot #
Cation
Form
Zeolite Beta 150 Zeolyst 1822-75 H+
Zeolite Mordenite 90 Zeolyst 1822-60-30 H+
Zeolite-Y
80 Zeolyst 78001N00257 H+
ZSM-5/Silicalite >1000 Grace
Davison 5-8888-0702 ---
Granular Sample SiO2
Al2O3
Company
Name Lot #
Micropore
Area
(m2/g)
Zeolite Beta 35 Engelhard L6598-48-1 266
Zeolite Mordenite 50 Engelhard 05001C-
BWC2-06 304.3
Molsiv HISIV 1000
(High silica faujasite) < 6.5 UOP 2006003165 247.1
Molsiv HISIV 3000
(High silica faujasite) < 10 UOP 2002001440 230.5
Zeolite-Y --- Engelhard 20275-45-1 73.4
Zeolite-Y --- Engelhard 20275-45-2 58.7
ZSM-5 280 Zeolyst CBV28014 141.8
Table 1 shows the seven granular zeolite forms that were tested, and HiSiv 3000 and
ZSM-5 were found to be the most efficient. For the time trials, the samples were prepared to
create 1 mg/L samples. Two sets of ZSM-5 and HiSiv 3000 zeolites (one lower mass of zeolite,
one higher mass) were baked in an oven at 350 oC for 12 hours (in order to clean out the pores).
The sample vials were then placed in a rotisserie for 48 hours at 15 rpm. At designated times –
0, 6, 12, 24, and 48 hours – the vials were removed and centrifuged for separation at 3000 rpm
16
for 10 minutes. In order to test the equilibrium capacities, the samples were again prepared with
99% TBA with water in concentrations of 0.1, 1, and 10 mg/L. These would be used to
determine the best TBA adsorbents. For isotherm samples, they were again prepared in 99%
TBA and water solutions in concentrations between 0-150 mg/L. The zeolites were baked in an
oven at 300o C for 12 hours. A certain mass would be chosen for each zeolite and recorded, then
added to each vial. The vials were then placed on a shaker table for 48 hours at 5 rpm and after
48 hours, were removed and placed in the centrifuge for separation (Butland, et al., 2008).
For fixed bed experiments, the zeolites were added into a column attached to a pump to
control the feed flow rate. The feed would flow through the column, through a flow adapter,
through the packed bed, and finally the liquid would leave the column into a waste container.
Samples were taken at the exit of the column at specific time intervals (Butland, et al., 2008).
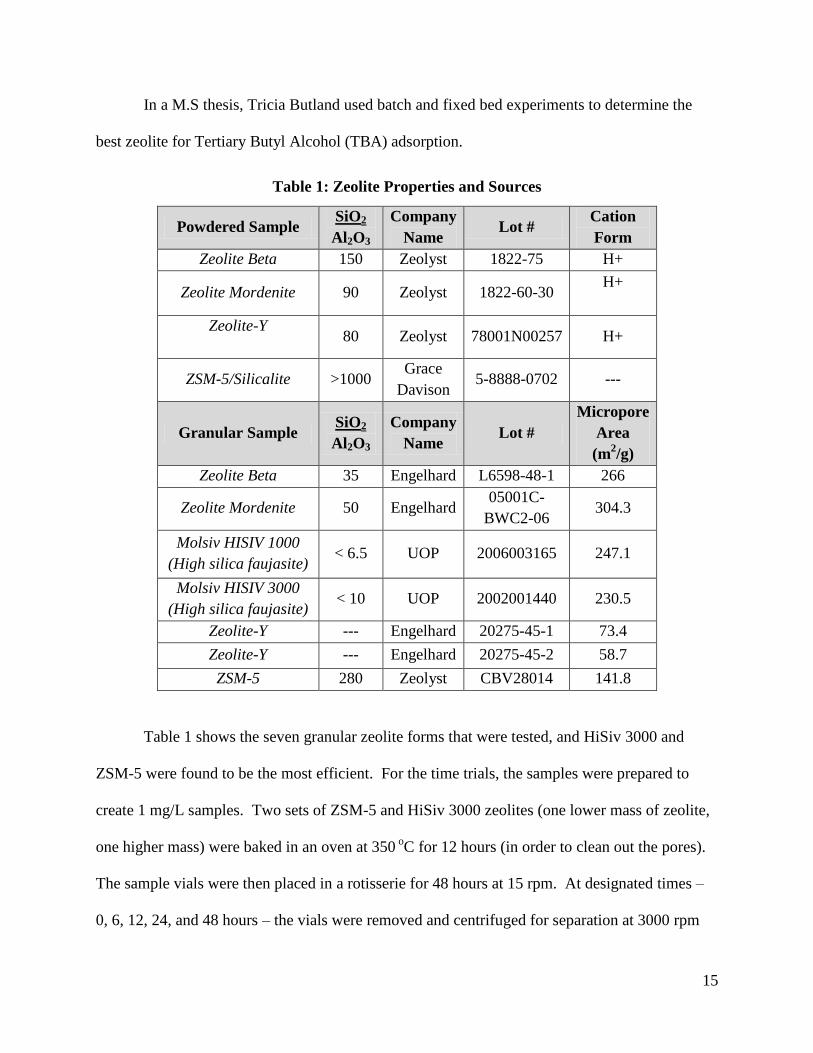
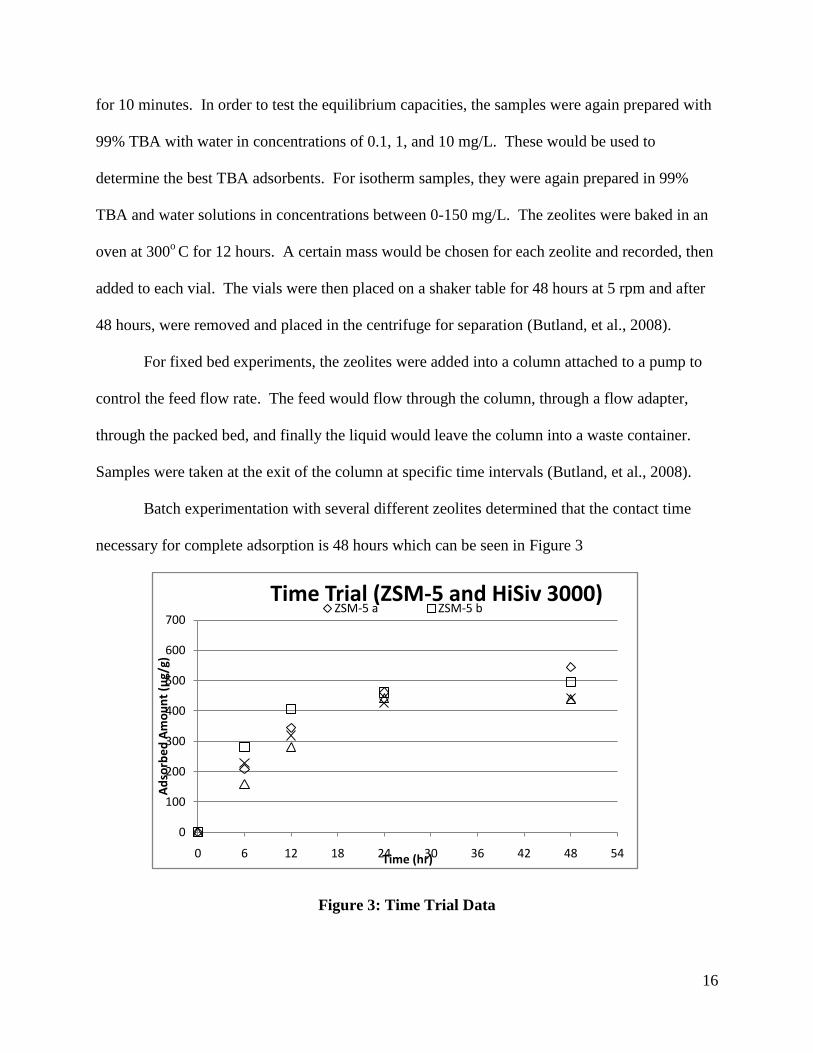
Batch experimentation with several different zeolites determined that the contact time
necessary for complete adsorption is 48 hours which can be seen in Figure 3
Figure 3: Time Trial Data
0
100
200
300
400
500
600
700
0 6 12 18 24 30 36 42 48 54
Ad
sorb
ed
Am
ou
nt
(μg/
g)
Time (hr)
Time Trial (ZSM-5 and HiSiv 3000)ZSM-5 a ZSM-5 b
17
Of the seven zeolites tested ZSM-5 and HiSIV 3000 adsorbed more in the 48-hour period
than the other zeolites (Butland, et al., 2008). In the column experiments, each column’s
equivalent adsorption capacity was determined and showed that adsorption in the columns were
10 times less than in the batch experiments. This was thought to be due to the contact time (48
hours) needed to complete adsorption and a very slow mass transfer process occurring in the
zeolite pores (Butland, et al., 2008). These results point out that equilibrium adsorption capacity
may not administrate the behavior of fixed bed absorbers if mass transfer is limited significantly
(Butland, et al., 2008).
Project Goals
From the understanding of the experiments described above, the experiments for this
report were developed. The procedure for batch adsorption used in the most recent experiments
was conducted with the ZSM-5 zeolite. In the previous experiment, a clay binder was added to
the granular form of the ZSM-5 before it was shaped into pellets. The clay binders were possibly
affecting the efficiency of the ZSM-5 adsorbing MTBE because of pore blockage. The granular
ZSM-5, called polycrystalline zeolite aggregates, were synthesized so that to create ZSM-5
without the clay binder.
18
Methodology
Analysis of ZSM-5 Sample
In a previous MQP, it was conjectured that Derek Pszybysz made granular ZSM-5
zeolites, but he did not accurately record x-ray diffraction data on the samples. In a subsequent
study, Bradford Carleen repeated the experiments and was able to provide more samples as the
previous set of zeolites was limited in amount. Because such little information was known about
these zeolites, analyses were conducted to determine three things: whether the samples created
were truly ZSM-5, whether the samples had thorough crystalline structures, and whether the
samples were calcined or uncalcined. For reference in this report, the ZSM-5 pellets from run 4
that were made by Derek will be referred to as the “old sample,” while the ZSM-5 pellets that
were synthesized by Brad will be referred to as the “new sample.”
Powder X-Ray Defraction (XRD)
The powder x-ray diffraction was used to determine if the samples of pellets were
actually synthesized correctly. A pellet was taken from run 4 of the day 8 vial from the old
samples; the pellet was ground to powder using a mortar and pestle. The powder was then placed
onto a glass slide and placed into the machine. The computer then gave the analysis. The new
sample that Brad had made also used this machine, but we did not do the analysis since he
provided the XRD results.
19
Scanning Electron Microscope (SEM)
The scanning electron microscope was used to take images of the samples to show if the
crystalline structures were uniform throughout the pellet. To prepare the sample for the SEM the
sample is first placed on a special stand that is coated with carbon paint so that the sample is
secure and the vacuum used in the machine will not be able to displace the sample. The sample
was then coated with a thin layer of gold by a machine called a sputter coater. This was done to
help reduce the effects of the electrons so that the image would be clear. The sample was placed
in the SEM and the pictures were then taken at different places to show that the crystalline
structure was uniform. This was done twice – the first was a sample that was found to already be
broken from run 4 of the old sample, and the second was a whole pellet from the new sample that
was broken before being placed into the machine. This was done to show the difference between
a sample that could have been broken during synthesis and a sample that was clearly not broken
during synthesis.
Thermal Gravimetric Analysis (TGA)
The TGA was used to determine if the old sample had been calcined or not. The machine
is designed to increase the temperature of the sample and measure the weight loss, because as the
temperature rises certain components volatilize or burn off. The sample being analyzed was
from run 4 of the day 8 of the old samples; this was assumed to be the stage of the synthesis
where the samples would most likely have been calcined. To be analyzed in the TGA, the
sample needed to be in a powder form. This was done by using a mortar and pestle to grind the
pellet. There were also two other samples that were used as controls: sample ZSM-5 powders
that were calcined and uncalcined. The tray that the sample was to be placed in was put over a
20
Bunsen burner to burn off any other samples that were used in other experiments. The sample
was put into the tray and then placed into the TGA machine. The TGA was set to be in the range
of 0-500° C. During the experiment there was to be a drop off at two significant sections. The
first was at 100° C, where water boils off and is removed from the mass, and the second at
around 250-300° C where the organic template would theoretically burn off. It was found that
there was a 15% weight reduction, signifying that the old sample was uncalcined. Therefore, the
new sample was used for our batch experiments, because they were calcined by Bradford
Carleen after the synthesis.
COD Calibration Curve
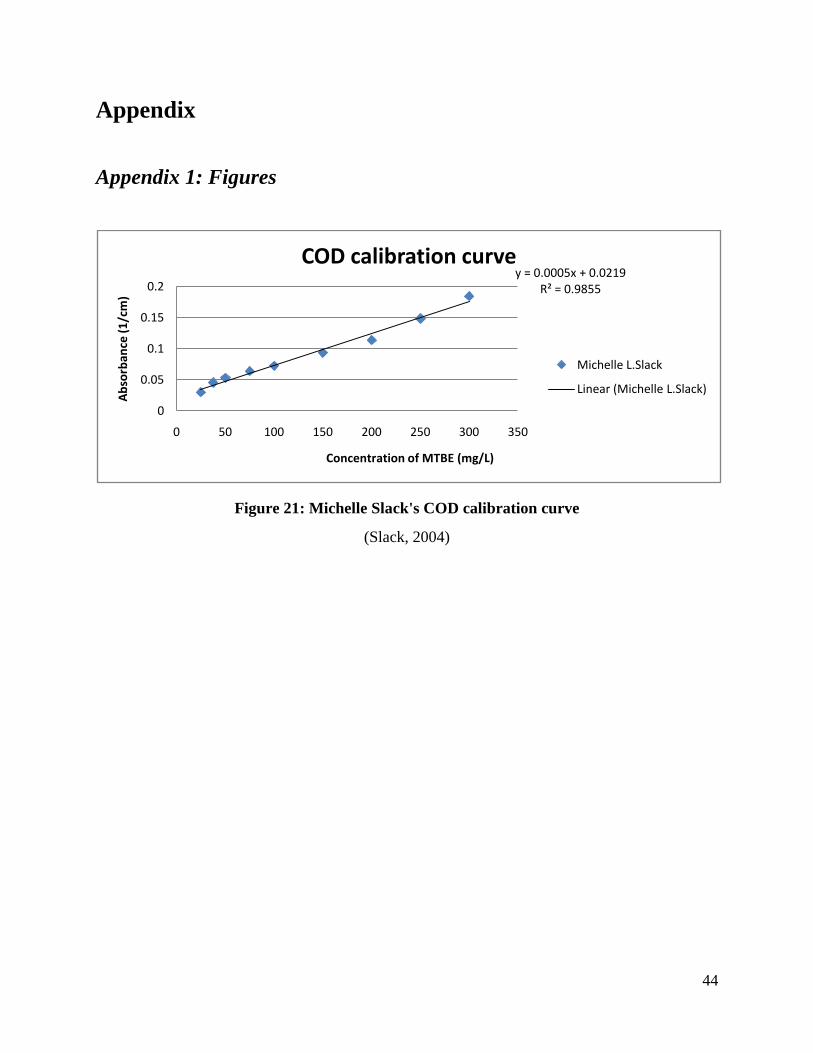
In a previous study, Michelle Slack used ultraviolet & visual spectroscopy for analysis.
Chemical Oxygen Demand (COD) tests were used to measure the concentrations of MTBE in the
samples. The COD test is used to indirectly measure the amount of organic compounds in water.
A strong chemical oxidant is used along with acid and heat to oxidize the organics. It measures
the amount of oxidant consumed in the breakdown of the organic matter, which indirectly gives
the amount of MTBE in the sample (Droste, 1996). The procedure for the COD test is in
Appendix 4. A calibration curve was created in order to read the concentrations of MTBE; her
calibration curve is located in Appendix 1. A standard solution of MTBE and water was made
for analysis. The objective was to create a calibration curve using our standard solution that
matched with Slack’s curve. Four standard solutions were used: 0, 50, 175, and 275 mg/L of
MTBE in water. When creating calibration curves, one or two concentrations are not enough
information, and more than four concentrations will require unnecessary work to obtain the same
21
information that only four concentration points would show. The calculations for this can be
seen in Appendix 3.
The calculated volumes of MTBE were added to a 42 mL vial and then filled with E-pure
water to dilute the MTBE and achieve the specified stock concentration. The vials were placed
in a rotisserie to be mixed for 24 hours. Afterwards, the vials were removed for COD analysis.
Time Trials
The time trials were conducted to determine how long it took samples to reach
equilibrium, where the zeolite reaches saturation. The chosen concentration was 275 mg/L of
MTBE, because it was towards the top of the COD equilibrium curve so that when the samples
were analyzed the results would appear on the COD equilibrium curve. The time trials tested the
overall adsorption of four different samples: powder calcined ZSM-5, powder uncalcined ZSM-
5, an old sample, and a new sample. The process for preparing the vials was the same as during
the COD equilibrium curve; however in this experiment zeolites were added to the vials. The
weight of each pellet used for this experiment was recorded using a bench scale.
The time intervals used for this experiment were 0, 6, 12, 24, 48 and 72 hours. The
intervals of 12 and 72 hours were only used for the new sample since more detail was desired for
this sample and the other samples were used for comparative reasons. To be more efficient with
the experiments, the zeolite and solutions were combined prior to being put in the rotisserie. The
samples were placed in the rotisserie in the order of 72, 48, 24, and then 6 hours was the last vial
to put in the rotisserie. This was done so that after 72 hours, all the vials were ready for COD
analysis.
22
To determine the concentration of the amount adsorbed in each sample Equation 1 was
used.
Equation 1: Amount of MTBE adsorbed
𝑞𝑒(𝑚𝑔
𝑔) =
𝐶𝑖𝑜 − 𝐶𝑒 ∗ 𝑉
𝑚𝑧𝑒𝑜𝑙𝑖𝑡𝑒
In Equation 1, Cio is the initial concentration of the sample, Ce is the concentration of the
sample after adsorption, mzeolite is the mass of the zeolite, and V is the volume of the vial (0.042
L). The qe values and time intervals were graphed and are shown in the Results section. In order
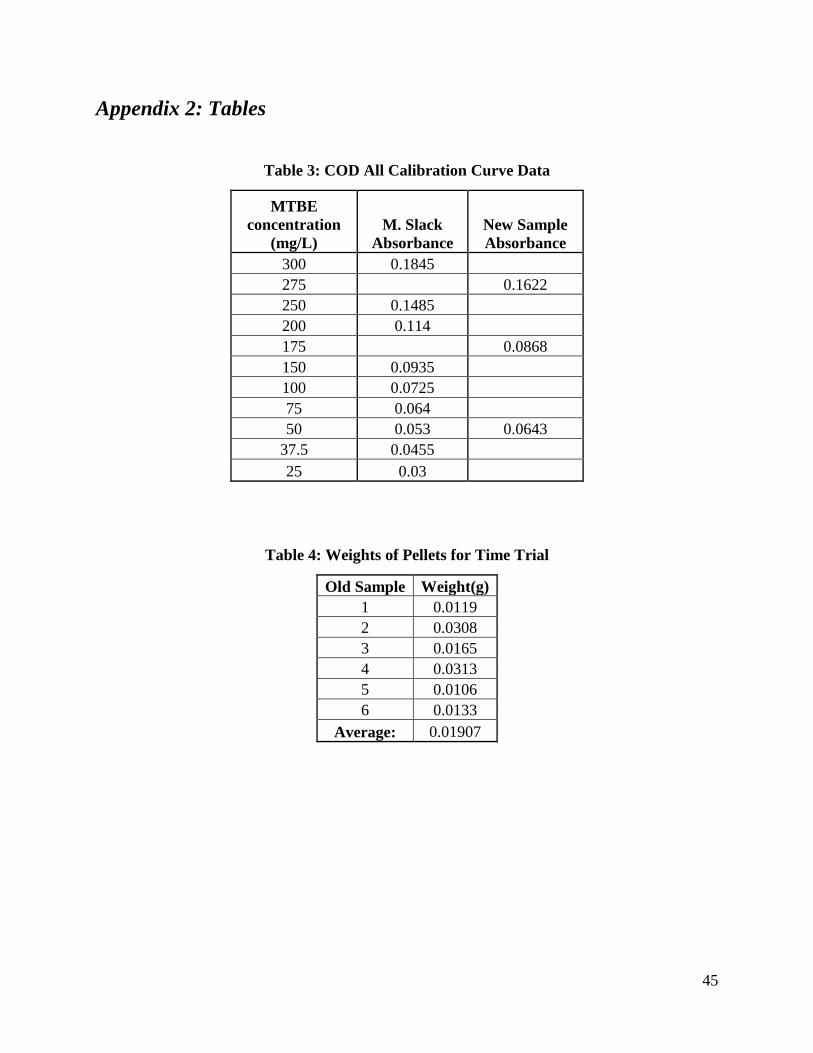
to determine the weight should be used for the granular samples, old pellets were weighed and
the average was taken. The weight used for the granular samples was ≈0.01907g. Raw data can
be found in Appendix 2.
Adsorption Isotherm
The adsorption isotherm was used to determine over a range of concentrations how much
the ZSM-5 pellet could adsorb at equilibrium. The range of concentrations was 25-300 mg/L of
MTBE in water. Calculations were done to determine how much stock sample was used for each
concentration, which can be seen in Appendix 2. The calculated amount of MTBE was added to
a 42 mL vial and filled with E-pure water. A new ZSM-5 pellet was added after being weighed
and recorded. A total of 12 samples were placed into the rotisserie to mix for 72 hours.
Afterwards, the samples were taken out for COD analysis. Equation 1 was used to determine the
amount of MTBE that was adsorbed. The qe values and time intervals were graphed and are
shown in the Results section.
23
Results & Discussion
Analysis of Samples
Powder X-Ray Defraction
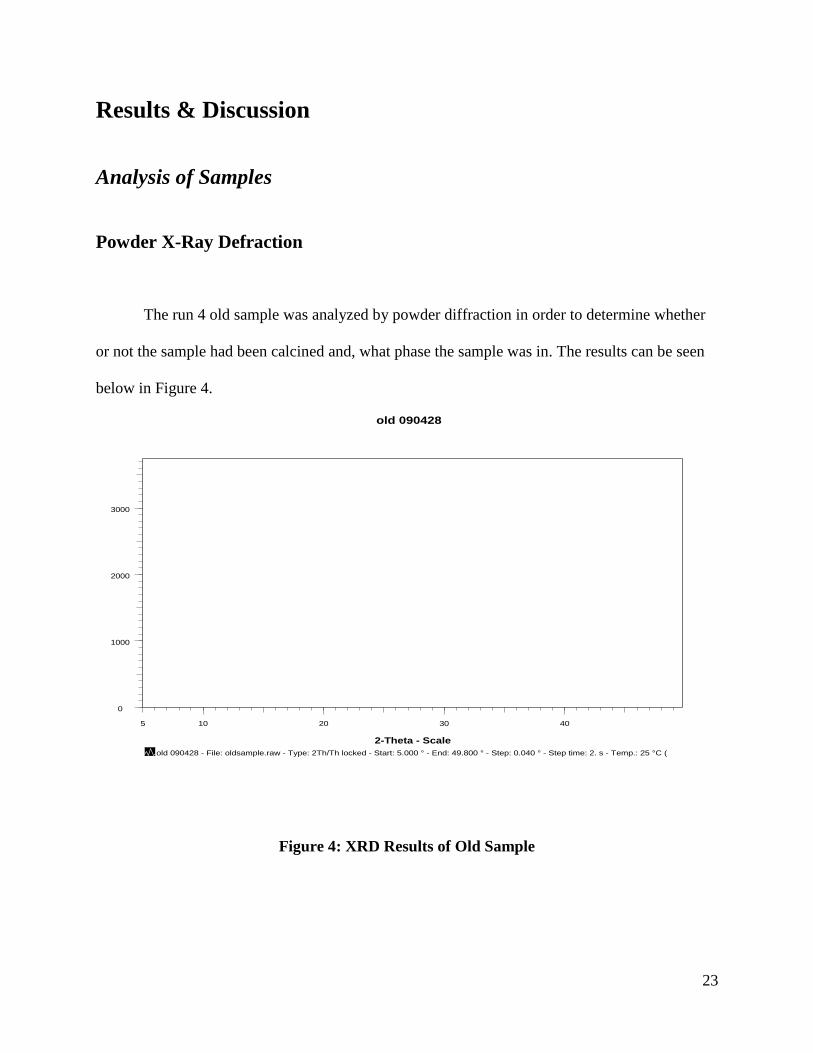
The run 4 old sample was analyzed by powder diffraction in order to determine whether
or not the sample had been calcined and, what phase the sample was in. The results can be seen
below in Figure 4.
Figure 4: XRD Results of Old Sample
old 090428
old 090428 - File: oldsample.raw - Type: 2Th/Th locked - Start: 5.000 ° - End: 49.800 ° - Step: 0.040 ° - Step time: 2. s - Temp.: 25 °C (
Lin
(C
ou
nts
)
0
1000
2000
3000
2-Theta - Scale
5 10 20 30 40
24
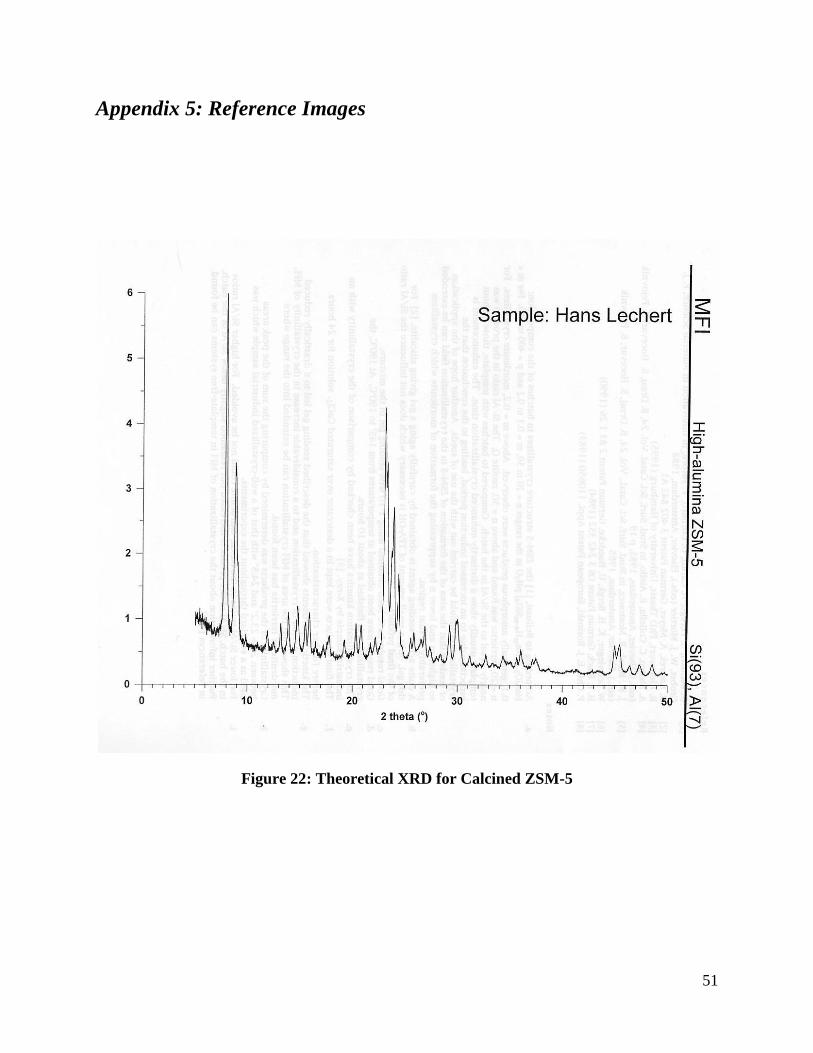
To verify whether the results showed a calcined or uncalcined ZSM-5, a reference was
used from which can be seen in Appendix 5. In comparing the results, this test verified that all
samples from run 4 of the old sample after day 8 were calcined ZSM-5.
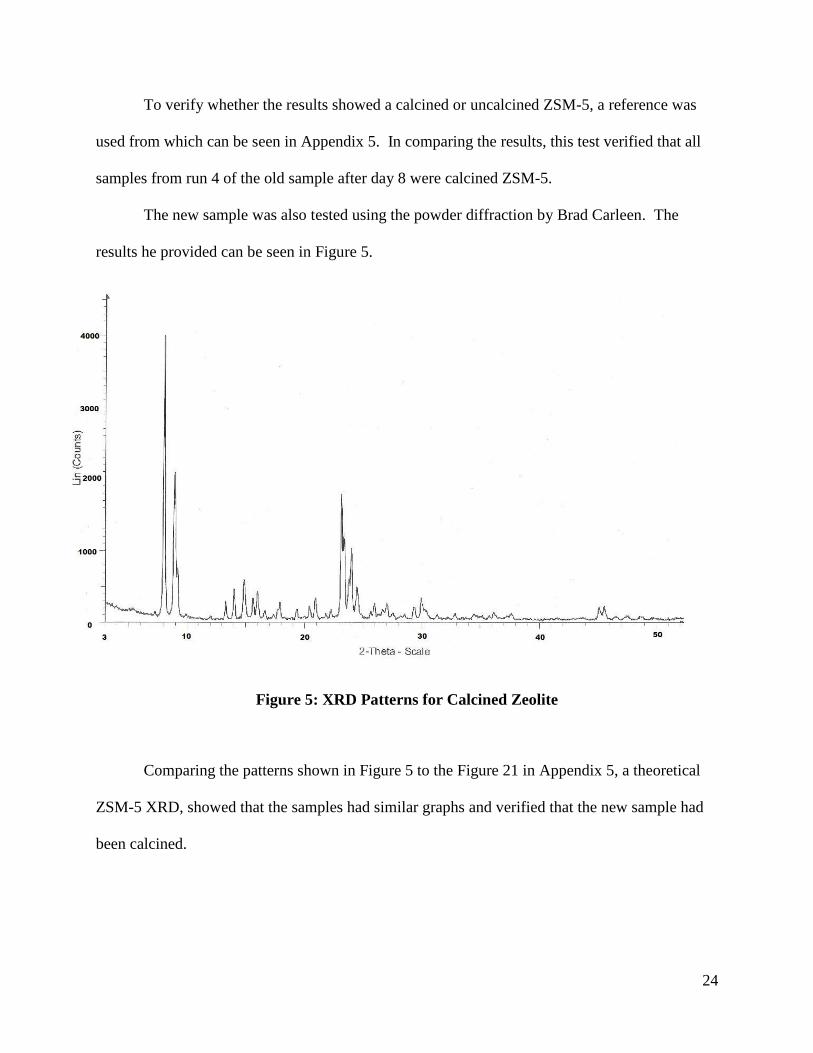
The new sample was also tested using the powder diffraction by Brad Carleen. The
results he provided can be seen in Figure 5.
Figure 5: XRD Patterns for Calcined Zeolite
Comparing the patterns shown in Figure 5 to the Figure 21 in Appendix 5, a theoretical
ZSM-5 XRD, showed that the samples had similar graphs and verified that the new sample had
been calcined.
25
Scanning Electron Microscope (SEM)
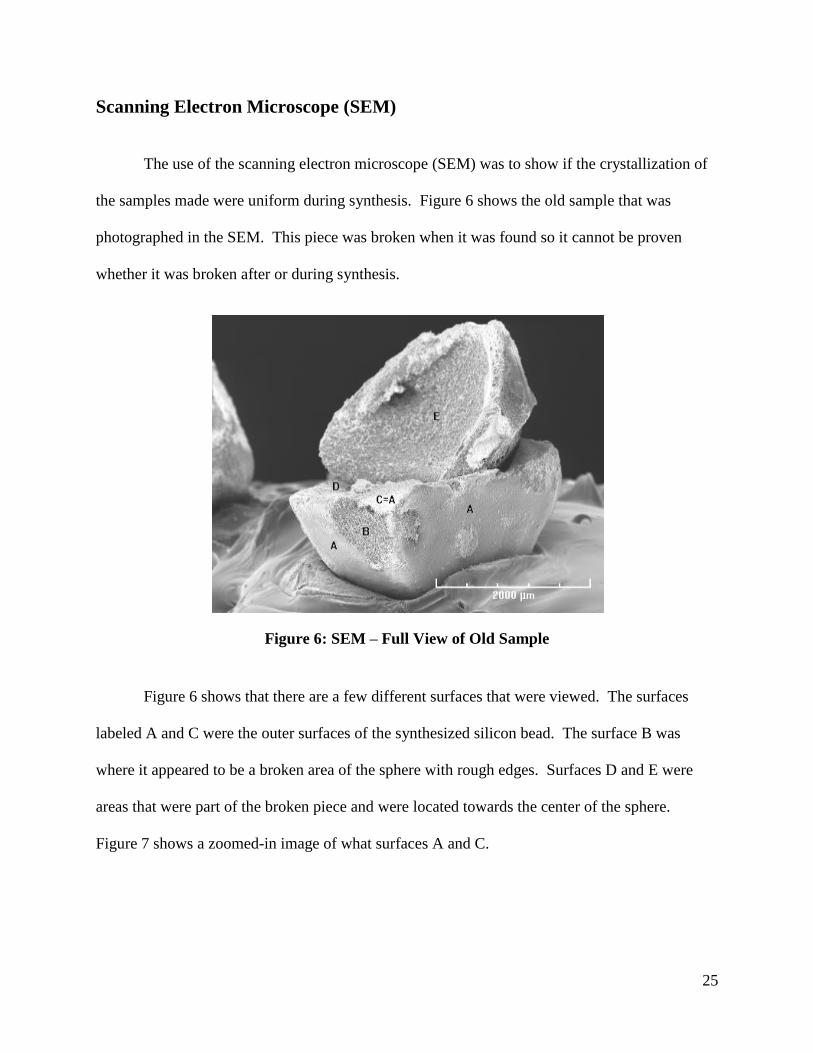
The use of the scanning electron microscope (SEM) was to show if the crystallization of
the samples made were uniform during synthesis. Figure 6 shows the old sample that was
photographed in the SEM. This piece was broken when it was found so it cannot be proven
whether it was broken after or during synthesis.
Figure 6: SEM – Full View of Old Sample
Figure 6 shows that there are a few different surfaces that were viewed. The surfaces
labeled A and C were the outer surfaces of the synthesized silicon bead. The surface B was
where it appeared to be a broken area of the sphere with rough edges. Surfaces D and E were
areas that were part of the broken piece and were located towards the center of the sphere.
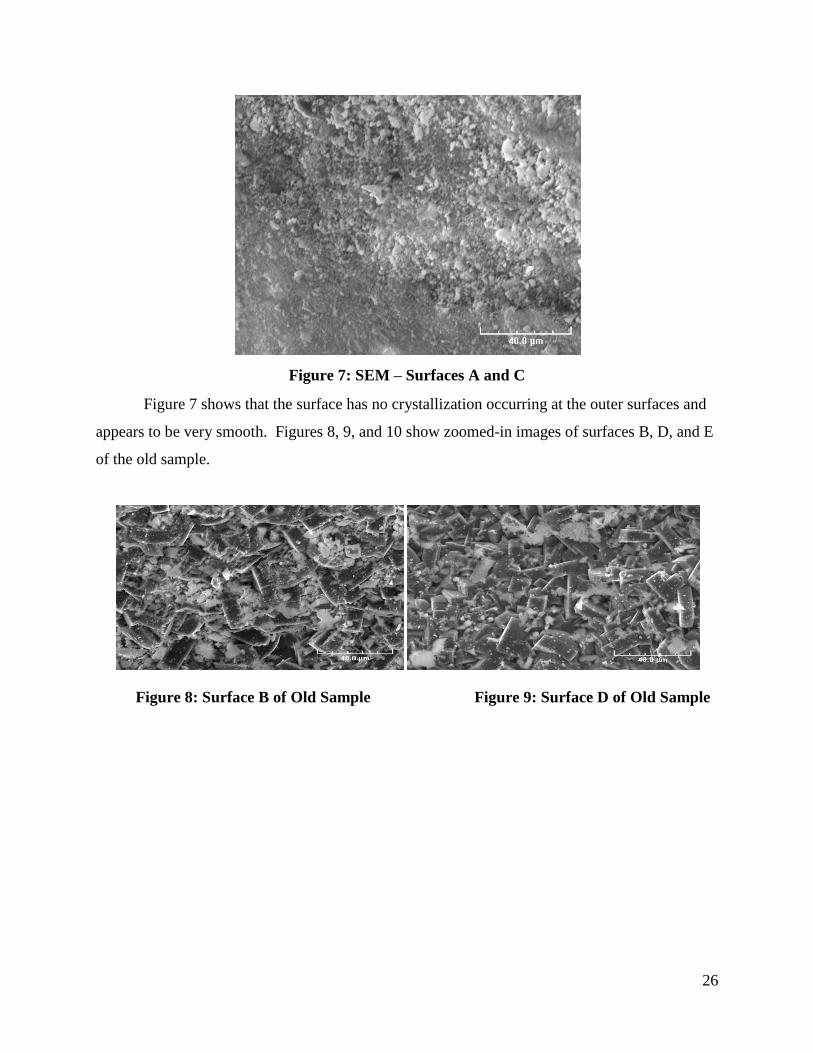
Figure 7 shows a zoomed-in image of what surfaces A and C.
26
Figure 7: SEM – Surfaces A and C
Figure 7 shows that the surface has no crystallization occurring at the outer surfaces and
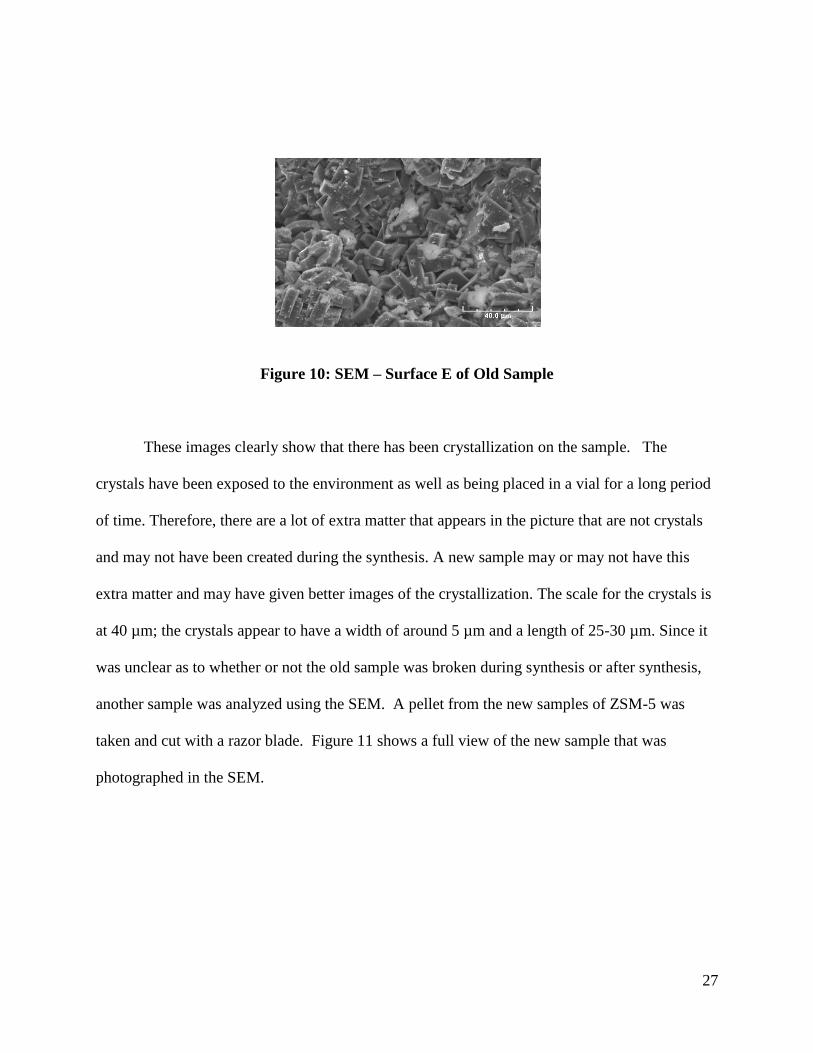
appears to be very smooth. Figures 8, 9, and 10 show zoomed-in images of surfaces B, D, and E
of the old sample.
Figure 8: Surface B of Old Sample Figure 9: Surface D of Old Sample
27
Figure 10: SEM – Surface E of Old Sample
These images clearly show that there has been crystallization on the sample. The
crystals have been exposed to the environment as well as being placed in a vial for a long period
of time. Therefore, there are a lot of extra matter that appears in the picture that are not crystals
and may not have been created during the synthesis. A new sample may or may not have this
extra matter and may have given better images of the crystallization. The scale for the crystals is
at 40 µm; the crystals appear to have a width of around 5 µm and a length of 25-30 µm. Since it
was unclear as to whether or not the old sample was broken during synthesis or after synthesis,
another sample was analyzed using the SEM. A pellet from the new samples of ZSM-5 was
taken and cut with a razor blade. Figure 11 shows a full view of the new sample that was
photographed in the SEM.
28
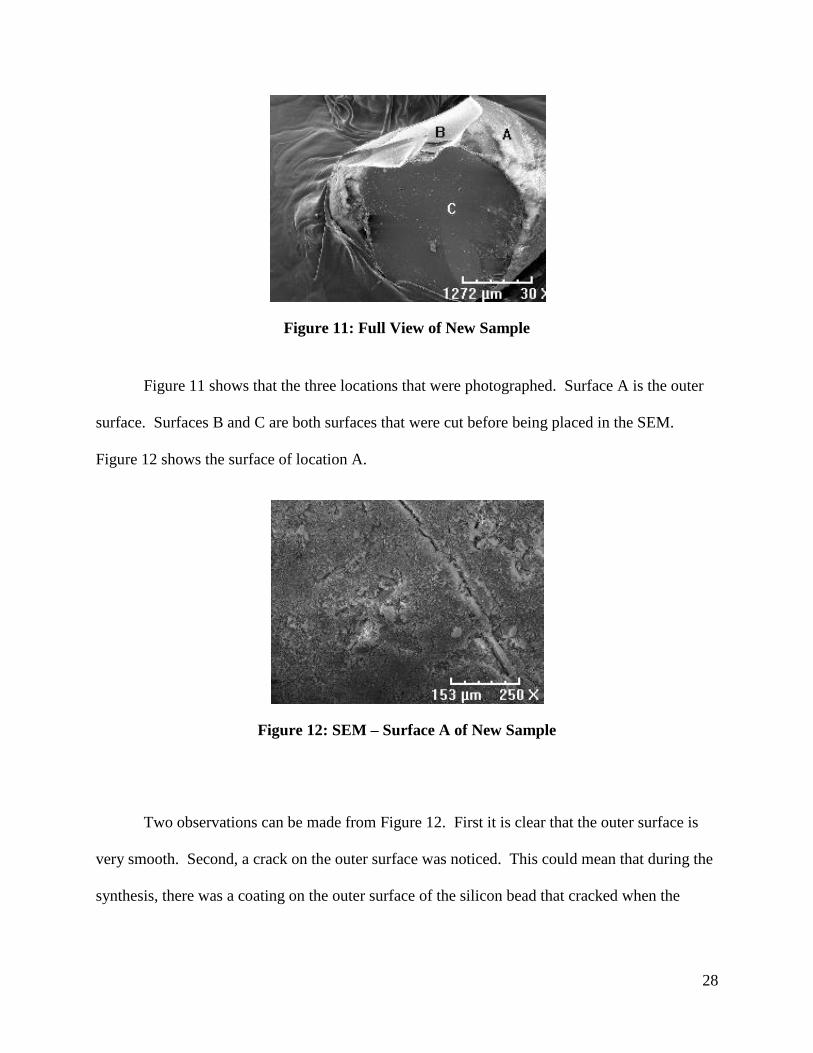
Figure 11: Full View of New Sample
Figure 11 shows that the three locations that were photographed. Surface A is the outer
surface. Surfaces B and C are both surfaces that were cut before being placed in the SEM.
Figure 12 shows the surface of location A.
Figure 12: SEM – Surface A of New Sample
Two observations can be made from Figure 12. First it is clear that the outer surface is
very smooth. Second, a crack on the outer surface was noticed. This could mean that during the
synthesis, there was a coating on the outer surface of the silicon bead that cracked when the
29
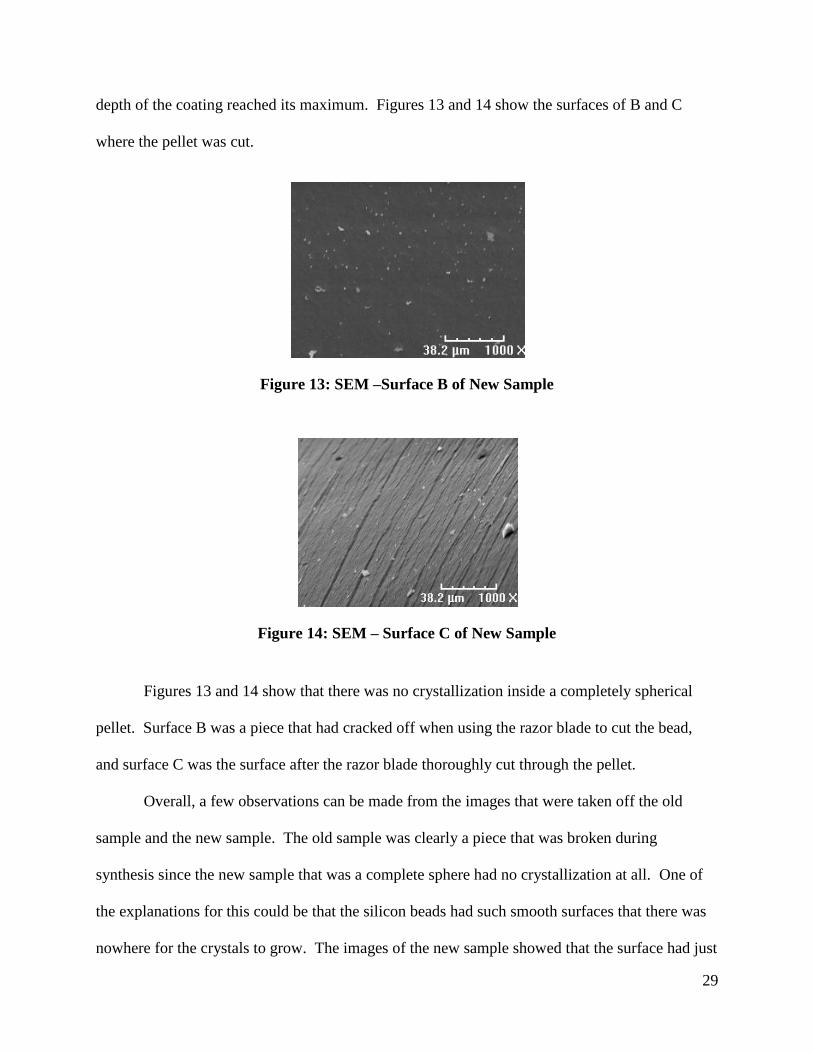
depth of the coating reached its maximum. Figures 13 and 14 show the surfaces of B and C
where the pellet was cut.
Figure 13: SEM –Surface B of New Sample
Figure 14: SEM – Surface C of New Sample
Figures 13 and 14 show that there was no crystallization inside a completely spherical
pellet. Surface B was a piece that had cracked off when using the razor blade to cut the bead,
and surface C was the surface after the razor blade thoroughly cut through the pellet.
Overall, a few observations can be made from the images that were taken off the old
sample and the new sample. The old sample was clearly a piece that was broken during
synthesis since the new sample that was a complete sphere had no crystallization at all. One of
the explanations for this could be that the silicon beads had such smooth surfaces that there was
nowhere for the crystals to grow. The images of the new sample showed that the surface had just
30
started to get rough and develop cracks. If the synthesis was allowed a longer period of time
then there may have been some crystallization on the surface. Additionally, the old sample
showed that a broken piece of zeolite or a piece that was broken during synthesis created a rough
surface that was perfect for crystallization. Further research would be required to fully answer
these questions. The analysis for this part of the report focused on crystallization, and the
samples that were used in later experiments for the project focused on whole pellets that did not
have crystallization on them. The pellets that were used that were not crystalline might not be as
efficient as pellets that had crystallization. This could be researched with more experiments.
Thermal Gravimetric Analysis (TGA)
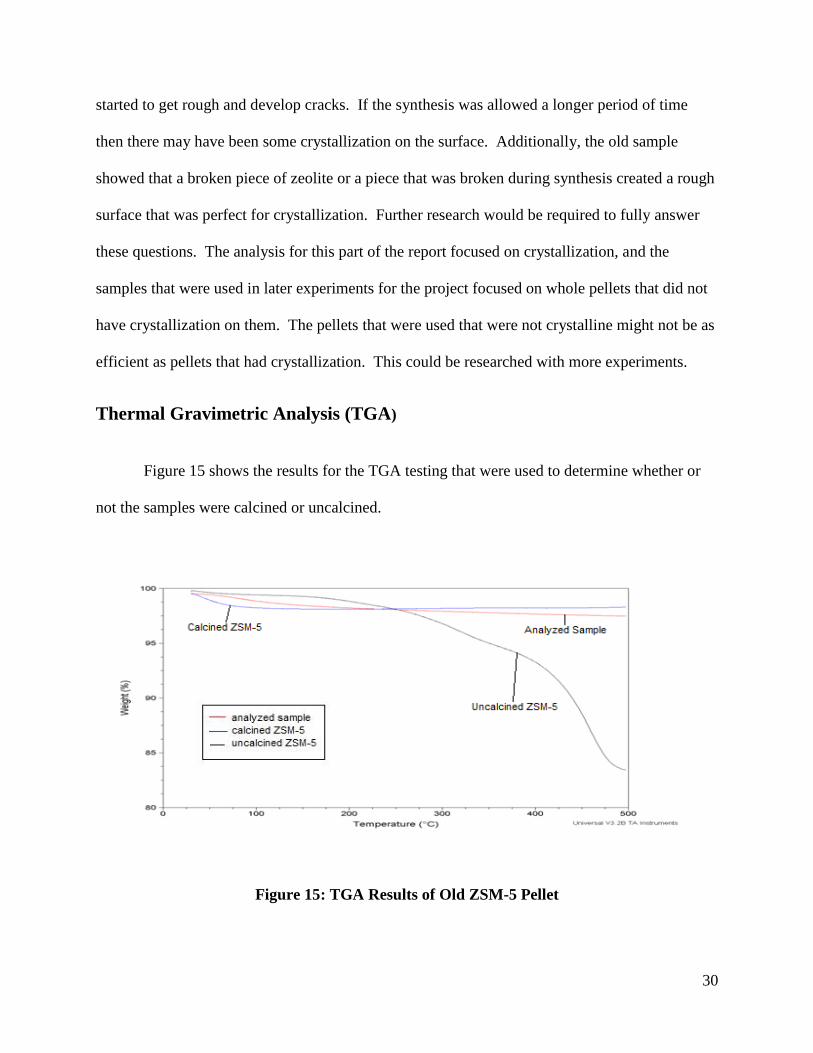
Figure 15 shows the results for the TGA testing that were used to determine whether or
not the samples were calcined or uncalcined.
Figure 15: TGA Results of Old ZSM-5 Pellet
31
The red line, or the line in the middle at 100ºC, is the sample that was being analyzed,
which was the run 4 day 8 vial from the old samples. The blue line, or the lowest line at 100ºC,
was the new sample that was experimented with, and the black line, or the top line at 100ºC, was
a sample of uncalcined ZSM-5. As Figure 15 shows, the uncalcined ZSM-5 had about a 15%
weight drop where the organic template had been burned off, verifying that the sample was
uncalcined. The old sample showed no weight decrease in the 250-500 ºC temperature range.
Using these as controls for a calcined and uncalcined sample, it was concluded that the ZSM-5
sample to be used for the experiments was indeed calcined.
32
Experimental Results
COD Calibration Curve
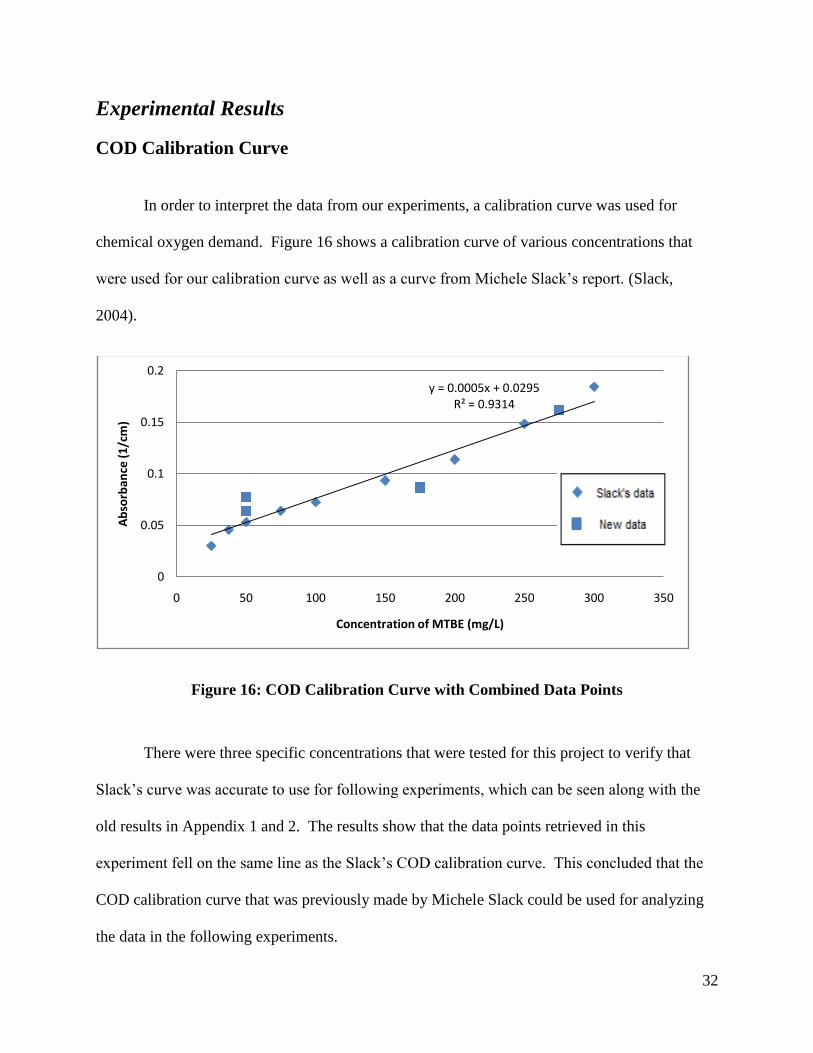
In order to interpret the data from our experiments, a calibration curve was used for
chemical oxygen demand. Figure 16 shows a calibration curve of various concentrations that
were used for our calibration curve as well as a curve from Michele Slack’s report. (Slack,
2004).
Figure 16: COD Calibration Curve with Combined Data Points
There were three specific concentrations that were tested for this project to verify that
Slack’s curve was accurate to use for following experiments, which can be seen along with the
old results in Appendix 1 and 2. The results show that the data points retrieved in this
experiment fell on the same line as the Slack’s COD calibration curve. This concluded that the
COD calibration curve that was previously made by Michele Slack could be used for analyzing
the data in the following experiments.
y = 0.0005x + 0.0295R² = 0.9314
0
0.05
0.1
0.15
0.2
0 50 100 150 200 250 300 350
Ab
sorb
ance
(1
/cm
)
Concentration of MTBE (mg/L)
33
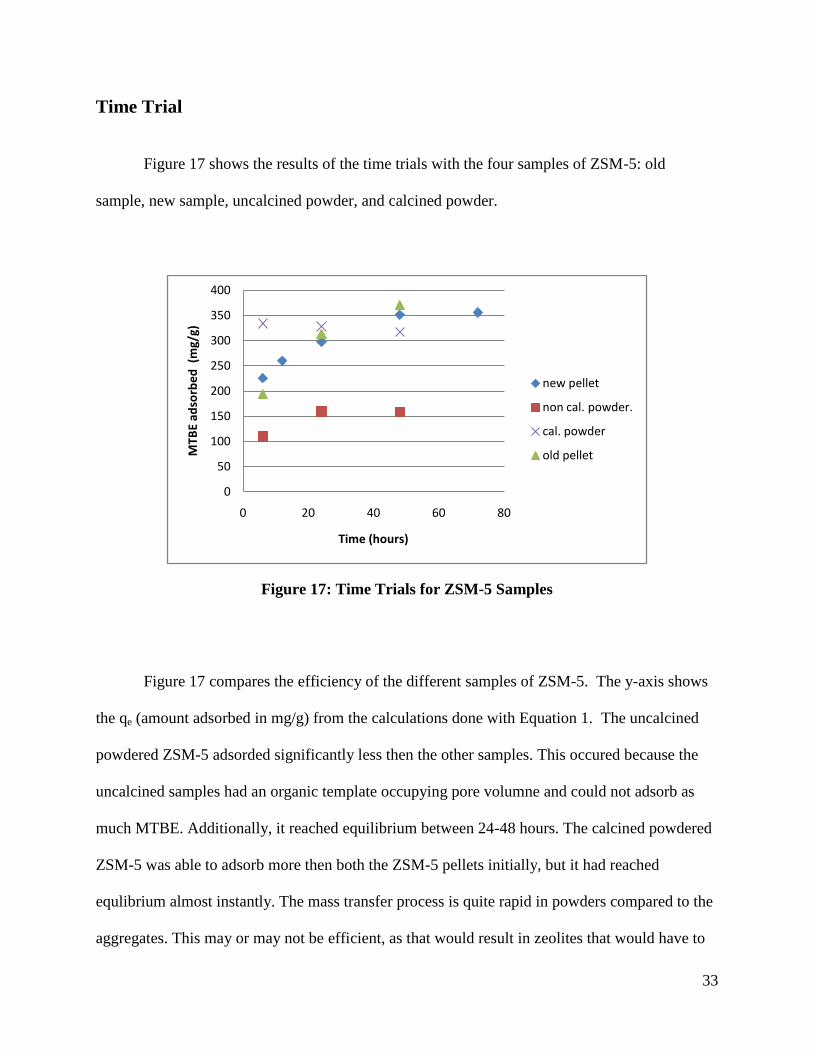
Time Trial
Figure 17 shows the results of the time trials with the four samples of ZSM-5: old
sample, new sample, uncalcined powder, and calcined powder.
Figure 17: Time Trials for ZSM-5 Samples
Figure 17 compares the efficiency of the different samples of ZSM-5. The y-axis shows
the qe (amount adsorbed in mg/g) from the calculations done with Equation 1. The uncalcined
powdered ZSM-5 adsorded significantly less then the other samples. This occured because the
uncalcined samples had an organic template occupying pore volumne and could not adsorb as
much MTBE. Additionally, it reached equilibrium between 24-48 hours. The calcined powdered
ZSM-5 was able to adsorb more then both the ZSM-5 pellets initially, but it had reached
equlibrium almost instantly. The mass transfer process is quite rapid in powders compared to the
aggregates. This may or may not be efficient, as that would result in zeolites that would have to
0
50
100
150
200
250
300
350
400
0 20 40 60 80
MTB
E ad
sorb
ed
(m
g/g)
Time (hours)
new pellet
non cal. powder.
cal. powder
old pellet
34
be regenerated frequently and a comparison of cost for regeneration would have to be done to
make conclusions. The new and old ZSM-5 pellets follow roughly the same trend and reach
equlibrium between 48-72 hours. For experiemntal purposes, 72 hours was considered the time
for saturation. A table with all of the details to the time trials can be seen in Appendix 2.
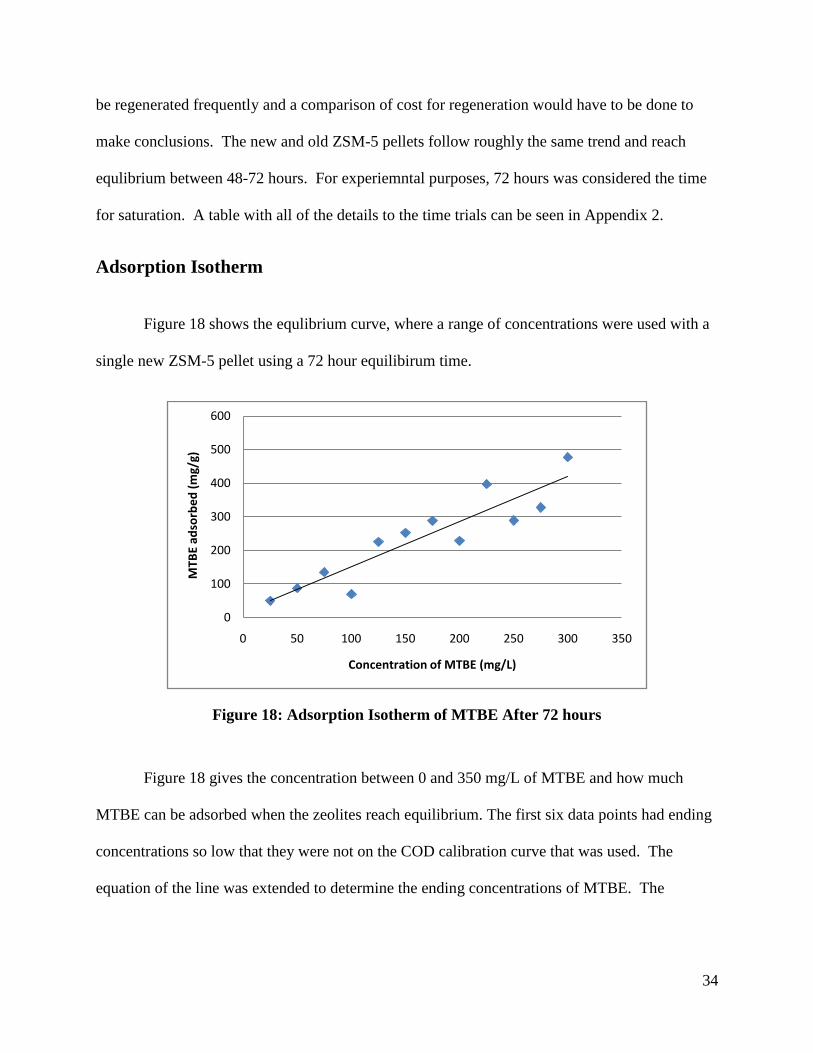
Adsorption Isotherm
Figure 18 shows the equlibrium curve, where a range of concentrations were used with a
single new ZSM-5 pellet using a 72 hour equilibirum time.
Figure 18: Adsorption Isotherm of MTBE After 72 hours
Figure 18 gives the concentration between 0 and 350 mg/L of MTBE and how much
MTBE can be adsorbed when the zeolites reach equilibrium. The first six data points had ending
concentrations so low that they were not on the COD calibration curve that was used. The
equation of the line was extended to determine the ending concentrations of MTBE. The
0
100
200
300
400
500
600
0 50 100 150 200 250 300 350
MTB
E ad
sorb
ed
(m
g/g)
Concentration of MTBE (mg/L)
35
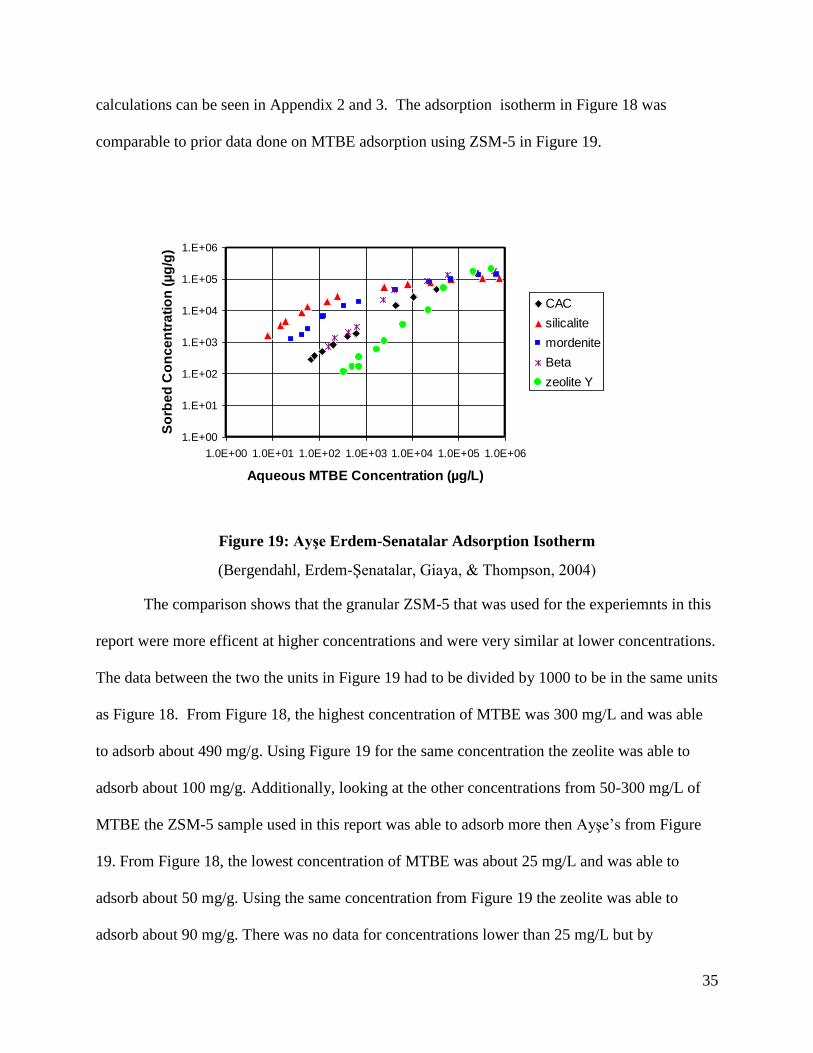
calculations can be seen in Appendix 2 and 3. The adsorption isotherm in Figure 18 was
comparable to prior data done on MTBE adsorption using ZSM-5 in Figure 19.
Figure 19: Ayşe Erdem-Senatalar Adsorption Isotherm
(Bergendahl, Erdem-Şenatalar, Giaya, & Thompson, 2004)
The comparison shows that the granular ZSM-5 that was used for the experiemnts in this
report were more efficent at higher concentrations and were very similar at lower concentrations.
The data between the two the units in Figure 19 had to be divided by 1000 to be in the same units
as Figure 18. From Figure 18, the highest concentration of MTBE was 300 mg/L and was able
to adsorb about 490 mg/g. Using Figure 19 for the same concentration the zeolite was able to
adsorb about 100 mg/g. Additionally, looking at the other concentrations from 50-300 mg/L of
MTBE the ZSM-5 sample used in this report was able to adsorb more then Ayşe’s from Figure
19. From Figure 18, the lowest concentration of MTBE was about 25 mg/L and was able to
adsorb about 50 mg/g. Using the same concentration from Figure 19 the zeolite was able to
adsorb about 90 mg/g. There was no data for concentrations lower than 25 mg/L but by
1.E+00
1.E+01
1.E+02
1.E+03
1.E+04
1.E+05
1.E+06
1.0E+00 1.0E+01 1.0E+02 1.0E+03 1.0E+04 1.0E+05 1.0E+06
Aqueous MTBE Concentration (µg/L)
So
rbe
d C
on
ce
ntr
ati
on
(µ
g/g
)
CAC
silicalite
mordenite
Beta
zeolite Y
36
extending the equation of the line in Figure 18 it compares to the lower concentrations seen in
Figure 19. This shows that at the lower concentrations the ZSM-5 used in this report did not
adsorb as much MTBE as the ZSM-5 shown from Ayşe’s data in Figure 19.
Design of Treatment System
The contamination scenario at Pascoag, Rhode Island was used as the basis for the design
aspect of this project. Although the contamination at Pascoag is currently being treated, the
plume is so large that much of the water supply is still contaminated. Current contamination
levels of MTBE were found to reach a maximum of 15,000 µg/L in the bedrock aquifer (Allen &
Boving, 2006). For comparison, the Rhode Island drinking limit for MTBE is 40µg/L.
In 2004, the Rhode Island Department of Environmental Management installed a
treatment system that includes submersible pumps, air strippers, liquid and vapor phase granular
activated carbon and is designed to handle a flow of 100 gallons per minute (Rhode Island
Department of Environmental Management, 2005). This design parameter was used as the
pumping rate through the system. A total of three columns were used in series, where two
columns would be operating and would be offline for regeneration or maintenance. Figure 19
shows a piping schematic of this system.
37
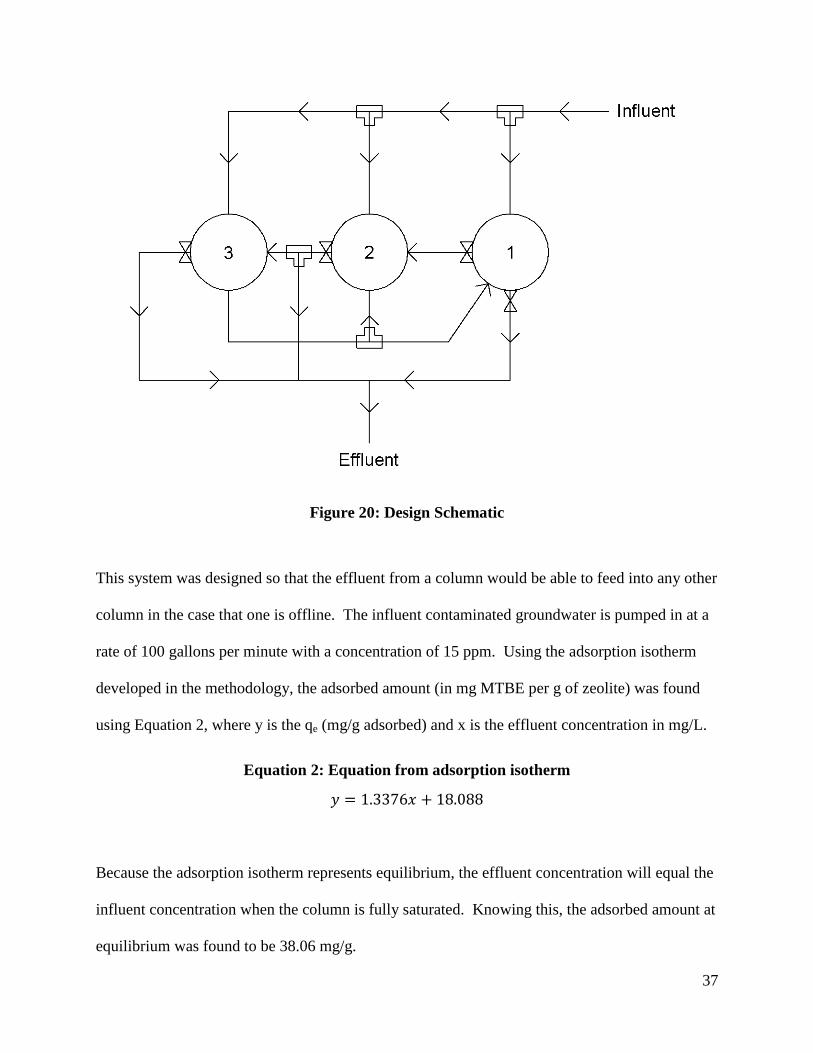
Figure 20: Design Schematic
This system was designed so that the effluent from a column would be able to feed into any other
column in the case that one is offline. The influent contaminated groundwater is pumped in at a
rate of 100 gallons per minute with a concentration of 15 ppm. Using the adsorption isotherm
developed in the methodology, the adsorbed amount (in mg MTBE per g of zeolite) was found
using Equation 2, where y is the qe (mg/g adsorbed) and x is the effluent concentration in mg/L.
Equation 2: Equation from adsorption isotherm
𝑦 = 1.3376𝑥 + 18.088
Because the adsorption isotherm represents equilibrium, the effluent concentration will equal the
influent concentration when the column is fully saturated. Knowing this, the adsorbed amount at
equilibrium was found to be 38.06 mg/g.
38
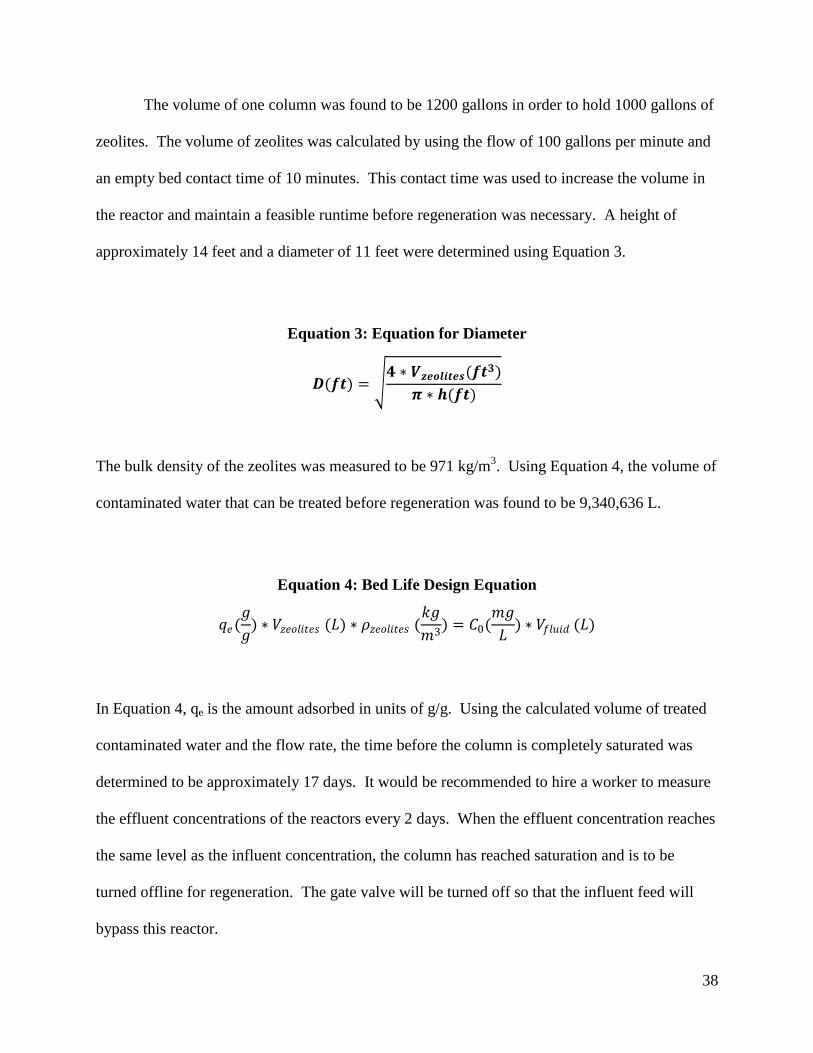
The volume of one column was found to be 1200 gallons in order to hold 1000 gallons of
zeolites. The volume of zeolites was calculated by using the flow of 100 gallons per minute and
an empty bed contact time of 10 minutes. This contact time was used to increase the volume in
the reactor and maintain a feasible runtime before regeneration was necessary. A height of
approximately 14 feet and a diameter of 11 feet were determined using Equation 3.
Equation 3: Equation for Diameter
𝑫(𝒇𝒕) = 𝟒 ∗ 𝑽𝒛𝒆𝒐𝒍𝒊𝒕𝒆𝒔(𝒇𝒕𝟑)
𝝅 ∗ 𝒉(𝒇𝒕)
The bulk density of the zeolites was measured to be 971 kg/m3. Using Equation 4, the volume of
contaminated water that can be treated before regeneration was found to be 9,340,636 L.
Equation 4: Bed Life Design Equation
𝑞𝑒(𝑔
𝑔) ∗ 𝑉𝑧𝑒𝑜𝑙𝑖𝑡𝑒𝑠 (𝐿) ∗ 𝜌𝑧𝑒𝑜𝑙𝑖𝑡𝑒𝑠 (
𝑘𝑔
𝑚3) = 𝐶0(
𝑚𝑔
𝐿) ∗ 𝑉𝑓𝑙𝑢𝑖𝑑 (𝐿)
In Equation 4, qe is the amount adsorbed in units of g/g. Using the calculated volume of treated
contaminated water and the flow rate, the time before the column is completely saturated was
determined to be approximately 17 days. It would be recommended to hire a worker to measure
the effluent concentrations of the reactors every 2 days. When the effluent concentration reaches
the same level as the influent concentration, the column has reached saturation and is to be
turned offline for regeneration. The gate valve will be turned off so that the influent feed will
bypass this reactor.
39
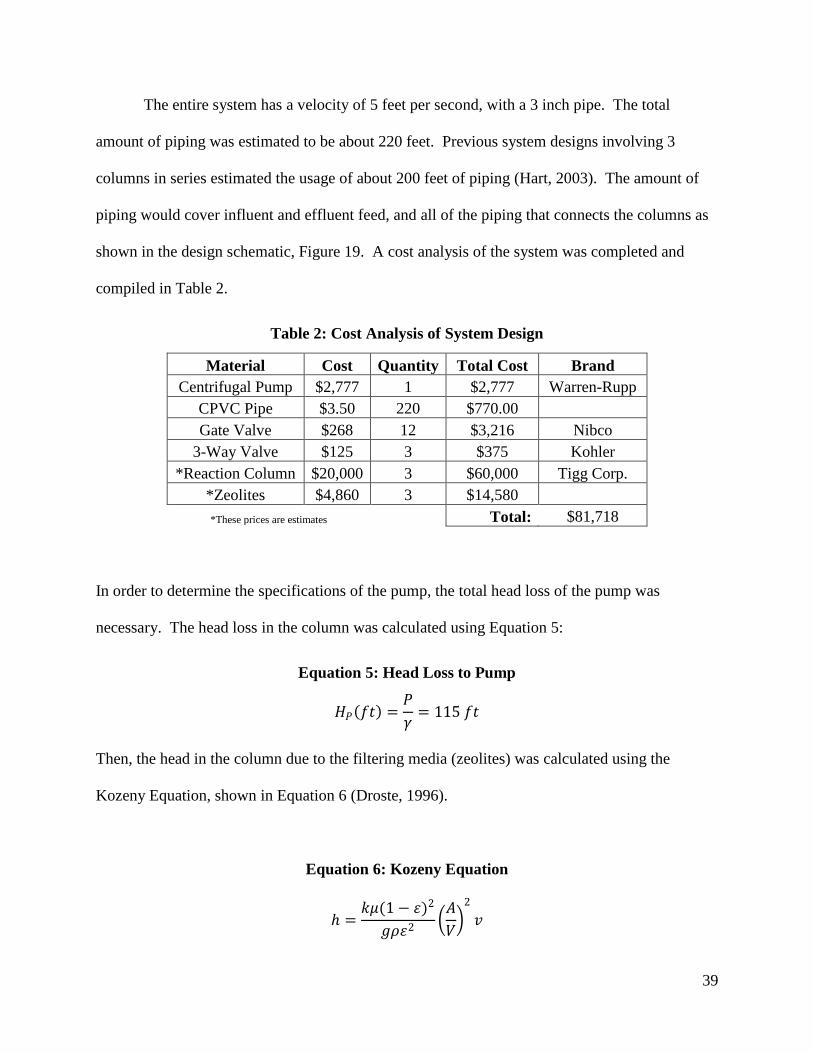
The entire system has a velocity of 5 feet per second, with a 3 inch pipe. The total
amount of piping was estimated to be about 220 feet. Previous system designs involving 3
columns in series estimated the usage of about 200 feet of piping (Hart, 2003). The amount of
piping would cover influent and effluent feed, and all of the piping that connects the columns as
shown in the design schematic, Figure 19. A cost analysis of the system was completed and
compiled in Table 2.
Table 2: Cost Analysis of System Design
Material Cost Quantity Total Cost Brand
Centrifugal Pump $2,777 1 $2,777 Warren-Rupp
CPVC Pipe $3.50 220 $770.00
Gate Valve $268 12 $3,216 Nibco
3-Way Valve $125 3 $375 Kohler
*Reaction Column $20,000 3 $60,000 Tigg Corp.
*Zeolites $4,860 3 $14,580
*These prices are estimates
Total: $81,718
In order to determine the specifications of the pump, the total head loss of the pump was
necessary. The head loss in the column was calculated using Equation 5:
Equation 5: Head Loss to Pump
𝐻𝑃 𝑓𝑡 =𝑃
𝛾= 115 𝑓𝑡
Then, the head in the column due to the filtering media (zeolites) was calculated using the
Kozeny Equation, shown in Equation 6 (Droste, 1996).
Equation 6: Kozeny Equation
=𝑘𝜇(1 − 𝜀)2
𝑔𝜌𝜀2 𝐴
𝑉
2
𝑣
40
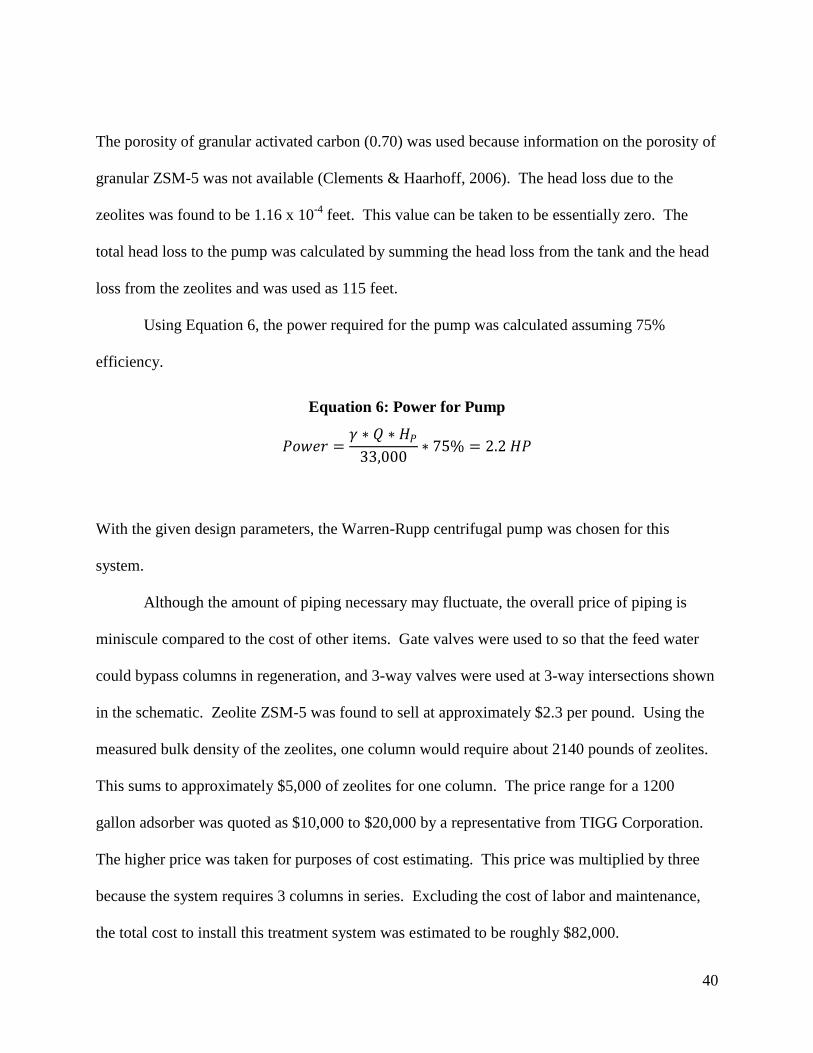
The porosity of granular activated carbon (0.70) was used because information on the porosity of
granular ZSM-5 was not available (Clements & Haarhoff, 2006). The head loss due to the
zeolites was found to be 1.16 x 10⁻⁴
feet. This value can be taken to be essentially zero. The
total head loss to the pump was calculated by summing the head loss from the tank and the head
loss from the zeolites and was used as 115 feet.
Using Equation 6, the power required for the pump was calculated assuming 75%
efficiency.
Equation 6: Power for Pump
𝑃𝑜𝑤𝑒𝑟 =𝛾 ∗ 𝑄 ∗ 𝐻𝑃
33,000∗ 75% = 2.2 𝐻𝑃
With the given design parameters, the Warren-Rupp centrifugal pump was chosen for this
system.
Although the amount of piping necessary may fluctuate, the overall price of piping is
miniscule compared to the cost of other items. Gate valves were used to so that the feed water
could bypass columns in regeneration, and 3-way valves were used at 3-way intersections shown
in the schematic. Zeolite ZSM-5 was found to sell at approximately $2.3 per pound. Using the
measured bulk density of the zeolites, one column would require about 2140 pounds of zeolites.
This sums to approximately $5,000 of zeolites for one column. The price range for a 1200
gallon adsorber was quoted as $10,000 to $20,000 by a representative from TIGG Corporation.
The higher price was taken for purposes of cost estimating. This price was multiplied by three
because the system requires 3 columns in series. Excluding the cost of labor and maintenance,
the total cost to install this treatment system was estimated to be roughly $82,000.
41
Design Recommendations and Conclusions
Zeolite ZSM-5 could be an effective method of treating MTBE from water. The cost is
relatively low to design a system. One column would have to be regenerated every 17 days, thus
it is recommended to check the effluent concentrations every 2 days. The granular form of
ZSM-5 would be more effective in a reaction column than the powdered form, as the powder
zeolite would be impractical. ZSM-5 could potentially be more efficient and cost-effective than
granular activated carbon. Although activated carbon is cheaper by the pound than zeolites,
when granular activated carbon is regenerated it loses about 5-15% of its carbon mass per cycle
(U.S. Army Corp of Engineers, 2001). Therefore, activated carbon can only be used so many
times before it loses its efficiency.
In order to more quantitatively compare the effectiveness of ZSM-5 and granular
activated carbon on MTBE, further research is recommended on these two processes including
research and cost analysis of regeneration processes. Further research may show that ZSM-5 is a
more cost effective method because it does not lose efficiency as much as activated carbon. It is
also noted that further research should be done using column experiments. The tests that were
used in this report involved batch experiments. Analysis of adsorption tests using bench-scale
column reactors may prove useful in comparing the adsorption effectiveness of ZSM-5 and
granular activated carbon in fixed bed treatment systems.
42
References
Environmental Protection Agency. (n.d.). Methyl Tertiary Butyl Ether. Retrieved 23 September,
2008, from http://www.epa.gov/mtbe/faq.htm
Allen, J., & Boving, T. (2006). MTBE Drinking Water Contamination in Pascoag, RI: A Tracer
Test for Investigating the Fate and Transport of Contaminants in a Fracture Rock Aquifer.
Kingston.
Anderson, M. A. (2000). Removal of MTBE and other Organic Contaminants From Water by
Sorption to High Silica Zeolites. Environmental Science & Technology , 725-727.
Bergendahl, J., Erdem-Şenatalar, A., Giaya, A., & Thompson, R. (2004). Adorption of MTBE on
Hydrophobic Molecular Sieves. Environmental Engineering Science.
British Zeolite Association. (n.d.). What Are Zeolites? Retrieved October 15, 2008, from British
Zeolite Association: www.bza.org/zeolites.html
Butland, T. D., Abu-Lail, L., & Thompson, R. (2008). Removal of Tertiary Butyl Alcohol from
Water by Adsorption on Zeolites.
California Enivronmental Protection Agency. (n.d.). 2000-10-03 Cleaner-Burning Gasoline
Without MTBE. Retrieved October 15, 2008, from California Air Resources Board:
http://www.arb.ca.gov/fuels/gasoline/cbgmtbe.htm
California EPA. (n.d.). California Air Resources Board. Retrieved October 15, 2008, from
California Environmental Protection Agency: http://www.arb.ca.gov/fuels/gasoline/cbgmtbe.htm
Cejka, J., Bekkum, H. V., & Schuth, F. (2007). Introduction to Zeolite Molecular Sieves.
Elsevier .
Chippindale, A. M., Darlow, D. P., Powell, A. V., & Vaquiero, P. (2004). Solvothermal
Synthesis of Novel Antimony Sulphides Containing [Sb4S7]2− Units. Solid State Ionics , 601-
605.
Chitnisa, G., Degnan, T., & Schipper, P. (2000). History of ZSM-5 fluid catalytic cracking
additive development at Mobil. Elsevier Science.
Clements, M., & Haarhoff, J. (2006). Practical experiences with granular activated carbon
(GAC) at the Rietvlei Water Treatment Plant.
Droste, R. L. (1996). Theory and Practice of Water and Wastewater Treatment. John Wiley &
Sons, Inc.
43
Energy Information Administration. (n.d.). Satus and Impact of State MTBE Bans. Retrieved
October 16, 2008, from http://www.eia.doe.gov/oiaf/servicerpt/mtbeban/table1.html
Hart, C. L. (2003). MTBE Removal with Zero-Valent Iron and Hydrogen Peroxide. Worcester.
ISCID. (n.d.). Hydrophobic. Retrieved October 14, 2008, from International Society of
Complexity, Information, and Design: http://www.iscid.org/encyclopedia/Hydrophobic
Meissner, M., & Voll, A. (n.d.). What is MTBE? Retrieved October 15, 2008, from MTBE
Litigation Info:
http://www.mtbelitigationinfo.com/external/?fuseaction=external.docview&cid=942&documentI
D=72925
Ohio State University. (n.d.). Retrieved December 2008, from Department of Chemistry:
http://www.chemistry.ohio-state.edu/~woodward/ch754/zeoliteA.gif
Rhode Island Department of Environmental Management. (2005). Pascoag Water District Fact
Sheet. Providence.
SIGMA. (n.d.). Weekly Report. Retrieved October 15, 2008, from Society of Independent
Gasoline Marketers of America: http://www.sigma.org/wr/reports/05/050523.html
Slack, M. L. (2004). Chemical Oxidation of Water-Borne Contaminants in a Membrane-Isolated
Domain. Worcester.
The Zeolite Group. (n.d.). Retrieved April 2009, from Mineral Gallery:
http://www.galleries.com/minerals/Silicate/ZEOLITES.htm
U.S. Army Corp of Engineers. (2001). Engineering and Design Adsorption Design Guide.
U.S. Geological Survey. (n.d.). The Atmosphere - A Potential Source of MTBE to Ground Water.
Retrieved October 3, 2008, from United States Geological Survey:
http://toxics.usgs.gov/highlights/mtbe.html
Whittingham, S. (n.d.). Synthesis of Zeolite. Retrieved 2009, from Binghamton University:
http://materials.binghamton.edu/labs/zeolite/zeolite.html
44
Appendix
Appendix 1: Figures
Figure 21: Michelle Slack's COD calibration curve
(Slack, 2004)
y = 0.0005x + 0.0219R² = 0.9855
0
0.05
0.1
0.15
0.2
0 50 100 150 200 250 300 350
Ab
sorb
ance
(1
/cm
)
Concentration of MTBE (mg/L)
COD calibration curve
Michelle L.Slack
Linear (Michelle L.Slack)
45
Appendix 2: Tables
Table 3: COD All Calibration Curve Data
MTBE
concentration
(mg/L)
M. Slack
Absorbance
New Sample
Absorbance
300 0.1845
275
0.1622
250 0.1485
200 0.114
175
0.0868
150 0.0935
100 0.0725
75 0.064
50 0.053 0.0643
37.5 0.0455
25 0.03
Table 4: Weights of Pellets for Time Trial
Old Sample Weight(g)
1 0.0119
2 0.0308
3 0.0165
4 0.0313
5 0.0106
6 0.0133
Average: 0.01907
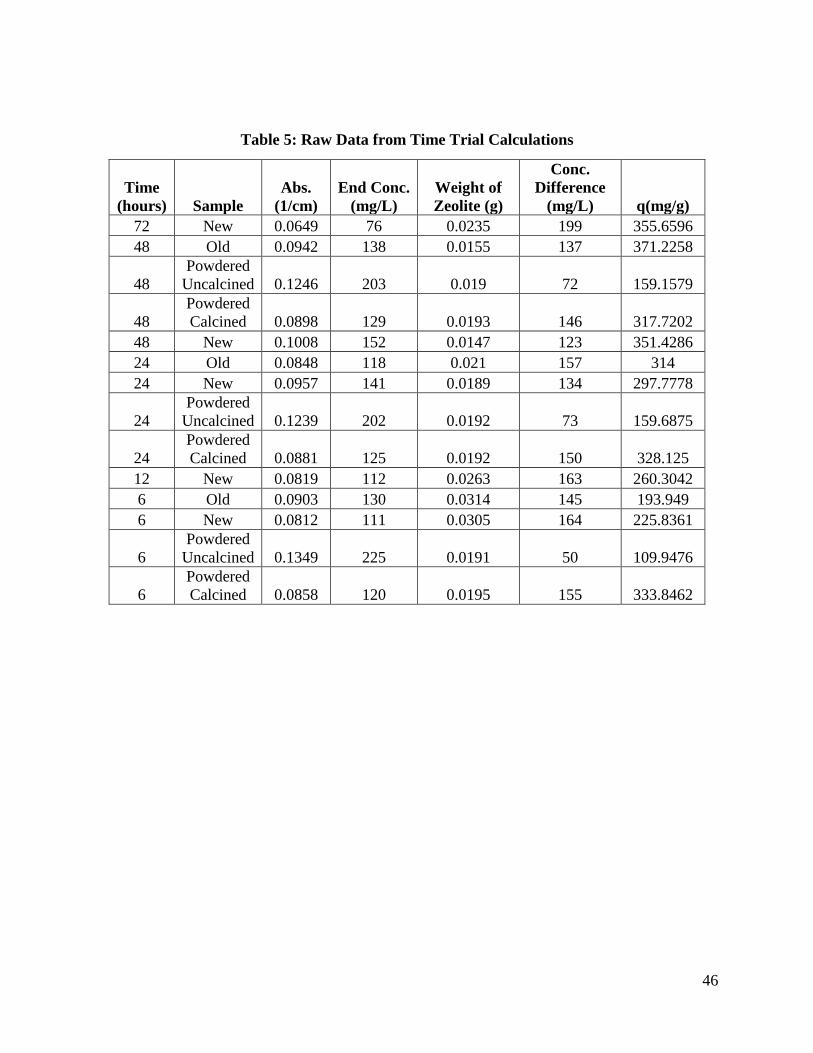
46
Table 5: Raw Data from Time Trial Calculations
Time
(hours) Sample
Abs.
(1/cm)
End Conc.
(mg/L)
Weight of
Zeolite (g)
Conc.
Difference
(mg/L) q(mg/g)
72 New 0.0649 76 0.0235 199 355.6596
48 Old 0.0942 138 0.0155 137 371.2258
48
Powdered
Uncalcined 0.1246 203 0.019 72 159.1579
48
Powdered
Calcined 0.0898 129 0.0193 146 317.7202
48 New 0.1008 152 0.0147 123 351.4286
24 Old 0.0848 118 0.021 157 314
24 New 0.0957 141 0.0189 134 297.7778
24
Powdered
Uncalcined 0.1239 202 0.0192 73 159.6875
24
Powdered
Calcined 0.0881 125 0.0192 150 328.125
12 New 0.0819 112 0.0263 163 260.3042
6 Old 0.0903 130 0.0314 145 193.949
6 New 0.0812 111 0.0305 164 225.8361
6
Powdered
Uncalcined 0.1349 225 0.0191 50 109.9476
6
Powdered
Calcined 0.0858 120 0.0195 155 333.8462
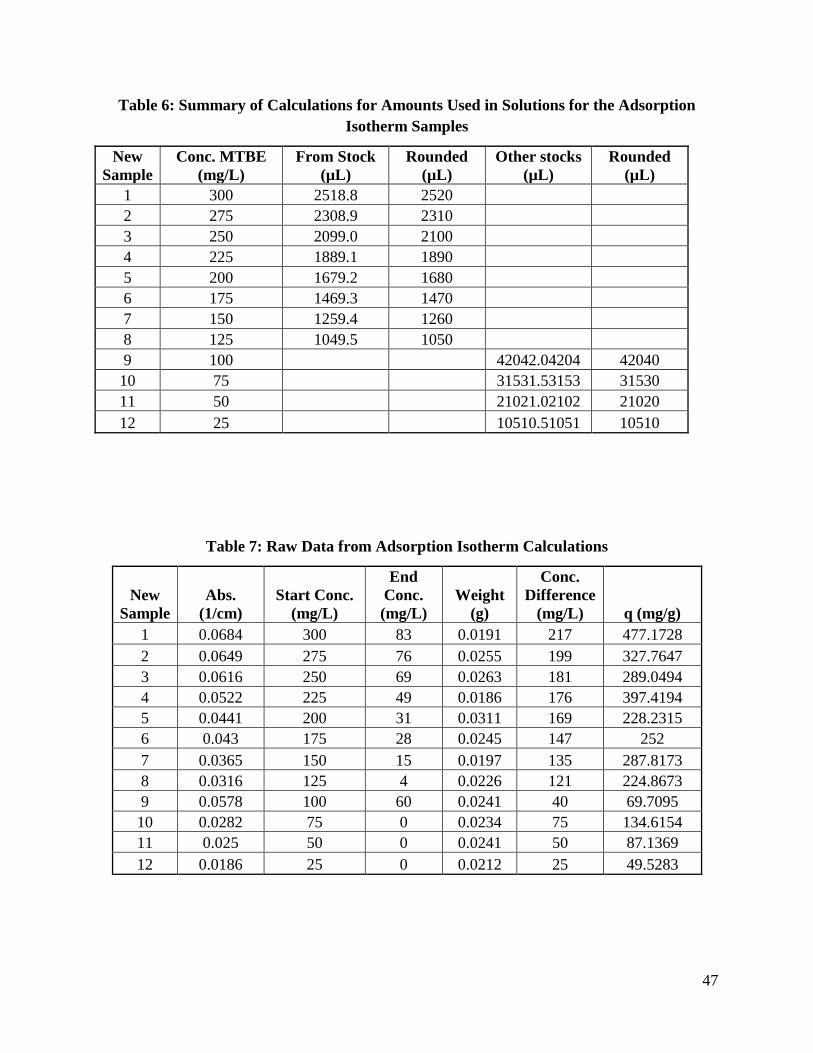
47
Table 6: Summary of Calculations for Amounts Used in Solutions for the Adsorption
Isotherm Samples
New
Sample
Conc. MTBE
(mg/L)
From Stock
(µL)
Rounded
(µL)
Other stocks
(µL)
Rounded
(µL)
1 300 2518.8 2520
2 275 2308.9 2310
3 250 2099.0 2100
4 225 1889.1 1890
5 200 1679.2 1680
6 175 1469.3 1470
7 150 1259.4 1260
8 125 1049.5 1050
9 100
42042.04204 42040
10 75
31531.53153 31530
11 50
21021.02102 21020
12 25
10510.51051 10510
Table 7: Raw Data from Adsorption Isotherm Calculations
New
Sample
Abs.
(1/cm)
Start Conc.
(mg/L)
End
Conc.
(mg/L)
Weight
(g)
Conc.
Difference
(mg/L) q (mg/g)
1 0.0684 300 83 0.0191 217 477.1728
2 0.0649 275 76 0.0255 199 327.7647
3 0.0616 250 69 0.0263 181 289.0494
4 0.0522 225 49 0.0186 176 397.4194
5 0.0441 200 31 0.0311 169 228.2315
6 0.043 175 28 0.0245 147 252
7 0.0365 150 15 0.0197 135 287.8173
8 0.0316 125 4 0.0226 121 224.8673
9 0.0578 100 60 0.0241 40 69.7095
10 0.0282 75 0 0.0234 75 134.6154
11 0.025 50 0 0.0241 50 87.1369
12 0.0186 25 0 0.0212 25 49.5283
48
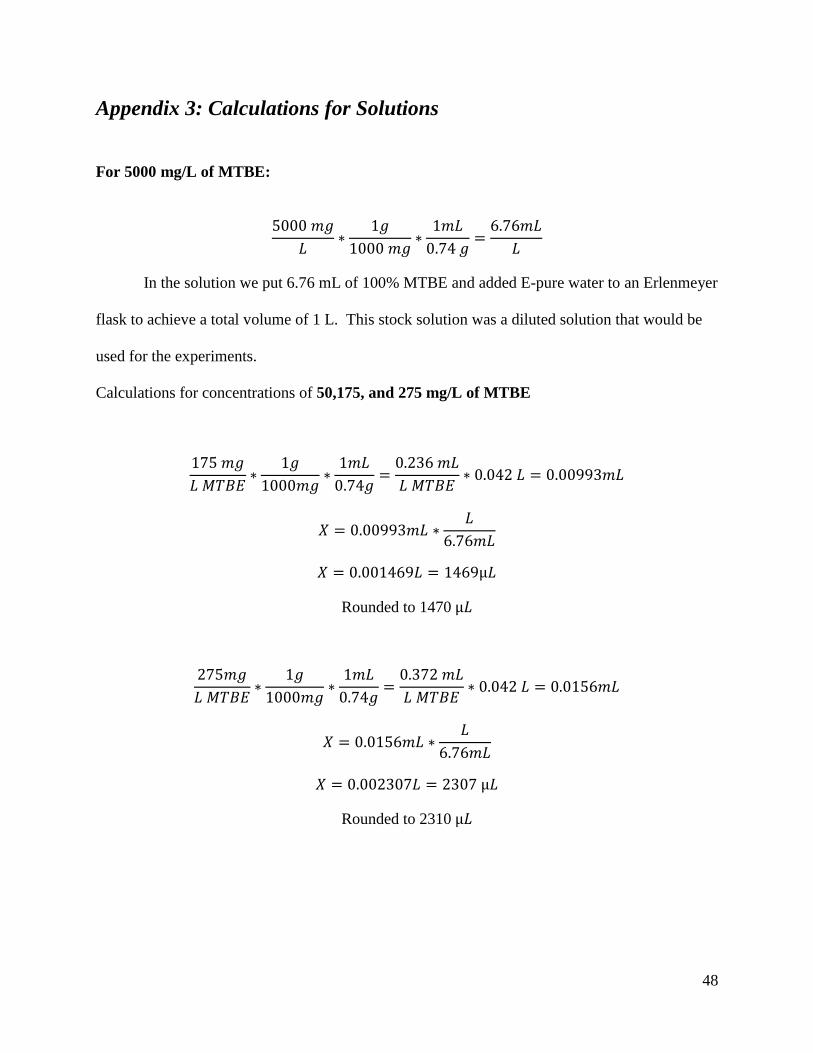
Appendix 3: Calculations for Solutions
For 5000 mg/L of MTBE:
5000 𝑚𝑔
𝐿∗
1𝑔
1000 𝑚𝑔∗
1𝑚𝐿
0.74 𝑔=
6.76𝑚𝐿
𝐿
In the solution we put 6.76 mL of 100% MTBE and added E-pure water to an Erlenmeyer
flask to achieve a total volume of 1 L. This stock solution was a diluted solution that would be
used for the experiments.
Calculations for concentrations of 50,175, and 275 mg/L of MTBE
175 𝑚𝑔
𝐿 𝑀𝑇𝐵𝐸∗
1𝑔
1000𝑚𝑔∗
1𝑚𝐿
0.74𝑔=
0.236 𝑚𝐿
𝐿 𝑀𝑇𝐵𝐸∗ 0.042 𝐿 = 0.00993𝑚𝐿
𝑋 = 0.00993𝑚𝐿 ∗𝐿
6.76𝑚𝐿
𝑋 = 0.001469𝐿 = 1469µ𝐿
Rounded to 1470 µ𝐿
275𝑚𝑔
𝐿 𝑀𝑇𝐵𝐸∗
1𝑔
1000𝑚𝑔∗
1𝑚𝐿
0.74𝑔=
0.372 𝑚𝐿
𝐿 𝑀𝑇𝐵𝐸∗ 0.042 𝐿 = 0.0156𝑚𝐿
𝑋 = 0.0156𝑚𝐿 ∗𝐿
6.76𝑚𝐿
𝑋 = 0.002307𝐿 = 2307 µ𝐿
Rounded to 2310 µ𝐿
49
For solutions of 100 and less, specific calculations need to be done as to make sure there
was enough MTBE to be traced. The calculations were for double the amount of MTBE for half
the volume.
For 50 ppm in a 42 mL vial, a concentration was 100 ppm in 21mL was used.
The stock solution was calculated by:
100𝑚𝑔
𝐿∗
1𝑔
1000𝑚𝑔∗
1𝑚𝐿
0.74𝑔=
0.135𝑚𝐿
𝐿
100 𝑚𝑔
𝐿 𝑀𝑇𝐵𝐸∗
1𝑔
1000𝑚𝑔∗
1𝑚𝐿
0.74𝑔=
0.135 𝑚𝐿
𝐿 𝑀𝑇𝐵𝐸∗ 0.021 𝐿 = 0.002838𝑚𝐿
𝑋 = 0.002838𝑚𝐿 ∗𝐿
0.135𝑚𝐿
𝑋 = 0.021021𝐿 = 21,021µ𝐿
The amounts obtained were the amounts used that were taken from the stock solution for
specific concentrations.
50
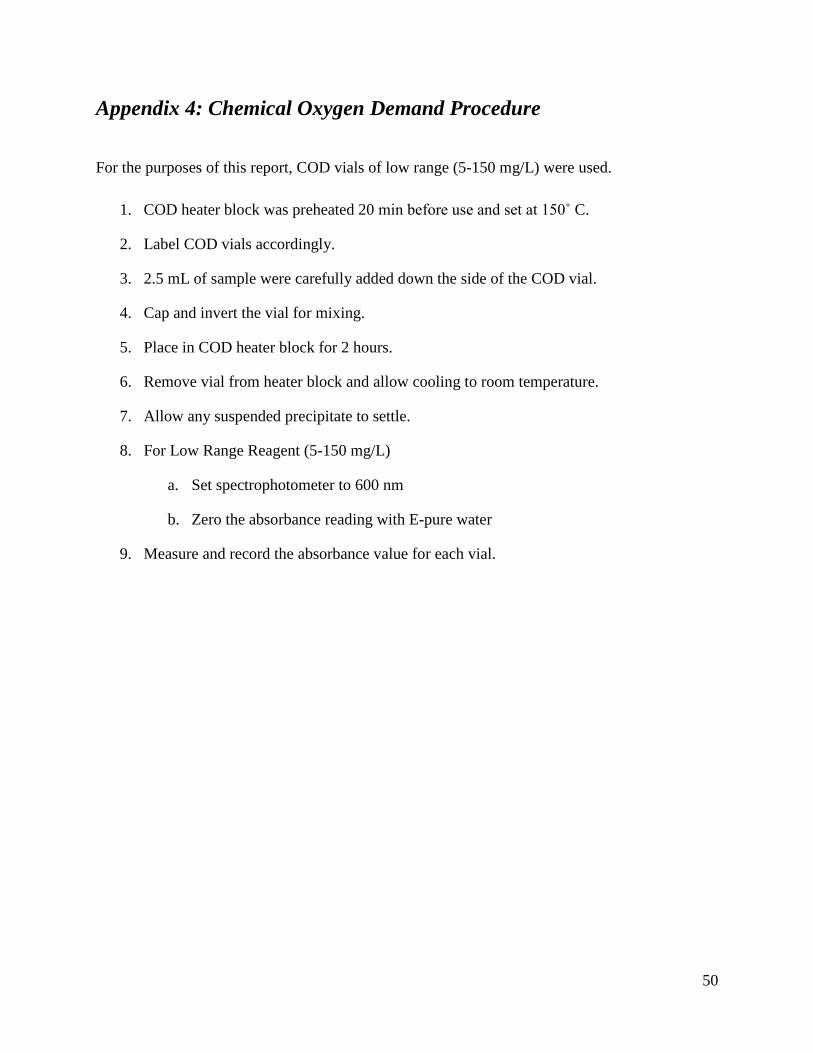
Appendix 4: Chemical Oxygen Demand Procedure
For the purposes of this report, COD vials of low range (5-150 mg/L) were used.
1. COD heater block was preheated 20 min before use and set at 150˚ C.
2. Label COD vials accordingly.
3. 2.5 mL of sample were carefully added down the side of the COD vial.
4. Cap and invert the vial for mixing.
5. Place in COD heater block for 2 hours.
6. Remove vial from heater block and allow cooling to room temperature.
7. Allow any suspended precipitate to settle.
8. For Low Range Reagent (5-150 mg/L)
a. Set spectrophotometer to 600 nm
b. Zero the absorbance reading with E-pure water
9. Measure and record the absorbance value for each vial.
51
Appendix 5: Reference Images
Figure 22: Theoretical XRD for Calcined ZSM-5