adhesion - considerations, testing and interpretation shear force 2. ... constant rate displacement...
TRANSCRIPT

3M Renewable Energy DivisionNREL PV Module Reliability Workshop (Feb 24, 2015) Adhesion - Considerations, Testing and Interpretation
Presenter Scott R. Meyer: Senior Specialist-Product and Application Development Engineer; 3M headquarters in St. Paul, MN, USA; Chemical Engineer B.S. degree from Iowa State University, 1985; 28 years at 3M Company in various divisions; experience with PSA tapes, epoxies, urethanes and fluoroelastomers; ~20 years of Experience with Adhesives; 6 years of tapes and adhesives experience related to the solar industry.
© 3M 2013. All rights reserved.
7 March
Topics:
1. Adhesion and Testing • Failure Modes • Types of Forces • Types of testing
2. Material & Adhesive Characteristics • Perform differently – Difficult to compare materials
3. Many Variables Impact Test Results and Performance • Material types • Time & Temperature • Environmental • Aging (outside scope of this discussion)
4. Rigid PV Module Application • Relevant Forces & Testing
© 3M 2015. All Rights Reserved. 2
7 March
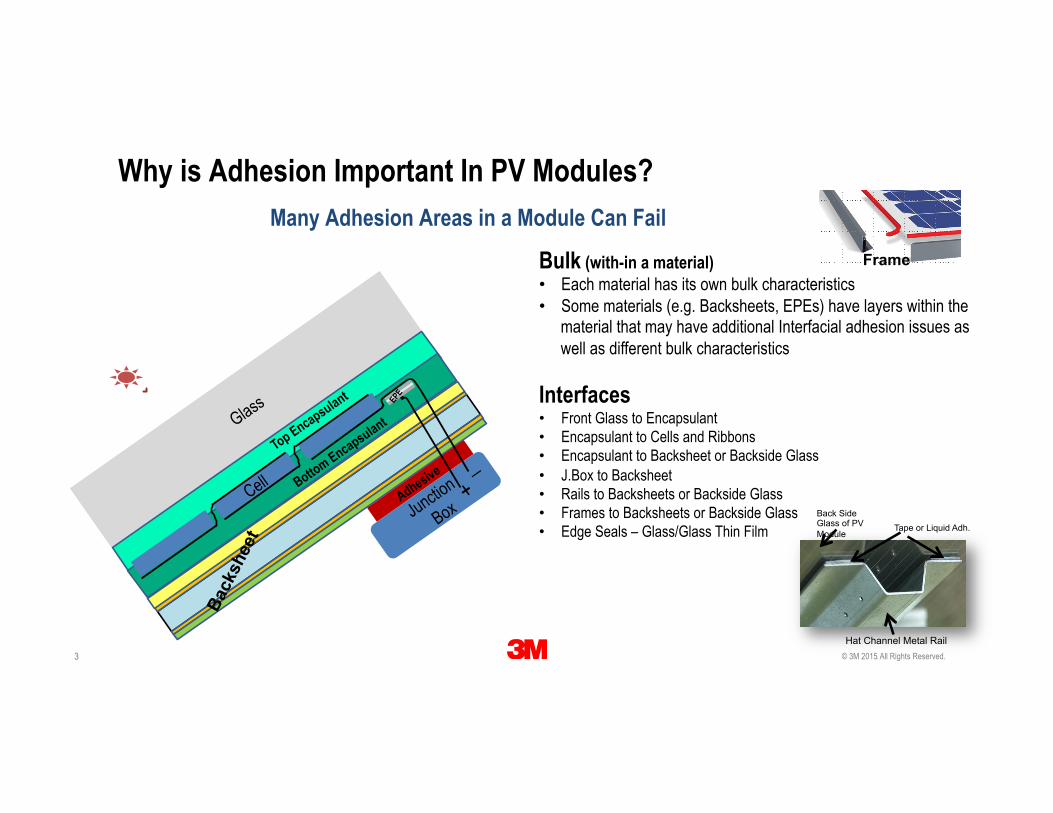
Why is Adhesion Important In PV Modules? Many Adhesion Areas in a Module Can Fail
Bulk (with-in a material) Frame • Each material has its own bulk characteristics • Some materials (e.g. Backsheets, EPEs) have layers within the
material that may have additional Interfacial adhesion issues as well as different bulk characteristics
Interfaces • Front Glass to Encapsulant • Encapsulant to Cells and Ribbons • Encapsulant to Backsheet or Backside Glass • J.Box to Backsheet • Rails to Backsheets or Backside Glass • Frames to Backsheets or Backside Glass Back Side
• Edge Seals – Glass/Glass Thin Film
2015. All Rights Reserved. © 3M
Glass of PV Module
Hat Channel Metal Rail
Tape or Liquid Adh.
3
7 March
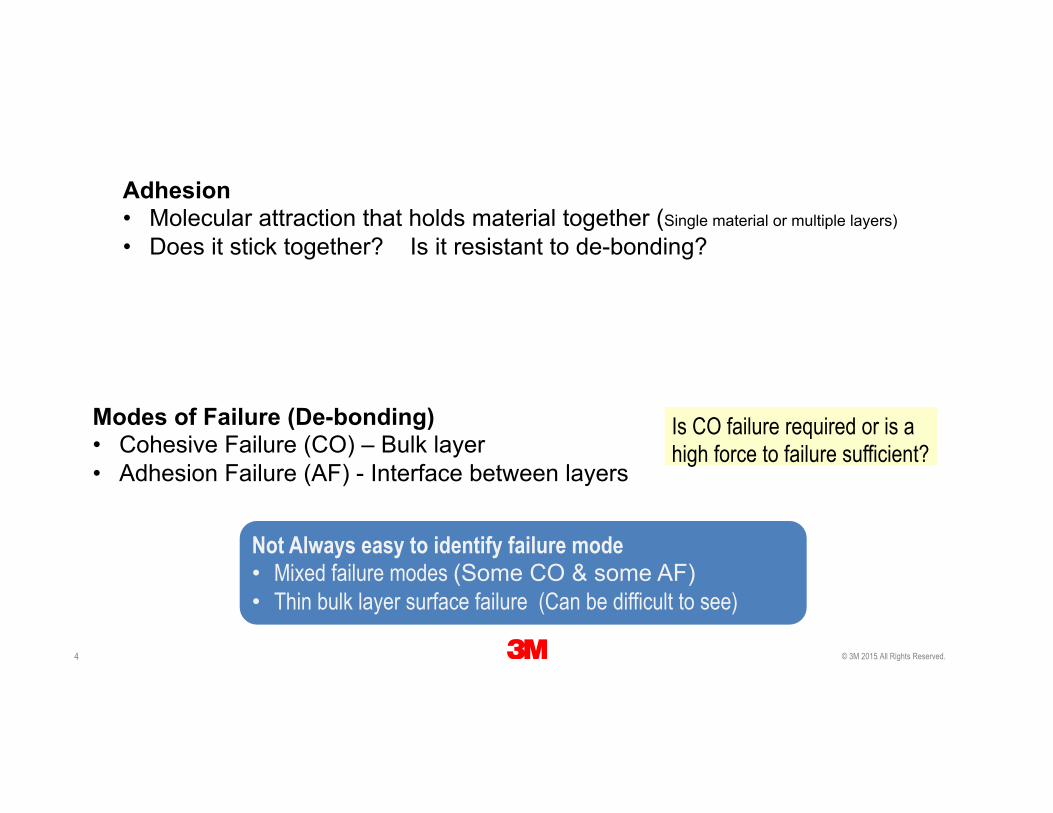
Adhesion • Molecular attraction that holds material together (Single material or multiple layers)
• Does it stick together? Is it resistant to de-bonding?
Modes of Failure (De-bonding) Is CO failure required or is a • Cohesive Failure (CO) – Bulk layer high force to failure sufficient? • Adhesion Failure (AF) - Interface between layers
4 2015. All Rights Reserved. © 3M
Not Always easy to identify failure mode • Mixed failure modes (Some CO & some AF) • Thin bulk layer surface failure (Can be difficult to see)
7 March
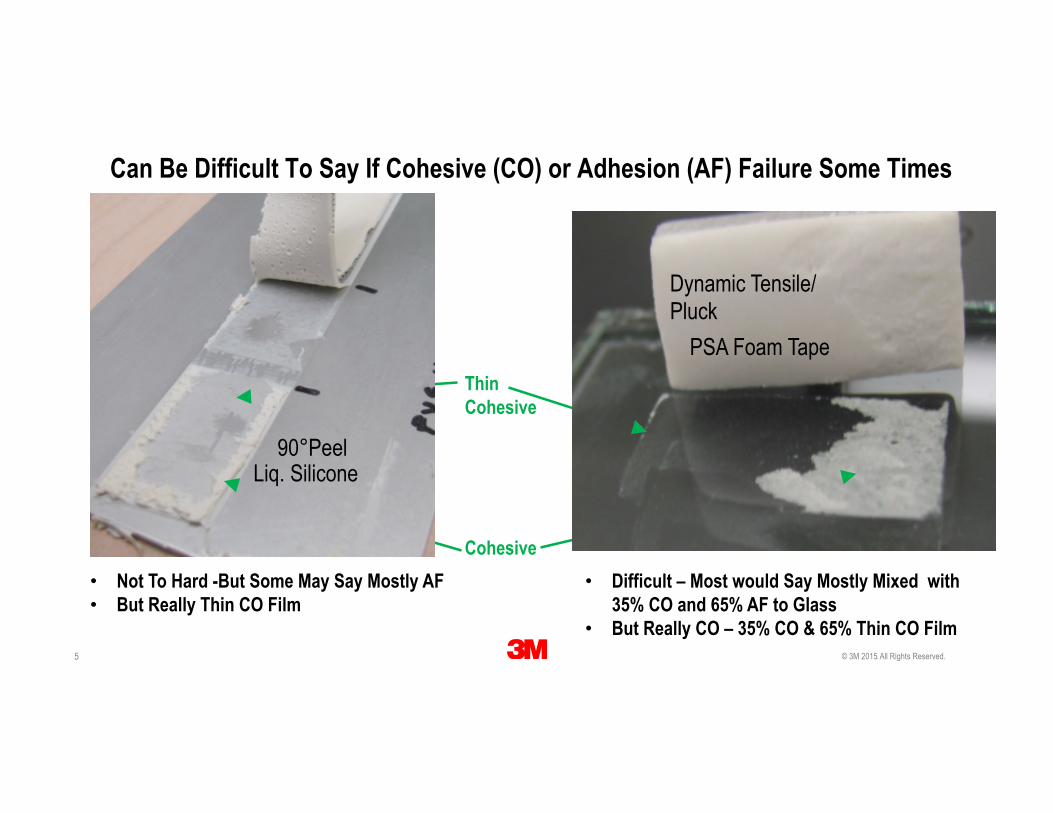
Can Be Difficult To Say If Cohesive (CO) or Adhesion (AF) Failure Some Times
Thin Cohesive
Cohesive
© 3M 2015. All Rights Reserved.
Liq. Silicone 90°Peel
• Not To Hard -But Some May Say Mostly AF • But Really Thin CO Film
PSA Foam Tape
Dynamic Tensile/ Pluck
• Difficult – Most would Say Mostly Mixed with 35% CO and 65% AF to Glass
• But Really CO – 35% CO & 65% Thin CO Film 5
7 March
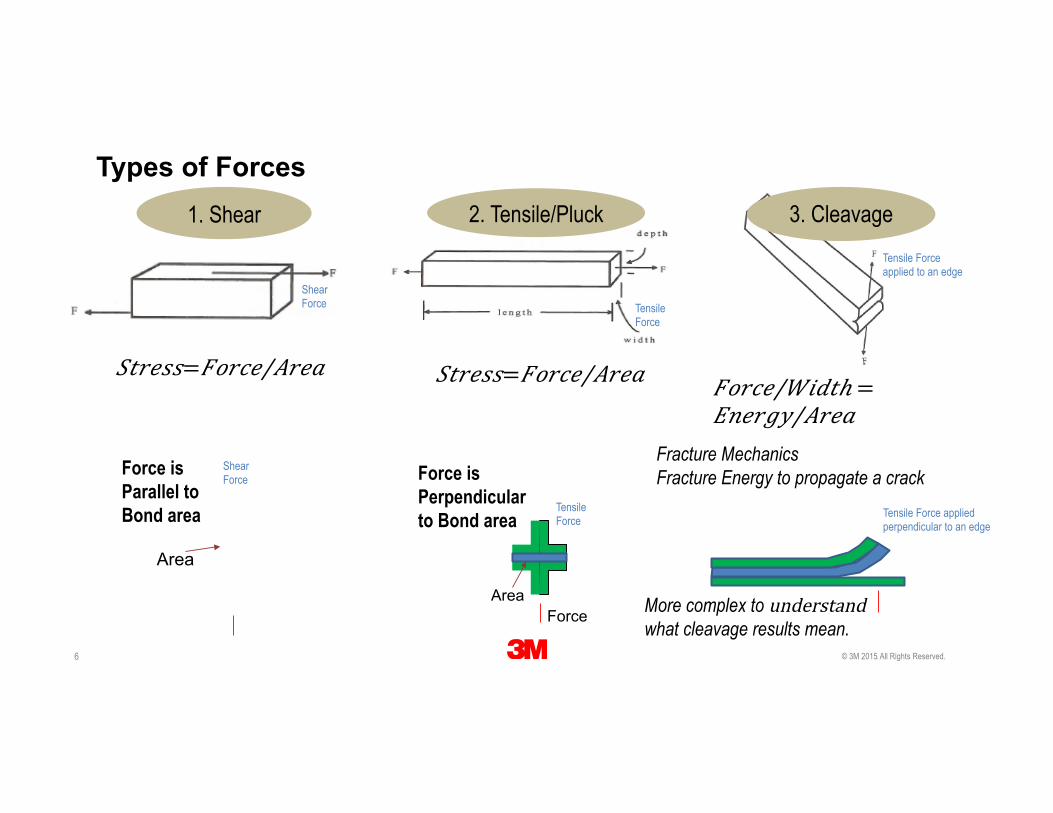
Types of Forces
1. Shear
Shear Force
2. Tensile/Pluck
Tensile Force
ile Force lied to an edge
𝑆𝑡𝑟𝑒𝑠𝑠= 𝐹𝑜𝑟𝑐𝑒/𝐴𝑟𝑒𝑎 𝑆𝑡𝑟𝑒𝑠𝑠= 𝐹𝑜𝑟𝑐𝑒/𝐴𝑟𝑒𝑎 𝐹𝑜𝑟𝑐𝑒/𝑊𝑖𝑑𝑡ℎ = 𝐸𝑛𝑒𝑟𝑔𝑦/𝐴𝑟𝑒𝑎
3. Cleavage Tensapp
Shear Force
Fracture Mechanics Force is Force is Fracture Energy to propagate a crack Parallel to Perpendicular Tensile Tensile Force applied Bond area Force to Bond area perpendicular to an edge
Area
Area More complex to understand Force what cleavage results mean.
© 3M 2015. All Rights Reserved. 6
7 March
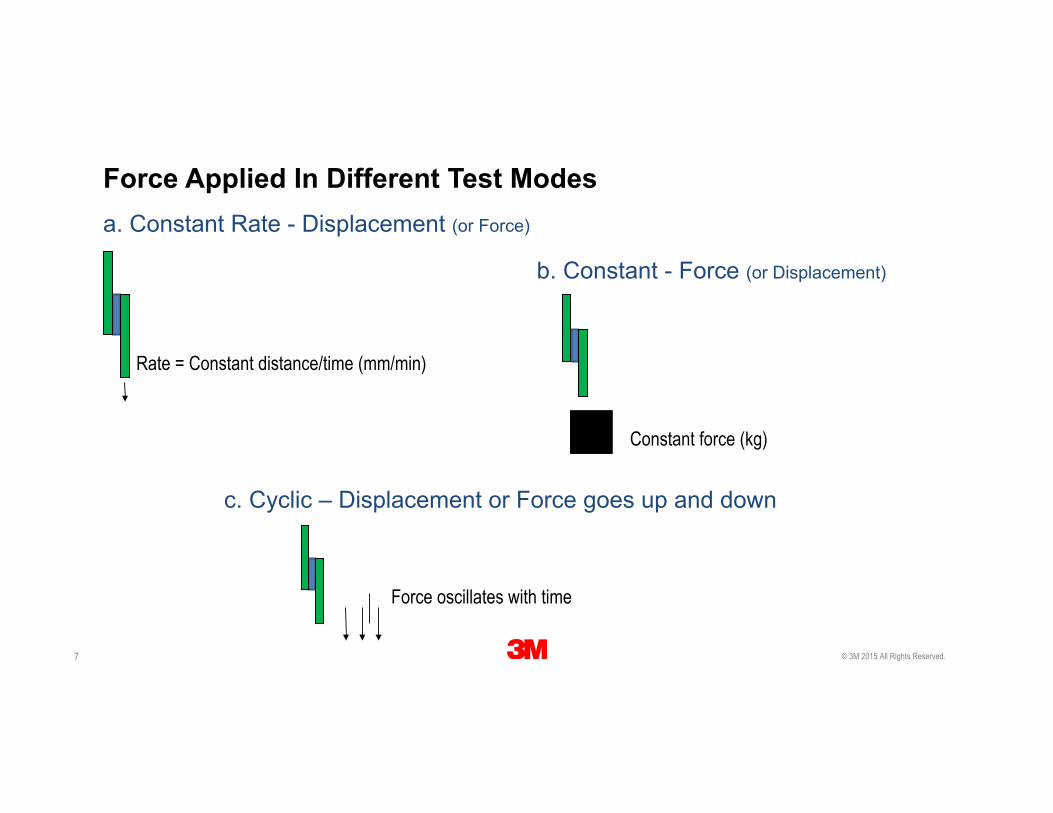
Force Applied In Different Test Modes a. Constant Rate - Displacement (or Force)
b. Constant - Force (or Displacement)
Rate = Constant distance/time (mm/min)
Constant force (kg)
c. Cyclic – Displacement or Force goes up and down
Force oscillates with time
© 3M 2015. All Rights Reserved. 7
8 7 March
Static Overlap Shear
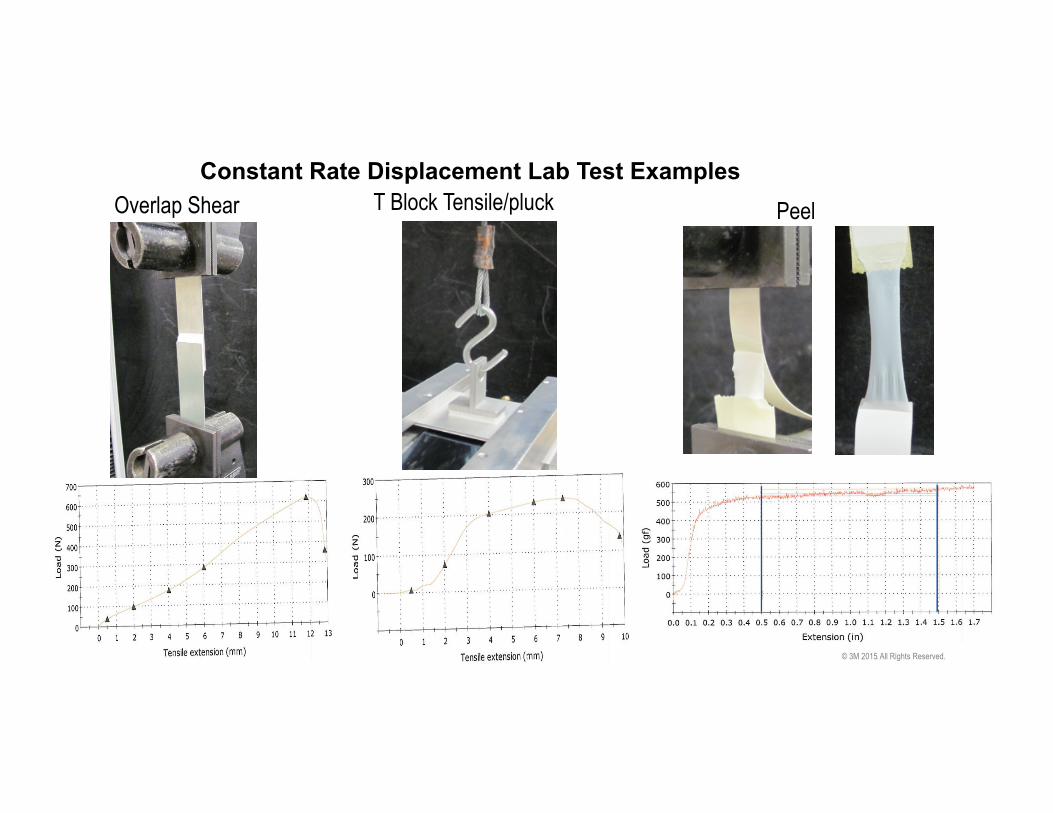
Constant Rate Displacement Lab Test Examples
Overlap Shear T Block Tensile/pluck Peel
© 3M 2015. All Rights Reserved.
7 March
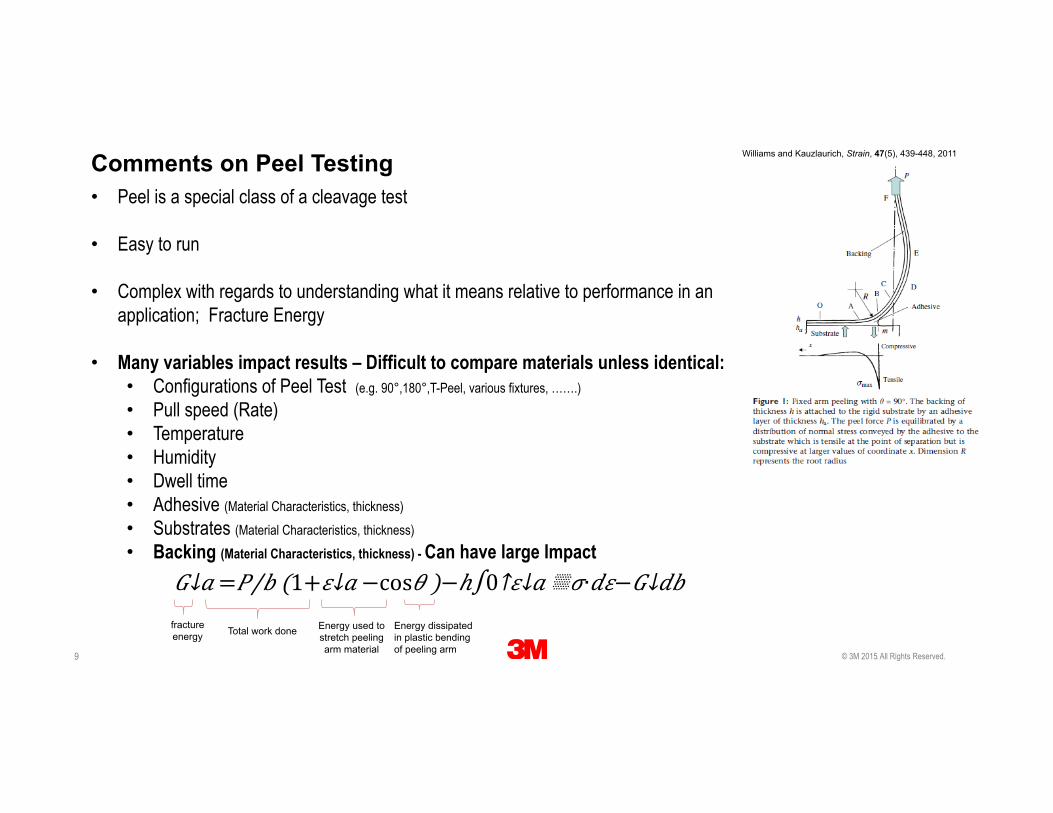
Williams and Kauzlaurich, Strain, 47(5), 439-448, 2011 Comments on Peel Testing • Peel is a special class of a cleavage test
• Easy to run
• Complex with regards to understanding what it means relative to performance in an application; Fracture Energy
• Many variables impact results – Difficult to compare materials unless identical: • Configurations of Peel Test (e.g. 90°,180°,T-Peel, various fixtures, …….) • Pull speed (Rate) • Temperature • Humidity • Dwell time • Adhesive (Material Characteristics, thickness) • Substrates (Material Characteristics, thickness) • Backing (Material Characteristics, thickness) - Can have large Impact
𝐺↓𝑎 = 𝑃/𝑏 (1+ 𝜀↓𝑎 −cos𝜃 ) −ℎ∫0↑𝜀↓𝑎 ▒𝜎∙𝑑𝜀− 𝐺↓𝑑𝑏 fracture Energy used to Energy dissipated Total work done energy stretch peeling in plastic bending
arm material of peeling arm © 3M 2015. All Rights Reserved. 9
7 March
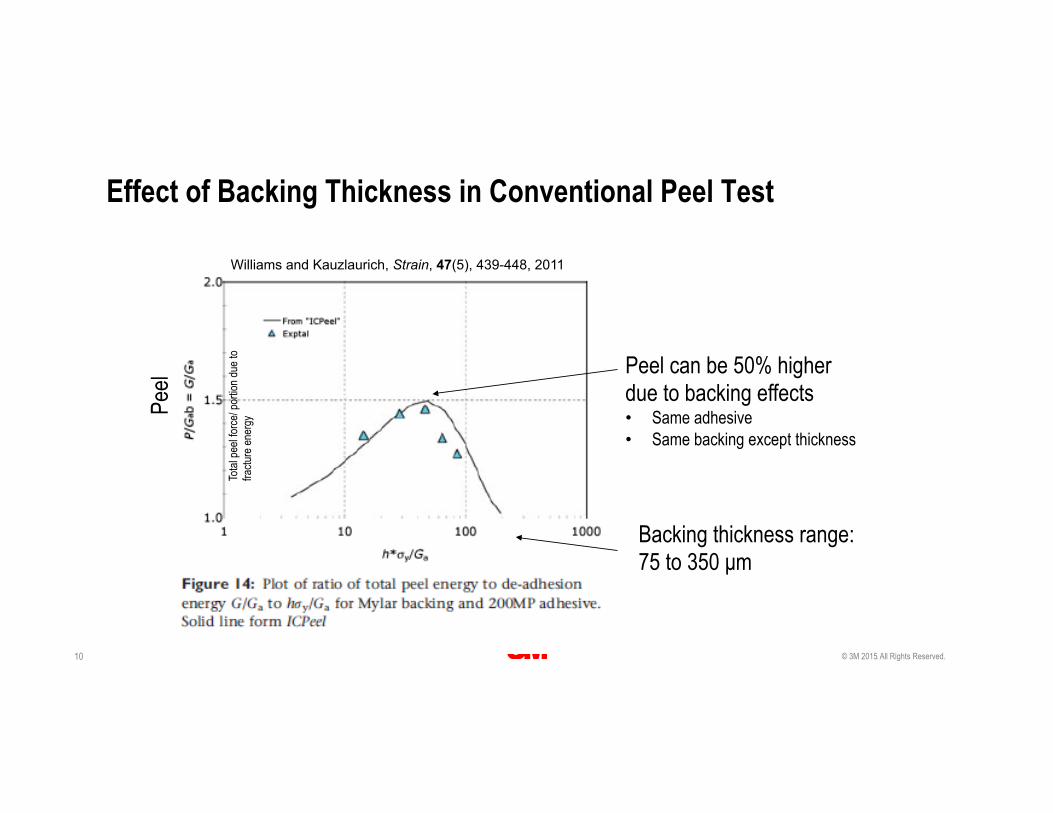
Effect of Backing Thickness in Conventional Peel Test
Peel can be 50% higher due to backing effects • Same adhesive • Same backing except thickness
Backing thickness range: 75 to 350 µm
© 3M 2015. All Rights Reserved. 10
Williams and Kauzlaurich, Strain, 47(5), 439-448, 2011
Total
peel
force
/ por
tion d
ue to
fractu
re en
ergy
Peel
7 March
Comments on Peel Testing (Continued) • Peel may not be the best test to use to simulate the forces of PV module applications
• Be cautious in the interpretation of peel data; conclusions can be misleading
Only thing worse than no data is “bad” or misleading data !
When to use peel: 1. Understanding the impact of dwell on adhesion build – How much time should you give something
to reach its best interfacial adhesion?
2. QC tests during manufacturing of an adhesive or identical construction - Are things changing?
3. If application is in a peel mode
© 3M 2015. All Rights Reserved. 11
7 March
Static Overlap Shear
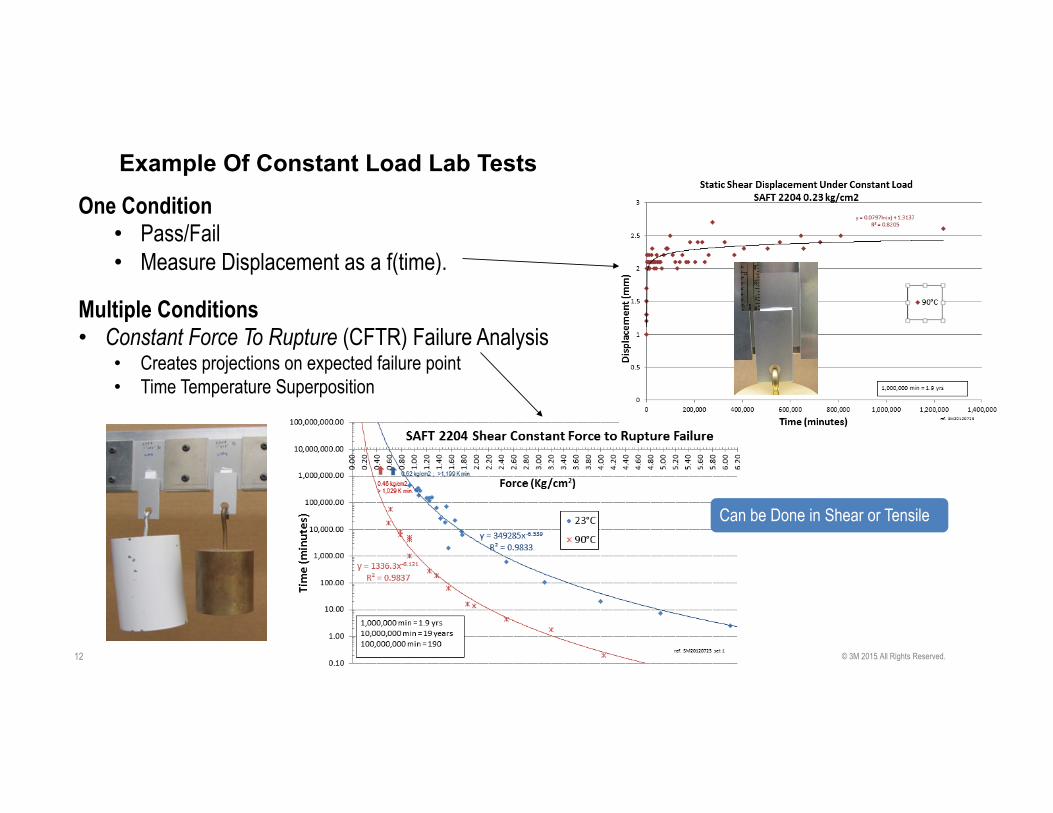
Example Of Constant Load Lab Tests
One Condition • Pass/Fail • Measure Displacement as a f(time).
Multiple Conditions • Constant Force To Rupture (CFTR) Failure Analysis
• Creates projections on expected failure point • Time Temperature Superposition
© 3M 2015. All Rights Reserved.
Can be Done in Shear or Tensile
12
13 7 March 2015 . All Rights Reserved. © 3M
Adhesive Types
Adhesive State Changes – During Bonding § Curing Liquids
― forms bond in liquid (unreacted) state; Crosslinks during cure ― e.g. epoxies, reactive polyurethanes ― Some may become glassy (e.g. structural epoxy & acrylics)
§ Hot Melt Adhesives (thermoplastics) ― melt crystals to form bond; solidifies on cooling to give strength ― Can have crosslinking (e.g. encapsulants) ― e.g. polyamides, thermoplastic polyurethanes, polyolefins
No Change in Adhesive State – During Bonding § Pressure Sensitive Adhesives (PSA)
― forms bond with contact time and pressure ― relies on viscoelasticity to provide resistance to debonding
14 7 March 2015 . All Rights Reserved. © 3M
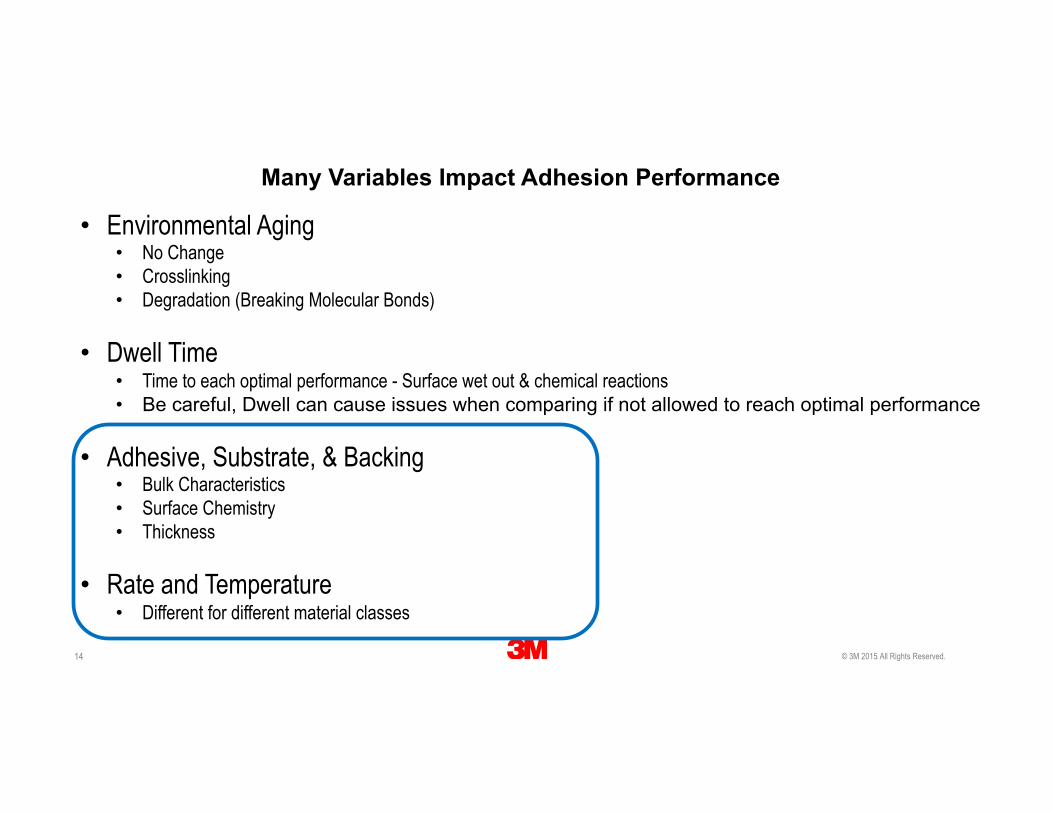
Many Variables Impact Adhesion Performance
• Environmental Aging • No Change • Crosslinking • Degradation (Breaking Molecular Bonds)
• Dwell Time • Time to each optimal performance - Surface wet out & chemical reactions • Be careful, Dwell can cause issues when comparing if not allowed to reach optimal performance
• Adhesive, Substrate, & Backing • Bulk Characteristics • Surface Chemistry • Thickness
• Rate and Temperature • Different for different material classes
15 7 March 2015 . All Rights Reserved. © 3M
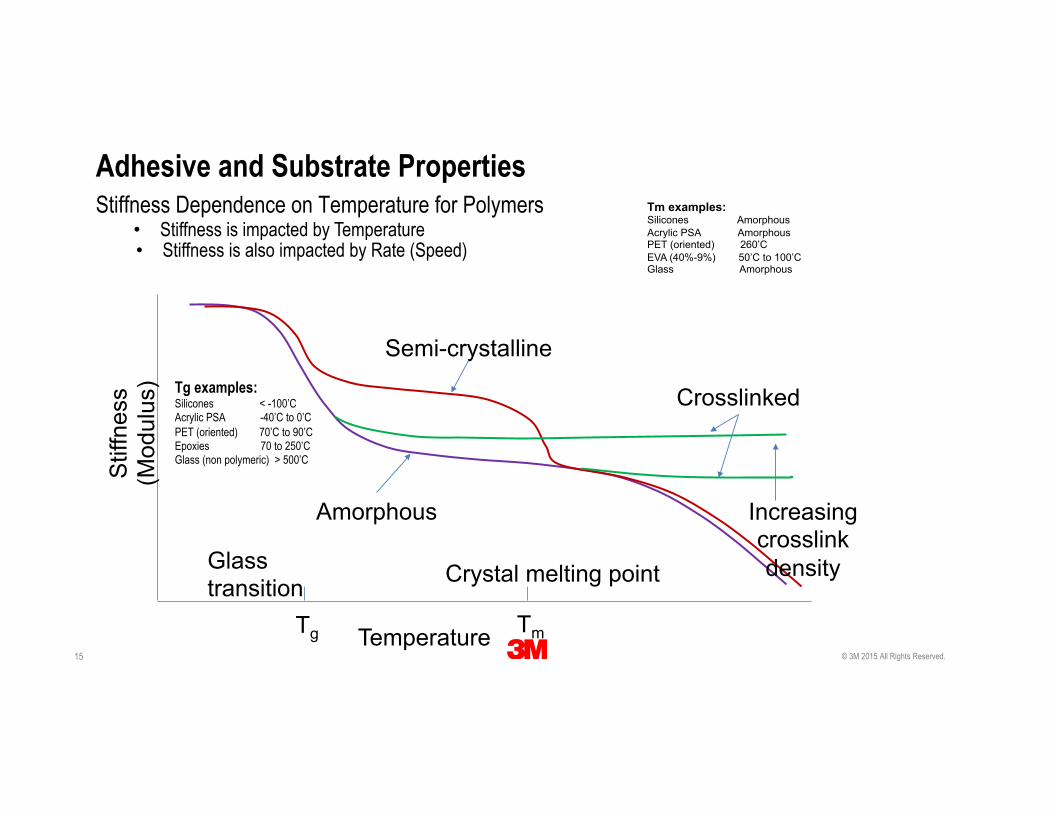
Stiffness Dependence on Temperature for Polymers
Temperature
Stif
fnes
s (M
odul
us)
Amorphous
Semi-crystalline
Crosslinked
Increasing crosslink density
Tg Tm
Glass transition Crystal melting point
Adhesive and Substrate Properties
• Stiffness is impacted by Temperature • Stiffness is also impacted by Rate (Speed)
Tg examples: Silicones < -100’C Acrylic PSA -40’C to 0’C PET (oriented) 70’C to 90’C Epoxies 70 to 250’C Glass (non polymeric) > 500’C
Tm examples: Silicones Amorphous Acrylic PSA Amorphous PET (oriented) 260’C EVA (40%-9%) 50’C to 100’C Glass Amorphous
16 7 March 2015 . All Rights Reserved. © 3M
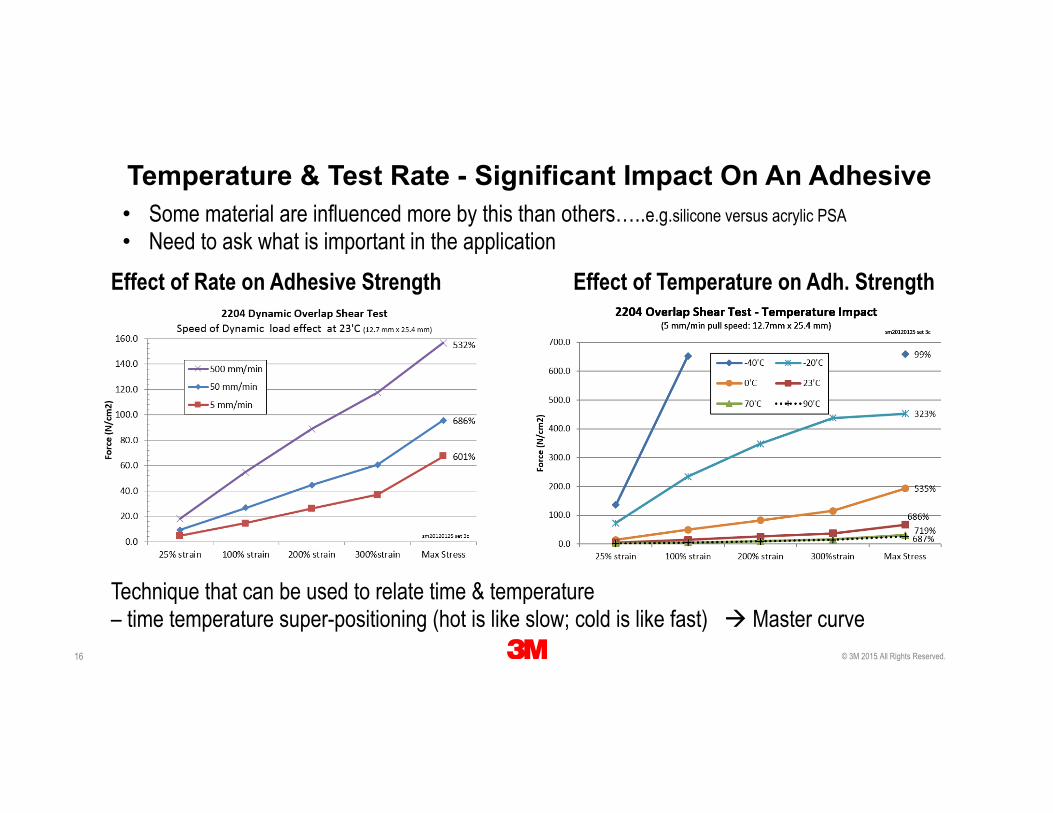
Temperature & Test Rate - Significant Impact On An Adhesive
Effect of Rate on Adhesive Strength Effect of Temperature on Adh. Strength
• Some material are influenced more by this than others…..e.g.silicone versus acrylic PSA • Need to ask what is important in the application
Technique that can be used to relate time & temperature – time temperature super-positioning (hot is like slow; cold is like fast) à Master curve
17 7 March 2015 . All Rights Reserved. © 3M
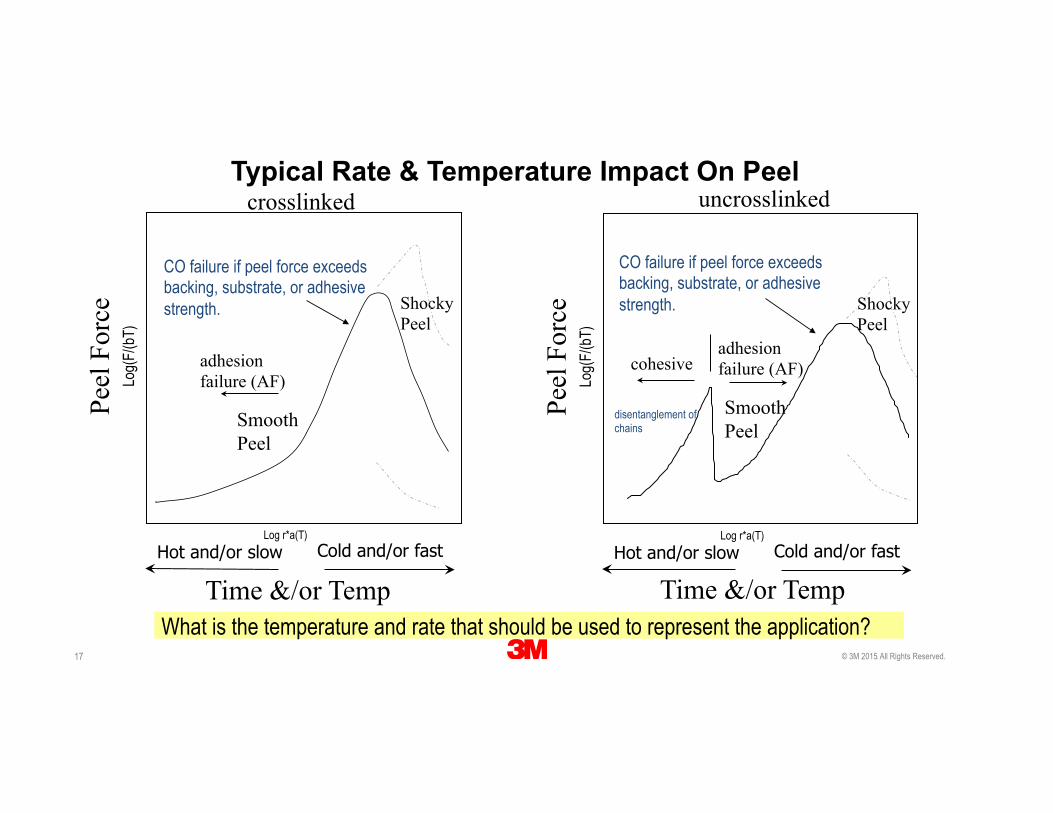
Typical Rate & Temperature Impact On Peel
What is the temperature and rate that should be used to represent the application?
uncrosslinked
cohesive
disentanglement of chains
Peel
For
ce Shocky
Peel adhesion failure (AF)
Smooth Peel
Cold and/or fast Hot and/or slow
CO failure if peel force exceeds backing, substrate, or adhesive strength.
Log(
F/(b
T)
Log r*a(T)
Time &/or Temp
Peel
For
ce
crosslinked
Shocky Peel
adhesion failure (AF)
Smooth Peel
Cold and/or fast Hot and/or slow
CO failure if peel force exceeds backing, substrate, or adhesive strength.
Log(
F/(b
T)
Log r*a(T)
Time &/or Temp
18 7 March 2015 . All Rights Reserved. © 3M
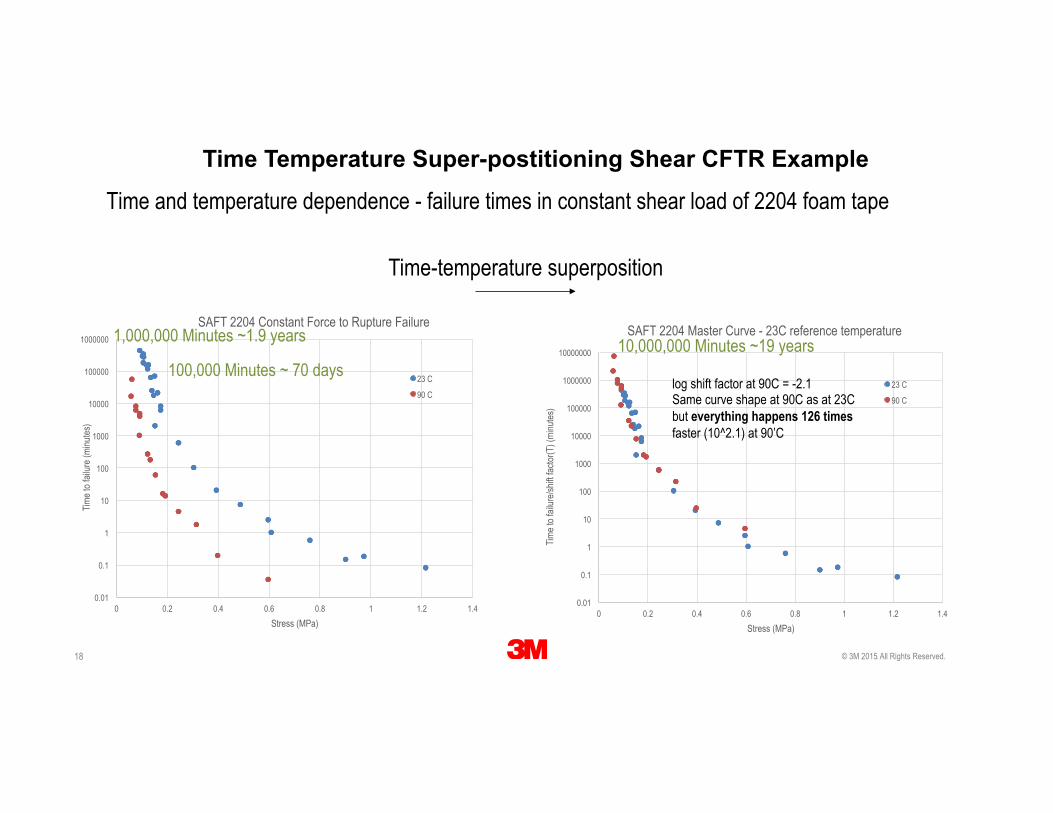
Time and temperature dependence - failure times in constant shear load of 2204 foam tape
0.01
0.1
1
10
100
1000
10000
100000
1000000
0 0.2 0.4 0.6 0.8 1 1.2 1.4
Time t
o fail
ure (
minu
tes)
Stress (MPa)
SAFT 2204 Constant Force to Rupture Failure
23 C
90 C
0.01
0.1
1
10
100
1000
10000
100000
1000000
10000000
0 0.2 0.4 0.6 0.8 1 1.2 1.4
Time t
o fail
ure/s
hift fa
ctor(T
) (mi
nutes
)
Stress (MPa)
SAFT 2204 Master Curve - 23C reference temperature
23 C
90 C log shift factor at 90C = -2.1 Same curve shape at 90C as at 23C but everything happens 126 times faster (10^2.1) at 90’C
Time-temperature superposition
Time Temperature Super-postitioning Shear CFTR Example
10,000,000 Minutes ~19 years 1,000,000 Minutes ~1.9 years
100,000 Minutes ~ 70 days
19 7 March 2015 . All Rights Reserved. © 3M
When does time-temperature superposition not work?
§ Semi-crystalline materials ― Not work with materials that are Crystalline - melting of crystal phase produces softening
that will not be seen below Tm regardless of time scale of test
§ Multi-phase materials ― different phases have different sensitivity to temperature
§ Temperature causes irreversible changes/degradation of material
Time Temperature Super-posititioning – When It Doesn’t Work
20 7 March 2015 . All Rights Reserved. © 3M
Each Application is Unique - Need to ask the following
Ø What are the critical forces that can cause failure? • Type - Shear, Tensile, Cleavage • Mode - Constant Load, Constant Rate, cyclic • Limit - maximum forces requirement
Ø What are reasonable tests that can be run to help get a perspective on performance? • Usually have to make compromises to do the best you can on a small scale • Need to validate &/or correlation with field results
21 7 March 2015 . All Rights Reserved. © 3M
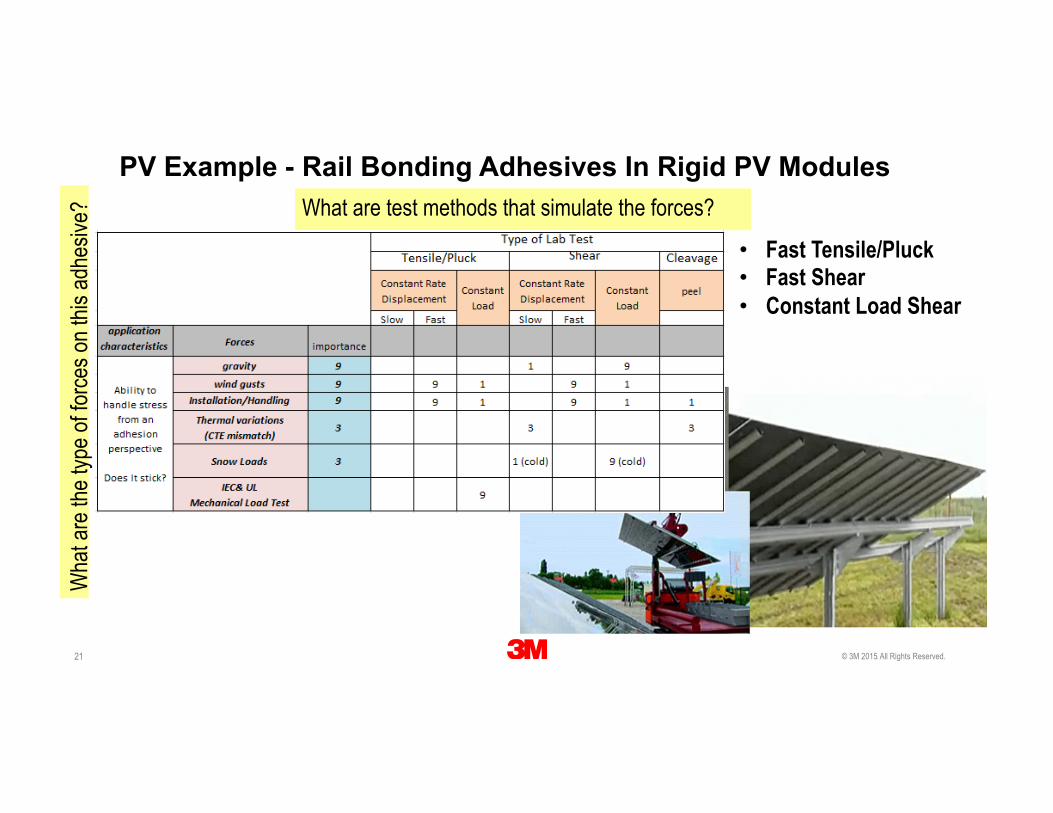
PV Example - Rail Bonding Adhesives In Rigid PV Modules
Tape or Liquid Adh.
Wha
t are
the t
ype o
f force
s on t
his ad
hesiv
e? What are test methods that simulate the forces?
• Fast Tensile/Pluck • Fast Shear • Constant Load Shear
22 7 March 2015 . All Rights Reserved. © 3M
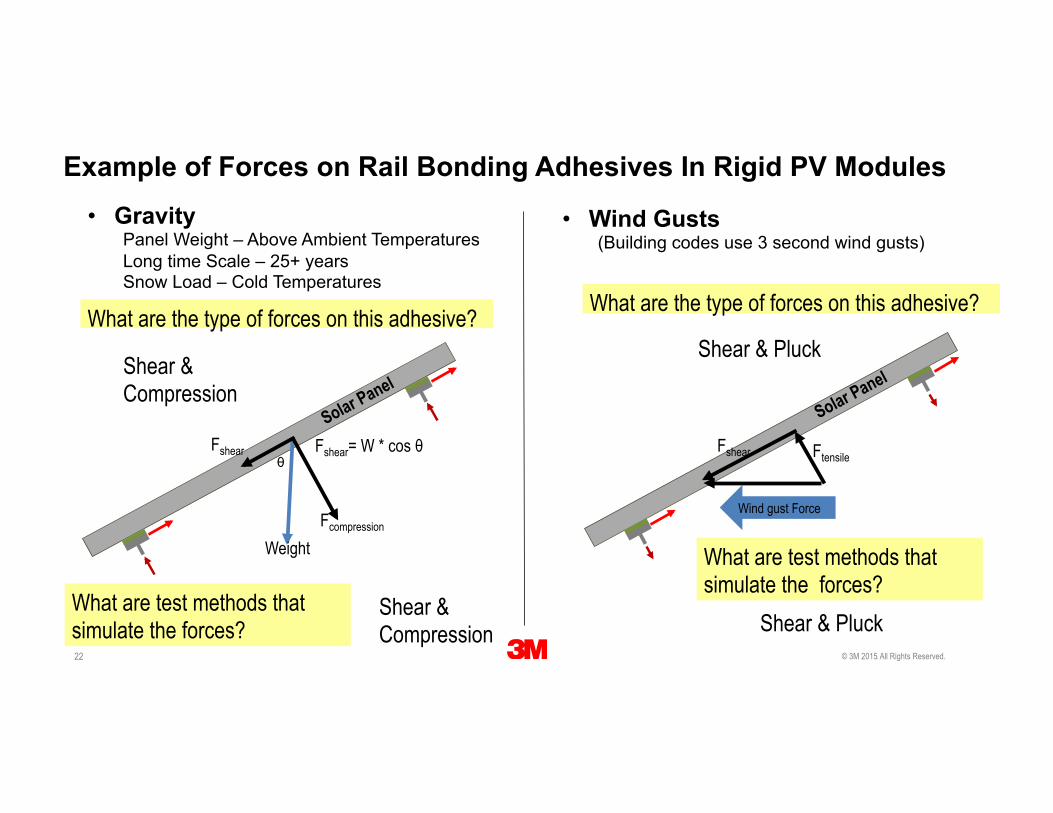
Example of Forces on Rail Bonding Adhesives In Rigid PV Modules
Fshear
Fcompression
Weight
Fshear= W * cos θ θ
• Gravity Panel Weight – Above Ambient Temperatures Long time Scale – 25+ years Snow Load – Cold Temperatures
What are the type of forces on this adhesive?
What are test methods that simulate the forces?
Shear & Compression
• Wind Gusts (Building codes use 3 second wind gusts)
What are the type of forces on this adhesive?
Wind gust Force
Fshear Ftensile
What are test methods that simulate the forces?
Shear & Pluck Shear & Compression
Shear & Pluck
23 7 March 2015 . All Rights Reserved. © 3M
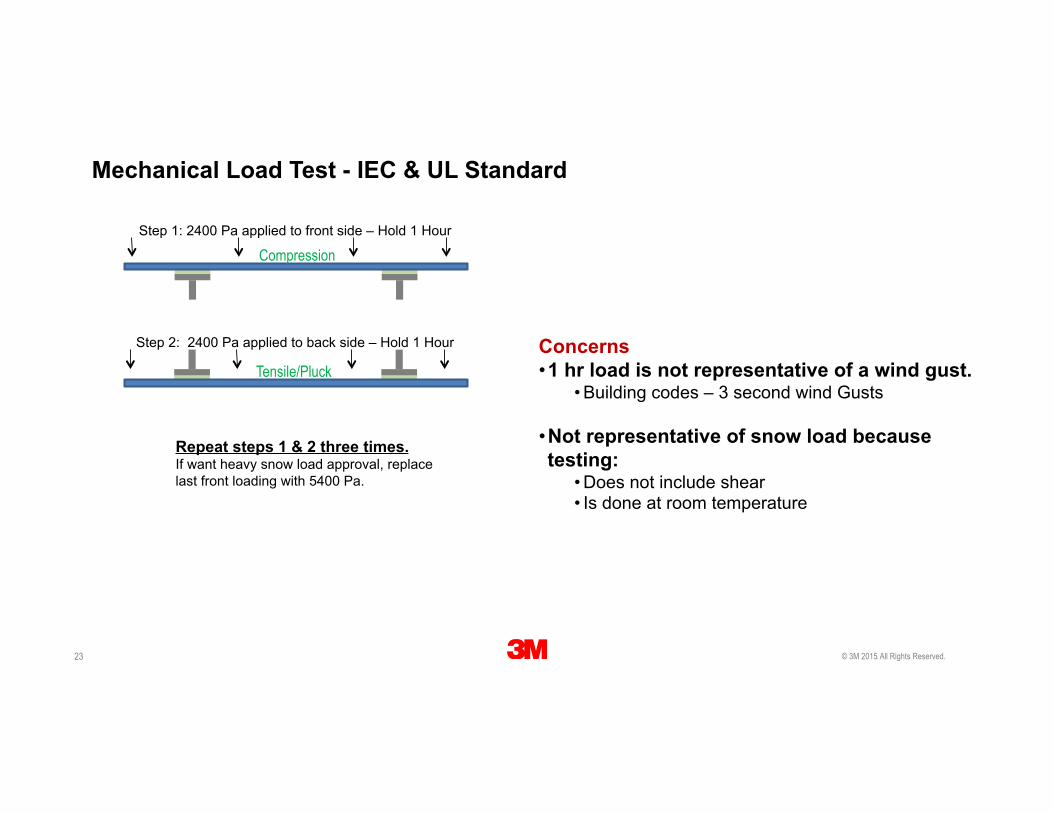
Repeat steps 1 & 2 three times. If want heavy snow load approval, replace last front loading with 5400 Pa.
Step 1: 2400 Pa applied to front side – Hold 1 Hour
Step 2: 2400 Pa applied to back side – Hold 1 Hour Concerns • 1 hr load is not representative of a wind gust.
• Building codes – 3 second wind Gusts
• Not representative of snow load because testing:
• Does not include shear • Is done at room temperature
Mechanical Load Test - IEC & UL Standard
Compression
Tensile/Pluck
24 7 March 2015 . All Rights Reserved. © 3M
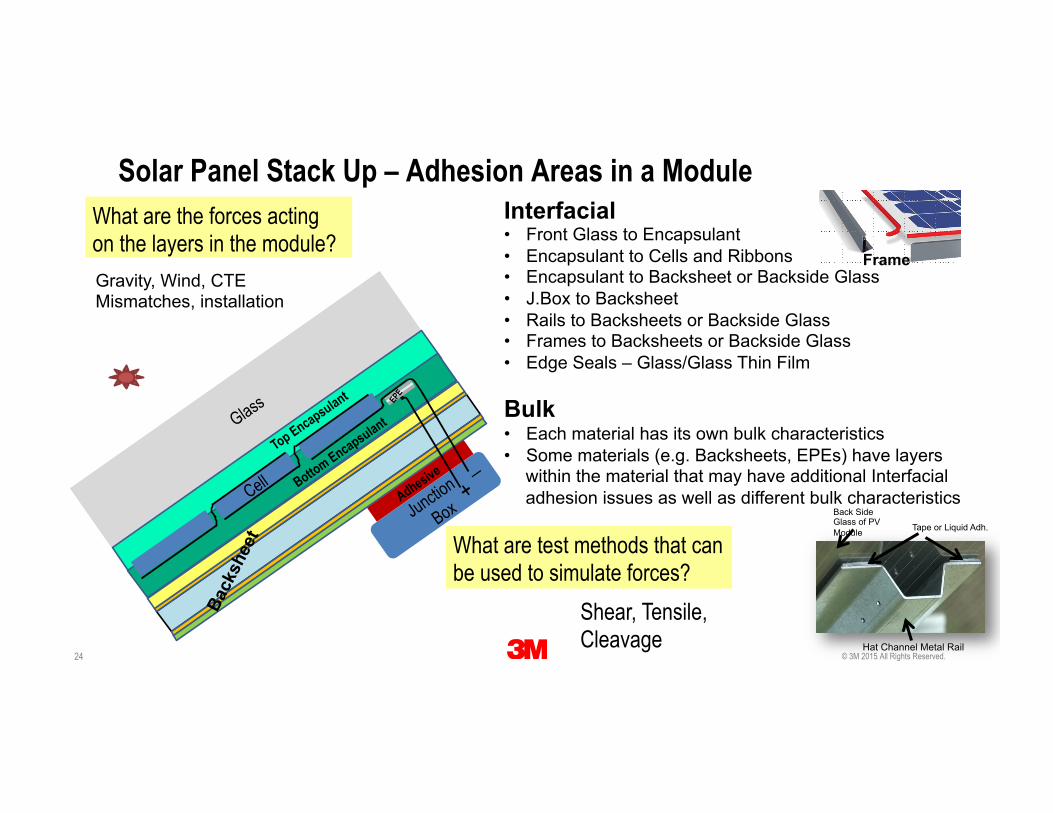
Solar Panel Stack Up – Adhesion Areas in a Module Interfacial • Front Glass to Encapsulant • Encapsulant to Cells and Ribbons • Encapsulant to Backsheet or Backside Glass • J.Box to Backsheet • Rails to Backsheets or Backside Glass • Frames to Backsheets or Backside Glass • Edge Seals – Glass/Glass Thin Film Bulk • Each material has its own bulk characteristics • Some materials (e.g. Backsheets, EPEs) have layers
within the material that may have additional Interfacial adhesion issues as well as different bulk characteristics
Frame
Back Side Glass of PV Module
Hat Channel Metal Rail
Tape or Liquid Adh.
What are the forces acting on the layers in the module?
Shear, Tensile, Cleavage
What are test methods that can be used to simulate forces?
Gravity, Wind, CTE Mismatches, installation
25 7 March 2015 . All Rights Reserved. © 3M
Key Points: 1. Peel
• Easy to run but complex with regards to understanding what it means relative to performance in an application.
• Influenced by many variables. (Backing, substrate, angle, stretching,………) • May not be the best test to use to simulate the forces of PV module applications
2. Understand application stresses & simulate stress as best as possible to get most relevant information.
3. Various adh. & materials perform differently - makes it difficult to compare application performance.
26 7 March 2015 . All Rights Reserved. © 3M
27 7 March 2015 . All Rights Reserved. © 3M
Backup Slides
28 7 March 2015 . All Rights Reserved. © 3M
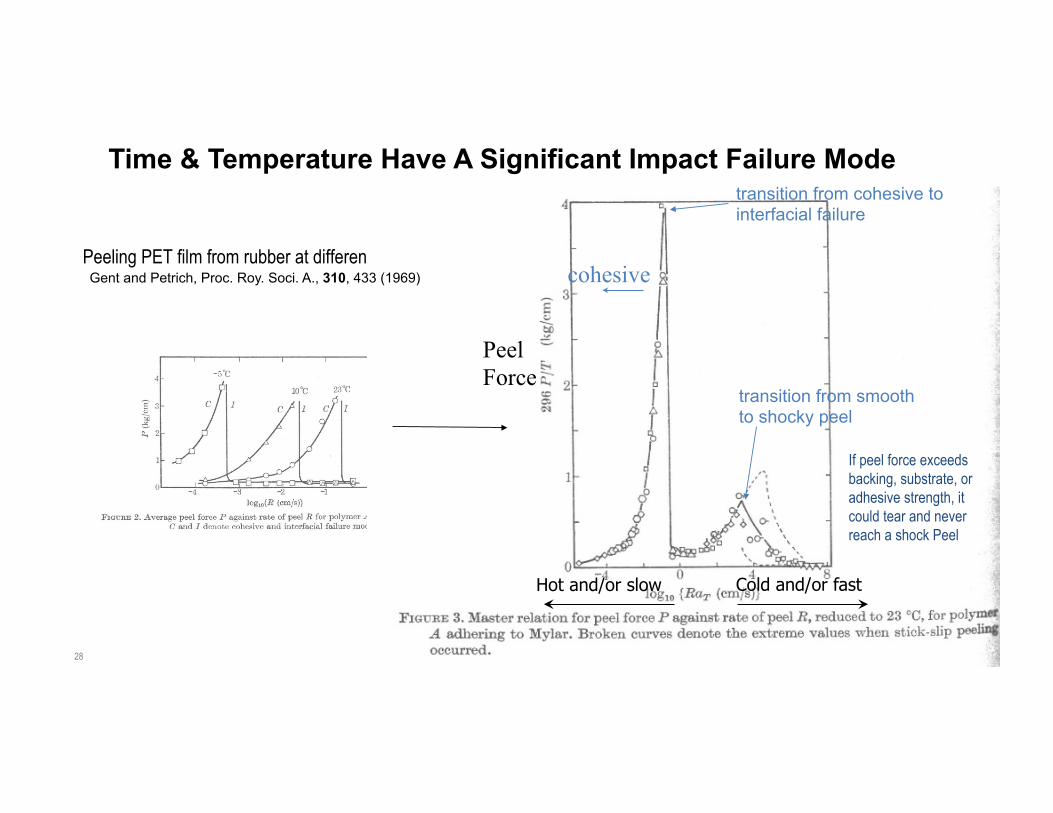
Peeling PET film from rubber at different rates and temperatures Gent and Petrich, Proc. Roy. Soci. A., 310, 433 (1969)
transition from cohesive to interfacial failure
transition from smooth to shocky peel
Time & Temperature Have A Significant Impact Failure Mode
Peel Force
Cold and/or fast Hot and/or slow
cohesive
If peel force exceeds backing, substrate, or adhesive strength, it could tear and never reach a shock Peel
29 7 March 2015 . All Rights Reserved. © 3M
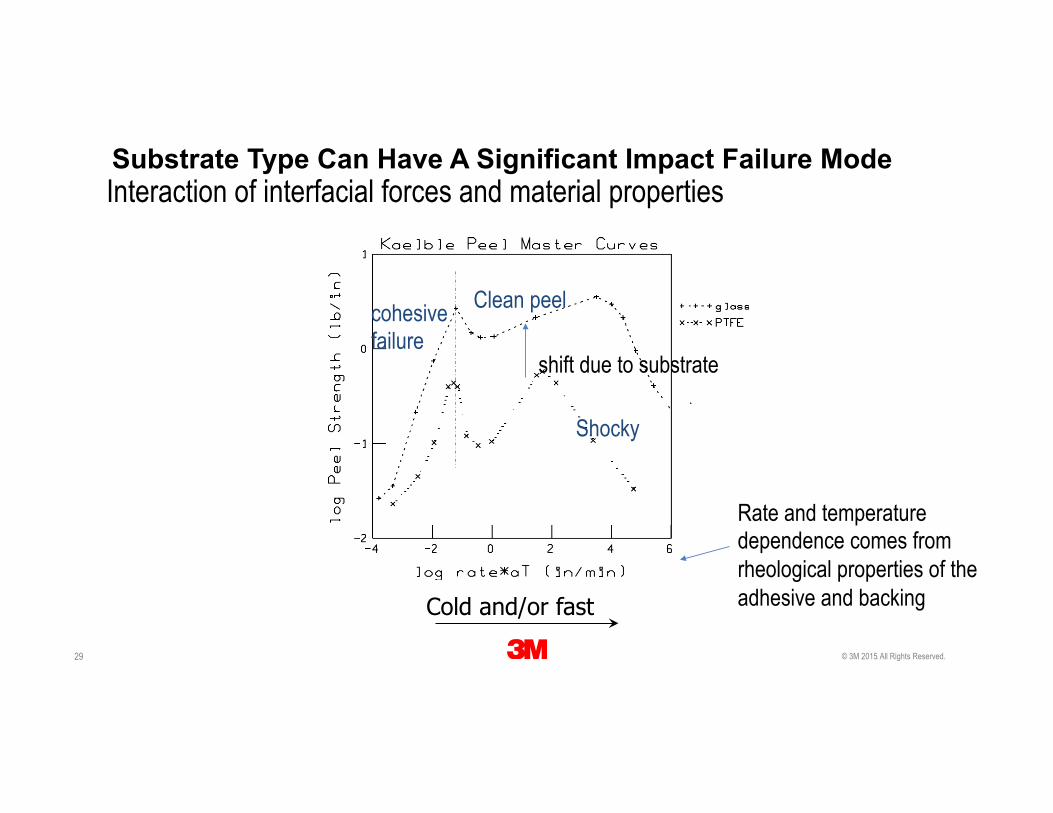
Interaction of interfacial forces and material properties
shift due to substrate
Rate and temperature dependence comes from rheological properties of the adhesive and backing
cohesive failure
Clean peel
Shocky
Substrate Type Can Have A Significant Impact Failure Mode
Cold and/or fast