adding value to facilities management with information...
TRANSCRIPT
General rights Copyright and moral rights for the publications made accessible in the public portal are retained by the authors and/or other copyright owners and it is a condition of accessing publications that users recognise and abide by the legal requirements associated with these rights.
• Users may download and print one copy of any publication from the public portal for the purpose of private study or research. • You may not further distribute the material or use it for any profit-making activity or commercial gain • You may freely distribute the URL identifying the publication in the public portal
If you believe that this document breaches copyright please contact us providing details, and we will remove access to the work immediately and investigate your claim.
Downloaded from orbit.dtu.dk on: Jul 28, 2018
Adding Value to Facilities Management with Information Technology
Ebbesen, Poul; Bonke, Sten; Jensen, Per Anker; Karlshøj, Jan
Publication date:2016
Link back to DTU Orbit
Citation (APA):Ebbesen, P., Bonke, S., Jensen, P. A., & Karlshøj, J. (2016). Adding Value to Facilities Management withInformation Technology.
ADDING VALUE TO FACILITIES MANAGEMENT WITH INFORMATION TECHNOLOGY ESTABLISHING A CONCEPTUAL FRAMEWORK FOR INFORMATION SYSTEM IMPLEMENTATION
PROCESSES IN FACILITIES MANAGEMENT
PhD Dissertation
Poul Ebbesen
January 2016
DTU Management
The Technical University of Denmark
Poul Ebbesen: Adding Value to FM with IT PhD Dissertation PART 1 January 2016
DTU Management 2
Main supervisor: Associate Professor Sten Bonke, DTU Management
Co-supervisors: Professor Per Anker Jensen, CFM, DTU Management
Associate Professor Jan Karlshøj, DTU Civil
Financed by: The Technical University of Denmark (DTU)
Centre for Facilities Management (CFM) – Realdania Research
Toubro Foundation
Idella Foundation
“It is only when we understand how things are done that we can improve them.” Poul Ebbesen
Poul Ebbesen: Adding Value to FM with IT PhD Dissertation PART 1 January 2016
DTU Management 3
Summary in English
This PhD project investigates implementation and use of Information Systems (IS) and Information Technologies (IT) in the Facilities Management (FM) business domain. This investigation is relevant because implementation and use of IS/IT in FM has potentials for improvements which can provide additional value to FM and the organisations which FM supports.
The empirical data was collected from more than 16 IS implementation and use cases in FM departments within private and public organisations in Denmark, Sweden, Germany and Australia. Data from 5 of the 16 cases are used as main input to the analysis in this study.
The cases have revealed a common structure of the elements constituting the IS and the Business Processes (BP) which the IS are intended to support. Based on this structure an IS-BP framework for analysing the interaction between Business Strategy, BP and the IS supporting the BP is proposed.
Specific issues are studied concerning the implementation processes, such as IS project scope, and formal control mechanisms used on the organisational IS level and on the IS project level. Also issues related to the change taking place such as the added value of IS implementation are studied. Finally IS strategy as the strategy of the use of IS to support business strategy (BS) is studied.
By analysing the cases it was demonstrated that IS project scopes can be more or less wide: Besides including IS change an IS project can more or less include organisational change. It was also found that an IS project can more or less include the state prior to or after the change, e.g. include involvement in operating the IS before and after the change.
Different levels of use of formal control mechanisms on the organizational IS level and on the IS project level were found. Based on these findings a formality matrix illustrating these differences is proposed.
A method for assessing the added value, by increasing efficiency and improving effectiveness, gained from IS implementation in FM is proposed. Based on the method it was found that IS can add value to both FM and likewise support business strategy.
It is found that IS strategy dictating use of IS with a high degree of uniformity, interoperability and data reliability can support more advanced and externally oriented business strategies.
The cases expose many different IT and IS being developed, implemented and used in FM. A matrix categorising these technologies according to their use in FM and according to type of IT/IS is finally proposed.
This research work is positioned in the intersection of four research domains; the managerial/socio-technical, the information system, the computer science and the methodological research domains. This research builds theory, which is mainly the IS-BP framework, the formality matrix and an added value assessment method inductively based on the multiple cases.
Seven papers are included in the dissertation; one conceptual (Paper 1), one review (paper 2), one methodological (Paper 3) and four empirical based papers (papers 4-7).
Poul Ebbesen: Adding Value to FM with IT PhD Dissertation PART 1 January 2016
DTU Management 4
An overview of relevant process theory perspectives was first established (Paper 1). In parallel existing research literature on IS and IT in FM was reviewed (Paper 2). During design of this research it was considered how visuals/displays, such as event chronologies, could be used methodologically to capture relevant data early in the research process (Paper 3).
Based on the process theory perspectives found (Paper 1), a list of interview questions was developed so that the use of IS and the IS implementation process could be studied from different process perspectives. Semi-structured interviews, guided by this list of questions, were conducted in all 16 IS implementation and use cases. Based on the coded interview transcripts, the event chronology could be mapped using a process research methodology. The event chronologies revealed patterns concerning e.g. IS project scopes (Paper 4) and IS-BP frameworks (Paper 5). The IS-BP framework was then used to analyse change perspectives such as added value (Paper 6) and IS strategy (Paper 7).
This research contributes to both theory and practice. The proposed IS-BP framework, embedded as an implicit structure in the empirical data, contributes to the IS theory in general and specifically to IS implementation theory. The framework is also applicable to practice; it can be used as a tool to plan and manage IS implementation. The proposed added value assessment method is mainly applicable to FM practice as a tool to obtain added value from IS investments in the FM business domain.
A coherent presentation of the PhD project is given in Part 1 of this dissertation. Part 2 contains the papers, each presenting the sub-studies completed during the PhD project. Part 2 contains published papers and papers in the process of being reviewed. In essence Part 1 is based on Part 2, but Part 1 can be read in its own right.
Enjoy reading.
Poul Ebbesen: Adding Value to FM with IT PhD Dissertation PART 1 January 2016
DTU Management 5
Summary in Danish
Dansk titel: Værditilvækst ved indførsel af Informationsteknologi i Facilities Management.
Dansk undertitel: Etablering af en konceptuel ramme til forståelse af implementering af informationssystemer i facilities management
Resumé: I dette ph.d. projekt undersøges implementering og brug af Informationssystemer (IS) og Informationsteknologier (IT) i Facilities Management (FM) forretningsområdet. Undersøgelsen er relevant fordi implementering og brug af IS/IT i FM har potentiale for forbedringer der kan tilføre yderligere værdi til FM og til den organisation, som FM understøtter.
Empirien til denne undersøgelse er indsamlet fra mere end 16 IS implementerings og brugs cases i FM afdelinger i private og offentlige organisationer in Danmark, Sverige, Tyskland og Australien. Det er primært data fra 5 ud af de 16 cases, der er anvendt i analyserne i dette studie.
De 16 cases viser sig at indeholde en ens struktur bestående af de dele, der udgør et IS og den businessproces (BP) som et IS har til formål at understøtte. Basered på denne struktur foreslås en IS-BP analyseramme til brug for vurdering af interaktionen mellem businessstrategi (BS), BP og IS.
Specifikke emner vedrørende implementeringsprocessen undersøges, herunder omfanget af IS projekter, og formelle kontrol mekanismer anvendt på det organisatoriske IS niveau og på IS projekt niveau. Aspekter vedrørende de forandringer, der forekommer, undersøges ligeledes, såsom værdtilvækst forårsaget af IS implementering. Desuden undersøges IS strategier, vedrørende brug af IS til understøtning af businessstrategi (BS).
En analyse af de 16 cases viser, at omfanget af IS projekter kan variere i bredden. Udover IS forandringen kan IS projekter også inkludere dele af den organisatoriske forandring. Det bliver desuden påvist, at IS projekter kan inkludere tilstanden før forandringen, f.eks. involvering i drift af IS før forandringen, samt inkludere tilstanden efter forandringen, f.eks. drift af IS efter forandringen.
Forskellige grader af brug af formelle kontrol mekanismer på det organisatoriske IS niveau og på IS projekt niveau blev identificeret. Baseret på denne nye viden foreslås en formalitetsmatrix til brug ved kortlægning af disse forhold.
Der foreslås yderligere en metode til vurdering af værditilvækst, ved forøgelse af produktivitet og effektivitet, opnået ved IS implementering i FM. Metoden viser at IS såvel kan tilføre værdi til FM som understøtte business strategier.
Det dokumenteres, at IS strategier der dikterer en høj grad af uniformitet, interoperabilitet og data pålidelighed kan understøtte mere avancerede og eksternt rettede business strategier.
De 16 cases repræsenterer en række forskellige former for IT og IS, som bliver udviklet, implementeret og brugt i FM. En matrix, der placerer disse teknologier i kategorier afhængigt af brug i FM og som opdeler dem i forhold til type af IT/IS bliver foreslået.
Poul Ebbesen: Adding Value to FM with IT PhD Dissertation PART 1 January 2016
DTU Management 6
Denne forskning placerer sig i krydsfeltet mellem fire forskningsdomæner: det management/socio-tekniske, det informationssystemiske, datalogien og metodologien. Forskningen bidrager med teori-udvikling, primært i forbindelse med IS-BP rammen, formalitets matrixen og værditilvækst vurderingsmetoden, induktivt baseret på flere cases.
Syv artikler er inkluderet i denne afhandling; en konceptuel (Artikel 1), en litteraturgennemgang (Artikel 2), en metodologisk (Artikel 3) og fire empiriske artikler (Artikel 4-7).
Et overblik over relevante procesteori perspektiver blev indledningsvist etableret (Artikel 1). Parallelt hermed blev eksisterende forskningslitteratur om IS og IT in FM kortlagt (Artikel 2). I forbindelse med design af denne forskning blev det undersøgt hvorledes visuelle fremstillinger, såsom event kronologier, kunne anvendes metodologisk til fangst af relevante data tidligt i forskningsprocessen (Artikel 3).
Baseret på de fundne procesteori perspektiver blev en liste med interview spørgsmål udviklet således at brug af IS og IS implementering kunne studeres fra forskellige procesperspektiver. Semi-strukturerede interviews blev gennemført i alle 16 cases. Baseret på de kodede interviewudskrifter kunne event kronologier kortlægges ved brug af procesforsknings-metodologi. Event kronologierne fremviste mønstre vedrørende omfanget af IS projekter (Artikel 4) og IS-BP rammen (Artikel 5). IS-BP rammen blev derefter anvendt til at analysere forandringsperspektiver såsom værditilvækst (Artikel 6) og IS strategi (Artikel 7).
Denne forskning bidrager således med både teori og praksis aspekter. Den foreslåede IS-BP ramme, indlejret som en implicit struktur i empirien, bidrager til IS teori generelt og specielt til teori om IS implementering i FM. Rammen er desuden anvendelig i praksis som et redskab til at planlægge og styre IS implementering. Den foreslåede metode til vurdering af værditilførsel kan primært anvendes i FM praksis som redskab til at opnå værditilvækst fra IS investeringer i FM business domænet.
En samlet præsentation af ph.d. projektet gives i Del 1 af denne afhandling. Del 2 indeholder artiklerne, der repræsenterer de forskningsanalytiske delaktiviteter indenfor feltet. Del 2 indeholder publicerede artikler og artikler under review. Del 1 er i sagens nature baseret på Del 2 og kan læses uafhængigt heraf.
God læsning (på engelsk)
Poul Ebbesen: Adding Value to FM with IT PhD Dissertation PART 1 January 2016
DTU Management 7
Acknowledgements
During the past three years I have gained significant insight into the world of IS/IT and FM, a world not only interesting but also with huge business potential. Excitement is not enough to get through a three years PhD project; you also need considerable support from others.
My main supervisor Associate Professor Sten Bonke and my two co-supervisors Professor Per Anker Jensen and Associate Professor Jan Karlshøj, all working at DTU, have all been a great support to me, each in their own unique and inspiring way. They represent the three columns that my research rests on; the managerial/socio-technical area, the FM area and the IS/IT area. Sten has given me indispensable theoretical insight into the managerial research domain, and he has given me excellent linguistic support. Most importantly Sten and I have shared many hours together discussing all thinkable topics related to my PhD. I really have enjoyed those discussions. Per introduced me to the Danish and the European FM research communities and introduced me to the CFM research forum at DTU, where I always feel welcome. Per also supported my research by providing funding for conferences and seminars. In addition Per has been extremely helpful reviewing my writings supported by his deep knowledge of FM. Jan inspired me to include computer science related topics into my research. He has also helped me realise that IT support in construction, and IT support in facilities management and operations are two sides of the same coin; both sides are about facilities and IT.
In addition to my supervisors I also would like to thank the many researchers and PhD students at DTU who supported and inspired me. A special thanks goes to Associate Professor Yutaka Yoshinaka who introduced me to the fascinating socio-technical research domain and who introduced me to his PhD student Angelos Balatsas Lekkas. Angelos and I have spent many lunch breaks discussing socio-technical theory and life in general. Our attempt to write a paper together failed but it was fun trying. Also thanks to Associate Professor Erling Havn who introduced me to IS research and the blurry concept of IS implementation. Late into my research Postdoc Giulia Nardelli introduced me to process research. Giulia spent many hours lecturing me about process research methodology, which I believe contains the key to studying and understanding process related issues. Also researchers at other universities inspired and supported me. One I must mention is Associate Professor Lene Pries-Heje at the IT University of Copenhagen who gave me new insights into the Information Systems research field.
I’m also grateful to all the practitioners, mainly in FM departments in private and public organisations in Denmark, Sweden, Germany and Australia, whom I interviewed. A special thank goes to Building Information Manager Chris Linning at the Sydney Opera House and Technical Documentation Manager Wolfgang Haller at Munich Airport. They are both perfect examples of how enthusiasm and openness makes a positive difference in our common pursuit to add additional value to business with technology. They were both so kind to give me unconditional access to their experience and knowledge in the difficult area of IT in FM.
As part of my PhD I visited the Technische Universität Munich (TUM), the University of Technology Sydney (UTS), and most important the University of Melbourne where Doctor Christopher Heywood spent time with me discussing FM and Cooperate Real Estate Management and gave me access to FM departments in organisations in Australia. Unfortunately I was not as planned able to visit Prof. Dr.
Poul Ebbesen: Adding Value to FM with IT PhD Dissertation PART 1 January 2016
DTU Management 8
Michael May at University of Applied Sciences Berlin. Luckily Michael could instead participate as one of the opponents at my Work in Progress seminar. Michael is internationally known for his research and publications within the field of IT and FM, and he has inspired me in my work.
Above all, I want to thank my family for their unconditional support in this long process. Especially my wife Bente Rasmussen, who through her work at a large international pharmaceutical company is directly involved in IS implementation. She was the one that finally convinced me that implementation issues are worth studying. I also want to thank my three children. My eldest daughter Louise Siv Ebbesen who introduced me to qualitative research in the social sciences by lending me her political science studies books from her time at Aarhus University and Copenhagen University. My son Morten Stig Ebbesen who, during my PhD, spent most of his time in Greenland studying artic technology at DTU: thereby introduced me to yet another technology also diffusing into the FM area; the drones, which he is quite good at building and navigating. And last but not least my youngest daughter Linea Gry Ebbesen who was an exchange student in Sydney during my visit to Australia. I was therefore able to spent time with her both in Sydney and in Melbourne during my stay, which I really enjoyed. Linea is a clever girl and she understood everything I shared with her about my PhD, and it was she who reminded me to keep both my feet on the ground even if I had my head in the clouds. Finally I want to thank my father Dr Peter Ebbesen for showing great interest in my project.
To everyone who inspired and helped me during this process, including those I am sure I forgot to mention: Thank you all so very much.
Poul Ebbesen, January 2016
Poul Ebbesen: Adding Value to FM with IT PhD Dissertation PART 1 January 2016
DTU Management 9
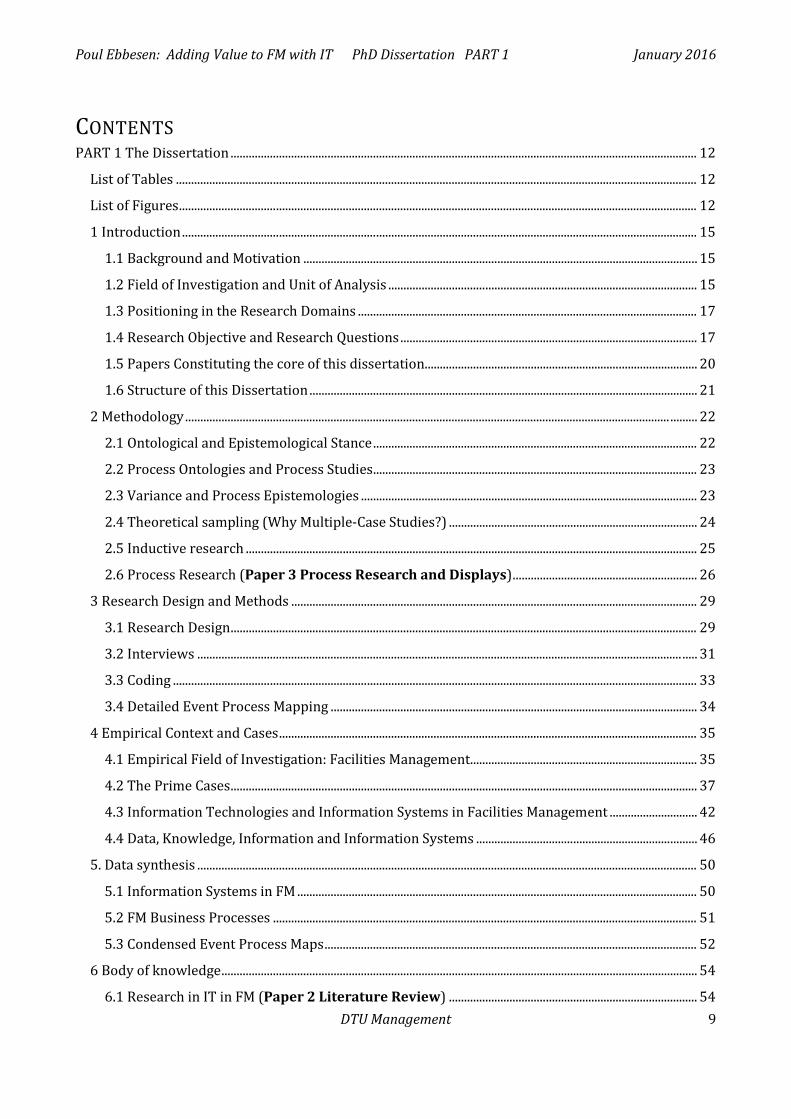
CONTENTS PART 1 The Dissertation .......................................................................................................................................................... 12
List of Tables ............................................................................................................................................................................ 12
List of Figures ........................................................................................................................................................................... 12
1 Introduction .......................................................................................................................................................................... 15
1.1 Background and Motivation .................................................................................................................................. 15
1.2 Field of Investigation and Unit of Analysis ...................................................................................................... 15
1.3 Positioning in the Research Domains ................................................................................................................ 17
1.4 Research Objective and Research Questions .................................................................................................. 17
1.5 Papers Constituting the core of this dissertation .......................................................................................... 20
1.6 Structure of this Dissertation ................................................................................................................................ 21
2 Methodology ................................................................................................................................................................ ......... 22
2.1 Ontological and Epistemological Stance ........................................................................................................... 22
2.2 Process Ontologies and Process Studies ........................................................................................................... 23
2.3 Variance and Process Epistemologies ............................................................................................................... 23
2.4 Theoretical sampling (Why Multiple-Case Studies?) .................................................................................. 24
2.5 Inductive research ..................................................................................................................................................... 25
2.6 Process Research (Paper 3 Process Research and Displays) ............................................................. 26
3 Research Design and Methods ...................................................................................................................................... 29
3.1 Research Design .......................................................................................................................................................... 29
3.2 Interviews ................................................................................................................................................................ ..... 31
3.3 Coding ............................................................................................................................................................................. 33
3.4 Detailed Event Process Mapping ......................................................................................................................... 34
4 Empirical Context and Cases .......................................................................................................................................... 35
4.1 Empirical Field of Investigation: Facilities Management ........................................................................... 35
4.2 The Prime Cases .......................................................................................................................................................... 37
4.3 Information Technologies and Information Systems in Facilities Management ............................. 42
4.4 Data, Knowledge, Information and Information Systems ......................................................................... 46
5. Data synthesis ..................................................................................................................................................................... 50
5.1 Information Systems in FM .................................................................................................................................... 50
5.2 FM Business Processes ............................................................................................................................................ 51
5.3 Condensed Event Process Maps ........................................................................................................................... 52
6 Body of knowledge ............................................................................................................................................................. 54
6.1 Research in IT in FM (Paper 2 Literature Review) .................................................................................. 54
Poul Ebbesen: Adding Value to FM with IT PhD Dissertation PART 1 January 2016
DTU Management 10
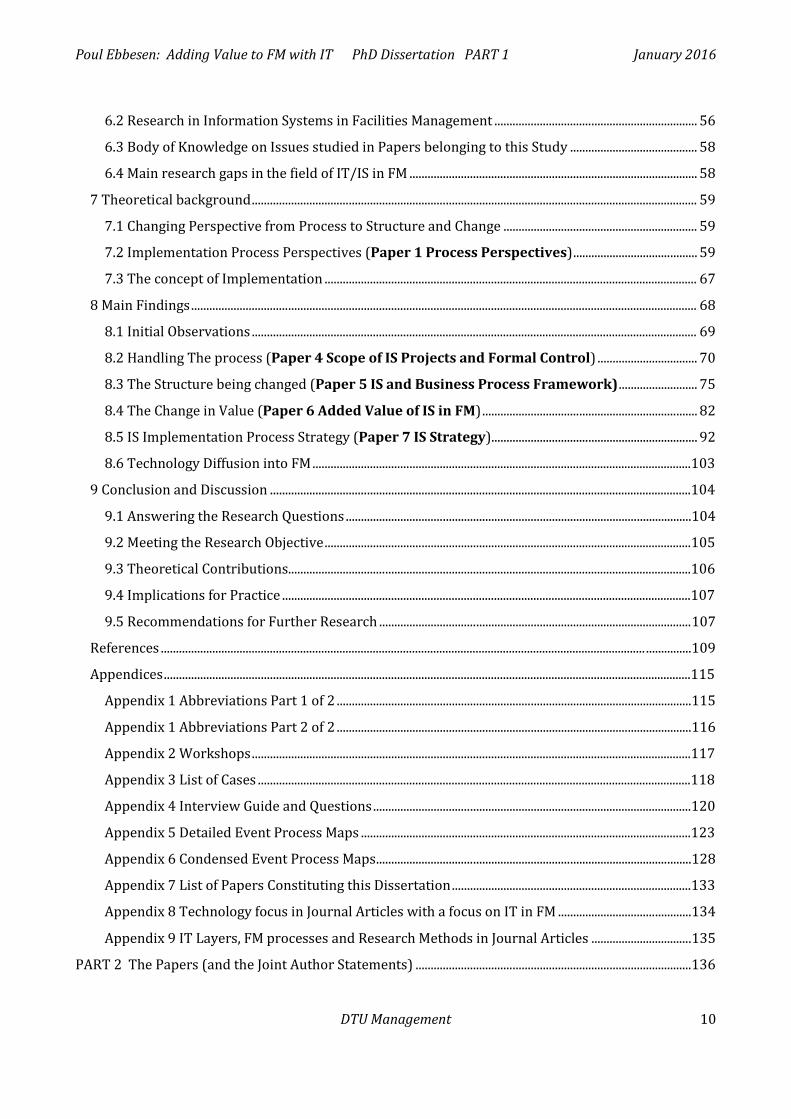
6.2 Research in Information Systems in Facilities Management ................................................................... 56
6.3 Body of Knowledge on Issues studied in Papers belonging to this Study .......................................... 58
6.4 Main research gaps in the field of IT/IS in FM ............................................................................................... 58
7 Theoretical background ................................................................................................................................................... 59
7.1 Changing Perspective from Process to Structure and Change ................................................................ 59
7.2 Implementation Process Perspectives (Paper 1 Process Perspectives) ......................................... 59
7.3 The concept of Implementation ........................................................................................................................... 67
8 Main Findings ....................................................................................................................................................................... 68
8.1 Initial Observations ................................................................................................................................................... 69
8.2 Handling The process (Paper 4 Scope of IS Projects and Formal Control) ................................. 70
8.3 The Structure being changed (Paper 5 IS and Business Process Framework) .......................... 75
8.4 The Change in Value (Paper 6 Added Value of IS in FM) ....................................................................... 82
8.5 IS Implementation Process Strategy (Paper 7 IS Strategy) .................................................................... 92
8.6 Technology Diffusion into FM .............................................................................................................................103
9 Conclusion and Discussion ...........................................................................................................................................104
9.1 Answering the Research Questions ..................................................................................................................104
9.2 Meeting the Research Objective .........................................................................................................................105
9.3 Theoretical Contributions.....................................................................................................................................106
9.4 Implications for Practice .......................................................................................................................................107
9.5 Recommendations for Further Research .......................................................................................................107
References ................................................................................................................................................................ ...............109
Appendices ..............................................................................................................................................................................115
Appendix 1 Abbreviations Part 1 of 2 .....................................................................................................................115
Appendix 1 Abbreviations Part 2 of 2 .....................................................................................................................116
Appendix 2 Workshops .................................................................................................................................................117
Appendix 3 List of Cases ...............................................................................................................................................118
Appendix 4 Interview Guide and Questions .........................................................................................................120
Appendix 5 Detailed Event Process Maps .............................................................................................................123
Appendix 6 Condensed Event Process Maps ........................................................................................................128
Appendix 7 List of Papers Constituting this Dissertation ...............................................................................133
Appendix 8 Technology focus in Journal Articles with a focus on IT in FM ............................................134
Appendix 9 IT Layers, FM processes and Research Methods in Journal Articles .................................135
PART 2 The Papers (and the Joint Author Statements) ...........................................................................................136

Poul Ebbesen: Adding Value to FM with IT PhD Dissertation PART 1 January 2016
DTU Management 11
Poul Ebbesen: Adding Value to FM with IT PhD Dissertation PART 1 January 2016
DTU Management 12
PART 1 THE DISSERTATION
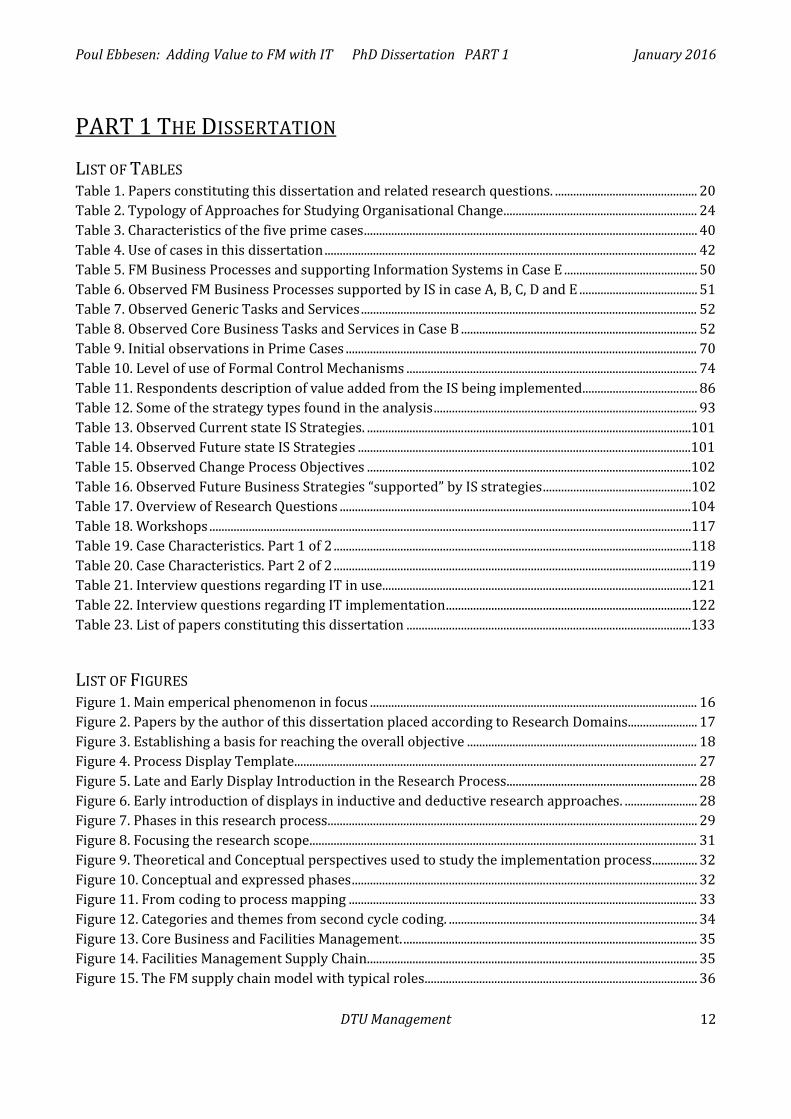
LIST OF TABLES Table 1. Papers constituting this dissertation and related research questions. ............................................... 20 Table 2. Typology of Approaches for Studying Organisational Change ................................................................ 24 Table 3. Characteristics of the five prime cases .............................................................................................................. 40 Table 4. Use of cases in this dissertation ........................................................................................................................... 42 Table 5. FM Business Processes and supporting Information Systems in Case E ............................................ 50 Table 6. Observed FM Business Processes supported by IS in case A, B, C, D and E ....................................... 51 Table 7. Observed Generic Tasks and Services ............................................................................................................... 52 Table 8. Observed Core Business Tasks and Services in Case B .............................................................................. 52 Table 9. Initial observations in Prime Cases .................................................................................................................... 70 Table 10. Level of use of Formal Control Mechanisms ................................................................................................ 74 Table 11. Respondents description of value added from the IS being implemented...................................... 86 Table 12. Some of the strategy types found in the analysis ....................................................................................... 93 Table 13. Observed Current state IS Strategies. ...........................................................................................................101 Table 14. Observed Future state IS Strategies ..............................................................................................................101 Table 15. Observed Change Process Objectives ...........................................................................................................102 Table 16. Observed Future Business Strategies “supported” by IS strategies .................................................102 Table 17. Overview of Research Questions ....................................................................................................................104 Table 18. Workshops ...............................................................................................................................................................117 Table 19. Case Characteristics. Part 1 of 2 ......................................................................................................................118 Table 20. Case Characteristics. Part 2 of 2 ......................................................................................................................119 Table 21. Interview questions regarding IT in use......................................................................................................121 Table 22. Interview questions regarding IT implementation .................................................................................122 Table 23. List of papers constituting this dissertation ..............................................................................................133
LIST OF FIGURES Figure 1. Main emperical phenomenon in focus ............................................................................................................ 16 Figure 2. Papers by the author of this dissertation placed according to Research Domains....................... 17 Figure 3. Establishing a basis for reaching the overall objective ............................................................................ 18 Figure 4. Process Display Template ..................................................................................................................................... 27 Figure 5. Late and Early Display Introduction in the Research Process............................................................... 28 Figure 6. Early introduction of displays in inductive and deductive research approaches. ........................ 28 Figure 7. Phases in this research process. ......................................................................................................................... 29 Figure 8. Focusing the research scope ................................................................................................................................ 31 Figure 9. Theoretical and Conceptual perspectives used to study the implementation process ............... 32 Figure 10. Conceptual and expressed phases .................................................................................................................. 32 Figure 11. From coding to process mapping ................................................................................................................... 33 Figure 12. Categories and themes from second cycle coding. .................................................................................. 34 Figure 13. Core Business and Facilities Management. ................................................................................................. 35 Figure 14. Facilities Management Supply Chain. ............................................................................................................ 35 Figure 15. The FM supply chain model with typical roles .......................................................................................... 36
Poul Ebbesen: Adding Value to FM with IT PhD Dissertation PART 1 January 2016
DTU Management 13
Figure 16. Photo Case A ............................................................................................................................................................ 37 Figure 17. Photo Case B ............................................................................................................................................................ 37 Figure 18. Photo Case C ............................................................................................................................................................ 38 Figure 19. Photo Case D ............................................................................................................................................................ 39 Figure 20. Photo Case E ............................................................................................................................................................ 39 Figure 21. Size and spread of facilities per case ............................................................................................................. 41 Figure 22. IT and Categories according to use in FM. .................................................................................................. 43 Figure 23. IS and IT in FM placed in Categories according to purpose and IS/IT Type. ................................ 44 Figure 24. Screenshot from the Visualization Management System ...................................................................... 45 Figure 25. Use of IS in a FM department ............................................................................................................................ 46 Figure 26. Four aspects of Information and retrieving and storing data in an IS............................................. 47 Figure 27. From Information to Data in an IS .................................................................................................................. 48 Figure 28. Number of articles with a focus within each of the technology areas ............................................. 54 Figure 29. IT Layer Framework and Number of articles focusing within each of the IT Layers ................ 56 Figure 30. ROI model for IS in FM ........................................................................................................................................ 57 Figure 31. From Process to Structure and Change ........................................................................................................ 59 Figure 32. Stages in Innovation-Decision Processes .................................................................................................... 60 Figure 33. Diffusion of Innovations. The logistic model .............................................................................................. 61 Figure 34. Evolutionary process in SCOT .......................................................................................................................... 62 Figure 35. Goal translation in ANT ....................................................................................................................................... 62 Figure 36. Phased in the Domestication Process in DOM ........................................................................................... 63 Figure 37. Five basic organisational parts and pulls in the Structure of Five model ...................................... 63 Figure 38. Interactions between organisational elements in in the Diamond Model ..................................... 64 Figure 39. Interactions process groups in Project Management ............................................................................. 65 Figure 40. Change Management Model .............................................................................................................................. 65 Figure 41. General Logic Model for a Business Process .............................................................................................. 66 Figure 42. FM Process model with focus on the Workflow ....................................................................................... 66 Figure 43. The IS Implementation process ....................................................................................................................... 67 Figure 44. The topics Process, Structure and Change .................................................................................................. 68 Figure 45. Research Process. Traditional View and This Research ........................................................................ 69 Figure 46. Data Transfer Obstacles ...................................................................................................................................... 70 Figure 47. Scope of IS projects in four cases shown in a simple stage model .................................................... 72 Figure 48. Formality Matrix ................................................................................................................................................... 74 Figure 49. Proposed IS-BP Framework .............................................................................................................................. 77 Figure 50. The IS-BP Framework applied to case E ...................................................................................................... 80 Figure 51. Value concepts and IS concepts ....................................................................................................................... 83 Figure 52. Added exchange value and added use value .............................................................................................. 83 Figure 53. Development in use value, cost of service and IS implementation ................................................... 84 Figure 54. VAM compared to other forms of management........................................................................................ 85 Figure 55. Three main steps in assessing the value of IS supporting FM ............................................................ 87 Figure 56. Sensors detecting people entering the room ............................................................................................. 87 Figure 57. Use response screen ............................................................................................................................................. 88 Figure 58. Monitor on dispatchers office showing use frequency and user responses for each room ... 88 Figure 59. Analysing the IS case using the FM supply chain model ....................................................................... 90 Figure 60. IS supporting both Efficiency and Effectiveness in the management of the process ................ 91
Poul Ebbesen: Adding Value to FM with IT PhD Dissertation PART 1 January 2016
DTU Management 14
Figure 61. Current and future state of IS strategy. Case A.......................................................................................... 95 Figure 62. Current and future state of IS strategy. Case B. ......................................................................................... 96 Figure 63. Current and future state of IS strategy. Case C. ......................................................................................... 98 Figure 64. Current and future state of IS strategy. Case D. ........................................................................................ 99 Figure 65. Current and future state of IS strategy. Case E. .......................................................................................100 Figure 66. Inductive research, conceptualisation and deductive research .......................................................106 Figure 67. Visual mapping of event chronology. Case A. ..........................................................................................123 Figure 68. Visual mapping of event chronology. Case B. ..........................................................................................124 Figure 69. Visual mapping of event chronology. Case C. ...........................................................................................125 Figure 70. Visual mapping of event chronology. Case D. ..........................................................................................126 Figure 71. Visual mapping of event chronology. Case E. ...........................................................................................127
Poul Ebbesen: Adding Value to FM with IT PhD Dissertation PART 1 January 2016
DTU Management 15
1 INTRODUCTION
1.1 BACKGROUND AND MOTIVATION Facilities Management (FM) departments in various types of organisations have in the past two to three decades been in the process of implementing and using new types of Information Systems (IS), based on different Information Technologies (IT), to support FM tasks and FM services.
Based on a more transparent and systematic data representation of the facilities, these types of IS can support FM operations and work processes, thereby having potentials for improving FM services and deliveries.
This study indicates a lack of methods, applicable in practice, for assessing the added value from these IS investments, including added value for the FM departments themselves as well as for the organisations serviced by the FM departments.
Hitherto in research there has been a lack of focus on IS implementation processes in FM and use of IS for FM operations in existing facilities. Especially organisational and socio-technical issues appear to be absent. Research within IS in FM primarily has been focusing on specific IT related technical aspects and often so in connection with construction or refurbishment projects. See Paper 2 by Ebbesen (2015b).
1.2 FIELD OF INVESTIGATION AND UNIT OF ANALYSIS To help close the gap of knowledge, caused by the lack of research focus on IS implementation processes and use of IS in FM, this research focuses on establishing a better conceptual platform for studying and understanding processes of IS implementation and use of IS in FM organisations involved in introducing IS for support of operations and work processes in existing facilities. The focus is on socio-technical, managerial and organisational aspects of the IS use and the IS implementation process (unit of analysis), and further on how this process can be improved in order to add the projected value, and finally how the added value can be assessed.
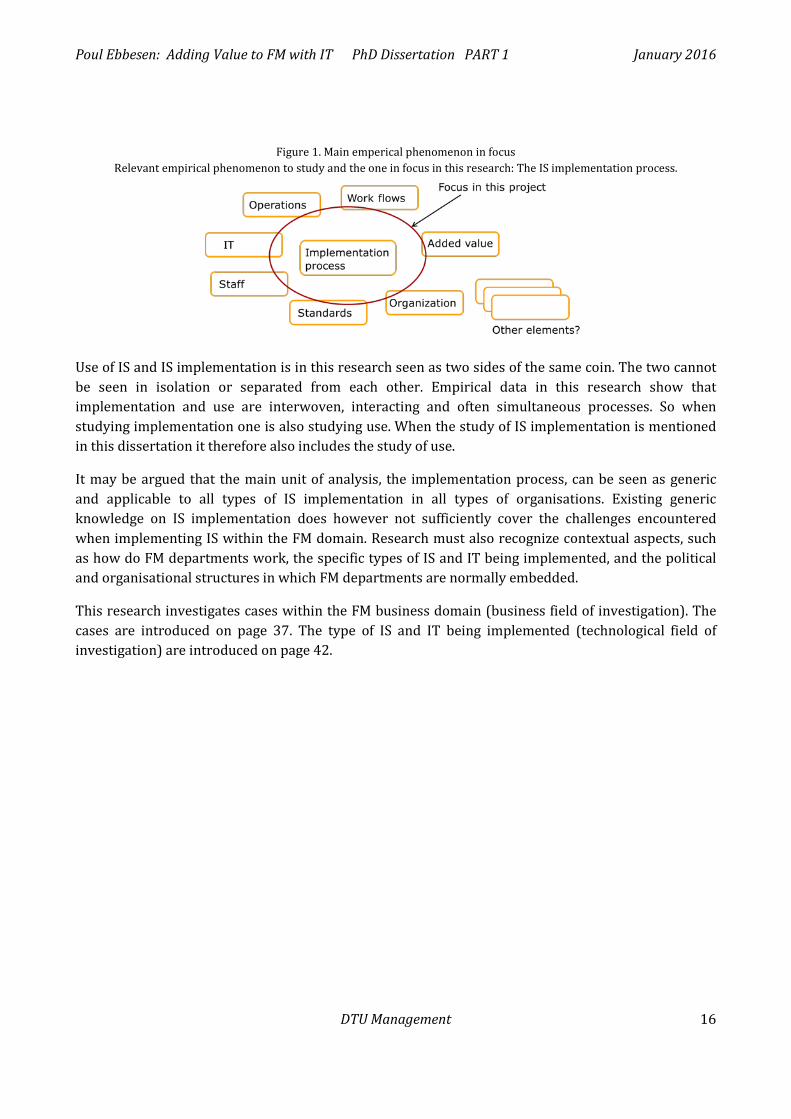
Increasingly, organisational analysts identify implementation failure, not innovation failure, as the cause of many organisations’ inability to achieve the intended benefits of the innovation they adopt (Klein & Sorra 1996). Initial empirical data from this research also points to the implementation process as being the most important empirical phenomenon to study, understand and improve, when striving to gain most possible added value from implementing IS in FM. As shown in Figure 1, other relevant phenomenon to study and improve could be the IT being implemented, the knowledge of the staff involved etc.
Poul Ebbesen: Adding Value to FM with IT PhD Dissertation PART 1 January 2016
DTU Management 16
Figure 1. Main emperical phenomenon in focus Relevant empirical phenomenon to study and the one in focus in this research: The IS implementation process.
Use of IS and IS implementation is in this research seen as two sides of the same coin. The two cannot be seen in isolation or separated from each other. Empirical data in this research show that implementation and use are interwoven, interacting and often simultaneous processes. So when studying implementation one is also studying use. When the study of IS implementation is mentioned in this dissertation it therefore also includes the study of use.
It may be argued that the main unit of analysis, the implementation process, can be seen as generic and applicable to all types of IS implementation in all types of organisations. Existing generic knowledge on IS implementation does however not sufficiently cover the challenges encountered when implementing IS within the FM domain. Research must also recognize contextual aspects, such as how do FM departments work, the specific types of IS and IT being implemented, and the political and organisational structures in which FM departments are normally embedded.
This research investigates cases within the FM business domain (business field of investigation). The cases are introduced on page 37. The type of IS and IT being implemented (technological field of investigation) are introduced on page 42.
Poul Ebbesen: Adding Value to FM with IT PhD Dissertation PART 1 January 2016
DTU Management 17
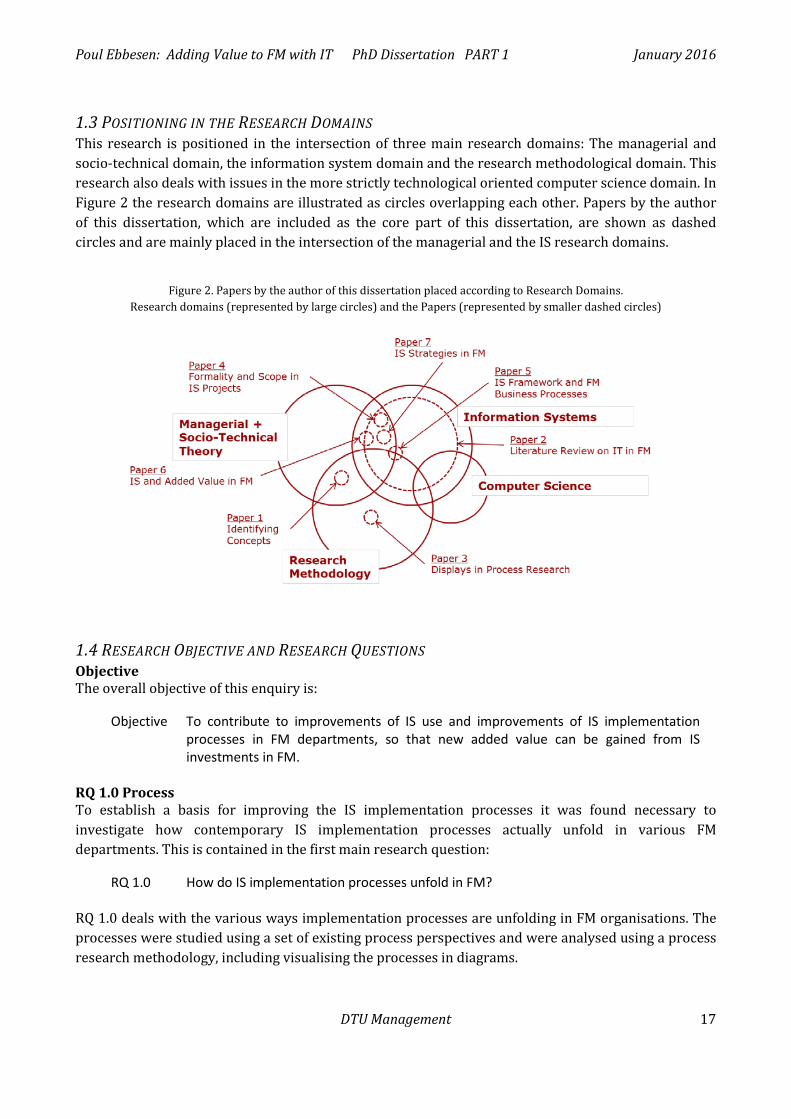
1.3 POSITIONING IN THE RESEARCH DOMAINS This research is positioned in the intersection of three main research domains: The managerial and socio-technical domain, the information system domain and the research methodological domain. This research also deals with issues in the more strictly technological oriented computer science domain. In Figure 2 the research domains are illustrated as circles overlapping each other. Papers by the author of this dissertation, which are included as the core part of this dissertation, are shown as dashed circles and are mainly placed in the intersection of the managerial and the IS research domains.
Figure 2. Papers by the author of this dissertation placed according to Research Domains.
Research domains (represented by large circles) and the Papers (represented by smaller dashed circles)
1.4 RESEARCH OBJECTIVE AND RESEARCH QUESTIONS Objective The overall objective of this enquiry is:
Objective To contribute to improvements of IS use and improvements of IS implementation processes in FM departments, so that new added value can be gained from IS investments in FM.
RQ 1.0 Process To establish a basis for improving the IS implementation processes it was found necessary to investigate how contemporary IS implementation processes actually unfold in various FM departments. This is contained in the first main research question:
RQ 1.0 How do IS implementation processes unfold in FM?
RQ 1.0 deals with the various ways implementation processes are unfolding in FM organisations. The processes were studied using a set of existing process perspectives and were analysed using a process research methodology, including visualising the processes in diagrams.
Poul Ebbesen: Adding Value to FM with IT PhD Dissertation PART 1 January 2016
DTU Management 18
To investigate a given process an understanding of the nature of such a process can be helpful. This inquiry is dealing with processes where technology is introduced into organisations, and where people are exposed to and involved in changes, e.g. changes in the way they conduct their work processes and routines. The need for a conceptualisation and a basic understanding of this type of processes is included in the following sub research question:
RQ 1.1 How can technology implementation processes in organisations be modelled and described?
To further strengthen the basis for investigating how IS implementation processes unfold in FM, the following sub research questions was added:
RQ 1.2 What is the state of the art in literature about IS implementation processes in FM?
RQ 2.0 Structure The empirical data acquired during the investigation of the IS implementation processes (RQ 1.0) revealed an underlying structure, common to all the IS implementation cases. It became clear that, in order to understand these processes in depth, a general conceptual structure, based on the empirical data, was needed. This structure could furthermore function as an analytical IS framework in the analysis phase. This lead to the second main research question:
RQ 2.0 How can the structure of IS in FM be conceptualised?
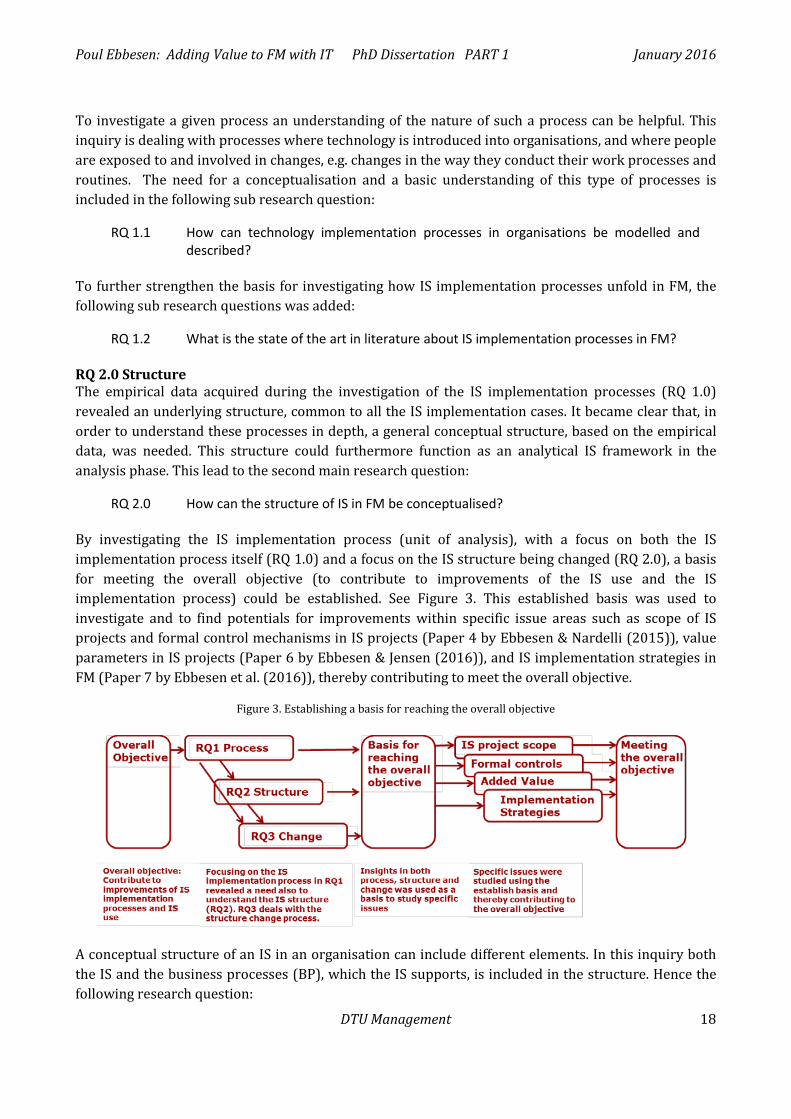
By investigating the IS implementation process (unit of analysis), with a focus on both the IS implementation process itself (RQ 1.0) and a focus on the IS structure being changed (RQ 2.0), a basis for meeting the overall objective (to contribute to improvements of the IS use and the IS implementation process) could be established. See Figure 3. This established basis was used to investigate and to find potentials for improvements within specific issue areas such as scope of IS projects and formal control mechanisms in IS projects (Paper 4 by Ebbesen & Nardelli (2015)), value parameters in IS projects (Paper 6 by Ebbesen & Jensen (2016)), and IS implementation strategies in FM (Paper 7 by Ebbesen et al. (2016)), thereby contributing to meet the overall objective.
Figure 3. Establishing a basis for reaching the overall objective
A conceptual structure of an IS in an organisation can include different elements. In this inquiry both the IS and the business processes (BP), which the IS supports, is included in the structure. Hence the following research question:
Poul Ebbesen: Adding Value to FM with IT PhD Dissertation PART 1 January 2016
DTU Management 19
RQ 2.0.1 How do IS and business processes interact in FM?
RQ 3.0 Change (structure change process) During the IS implementation process (RQ 1.0) the IS structure (RQ 2.0) is changed. This perspective is included in the following research question:
RQ 3.0 How do IS and business processes change during IS implementation in FM?
Based on the understanding of the process of change of the IS structure (RQ 3.0) the following sub research questions were investigated:
RQ 3.1 How are IS change processes organised in FM? RQ 3.2 How can IS change processes add value in FM? RQ 3.3 How can IS/IT interoperability be included in IS change processes in FM?
In RQ 3.1 different aspects of the organisation of implementation processes are analysed, such as IS scope and formal control mechanisms. RQ 3.2 investigates how parameters such as efficiency and effectiveness can help understand the value added by IS. RQ 3.3 has a focus on how IS/IT interoperability on different technical and organisational levels can be included in IS change processes.
Different strategies may be applied to IS implementation processes, each having different impacts on the change taking place. This implicates a sub research question of a more practical oriented nature and central to the aim and contribution of this research:
RQ 3.4 What types of strategies are applied to IS change processes in FM organisations? RQ 4 Additional insights gained As a side benefit this investigation revealed some additional insights and information as expressed in the following sub research questions:
RQ 4.1 What type of IS and IT are being used and implemented in FM? RQ 4.2 What type of BP are supported by IT/IS in FM?
Poul Ebbesen: Adding Value to FM with IT PhD Dissertation PART 1 January 2016
DTU Management 20
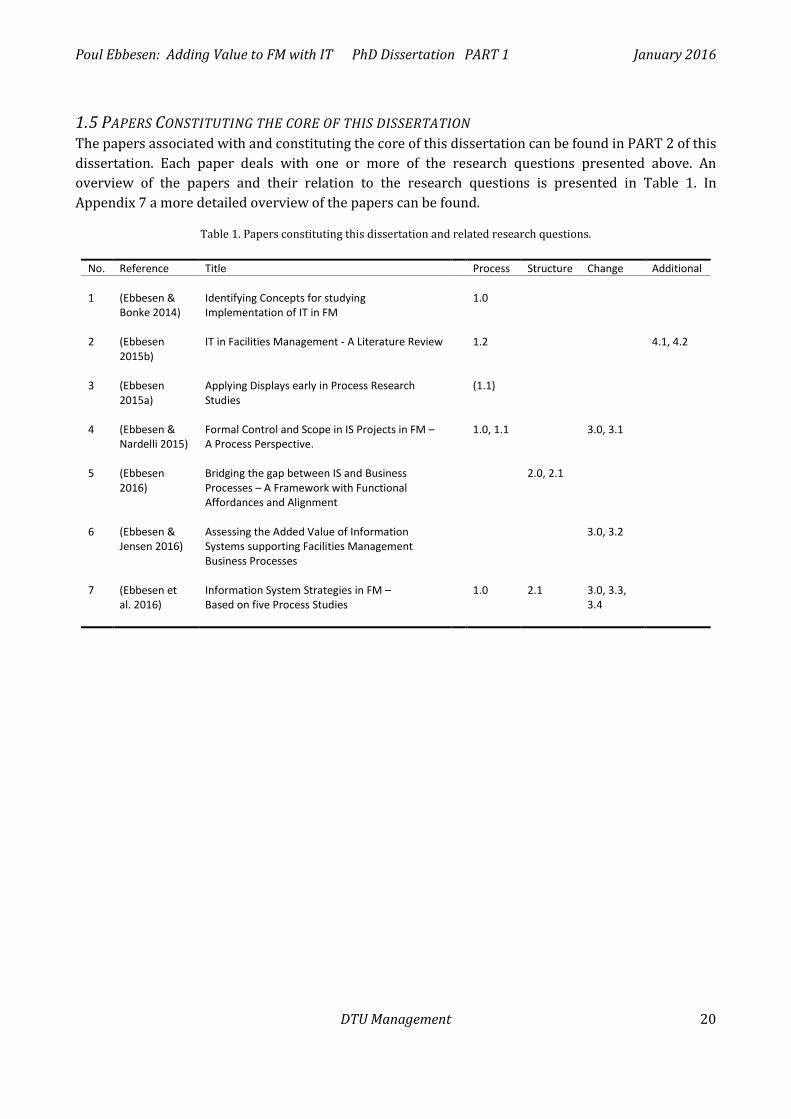
1.5 PAPERS CONSTITUTING THE CORE OF THIS DISSERTATION The papers associated with and constituting the core of this dissertation can be found in PART 2 of this dissertation. Each paper deals with one or more of the research questions presented above. An overview of the papers and their relation to the research questions is presented in Table 1. In Appendix 7 a more detailed overview of the papers can be found.
Table 1. Papers constituting this dissertation and related research questions.
No. Reference Title Process Structure Change Additional 1 (Ebbesen &
Bonke 2014) Identifying Concepts for studying Implementation of IT in FM
1.0
2 (Ebbesen 2015b)
IT in Facilities Management - A Literature Review
1.2 4.1, 4.2
3 (Ebbesen 2015a)
Applying Displays early in Process Research Studies
(1.1)
4 (Ebbesen & Nardelli 2015)
Formal Control and Scope in IS Projects in FM – A Process Perspective.
1.0, 1.1 3.0, 3.1
5 (Ebbesen 2016)
Bridging the gap between IS and Business Processes – A Framework with Functional Affordances and Alignment
2.0, 2.1
6 (Ebbesen & Jensen 2016)
Assessing the Added Value of Information Systems supporting Facilities Management Business Processes
3.0, 3.2
7 (Ebbesen et al. 2016)
Information System Strategies in FM – Based on five Process Studies
1.0 2.1 3.0, 3.3, 3.4
Poul Ebbesen: Adding Value to FM with IT PhD Dissertation PART 1 January 2016
DTU Management 21
1.6 STRUCTURE OF THIS DISSERTATION This dissertation consists of two parts: PART 1 which contains the text or cover of the dissertation and PART 2 which contains the papers written by the author (and co-authors). PART 1 is a complete summary of the PhD project and can be read alone. PART 1 refers to papers in PART 2 and contains text from the papers in PART 2. The papers in PART 2 contains dives into specific issues investigated in this PhD project, and can be read to obtain a more detailed insight into these issues. PART 1 explains the path leading to the content of the papers in PART 2. Each paper in PART 2 is presented in “its own” specific section in PART 1. The titles of these specific sections include the paper number in bold letters.
Papers in PART 2 are in the following referred to by use of the number of the paper. As an example Paper 2 by Ebbesen (2015b) is therefore just referred to as Paper 1.
PART 1 is structured as follows: In the next section 2 the philosophical stance is explained. In section 3 the research design and the methods used for data collection and data analysis is presented. In section 4 the empirical field of FM and IT/IS in FM, and the cases are presented. In section 5 a synthesis of the collected data is presented. Section 6 gives an overview of existing literature relevant for the issues studied in this research. In section 7 concepts and theories used in this inquiry are presented. In section 8 the main findings are presented and finally in section 9 it is discussed and concluded whether answers to the research questions have been found.
Poul Ebbesen: Adding Value to FM with IT PhD Dissertation PART 1 January 2016
DTU Management 22
2 METHODOLOGY This section explains the research methodology applied to this research, including the ontological and epistemological assumptions that ground this research. Furthermore process research methodology and methods are presented.
2.1 ONTOLOGICAL AND EPISTEMOLOGICAL STANCE Ontological assumption The ontological assumption is concerned with the nature of reality. Positivism and interpretivism are two extremities of a continuous line of ontological assumptions (Collis & Hussey 2009). Positivists believe social reality is objective and external to the researcher, and therefore there is only one reality. Interpretivists believe that social reality is subjective because it is socially constructed. Therefore, each person has his or her own sense of reality and there are multiple realities. The natural science research paradigm is most often based on positivism. The research paradigm social science can be based anywhere between positivism and interpretivism on the continuous line of ontological assumptions.
This research is positioned within the social science paradigm and applies an ontological stance between positivism and interpretivism. Using the typology with six categories or steps on the continuous line of ontological assumptions in Collis & Hussey (2009, p. 61), this research could be positioned in category two or three; seeing reality as a concrete process and as a contextual field of information. Furthermore this research attempts to generate theory from rich empirical data which interpretivist research often tends to do. All in all this research can be said to apply a “moderate interpretivist stance” although there is no fixed definition of what it implies. One for this research relevant quality of the “moderate interpretivist” view is proposed by Norris (2002), which is that what changes with the passage of time is the meaning or significance we attach to those events, or the kinds of salient detail and narrative structure that we impose on “raw data” of an otherwise inchoate historical record (Norris 2002, p. 33).
Positivism in relation to social science focuses on measuring social phenomena, and interpretivism focuses on exploring the complexity of social phenomena with a view to gain interpretive understanding. Therefore rather than adopting quantitative methods (where findings are derived from statistical analysis of the quantitative data) used by strict positivists, interpretivists adopt a range of mainly qualitative methods that “seek to describe, translate and otherwise come to terms with the meaning, not the frequency of certain more or less naturally occurring phenomena in the social world” (Van Maaen 1983 in Collis & Hussey 2009).
In this research the social phenomena being explored is the complex IS implementation processes and the underlying structures being changed during this process. The main qualitative methods applied to this research are interviewing, transcribing, coding and event mapping methods and techniques.
Epistemological assumption The epistemological assumption is about knowledge and knowing and is concerned with what we accept as valid knowledge. Positivists believe that only phenomena that are observable and measurable can be validly regarded as knowledge. They try to obtain an independent and objective stance. Interpretivists interact with the phenomena being researched and attempt to minimize the distance between the researcher and that being researched.
Poul Ebbesen: Adding Value to FM with IT PhD Dissertation PART 1 January 2016
DTU Management 23
As mentioned this research applies a “moderate interpretivist stance” which therefore implies that knowledge of the observer does matter. Furthermore the distance to that being observed, which in reality is the interview respondent’s experience and narrative, is tried minimized.
2.2 PROCESS ONTOLOGIES AND PROCESS STUDIES Methodologically this study belongs to the research field of process studies. “Process studies address questions about how and why things emerge, develop, grow, or terminate over time, as distinct from variance questions dealing with covariance among dependent and independent variables” (Langley et al. 2013). “Knowing that organisational practice B is generally more effective than organisational practice A reveals almost nothing about how to move over time from A to B” (Langley & Tsoukas 2010).
Processes and temporality “can be viewed from different ontologies of the social world: one world made of things in which processes represent change in things (grounded in a substantive meta- physics) and the other a world of processes, in which things are reifications of processes” (Tsoukas 2005 in Van de Ven & Poole 2005). These two different views can be traced back to antiquity. “Democritus pictured all of nature as composed of stable material substances that changed only in their positioning in space and time. In contrast Heraclitus viewed reality, not as a constellation of things but as one of processes. He argued that Process is fundamental: The river is not an object but an ever changing flow; the sun is not a thing, but a flaming fire. Everything in nature is a matter of process, of activity, of change" (Rescher, 1996, p. 10 in Van de Ven & Poole 2005).
When it comes to organisational change we can then either have a viewpoint and associated theories that presuppose that an “organization is a social entity or structure (a thing or a noun) that retains its identity while changing from one state to another over time” (Van de Ven & Poole 2005). Alternatively we have a viewpoint and associated theories that presuppose that organizations are composed solely of organizing processes (Van de Ven & Poole 2005).
This study takes a process ontological view were the world is seen as made of things or entities in which processes represent changes in things. As a consequence of this ontological process stance, it became clear as the research evolved, that a picture or view, of the “thing” that was being changed by the process being studied, was needed. What thing is it that moves or changes from A to B during the process? In this study the process being studied is the IS implementation process, and the thing being changed is understood as the structure (or system) of the IS and BP. The elements constituting this structure and the connections between these elements are being changed during the process. This structure which is conceptualised as a framework in Paper 5 is viewed as a fixed identifiable entity.
In this study the process can be represented by the flowing river and the structure can be represented by the river bed. The change can be represented by the change of the river bed taking place over time because of the process of the flowing river.
2.3 VARIANCE AND PROCESS EPISTEMOLOGIES Two definitions of change are often used in organization studies: (1) an observed difference over time in an organizational entity on selected dimensions; (2) a narrative describing a sequence of events on how development and change unfold (Poole et al. 2000 in Van de Ven & Poole 2005). When the first definition is used, change is typically studied with a ‘variance theory’. The second meaning of change takes an event-driven approach that is often associated with a ‘process theory’ explanation of the
Poul Ebbesen: Adding Value to FM with IT PhD Dissertation PART 1 January 2016
DTU Management 24
temporal order and sequence, in which change events occur based on a story or historical narrative (Van de Ven & Poole 2005). Variance and process methods respectively represent different epistemologies to the study of change and development.
This study applies a process oriented epistemological stance. In other words this study applies a process epistemology.
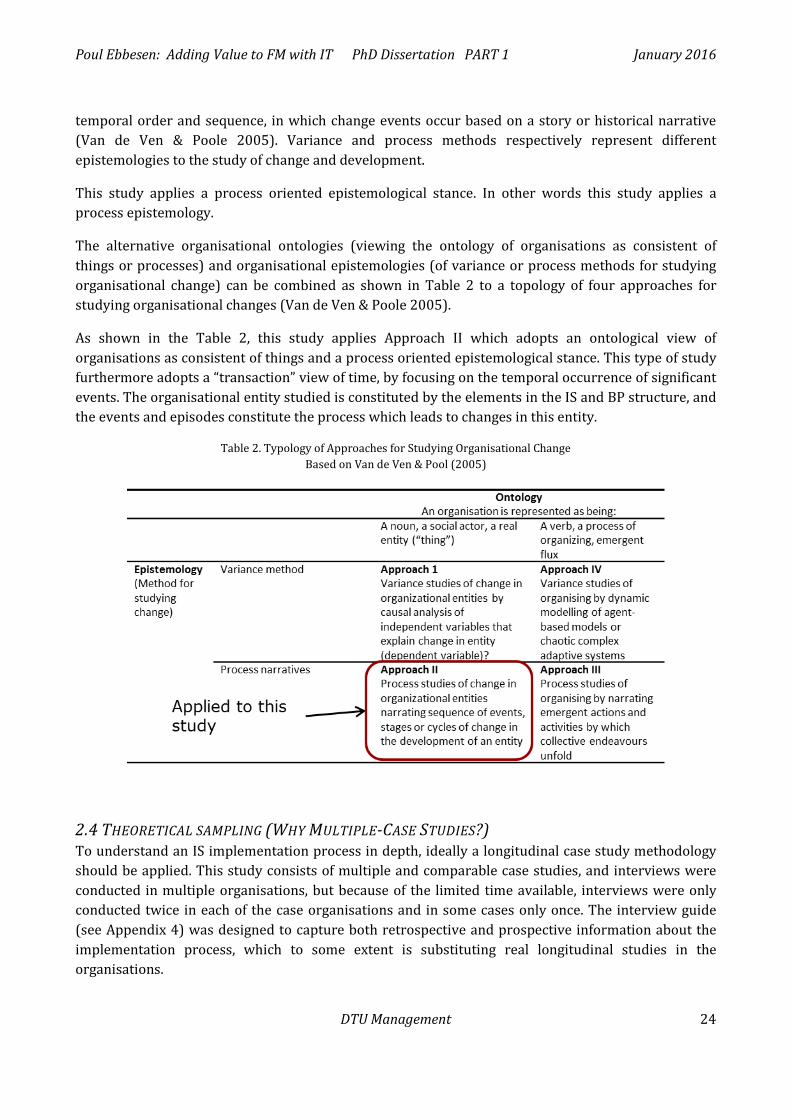
The alternative organisational ontologies (viewing the ontology of organisations as consistent of things or processes) and organisational epistemologies (of variance or process methods for studying organisational change) can be combined as shown in Table 2 to a topology of four approaches for studying organisational changes (Van de Ven & Poole 2005).
As shown in the Table 2, this study applies Approach II which adopts an ontological view of organisations as consistent of things and a process oriented epistemological stance. This type of study furthermore adopts a “transaction” view of time, by focusing on the temporal occurrence of significant events. The organisational entity studied is constituted by the elements in the IS and BP structure, and the events and episodes constitute the process which leads to changes in this entity.
Table 2. Typology of Approaches for Studying Organisational Change Based on Van de Ven & Pool (2005)
2.4 THEORETICAL SAMPLING (WHY MULTIPLE-CASE STUDIES?) To understand an IS implementation process in depth, ideally a longitudinal case study methodology should be applied. This study consists of multiple and comparable case studies, and interviews were conducted in multiple organisations, but because of the limited time available, interviews were only conducted twice in each of the case organisations and in some cases only once. The interview guide (see Appendix 4) was designed to capture both retrospective and prospective information about the implementation process, which to some extent is substituting real longitudinal studies in the organisations.
Poul Ebbesen: Adding Value to FM with IT PhD Dissertation PART 1 January 2016
DTU Management 25
This research follows the methodology outlined in Eisenhardt & Graebner (2007). It builds theory and theory constructs based on studies of multiple cases, and theory is developed inductively from the collected data. “The theory is emergent in the sense that it is situated and developed by recognizing patterns of relationships among constructs within and across the cases and their underlying logical arguments” (Eisenhardt & Graebner 2007).
Theoretical sampling means that cases are selected because they are particularly suitable for illuminating and extending relationships and logic among constructs (Eisenhardt & Graebner 2007). Theoretical sampling of single cases are done because the cases are unusually revelatory, extreme exemplars, or opportunities for unusual research (Yin 2003). But while single-case studies can richly describe the existence of a phenomenon (Siggelkow 2007) multiple-case studies typically provide a stronger base for theory building (Yin 2003). Theory is better grounded, more accurate, and more generalizable when based on multiple cases. Multiple cases enable comparisons that clarify whether an emergent finding is simply idiosyncratic to a single case or consistently replicated by several cases (Eisenhardt & Graebner 2007).
“Multiple cases are chosen for theoretical reasons such as replication, extension of theory, contrary replication, and elimination of alternative explanations” (Yin 2003). “A particularly important theoretical sampling is “polar types”, in which a researcher samples extreme (e.g. very high and very low performance) cases in order to more easily observe contrasting patterns in the data” (Eisenhardt & Graebner 2007). Paper 4 is based on four polar type cases in relation to IS project scope and formal control mechanisms.
The initial core criteria for choosing cases for this multiple case study was that the phenomenon in focus (the IS implementation process) could be studied. Simple as that. But only five of the cases were chosen for the final analysis in this research. These prime cases where chosen based on criteria described in section 3.1.
2.5 INDUCTIVE RESEARCH Inductive and deductive logics are mirrors of one another, with inductive theory building from cases producing new theory from data and deductive theory testing completing the cycle by using data to test theory (Eisenhardt & Graebner 2007). This research applies the first; the inductive theory building from cases producing new theory from data. Others can now deductively test the theory built during this research. It should be mentioned though that use of the inductively developed theory is exemplified in this research, e.g. in Paper 5 and 6.
In this research an inductive logic has mainly been applied. A variety of process theories each explaining different aspects of e.g. socio-technical processes, such as an IS implementation process, can be found in the literature. See section 7. In an attempt to collect rich data, some of these theories were used to apply specific process perspectives to the case interviews. So in a sense the data collection is partly based on existing theory, but the analysis of the collected data is not based on existing theory. On the contrary; through the analysis new theory concerning the process, structure and change was established. Both Paper 4, 5 and 6 are examples of this inductive approach.
Poul Ebbesen: Adding Value to FM with IT PhD Dissertation PART 1 January 2016
DTU Management 26
2.6 PROCESS RESEARCH (PAPER 3 PROCESS RESEARCH AND DISPLAYS) This section is based on Paper 3 and text from the paper is used in this section.
2.6.1 Process research This study is based on process research methodology which often is explained by juxtaposing it with the more used variance research methodology. Example of this can be found in (Olsen & Welke 2013), (Van de Ven & Huber 1990), (Mohr 1982) and (Van de Ven & Poole 2005). In short process models adopt a temporal and longitudinal view of reality and can explain how events and their particular sequence lead to outcomes. In contrast variance models snapshot reality.
Process research is concerned with understanding how things evolve over time and why they evolve in this way (Van de Ven & Huber 1990) in (Langley 1999), and process data therefore consists largely of stories about what happened and who did what when – that is, events, activities, and choices ordered over time. Process research support the ordering of time where events that occure happen in sequence or in parallel sequence and the form of the sequence is vital to understanding the outcome (Ahmad et al. 2011). Events are derived from historical narratives as interpretive acts of what happened (Van de Ven 2005). (Paper 3, p. 3)
Process theory makes identification of new patterns within empirical data possible. The identification of the events, their paths and their sequences permits pattern generation (Ahmad et al. 2011). (Paper 3, p. 4)
2.6.2 Displays in process research A display can be defined as a visual format which presents information systematically so that the user can draw conclusions and take action (Miles et al. 2014). A main goal of data displays is to provide ready access to information and convey a message. Displays can also be used as visual representations of emerging theories (Verdinelli & Scagnoli 2013). Furthermore displays serve as bridgeheads between theoretical ideas and empirical observations. (Dahler-Larsen 2008). (Paper 3, p. 2-3)
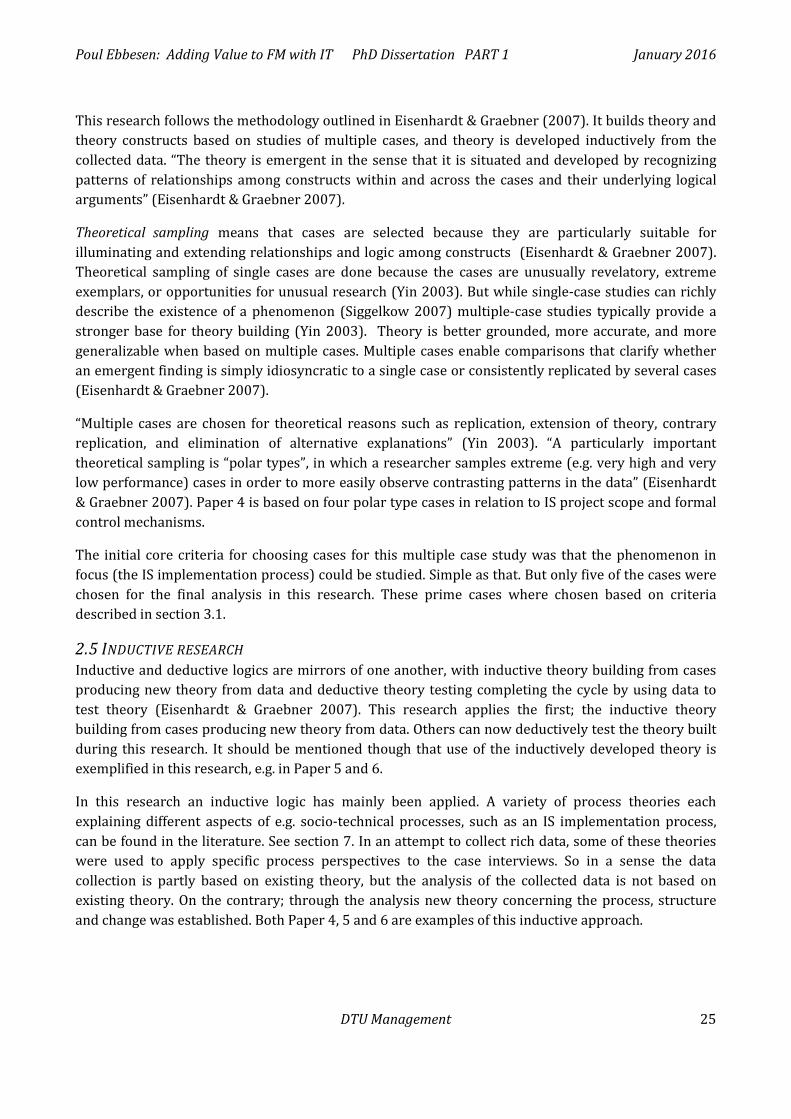
Displays used to visualise processes in process research are not standardized but often include some of the basic elements shown in the “Process Display Template” shown in Figure 4. Events, whether they are e.g. encounters occurring during a short period of time or episodes unfolding over a longer period of time, will often be depicted with boxes as shown. The events will be connected with e.g. arrows indicating relations between the events, e.g. one leading to another or one initiated by another. The process of events is influenced by contextual conditions, shown as downwards pointing arrow boxes in the top of the figure. Events can take place in different domain areas, e.g. a domain inside or outside an organization, or in a technological domain. In Langley (1999) this method of visual mapping of events is described more detailed. Historical or antecedent conditions may influence the event process and the final process will have an outcome. Often each event is quantified and put on some sort of scale, e.g. to which degree the event is positive for the outcome of the process. (Paper 3, p. 4)
In this research events and episodes are placed in domain areas as shown in Figure 4, but each event/episode is not quantified e.g. according to importance, and contextual conditions are not presented in the process display.
Poul Ebbesen: Adding Value to FM with IT PhD Dissertation PART 1 January 2016
DTU Management 27
Figure 4. Process Display Template Basic elements often included in displays used to visualize processes in process research. Inspired by e.g. Langley (1999) and
Ahmad et al. (2011). From Paper 3, Fig. 1
2.6.3 Critical Incident technique and critical events In process research focus is placed on “critical events” which are often found using the Critical Incident Technique (CIT). CIT has become a widely used qualitative research method and is today recognized as an effective exploratory and investigative tool (Butterfield 2005). (Paper 3, p. 5)
Bitner et al. (1990) in Gremler (2004) defined an incident as an observable human activity that is complete enough to allow inferences and predictions to be made about the person performing the act. A critical incident is described as one that makes a significant contribution, either positively or negatively, to an activity or phenomenon (Bitner, Booms, and Tetreault 1990; Grove and Fisk 1997) in Gremler (2004). The data collected are from the respondent’s perspective and in his or her own words (Edvardsson 1992) in Gremler (2004). The CIT method therefore provides a rich source of data by allowing respondents to determine which incidents are the most relevant to them for the phenomenon being investigated. Defining what counts as critical events is up to the researcher (Newman & Robey 1992) and (Robey & Newman 1996) in (Ahmad et al. 2011). (Paper 3, p. 5)
In this research events mentioned by the respondents and perceived, both by the interviewee and the interviewer, as necessary and relevant for describing the phenomena being investigated (the use of IS and the unfolding of the IS implementation process) are critical and are mapped in process displays based on the template in Figure 4 (see Appendices 5 and 6). Relevant domain areas emerged already during the data collection.
2.6.4 Early Introduction of Displays in Process Research By introducing a display type or template early in the research process the display may gradually be populated with data and developed through the whole research process. This approach is acceptable
Poul Ebbesen: Adding Value to FM with IT PhD Dissertation PART 1 January 2016
DTU Management 28
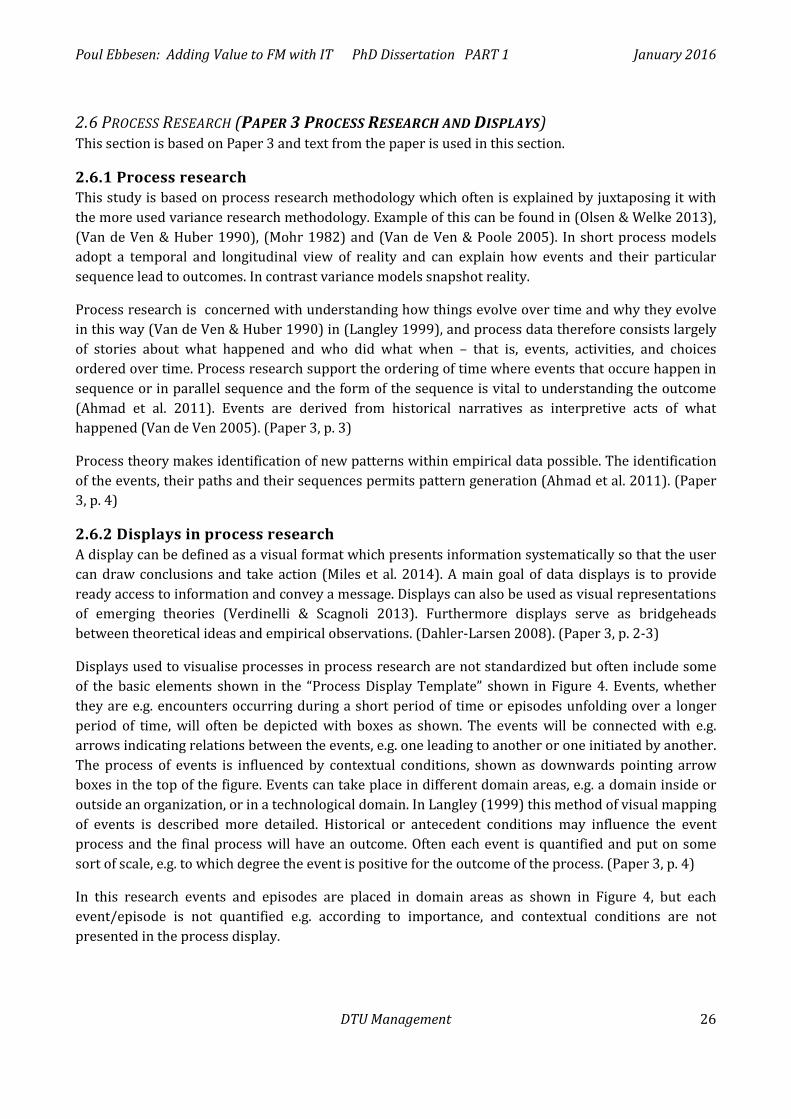
according to Dahler-Larsen (2010: 205f). Furthermore it may guide the research process.” (Paper 3, p. 5). Early introduction of displays in the research process is illustrated in the third row in Figure 5.
Figure 5. Late and Early Display Introduction in the Research Process. First row shows steps in the research process. Second row illustrates a research process where the display for presenting
data and findings is introduced at a late stage. In the third row a display type is introduced early and can therefore be developed and feed during the whole research process. From Paper 3, Fig. 2
Early Display Introduction does not necessarily exclude an inductive research approach. Whether the process display type shown in Figure 4 is fed with data about critical events already during data collection, e.g. while conducting interviews, or it is done late in the data analysis phase, does not influence how data can be interpreted based on the display. In both cases both an inductive and a deductive approach may be applied. (Paper 3, p. 6)
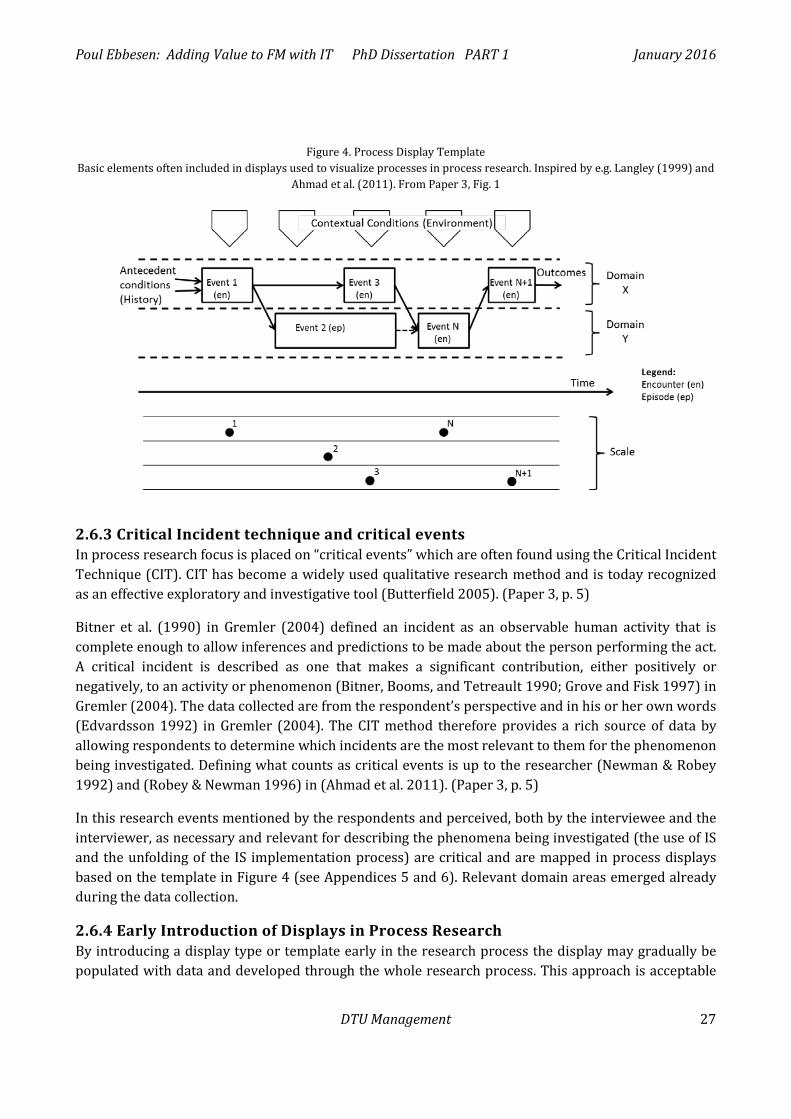
In deductive research the display used may be based on a predefined theory. This is illustrated in Figure 6 where both inductive and deductive research approaches with early display introduction are illustrated. (Paper 3, p. 7)
Figure 6. Early introduction of displays in inductive and deductive research approaches. In inductive research the display will not be influenced by a predefined theory. In a deductive research the display can be
shaped by a predefined theory. From Paper 3, Fig. 3

Poul Ebbesen: Adding Value to FM with IT PhD Dissertation PART 1 January 2016
DTU Management 29
3 RESEARCH DESIGN AND METHODS This section describes the research design and the methods used for data collection and analysis
3.1 RESEARCH DESIGN In the following an overall introduction to the main phases of this inquiry is given. The main phases and their contents are illustrated in Figure 7.
Figure 7. Phases in this research process.
Establishing a research basis To establish a basis for this inquiry an investigation on three areas was conducted. A series of workshops gave a first impression of the current state of practice of IS implementation and use in FM. See Appendix 2. The workshops had participants from all parts of the FM supply chain, including facilities managers, FM suppliers and IS suppliers. Current state in research (state of the art) was investigated through a literature review. See Paper 2. Finally a theoretical basis for studying and understanding the concept of processes, e.g. implementation and change processes, was established. See Paper 1. These concepts from different innovation, socio-technical, managerial and organisational theoretical fields were used to guide the collection and analysis of data.
Preparing data collection Based on the established “research basis” an interview guide containing a list of interview questions intended to investigate the unit of analysis, which is the IS implementation process, from different theoretical perspectives were developed. Appendix 4 contains the interview guide.
Data collection Data were collected through semi-structured interviews based on the interview guide. The research design described in this section is inspired by the ”seven stages of an interview inquiry” proposed in Kvale & Brinkmann (2009, p. 102). A more detailed description of the interview is presented in section 3.2.
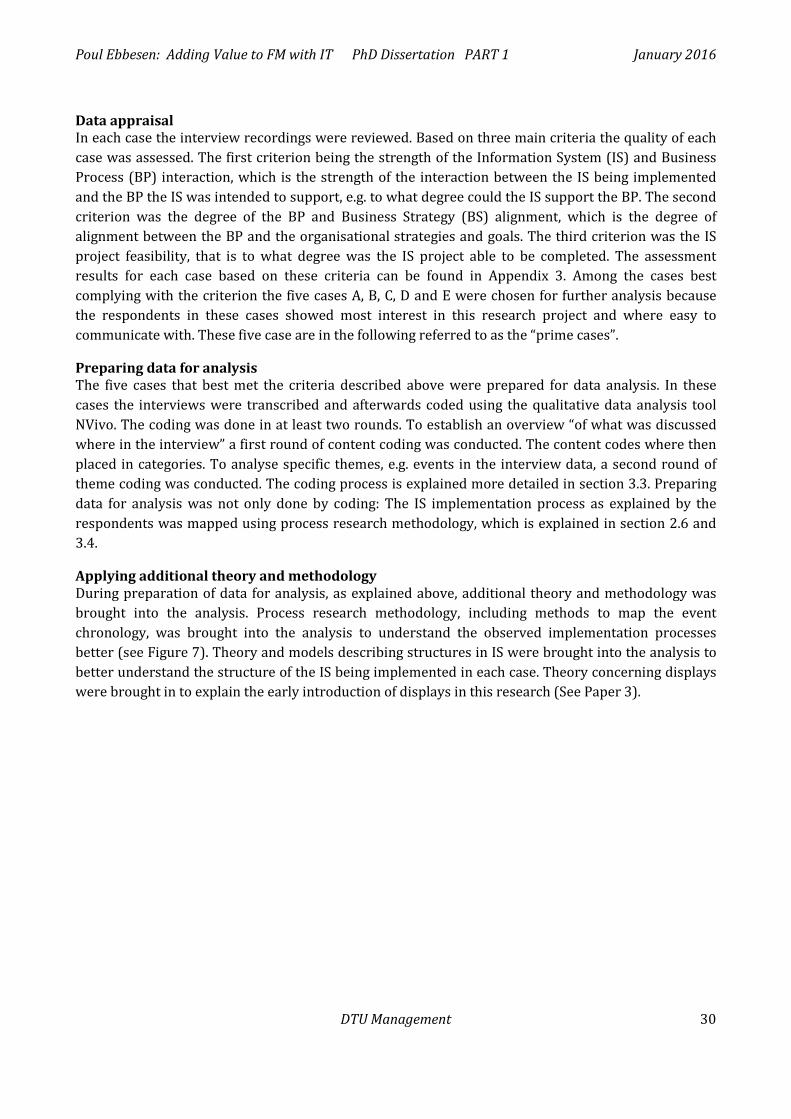
Poul Ebbesen: Adding Value to FM with IT PhD Dissertation PART 1 January 2016
DTU Management 30
Data appraisal In each case the interview recordings were reviewed. Based on three main criteria the quality of each case was assessed. The first criterion being the strength of the Information System (IS) and Business Process (BP) interaction, which is the strength of the interaction between the IS being implemented and the BP the IS was intended to support, e.g. to what degree could the IS support the BP. The second criterion was the degree of the BP and Business Strategy (BS) alignment, which is the degree of alignment between the BP and the organisational strategies and goals. The third criterion was the IS project feasibility, that is to what degree was the IS project able to be completed. The assessment results for each case based on these criteria can be found in Appendix 3. Among the cases best complying with the criterion the five cases A, B, C, D and E were chosen for further analysis because the respondents in these cases showed most interest in this research project and where easy to communicate with. These five case are in the following referred to as the “prime cases”.
Preparing data for analysis The five cases that best met the criteria described above were prepared for data analysis. In these cases the interviews were transcribed and afterwards coded using the qualitative data analysis tool NVivo. The coding was done in at least two rounds. To establish an overview “of what was discussed where in the interview” a first round of content coding was conducted. The content codes where then placed in categories. To analyse specific themes, e.g. events in the interview data, a second round of theme coding was conducted. The coding process is explained more detailed in section 3.3. Preparing data for analysis was not only done by coding: The IS implementation process as explained by the respondents was mapped using process research methodology, which is explained in section 2.6 and 3.4.
Applying additional theory and methodology During preparation of data for analysis, as explained above, additional theory and methodology was brought into the analysis. Process research methodology, including methods to map the event chronology, was brought into the analysis to understand the observed implementation processes better (see Figure 7). Theory and models describing structures in IS were brought into the analysis to better understand the structure of the IS being implemented in each case. Theory concerning displays were brought in to explain the early introduction of displays in this research (See Paper 3).
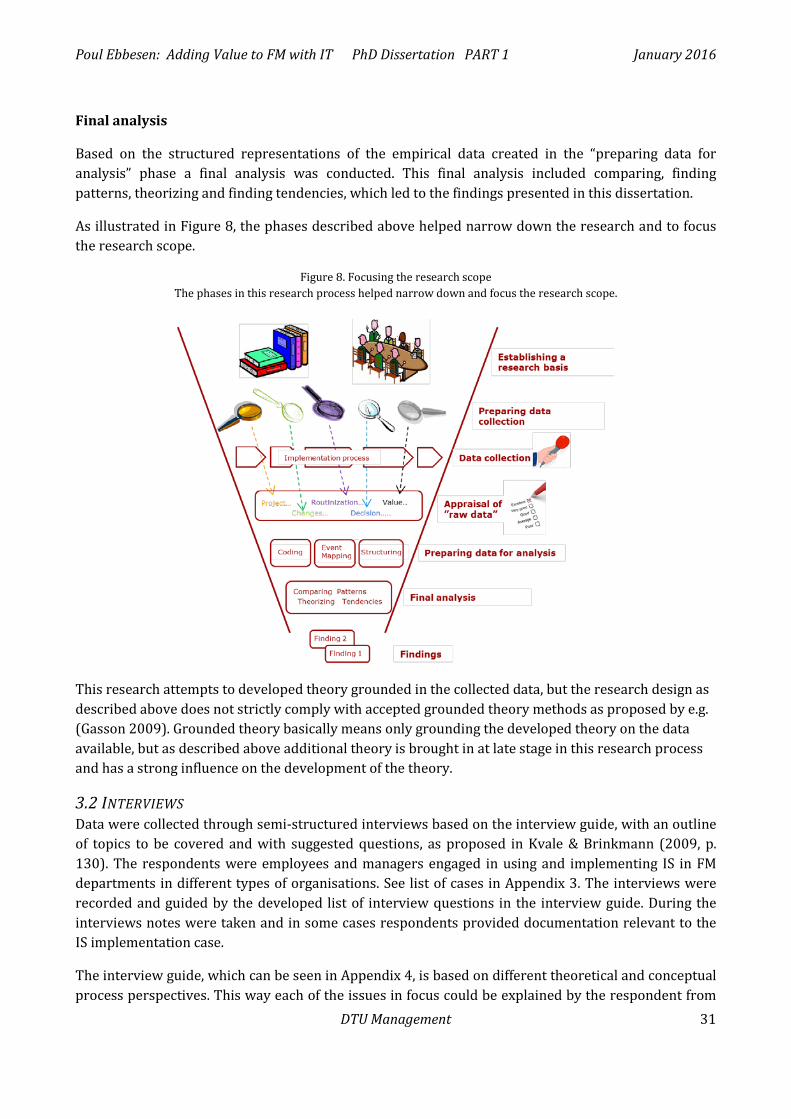
Poul Ebbesen: Adding Value to FM with IT PhD Dissertation PART 1 January 2016
DTU Management 31
Final analysis
Based on the structured representations of the empirical data created in the “preparing data for analysis” phase a final analysis was conducted. This final analysis included comparing, finding patterns, theorizing and finding tendencies, which led to the findings presented in this dissertation.
As illustrated in Figure 8, the phases described above helped narrow down the research and to focus the research scope.
Figure 8. Focusing the research scope The phases in this research process helped narrow down and focus the research scope.
This research attempts to developed theory grounded in the collected data, but the research design as described above does not strictly comply with accepted grounded theory methods as proposed by e.g. (Gasson 2009). Grounded theory basically means only grounding the developed theory on the data available, but as described above additional theory is brought in at late stage in this research process and has a strong influence on the development of the theory.
3.2 INTERVIEWS Data were collected through semi-structured interviews based on the interview guide, with an outline of topics to be covered and with suggested questions, as proposed in Kvale & Brinkmann (2009, p. 130). The respondents were employees and managers engaged in using and implementing IS in FM departments in different types of organisations. See list of cases in Appendix 3. The interviews were recorded and guided by the developed list of interview questions in the interview guide. During the interviews notes were taken and in some cases respondents provided documentation relevant to the IS implementation case.
The interview guide, which can be seen in Appendix 4, is based on different theoretical and conceptual process perspectives. This way each of the issues in focus could be explained by the respondent from
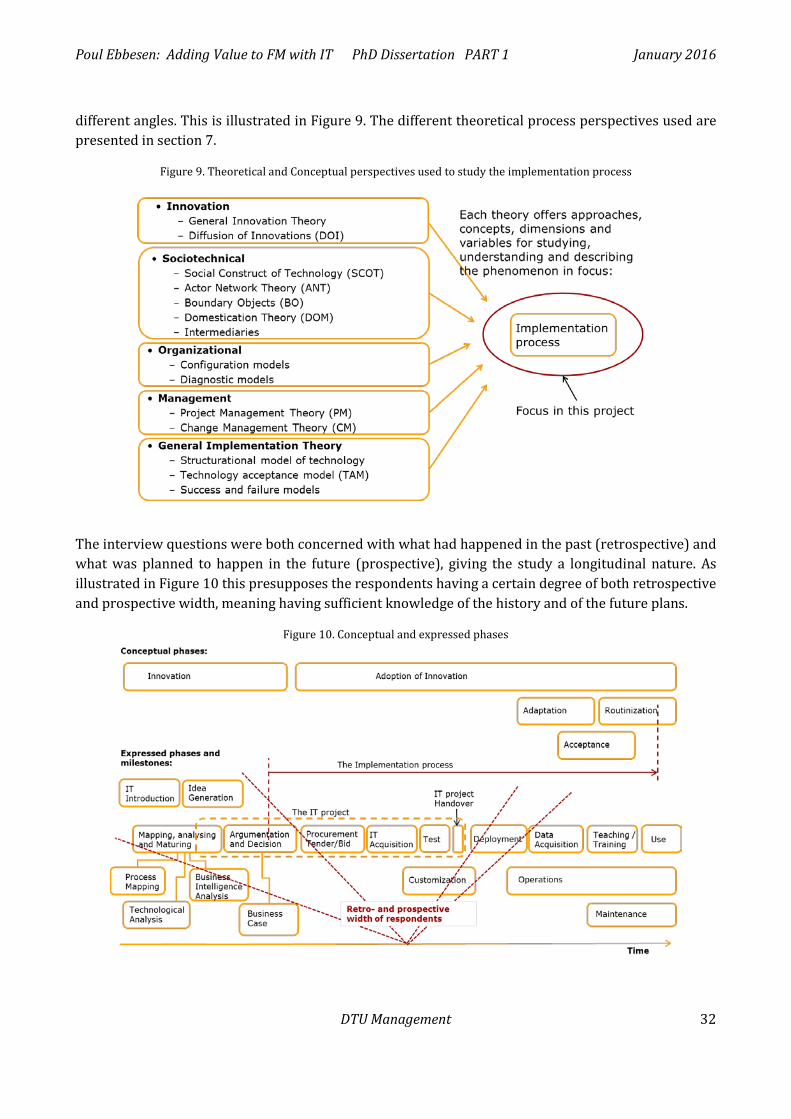
Poul Ebbesen: Adding Value to FM with IT PhD Dissertation PART 1 January 2016
DTU Management 32
different angles. This is illustrated in Figure 9. The different theoretical process perspectives used are presented in section 7.
Figure 9. Theoretical and Conceptual perspectives used to study the implementation process
The interview questions were both concerned with what had happened in the past (retrospective) and what was planned to happen in the future (prospective), giving the study a longitudinal nature. As illustrated in Figure 10 this presupposes the respondents having a certain degree of both retrospective and prospective width, meaning having sufficient knowledge of the history and of the future plans.
Figure 10. Conceptual and expressed phases
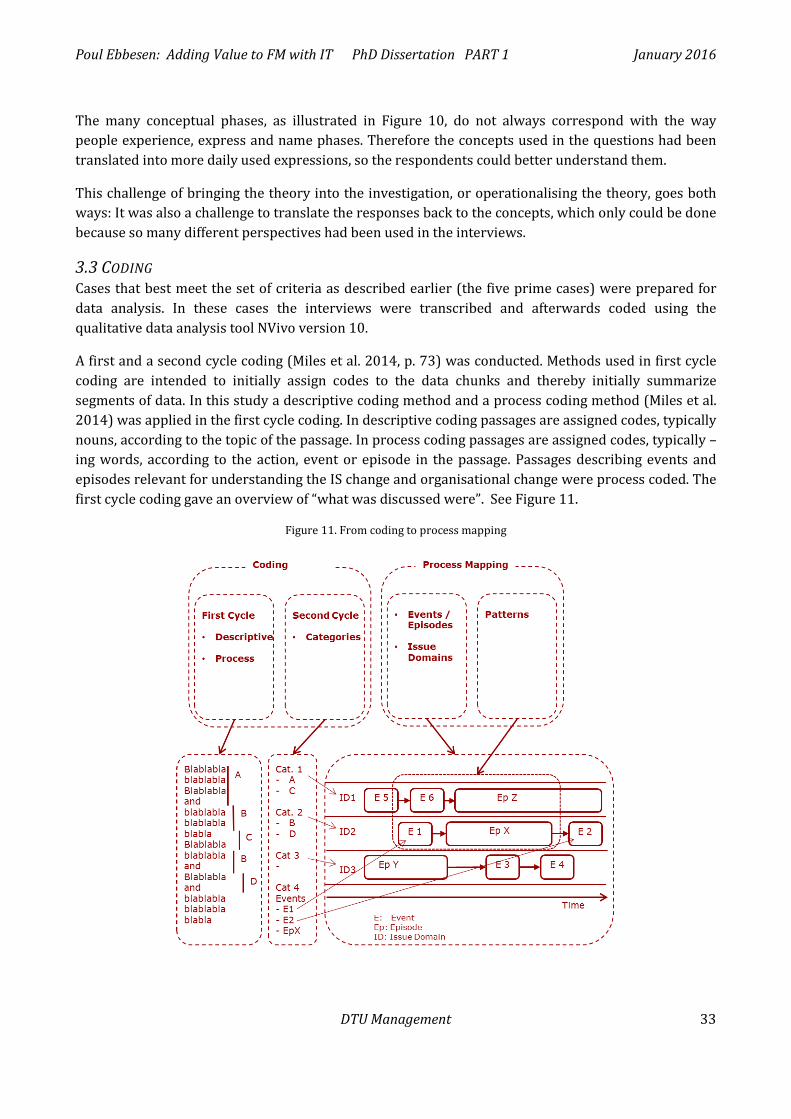
Poul Ebbesen: Adding Value to FM with IT PhD Dissertation PART 1 January 2016
DTU Management 33
The many conceptual phases, as illustrated in Figure 10, do not always correspond with the way people experience, express and name phases. Therefore the concepts used in the questions had been translated into more daily used expressions, so the respondents could better understand them.
This challenge of bringing the theory into the investigation, or operationalising the theory, goes both ways: It was also a challenge to translate the responses back to the concepts, which only could be done because so many different perspectives had been used in the interviews.
3.3 CODING Cases that best meet the set of criteria as described earlier (the five prime cases) were prepared for data analysis. In these cases the interviews were transcribed and afterwards coded using the qualitative data analysis tool NVivo version 10.
A first and a second cycle coding (Miles et al. 2014, p. 73) was conducted. Methods used in first cycle coding are intended to initially assign codes to the data chunks and thereby initially summarize segments of data. In this study a descriptive coding method and a process coding method (Miles et al. 2014) was applied in the first cycle coding. In descriptive coding passages are assigned codes, typically nouns, according to the topic of the passage. In process coding passages are assigned codes, typically –ing words, according to the action, event or episode in the passage. Passages describing events and episodes relevant for understanding the IS change and organisational change were process coded. The first cycle coding gave an overview of “what was discussed were”. See Figure 11.
Figure 11. From coding to process mapping
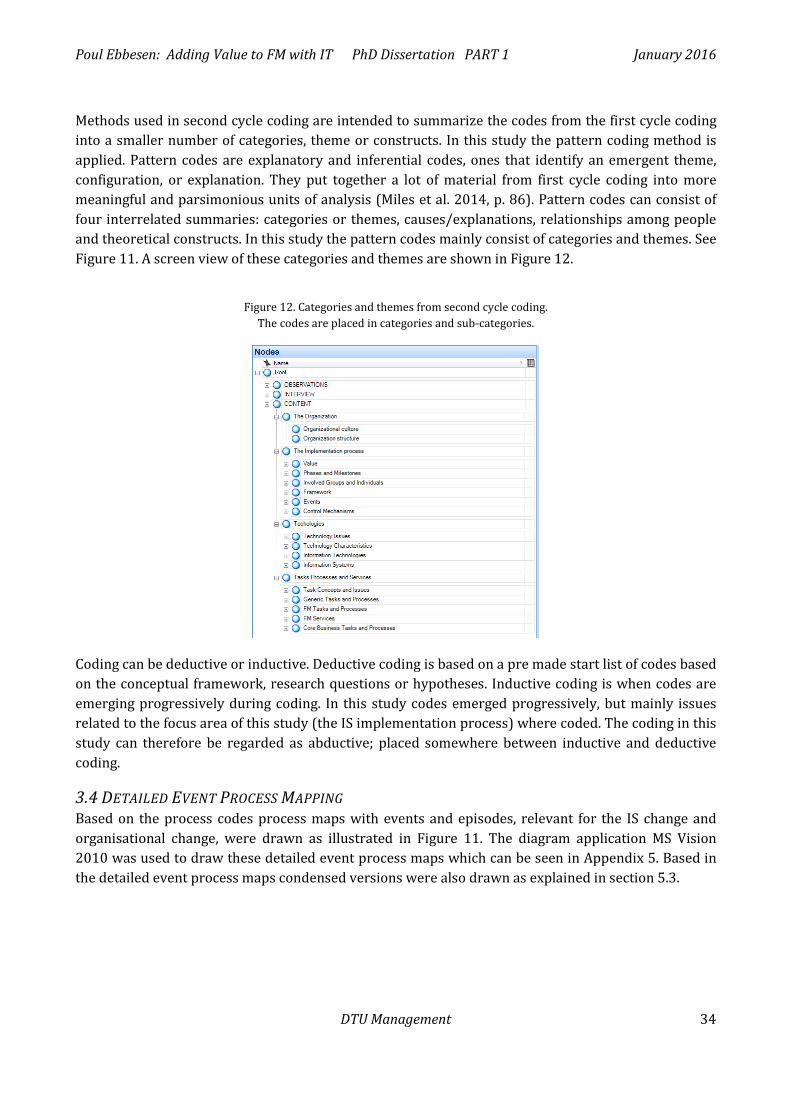
Poul Ebbesen: Adding Value to FM with IT PhD Dissertation PART 1 January 2016
DTU Management 34
Methods used in second cycle coding are intended to summarize the codes from the first cycle coding into a smaller number of categories, theme or constructs. In this study the pattern coding method is applied. Pattern codes are explanatory and inferential codes, ones that identify an emergent theme, configuration, or explanation. They put together a lot of material from first cycle coding into more meaningful and parsimonious units of analysis (Miles et al. 2014, p. 86). Pattern codes can consist of four interrelated summaries: categories or themes, causes/explanations, relationships among people and theoretical constructs. In this study the pattern codes mainly consist of categories and themes. See Figure 11. A screen view of these categories and themes are shown in Figure 12.
Figure 12. Categories and themes from second cycle coding.
The codes are placed in categories and sub-categories.
Coding can be deductive or inductive. Deductive coding is based on a pre made start list of codes based on the conceptual framework, research questions or hypotheses. Inductive coding is when codes are emerging progressively during coding. In this study codes emerged progressively, but mainly issues related to the focus area of this study (the IS implementation process) where coded. The coding in this study can therefore be regarded as abductive; placed somewhere between inductive and deductive coding.
3.4 DETAILED EVENT PROCESS MAPPING Based on the process codes process maps with events and episodes, relevant for the IS change and organisational change, were drawn as illustrated in Figure 11. The diagram application MS Vision 2010 was used to draw these detailed event process maps which can be seen in Appendix 5. Based in the detailed event process maps condensed versions were also drawn as explained in section 5.3.
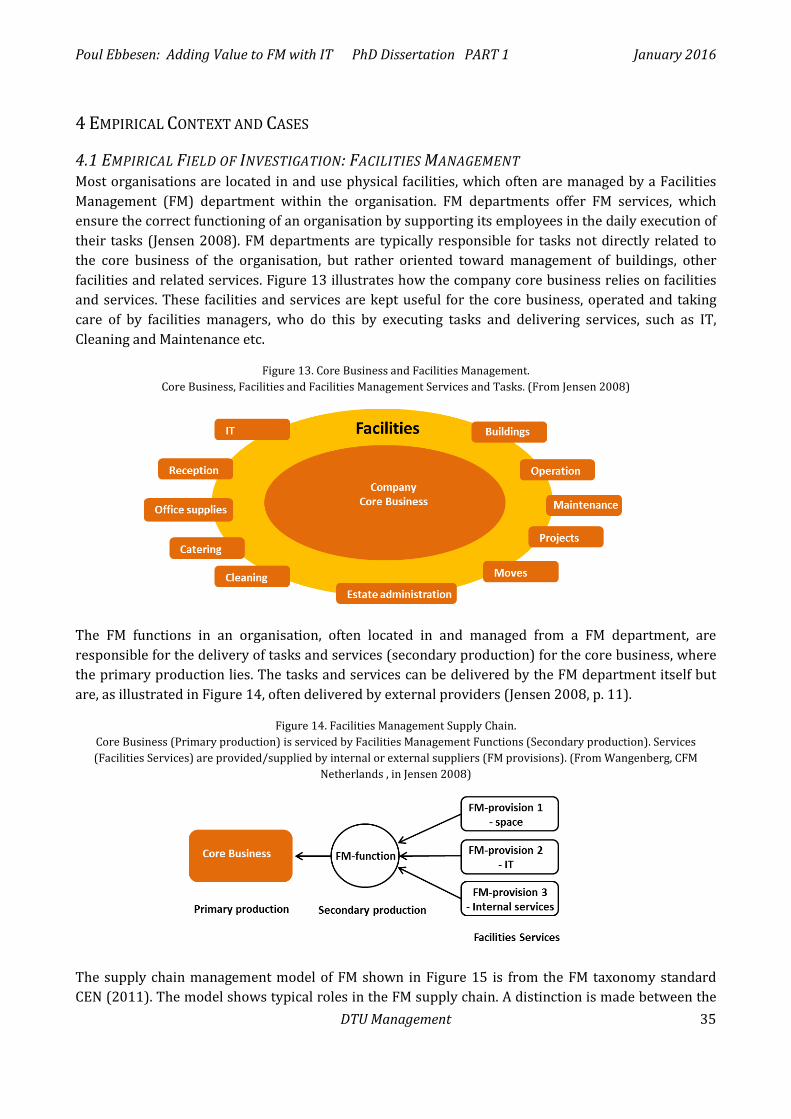
Poul Ebbesen: Adding Value to FM with IT PhD Dissertation PART 1 January 2016
DTU Management 35
4 EMPIRICAL CONTEXT AND CASES
4.1 EMPIRICAL FIELD OF INVESTIGATION: FACILITIES MANAGEMENT Most organisations are located in and use physical facilities, which often are managed by a Facilities Management (FM) department within the organisation. FM departments offer FM services, which ensure the correct functioning of an organisation by supporting its employees in the daily execution of their tasks (Jensen 2008). FM departments are typically responsible for tasks not directly related to the core business of the organisation, but rather oriented toward management of buildings, other facilities and related services. Figure 13 illustrates how the company core business relies on facilities and services. These facilities and services are kept useful for the core business, operated and taking care of by facilities managers, who do this by executing tasks and delivering services, such as IT, Cleaning and Maintenance etc.
Figure 13. Core Business and Facilities Management. Core Business, Facilities and Facilities Management Services and Tasks. (From Jensen 2008)
The FM functions in an organisation, often located in and managed from a FM department, are responsible for the delivery of tasks and services (secondary production) for the core business, where the primary production lies. The tasks and services can be delivered by the FM department itself but are, as illustrated in Figure 14, often delivered by external providers (Jensen 2008, p. 11).
Figure 14. Facilities Management Supply Chain. Core Business (Primary production) is serviced by Facilities Management Functions (Secondary production). Services (Facilities Services) are provided/supplied by internal or external suppliers (FM provisions). (From Wangenberg, CFM
Netherlands , in Jensen 2008)
The supply chain management model of FM shown in Figure 15 is from the FM taxonomy standard CEN (2011). The model shows typical roles in the FM supply chain. A distinction is made between the
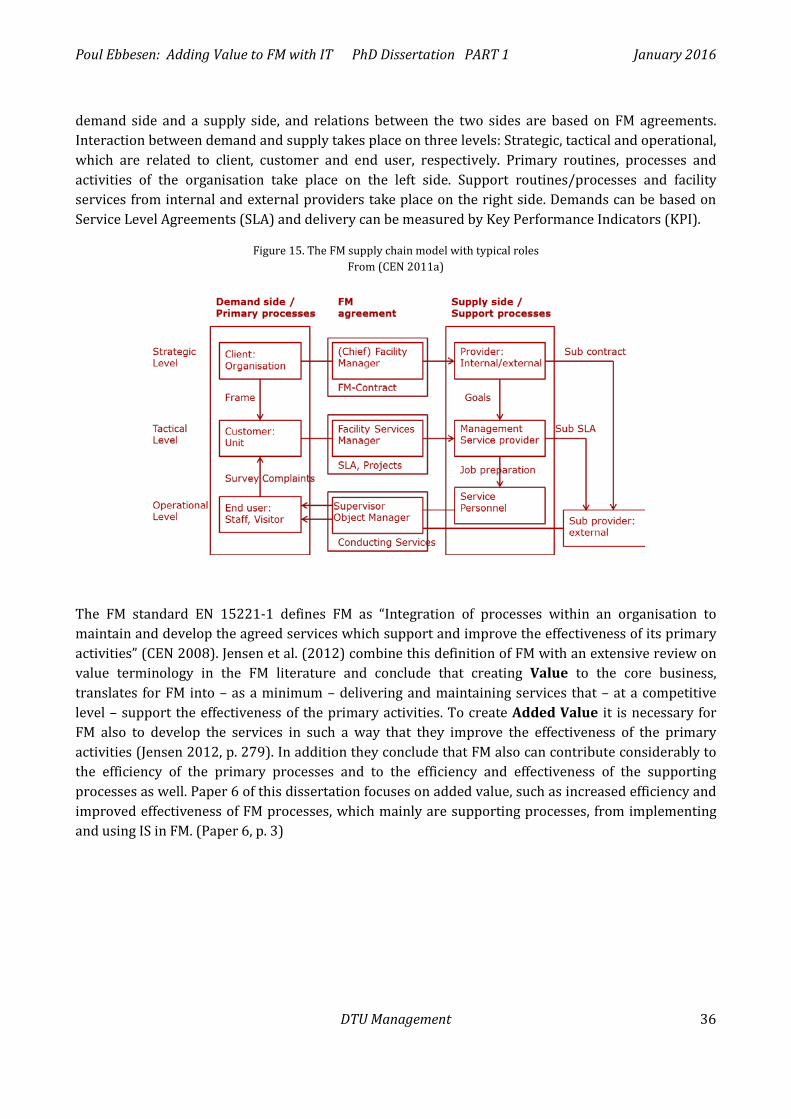
Poul Ebbesen: Adding Value to FM with IT PhD Dissertation PART 1 January 2016
DTU Management 36
demand side and a supply side, and relations between the two sides are based on FM agreements. Interaction between demand and supply takes place on three levels: Strategic, tactical and operational, which are related to client, customer and end user, respectively. Primary routines, processes and activities of the organisation take place on the left side. Support routines/processes and facility services from internal and external providers take place on the right side. Demands can be based on Service Level Agreements (SLA) and delivery can be measured by Key Performance Indicators (KPI).
Figure 15. The FM supply chain model with typical roles From (CEN 2011a)
The FM standard EN 15221-1 defines FM as “Integration of processes within an organisation to maintain and develop the agreed services which support and improve the effectiveness of its primary activities” (CEN 2008). Jensen et al. (2012) combine this definition of FM with an extensive review on value terminology in the FM literature and conclude that creating Value to the core business, translates for FM into – as a minimum – delivering and maintaining services that – at a competitive level – support the effectiveness of the primary activities. To create Added Value it is necessary for FM also to develop the services in such a way that they improve the effectiveness of the primary activities (Jensen 2012, p. 279). In addition they conclude that FM also can contribute considerably to the efficiency of the primary processes and to the efficiency and effectiveness of the supporting processes as well. Paper 6 of this dissertation focuses on added value, such as increased efficiency and improved effectiveness of FM processes, which mainly are supporting processes, from implementing and using IS in FM. (Paper 6, p. 3)

Poul Ebbesen: Adding Value to FM with IT PhD Dissertation PART 1 January 2016
DTU Management 37
4.2 THE PRIME CASES The five prime cases are briefly presented in the following. Additional information about each of the cases is given in subsequent sections. How the prime cases were selected among all the cases is explained in section 3.1.
4.2.1 Case A Case A is in a Danish municipality responsible for 2.2 million square meters of facilities spread around the municipal.
Figure 16. Photo Case A Borrowed from the official website of the municipality
The IS being implemented in case A is primarily for real estate information and workflow management and will be based on BIM and GIS.
Neither the IT department nor other departments in case A are in charge of operating or improving the IS supporting the FM tasks. The IS project in focus is handled by a project team established only to handle this IS project. The project team consists of people from different departments and with different professions and skills. The IS project is led by an appointed project manager.
4.2.2 Case B Case B is a Danish transportation organisation with 0.7 million square meters of facilities.
Figure 17. Photo Case B Borrowed from the official website of the transportation organisation
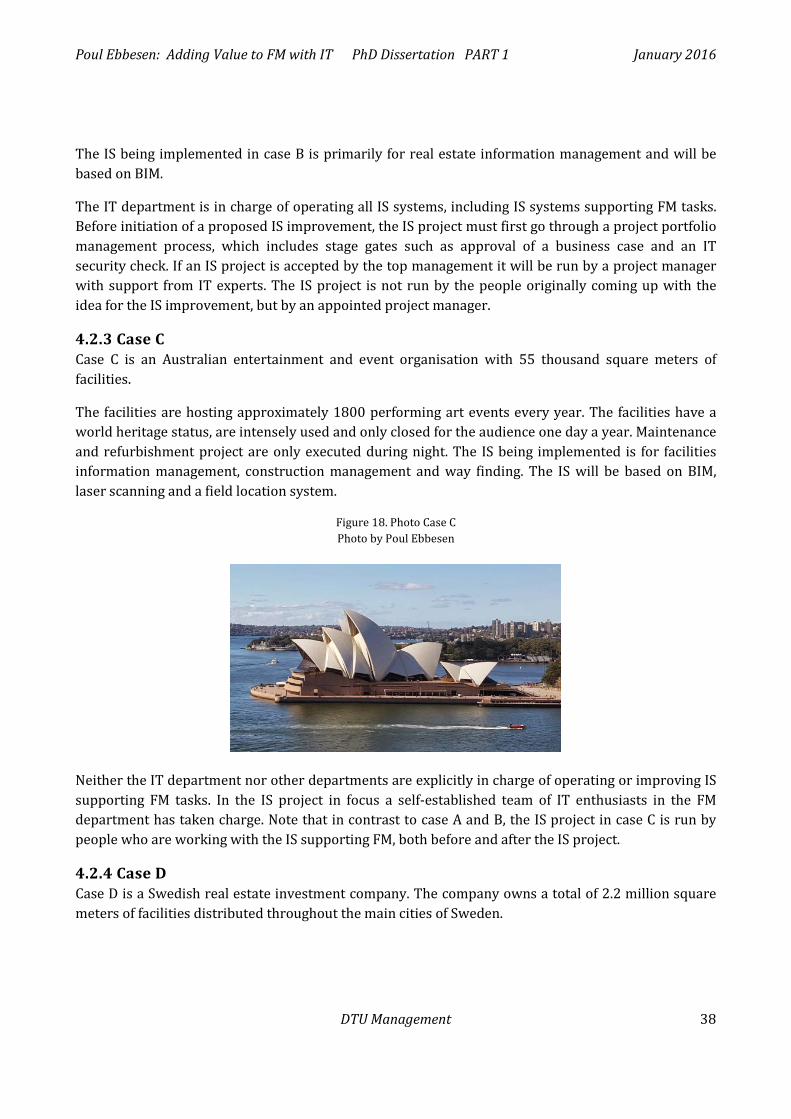
Poul Ebbesen: Adding Value to FM with IT PhD Dissertation PART 1 January 2016
DTU Management 38
The IS being implemented in case B is primarily for real estate information management and will be based on BIM.
The IT department is in charge of operating all IS systems, including IS systems supporting FM tasks. Before initiation of a proposed IS improvement, the IS project must first go through a project portfolio management process, which includes stage gates such as approval of a business case and an IT security check. If an IS project is accepted by the top management it will be run by a project manager with support from IT experts. The IS project is not run by the people originally coming up with the idea for the IS improvement, but by an appointed project manager.
4.2.3 Case C Case C is an Australian entertainment and event organisation with 55 thousand square meters of facilities.
The facilities are hosting approximately 1800 performing art events every year. The facilities have a world heritage status, are intensely used and only closed for the audience one day a year. Maintenance and refurbishment project are only executed during night. The IS being implemented is for facilities information management, construction management and way finding. The IS will be based on BIM, laser scanning and a field location system.
Figure 18. Photo Case C Photo by Poul Ebbesen
Neither the IT department nor other departments are explicitly in charge of operating or improving IS supporting FM tasks. In the IS project in focus a self-established team of IT enthusiasts in the FM department has taken charge. Note that in contrast to case A and B, the IS project in case C is run by people who are working with the IS supporting FM, both before and after the IS project.
4.2.4 Case D Case D is a Swedish real estate investment company. The company owns a total of 2.2 million square meters of facilities distributed throughout the main cities of Sweden.
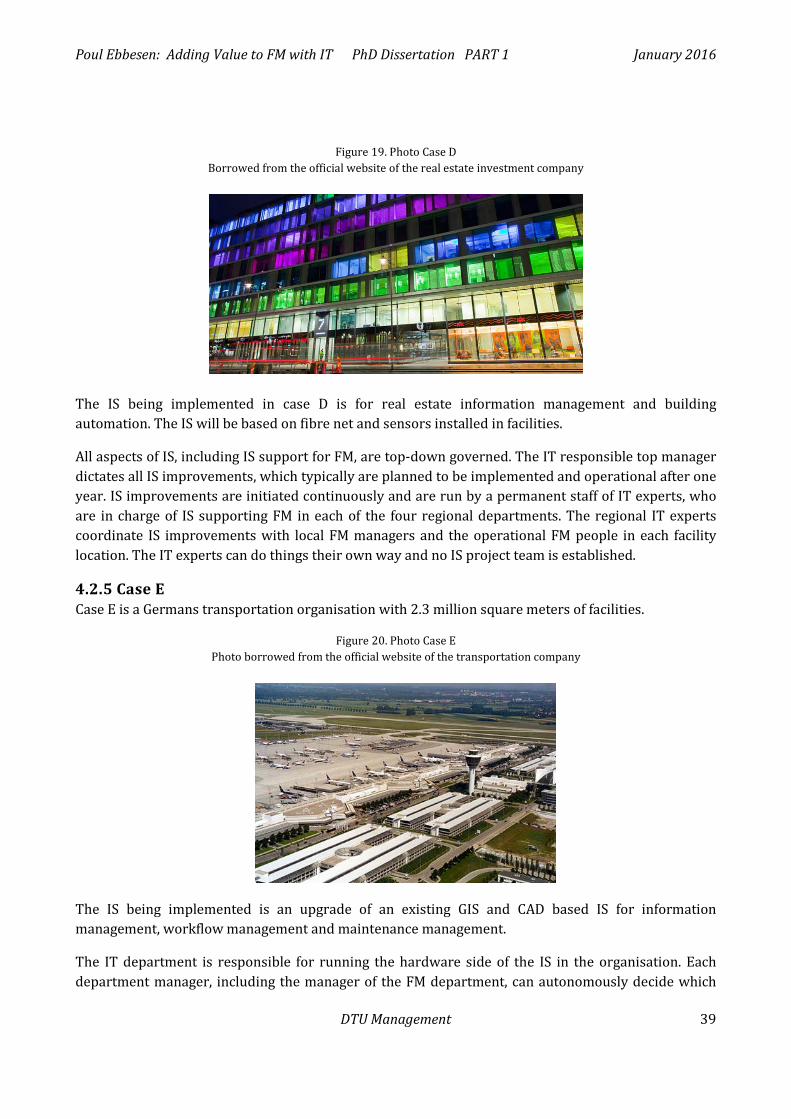
Poul Ebbesen: Adding Value to FM with IT PhD Dissertation PART 1 January 2016
DTU Management 39
Figure 19. Photo Case D Borrowed from the official website of the real estate investment company
The IS being implemented in case D is for real estate information management and building automation. The IS will be based on fibre net and sensors installed in facilities.
All aspects of IS, including IS support for FM, are top-down governed. The IT responsible top manager dictates all IS improvements, which typically are planned to be implemented and operational after one year. IS improvements are initiated continuously and are run by a permanent staff of IT experts, who are in charge of IS supporting FM in each of the four regional departments. The regional IT experts coordinate IS improvements with local FM managers and the operational FM people in each facility location. The IT experts can do things their own way and no IS project team is established.
4.2.5 Case E Case E is a Germans transportation organisation with 2.3 million square meters of facilities.
Figure 20. Photo Case E Photo borrowed from the official website of the transportation company
The IS being implemented is an upgrade of an existing GIS and CAD based IS for information management, workflow management and maintenance management.
The IT department is responsible for running the hardware side of the IS in the organisation. Each department manager, including the manager of the FM department, can autonomously decide which
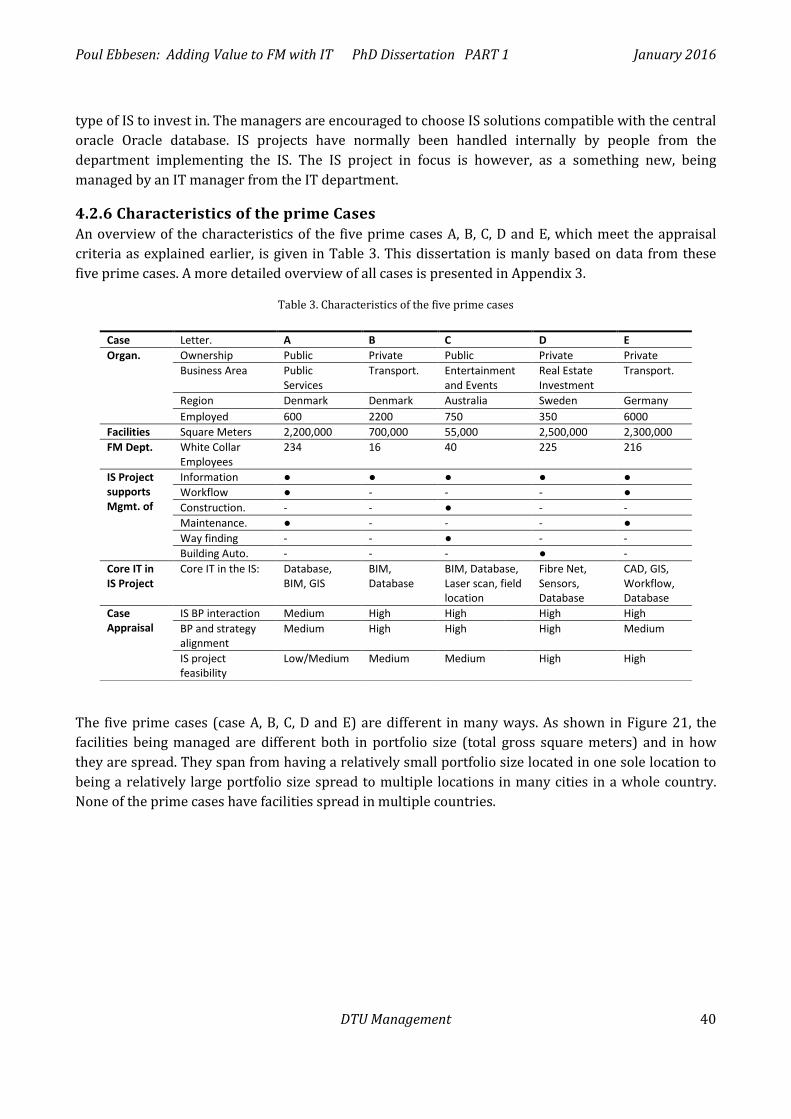
Poul Ebbesen: Adding Value to FM with IT PhD Dissertation PART 1 January 2016
DTU Management 40
type of IS to invest in. The managers are encouraged to choose IS solutions compatible with the central oracle Oracle database. IS projects have normally been handled internally by people from the department implementing the IS. The IS project in focus is however, as a something new, being managed by an IT manager from the IT department.
4.2.6 Characteristics of the prime Cases An overview of the characteristics of the five prime cases A, B, C, D and E, which meet the appraisal criteria as explained earlier, is given in Table 3. This dissertation is manly based on data from these five prime cases. A more detailed overview of all cases is presented in Appendix 3.
Table 3. Characteristics of the five prime cases
Case Letter. A B C D E Organ. Ownership Public Private Public Private Private
Business Area Public Services
Transport. Entertainment and Events
Real Estate Investment
Transport.
Region Denmark Denmark Australia Sweden Germany Employed 600 2200 750 350 6000
Facilities Square Meters 2,200,000 700,000 55,000 2,500,000 2,300,000 FM Dept. White Collar
Employees 234 16 40 225 216
IS Project supports Mgmt. of
Information ● ● ● ● ● Workflow ● - - - ● Construction. - - ● - - Maintenance. ● - - - ● Way finding - - ● - - Building Auto. - - - ● -
Core IT in IS Project
Core IT in the IS: Database, BIM, GIS
BIM, Database
BIM, Database, Laser scan, field location
Fibre Net, Sensors, Database
CAD, GIS, Workflow, Database
Case Appraisal
IS BP interaction Medium High High High High BP and strategy alignment
Medium High High High Medium
IS project feasibility
Low/Medium Medium Medium High High
The five prime cases (case A, B, C, D and E) are different in many ways. As shown in Figure 21, the facilities being managed are different both in portfolio size (total gross square meters) and in how they are spread. They span from having a relatively small portfolio size located in one sole location to being a relatively large portfolio size spread to multiple locations in many cities in a whole country. None of the prime cases have facilities spread in multiple countries.
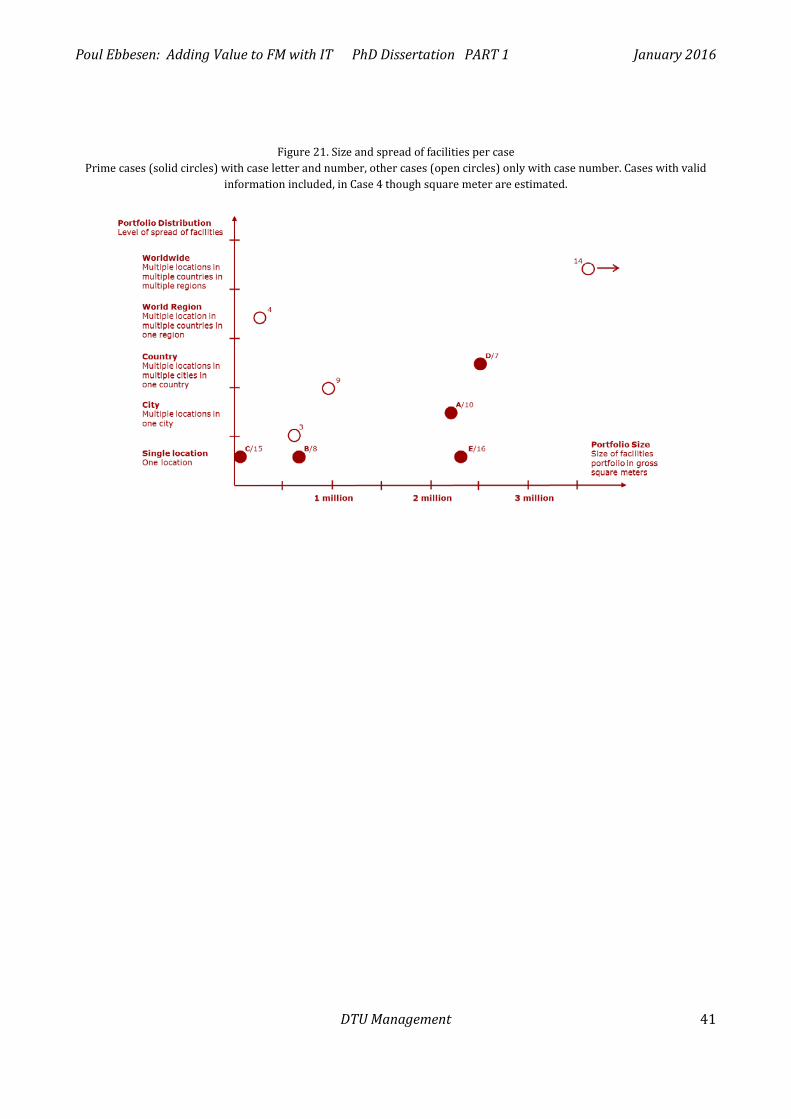
Poul Ebbesen: Adding Value to FM with IT PhD Dissertation PART 1 January 2016
DTU Management 41
Figure 21. Size and spread of facilities per case Prime cases (solid circles) with case letter and number, other cases (open circles) only with case number. Cases with valid
information included, in Case 4 though square meter are estimated.
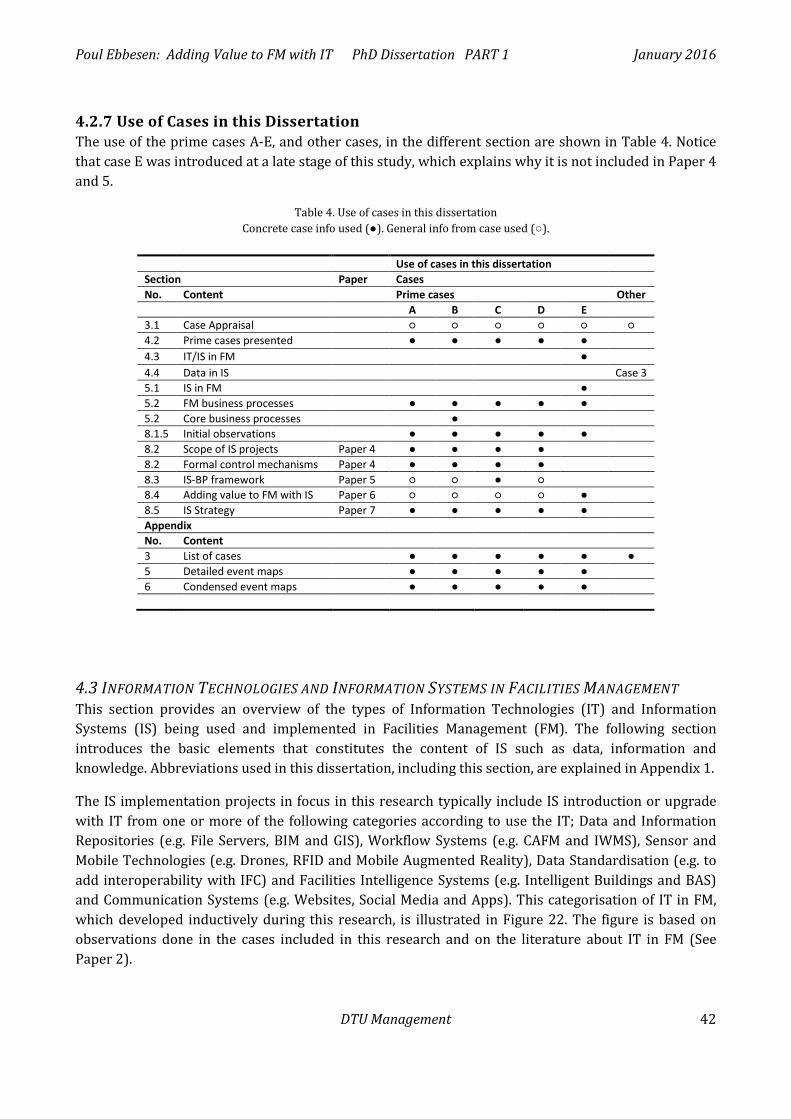
Poul Ebbesen: Adding Value to FM with IT PhD Dissertation PART 1 January 2016
DTU Management 42
4.2.7 Use of Cases in this Dissertation The use of the prime cases A-E, and other cases, in the different section are shown in Table 4. Notice that case E was introduced at a late stage of this study, which explains why it is not included in Paper 4 and 5.
Table 4. Use of cases in this dissertation Concrete case info used (●). General info from case used (○).
Use of cases in this dissertation Section Paper Cases No. Content Prime cases Other A B C D E 3.1 Case Appraisal ○ ○ ○ ○ ○ ○ 4.2 Prime cases presented ● ● ● ● ● 4.3 IT/IS in FM ● 4.4 Data in IS Case 3 5.1 IS in FM ● 5.2 FM business processes ● ● ● ● ● 5.2 Core business processes ● 8.1.5 Initial observations ● ● ● ● ● 8.2 Scope of IS projects Paper 4 ● ● ● ● 8.2 Formal control mechanisms Paper 4 ● ● ● ● 8.3 IS-BP framework Paper 5 ○ ○ ● ○ 8.4 Adding value to FM with IS Paper 6 ○ ○ ○ ○ ● 8.5 IS Strategy Paper 7 ● ● ● ● ● Appendix No. Content 3 List of cases ● ● ● ● ● ● 5 Detailed event maps ● ● ● ● ● 6 Condensed event maps ● ● ● ● ●
4.3 INFORMATION TECHNOLOGIES AND INFORMATION SYSTEMS IN FACILITIES MANAGEMENT This section provides an overview of the types of Information Technologies (IT) and Information Systems (IS) being used and implemented in Facilities Management (FM). The following section introduces the basic elements that constitutes the content of IS such as data, information and knowledge. Abbreviations used in this dissertation, including this section, are explained in Appendix 1.
The IS implementation projects in focus in this research typically include IS introduction or upgrade with IT from one or more of the following categories according to use the IT; Data and Information Repositories (e.g. File Servers, BIM and GIS), Workflow Systems (e.g. CAFM and IWMS), Sensor and Mobile Technologies (e.g. Drones, RFID and Mobile Augmented Reality), Data Standardisation (e.g. to add interoperability with IFC) and Facilities Intelligence Systems (e.g. Intelligent Buildings and BAS) and Communication Systems (e.g. Websites, Social Media and Apps). This categorisation of IT in FM, which developed inductively during this research, is illustrated in Figure 22. The figure is based on observations done in the cases included in this research and on the literature about IT in FM (See Paper 2).
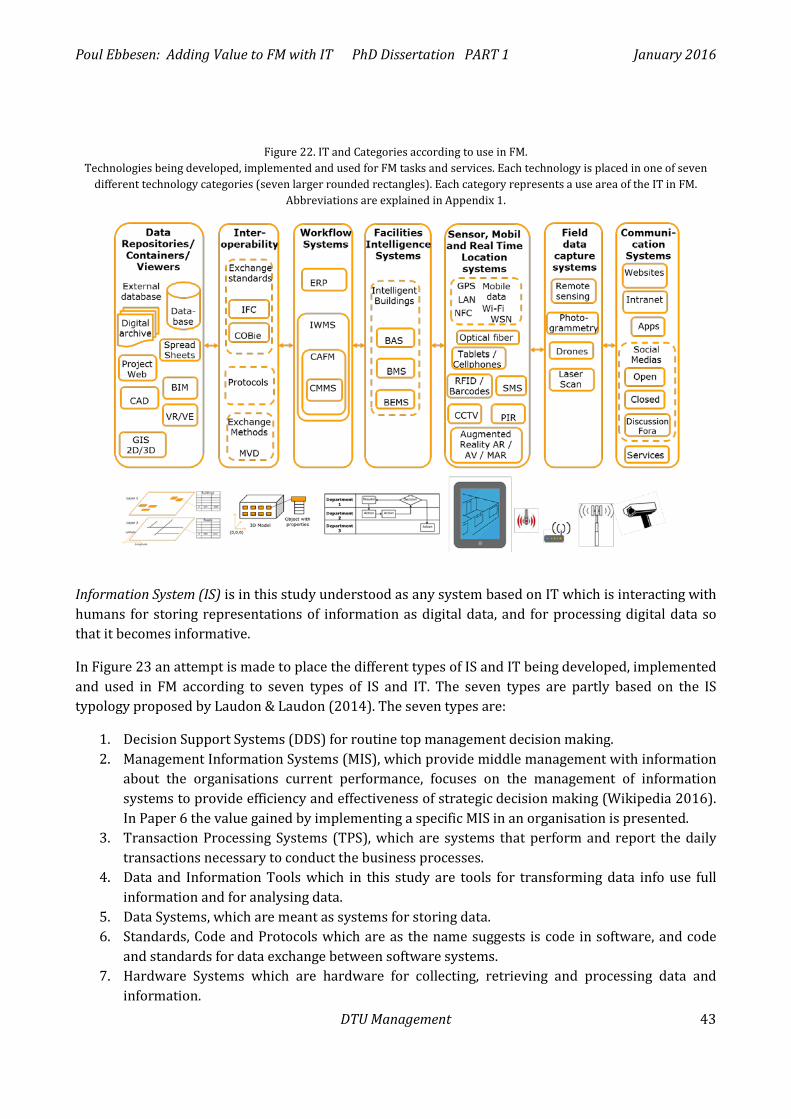
Poul Ebbesen: Adding Value to FM with IT PhD Dissertation PART 1 January 2016
DTU Management 43
Figure 22. IT and Categories according to use in FM. Technologies being developed, implemented and used for FM tasks and services. Each technology is placed in one of seven
different technology categories (seven larger rounded rectangles). Each category represents a use area of the IT in FM. Abbreviations are explained in Appendix 1.
Information System (IS) is in this study understood as any system based on IT which is interacting with humans for storing representations of information as digital data, and for processing digital data so that it becomes informative.
In Figure 23 an attempt is made to place the different types of IS and IT being developed, implemented and used in FM according to seven types of IS and IT. The seven types are partly based on the IS typology proposed by Laudon & Laudon (2014). The seven types are:
1. Decision Support Systems (DDS) for routine top management decision making. 2. Management Information Systems (MIS), which provide middle management with information
about the organisations current performance, focuses on the management of information systems to provide efficiency and effectiveness of strategic decision making (Wikipedia 2016). In Paper 6 the value gained by implementing a specific MIS in an organisation is presented.
3. Transaction Processing Systems (TPS), which are systems that perform and report the daily transactions necessary to conduct the business processes.
4. Data and Information Tools which in this study are tools for transforming data info use full information and for analysing data.
5. Data Systems, which are meant as systems for storing data. 6. Standards, Code and Protocols which are as the name suggests is code in software, and code
and standards for data exchange between software systems. 7. Hardware Systems which are hardware for collecting, retrieving and processing data and
information.
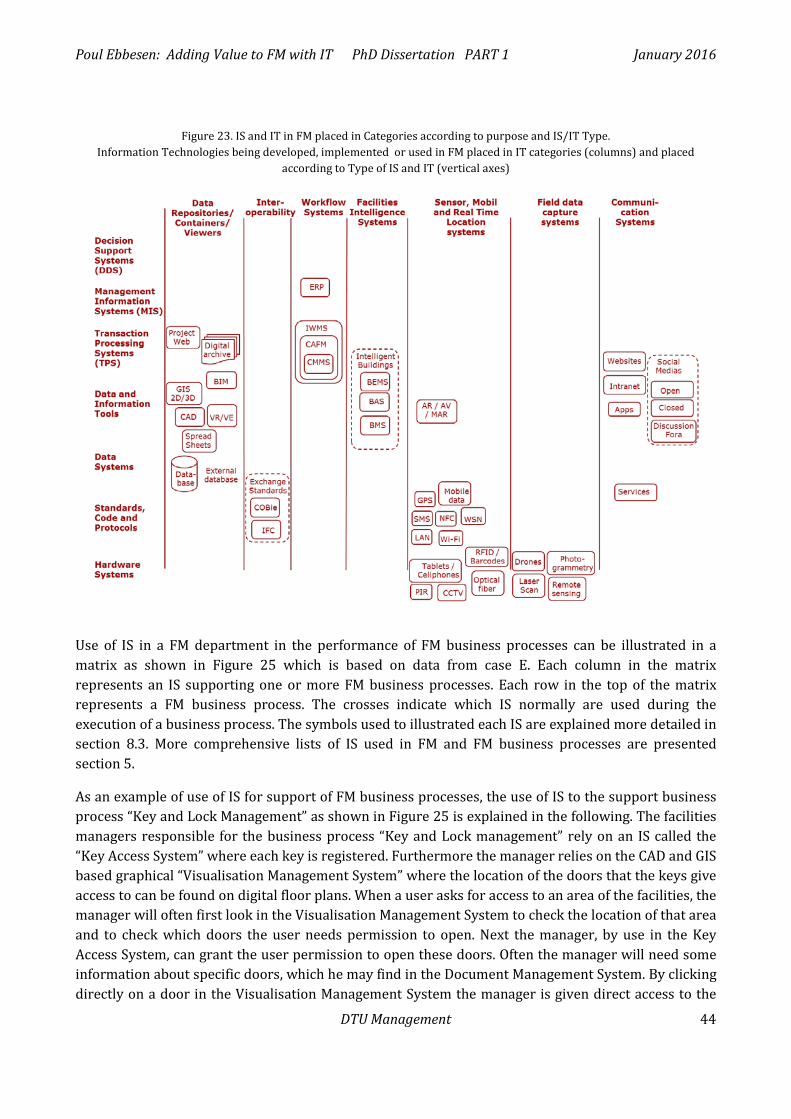
Poul Ebbesen: Adding Value to FM with IT PhD Dissertation PART 1 January 2016
DTU Management 44
Figure 23. IS and IT in FM placed in Categories according to purpose and IS/IT Type.
Information Technologies being developed, implemented or used in FM placed in IT categories (columns) and placed according to Type of IS and IT (vertical axes)
Use of IS in a FM department in the performance of FM business processes can be illustrated in a matrix as shown in Figure 25 which is based on data from case E. Each column in the matrix represents an IS supporting one or more FM business processes. Each row in the top of the matrix represents a FM business process. The crosses indicate which IS normally are used during the execution of a business process. The symbols used to illustrated each IS are explained more detailed in section 8.3. More comprehensive lists of IS used in FM and FM business processes are presented section 5.
As an example of use of IS for support of FM business processes, the use of IS to the support business process “Key and Lock Management” as shown in Figure 25 is explained in the following. The facilities managers responsible for the business process “Key and Lock management” rely on an IS called the “Key Access System” where each key is registered. Furthermore the manager relies on the CAD and GIS based graphical “Visualisation Management System” where the location of the doors that the keys give access to can be found on digital floor plans. When a user asks for access to an area of the facilities, the manager will often first look in the Visualisation Management System to check the location of that area and to check which doors the user needs permission to open. Next the manager, by use in the Key Access System, can grant the user permission to open these doors. Often the manager will need some information about specific doors, which he may find in the Document Management System. By clicking directly on a door in the Visualisation Management System the manager is given direct access to the
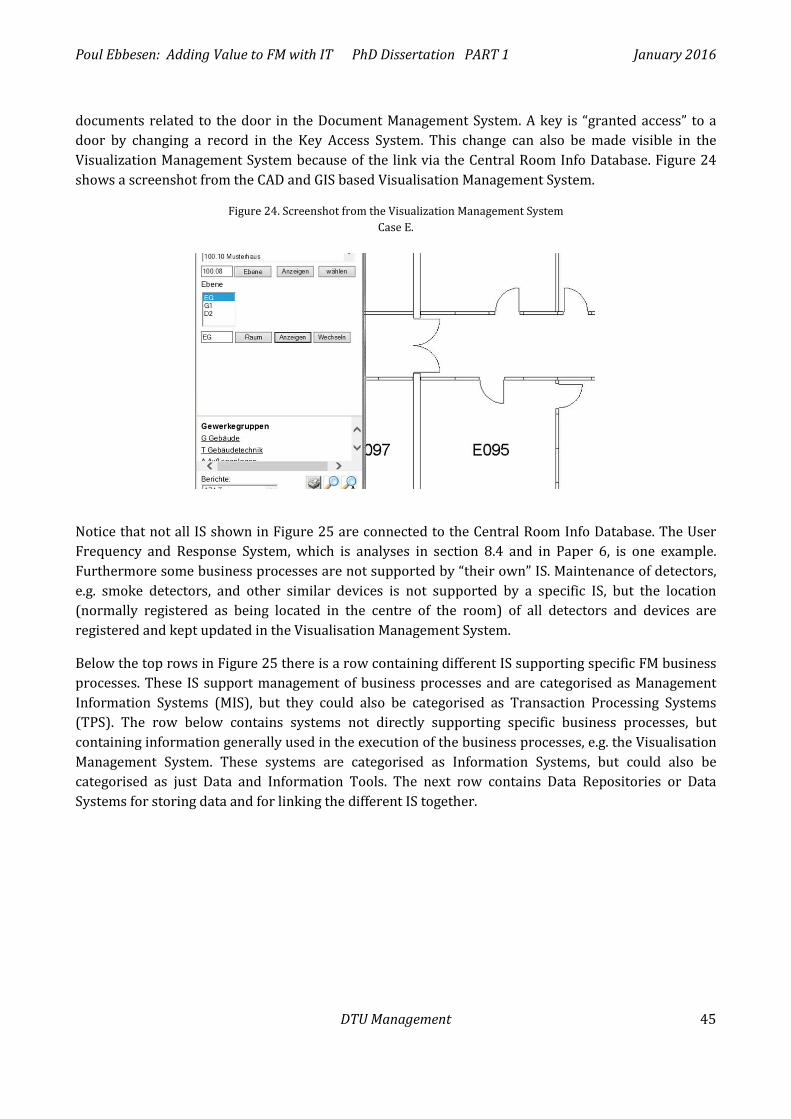
Poul Ebbesen: Adding Value to FM with IT PhD Dissertation PART 1 January 2016
DTU Management 45
documents related to the door in the Document Management System. A key is “granted access” to a door by changing a record in the Key Access System. This change can also be made visible in the Visualization Management System because of the link via the Central Room Info Database. Figure 24 shows a screenshot from the CAD and GIS based Visualisation Management System.
Figure 24. Screenshot from the Visualization Management System Case E.
Notice that not all IS shown in Figure 25 are connected to the Central Room Info Database. The User Frequency and Response System, which is analyses in section 8.4 and in Paper 6, is one example. Furthermore some business processes are not supported by “their own” IS. Maintenance of detectors, e.g. smoke detectors, and other similar devices is not supported by a specific IS, but the location (normally registered as being located in the centre of the room) of all detectors and devices are registered and kept updated in the Visualisation Management System.
Below the top rows in Figure 25 there is a row containing different IS supporting specific FM business processes. These IS support management of business processes and are categorised as Management Information Systems (MIS), but they could also be categorised as Transaction Processing Systems (TPS). The row below contains systems not directly supporting specific business processes, but containing information generally used in the execution of the business processes, e.g. the Visualisation Management System. These systems are categorised as Information Systems, but could also be categorised as just Data and Information Tools. The next row contains Data Repositories or Data Systems for storing data and for linking the different IS together.
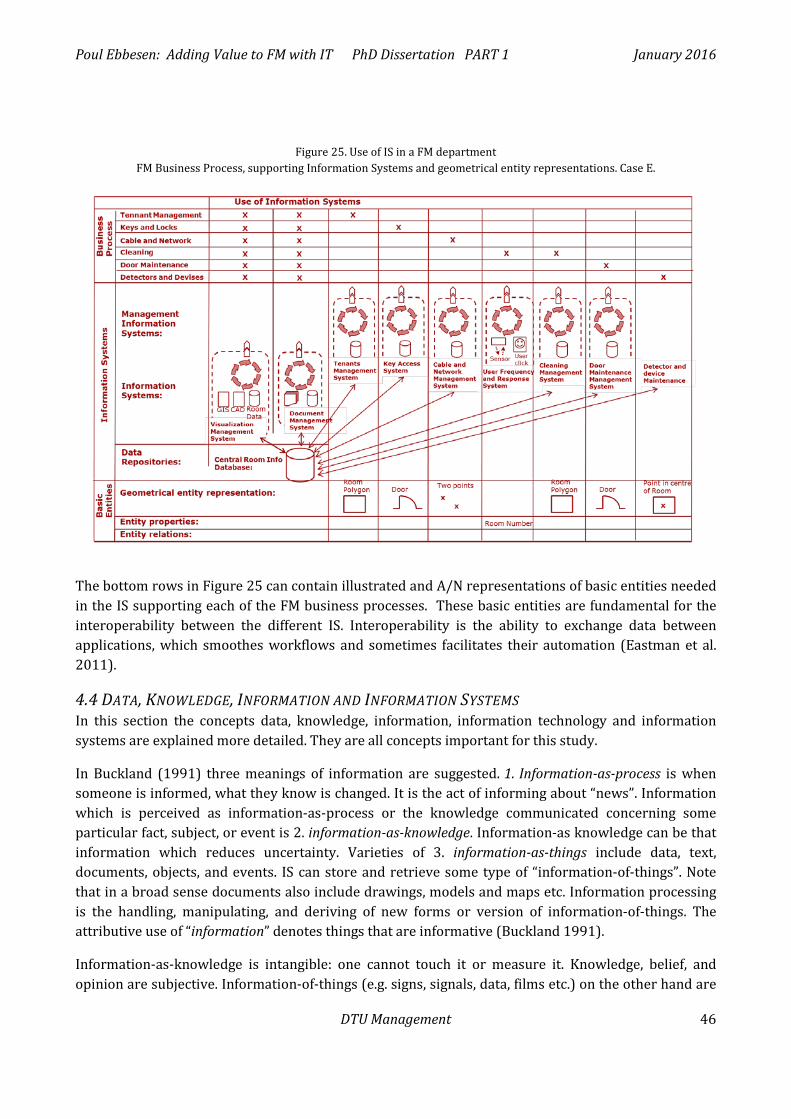
Poul Ebbesen: Adding Value to FM with IT PhD Dissertation PART 1 January 2016
DTU Management 46
Figure 25. Use of IS in a FM department FM Business Process, supporting Information Systems and geometrical entity representations. Case E.
The bottom rows in Figure 25 can contain illustrated and A/N representations of basic entities needed in the IS supporting each of the FM business processes. These basic entities are fundamental for the interoperability between the different IS. Interoperability is the ability to exchange data between applications, which smoothes workflows and sometimes facilitates their automation (Eastman et al. 2011).
4.4 DATA, KNOWLEDGE, INFORMATION AND INFORMATION SYSTEMS In this section the concepts data, knowledge, information, information technology and information systems are explained more detailed. They are all concepts important for this study.
In Buckland (1991) three meanings of information are suggested. 1. Information-as-process is when someone is informed, what they know is changed. It is the act of informing about “news”. Information which is perceived as information-as-process or the knowledge communicated concerning some particular fact, subject, or event is 2. information-as-knowledge. Information-as knowledge can be that information which reduces uncertainty. Varieties of 3. information-as-things include data, text, documents, objects, and events. IS can store and retrieve some type of “information-of-things”. Note that in a broad sense documents also include drawings, models and maps etc. Information processing is the handling, manipulating, and deriving of new forms or version of information-of-things. The attributive use of “information” denotes things that are informative (Buckland 1991).
Information-as-knowledge is intangible: one cannot touch it or measure it. Knowledge, belief, and opinion are subjective. Information-of-things (e.g. signs, signals, data, films etc.) on the other hand are
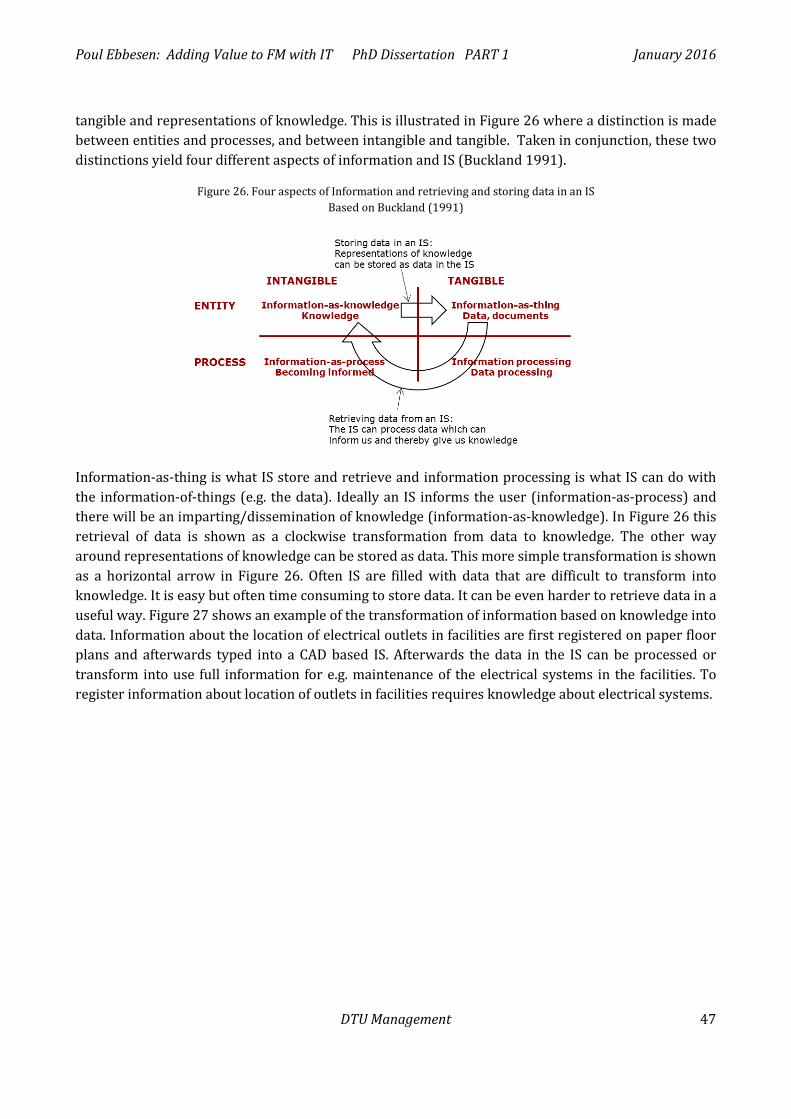
Poul Ebbesen: Adding Value to FM with IT PhD Dissertation PART 1 January 2016
DTU Management 47
tangible and representations of knowledge. This is illustrated in Figure 26 where a distinction is made between entities and processes, and between intangible and tangible. Taken in conjunction, these two distinctions yield four different aspects of information and IS (Buckland 1991).
Figure 26. Four aspects of Information and retrieving and storing data in an IS Based on Buckland (1991)
Information-as-thing is what IS store and retrieve and information processing is what IS can do with the information-of-things (e.g. the data). Ideally an IS informs the user (information-as-process) and there will be an imparting/dissemination of knowledge (information-as-knowledge). In Figure 26 this retrieval of data is shown as a clockwise transformation from data to knowledge. The other way around representations of knowledge can be stored as data. This more simple transformation is shown as a horizontal arrow in Figure 26. Often IS are filled with data that are difficult to transform into knowledge. It is easy but often time consuming to store data. It can be even harder to retrieve data in a useful way. Figure 27 shows an example of the transformation of information based on knowledge into data. Information about the location of electrical outlets in facilities are first registered on paper floor plans and afterwards typed into a CAD based IS. Afterwards the data in the IS can be processed or transform into use full information for e.g. maintenance of the electrical systems in the facilities. To register information about location of outlets in facilities requires knowledge about electrical systems.
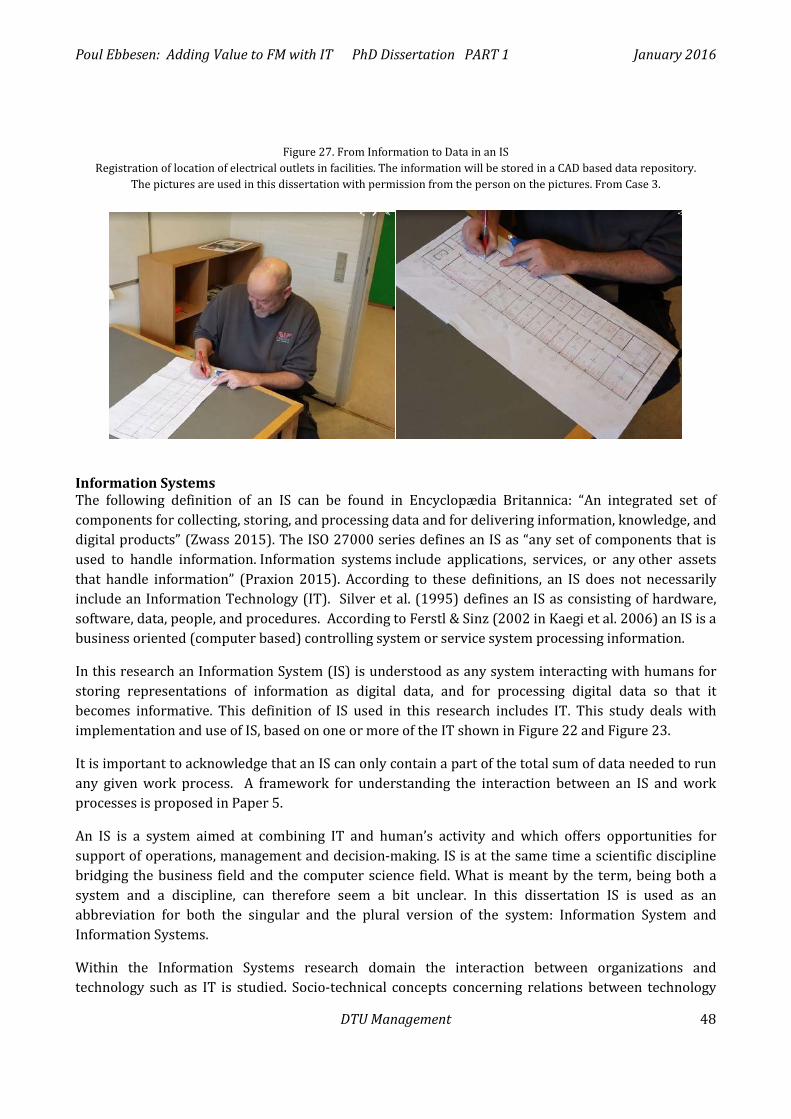
Poul Ebbesen: Adding Value to FM with IT PhD Dissertation PART 1 January 2016
DTU Management 48
Figure 27. From Information to Data in an IS Registration of location of electrical outlets in facilities. The information will be stored in a CAD based data repository.
The pictures are used in this dissertation with permission from the person on the pictures. From Case 3.
Information Systems The following definition of an IS can be found in Encyclopædia Britannica: “An integrated set of components for collecting, storing, and processing data and for delivering information, knowledge, and digital products” (Zwass 2015). The ISO 27000 series defines an IS as “any set of components that is used to handle information. Information systems include applications, services, or any other assets that handle information” (Praxion 2015). According to these definitions, an IS does not necessarily include an Information Technology (IT). Silver et al. (1995) defines an IS as consisting of hardware, software, data, people, and procedures. According to Ferstl & Sinz (2002 in Kaegi et al. 2006) an IS is a business oriented (computer based) controlling system or service system processing information.
In this research an Information System (IS) is understood as any system interacting with humans for storing representations of information as digital data, and for processing digital data so that it becomes informative. This definition of IS used in this research includes IT. This study deals with implementation and use of IS, based on one or more of the IT shown in Figure 22 and Figure 23.
It is important to acknowledge that an IS can only contain a part of the total sum of data needed to run any given work process. A framework for understanding the interaction between an IS and work processes is proposed in Paper 5.
An IS is a system aimed at combining IT and human’s activity and which offers opportunities for support of operations, management and decision-making. IS is at the same time a scientific discipline bridging the business field and the computer science field. What is meant by the term, being both a system and a discipline, can therefore seem a bit unclear. In this dissertation IS is used as an abbreviation for both the singular and the plural version of the system: Information System and Information Systems.
Within the Information Systems research domain the interaction between organizations and technology such as IT is studied. Socio-technical concepts concerning relations between technology
Poul Ebbesen: Adding Value to FM with IT PhD Dissertation PART 1 January 2016
DTU Management 49
and humans are often used in Information Systems research. It is difficult to draw a sharp line between the Information Systems research area and the socio-technical research area. An IS Framework, as the one presented in Paper 5, can be built on different perspective, e.g. an Information Systems perspective or a socio-technical perspective. Management or computer science perspectives can also be used.
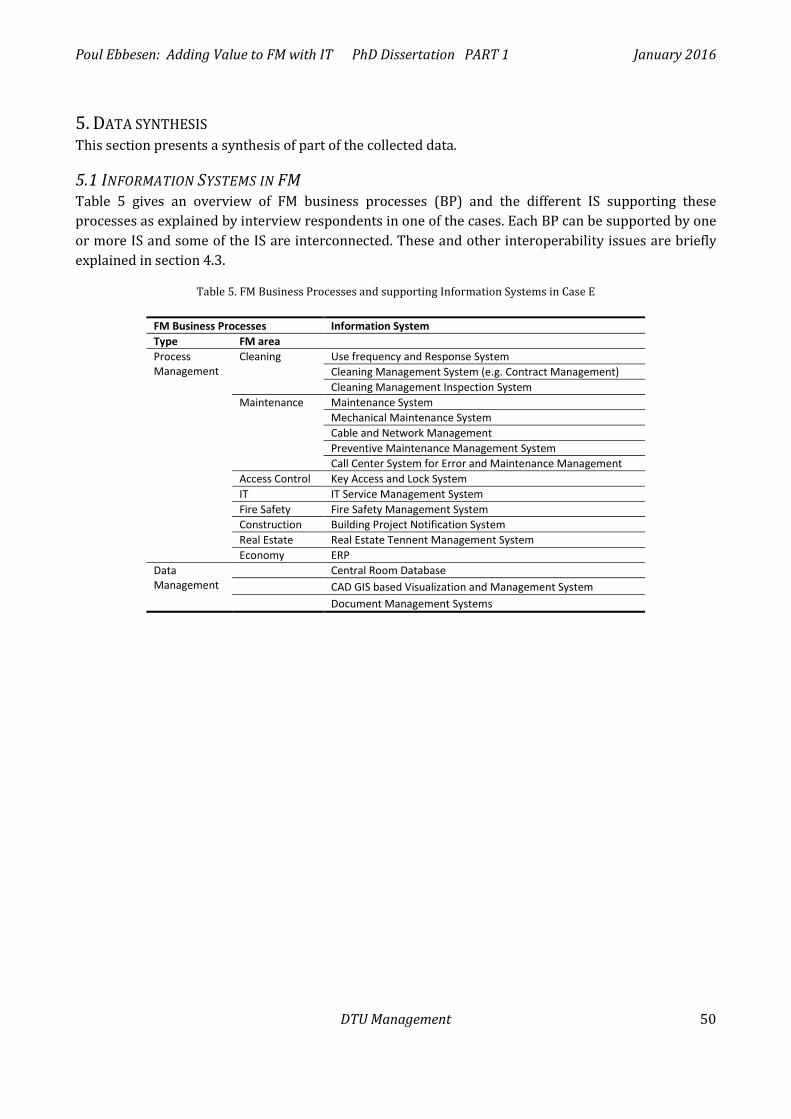
Poul Ebbesen: Adding Value to FM with IT PhD Dissertation PART 1 January 2016
DTU Management 50
5. DATA SYNTHESIS This section presents a synthesis of part of the collected data.
5.1 INFORMATION SYSTEMS IN FM Table 5 gives an overview of FM business processes (BP) and the different IS supporting these processes as explained by interview respondents in one of the cases. Each BP can be supported by one or more IS and some of the IS are interconnected. These and other interoperability issues are briefly explained in section 4.3.
Table 5. FM Business Processes and supporting Information Systems in Case E
FM Business Processes Information System Type FM area Process Management
Cleaning Use frequency and Response System Cleaning Management System (e.g. Contract Management) Cleaning Management Inspection System
Maintenance Maintenance System Mechanical Maintenance System Cable and Network Management Preventive Maintenance Management System Call Center System for Error and Maintenance Management
Access Control Key Access and Lock System IT IT Service Management System Fire Safety Fire Safety Management System Construction Building Project Notification System Real Estate Real Estate Tennent Management System Economy ERP
Data Management
Central Room Database CAD GIS based Visualization and Management System Document Management Systems
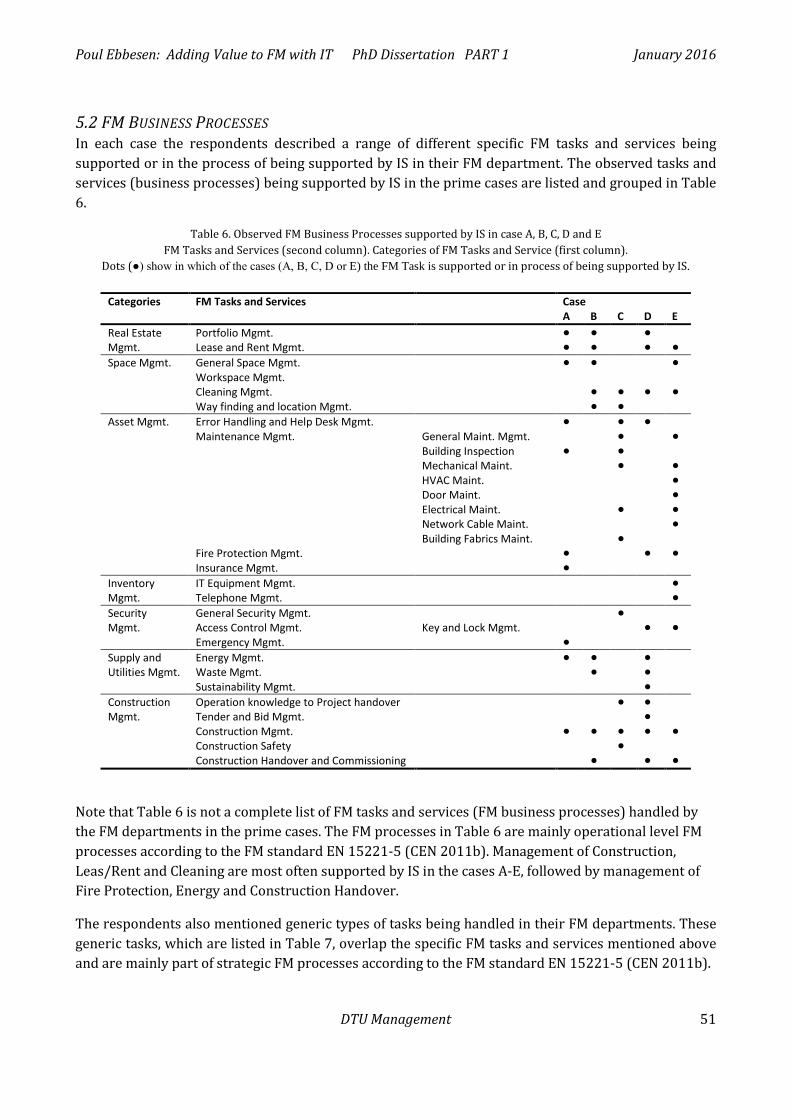
Poul Ebbesen: Adding Value to FM with IT PhD Dissertation PART 1 January 2016
DTU Management 51
5.2 FM BUSINESS PROCESSES In each case the respondents described a range of different specific FM tasks and services being supported or in the process of being supported by IS in their FM department. The observed tasks and services (business processes) being supported by IS in the prime cases are listed and grouped in Table 6.
Table 6. Observed FM Business Processes supported by IS in case A, B, C, D and E FM Tasks and Services (second column). Categories of FM Tasks and Service (first column).
Dots (●) show in which of the cases (A, B, C, D or E) the FM Task is supported or in process of being supported by IS.
Categories FM Tasks and Services Case A B C D E Real Estate Mgmt.
Portfolio Mgmt. ● ● ● Lease and Rent Mgmt. ● ● ● ●
Space Mgmt. General Space Mgmt. ● ● ● Workspace Mgmt. Cleaning Mgmt. ● ● ● ● Way finding and location Mgmt. ● ●
Asset Mgmt. Error Handling and Help Desk Mgmt. ● ● ● Maintenance Mgmt. General Maint. Mgmt. ● ● Building Inspection ● ● Mechanical Maint. ● ● HVAC Maint. ● Door Maint. ● Electrical Maint. ● ● Network Cable Maint. ● Building Fabrics Maint. ● Fire Protection Mgmt. ● ● ● Insurance Mgmt. ●
Inventory Mgmt.
IT Equipment Mgmt. ● Telephone Mgmt. ●
Security Mgmt.
General Security Mgmt. ● Access Control Mgmt. Key and Lock Mgmt. ● ● Emergency Mgmt. ●
Supply and Utilities Mgmt.
Energy Mgmt. ● ● ● Waste Mgmt. ● ●
Sustainability Mgmt. ● Construction Mgmt.
Operation knowledge to Project handover ● ● Tender and Bid Mgmt. ● Construction Mgmt. ● ● ● ● ● Construction Safety ● Construction Handover and Commissioning ● ● ●
Note that Table 6 is not a complete list of FM tasks and services (FM business processes) handled by the FM departments in the prime cases. The FM processes in Table 6 are mainly operational level FM processes according to the FM standard EN 15221-5 (CEN 2011b). Management of Construction, Leas/Rent and Cleaning are most often supported by IS in the cases A-E, followed by management of Fire Protection, Energy and Construction Handover.
The respondents also mentioned generic types of tasks being handled in their FM departments. These generic tasks, which are listed in Table 7, overlap the specific FM tasks and services mentioned above and are mainly part of strategic FM processes according to the FM standard EN 15221-5 (CEN 2011b).
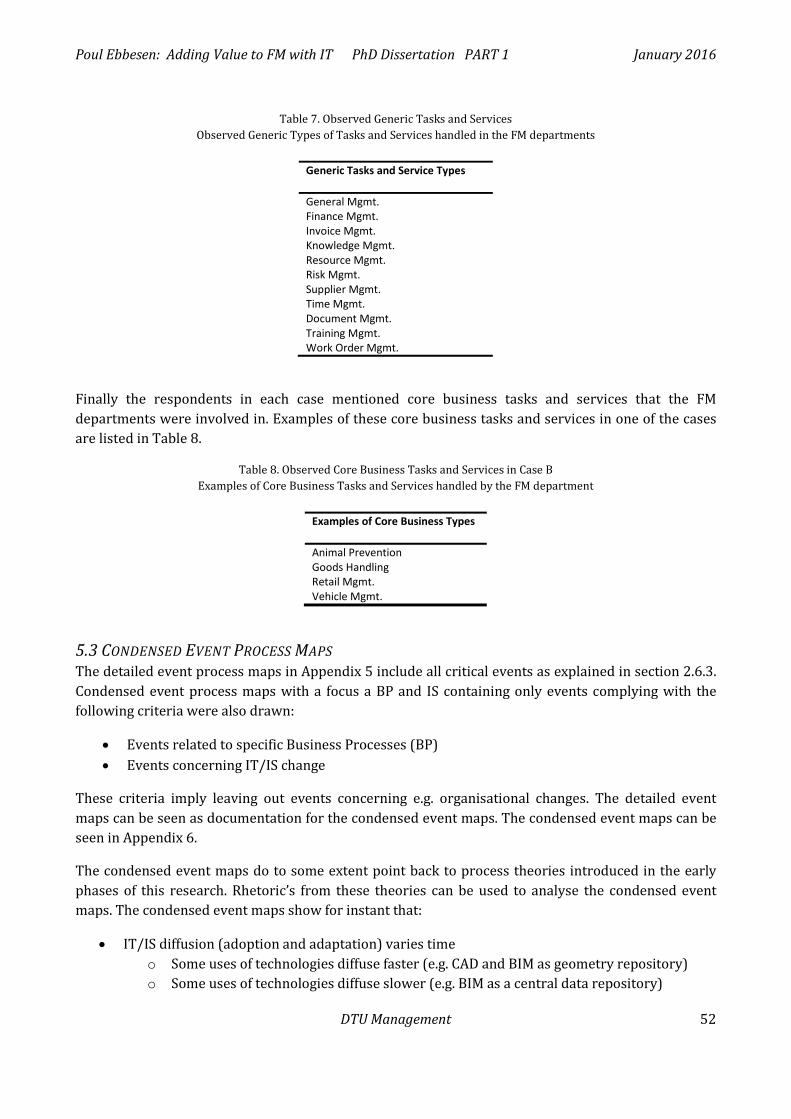
Poul Ebbesen: Adding Value to FM with IT PhD Dissertation PART 1 January 2016
DTU Management 52
Table 7. Observed Generic Tasks and Services Observed Generic Types of Tasks and Services handled in the FM departments
Generic Tasks and Service Types General Mgmt. Finance Mgmt. Invoice Mgmt. Knowledge Mgmt. Resource Mgmt. Risk Mgmt. Supplier Mgmt. Time Mgmt. Document Mgmt. Training Mgmt. Work Order Mgmt.
Finally the respondents in each case mentioned core business tasks and services that the FM departments were involved in. Examples of these core business tasks and services in one of the cases are listed in Table 8.
Table 8. Observed Core Business Tasks and Services in Case B Examples of Core Business Tasks and Services handled by the FM department
Examples of Core Business Types Animal Prevention Goods Handling Retail Mgmt. Vehicle Mgmt.
5.3 CONDENSED EVENT PROCESS MAPS The detailed event process maps in Appendix 5 include all critical events as explained in section 2.6.3. Condensed event process maps with a focus a BP and IS containing only events complying with the following criteria were also drawn:
• Events related to specific Business Processes (BP) • Events concerning IT/IS change
These criteria imply leaving out events concerning e.g. organisational changes. The detailed event maps can be seen as documentation for the condensed event maps. The condensed event maps can be seen in Appendix 6.
The condensed event maps do to some extent point back to process theories introduced in the early phases of this research. Rhetoric’s from these theories can be used to analyse the condensed event maps. The condensed event maps show for instant that:
• IT/IS diffusion (adoption and adaptation) varies time o Some uses of technologies diffuse faster (e.g. CAD and BIM as geometry repository) o Some uses of technologies diffuse slower (e.g. BIM as a central data repository)
Poul Ebbesen: Adding Value to FM with IT PhD Dissertation PART 1 January 2016
DTU Management 53
• New ways of using technologies can occur when new technologies are introduced o e.g. point cloud scans feeding BIM with geometric data
• Often technologies are used in combination to become part of an IS supporting BP • The last two decades or more attempts have been made to support FM business processes with
IT and IS
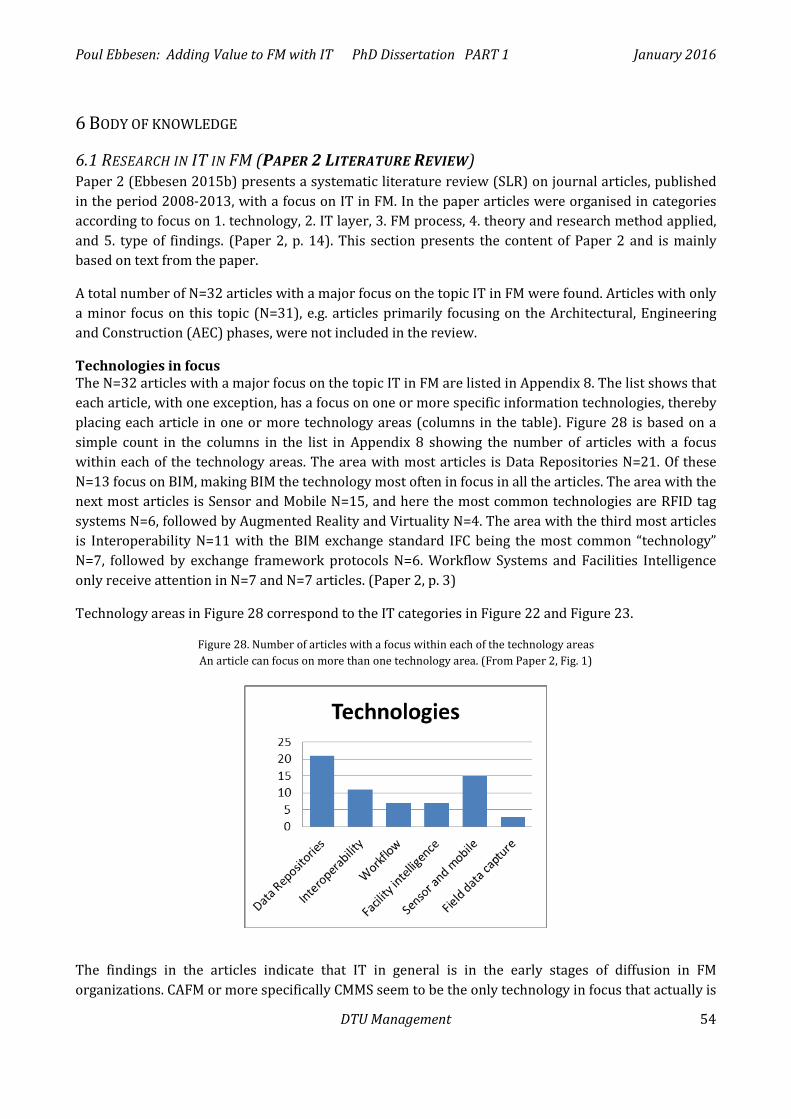
Poul Ebbesen: Adding Value to FM with IT PhD Dissertation PART 1 January 2016
DTU Management 54
6 BODY OF KNOWLEDGE
6.1 RESEARCH IN IT IN FM (PAPER 2 LITERATURE REVIEW) Paper 2 (Ebbesen 2015b) presents a systematic literature review (SLR) on journal articles, published in the period 2008-2013, with a focus on IT in FM. In the paper articles were organised in categories according to focus on 1. technology, 2. IT layer, 3. FM process, 4. theory and research method applied, and 5. type of findings. (Paper 2, p. 14). This section presents the content of Paper 2 and is mainly based on text from the paper.
A total number of N=32 articles with a major focus on the topic IT in FM were found. Articles with only a minor focus on this topic (N=31), e.g. articles primarily focusing on the Architectural, Engineering and Construction (AEC) phases, were not included in the review.
Technologies in focus The N=32 articles with a major focus on the topic IT in FM are listed in Appendix 8. The list shows that each article, with one exception, has a focus on one or more specific information technologies, thereby placing each article in one or more technology areas (columns in the table). Figure 28 is based on a simple count in the columns in the list in Appendix 8 showing the number of articles with a focus within each of the technology areas. The area with most articles is Data Repositories N=21. Of these N=13 focus on BIM, making BIM the technology most often in focus in all the articles. The area with the next most articles is Sensor and Mobile N=15, and here the most common technologies are RFID tag systems N=6, followed by Augmented Reality and Virtuality N=4. The area with the third most articles is Interoperability N=11 with the BIM exchange standard IFC being the most common “technology” N=7, followed by exchange framework protocols N=6. Workflow Systems and Facilities Intelligence only receive attention in N=7 and N=7 articles. (Paper 2, p. 3)
Technology areas in Figure 28 correspond to the IT categories in Figure 22 and Figure 23.
Figure 28. Number of articles with a focus within each of the technology areas An article can focus on more than one technology area. (From Paper 2, Fig. 1)
The findings in the articles indicate that IT in general is in the early stages of diffusion in FM organizations. CAFM or more specifically CMMS seem to be the only technology in focus that actually is
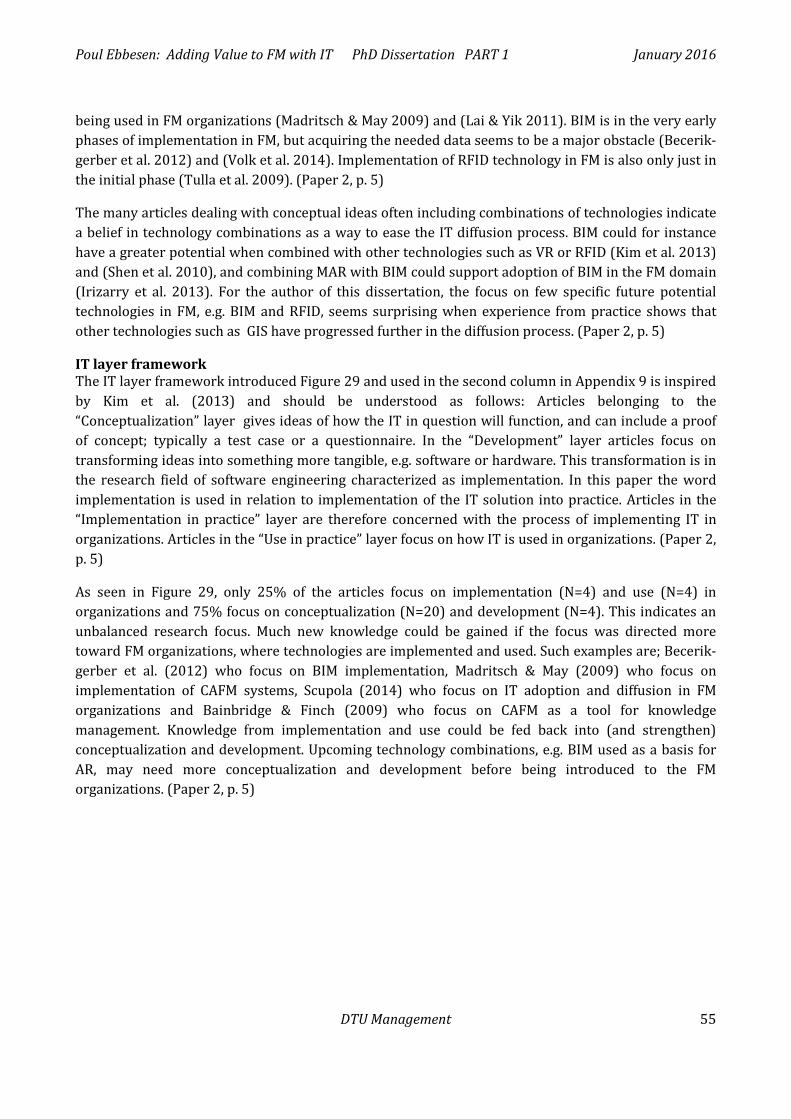
Poul Ebbesen: Adding Value to FM with IT PhD Dissertation PART 1 January 2016
DTU Management 55
being used in FM organizations (Madritsch & May 2009) and (Lai & Yik 2011). BIM is in the very early phases of implementation in FM, but acquiring the needed data seems to be a major obstacle (Becerik-gerber et al. 2012) and (Volk et al. 2014). Implementation of RFID technology in FM is also only just in the initial phase (Tulla et al. 2009). (Paper 2, p. 5)
The many articles dealing with conceptual ideas often including combinations of technologies indicate a belief in technology combinations as a way to ease the IT diffusion process. BIM could for instance have a greater potential when combined with other technologies such as VR or RFID (Kim et al. 2013) and (Shen et al. 2010), and combining MAR with BIM could support adoption of BIM in the FM domain (Irizarry et al. 2013). For the author of this dissertation, the focus on few specific future potential technologies in FM, e.g. BIM and RFID, seems surprising when experience from practice shows that other technologies such as GIS have progressed further in the diffusion process. (Paper 2, p. 5)
IT layer framework The IT layer framework introduced Figure 29 and used in the second column in Appendix 9 is inspired by Kim et al. (2013) and should be understood as follows: Articles belonging to the “Conceptualization” layer gives ideas of how the IT in question will function, and can include a proof of concept; typically a test case or a questionnaire. In the “Development” layer articles focus on transforming ideas into something more tangible, e.g. software or hardware. This transformation is in the research field of software engineering characterized as implementation. In this paper the word implementation is used in relation to implementation of the IT solution into practice. Articles in the “Implementation in practice” layer are therefore concerned with the process of implementing IT in organizations. Articles in the “Use in practice” layer focus on how IT is used in organizations. (Paper 2, p. 5)
As seen in Figure 29, only 25% of the articles focus on implementation (N=4) and use (N=4) in organizations and 75% focus on conceptualization (N=20) and development (N=4). This indicates an unbalanced research focus. Much new knowledge could be gained if the focus was directed more toward FM organizations, where technologies are implemented and used. Such examples are; Becerik-gerber et al. (2012) who focus on BIM implementation, Madritsch & May (2009) who focus on implementation of CAFM systems, Scupola (2014) who focus on IT adoption and diffusion in FM organizations and Bainbridge & Finch (2009) who focus on CAFM as a tool for knowledge management. Knowledge from implementation and use could be fed back into (and strengthen) conceptualization and development. Upcoming technology combinations, e.g. BIM used as a basis for AR, may need more conceptualization and development before being introduced to the FM organizations. (Paper 2, p. 5)
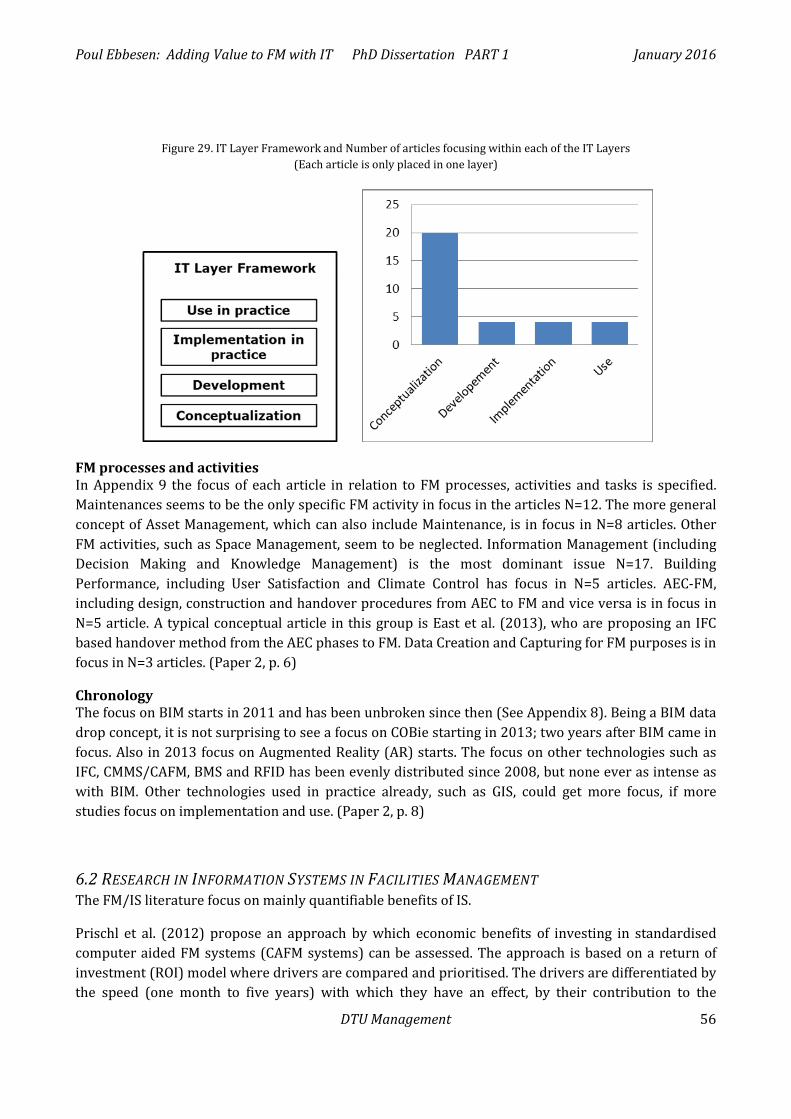
Poul Ebbesen: Adding Value to FM with IT PhD Dissertation PART 1 January 2016
DTU Management 56
Figure 29. IT Layer Framework and Number of articles focusing within each of the IT Layers (Each article is only placed in one layer)
FM processes and activities In Appendix 9 the focus of each article in relation to FM processes, activities and tasks is specified. Maintenances seems to be the only specific FM activity in focus in the articles N=12. The more general concept of Asset Management, which can also include Maintenance, is in focus in N=8 articles. Other FM activities, such as Space Management, seem to be neglected. Information Management (including Decision Making and Knowledge Management) is the most dominant issue N=17. Building Performance, including User Satisfaction and Climate Control has focus in N=5 articles. AEC-FM, including design, construction and handover procedures from AEC to FM and vice versa is in focus in N=5 article. A typical conceptual article in this group is East et al. (2013), who are proposing an IFC based handover method from the AEC phases to FM. Data Creation and Capturing for FM purposes is in focus in N=3 articles. (Paper 2, p. 6)
Chronology The focus on BIM starts in 2011 and has been unbroken since then (See Appendix 8). Being a BIM data drop concept, it is not surprising to see a focus on COBie starting in 2013; two years after BIM came in focus. Also in 2013 focus on Augmented Reality (AR) starts. The focus on other technologies such as IFC, CMMS/CAFM, BMS and RFID has been evenly distributed since 2008, but none ever as intense as with BIM. Other technologies used in practice already, such as GIS, could get more focus, if more studies focus on implementation and use. (Paper 2, p. 8)
6.2 RESEARCH IN INFORMATION SYSTEMS IN FACILITIES MANAGEMENT The FM/IS literature focus on mainly quantifiable benefits of IS.
Prischl et al. (2012) propose an approach by which economic benefits of investing in standardised computer aided FM systems (CAFM systems) can be assessed. The approach is based on a return of investment (ROI) model where drivers are compared and prioritised. The drivers are differentiated by the speed (one month to five years) with which they have an effect, by their contribution to the
Poul Ebbesen: Adding Value to FM with IT PhD Dissertation PART 1 January 2016
DTU Management 57
economic value added (EVA) to the business, and by their potential in relation to their monetary value in relation to the specific enterprise (Prischl et al. 2012, p. 126). As an example a driver can be a FM task or process, e.g. vacancy management. If investing X dollars in a CAFM system, and this investment results in identifying vacant rooms representing a rent income of X/2 dollars per year, then the ROI amounts to 50% in the first year. The potential of this investment may be small if compared to e.g. the total turnover of the organisation. Furthermore it may take 1 or 2 years to have the CAFM system up running, and maybe extra personnel must be employed to fed the system with data and run the system. The ROI model can help clarify where it is most relevant to invest in IS to support FM. The model show how time plays a significant role in the ROI interpretation (Prischl et al. 2012). The model includes economic benefit of IS investments but do not include other values for the FM supply chain as a whole. (Paper 6, p. 6) The RIO model is illustrated in Figure 30.
Figure 30. ROI model for IS in FM From Prischl et al. (2012)
A matrix for mapping the value of each function of the IS with the organisations objectives and the FM process is proposed in Keller (2013). It is pointed out, that in order to fully understand the value added by technology, we need to analyse the value of FM to the organisation and the value that process improvement adds when implementing and using technology (Which is exactly what this paper seeks to achieve). It is argued that IS can add value to FM in mainly three areas; interoperability, reorganisation and culture. Interoperability because IS can provide information not only used for FM processes, but also used by the rest of the organisation. Reorganisation because IS can eliminate data, process and organisational silos. Culture because IS can be used to convey culture change (Keller 2013). (Paper 6, p. 6)
Poul Ebbesen: Adding Value to FM with IT PhD Dissertation PART 1 January 2016
DTU Management 58
6.3 BODY OF KNOWLEDGE ON ISSUES STUDIED IN PAPERS BELONGING TO THIS STUDY An overview of the body of knowledge concerning specific topics studied in the papers 1-7 is included in section 8. Detailed presentations of the body of knowledge of these specific topics can be found in the papers 1-7.
6.4 MAIN RESEARCH GAPS IN THE FIELD OF IT/IS IN FM Existing research has a lack of focus on IS implementation processes in FM and use of IS for FM operations in existing facilities. Especially organisational and socio-technical issues appear to be absent. Research within IS in FM primarily has been focusing on specific IT related technical aspects and often so in connection with construction or refurbishment projects. Existing research in IS implementation and use in FM tend to focus mainly on quantifiable issues such as monetary issues and on detailed FM process studies.
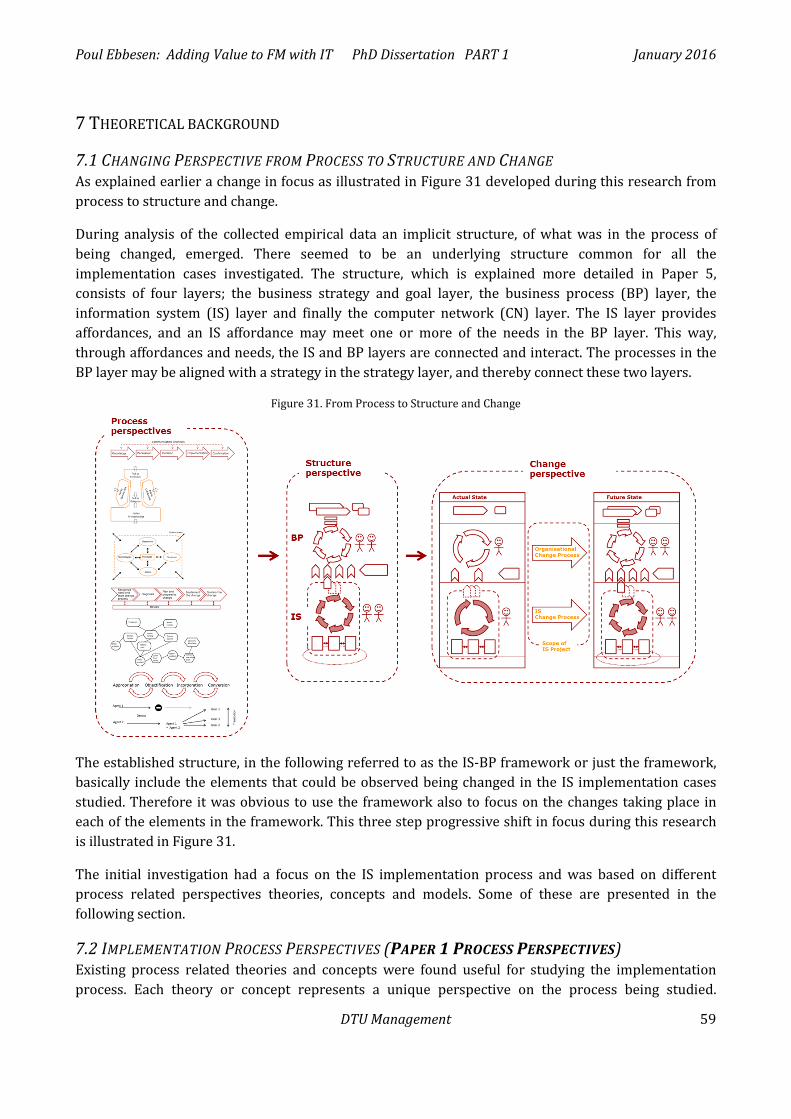
Poul Ebbesen: Adding Value to FM with IT PhD Dissertation PART 1 January 2016
DTU Management 59
7 THEORETICAL BACKGROUND
7.1 CHANGING PERSPECTIVE FROM PROCESS TO STRUCTURE AND CHANGE As explained earlier a change in focus as illustrated in Figure 31 developed during this research from process to structure and change.
During analysis of the collected empirical data an implicit structure, of what was in the process of being changed, emerged. There seemed to be an underlying structure common for all the implementation cases investigated. The structure, which is explained more detailed in Paper 5, consists of four layers; the business strategy and goal layer, the business process (BP) layer, the information system (IS) layer and finally the computer network (CN) layer. The IS layer provides affordances, and an IS affordance may meet one or more of the needs in the BP layer. This way, through affordances and needs, the IS and BP layers are connected and interact. The processes in the BP layer may be aligned with a strategy in the strategy layer, and thereby connect these two layers.
Figure 31. From Process to Structure and Change
The established structure, in the following referred to as the IS-BP framework or just the framework, basically include the elements that could be observed being changed in the IS implementation cases studied. Therefore it was obvious to use the framework also to focus on the changes taking place in each of the elements in the framework. This three step progressive shift in focus during this research is illustrated in Figure 31.
The initial investigation had a focus on the IS implementation process and was based on different process related perspectives theories, concepts and models. Some of these are presented in the following section.
7.2 IMPLEMENTATION PROCESS PERSPECTIVES (PAPER 1 PROCESS PERSPECTIVES) Existing process related theories and concepts were found useful for studying the implementation process. Each theory or concept represents a unique perspective on the process being studied.
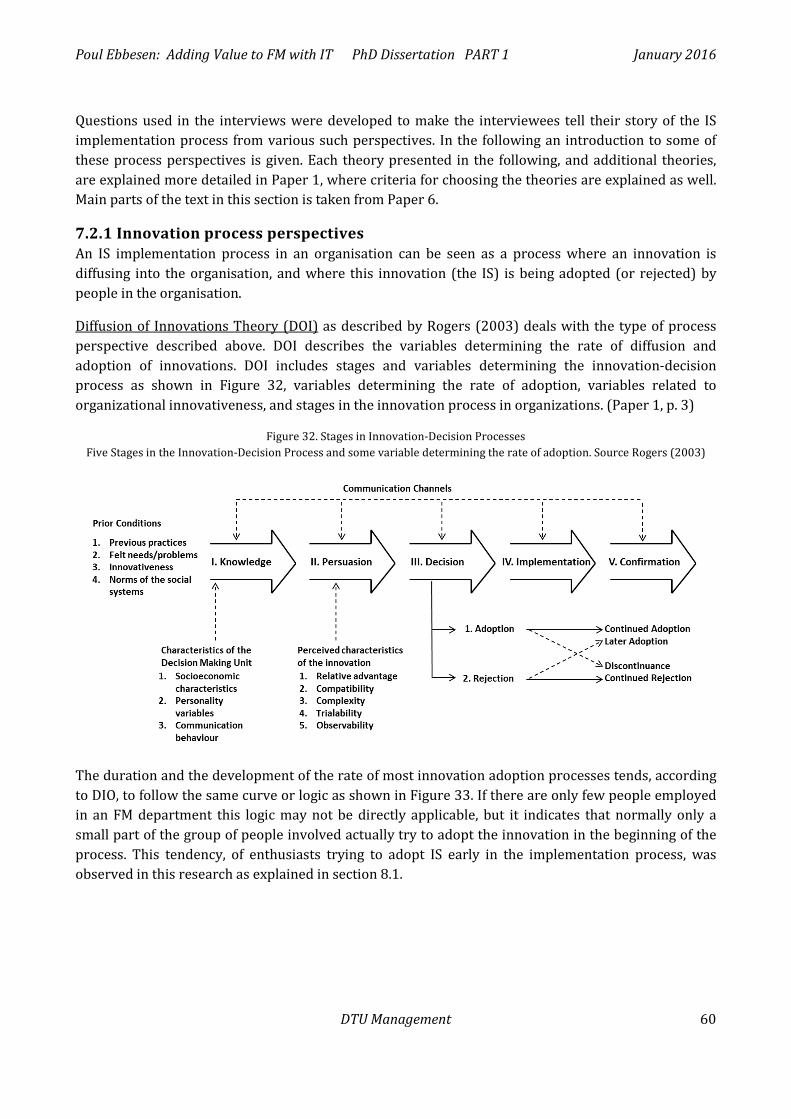
Poul Ebbesen: Adding Value to FM with IT PhD Dissertation PART 1 January 2016
DTU Management 60
Questions used in the interviews were developed to make the interviewees tell their story of the IS implementation process from various such perspectives. In the following an introduction to some of these process perspectives is given. Each theory presented in the following, and additional theories, are explained more detailed in Paper 1, where criteria for choosing the theories are explained as well. Main parts of the text in this section is taken from Paper 6.
7.2.1 Innovation process perspectives An IS implementation process in an organisation can be seen as a process where an innovation is diffusing into the organisation, and where this innovation (the IS) is being adopted (or rejected) by people in the organisation.
Diffusion of Innovations Theory (DOI) as described by Rogers (2003) deals with the type of process perspective described above. DOI describes the variables determining the rate of diffusion and adoption of innovations. DOI includes stages and variables determining the innovation-decision process as shown in Figure 32, variables determining the rate of adoption, variables related to organizational innovativeness, and stages in the innovation process in organizations. (Paper 1, p. 3)
Figure 32. Stages in Innovation-Decision Processes Five Stages in the Innovation-Decision Process and some variable determining the rate of adoption. Source Rogers (2003)
The duration and the development of the rate of most innovation adoption processes tends, according to DIO, to follow the same curve or logic as shown in Figure 33. If there are only few people employed in an FM department this logic may not be directly applicable, but it indicates that normally only a small part of the group of people involved actually try to adopt the innovation in the beginning of the process. This tendency, of enthusiasts trying to adopt IS early in the implementation process, was observed in this research as explained in section 8.1.
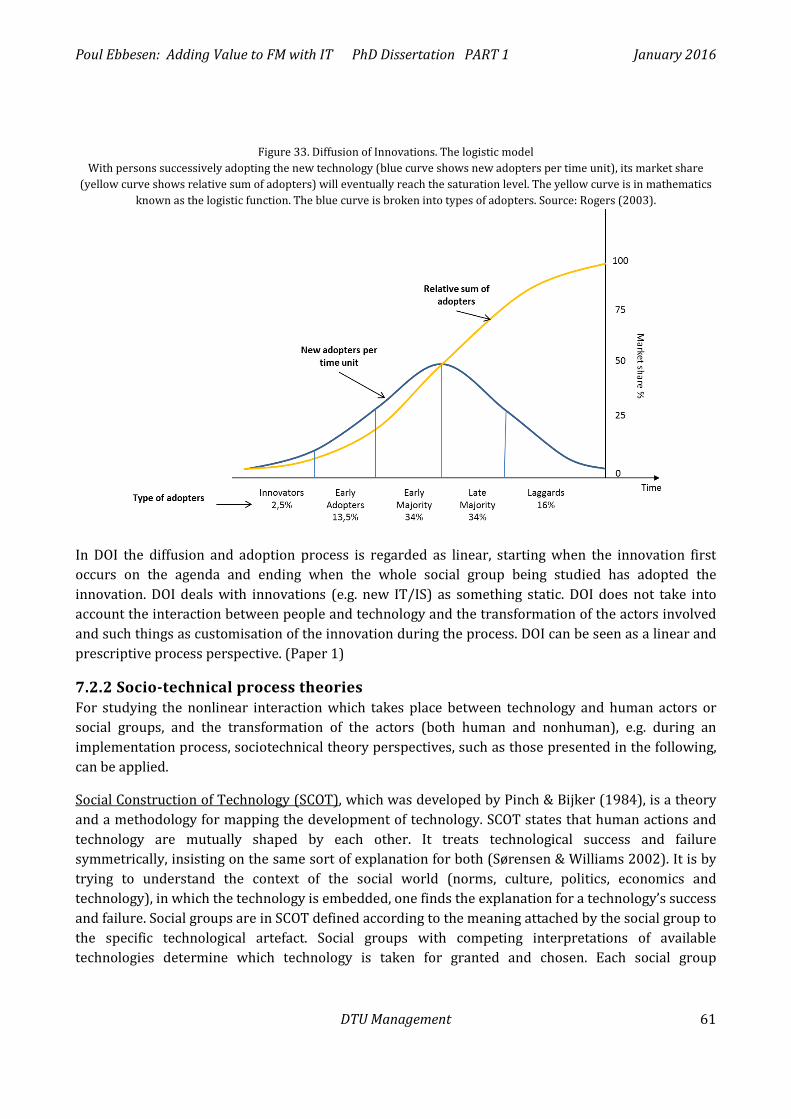
Poul Ebbesen: Adding Value to FM with IT PhD Dissertation PART 1 January 2016
DTU Management 61
Figure 33. Diffusion of Innovations. The logistic model With persons successively adopting the new technology (blue curve shows new adopters per time unit), its market share
(yellow curve shows relative sum of adopters) will eventually reach the saturation level. The yellow curve is in mathematics known as the logistic function. The blue curve is broken into types of adopters. Source: Rogers (2003).
In DOI the diffusion and adoption process is regarded as linear, starting when the innovation first occurs on the agenda and ending when the whole social group being studied has adopted the innovation. DOI deals with innovations (e.g. new IT/IS) as something static. DOI does not take into account the interaction between people and technology and the transformation of the actors involved and such things as customisation of the innovation during the process. DOI can be seen as a linear and prescriptive process perspective. (Paper 1)
7.2.2 Socio-technical process theories For studying the nonlinear interaction which takes place between technology and human actors or social groups, and the transformation of the actors (both human and nonhuman), e.g. during an implementation process, sociotechnical theory perspectives, such as those presented in the following, can be applied.
Social Construction of Technology (SCOT), which was developed by Pinch & Bijker (1984), is a theory and a methodology for mapping the development of technology. SCOT states that human actions and technology are mutually shaped by each other. It treats technological success and failure symmetrically, insisting on the same sort of explanation for both (Sørensen & Williams 2002). It is by trying to understand the context of the social world (norms, culture, politics, economics and technology), in which the technology is embedded, one finds the explanation for a technology’s success and failure. Social groups are in SCOT defined according to the meaning attached by the social group to the specific technological artefact. Social groups with competing interpretations of available technologies determine which technology is taken for granted and chosen. Each social group
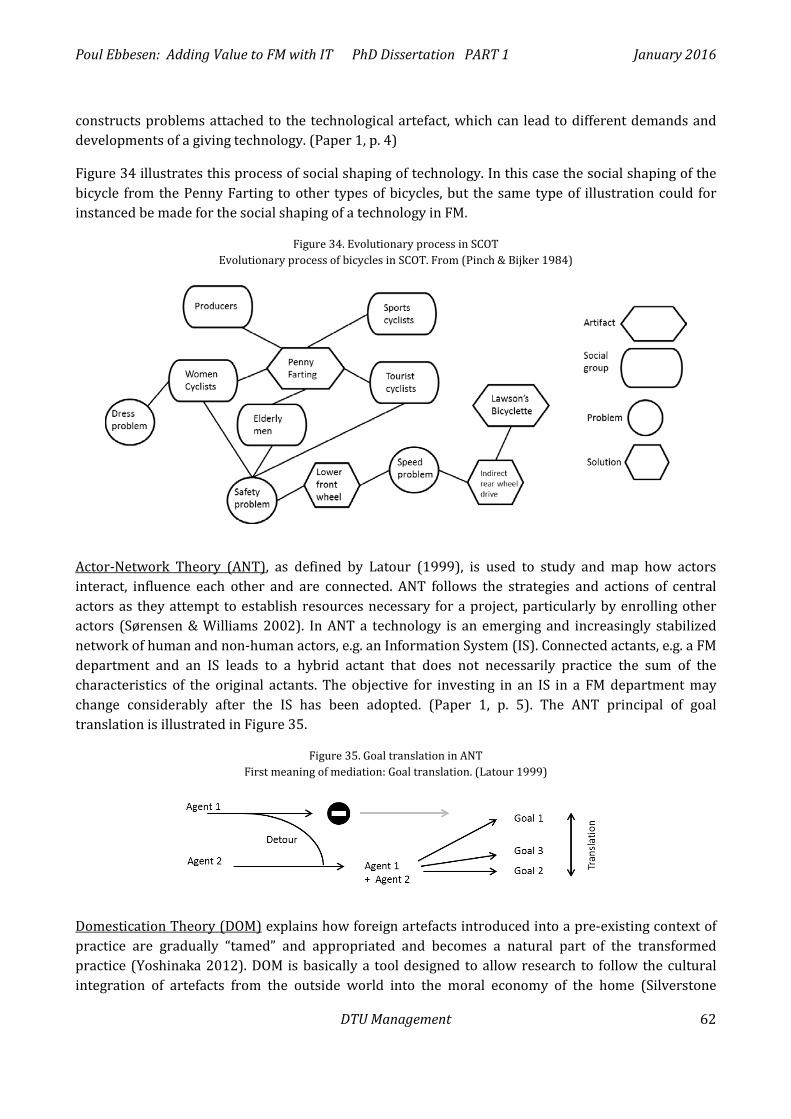
Poul Ebbesen: Adding Value to FM with IT PhD Dissertation PART 1 January 2016
DTU Management 62
constructs problems attached to the technological artefact, which can lead to different demands and developments of a giving technology. (Paper 1, p. 4)
Figure 34 illustrates this process of social shaping of technology. In this case the social shaping of the bicycle from the Penny Farting to other types of bicycles, but the same type of illustration could for instanced be made for the social shaping of a technology in FM.
Figure 34. Evolutionary process in SCOT Evolutionary process of bicycles in SCOT. From (Pinch & Bijker 1984)
Actor-Network Theory (ANT), as defined by Latour (1999), is used to study and map how actors interact, influence each other and are connected. ANT follows the strategies and actions of central actors as they attempt to establish resources necessary for a project, particularly by enrolling other actors (Sørensen & Williams 2002). In ANT a technology is an emerging and increasingly stabilized network of human and non-human actors, e.g. an Information System (IS). Connected actants, e.g. a FM department and an IS leads to a hybrid actant that does not necessarily practice the sum of the characteristics of the original actants. The objective for investing in an IS in a FM department may change considerably after the IS has been adopted. (Paper 1, p. 5). The ANT principal of goal translation is illustrated in Figure 35.
Figure 35. Goal translation in ANT First meaning of mediation: Goal translation. (Latour 1999)
Domestication Theory (DOM) explains how foreign artefacts introduced into a pre-existing context of practice are gradually “tamed” and appropriated and becomes a natural part of the transformed practice (Yoshinaka 2012). DOM is basically a tool designed to allow research to follow the cultural integration of artefacts from the outside world into the moral economy of the home (Silverstone
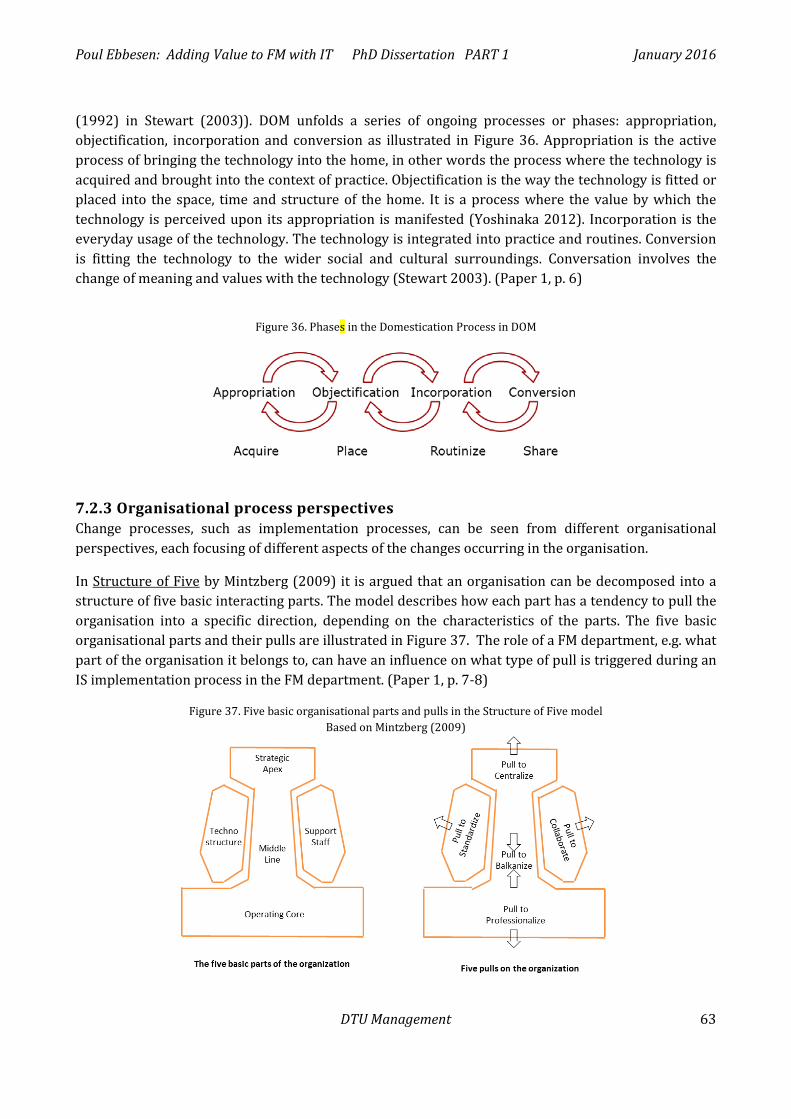
Poul Ebbesen: Adding Value to FM with IT PhD Dissertation PART 1 January 2016
DTU Management 63
(1992) in Stewart (2003)). DOM unfolds a series of ongoing processes or phases: appropriation, objectification, incorporation and conversion as illustrated in Figure 36. Appropriation is the active process of bringing the technology into the home, in other words the process where the technology is acquired and brought into the context of practice. Objectification is the way the technology is fitted or placed into the space, time and structure of the home. It is a process where the value by which the technology is perceived upon its appropriation is manifested (Yoshinaka 2012). Incorporation is the everyday usage of the technology. The technology is integrated into practice and routines. Conversion is fitting the technology to the wider social and cultural surroundings. Conversation involves the change of meaning and values with the technology (Stewart 2003). (Paper 1, p. 6)
Figure 36. Phases in the Domestication Process in DOM
7.2.3 Organisational process perspectives Change processes, such as implementation processes, can be seen from different organisational perspectives, each focusing of different aspects of the changes occurring in the organisation.
In Structure of Five by Mintzberg (2009) it is argued that an organisation can be decomposed into a structure of five basic interacting parts. The model describes how each part has a tendency to pull the organisation into a specific direction, depending on the characteristics of the parts. The five basic organisational parts and their pulls are illustrated in Figure 37. The role of a FM department, e.g. what part of the organisation it belongs to, can have an influence on what type of pull is triggered during an IS implementation process in the FM department. (Paper 1, p. 7-8)
Figure 37. Five basic organisational parts and pulls in the Structure of Five model Based on Mintzberg (2009)
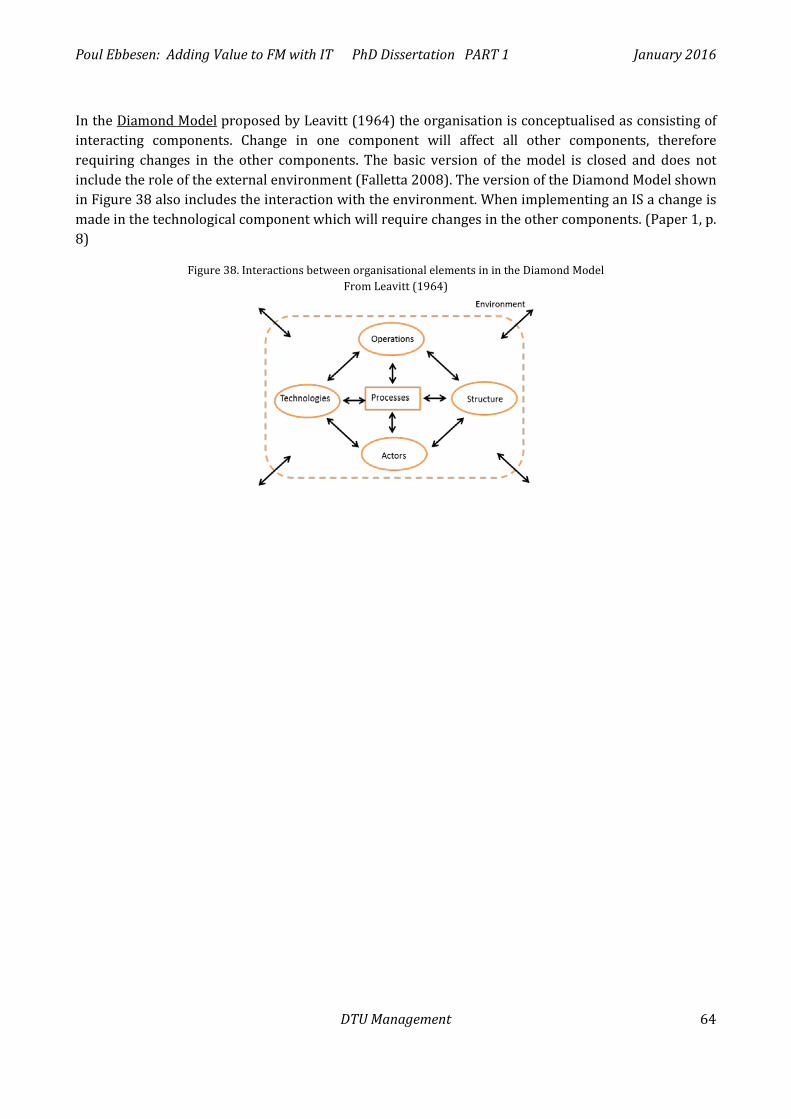
Poul Ebbesen: Adding Value to FM with IT PhD Dissertation PART 1 January 2016
DTU Management 64
In the Diamond Model proposed by Leavitt (1964) the organisation is conceptualised as consisting of interacting components. Change in one component will affect all other components, therefore requiring changes in the other components. The basic version of the model is closed and does not include the role of the external environment (Falletta 2008). The version of the Diamond Model shown in Figure 38 also includes the interaction with the environment. When implementing an IS a change is made in the technological component which will require changes in the other components. (Paper 1, p. 8)
Figure 38. Interactions between organisational elements in in the Diamond Model From Leavitt (1964)
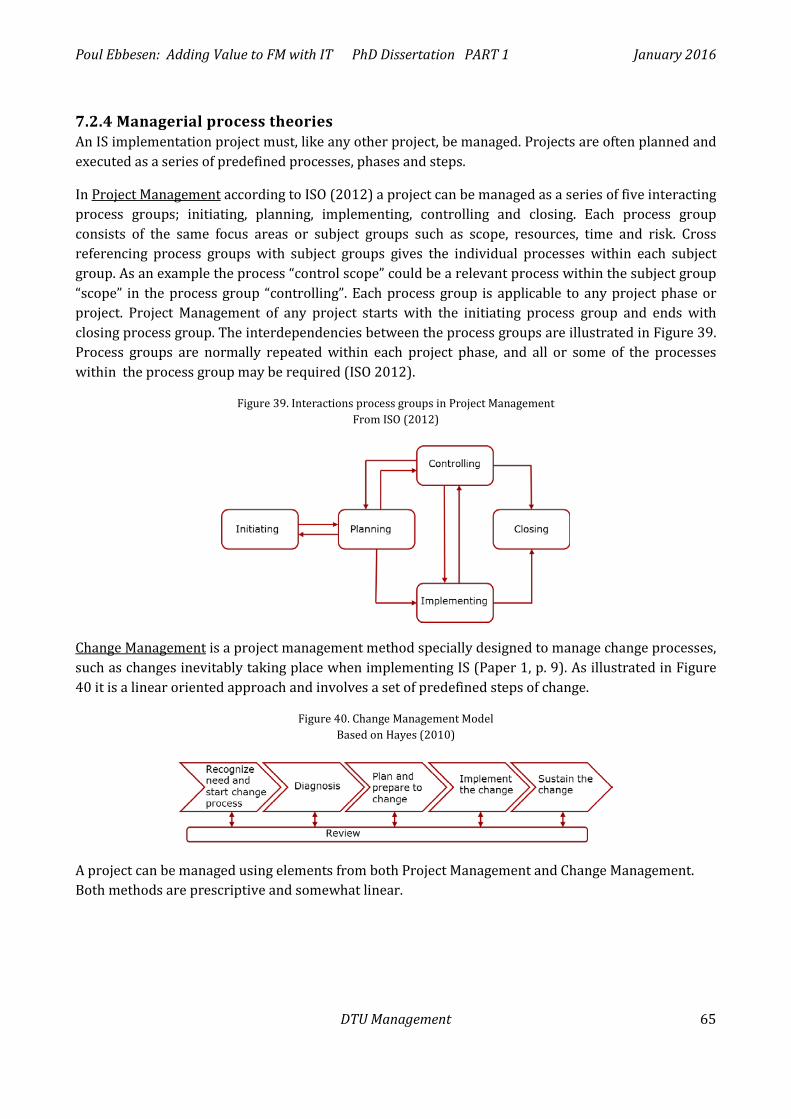
Poul Ebbesen: Adding Value to FM with IT PhD Dissertation PART 1 January 2016
DTU Management 65
7.2.4 Managerial process theories An IS implementation project must, like any other project, be managed. Projects are often planned and executed as a series of predefined processes, phases and steps.
In Project Management according to ISO (2012) a project can be managed as a series of five interacting process groups; initiating, planning, implementing, controlling and closing. Each process group consists of the same focus areas or subject groups such as scope, resources, time and risk. Cross referencing process groups with subject groups gives the individual processes within each subject group. As an example the process “control scope” could be a relevant process within the subject group “scope” in the process group “controlling”. Each process group is applicable to any project phase or project. Project Management of any project starts with the initiating process group and ends with closing process group. The interdependencies between the process groups are illustrated in Figure 39. Process groups are normally repeated within each project phase, and all or some of the processes within the process group may be required (ISO 2012).
Figure 39. Interactions process groups in Project Management From ISO (2012)
Change Management is a project management method specially designed to manage change processes, such as changes inevitably taking place when implementing IS (Paper 1, p. 9). As illustrated in Figure 40 it is a linear oriented approach and involves a set of predefined steps of change.
Figure 40. Change Management Model Based on Hayes (2010)
A project can be managed using elements from both Project Management and Change Management. Both methods are prescriptive and somewhat linear.
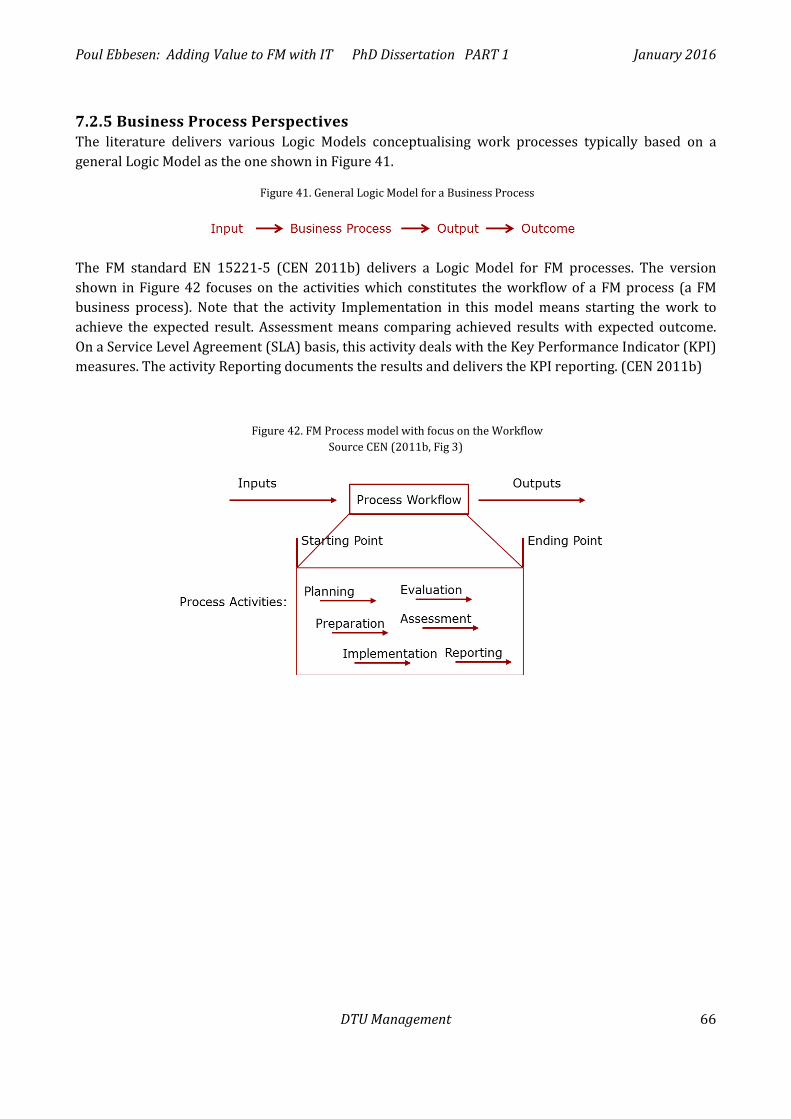
Poul Ebbesen: Adding Value to FM with IT PhD Dissertation PART 1 January 2016
DTU Management 66
7.2.5 Business Process Perspectives The literature delivers various Logic Models conceptualising work processes typically based on a general Logic Model as the one shown in Figure 41.
Figure 41. General Logic Model for a Business Process
The FM standard EN 15221-5 (CEN 2011b) delivers a Logic Model for FM processes. The version shown in Figure 42 focuses on the activities which constitutes the workflow of a FM process (a FM business process). Note that the activity Implementation in this model means starting the work to achieve the expected result. Assessment means comparing achieved results with expected outcome. On a Service Level Agreement (SLA) basis, this activity deals with the Key Performance Indicator (KPI) measures. The activity Reporting documents the results and delivers the KPI reporting. (CEN 2011b)
Figure 42. FM Process model with focus on the Workflow Source CEN (2011b, Fig 3)
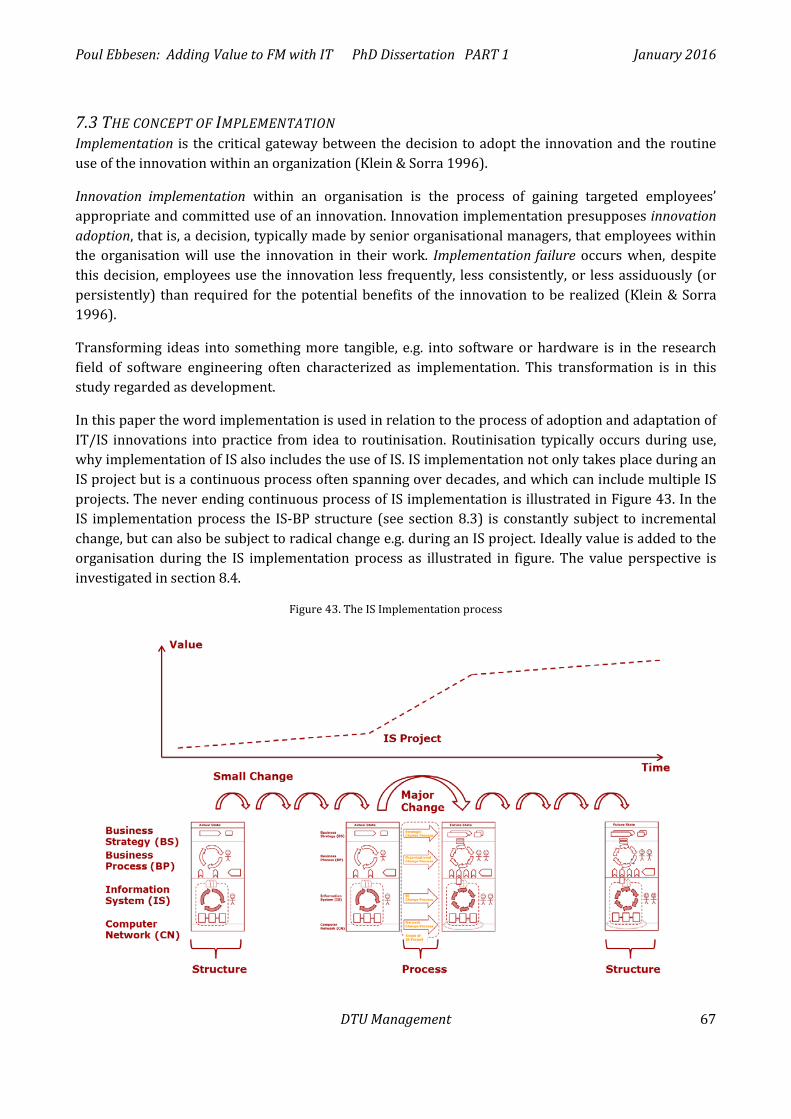
Poul Ebbesen: Adding Value to FM with IT PhD Dissertation PART 1 January 2016
DTU Management 67
7.3 THE CONCEPT OF IMPLEMENTATION Implementation is the critical gateway between the decision to adopt the innovation and the routine use of the innovation within an organization (Klein & Sorra 1996).
Innovation implementation within an organisation is the process of gaining targeted employees’ appropriate and committed use of an innovation. Innovation implementation presupposes innovation adoption, that is, a decision, typically made by senior organisational managers, that employees within the organisation will use the innovation in their work. Implementation failure occurs when, despite this decision, employees use the innovation less frequently, less consistently, or less assiduously (or persistently) than required for the potential benefits of the innovation to be realized (Klein & Sorra 1996).
Transforming ideas into something more tangible, e.g. into software or hardware is in the research field of software engineering often characterized as implementation. This transformation is in this study regarded as development.
In this paper the word implementation is used in relation to the process of adoption and adaptation of IT/IS innovations into practice from idea to routinisation. Routinisation typically occurs during use, why implementation of IS also includes the use of IS. IS implementation not only takes place during an IS project but is a continuous process often spanning over decades, and which can include multiple IS projects. The never ending continuous process of IS implementation is illustrated in Figure 43. In the IS implementation process the IS-BP structure (see section 8.3) is constantly subject to incremental change, but can also be subject to radical change e.g. during an IS project. Ideally value is added to the organisation during the IS implementation process as illustrated in figure. The value perspective is investigated in section 8.4.
Figure 43. The IS Implementation process
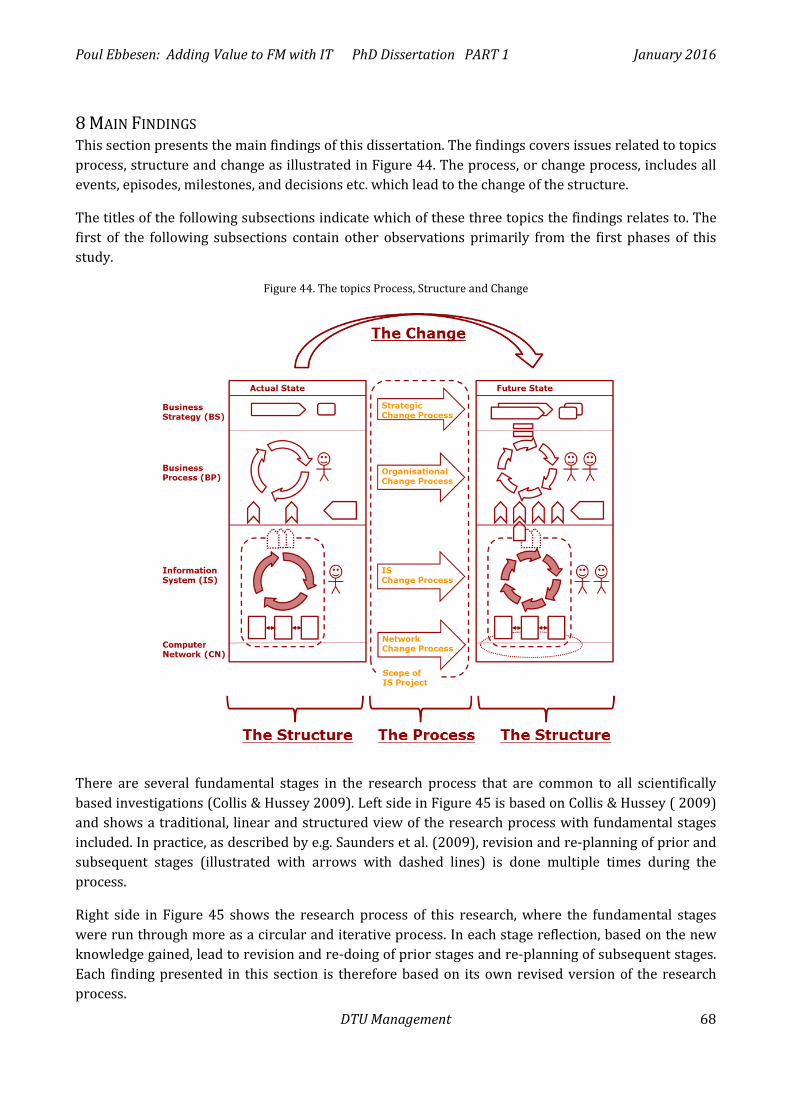
Poul Ebbesen: Adding Value to FM with IT PhD Dissertation PART 1 January 2016
DTU Management 68
8 MAIN FINDINGS This section presents the main findings of this dissertation. The findings covers issues related to topics process, structure and change as illustrated in Figure 44. The process, or change process, includes all events, episodes, milestones, and decisions etc. which lead to the change of the structure.
The titles of the following subsections indicate which of these three topics the findings relates to. The first of the following subsections contain other observations primarily from the first phases of this study.
Figure 44. The topics Process, Structure and Change
There are several fundamental stages in the research process that are common to all scientifically based investigations (Collis & Hussey 2009). Left side in Figure 45 is based on Collis & Hussey ( 2009) and shows a traditional, linear and structured view of the research process with fundamental stages included. In practice, as described by e.g. Saunders et al. (2009), revision and re-planning of prior and subsequent stages (illustrated with arrows with dashed lines) is done multiple times during the process.
Right side in Figure 45 shows the research process of this research, where the fundamental stages were run through more as a circular and iterative process. In each stage reflection, based on the new knowledge gained, lead to revision and re-doing of prior stages and re-planning of subsequent stages. Each finding presented in this section is therefore based on its own revised version of the research process.
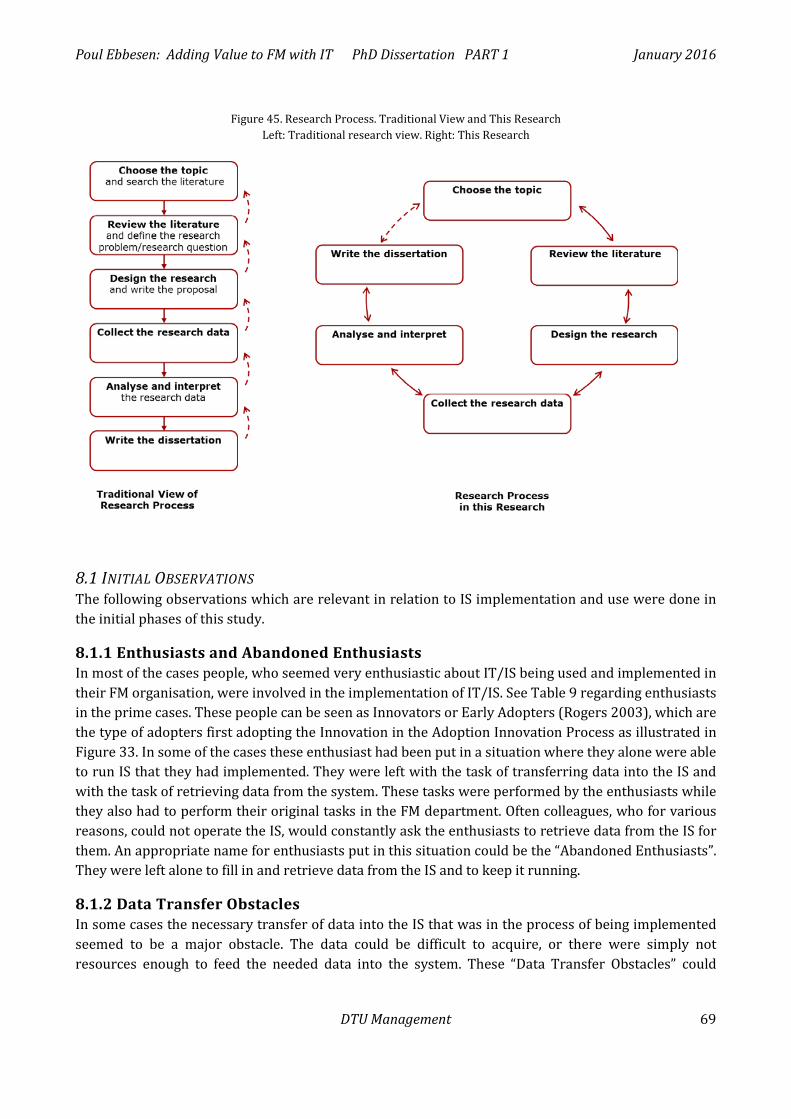
Poul Ebbesen: Adding Value to FM with IT PhD Dissertation PART 1 January 2016
DTU Management 69
Figure 45. Research Process. Traditional View and This Research Left: Traditional research view. Right: This Research
8.1 INITIAL OBSERVATIONS The following observations which are relevant in relation to IS implementation and use were done in the initial phases of this study.
8.1.1 Enthusiasts and Abandoned Enthusiasts In most of the cases people, who seemed very enthusiastic about IT/IS being used and implemented in their FM organisation, were involved in the implementation of IT/IS. See Table 9 regarding enthusiasts in the prime cases. These people can be seen as Innovators or Early Adopters (Rogers 2003), which are the type of adopters first adopting the Innovation in the Adoption Innovation Process as illustrated in Figure 33. In some of the cases these enthusiast had been put in a situation where they alone were able to run IS that they had implemented. They were left with the task of transferring data into the IS and with the task of retrieving data from the system. These tasks were performed by the enthusiasts while they also had to perform their original tasks in the FM department. Often colleagues, who for various reasons, could not operate the IS, would constantly ask the enthusiasts to retrieve data from the IS for them. An appropriate name for enthusiasts put in this situation could be the “Abandoned Enthusiasts”. They were left alone to fill in and retrieve data from the IS and to keep it running.
8.1.2 Data Transfer Obstacles In some cases the necessary transfer of data into the IS that was in the process of being implemented seemed to be a major obstacle. The data could be difficult to acquire, or there were simply not resources enough to feed the needed data into the system. These “Data Transfer Obstacles” could
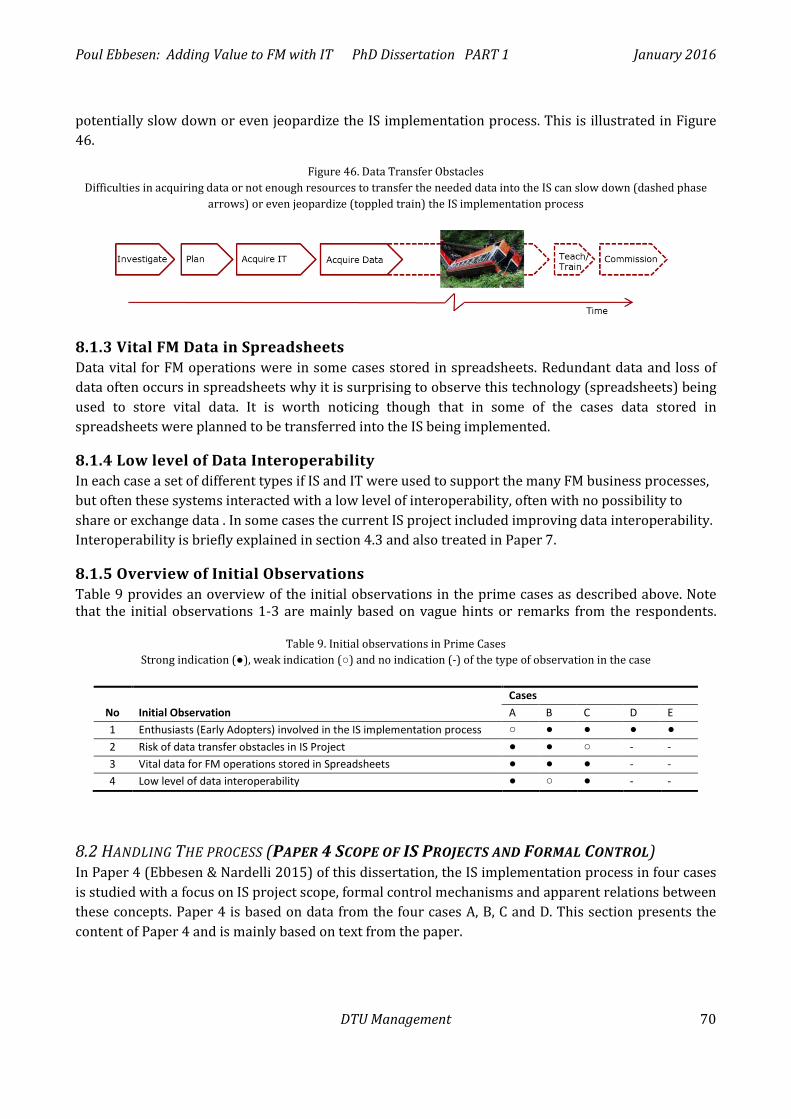
Poul Ebbesen: Adding Value to FM with IT PhD Dissertation PART 1 January 2016
DTU Management 70
potentially slow down or even jeopardize the IS implementation process. This is illustrated in Figure 46.
Figure 46. Data Transfer Obstacles Difficulties in acquiring data or not enough resources to transfer the needed data into the IS can slow down (dashed phase
arrows) or even jeopardize (toppled train) the IS implementation process
8.1.3 Vital FM Data in Spreadsheets Data vital for FM operations were in some cases stored in spreadsheets. Redundant data and loss of data often occurs in spreadsheets why it is surprising to observe this technology (spreadsheets) being used to store vital data. It is worth noticing though that in some of the cases data stored in spreadsheets were planned to be transferred into the IS being implemented.
8.1.4 Low level of Data Interoperability In each case a set of different types if IS and IT were used to support the many FM business processes, but often these systems interacted with a low level of interoperability, often with no possibility to share or exchange data . In some cases the current IS project included improving data interoperability. Interoperability is briefly explained in section 4.3 and also treated in Paper 7.
8.1.5 Overview of Initial Observations Table 9 provides an overview of the initial observations in the prime cases as described above. Note that the initial observations 1-3 are mainly based on vague hints or remarks from the respondents.
Table 9. Initial observations in Prime Cases Strong indication (●), weak indication (○) and no indication (-) of the type of observation in the case
Cases No Initial Observation A B C D E 1 Enthusiasts (Early Adopters) involved in the IS implementation process ○ ● ● ● ● 2 Risk of data transfer obstacles in IS Project ● ● ○ - - 3 Vital data for FM operations stored in Spreadsheets ● ● ● - - 4 Low level of data interoperability ● ○ ● - -
8.2 HANDLING THE PROCESS (PAPER 4 SCOPE OF IS PROJECTS AND FORMAL CONTROL) In Paper 4 (Ebbesen & Nardelli 2015) of this dissertation, the IS implementation process in four cases is studied with a focus on IS project scope, formal control mechanisms and apparent relations between these concepts. Paper 4 is based on data from the four cases A, B, C and D. This section presents the content of Paper 4 and is mainly based on text from the paper.
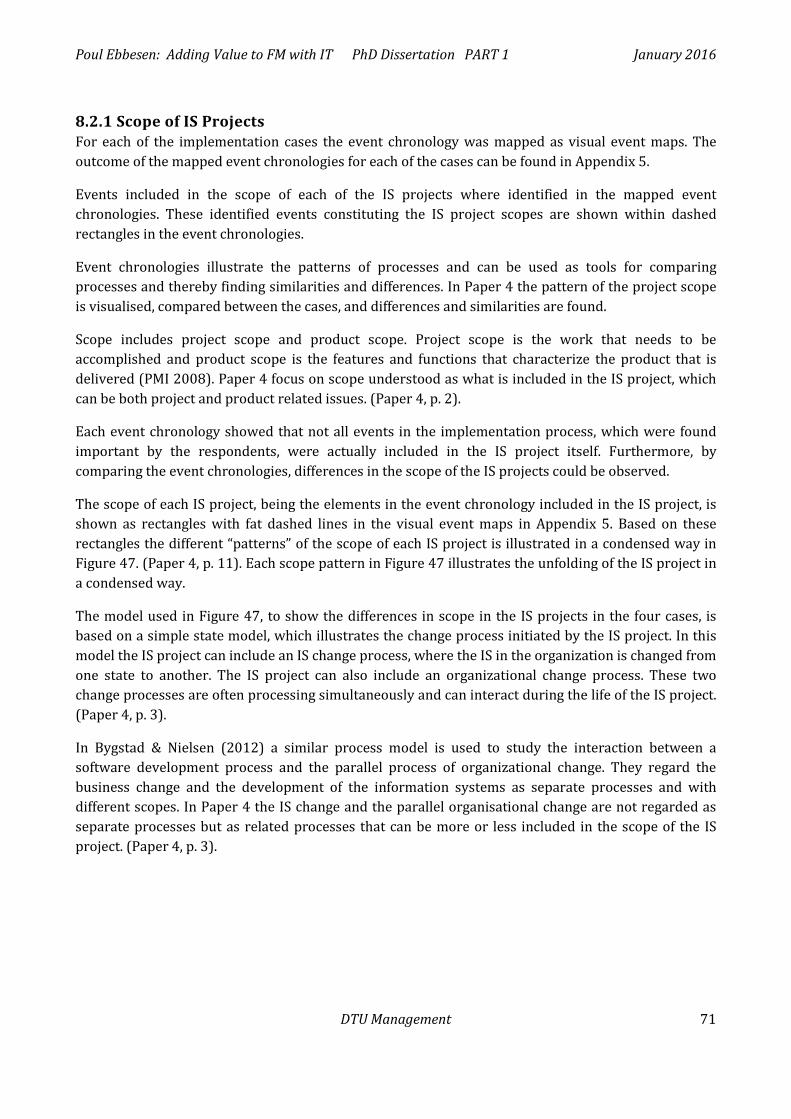
Poul Ebbesen: Adding Value to FM with IT PhD Dissertation PART 1 January 2016
DTU Management 71
8.2.1 Scope of IS Projects For each of the implementation cases the event chronology was mapped as visual event maps. The outcome of the mapped event chronologies for each of the cases can be found in Appendix 5.
Events included in the scope of each of the IS projects where identified in the mapped event chronologies. These identified events constituting the IS project scopes are shown within dashed rectangles in the event chronologies.
Event chronologies illustrate the patterns of processes and can be used as tools for comparing processes and thereby finding similarities and differences. In Paper 4 the pattern of the project scope is visualised, compared between the cases, and differences and similarities are found.
Scope includes project scope and product scope. Project scope is the work that needs to be accomplished and product scope is the features and functions that characterize the product that is delivered (PMI 2008). Paper 4 focus on scope understood as what is included in the IS project, which can be both project and product related issues. (Paper 4, p. 2).
Each event chronology showed that not all events in the implementation process, which were found important by the respondents, were actually included in the IS project itself. Furthermore, by comparing the event chronologies, differences in the scope of the IS projects could be observed.
The scope of each IS project, being the elements in the event chronology included in the IS project, is shown as rectangles with fat dashed lines in the visual event maps in Appendix 5. Based on these rectangles the different “patterns” of the scope of each IS project is illustrated in a condensed way in Figure 47. (Paper 4, p. 11). Each scope pattern in Figure 47 illustrates the unfolding of the IS project in a condensed way.
The model used in Figure 47, to show the differences in scope in the IS projects in the four cases, is based on a simple state model, which illustrates the change process initiated by the IS project. In this model the IS project can include an IS change process, where the IS in the organization is changed from one state to another. The IS project can also include an organizational change process. These two change processes are often processing simultaneously and can interact during the life of the IS project. (Paper 4, p. 3).
In Bygstad & Nielsen (2012) a similar process model is used to study the interaction between a software development process and the parallel process of organizational change. They regard the business change and the development of the information systems as separate processes and with different scopes. In Paper 4 the IS change and the parallel organisational change are not regarded as separate processes but as related processes that can be more or less included in the scope of the IS project. (Paper 4, p. 3).
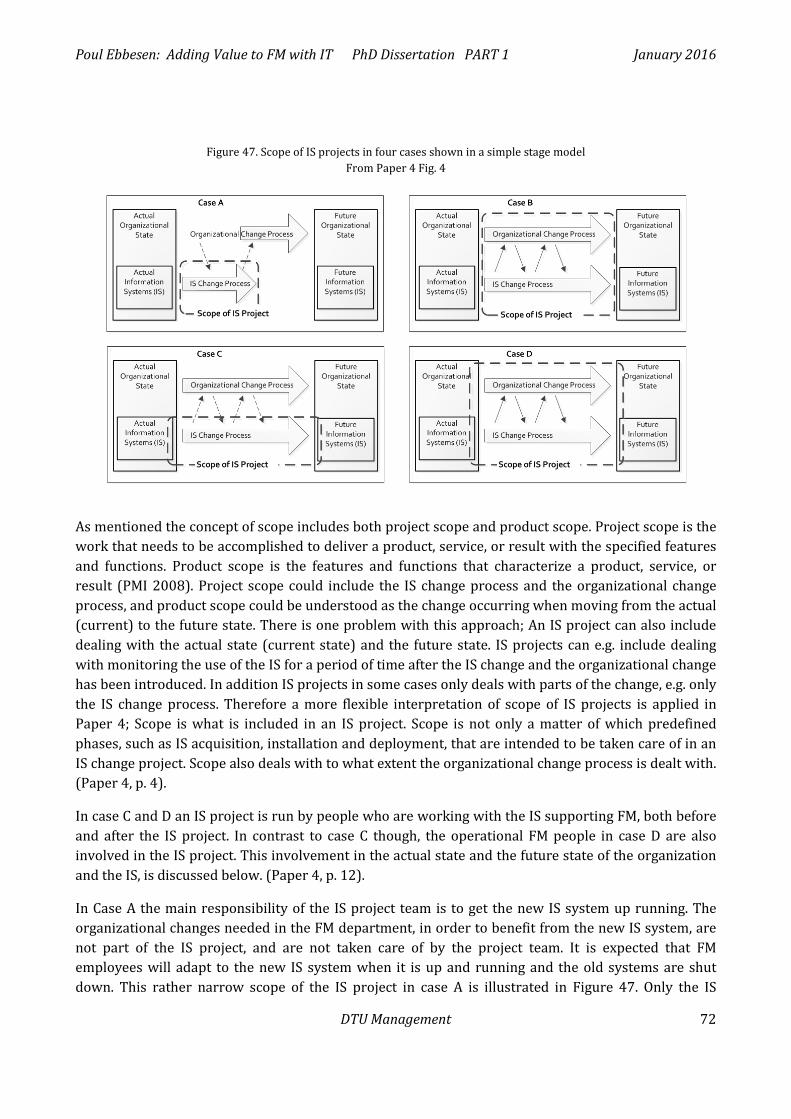
Poul Ebbesen: Adding Value to FM with IT PhD Dissertation PART 1 January 2016
DTU Management 72
Figure 47. Scope of IS projects in four cases shown in a simple stage model From Paper 4 Fig. 4
As mentioned the concept of scope includes both project scope and product scope. Project scope is the work that needs to be accomplished to deliver a product, service, or result with the specified features and functions. Product scope is the features and functions that characterize a product, service, or result (PMI 2008). Project scope could include the IS change process and the organizational change process, and product scope could be understood as the change occurring when moving from the actual (current) to the future state. There is one problem with this approach; An IS project can also include dealing with the actual state (current state) and the future state. IS projects can e.g. include dealing with monitoring the use of the IS for a period of time after the IS change and the organizational change has been introduced. In addition IS projects in some cases only deals with parts of the change, e.g. only the IS change process. Therefore a more flexible interpretation of scope of IS projects is applied in Paper 4; Scope is what is included in an IS project. Scope is not only a matter of which predefined phases, such as IS acquisition, installation and deployment, that are intended to be taken care of in an IS change project. Scope also deals with to what extent the organizational change process is dealt with. (Paper 4, p. 4).
In case C and D an IS project is run by people who are working with the IS supporting FM, both before and after the IS project. In contrast to case C though, the operational FM people in case D are also involved in the IS project. This involvement in the actual state and the future state of the organization and the IS, is discussed below. (Paper 4, p. 12).
In Case A the main responsibility of the IS project team is to get the new IS system up running. The organizational changes needed in the FM department, in order to benefit from the new IS system, are not part of the IS project, and are not taken care of by the project team. It is expected that FM employees will adapt to the new IS system when it is up and running and the old systems are shut down. This rather narrow scope of the IS project in case A is illustrated in Figure 47. Only the IS
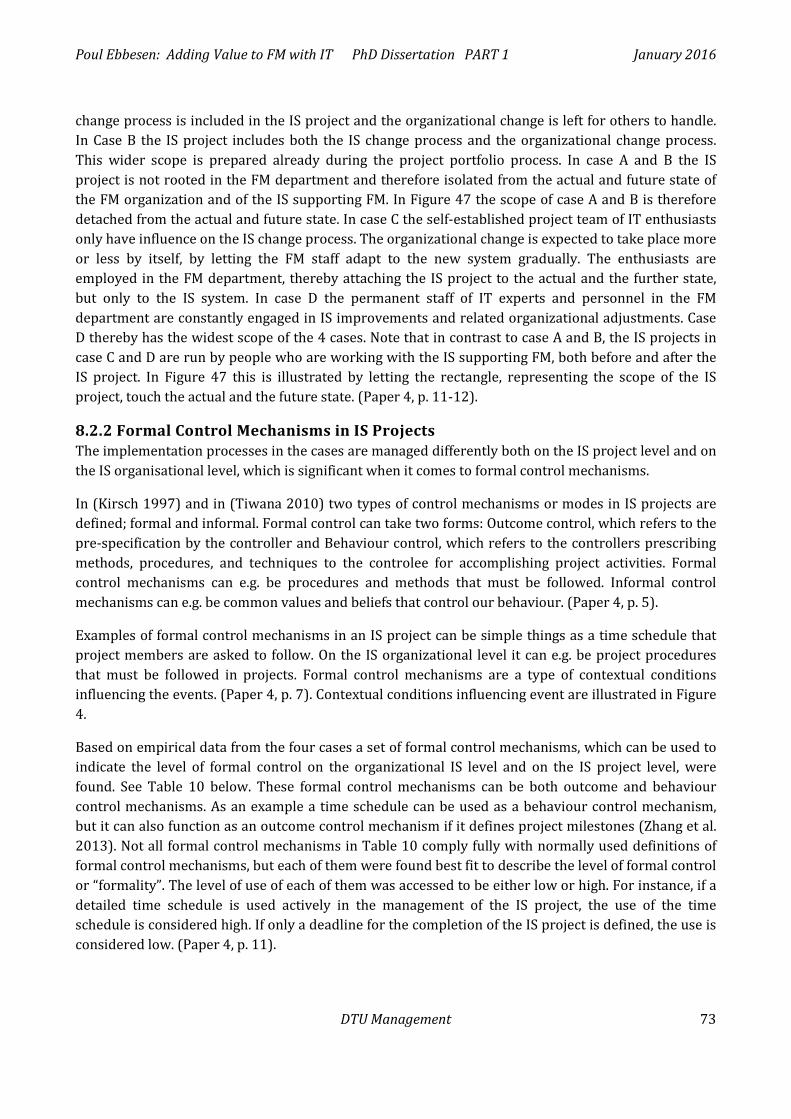
Poul Ebbesen: Adding Value to FM with IT PhD Dissertation PART 1 January 2016
DTU Management 73
change process is included in the IS project and the organizational change is left for others to handle. In Case B the IS project includes both the IS change process and the organizational change process. This wider scope is prepared already during the project portfolio process. In case A and B the IS project is not rooted in the FM department and therefore isolated from the actual and future state of the FM organization and of the IS supporting FM. In Figure 47 the scope of case A and B is therefore detached from the actual and future state. In case C the self-established project team of IT enthusiasts only have influence on the IS change process. The organizational change is expected to take place more or less by itself, by letting the FM staff adapt to the new system gradually. The enthusiasts are employed in the FM department, thereby attaching the IS project to the actual and the further state, but only to the IS system. In case D the permanent staff of IT experts and personnel in the FM department are constantly engaged in IS improvements and related organizational adjustments. Case D thereby has the widest scope of the 4 cases. Note that in contrast to case A and B, the IS projects in case C and D are run by people who are working with the IS supporting FM, both before and after the IS project. In Figure 47 this is illustrated by letting the rectangle, representing the scope of the IS project, touch the actual and the future state. (Paper 4, p. 11-12).
8.2.2 Formal Control Mechanisms in IS Projects The implementation processes in the cases are managed differently both on the IS project level and on the IS organisational level, which is significant when it comes to formal control mechanisms.
In (Kirsch 1997) and in (Tiwana 2010) two types of control mechanisms or modes in IS projects are defined; formal and informal. Formal control can take two forms: Outcome control, which refers to the pre-specification by the controller and Behaviour control, which refers to the controllers prescribing methods, procedures, and techniques to the controlee for accomplishing project activities. Formal control mechanisms can e.g. be procedures and methods that must be followed. Informal control mechanisms can e.g. be common values and beliefs that control our behaviour. (Paper 4, p. 5).
Examples of formal control mechanisms in an IS project can be simple things as a time schedule that project members are asked to follow. On the IS organizational level it can e.g. be project procedures that must be followed in projects. Formal control mechanisms are a type of contextual conditions influencing the events. (Paper 4, p. 7). Contextual conditions influencing event are illustrated in Figure 4.
Based on empirical data from the four cases a set of formal control mechanisms, which can be used to indicate the level of formal control on the organizational IS level and on the IS project level, were found. See Table 10 below. These formal control mechanisms can be both outcome and behaviour control mechanisms. As an example a time schedule can be used as a behaviour control mechanism, but it can also function as an outcome control mechanism if it defines project milestones (Zhang et al. 2013). Not all formal control mechanisms in Table 10 comply fully with normally used definitions of formal control mechanisms, but each of them were found best fit to describe the level of formal control or “formality”. The level of use of each of them was accessed to be either low or high. For instance, if a detailed time schedule is used actively in the management of the IS project, the use of the time schedule is considered high. If only a deadline for the completion of the IS project is defined, the use is considered low. (Paper 4, p. 11).
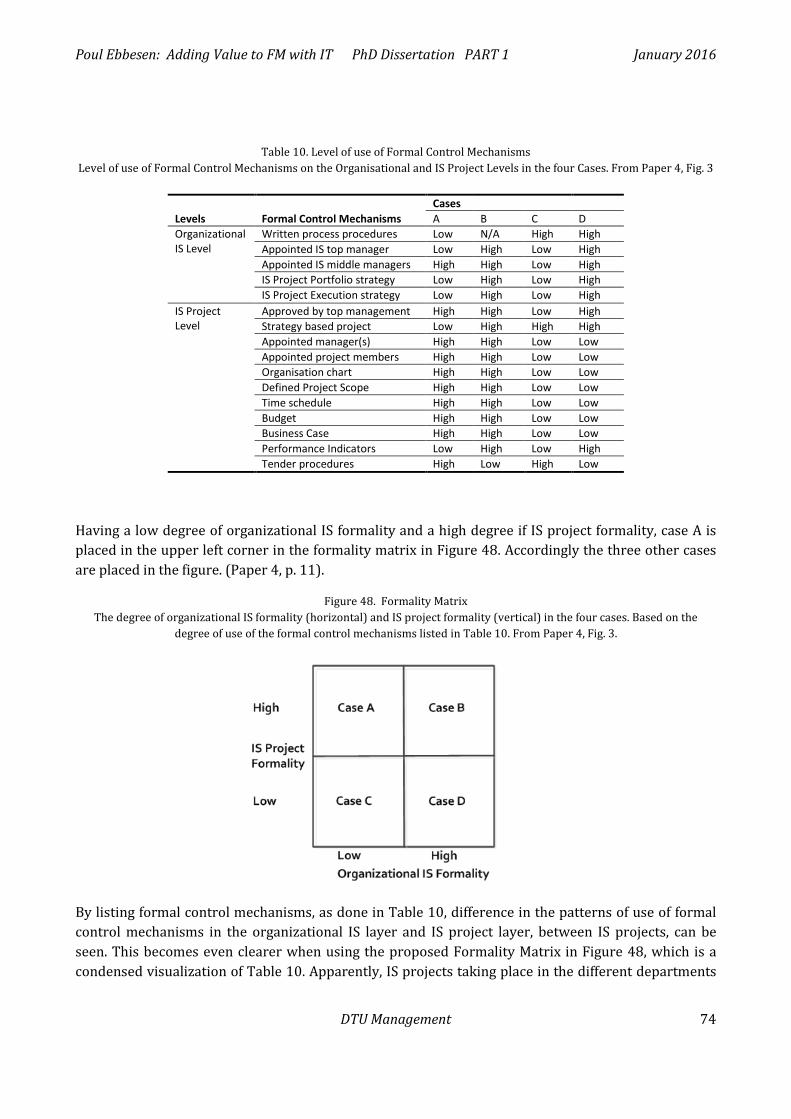
Poul Ebbesen: Adding Value to FM with IT PhD Dissertation PART 1 January 2016
DTU Management 74
Table 10. Level of use of Formal Control Mechanisms Level of use of Formal Control Mechanisms on the Organisational and IS Project Levels in the four Cases. From Paper 4, Fig. 3
Cases Levels Formal Control Mechanisms A B C D Organizational IS Level
Written process procedures Low N/A High High Appointed IS top manager Low High Low High Appointed IS middle managers High High Low High IS Project Portfolio strategy Low High Low High IS Project Execution strategy Low High Low High
IS Project Level
Approved by top management High High Low High Strategy based project Low High High High Appointed manager(s) High High Low Low Appointed project members High High Low Low Organisation chart High High Low Low Defined Project Scope High High Low Low Time schedule High High Low Low Budget High High Low Low Business Case High High Low Low Performance Indicators Low High Low High Tender procedures High Low High Low
Having a low degree of organizational IS formality and a high degree if IS project formality, case A is placed in the upper left corner in the formality matrix in Figure 48. Accordingly the three other cases are placed in the figure. (Paper 4, p. 11).
Figure 48. Formality Matrix The degree of organizational IS formality (horizontal) and IS project formality (vertical) in the four cases. Based on the
degree of use of the formal control mechanisms listed in Table 10. From Paper 4, Fig. 3.
By listing formal control mechanisms, as done in Table 10, difference in the patterns of use of formal control mechanisms in the organizational IS layer and IS project layer, between IS projects, can be seen. This becomes even clearer when using the proposed Formality Matrix in Figure 48, which is a condensed visualization of Table 10. Apparently, IS projects taking place in the different departments
Poul Ebbesen: Adding Value to FM with IT PhD Dissertation PART 1 January 2016
DTU Management 75
of an organization can be governed more or less from an overall organizational level. They can also be managed more or less on the IS project level. (Paper 4, p. 12).
8.2.3 Combining Scope and Formal Control Claiming some sort of relation between where in the Formality Matrix an IS project is placed and the shape of the scope of the IS project requires more cases than included in this study. Despite this limitation some suggested relations are proposed in the following. (Paper 4, p. 13)
Organizations with a more formalized organizational IS governance, such as case B and D, tend to include both IS change and organizational change, which allows for a wider IS project scope. In other words they are more prone to a wider IS project scope. On the other hand, organizations with an less formalized organizational IS management, such as case A and C, seem to miss the capability of including the whole change process, and thereby be more prone to a narrower IS project scope. (Paper 4, p. 13).
IS projects with a less formalized management, such as in case C and D, seem to be better attached or linked to the actual and future state of the IS, and in case D also to the actual and further state of the organization. The reason could be that only people who are familiar with the actual conditions, e.g. who work in the FM department, are able to run a IS project in the FM department in an informal manner. Both in case C and D the same group of people are involved in not only the IS projects in focus, but in all IS projects in the FM department. The only difference is that in case D a framework or a structure, wherein the project can be managed has been established by the organization. (Paper 4, p. 13).
Note that the transition in the start and the end of the scope of an IS project may be vital for the level of success of the IS project. In case A and C, where the organizational change process is not included in the scope, the transition in the end may reveal some challenges. (Paper 4, p. 13).
8.3 THE STRUCTURE BEING CHANGED (PAPER 5 IS AND BUSINESS PROCESS FRAMEWORK) In Paper 5 (Ebbesen 2016) of this dissertation a framework describing and illustrating the interaction between Information Systems (IS) and Business Processes (BP) is presented. This IS-BP framework emerged as an implicit and underlying common structure during the study of the unfolding of the IS implementation processes in case A, B, C and D. The use of the framework is exemplified by applying it to case C. This section presents the content of Paper 5 and is mainly based on text from the paper. The two concepts alignment and functional affordances which are important elements linking layers together in the proposed framework are first explained.
8.3.1 Alignment A common stance is that IS must support BP which must be aligned with the business goals and strategy. To build an organisational structure and a set of BP which reflect the interdependence of enterprise strategy and IT capabilities, the linkage of IT to the enterprise is a key factor that can affect the competitiveness and efficiency of the business. This is alignment according to Luftman et al. (1993) in Millet et al. (2009). Alignment can be described at two different abstraction levels, i.e. strategic and functional (Chan & Reich (2007) in Aversano et al. (2011)); it involves different aspects, such as enterprise goals, business entities, strategies and processes, IS and data. In the framework presented in Paper 5 the alignment is described on the strategic level as a link between BS and BP. (Paper 5, p. 4)
Poul Ebbesen: Adding Value to FM with IT PhD Dissertation PART 1 January 2016
DTU Management 76
According to Gregor et al. (2007) several architecture frameworks have been developed to cater for the business and IS/IT needs of organisations. They argue that an enterprise architecture (EA) of an organisation can enable the alignment of Business Strategy (BS) and IS/IT. They define alignment between IS and BS as a condition where IS supports and are supported by the BS. In summary, organisational studies suggest that alignment and perceived business performance is closely related (Gregor et al. 2007). The framework presented in this Paper 5 contains some of the elements normally included in organisation’s EA. Furthermore the framework includes alignment between BS and BP and not as in Gregor et al. (2007) between BS and IS. In the framework presented in Paper 5 functional affordances of the IS connects to the needs of the BP, which to some extent though can be seen as alignment between IS and BS. EA can enable alignment in important ways: Business and IS are drawn together under a common organisational framework and the current and future state of the business and the IS/IT is defined and described (Gregor et al. 2007). The same argument can be applied to the present framework and it can therefore enable alignment. (Paper 5, p. 4)
Corporate strategic processes are likely to be quite far removed, in organizational terms, from processes of IS development and operation (Beeson et al. 2002). One of the major reasons why IS encounter problems or fail in the context of an organisation is the missing alignment with BP, furthermore BP and IS mutually affect each other in non-trivial ways (Heinrich 2014). These statements only underpin the need for a framework as the one proposed in Paper 5. (Paper 5, p. 5)
8.3.2 Functional Affordances The concept of affordances is central to the proposed framework. Affordance can be understood as the multiple uses for which artefacts may be employed (Gibson 1986). According to Gibson we do not perceive the qualities of objects but their affordances. Functional affordances are potential uses of IS based on users’ interpretation of their material properties dependent on the use context (Markus & Silver 2008). The concept of functional affordances builds on the view that individuals do not interact with an object without perceiving what the object can be used for (Gibson 1986). (Paper 5, p. 4)
Functional affordances describe the action possibilities offered by properties existent in IS. Still, these functional affordances need to be perceived as such before they can be realized. The way functional affordances are perceived is furthermore dependent on the context in which IS are used (Leonardi (2011) in Seidel & Recker (2012)). Consequently, the way functional affordances are perceived is dependent on the BP in which the IS are used. Seidel & Recker (2012) conclude that the emergence of the functional affordances not only depends on the material properties of IS, but also on the characteristics of the process to be changed, including the involved individuals and organizational context. The framework proposed in Paper 5 includes elements such as process, context and human resources. (Paper 5, p.4-5)
8.3.3 IS-BP Framework During the mapping of events chronologies, explained earlier in this dissertation, the structure or patterns which are representing the basis for the framework, proposed in Paper 5, emerged. As an example, it became clear that in all four cases (A, B, C and D) there were routines strictly related to the BP and other routines strictly related to the IS, in other words two separate sets of routines. Furthermore the elements common to all four cases, which constitutes the IS and the BS and the connections between the IS and the BP, emerged. At this stage additional existing theory on IS and BP frameworks, as explained above, was included in the study. It became clear that the observed
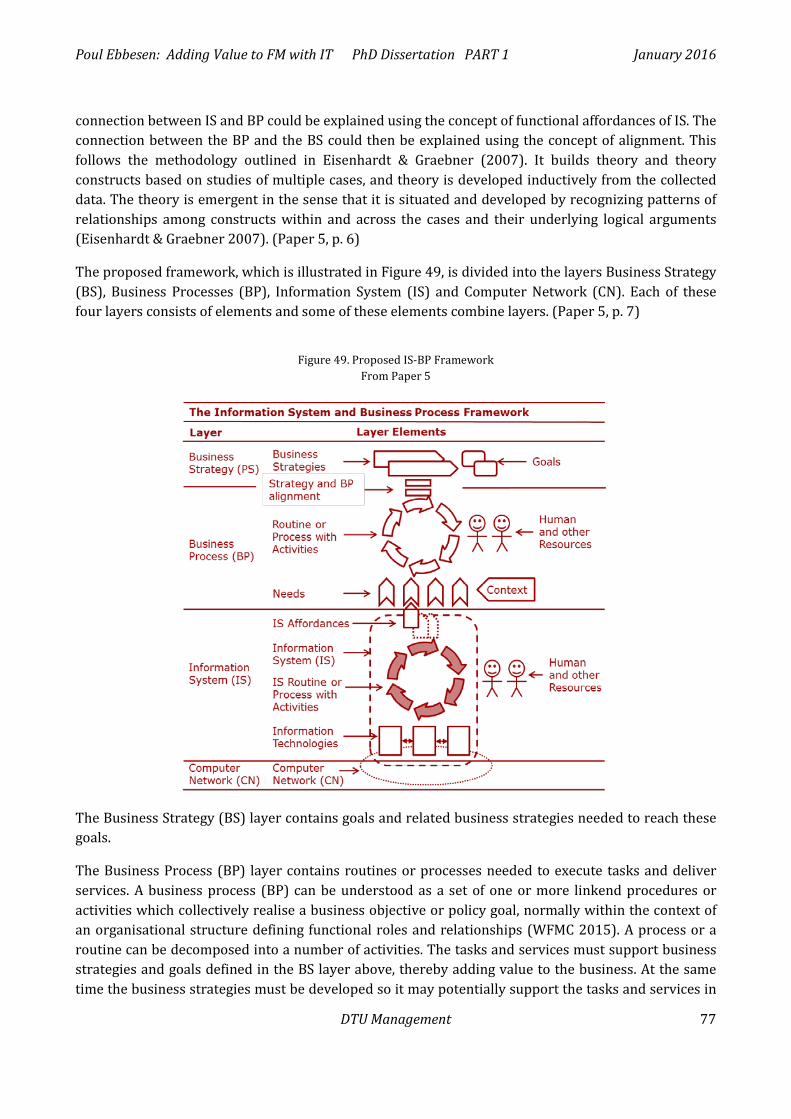
Poul Ebbesen: Adding Value to FM with IT PhD Dissertation PART 1 January 2016
DTU Management 77
connection between IS and BP could be explained using the concept of functional affordances of IS. The connection between the BP and the BS could then be explained using the concept of alignment. This follows the methodology outlined in Eisenhardt & Graebner (2007). It builds theory and theory constructs based on studies of multiple cases, and theory is developed inductively from the collected data. The theory is emergent in the sense that it is situated and developed by recognizing patterns of relationships among constructs within and across the cases and their underlying logical arguments (Eisenhardt & Graebner 2007). (Paper 5, p. 6)
The proposed framework, which is illustrated in Figure 49, is divided into the layers Business Strategy (BS), Business Processes (BP), Information System (IS) and Computer Network (CN). Each of these four layers consists of elements and some of these elements combine layers. (Paper 5, p. 7)
Figure 49. Proposed IS-BP Framework
From Paper 5
The Business Strategy (BS) layer contains goals and related business strategies needed to reach these goals.
The Business Process (BP) layer contains routines or processes needed to execute tasks and deliver services. A business process (BP) can be understood as a set of one or more linkend procedures or activities which collectively realise a business objective or policy goal, normally within the context of an organisational structure defining functional roles and relationships (WFMC 2015). A process or a routine can be decomposed into a number of activities. The tasks and services must support business strategies and goals defined in the BS layer above, thereby adding value to the business. At the same time the business strategies must be developed so it may potentially support the tasks and services in
Poul Ebbesen: Adding Value to FM with IT PhD Dissertation PART 1 January 2016
DTU Management 78
the BP layer. For this relation between the routines in the BP layer and the strategies in the BS layer, the concept of alignment is used in the framework. The BP layer also contains resources, e.g. human resources needed to execute the routines and processes. Furthermore this layer contains needs that must be met in order to execute the routines and processes, such as managerial support, legal support, financial support, standardised procedures, and access to data and information. Each need is context dependent; it depends on e.g. the type of organisation or type of facilities (at least when dealing with IS used in FM departments). (Paper 5, p. 7)
The IS layer contains the IS, which includes IS routines or processes and one or more interacting IT. The IS routines and processes also require human resources and cannot rely only on the technologies to be executed. The IS layer creates IS affordances, or functional IS affordances, typically data or information type of affordances. One or more of these functional IS affordances can match one or more of the needs in the BP layer above, typically data or information types of needs. This match does however rely on the context (Leonardi 2011) and on how the functional affordances are perceived by the human recourses or individuals involved in the BP. (Paper 5, p.8)
Finally the CN layer contains the network which is the infrastructure wherein data can be transmitted and exchanged between technologies in the IS layer. (Paper 5, p. 8)
Coherent layers interact with each other. The CN layer delivers the basis for running the technologies in the IS layer. In the IS layer functional affordances are created, typically meeting the needs for data and information in the BP layer. Finally, if the processes in the BP layer are aligned with the strategies in the BS layer, the BP layer can add value to the business by delivering the routines and processes and executing the tasks and services needed to reach the goals set in the BS layer as defined in the strategies. If needs in the BP layer are meet by functional affordances in the IS layer, in other words if the BP layer is supported by the IS layer, this should add further value to the BS layer. (Paper 5, p. 8)
It should be noticed that there may be multiple instances of each element in the framework, e.g. more than one routine in the IS layer, more than one functional affordance which is used in the BP layer, more than one routine in the BP layer etc. (Paper 5, p. 8)
8.3.4 Applying the IS-BP Framework to a case The IS-BP framework is tested and used as an analytical tool by applying it to case C where an IS based on Building Information Modeling (BIM) was implemented to support management of construction and refurbishment projects. The business process (BP) in this case is Construction Management. (Paper 5, p. 2). In the following the IS implementation case is first explained, next the IS-BP framework is applied to the case and finally the use of the framework is discussed.
Case C is constituted by an Australian organisation which manages cultural events. The organisation is owned by the public, has 750 employees and it is situated in 55,000 m2 facilities. The FM department employs 40 people who are in charge of all operations and changes of the facilities. Most of the functions are outsourced and the FM department therefore relies heavily on external suppliers such as consultants, contractors and service providers to operate and adjust the facilities according to the needs of the core business. The facilities are intensely exploited and used every day all year round. The facilities are constantly undergoing alterations; there are constantly ongoing construction and refurbishment projects in the facilities. The facilities are geometrically complicated and they are
Poul Ebbesen: Adding Value to FM with IT PhD Dissertation PART 1 January 2016
DTU Management 79
classified as protected buildings and subject to strict constraints to any changes. Hence a constant need for accurate and updated geometrical data. (Paper 5, p. 9)
As indicated the suppliers involved in the alterations of the facilities are in constant need of accurate and updated geometrical building information. To minimize the time spent to find and deliver updated information, the FM department during the last 10 years has been in the process of implementing an IS based on Building Information Modeling (BIM), where updated geometrical building data and other building related information is available, and where changes in the physical facilities are reported back and updated in the 3D BIM model. The process of implementing the IS, which is now fully completed, has taken ten years. This includes building up the needed knowledge in the FM department and scanning the IS market for possible solutions. New employees with IS and BIM competences have been hired to build up the 3D model and to manage the routines and processes of the IS. The IS routines include keeping the 3D model up-to-date and delivering needed data for the construction projects. The IS runs on an internal network. Only people in charge of the IS have access to the internal network within which the updated master model is located. Through the internet external suppliers have access to a simple version of the model and to other information and drawings. At the end of each alteration in the facilities it is required that suppliers upload a new version of the model, including the changes they have applied to the physical facilities. The IS managers can then change the master model accordingly. The external suppliers are also required to do cloud scanning of the changed areas of the facilities, and to deliver the cloud scanning files together with the new version of the model. (Paper 5, p. 9)
Each IS-BP framework layer and element of the IS implementation project in case C is explained in the following (the IS-BP framework is applied to the case). Short explanations of each of element in the case are given as a summarised view in Figure 50, which is based on the illustration of the framework from Figure 49.
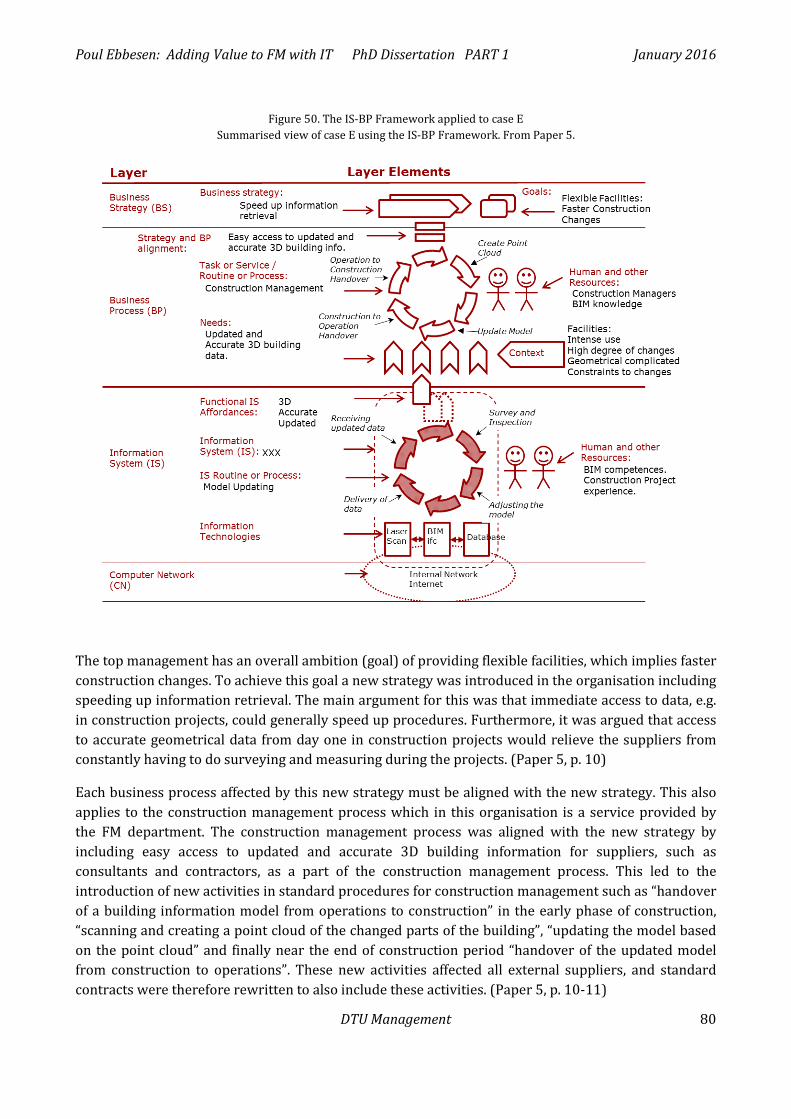
Poul Ebbesen: Adding Value to FM with IT PhD Dissertation PART 1 January 2016
DTU Management 80
Figure 50. The IS-BP Framework applied to case E Summarised view of case E using the IS-BP Framework. From Paper 5.
The top management has an overall ambition (goal) of providing flexible facilities, which implies faster construction changes. To achieve this goal a new strategy was introduced in the organisation including speeding up information retrieval. The main argument for this was that immediate access to data, e.g. in construction projects, could generally speed up procedures. Furthermore, it was argued that access to accurate geometrical data from day one in construction projects would relieve the suppliers from constantly having to do surveying and measuring during the projects. (Paper 5, p. 10)
Each business process affected by this new strategy must be aligned with the new strategy. This also applies to the construction management process which in this organisation is a service provided by the FM department. The construction management process was aligned with the new strategy by including easy access to updated and accurate 3D building information for suppliers, such as consultants and contractors, as a part of the construction management process. This led to the introduction of new activities in standard procedures for construction management such as “handover of a building information model from operations to construction” in the early phase of construction, “scanning and creating a point cloud of the changed parts of the building”, “updating the model based on the point cloud” and finally near the end of construction period “handover of the updated model from construction to operations”. These new activities affected all external suppliers, and standard contracts were therefore rewritten to also include these activities. (Paper 5, p. 10-11)
Poul Ebbesen: Adding Value to FM with IT PhD Dissertation PART 1 January 2016
DTU Management 81
To execute the mentioned new activities some data related needs must be met. Data must be constantly prepared for use; data must be updated and be accurate. The context is an important element when considering what needs should be met. As mentioned the facilities are intensely exploited, often undergoing alterations, are geometrically complicated and there are strict constraints to any changes. (Paper 5, p. 11)
To meet these needs it was decided to invest in a BIM based IS. To meet the specific need of access to accurate geometrical data, and at the same time take into account the special context of having to do with geometrical complicated facilities, it was decided to laser scan the geometrically most complicated parts of the facilities. To meet the specific need of having constantly updated data, people with IS and BIM skills where hired to run the IS routines. The IS, as shown in Figure 50, creates the functional affordances of delivering accurate and updated 3D information. These affordances cover the data related needs of the new activities “operations to construction handover” and “construction to operations handover” in the construction management routine in the BP layer. The IS routine includes activities such as “receiving updated data from construction”, “survey and inspection”, adjustment of the master model” and “delivery of data to construction”. (Paper 5, p. 11)
8.3.5 Discussions and Conclusions about the IS-BP Framework The IS-BP framework presented in Paper 5 shows that IS and BP are two separate and distinct phenomena. This implies a distinction between the routines in the BP layer and the routines in the IS layer. Both routines include activities which require manpower and other resources, but they are two separate entities. The IS and BP layers are connected through functional affordances of the IS and requirements or needs of the BP. (Paper 5, p. 11)
When applying the IS-BP framework to a case, as it is done in Paper 5, the framework can show to what degree an existing IS or an IS implementation project is “complete” or “robust”. If one or more of the elements in the framework are missing or not defined, the IS implementation is likely to run in to trouble. If for instance in the routine in the IS layer, it is unclear which activities create the functional affordances needed in the BP layer, it may not be possible to support the routine in the BP layer. Each element is needed and must be clarified in order to add value to the organisation from IS investments. (Paper 5, p. 11)
Although many different routines and processes are needed to keep facilities operating efficiently it is often challenging to actually implement these in an existing FM organization (Lewis et al. 2010). If routines and processes in the BP layer are not in place, it will be difficult to support them with an IS. This may jeopardise an IS project. (Paper 5, p. 12). FM routines and processes, or just FM business processes (BP) not in place are not specifically dealt with in this research, but such routine and processes were observed in some of the cases.
The framework can be used as an analytical framework to investigate implementation and use of IS in organisations, and it can be used to compare such cases. The framework provides a more holistic view in the planning and execution of IS implementation projects, forcing one to see the broader picture. (Paper 5, p. 11)
The costly part in the framework is the work routines and processes. Keeping these running and compliant to standards in the BP layer requires highly specialized skills. Adding an IS layer with its own routines and processes to the equation, it becomes even more costly and complicated. As
Poul Ebbesen: Adding Value to FM with IT PhD Dissertation PART 1 January 2016
DTU Management 82
mentioned in the description of the case, new staff were hired to run the routines in the IS layer. (Paper 5, p. 12)
8.4 THE CHANGE IN VALUE (PAPER 6 ADDED VALUE OF IS IN FM) Paper 6 (Ebbesen & Jensen 2016) of this dissertation deals with an aspect of the changes taking place during IS implementation projects. Paper 6 focuses on change in value (the added value) to the organisation generated from an implemented IS which supports a specific FM business process. The paper presents a method, for assessing the added value of IS being implemented, based on a FM supply chain model, value dimensions such as efficiency and effectiveness, Value Adding Management (VAM) and functional affordances. The use of the method is exemplified by applying it to case E where the FM business process cleaning is supported by a recently implemented IS. The presentation below, of the content of Paper 6, is mainly based on text from the paper.
8.4.1 Added Value and Value Concepts Assessing the added value from the effort of implementing IS supporting FM processes is associated with major challenges. It is often unclear what added value is expected and what part of the supply chain of FM deliveries that benefits from the IS. One reason for this might be that the concept of value is not well defined and as a consequence can be difficult to use as the sole parameter. Furthermore it is often not understood very well how the parts in the supply chain of FM deliveries are interconnected. Paper 6 therefore proposes a general method for assessing the added value of IS in FM. (Paper 6, p. 2)
There is no commonly accepted definition of value (Thyssen 2011, p. 53). The plural version ”values” is often related to ethics or moral issues. In Paper 6 value is understood as benefits to the business. There are of course many types of benefits. To achieve value, or to add value, often some sort of effort or sacrifice is required. Examples of benefits from the effort or sacrifice of implementing an IS can e.g. be increased efficiency and improved effectiveness of the business processes, and improved Interoperability. But implementing an IS in an organisation, can of course also have many other types of benefits, e.g. improved working conditions. Each type of benefit can add value to the business. The left side of the tree structure in Figure 51 illustrates the explained relations between these value concepts. (Paper 6, p. 2-3)
The right side of Figure 51 shows that IS can offer functional affordances, some of which can improve effectiveness, increase efficiency or improve interoperability. The concept of functional affordances is explained in the previous section concerning Paper 5 and the concept of interoperability is explained below. (Paper 6, p. 3)
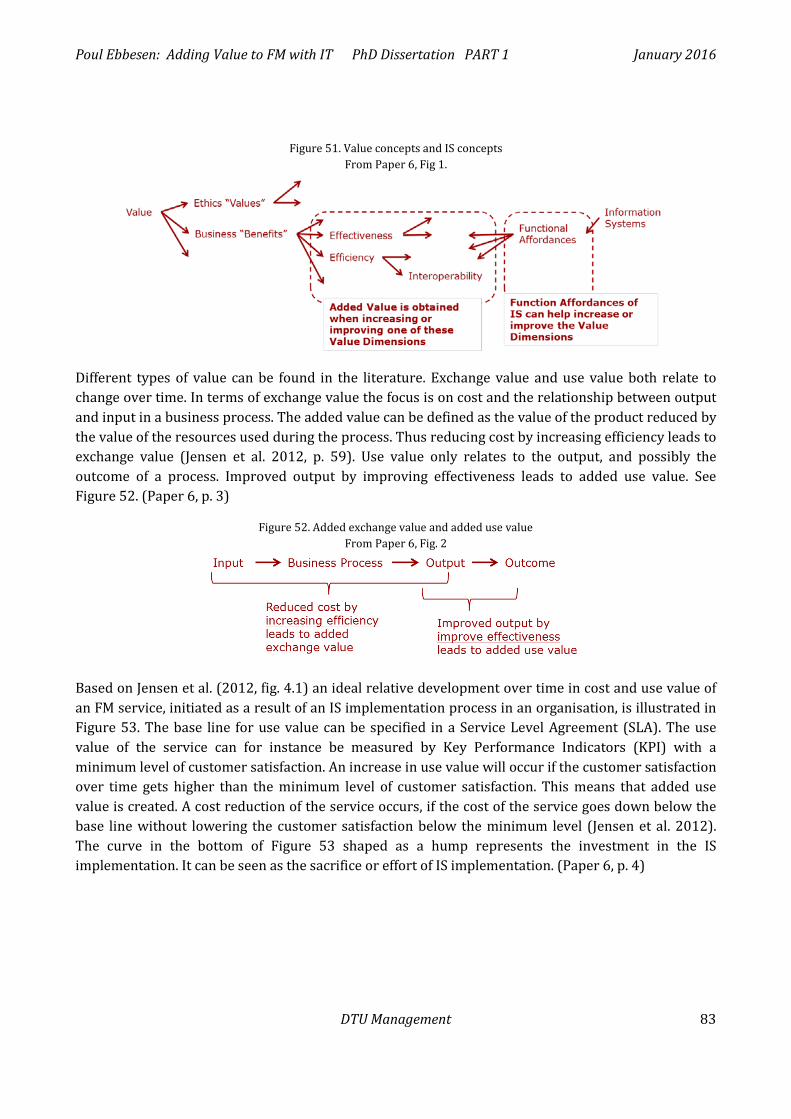
Poul Ebbesen: Adding Value to FM with IT PhD Dissertation PART 1 January 2016
DTU Management 83
Figure 51. Value concepts and IS concepts From Paper 6, Fig 1.
Different types of value can be found in the literature. Exchange value and use value both relate to change over time. In terms of exchange value the focus is on cost and the relationship between output and input in a business process. The added value can be defined as the value of the product reduced by the value of the resources used during the process. Thus reducing cost by increasing efficiency leads to exchange value (Jensen et al. 2012, p. 59). Use value only relates to the output, and possibly the outcome of a process. Improved output by improving effectiveness leads to added use value. See Figure 52. (Paper 6, p. 3)
Figure 52. Added exchange value and added use value From Paper 6, Fig. 2
Based on Jensen et al. (2012, fig. 4.1) an ideal relative development over time in cost and use value of an FM service, initiated as a result of an IS implementation process in an organisation, is illustrated in Figure 53. The base line for use value can be specified in a Service Level Agreement (SLA). The use value of the service can for instance be measured by Key Performance Indicators (KPI) with a minimum level of customer satisfaction. An increase in use value will occur if the customer satisfaction over time gets higher than the minimum level of customer satisfaction. This means that added use value is created. A cost reduction of the service occurs, if the cost of the service goes down below the base line without lowering the customer satisfaction below the minimum level (Jensen et al. 2012). The curve in the bottom of Figure 53 shaped as a hump represents the investment in the IS implementation. It can be seen as the sacrifice or effort of IS implementation. (Paper 6, p. 4)
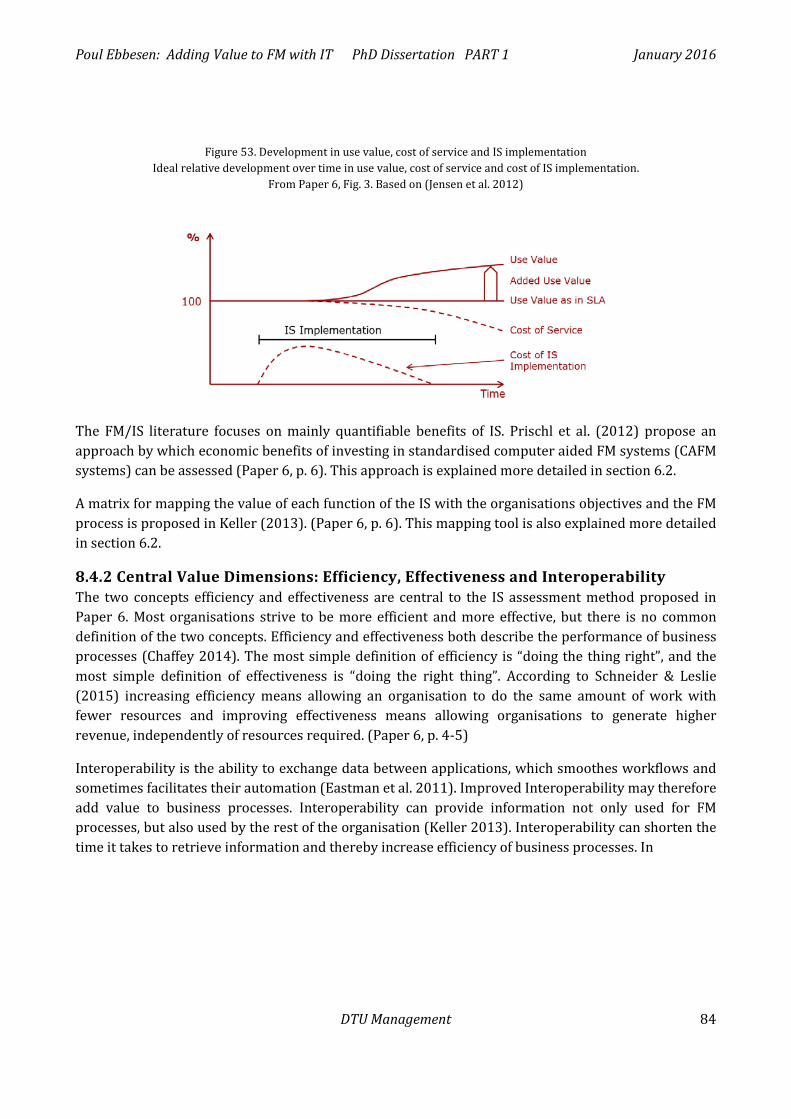
Poul Ebbesen: Adding Value to FM with IT PhD Dissertation PART 1 January 2016
DTU Management 84
Figure 53. Development in use value, cost of service and IS implementation Ideal relative development over time in use value, cost of service and cost of IS implementation.
From Paper 6, Fig. 3. Based on (Jensen et al. 2012)
The FM/IS literature focuses on mainly quantifiable benefits of IS. Prischl et al. (2012) propose an approach by which economic benefits of investing in standardised computer aided FM systems (CAFM systems) can be assessed (Paper 6, p. 6). This approach is explained more detailed in section 6.2.
A matrix for mapping the value of each function of the IS with the organisations objectives and the FM process is proposed in Keller (2013). (Paper 6, p. 6). This mapping tool is also explained more detailed in section 6.2.
8.4.2 Central Value Dimensions: Efficiency, Effectiveness and Interoperability The two concepts efficiency and effectiveness are central to the IS assessment method proposed in Paper 6. Most organisations strive to be more efficient and more effective, but there is no common definition of the two concepts. Efficiency and effectiveness both describe the performance of business processes (Chaffey 2014). The most simple definition of efficiency is “doing the thing right”, and the most simple definition of effectiveness is “doing the right thing”. According to Schneider & Leslie (2015) increasing efficiency means allowing an organisation to do the same amount of work with fewer resources and improving effectiveness means allowing organisations to generate higher revenue, independently of resources required. (Paper 6, p. 4-5)
Interoperability is the ability to exchange data between applications, which smoothes workflows and sometimes facilitates their automation (Eastman et al. 2011). Improved Interoperability may therefore add value to business processes. Interoperability can provide information not only used for FM processes, but also used by the rest of the organisation (Keller 2013). Interoperability can shorten the time it takes to retrieve information and thereby increase efficiency of business processes. In
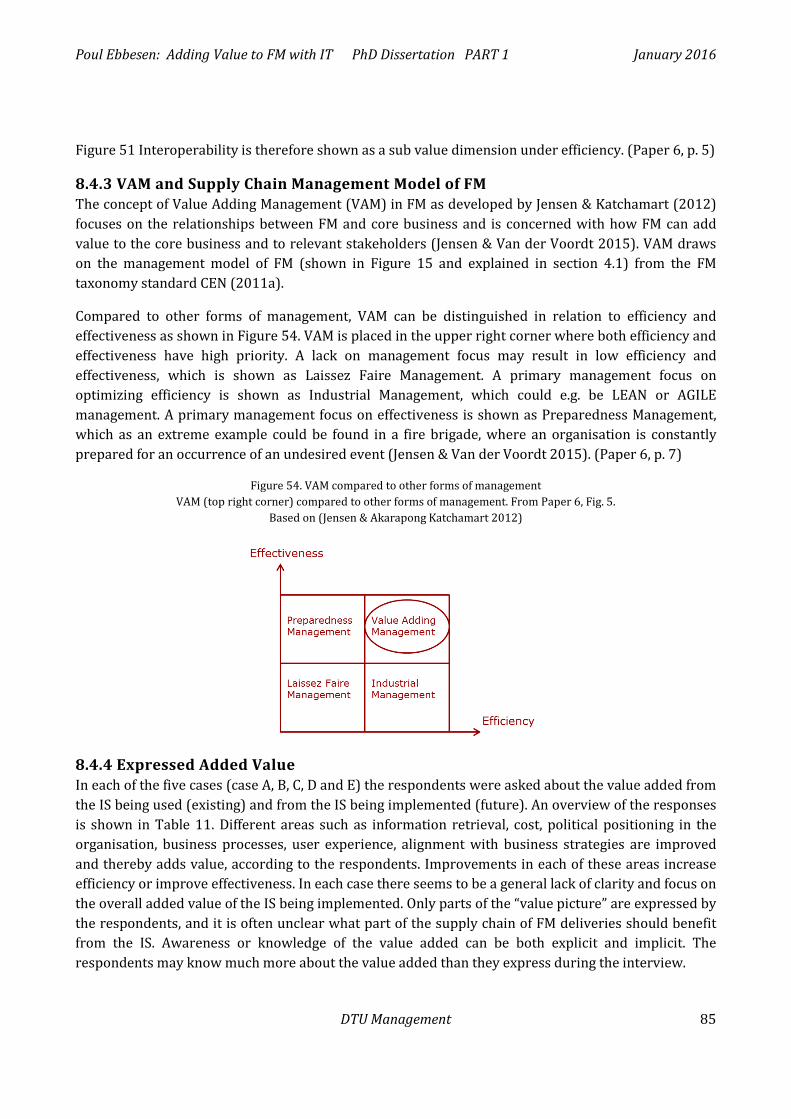
Poul Ebbesen: Adding Value to FM with IT PhD Dissertation PART 1 January 2016
DTU Management 85
Figure 51 Interoperability is therefore shown as a sub value dimension under efficiency. (Paper 6, p. 5)
8.4.3 VAM and Supply Chain Management Model of FM The concept of Value Adding Management (VAM) in FM as developed by Jensen & Katchamart (2012) focuses on the relationships between FM and core business and is concerned with how FM can add value to the core business and to relevant stakeholders (Jensen & Van der Voordt 2015). VAM draws on the management model of FM (shown in Figure 15 and explained in section 4.1) from the FM taxonomy standard CEN (2011a).
Compared to other forms of management, VAM can be distinguished in relation to efficiency and effectiveness as shown in Figure 54. VAM is placed in the upper right corner where both efficiency and effectiveness have high priority. A lack on management focus may result in low efficiency and effectiveness, which is shown as Laissez Faire Management. A primary management focus on optimizing efficiency is shown as Industrial Management, which could e.g. be LEAN or AGILE management. A primary management focus on effectiveness is shown as Preparedness Management, which as an extreme example could be found in a fire brigade, where an organisation is constantly prepared for an occurrence of an undesired event (Jensen & Van der Voordt 2015). (Paper 6, p. 7)
Figure 54. VAM compared to other forms of management VAM (top right corner) compared to other forms of management. From Paper 6, Fig. 5.
Based on (Jensen & Akarapong Katchamart 2012)
8.4.4 Expressed Added Value In each of the five cases (case A, B, C, D and E) the respondents were asked about the value added from the IS being used (existing) and from the IS being implemented (future). An overview of the responses is shown in Table 11. Different areas such as information retrieval, cost, political positioning in the organisation, business processes, user experience, alignment with business strategies are improved and thereby adds value, according to the respondents. Improvements in each of these areas increase efficiency or improve effectiveness. In each case there seems to be a general lack of clarity and focus on the overall added value of the IS being implemented. Only parts of the “value picture” are expressed by the respondents, and it is often unclear what part of the supply chain of FM deliveries should benefit from the IS. Awareness or knowledge of the value added can be both explicit and implicit. The respondents may know much more about the value added than they express during the interview.
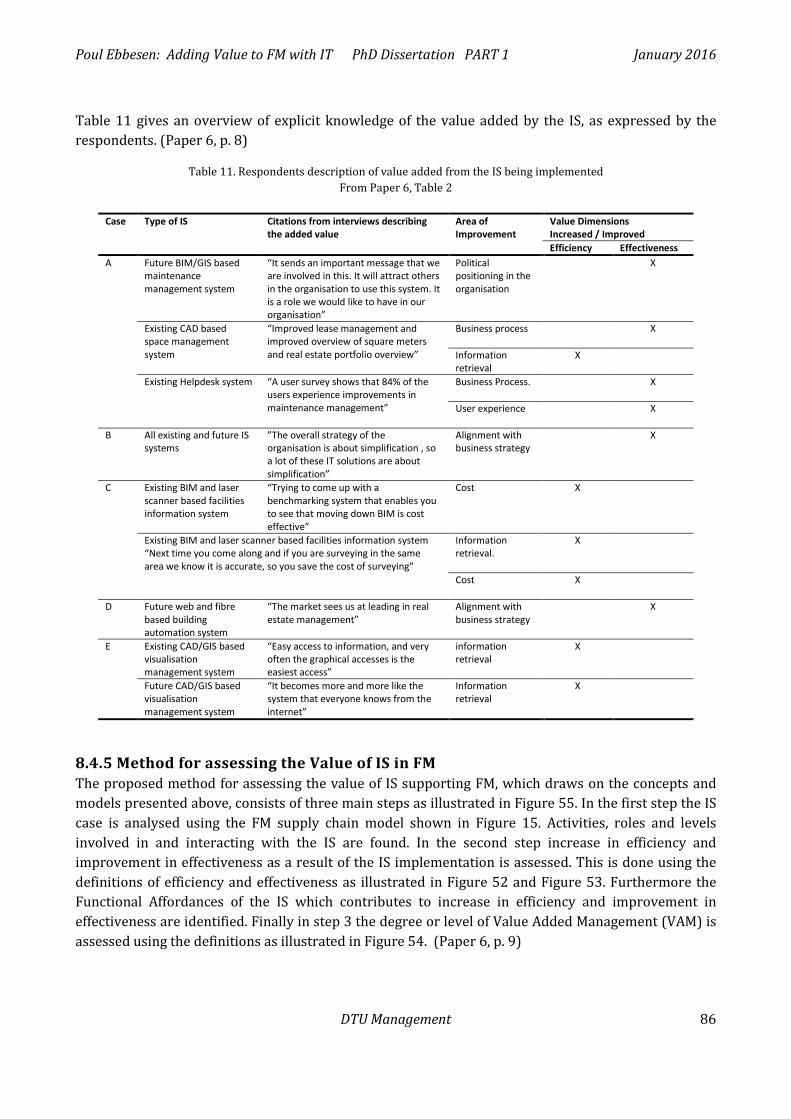
Poul Ebbesen: Adding Value to FM with IT PhD Dissertation PART 1 January 2016
DTU Management 86
Table 11 gives an overview of explicit knowledge of the value added by the IS, as expressed by the respondents. (Paper 6, p. 8)
Table 11. Respondents description of value added from the IS being implemented From Paper 6, Table 2
Case Type of IS Citations from interviews describing
the added value Area of Improvement
Value Dimensions Increased / Improved
Efficiency Effectiveness A Future BIM/GIS based
maintenance management system
“It sends an important message that we are involved in this. It will attract others in the organisation to use this system. It is a role we would like to have in our organisation”
Political positioning in the organisation
X
Existing CAD based space management system
“Improved lease management and improved overview of square meters and real estate portfolio overview”
Business process
X
Information retrieval
X
Existing Helpdesk system “A user survey shows that 84% of the users experience improvements in maintenance management”
Business Process.
X
User experience
X
B All existing and future IS systems
”The overall strategy of the organisation is about simplification , so a lot of these IT solutions are about simplification”
Alignment with business strategy
X
C Existing BIM and laser scanner based facilities information system
“Trying to come up with a benchmarking system that enables you to see that moving down BIM is cost effective”
Cost X
Existing BIM and laser scanner based facilities information system “Next time you come along and if you are surveying in the same area we know it is accurate, so you save the cost of surveying”
Information retrieval.
X
Cost
X
D Future web and fibre based building automation system
“The market sees us at leading in real estate management”
Alignment with business strategy
X
E Existing CAD/GIS based visualisation management system
“Easy access to information, and very often the graphical accesses is the easiest access”
information retrieval
X
Future CAD/GIS based visualisation management system
“It becomes more and more like the system that everyone knows from the internet”
Information retrieval
X
8.4.5 Method for assessing the Value of IS in FM The proposed method for assessing the value of IS supporting FM, which draws on the concepts and models presented above, consists of three main steps as illustrated in Figure 55. In the first step the IS case is analysed using the FM supply chain model shown in Figure 15. Activities, roles and levels involved in and interacting with the IS are found. In the second step increase in efficiency and improvement in effectiveness as a result of the IS implementation is assessed. This is done using the definitions of efficiency and effectiveness as illustrated in Figure 52 and Figure 53. Furthermore the Functional Affordances of the IS which contributes to increase in efficiency and improvement in effectiveness are identified. Finally in step 3 the degree or level of Value Added Management (VAM) is assessed using the definitions as illustrated in Figure 54. (Paper 6, p. 9)
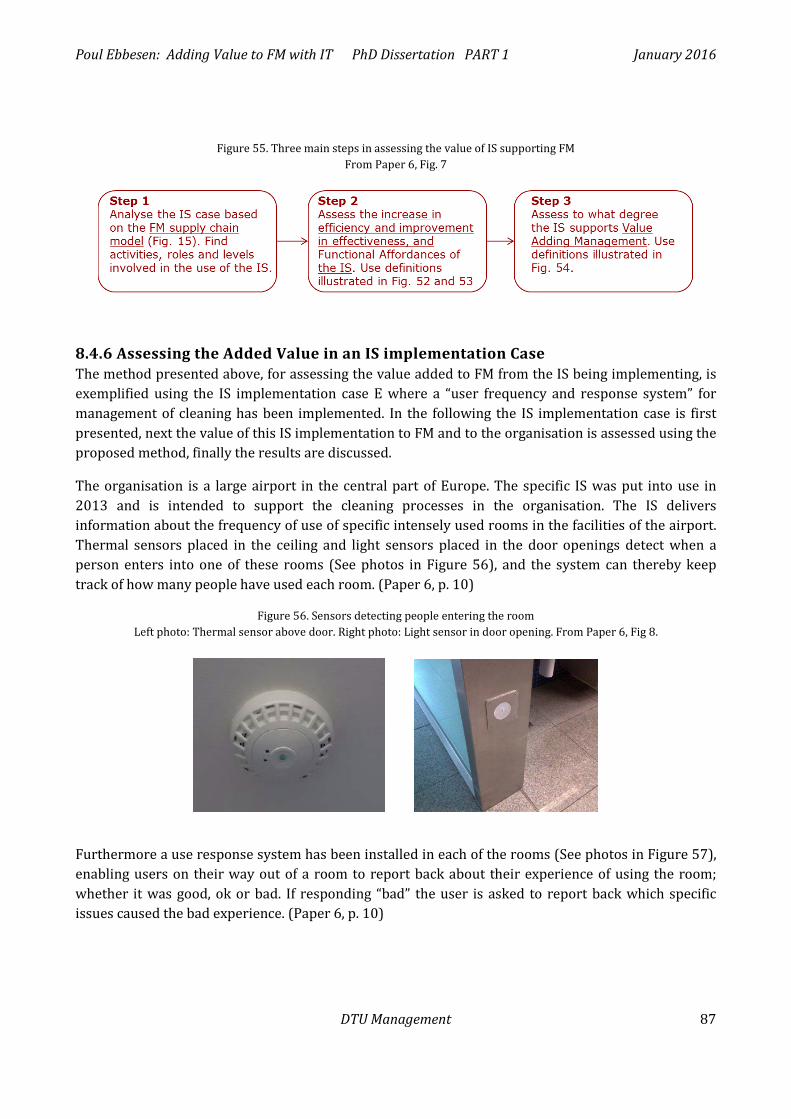
Poul Ebbesen: Adding Value to FM with IT PhD Dissertation PART 1 January 2016
DTU Management 87
Figure 55. Three main steps in assessing the value of IS supporting FM From Paper 6, Fig. 7
8.4.6 Assessing the Added Value in an IS implementation Case The method presented above, for assessing the value added to FM from the IS being implementing, is exemplified using the IS implementation case E where a “user frequency and response system” for management of cleaning has been implemented. In the following the IS implementation case is first presented, next the value of this IS implementation to FM and to the organisation is assessed using the proposed method, finally the results are discussed.
The organisation is a large airport in the central part of Europe. The specific IS was put into use in 2013 and is intended to support the cleaning processes in the organisation. The IS delivers information about the frequency of use of specific intensely used rooms in the facilities of the airport. Thermal sensors placed in the ceiling and light sensors placed in the door openings detect when a person enters into one of these rooms (See photos in Figure 56), and the system can thereby keep track of how many people have used each room. (Paper 6, p. 10)
Figure 56. Sensors detecting people entering the room Left photo: Thermal sensor above door. Right photo: Light sensor in door opening. From Paper 6, Fig 8.
Furthermore a use response system has been installed in each of the rooms (See photos in Figure 57), enabling users on their way out of a room to report back about their experience of using the room; whether it was good, ok or bad. If responding “bad” the user is asked to report back which specific issues caused the bad experience. (Paper 6, p. 10)
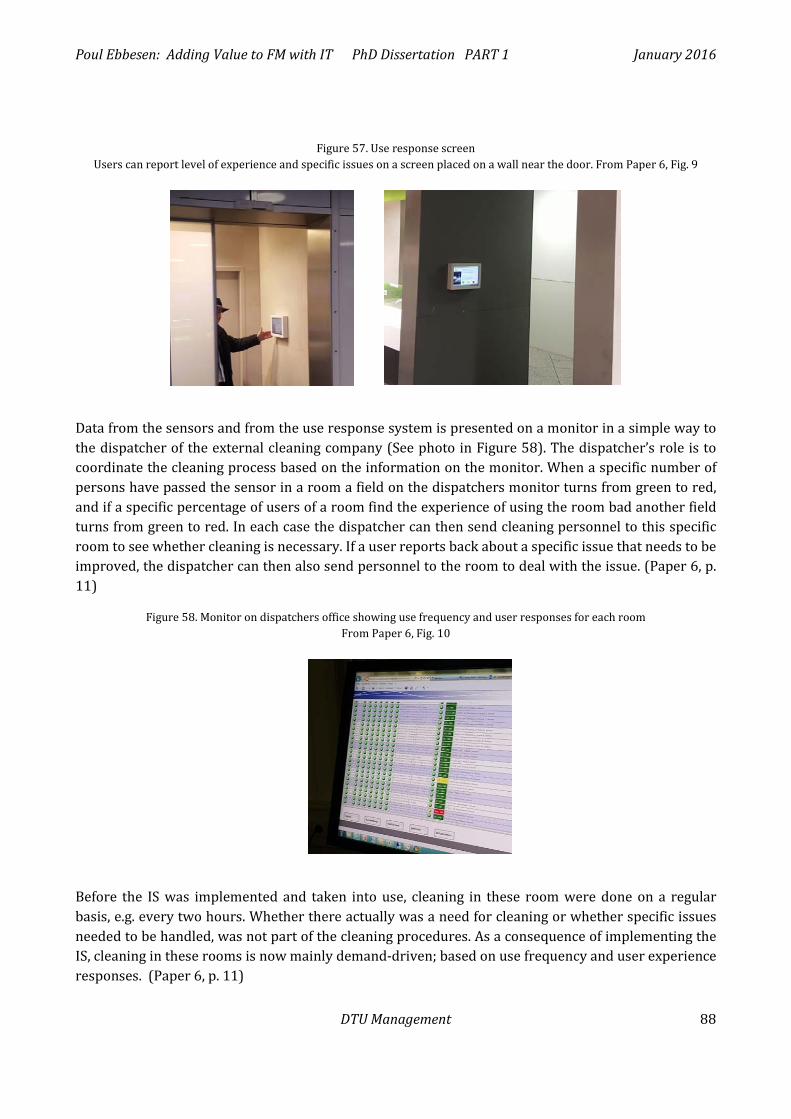
Poul Ebbesen: Adding Value to FM with IT PhD Dissertation PART 1 January 2016
DTU Management 88
Figure 57. Use response screen Users can report level of experience and specific issues on a screen placed on a wall near the door. From Paper 6, Fig. 9
Data from the sensors and from the use response system is presented on a monitor in a simple way to the dispatcher of the external cleaning company (See photo in Figure 58). The dispatcher’s role is to coordinate the cleaning process based on the information on the monitor. When a specific number of persons have passed the sensor in a room a field on the dispatchers monitor turns from green to red, and if a specific percentage of users of a room find the experience of using the room bad another field turns from green to red. In each case the dispatcher can then send cleaning personnel to this specific room to see whether cleaning is necessary. If a user reports back about a specific issue that needs to be improved, the dispatcher can then also send personnel to the room to deal with the issue. (Paper 6, p. 11)
Figure 58. Monitor on dispatchers office showing use frequency and user responses for each room From Paper 6, Fig. 10
Before the IS was implemented and taken into use, cleaning in these room were done on a regular basis, e.g. every two hours. Whether there actually was a need for cleaning or whether specific issues needed to be handled, was not part of the cleaning procedures. As a consequence of implementing the IS, cleaning in these rooms is now mainly demand-driven; based on use frequency and user experience responses. (Paper 6, p. 11)
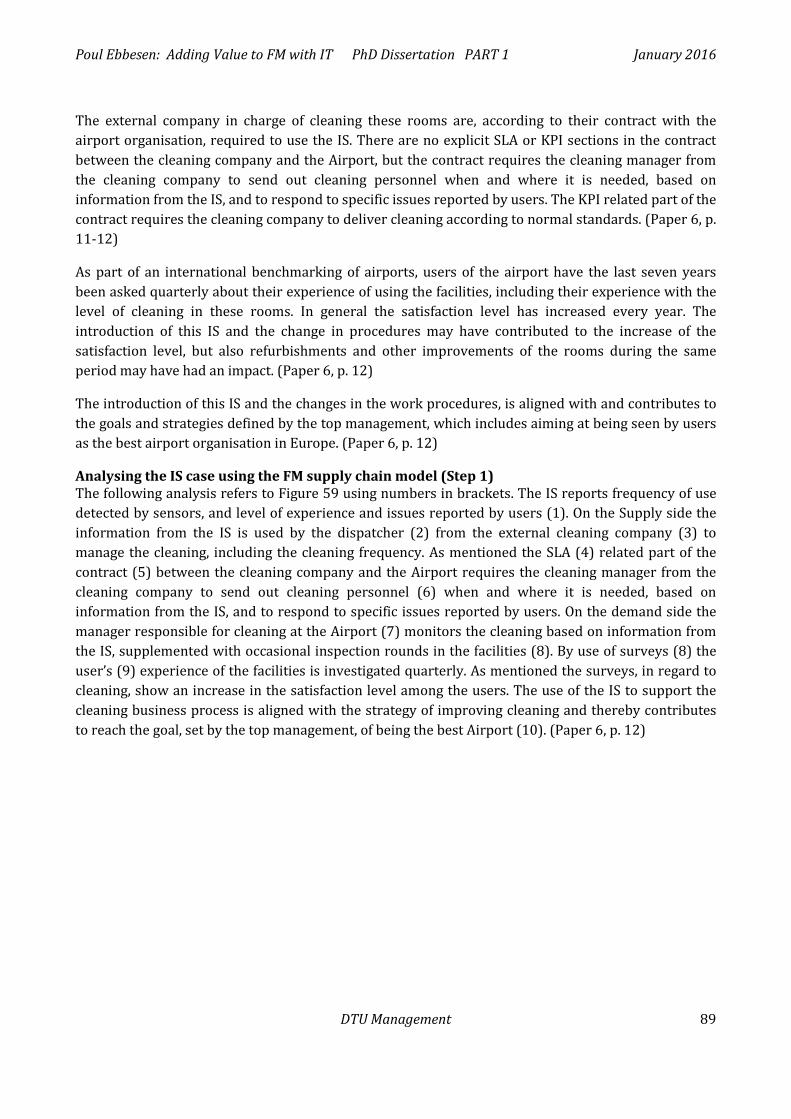
Poul Ebbesen: Adding Value to FM with IT PhD Dissertation PART 1 January 2016
DTU Management 89
The external company in charge of cleaning these rooms are, according to their contract with the airport organisation, required to use the IS. There are no explicit SLA or KPI sections in the contract between the cleaning company and the Airport, but the contract requires the cleaning manager from the cleaning company to send out cleaning personnel when and where it is needed, based on information from the IS, and to respond to specific issues reported by users. The KPI related part of the contract requires the cleaning company to deliver cleaning according to normal standards. (Paper 6, p. 11-12)
As part of an international benchmarking of airports, users of the airport have the last seven years been asked quarterly about their experience of using the facilities, including their experience with the level of cleaning in these rooms. In general the satisfaction level has increased every year. The introduction of this IS and the change in procedures may have contributed to the increase of the satisfaction level, but also refurbishments and other improvements of the rooms during the same period may have had an impact. (Paper 6, p. 12)
The introduction of this IS and the changes in the work procedures, is aligned with and contributes to the goals and strategies defined by the top management, which includes aiming at being seen by users as the best airport organisation in Europe. (Paper 6, p. 12)
Analysing the IS case using the FM supply chain model (Step 1) The following analysis refers to Figure 59 using numbers in brackets. The IS reports frequency of use detected by sensors, and level of experience and issues reported by users (1). On the Supply side the information from the IS is used by the dispatcher (2) from the external cleaning company (3) to manage the cleaning, including the cleaning frequency. As mentioned the SLA (4) related part of the contract (5) between the cleaning company and the Airport requires the cleaning manager from the cleaning company to send out cleaning personnel (6) when and where it is needed, based on information from the IS, and to respond to specific issues reported by users. On the demand side the manager responsible for cleaning at the Airport (7) monitors the cleaning based on information from the IS, supplemented with occasional inspection rounds in the facilities (8). By use of surveys (8) the user’s (9) experience of the facilities is investigated quarterly. As mentioned the surveys, in regard to cleaning, show an increase in the satisfaction level among the users. The use of the IS to support the cleaning business process is aligned with the strategy of improving cleaning and thereby contributes to reach the goal, set by the top management, of being the best Airport (10). (Paper 6, p. 12)
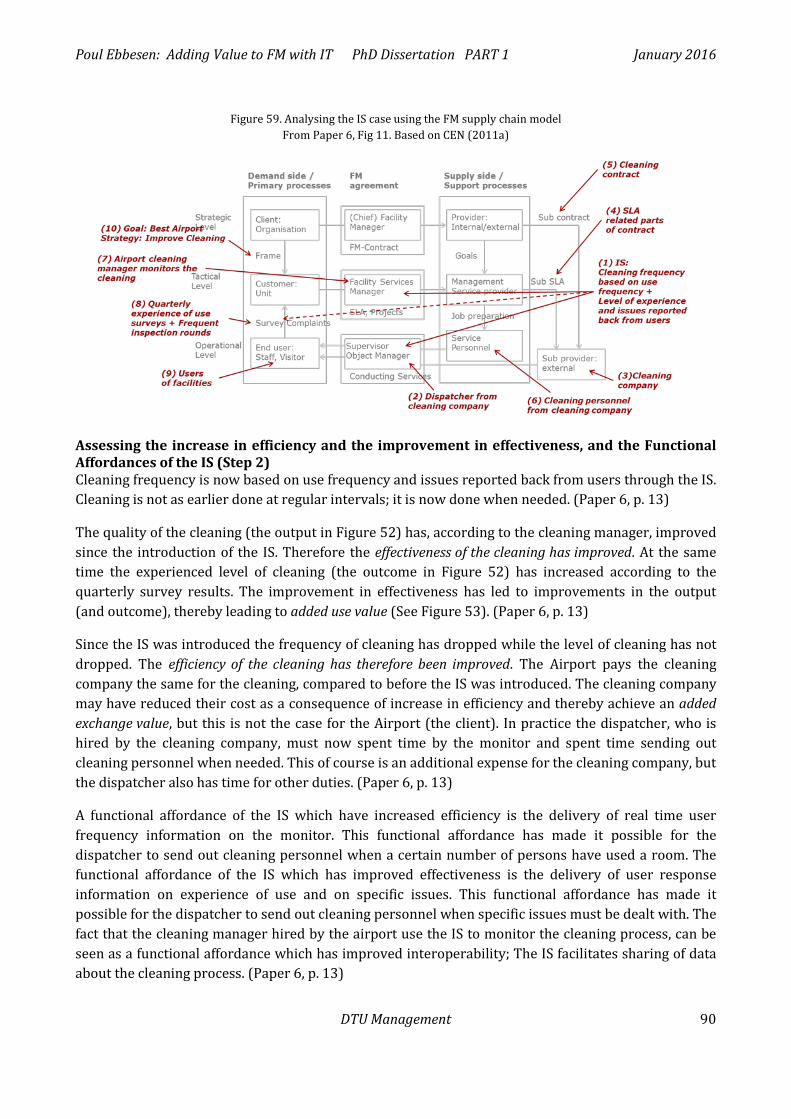
Poul Ebbesen: Adding Value to FM with IT PhD Dissertation PART 1 January 2016
DTU Management 90
Figure 59. Analysing the IS case using the FM supply chain model From Paper 6, Fig 11. Based on CEN (2011a)
Assessing the increase in efficiency and the improvement in effectiveness, and the Functional Affordances of the IS (Step 2) Cleaning frequency is now based on use frequency and issues reported back from users through the IS. Cleaning is not as earlier done at regular intervals; it is now done when needed. (Paper 6, p. 13)
The quality of the cleaning (the output in Figure 52) has, according to the cleaning manager, improved since the introduction of the IS. Therefore the effectiveness of the cleaning has improved. At the same time the experienced level of cleaning (the outcome in Figure 52) has increased according to the quarterly survey results. The improvement in effectiveness has led to improvements in the output (and outcome), thereby leading to added use value (See Figure 53). (Paper 6, p. 13)
Since the IS was introduced the frequency of cleaning has dropped while the level of cleaning has not dropped. The efficiency of the cleaning has therefore been improved. The Airport pays the cleaning company the same for the cleaning, compared to before the IS was introduced. The cleaning company may have reduced their cost as a consequence of increase in efficiency and thereby achieve an added exchange value, but this is not the case for the Airport (the client). In practice the dispatcher, who is hired by the cleaning company, must now spent time by the monitor and spent time sending out cleaning personnel when needed. This of course is an additional expense for the cleaning company, but the dispatcher also has time for other duties. (Paper 6, p. 13)
A functional affordance of the IS which have increased efficiency is the delivery of real time user frequency information on the monitor. This functional affordance has made it possible for the dispatcher to send out cleaning personnel when a certain number of persons have used a room. The functional affordance of the IS which has improved effectiveness is the delivery of user response information on experience of use and on specific issues. This functional affordance has made it possible for the dispatcher to send out cleaning personnel when specific issues must be dealt with. The fact that the cleaning manager hired by the airport use the IS to monitor the cleaning process, can be seen as a functional affordance which has improved interoperability; The IS facilitates sharing of data about the cleaning process. (Paper 6, p. 13)
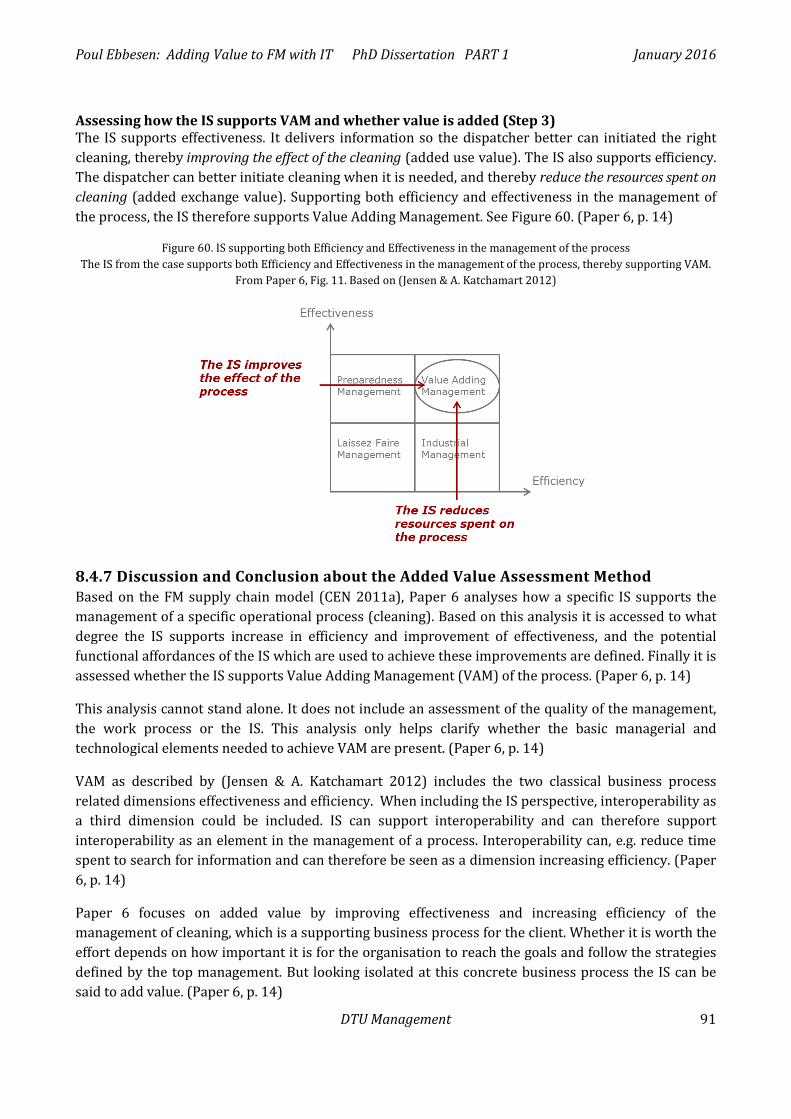
Poul Ebbesen: Adding Value to FM with IT PhD Dissertation PART 1 January 2016
DTU Management 91
Assessing how the IS supports VAM and whether value is added (Step 3) The IS supports effectiveness. It delivers information so the dispatcher better can initiated the right cleaning, thereby improving the effect of the cleaning (added use value). The IS also supports efficiency. The dispatcher can better initiate cleaning when it is needed, and thereby reduce the resources spent on cleaning (added exchange value). Supporting both efficiency and effectiveness in the management of the process, the IS therefore supports Value Adding Management. See Figure 60. (Paper 6, p. 14)
Figure 60. IS supporting both Efficiency and Effectiveness in the management of the process The IS from the case supports both Efficiency and Effectiveness in the management of the process, thereby supporting VAM.
From Paper 6, Fig. 11. Based on (Jensen & A. Katchamart 2012)
8.4.7 Discussion and Conclusion about the Added Value Assessment Method Based on the FM supply chain model (CEN 2011a), Paper 6 analyses how a specific IS supports the management of a specific operational process (cleaning). Based on this analysis it is accessed to what degree the IS supports increase in efficiency and improvement of effectiveness, and the potential functional affordances of the IS which are used to achieve these improvements are defined. Finally it is assessed whether the IS supports Value Adding Management (VAM) of the process. (Paper 6, p. 14)
This analysis cannot stand alone. It does not include an assessment of the quality of the management, the work process or the IS. This analysis only helps clarify whether the basic managerial and technological elements needed to achieve VAM are present. (Paper 6, p. 14)
VAM as described by (Jensen & A. Katchamart 2012) includes the two classical business process related dimensions effectiveness and efficiency. When including the IS perspective, interoperability as a third dimension could be included. IS can support interoperability and can therefore support interoperability as an element in the management of a process. Interoperability can, e.g. reduce time spent to search for information and can therefore be seen as a dimension increasing efficiency. (Paper 6, p. 14)
Paper 6 focuses on added value by improving effectiveness and increasing efficiency of the management of cleaning, which is a supporting business process for the client. Whether it is worth the effort depends on how important it is for the organisation to reach the goals and follow the strategies defined by the top management. But looking isolated at this concrete business process the IS can be said to add value. (Paper 6, p. 14)
Poul Ebbesen: Adding Value to FM with IT PhD Dissertation PART 1 January 2016
DTU Management 92
Even though the added value in the example case was vaguely expressed by the respondents, the IS apparently adds value when assessed using the proposed method. (Paper 6, p. 14)
Because of the way the cleaning process is organised the potential of the functional affordances of the IS can be exploited. The IS contributes to added value because the dispatcher actually use the information offered by the IS, and because the cleaning work process is organised so that this information can be used. The functional affordances of the IS where seen as useful in this specific context in the strive for VAM. (Paper 6, p. 14)
Paper 6 illustrates that a well organised management setup is required to gain value from IS. It is also illustrated that implementing IS includes both organisational and technological changes. (Paper 6, p. 14)
The use of the IS as described definitely adds value to the secondary process cleaning. Because of the increase of the user experience of the cleaning level, which is aligned with the strategy of improving cleaning in order to become the best airport, the use of the IS also adds value to a primary process of the organisation. (Paper 6, p. 14)
8.5 IS IMPLEMENTATION PROCESS STRATEGY (PAPER 7 IS STRATEGY) Paper 7 (Ebbesen et al. 2016) of this dissertation deals with an aspect related to changes taking place during IS implementation and use. Paper 7 focuses on IS strategy viewed as the use of IS to support business strategy. It is generally recognised that IS implementation and use should support the business strategy of an organisation. To gain more insight into this issue in the FM domain, Paper 7 presents an analysis of how business strategy is supported by IS implementation and use in the five cases A-E. The presentation below, of the content of Paper 7, is mainly based on text from the paper.
8.5.1 Strategy and IS Strategy There is no fixed definition of strategy. Strategy in warfare is “the science or art of employing all the military, economic, political, and other resources of a country to achieve the objects of war” (Cohen 2016). General strategy is about how objectives are achieved. Paper 7 treats strategy as a change process which can be observed over time. The process includes incremental changes, and more radical changes such as changes taking place during IS projects. (Paper 7, p. 3) Paper 7 applies the business centric view of IS strategy as the use of IS to support business strategy as described in Chen et al. (2010). In the literature other views of IS strategy can be found, e.g. a view of IS strategy being the master plan of the IS and a view of IS strategy being the shared view of the IS role within the organisation (Chen et al. 2010). These two alternative views on IS strategy are not applied in Paper 7. (Paper 7, p. 3) A realized strategy can be based both on a deliberate strategy and on emergent strategy. Emergent strategy indicates that the strategy has emerged over time. Deliberate strategy can be based on intended strategy, e.g. a strategy defined by top management. Intended strategy can become unrealized strategy or deliberate strategy (Mintzberg 1987). In Paper 7 the realized IS strategy is studied. (Paper 7, p. 3)
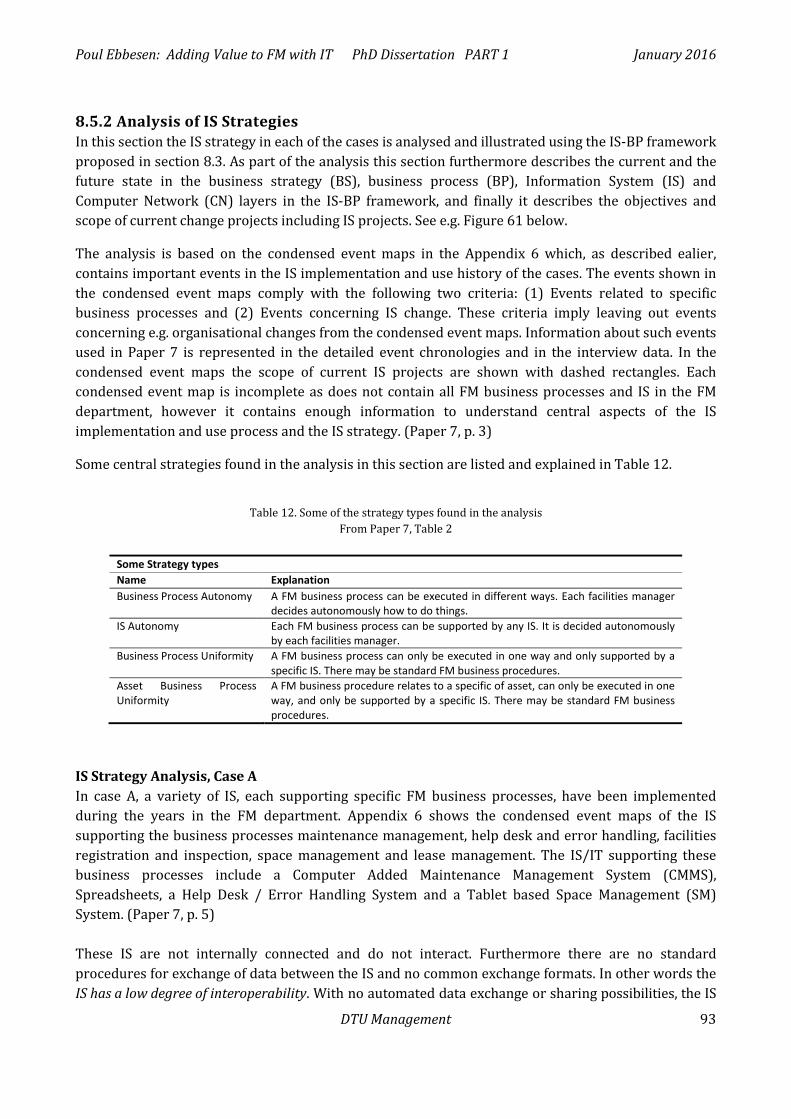
Poul Ebbesen: Adding Value to FM with IT PhD Dissertation PART 1 January 2016
DTU Management 93
8.5.2 Analysis of IS Strategies In this section the IS strategy in each of the cases is analysed and illustrated using the IS-BP framework proposed in section 8.3. As part of the analysis this section furthermore describes the current and the future state in the business strategy (BS), business process (BP), Information System (IS) and Computer Network (CN) layers in the IS-BP framework, and finally it describes the objectives and scope of current change projects including IS projects. See e.g. Figure 61 below.
The analysis is based on the condensed event maps in the Appendix 6 which, as described ealier, contains important events in the IS implementation and use history of the cases. The events shown in the condensed event maps comply with the following two criteria: (1) Events related to specific business processes and (2) Events concerning IS change. These criteria imply leaving out events concerning e.g. organisational changes from the condensed event maps. Information about such events used in Paper 7 is represented in the detailed event chronologies and in the interview data. In the condensed event maps the scope of current IS projects are shown with dashed rectangles. Each condensed event map is incomplete as does not contain all FM business processes and IS in the FM department, however it contains enough information to understand central aspects of the IS implementation and use process and the IS strategy. (Paper 7, p. 3)
Some central strategies found in the analysis in this section are listed and explained in Table 12.
Table 12. Some of the strategy types found in the analysis
From Paper 7, Table 2
Some Strategy types Name Explanation Business Process Autonomy A FM business process can be executed in different ways. Each facilities manager
decides autonomously how to do things. IS Autonomy Each FM business process can be supported by any IS. It is decided autonomously
by each facilities manager. Business Process Uniformity A FM business process can only be executed in one way and only supported by a
specific IS. There may be standard FM business procedures. Asset Business Process Uniformity
A FM business procedure relates to a specific of asset, can only be executed in one way, and only be supported by a specific IS. There may be standard FM business procedures.
IS Strategy Analysis, Case A In case A, a variety of IS, each supporting specific FM business processes, have been implemented during the years in the FM department. Appendix 6 shows the condensed event maps of the IS supporting the business processes maintenance management, help desk and error handling, facilities registration and inspection, space management and lease management. The IS/IT supporting these business processes include a Computer Added Maintenance Management System (CMMS), Spreadsheets, a Help Desk / Error Handling System and a Tablet based Space Management (SM) System. (Paper 7, p. 5) These IS are not internally connected and do not interact. Furthermore there are no standard procedures for exchange of data between the IS and no common exchange formats. In other words the IS has a low degree of interoperability. With no automated data exchange or sharing possibilities, the IS
Poul Ebbesen: Adding Value to FM with IT PhD Dissertation PART 1 January 2016
DTU Management 94
now contain redundant and inaccurate data about the facilities. This is seen as a major challenge in the execution of the different business processes. (Paper 7, p. 5) Over the years the facilities managers responsible for the FM business processes have been allowed to implement different IS to support specific FM business process. The facilities managers have not been required to choose solutions complying with overall organisational requirements. So far this “IS autonomy” has been a more or less deliberate strategy which was found as implicit information in the empirical data of this study, e.g. by analysing the condensed event process map. This aspect was not directly addressed by the interview respondents and is not included in an overall well defined IS strategy of the organisation. (Paper 7, p. 5) For each FM business process differences in work procedures have developed over the years. Whether the use of different IS for the same business process, e.g. the use of both spreadsheets and a SM system in the execution of the business processes facilities registration and inspection, have had an influence on this is unclear, but it is seen as a problem by the management of the FM department. In short this business process issue can be defined as a lack of standard business procedures. (Paper 7, p. 5) In all the execution of FM business processes had an autonomous character and “business process autonomy” had become the norm within the FM organisation. It was then decided to change this so that business processes in the future would be executed in a uniform manner, which implies that facilities managers in the future will be forced to follow standard business procedures. As a tool to change to “business process uniformity” it was decided to replace the different IS, hitherto supporting the FM business processes maintenance management, help desk and error handling, facilities registration and inspection, space management and lease management with a new Integrated Workplace Management System (IWMS). The IS project set up to handle this only included the IS change, and the objective of the IS project was to reduce the number of IS used within the organisation. It is expected that implementing the new IS will lead to a high degree of interoperability because all processes will be supported by only one system. (Paper 7, p. 5) When the IS has been implemented the facilities managers, no matter which business processes they are responsible for, will be instructed to use the new common IS (the IWMS) and thereby work in a uniform way. This part of the process of implementing business process uniformity is expected to happen more or less by itself and is not part of the IS project. (Paper 7, p. 6) The change process in case A is illustrated below in Figure 61. The figure is based on the IS-BP proposed in section 8.3 and it illustrates how the change to a new common IS supports the implementation of business process uniformity. (Paper 7, p. 6)
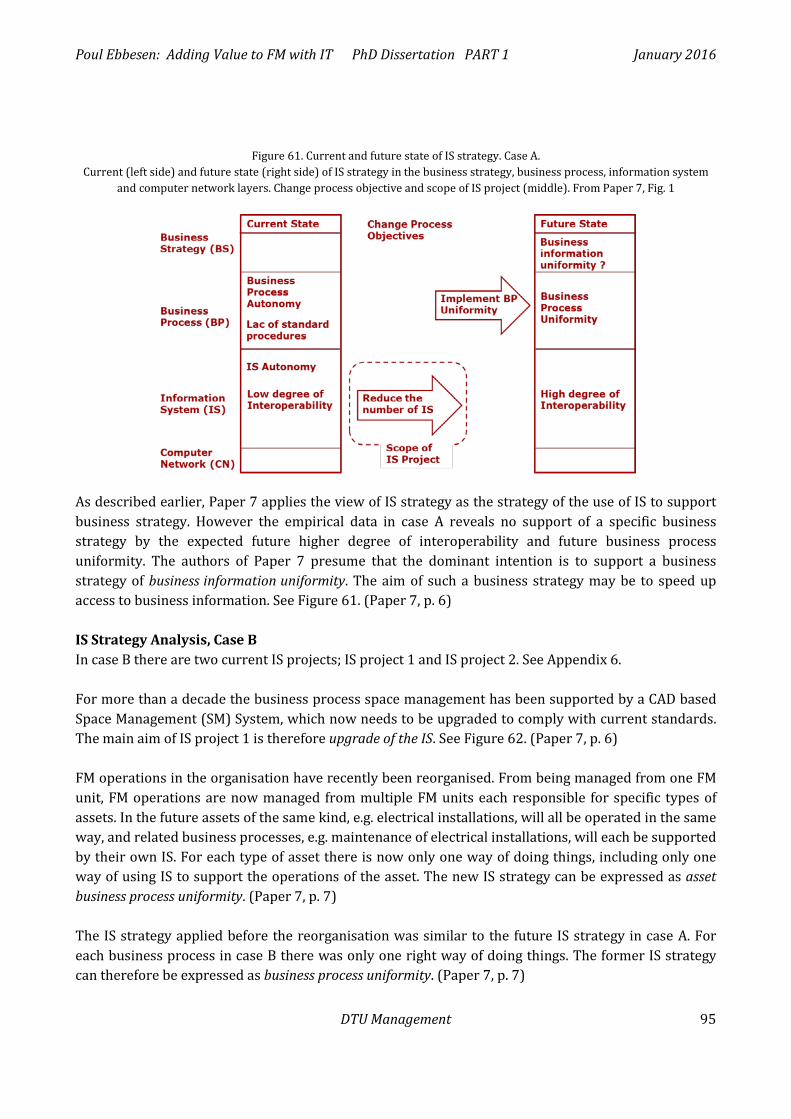
Poul Ebbesen: Adding Value to FM with IT PhD Dissertation PART 1 January 2016
DTU Management 95
Figure 61. Current and future state of IS strategy. Case A. Current (left side) and future state (right side) of IS strategy in the business strategy, business process, information system
and computer network layers. Change process objective and scope of IS project (middle). From Paper 7, Fig. 1
As described earlier, Paper 7 applies the view of IS strategy as the strategy of the use of IS to support business strategy. However the empirical data in case A reveals no support of a specific business strategy by the expected future higher degree of interoperability and future business process uniformity. The authors of Paper 7 presume that the dominant intention is to support a business strategy of business information uniformity. The aim of such a business strategy may be to speed up access to business information. See Figure 61. (Paper 7, p. 6) IS Strategy Analysis, Case B In case B there are two current IS projects; IS project 1 and IS project 2. See Appendix 6. For more than a decade the business process space management has been supported by a CAD based Space Management (SM) System, which now needs to be upgraded to comply with current standards. The main aim of IS project 1 is therefore upgrade of the IS. See Figure 62. (Paper 7, p. 6) FM operations in the organisation have recently been reorganised. From being managed from one FM unit, FM operations are now managed from multiple FM units each responsible for specific types of assets. In the future assets of the same kind, e.g. electrical installations, will all be operated in the same way, and related business processes, e.g. maintenance of electrical installations, will each be supported by their own IS. For each type of asset there is now only one way of doing things, including only one way of using IS to support the operations of the asset. The new IS strategy can be expressed as asset business process uniformity. (Paper 7, p. 7) The IS strategy applied before the reorganisation was similar to the future IS strategy in case A. For each business process in case B there was only one right way of doing things. The former IS strategy can therefore be expressed as business process uniformity. (Paper 7, p. 7)
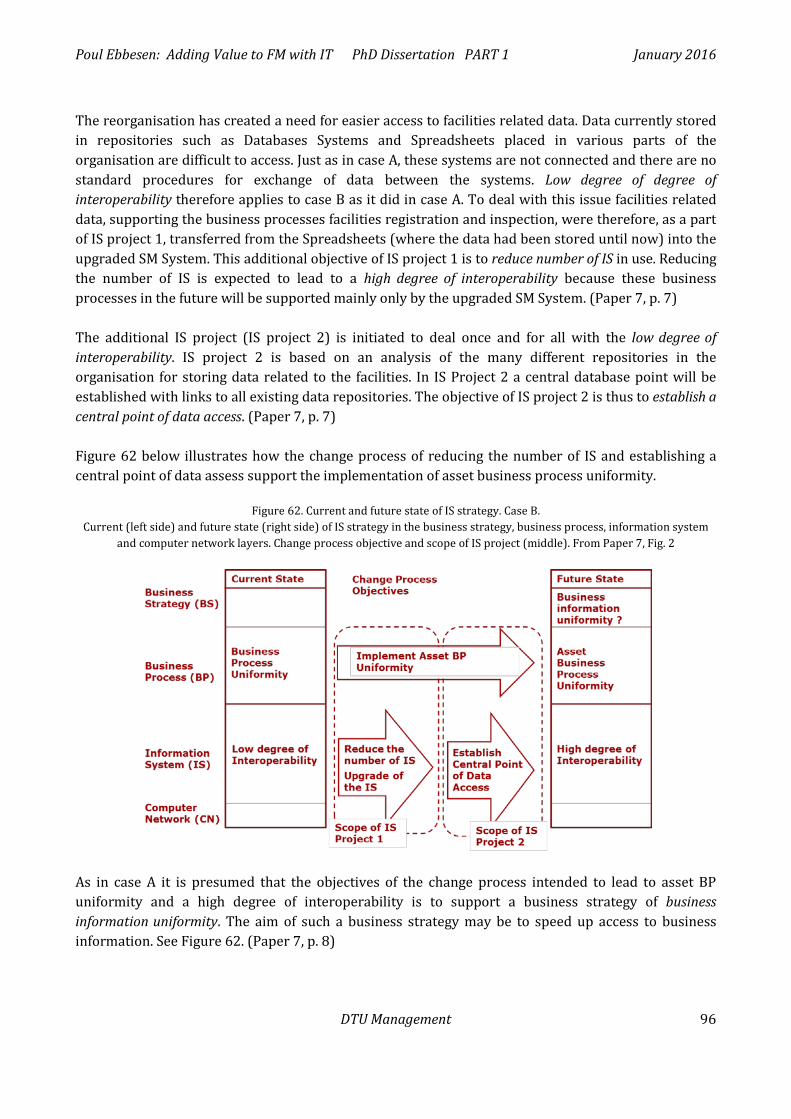
Poul Ebbesen: Adding Value to FM with IT PhD Dissertation PART 1 January 2016
DTU Management 96
The reorganisation has created a need for easier access to facilities related data. Data currently stored in repositories such as Databases Systems and Spreadsheets placed in various parts of the organisation are difficult to access. Just as in case A, these systems are not connected and there are no standard procedures for exchange of data between the systems. Low degree of degree of interoperability therefore applies to case B as it did in case A. To deal with this issue facilities related data, supporting the business processes facilities registration and inspection, were therefore, as a part of IS project 1, transferred from the Spreadsheets (where the data had been stored until now) into the upgraded SM System. This additional objective of IS project 1 is to reduce number of IS in use. Reducing the number of IS is expected to lead to a high degree of interoperability because these business processes in the future will be supported mainly only by the upgraded SM System. (Paper 7, p. 7) The additional IS project (IS project 2) is initiated to deal once and for all with the low degree of interoperability. IS project 2 is based on an analysis of the many different repositories in the organisation for storing data related to the facilities. In IS Project 2 a central database point will be established with links to all existing data repositories. The objective of IS project 2 is thus to establish a central point of data access. (Paper 7, p. 7) Figure 62 below illustrates how the change process of reducing the number of IS and establishing a central point of data assess support the implementation of asset business process uniformity.
Figure 62. Current and future state of IS strategy. Case B. Current (left side) and future state (right side) of IS strategy in the business strategy, business process, information system
and computer network layers. Change process objective and scope of IS project (middle). From Paper 7, Fig. 2
As in case A it is presumed that the objectives of the change process intended to lead to asset BP uniformity and a high degree of interoperability is to support a business strategy of business information uniformity. The aim of such a business strategy may be to speed up access to business information. See Figure 62. (Paper 7, p. 8)
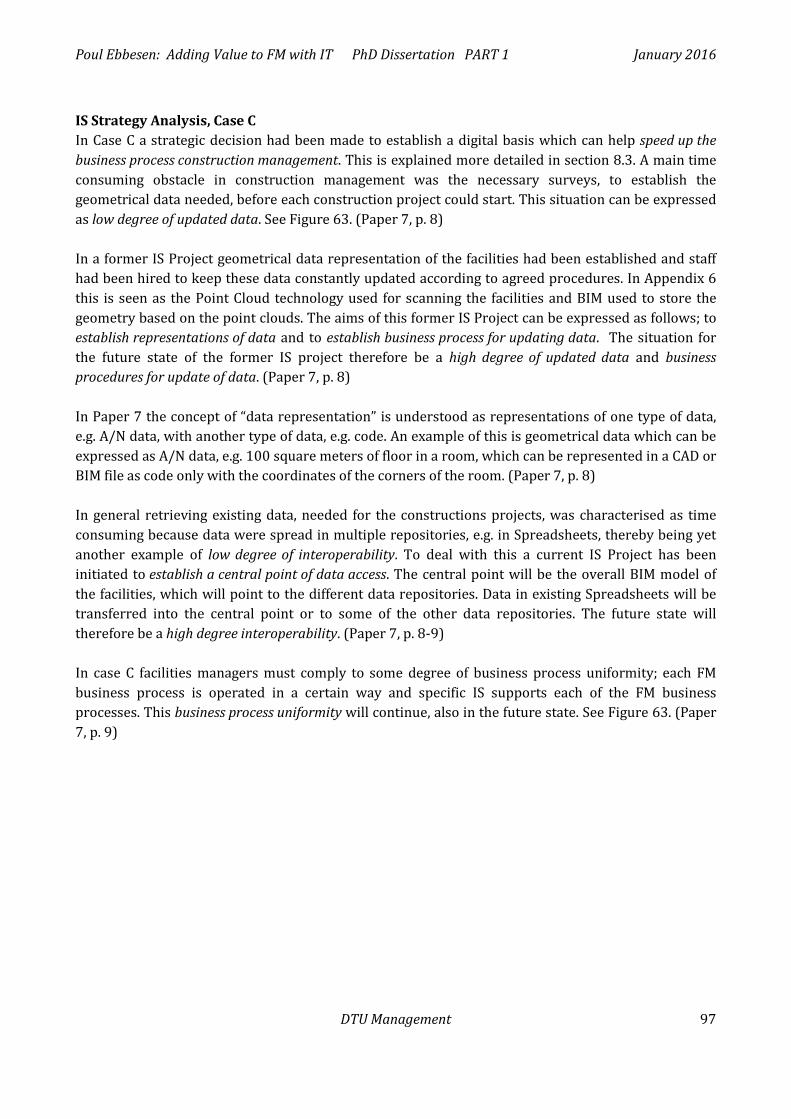
Poul Ebbesen: Adding Value to FM with IT PhD Dissertation PART 1 January 2016
DTU Management 97
IS Strategy Analysis, Case C In Case C a strategic decision had been made to establish a digital basis which can help speed up the business process construction management. This is explained more detailed in section 8.3. A main time consuming obstacle in construction management was the necessary surveys, to establish the geometrical data needed, before each construction project could start. This situation can be expressed as low degree of updated data. See Figure 63. (Paper 7, p. 8) In a former IS Project geometrical data representation of the facilities had been established and staff had been hired to keep these data constantly updated according to agreed procedures. In Appendix 6 this is seen as the Point Cloud technology used for scanning the facilities and BIM used to store the geometry based on the point clouds. The aims of this former IS Project can be expressed as follows; to establish representations of data and to establish business process for updating data. The situation for the future state of the former IS project therefore be a high degree of updated data and business procedures for update of data. (Paper 7, p. 8) In Paper 7 the concept of “data representation” is understood as representations of one type of data, e.g. A/N data, with another type of data, e.g. code. An example of this is geometrical data which can be expressed as A/N data, e.g. 100 square meters of floor in a room, which can be represented in a CAD or BIM file as code only with the coordinates of the corners of the room. (Paper 7, p. 8) In general retrieving existing data, needed for the constructions projects, was characterised as time consuming because data were spread in multiple repositories, e.g. in Spreadsheets, thereby being yet another example of low degree of interoperability. To deal with this a current IS Project has been initiated to establish a central point of data access. The central point will be the overall BIM model of the facilities, which will point to the different data repositories. Data in existing Spreadsheets will be transferred into the central point or to some of the other data repositories. The future state will therefore be a high degree interoperability. (Paper 7, p. 8-9) In case C facilities managers must comply to some degree of business process uniformity; each FM business process is operated in a certain way and specific IS supports each of the FM business processes. This business process uniformity will continue, also in the future state. See Figure 63. (Paper 7, p. 9)
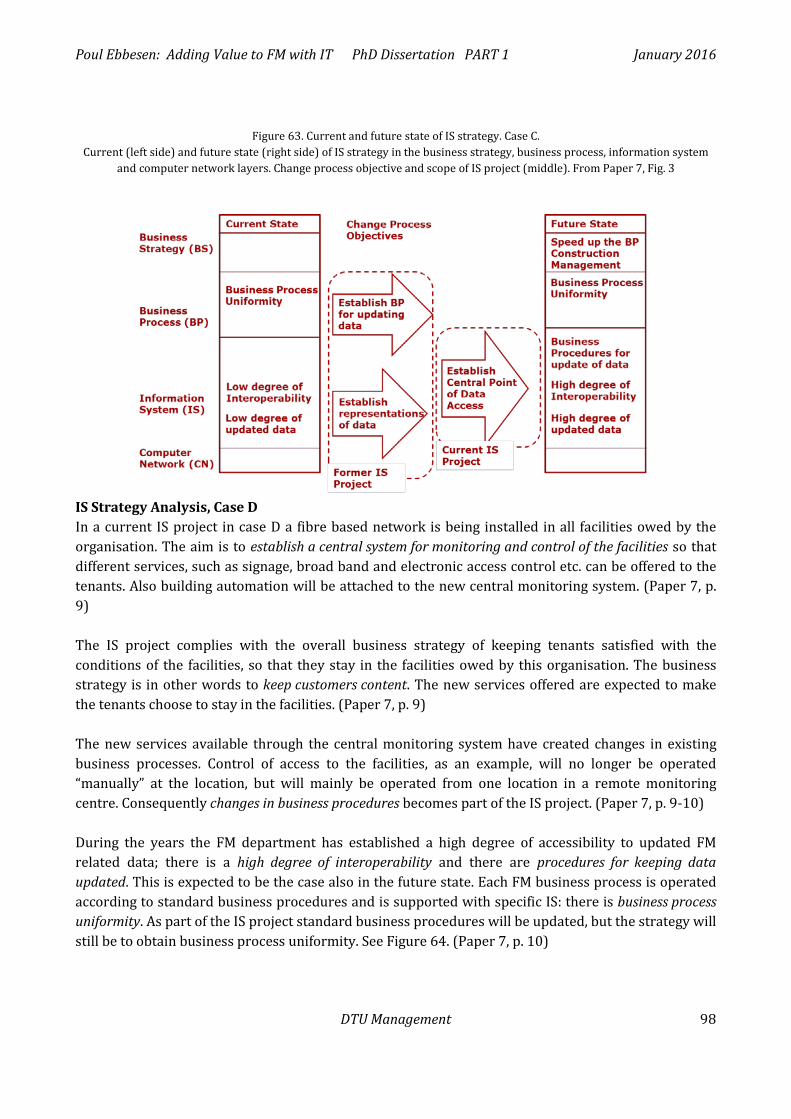
Poul Ebbesen: Adding Value to FM with IT PhD Dissertation PART 1 January 2016
DTU Management 98
Figure 63. Current and future state of IS strategy. Case C.
Current (left side) and future state (right side) of IS strategy in the business strategy, business process, information system and computer network layers. Change process objective and scope of IS project (middle). From Paper 7, Fig. 3
IS Strategy Analysis, Case D In a current IS project in case D a fibre based network is being installed in all facilities owed by the organisation. The aim is to establish a central system for monitoring and control of the facilities so that different services, such as signage, broad band and electronic access control etc. can be offered to the tenants. Also building automation will be attached to the new central monitoring system. (Paper 7, p. 9) The IS project complies with the overall business strategy of keeping tenants satisfied with the conditions of the facilities, so that they stay in the facilities owed by this organisation. The business strategy is in other words to keep customers content. The new services offered are expected to make the tenants choose to stay in the facilities. (Paper 7, p. 9) The new services available through the central monitoring system have created changes in existing business processes. Control of access to the facilities, as an example, will no longer be operated “manually” at the location, but will mainly be operated from one location in a remote monitoring centre. Consequently changes in business procedures becomes part of the IS project. (Paper 7, p. 9-10) During the years the FM department has established a high degree of accessibility to updated FM related data; there is a high degree of interoperability and there are procedures for keeping data updated. This is expected to be the case also in the future state. Each FM business process is operated according to standard business procedures and is supported with specific IS: there is business process uniformity. As part of the IS project standard business procedures will be updated, but the strategy will still be to obtain business process uniformity. See Figure 64. (Paper 7, p. 10)
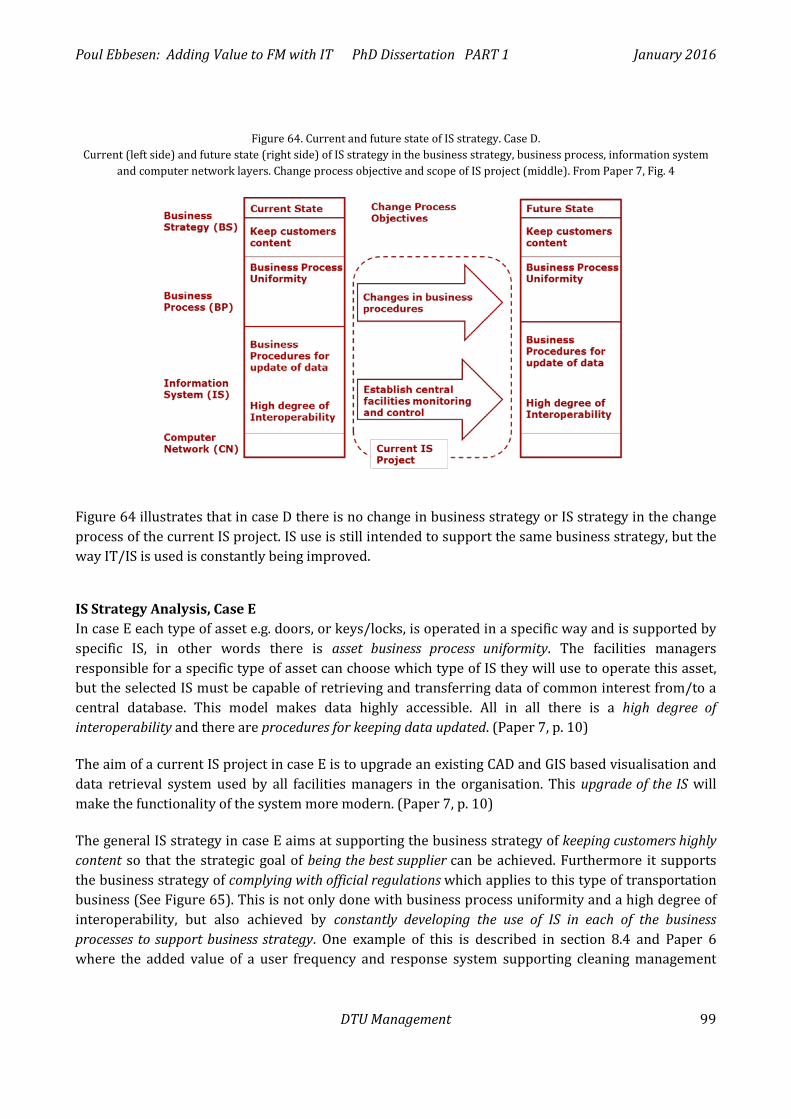
Poul Ebbesen: Adding Value to FM with IT PhD Dissertation PART 1 January 2016
DTU Management 99
Figure 64. Current and future state of IS strategy. Case D.
Current (left side) and future state (right side) of IS strategy in the business strategy, business process, information system and computer network layers. Change process objective and scope of IS project (middle). From Paper 7, Fig. 4
Figure 64 illustrates that in case D there is no change in business strategy or IS strategy in the change process of the current IS project. IS use is still intended to support the same business strategy, but the way IT/IS is used is constantly being improved.
IS Strategy Analysis, Case E In case E each type of asset e.g. doors, or keys/locks, is operated in a specific way and is supported by specific IS, in other words there is asset business process uniformity. The facilities managers responsible for a specific type of asset can choose which type of IS they will use to operate this asset, but the selected IS must be capable of retrieving and transferring data of common interest from/to a central database. This model makes data highly accessible. All in all there is a high degree of interoperability and there are procedures for keeping data updated. (Paper 7, p. 10) The aim of a current IS project in case E is to upgrade an existing CAD and GIS based visualisation and data retrieval system used by all facilities managers in the organisation. This upgrade of the IS will make the functionality of the system more modern. (Paper 7, p. 10) The general IS strategy in case E aims at supporting the business strategy of keeping customers highly content so that the strategic goal of being the best supplier can be achieved. Furthermore it supports the business strategy of complying with official regulations which applies to this type of transportation business (See Figure 65). This is not only done with business process uniformity and a high degree of interoperability, but also achieved by constantly developing the use of IS in each of the business processes to support business strategy. One example of this is described in section 8.4 and Paper 6 where the added value of a user frequency and response system supporting cleaning management
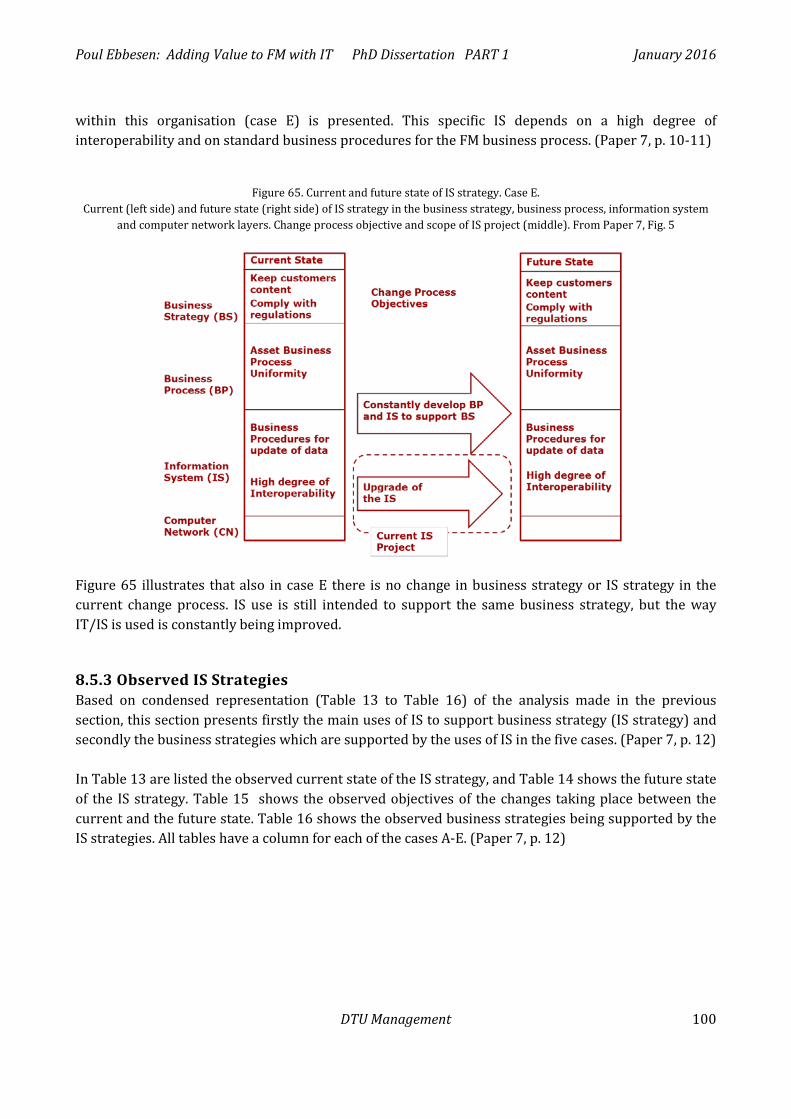
Poul Ebbesen: Adding Value to FM with IT PhD Dissertation PART 1 January 2016
DTU Management 100
within this organisation (case E) is presented. This specific IS depends on a high degree of interoperability and on standard business procedures for the FM business process. (Paper 7, p. 10-11)
Figure 65. Current and future state of IS strategy. Case E. Current (left side) and future state (right side) of IS strategy in the business strategy, business process, information system
and computer network layers. Change process objective and scope of IS project (middle). From Paper 7, Fig. 5
Figure 65 illustrates that also in case E there is no change in business strategy or IS strategy in the current change process. IS use is still intended to support the same business strategy, but the way IT/IS is used is constantly being improved.
8.5.3 Observed IS Strategies Based on condensed representation (Table 13 to Table 16) of the analysis made in the previous section, this section presents firstly the main uses of IS to support business strategy (IS strategy) and secondly the business strategies which are supported by the uses of IS in the five cases. (Paper 7, p. 12) In Table 13 are listed the observed current state of the IS strategy, and Table 14 shows the future state of the IS strategy. Table 15 shows the observed objectives of the changes taking place between the current and the future state. Table 16 shows the observed business strategies being supported by the IS strategies. All tables have a column for each of the cases A-E. (Paper 7, p. 12)
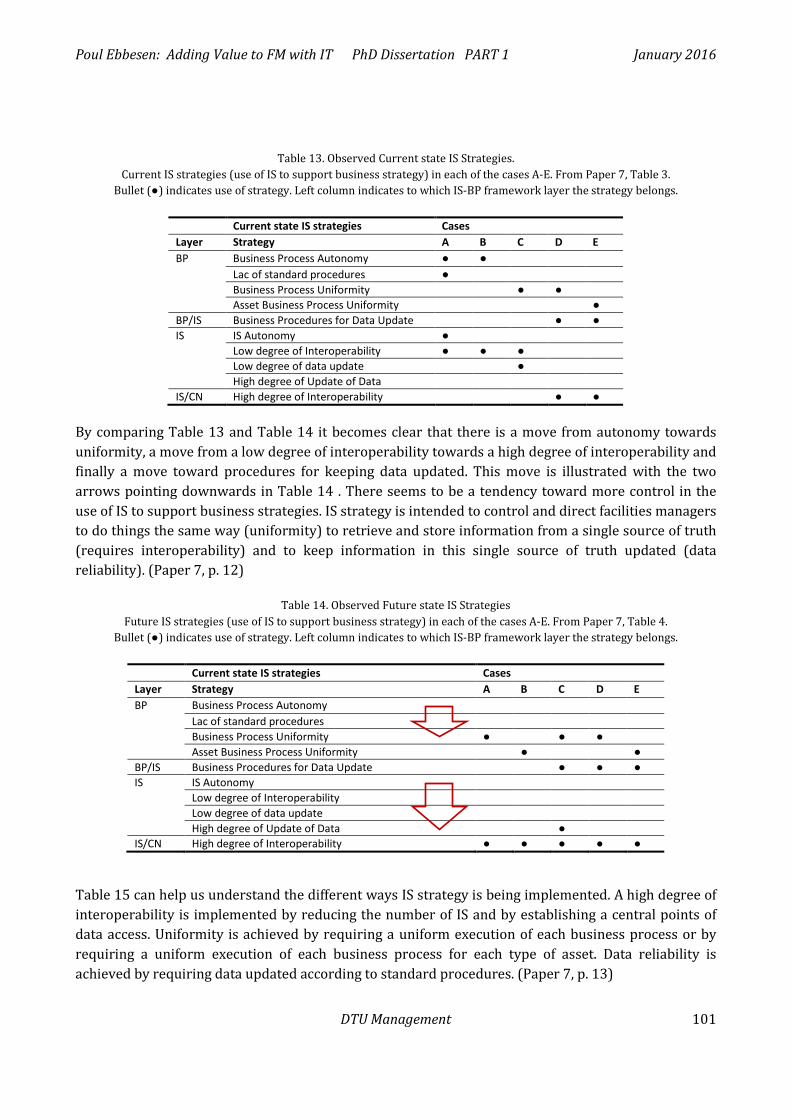
Poul Ebbesen: Adding Value to FM with IT PhD Dissertation PART 1 January 2016
DTU Management 101
Table 13. Observed Current state IS Strategies. Current IS strategies (use of IS to support business strategy) in each of the cases A-E. From Paper 7, Table 3.
Bullet (●) indicates use of strategy. Left column indicates to which IS-BP framework layer the strategy belongs.
Current state IS strategies Cases Layer Strategy A B C D E BP Business Process Autonomy ● ●
Lac of standard procedures ● Business Process Uniformity ● ● Asset Business Process Uniformity ●
BP/IS Business Procedures for Data Update ● ● IS IS Autonomy ●
Low degree of Interoperability ● ● ● Low degree of data update ● High degree of Update of Data
IS/CN High degree of Interoperability ● ●
By comparing Table 13 and Table 14 it becomes clear that there is a move from autonomy towards uniformity, a move from a low degree of interoperability towards a high degree of interoperability and finally a move toward procedures for keeping data updated. This move is illustrated with the two arrows pointing downwards in Table 14 . There seems to be a tendency toward more control in the use of IS to support business strategies. IS strategy is intended to control and direct facilities managers to do things the same way (uniformity) to retrieve and store information from a single source of truth (requires interoperability) and to keep information in this single source of truth updated (data reliability). (Paper 7, p. 12)
Table 14. Observed Future state IS Strategies Future IS strategies (use of IS to support business strategy) in each of the cases A-E. From Paper 7, Table 4.
Bullet (●) indicates use of strategy. Left column indicates to which IS-BP framework layer the strategy belongs.
Current state IS strategies Cases Layer Strategy A B C D E BP Business Process Autonomy
Lac of standard procedures Business Process Uniformity ● ● ● Asset Business Process Uniformity ● ●
BP/IS Business Procedures for Data Update ● ● ● IS IS Autonomy
Low degree of Interoperability Low degree of data update High degree of Update of Data ●
IS/CN High degree of Interoperability ● ● ● ● ●
Table 15 can help us understand the different ways IS strategy is being implemented. A high degree of interoperability is implemented by reducing the number of IS and by establishing a central points of data access. Uniformity is achieved by requiring a uniform execution of each business process or by requiring a uniform execution of each business process for each type of asset. Data reliability is achieved by requiring data updated according to standard procedures. (Paper 7, p. 13)
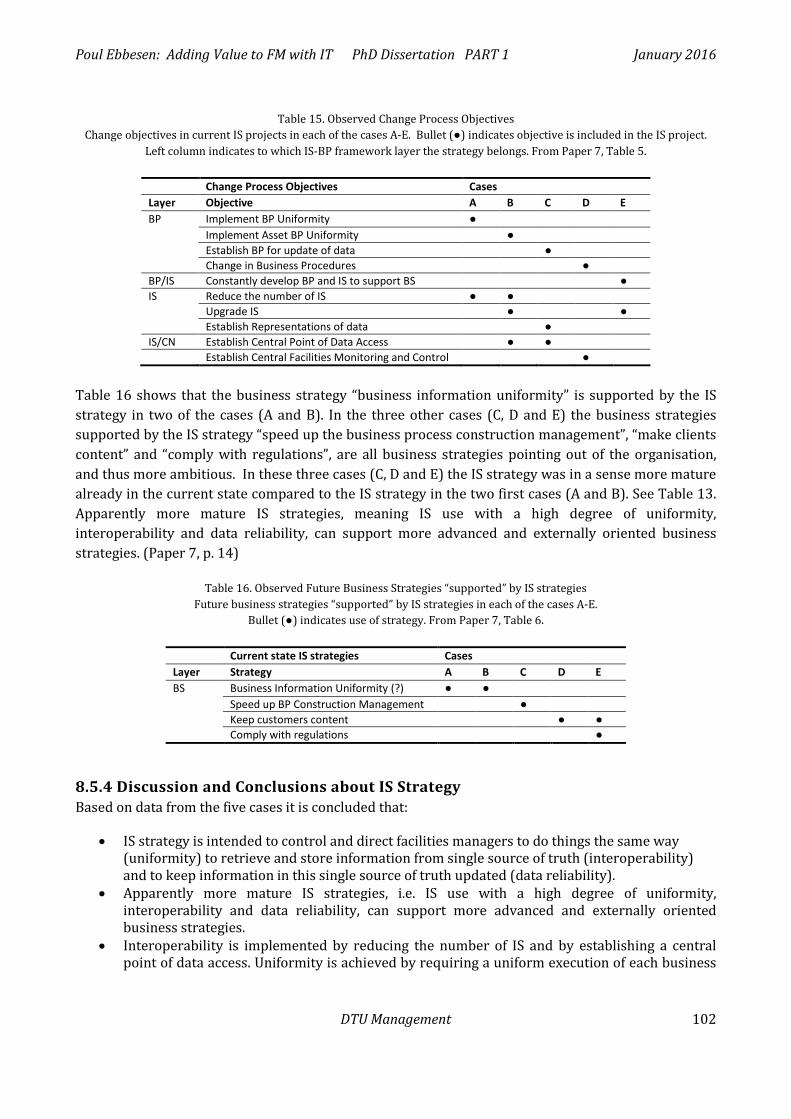
Poul Ebbesen: Adding Value to FM with IT PhD Dissertation PART 1 January 2016
DTU Management 102
Table 15. Observed Change Process Objectives Change objectives in current IS projects in each of the cases A-E. Bullet (●) indicates objective is included in the IS project.
Left column indicates to which IS-BP framework layer the strategy belongs. From Paper 7, Table 5.
Change Process Objectives Cases Layer Objective A B C D E BP Implement BP Uniformity ●
Implement Asset BP Uniformity ● Establish BP for update of data ● Change in Business Procedures ●
BP/IS Constantly develop BP and IS to support BS ● IS Reduce the number of IS ● ●
Upgrade IS ● ● Establish Representations of data ●
IS/CN Establish Central Point of Data Access ● ● Establish Central Facilities Monitoring and Control ●
Table 16 shows that the business strategy “business information uniformity” is supported by the IS strategy in two of the cases (A and B). In the three other cases (C, D and E) the business strategies supported by the IS strategy “speed up the business process construction management”, “make clients content” and “comply with regulations”, are all business strategies pointing out of the organisation, and thus more ambitious. In these three cases (C, D and E) the IS strategy was in a sense more mature already in the current state compared to the IS strategy in the two first cases (A and B). See Table 13. Apparently more mature IS strategies, meaning IS use with a high degree of uniformity, interoperability and data reliability, can support more advanced and externally oriented business strategies. (Paper 7, p. 14)
Table 16. Observed Future Business Strategies “supported” by IS strategies Future business strategies “supported” by IS strategies in each of the cases A-E.
Bullet (●) indicates use of strategy. From Paper 7, Table 6.
Current state IS strategies Cases Layer Strategy A B C D E BS Business Information Uniformity (?) ● ●
Speed up BP Construction Management ● Keep customers content ● ● Comply with regulations ●
8.5.4 Discussion and Conclusions about IS Strategy Based on data from the five cases it is concluded that:
• IS strategy is intended to control and direct facilities managers to do things the same way (uniformity) to retrieve and store information from single source of truth (interoperability) and to keep information in this single source of truth updated (data reliability).
• Apparently more mature IS strategies, i.e. IS use with a high degree of uniformity, interoperability and data reliability, can support more advanced and externally oriented business strategies.
• Interoperability is implemented by reducing the number of IS and by establishing a central point of data access. Uniformity is achieved by requiring a uniform execution of each business
Poul Ebbesen: Adding Value to FM with IT PhD Dissertation PART 1 January 2016
DTU Management 103
process or by requiring a uniform execution of each business processes for each type of asset. Data reliability is achieved by requiring data updated according to standard procedures.
(Paper 7, p. 14) It is demonstrated that IS implementation processes in FM, constituted by constant incremental changes and by more radical changes during IS projects (see section 7.3), continuously improve the use of IS to support business strategy. An interesting aspect is whether we implement IS or implement IS strategy or both? (Paper 7, p. 14)
Paper 7 is based on observed realised IS strategies, which can be both deliberate and/or emergent. Each IS strategy may have emerged over time as a result of many events and decisions, and may not have been deliberate. (Paper 7, p. 14-15)
The methodology applied in Paper 7 can be used to establish IS strategies in practice. Using the IS-BP framework the current state, the future states of the IS strategy and the change process, e.g. the IS project, can be mapped. Thereby illustrating how the change in the use of IS can lead to more support of the business strategy. (Paper 7, p. 15) It is demonstrated that IS implementation projects in FM are not delimited and isolated projects. Rather they appear to be interwoven and linked to past and concurrent IS implementation. Recognising this when planning and executing IS projects in FM is anticipated to strengthen the IS implementation process. (Paper 7, p. 15)
8.6 TECHNOLOGY DIFFUSION INTO FM Based on literature and the empirical data, different types of Information Technologies (IT) and Information Systems (IS) being developed, implemented and used in the FM domain were found. This is described e.g. in section 4.3 and in Paper 2. It was found that IT and IS are in their early stages of diffusion into FM organizations, and that there seems to be a belief in technology combinations as a way to speed up the slow IT/IS diffusion process in FM.
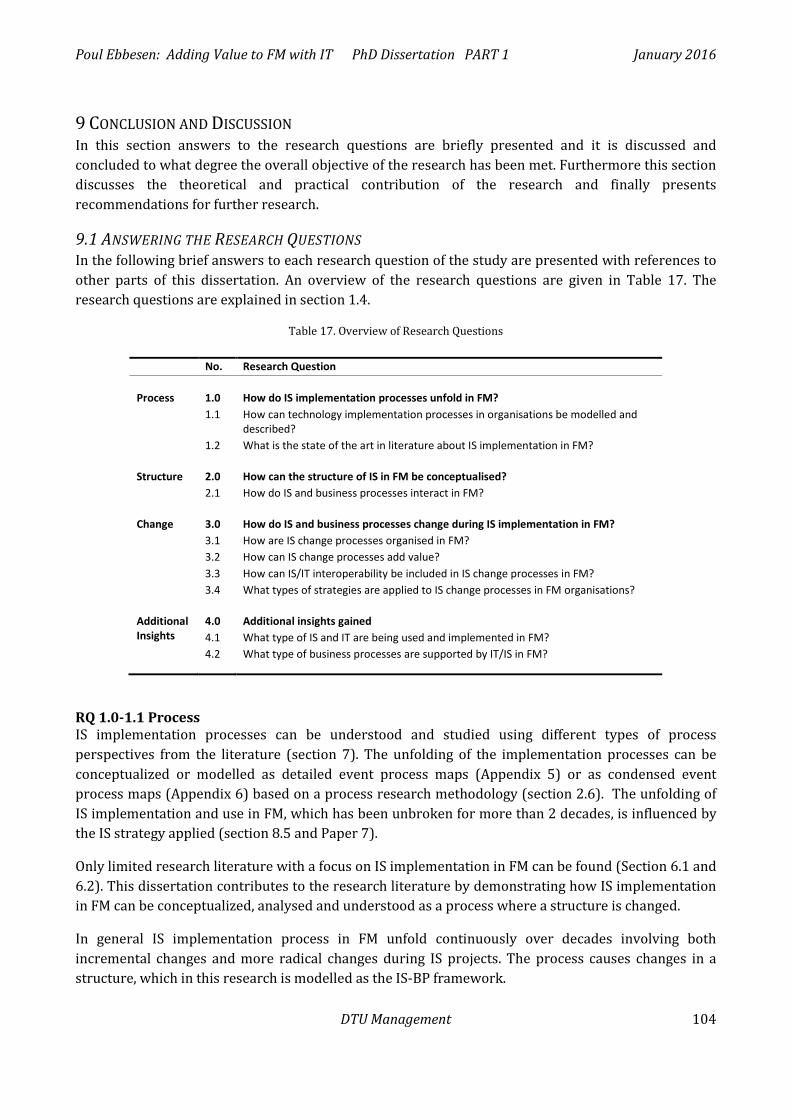
Poul Ebbesen: Adding Value to FM with IT PhD Dissertation PART 1 January 2016
DTU Management 104
9 CONCLUSION AND DISCUSSION In this section answers to the research questions are briefly presented and it is discussed and concluded to what degree the overall objective of the research has been met. Furthermore this section discusses the theoretical and practical contribution of the research and finally presents recommendations for further research.
9.1 ANSWERING THE RESEARCH QUESTIONS In the following brief answers to each research question of the study are presented with references to other parts of this dissertation. An overview of the research questions are given in Table 17. The research questions are explained in section 1.4.
Table 17. Overview of Research Questions
No. Research Question Process
1.0
How do IS implementation processes unfold in FM?
1.1 How can technology implementation processes in organisations be modelled and described?
1.2 What is the state of the art in literature about IS implementation in FM?
Structure 2.0 How can the structure of IS in FM be conceptualised? 2.1 How do IS and business processes interact in FM?
Change 3.0 How do IS and business processes change during IS implementation in FM? 3.1 How are IS change processes organised in FM? 3.2 How can IS change processes add value? 3.3 How can IS/IT interoperability be included in IS change processes in FM? 3.4 What types of strategies are applied to IS change processes in FM organisations?
Additional Insights
4.0 Additional insights gained 4.1 What type of IS and IT are being used and implemented in FM?
4.2 What type of business processes are supported by IT/IS in FM?
RQ 1.0-1.1 Process IS implementation processes can be understood and studied using different types of process perspectives from the literature (section 7). The unfolding of the implementation processes can be conceptualized or modelled as detailed event process maps (Appendix 5) or as condensed event process maps (Appendix 6) based on a process research methodology (section 2.6). The unfolding of IS implementation and use in FM, which has been unbroken for more than 2 decades, is influenced by the IS strategy applied (section 8.5 and Paper 7).
Only limited research literature with a focus on IS implementation in FM can be found (Section 6.1 and 6.2). This dissertation contributes to the research literature by demonstrating how IS implementation in FM can be conceptualized, analysed and understood as a process where a structure is changed.
In general IS implementation process in FM unfold continuously over decades involving both incremental changes and more radical changes during IS projects. The process causes changes in a structure, which in this research is modelled as the IS-BP framework.
Poul Ebbesen: Adding Value to FM with IT PhD Dissertation PART 1 January 2016
DTU Management 105
RQ 2.0-2.1 Structure The IS-BP framework, presented in section 8.3 and in Paper 5, is a conceptualisation of the structure being changed during the IS implementation process. The framework shows that IS and business processes (BP) can be conceptualised as two distinct but interacting entities. The IS-BP framework shows that an IS can support a BP through functional affordances offered to the people running the BP. Provided the BP is aligned with the business strategy (BS) of the organisation, the IS can support the PB and thereby help the organisation reach its goals.
RQ 3.0-3.4 Change The IS change and the interacting organisational change in FM can be more or less formalised. On the IS project level organisations can apply a low or a high degree of formal control mechanisms. Similarly on the organisational IS governance/management level organisations can apply a low or a high degree of formal control mechanisms (section 8.2 and Paper 4).
IS projects may have a narrow scope only including IS change or have a wider scope also including organisational change. Furthermore, the state before (current state) and the state after (future state) the change process can be included in the IS project scope. The state before the change can be included if people involved in the IS project have also been involved e.g. in running the IS before the change. Similarly the state after the change can be included when people involved in the IS project are also involved e.g. in running the IS after the change (section 8.2 and Paper 4).
Change processes including IS implementation in FM can add value to the organisation if e.g. an increase in efficiency or an improvement in effectiveness is achieved, provided these improvements also supports business strategy. Assessing whether value has been added requires some kind of measuring or surveying of the situation before and after the change process (section 8.4 and Paper 6).
In this dissertation interoperability is seen as a part of the value parameter efficiency: The more interoperability the more efficiency (section 8.4 and Paper 6). Interoperability is also closely related to IS strategy (section 8.5 and Paper 7) because interoperability seems to be a common means to reach the overall goal of IS implementation and use; to support business strategies. Realized IS strategy with a high degree of uniformity, interoperability and data reliability is found to support more advanced and externally oriented business processes (section 8.5 and Paper 7).
To summarise it may be concluded that IS and business processes change during the ongoing IS implementation process so that support of business strategy is improved.
RQ 4.1-4.2 Additional Insights A variety of IS based on different IT are being developed, implemented and used to support FM business processes. The different types of IS and IT found in this research in the FM domain are presented and categorised in section 4.3.
A range of FM business processes are supported by IS in FM, and these business processes can be categorised (se section 5.2) and matched with the IS supporting them as shown in section 4.3.
9.2 MEETING THE RESEARCH OBJECTIVE The overall objective of this enquiry was “to contribute to improvements of IS use and improvements of IS implementation processes in FM departments, so that new added value can be gained from IS investments in FM.”
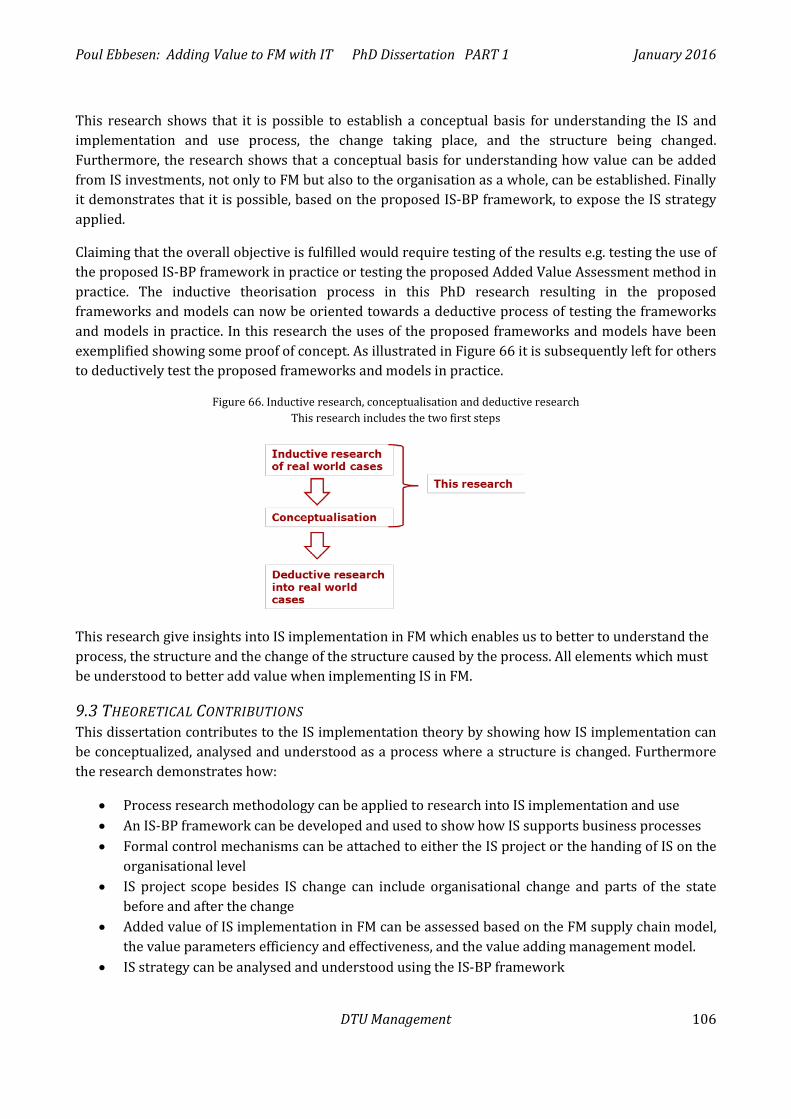
Poul Ebbesen: Adding Value to FM with IT PhD Dissertation PART 1 January 2016
DTU Management 106
This research shows that it is possible to establish a conceptual basis for understanding the IS and implementation and use process, the change taking place, and the structure being changed. Furthermore, the research shows that a conceptual basis for understanding how value can be added from IS investments, not only to FM but also to the organisation as a whole, can be established. Finally it demonstrates that it is possible, based on the proposed IS-BP framework, to expose the IS strategy applied.
Claiming that the overall objective is fulfilled would require testing of the results e.g. testing the use of the proposed IS-BP framework in practice or testing the proposed Added Value Assessment method in practice. The inductive theorisation process in this PhD research resulting in the proposed frameworks and models can now be oriented towards a deductive process of testing the frameworks and models in practice. In this research the uses of the proposed frameworks and models have been exemplified showing some proof of concept. As illustrated in Figure 66 it is subsequently left for others to deductively test the proposed frameworks and models in practice.
Figure 66. Inductive research, conceptualisation and deductive research This research includes the two first steps
This research give insights into IS implementation in FM which enables us to better to understand the process, the structure and the change of the structure caused by the process. All elements which must be understood to better add value when implementing IS in FM.
9.3 THEORETICAL CONTRIBUTIONS This dissertation contributes to the IS implementation theory by showing how IS implementation can be conceptualized, analysed and understood as a process where a structure is changed. Furthermore the research demonstrates how:
• Process research methodology can be applied to research into IS implementation and use • An IS-BP framework can be developed and used to show how IS supports business processes • Formal control mechanisms can be attached to either the IS project or the handing of IS on the
organisational level • IS project scope besides IS change can include organisational change and parts of the state
before and after the change • Added value of IS implementation in FM can be assessed based on the FM supply chain model,
the value parameters efficiency and effectiveness, and the value adding management model. • IS strategy can be analysed and understood using the IS-BP framework
Poul Ebbesen: Adding Value to FM with IT PhD Dissertation PART 1 January 2016
DTU Management 107
9.4 IMPLICATIONS FOR PRACTICE The dissertation is more descriptive than prescriptive; it does not prescribe how things should be done. It delivers insight into and an understanding of how things are done. It delivers observed structures and models (which are mainly descriptive) which can help practitioners reflect upon their actions, and thereby enable them to improve their performance.
9.5 RECOMMENDATIONS FOR FURTHER RESEARCH The observed ways of IS/IT implementation and use in FM practice and the conceptualisation and theorisation based on these observations need now to be tested deductively in practice. The research questions for future research could be:
• Are formal control mechanisms related to either the IS project level or the organisational IS level, or are some formal control mechanisms shared by both levels? (section 8.2 and Paper 4)
• Can we rely on the IS-BP framework to fully understand how IS supports FM and the core business of organisations? (section 8.3 and Paper 5)
• Can the analysis of the value added by implementing IS in FM be limited to the two constructs efficiency and effectiveness? (section 8.4 and Paper 6)
• Can IS strategy viewed as the use of IS to support business processes stand alone, or should we include other views of IS strategy to fully understand strategy when the aim is to support FM with IS? (section 8.5 and Paper 7)
• When are IS projects just more radical parts of the otherwise ongoing incremental IS and organisational changes taking place because of the continuous diffusion of IS into FM? (section 7.3)
To obtain and sustain the expected added value gained from the IS implementation and use, changes may be needed in the FM department and other parts of the organisation. A relevant research question central to the aim and contribution of this research and relevant for future research could therefore be:
• How should the FM organisations be consolidated when implementing IS in order to obtain and sustain the projected added value?
The empirical data in this research only vaguely pointed directly back to the theory introduced in the initial phases. The theory, primarily process perspectives, was introduced in the early phases to investigate the phenomenon of IS implementation and use. Terminology from process theories was translated into phrases which could be easier understood by the respondents who are practitioners. The concepts from the theory did therefore not explicitly appear in the data collected from the interviews. A future study within this domain could limit this challenge by introducing a terminology in the interviews pointing more directly to the different process perspectives used.
The design of this research developed and was adjusted during the PhD project. A future study can, by reusing the final research design of this research, follow a more rigorous path. Such study should still highlight the inductive approach through openness to new issues emerging from the empirical data.
Poul Ebbesen, January 2016

Poul Ebbesen: Adding Value to FM with IT PhD Dissertation PART 1 January 2016
DTU Management 108
Poul Ebbesen: Adding Value to FM with IT PhD Dissertation PART 1 January 2016
DTU Management 109
REFERENCES Ahmad, A., Lyytinen, K. & Newman, M., 2011. The Evolution of Process Models in Is Research: From a
Punctuated Social Process Model To a Socio-Technical Process Model. In ECIS 2011 Proceedings.
Aversano, L., Grasso, C. & Tortorella, M., 2011. ALBIS - ALigning Business Processes and Information Systems: A Case Study. In Enterprise Information Systems. pp. 286–296.
Bainbridge, M. & Finch, E.F., 2009. Getting the attention the facilities manager deserves. Facilities, 27(7/8), pp.277–290.
Becerik-gerber, B. et al., 2012. Application Areas and Data Requirements for BIM-Enabled Facilities Management. , (March), pp.431–443.
Beeson, I. et al., 2002. Linking Business Processes and Information Systems Provision in a Dynamic Environment. Information Systems Frontiers, 4(3), pp.317–329.
Buckland, M.K., 1991. Information as thing. Journal of the American Society for Information Science, 42(5), pp.351–360.
Butterfield, L.D., 2005. Fifty years of the critical incident technique: 1954-2004 and beyond. Qualitative Research, 5(4), pp.475–497.
Bygstad, B. & Nielsen, P., 2012. Understanding and managing process interaction in IS development projects. Nordic Contributions in IS Research, pp.1–19.
CEN, 2008. EN 15221-1:2006 Facility Management - Part 1: Terms and definitions,
CEN, 2011a. EN 15221-4:2011 Facility Management - Part 4: Taxonomy, Classification and Structures in Facility Management,
CEN, 2011b. EN 15221-5:2011 Facility Management - Part 5: Guidance on Facility Management processes,
Chaffey, D., 2014. What is the difference between efficiency and effectiveness marketing measures? - Smart Insights Digital Marketing Advice.
Chan, Y.E. & Reich, B.H., 2007. IT alignment: what have we learned? Journal of Information Technology, 22(4), pp.297–315.
Chen, D.Q. et al., 2010. Information systems strategy: reconceptualization, measurement, and implications. MIS Quarterly, 34(2), pp.233–259.
Chen, H.-M., Hou, C.-C. & Wang, Y.-H., 2013. A 3D visualized expert system for maintenance and management of existing building facilities using reliability-based method. Expert Systems with Applications, 40(1), pp.287–299.
Cohen, E.A., 2016. Strategy. Encyclopædia Britannica. Available at: http://global.britannica.com.globalproxy.cvt.dk/topic/strategy-military.
Collis, J. & Hussey, R., 2009. Business Research, A pracitcal guide for undergraduate & postgraduate students 3rd ed., Palgrave Macmillan.
Dahler-Larsen, P., 2010. Display. In L. B. Andsersen, K. M. Hansen, & R. Klemmensen, eds. Metoder i statskundskab. Hans Reitzels Forlag, pp. 192–214.
Dahler-Larsen, P., 2008. Displaying Qualitative Data, University Press of Southern Denmark.
Eadie, R. et al., 2013. BIM implementation throughout the UK construction project lifecycle: An analysis. Automation in Construction, 36(2013), pp.145–151.
East, E.W. et al., 2013. Facility Management Handover Model View. , (February), pp.61–67.
Poul Ebbesen: Adding Value to FM with IT PhD Dissertation PART 1 January 2016
DTU Management 110
Eastman, C. et al., 2011. BIM Handbook: A Guide to Building Information Modeling for Owners, Managers, Designers, Engineers and Contractors, Wiley.
Ebbesen, P., 2015a. Applying Displays to Qualitaitve Studies of Information Technology Implementation Processes. In 7th International Process Symposium.
Ebbesen, P., 2016. Bridging the gap between Information Systems and Business Processes – A Framework with Functional Affordances and Alignment. ITcon, In Review.
Ebbesen, P. et al., 2016. Information System Strategies in Facilities Management – Based on five Process Studies. In CFM Second Nordic Conference. p. In Review.
Ebbesen, P., 2015b. Information Technology in Facilities Management - A Literature Review. In 14th EuroFM Research Symposium.
Ebbesen, P. & Bonke, S., 2014. Identifying Concepts for studying Implementaiton of Information Technology in Facilities Management. In CIB Facilities Management Conference. pp. 417–429.
Ebbesen, P. & Jensen, P.A., 2016. Assessing the Added Value of Information Systems supporting Facilities Management Business Processes. Facilities, In Review.
Ebbesen, P. & Nardelli, G., 2015. Formal Control and Scope in Information System Projects in Facilities Management – A Process Perspective. In The 38th Information Systems Research Conference in Scandinavia (IRIS 38). pp. 1–17.
Eisenhardt, K.M. & Graebner, M.E., 2007. Theory Building From Cases : Opportunities and Challenges. Academy of Management Journal, 50(1), pp.25–32.
Elmualim, A. & Pelumi-Johnson, A., 2009. Application of computer-aided facilities management (CAFM) for intelligent buildings operation. Facilities, 27(11/12), pp.421–428.
Falletta, S., 2008. Organizational Diagnostic Models, A Review & Synthesis, Available at: http://www.leadersphere.com/img/OrgmodelsR2009.pdf.
Gasson, S., 2009. Employing a Grounded Theory Approach for MIS Research. In Y. Dwivedi et al., eds. Handbook on Research on Contemporary Theoretical Models in Information Systems. pp. 34–56.
Gibson, J.J., 1986. The ecological approach to visual perception, Lawrence Erlbaum Associates.
Gregor, S., Hart, D. & Martin, N., 2007. Enterprise architectures: enablers of business strategy and IS/IT alignment in government. Information Technology & People, 20(2), pp.96–120.
Gremler, D.D., 2004. The Critical Incident Technique in Service Research. Journal of Service Research, 7(1), pp.65–89.
Hallberg, D., 2011. On the use of open BIM and 4D visualisation in a predictive life cycle management system for construction works. Journal of Information Technology in Construction, 16, pp.445–466.
Hayes, J., 2010. The theory and practice of change management 3rd ed., Basingstoke: Palgrave Macmillan.
Heinrich, R., 2014. Aligning Business Processes and Information Systems, Springer Vieweg.
Hou, L., Wang, Y. & Wang, X., 2014. Combining Photogrammetry and Augmented Reality Towards an Integrated Facility Management System for the Oil Industry. Proceedings of the IEEE, 102(2).
Hua, Y., Göçer, Ö. & Göçer, K., 2014. Spatial mapping of occupant satisfaction and indoor environment quality in a LEED platinum campus building. Building and Environment, 79, pp.124–137.
Irizarry, J. et al., 2014. Ambient intelligence environments for accessing building information: A healthcare facility management scenario. Facilities, 32(3), pp.120–138.
Irizarry, J. et al., 2013. InfoSPOT: A mobile Augmented Reality method for accessing building information
Poul Ebbesen: Adding Value to FM with IT PhD Dissertation PART 1 January 2016
DTU Management 111
through a situation awareness approach. Automation in Construction, 33(2013), pp.11–23.
ISO, 2012. Guidance on project management ISO 21500,
Jensen, P.A., 2008. Facilities Management for students and practitioners, Lyngby Denmark: Centre for Facilities Management - Realdania Research, DTU Management Engineering and Polyteknisk Forlag.
Jensen, P.A., 2012. The added value og facilities management. Concepts, findings and perspectives, Lyngby Denmark: Polyteknisk Forlag.
Jensen, P.A. & Katchamart, A., 2012. Value Adding Management: A concept and a case. In P. A. Jensen, T. van der Voordt, & C. Coenen, eds. The Added Value of Facilities Management - Concepts, Findings and Perspectives. Centre for Facilities Management - Realdania Research, DTU Management Engineering.
Jensen, P.A. & Katchamart, A., 2012. Value Adding Management: A Concept and a Case. Added Value of Facilities Management: Concepts, Findings and Perspectives, pp.164–176.
Jensen, P.A. & Van der Voordt, T., 2015. How can FM create Value to Organisations?,- A critical review of papers from EuroFM Symposia 2013-2015, EuroFM
Jensen, P.A., Van der Voordt, T. & Coenen, C. eds., 2012. The Added Value of Facilities Management. Concepts, Findings and Perspectives, Polyteknisk Forlag.
Jung, J. et al., 2014. Productive modeling for development of as-built BIM of existing indoor structures. Automation in Construction, 42, pp.68–77.
Kaegi, M. et al., 2006. Information systems’ risk analysis by agent-based modelling of business processes. Proceedings of the European Safety and Reliability Conference 2006, ESREL 2006 - Safety and Reliability for Managing Risk, 3(September), pp.2277–2284.
Keller, C., 2013. CAFM/IWMS - Balancing Technology, Processes and Objectives. In E. Teicholz, ed. Technology for Facilities Management. The Impact on Cutting-Edge Technology on Facility Management. IFMA.
Kim, M.J. et al., 2013. Virtual reality for the built environment : A critical review of recent advances. , 18(August), pp.279–305.
Kirsch, L.J., 1997. Portfolios of Control Modes and IS Project Management. Information Systems Research, 8(3), pp.215–239.
Klein, K.J. & Sorra, J.S., 1996. The Challenge of Innovation Implementation. Academy of Management Review, 21(4), pp.1055–1081.
Klein, L., Li, N. & Becerik-Gerber, B., 2012. Imaged-based verification of as-built documentation of operational buildings. Automation in Construction, 21(2012), pp.161–171.
Ko, C.-H., Pan, N.-F. & Chiou, C.-C., 2013. Web-based radio frequency identification facility management systems. Structure and Infrastructure Engineering, 9(5), pp.465–480.
Kriksciuniene, D. et al., 2014. Data analysis in the intelligent building environment. International Journal of Computer Science and Applications, 11(1), pp.1–17.
Kvale, S. & Brinkmann, S., 2009. Interviews 2nd ed., SAGE Publications.
Lai, J.H. & Yik, F.W., 2011. A probe into the facilities maintenance data of a hotel. Building Services Engineering Research and Technology, 33(2), pp.141–157.
Langley, A. et al., 2013. Process studies of change in organization and management: unveiling temporality, activity, and flow. Academy of Management Journal, 56(1), pp.1–13.
Langley, A., 1999. Strategies for theorizing from process data. Academy of Management Review, 24(4),
Poul Ebbesen: Adding Value to FM with IT PhD Dissertation PART 1 January 2016
DTU Management 112
pp.691–710.
Langley, A. & Tsoukas, H., 2010. Introducing perspectives on process organization studies. In Process, sencemaking, and organizing.
Latour, B., 1999. A Collective of Humans and Nonhumans. In Pandora’s hope : Essays on the reality of science studies. Cambridge, MA: Harvard University Press, pp. 174–198.
Laudon, K.C. & Laudon, J.P., 2014. Management Information Systems. Managing the Digital Firm. 3rd ed., Pearson Education Limited.
Leavitt, H.J., 1964. Applied organization change in industry: structural, technical, and human approaches. In W. W. Cooper, H. J. Leavitt, & M. W. I. Shelly, eds. New Perspectives in Organization Research. pp. 55–77.
Leonardi, P.M., 2011. When flexible routines meet flexible technologies: affordance, constraint, and the imbrication of human and material agencies. MIS Quarterly, 35(1), pp.147–167.
Lewis, A., Riley, D. & Elmualim, A., 2010. Defining High Performance Buildings for Operations and Maintenance. International Journal of Facility Management, 1(2), pp.1–16.
Luftman, J.N., Lewis, P.R. & Oldach, S.H., 1993. Transforming the enterprise: the alignment of business and information technology strategies. IBM Systems Journal, 32(1), p.189/221.
Madritsch, T. & May, M., 2009. Successful IT implementation in facility management. Facilities, 27(11/12), pp.429–444.
Malatras, A., Asgari, A.H. & Baugé, T., 2008. Web Enabled Wireless Sensor Networks for Facilities Management. IEEE Systems Journal, 2(December), pp.500–512.
Manzoor, F. et al., 2012. RFID based efficient lighting control. , 4, pp.1–21.
Markus, M.L. & Silver, M.S., 2008. A Foundation for the Study of IT Effects : A New Look at DeSanctis and Poole ’ s Concepts of Structural Features and Spirit. Journal of the Association for Information Systems, 9(10/11), pp.609–632.
Miles, M.B., Huberman, A.M. & Saldaña, J., 2014. Qualitative Data Analysis 3rd ed., SAGE Publications.
Millet, P.-A., Schmitt, P. & Botta-Genoulaz, V., 2009. The SCOR model for the alignment of business processes and information systems. Enterprise Information Systems, 3(4), pp.393–407.
Mintzberg, H., 1987. The Strategy Concept I: Five Ps For Strategy. California Management Review, 30(1), pp.11–24.
Mintzberg, M., 2009. Structure in fives. Designing effective organizations, Edinburgh: Pearson Education Limited.
Mohr, L.B., 1982. Explaining organizational behavior, Jossey-Bass San Francisco.
Motamedi, A. et al., 2011. Role-based access to facilities lifecycle information on RFID tags. Advanced Engineering Informatics, 25(3), pp.559–568.
Motamedi, A., Hammad, A. & Asen, Y., 2014. Knowledge-assisted BIM-based visual analytics for failure root cause detection in facilities management. Automation in Construction, 43, pp.73–83.
Motamedi, A., Soltani, M.M. & Hammad, A., 2013. Localization of RFID-equipped assets during the operation phase of facilities. Advanced Engineering Informatics, 27(4), pp.566–579.
Newman, M. & Robey, D., 1992. A Social Process Model of User- Analyst Relationships. , (June), pp.249–267.
Norris, C., 2002. Truth Matters. Realism, Anti-Realism and Response-Dependence, Edinburgh University
Poul Ebbesen: Adding Value to FM with IT PhD Dissertation PART 1 January 2016
DTU Management 113
Press.
Olbrich, M. et al., 2013. Augmented reality supporting user-centric building information management. The Visual Computer, 29(10), pp.1093–1105.
Olsen, T. & Welke, R., 2013. Understanding Events , Critical Incidents , and Punctuation in Process Theory. In Proceedings of the Nineteenth Americas Conference on Information Systems, Chicago, Illinois.
Otto, J., 2008. Implementation of future service requirements in building management. International Journal of Environment and Pollution, 35(2/3/4), p.265.
Pinch, T.J. & Bijker, W.E., 1984. The Social Construction of Facts and Artifacts: Or How the Sociology of Science and the Sociology of Technology Might Benefit Each Other. In Workshop held at the Uniiversity of Twente, The Netherlands. MIT Press.
PMI, 2008. A Guide to the Project Management Body of Knowledge (PMBOK Guide), Project Management Institute.
Praxion, 2015. ISO 27000 series. Praxion Research Group. Available at: http://www.praxiom.com/iso-27000-definitions.htm.
Prischl, P. et al., 2012. Economic benefits of a CAFM implementation. In G. Williams & M. May, eds. The Facilitiy Manager’s Guide to Information Technology. IFMA.
Robey, D. & Newman, M., 1996. Sequential patterns in information systems development: an application of a social process model. ACM Transactions on Information Systems, 14(1), pp.30–63.
Rogers, E.M., 2003. Diffusion of innovations, NY: Free Press.
Saunders, M., Lewis, P. & Thornhill, A., 2009. Research for methods for business students 5th ed., Prentice Hall.
Schneider, T. & Leslie, B., 2015. Efficiency vs . Effectiveness : Defining the Difference, Available at: http://www.switchpointllc.com/.
Scupola, A., 2014. ICT Adoption in Facilities Management Supply Chain: The Case of Denmark. Journal of Global Information Technology Management, 15(1), pp.53–78.
Seidel, S. & Recker, J., 2012. Implementing green business processes: the importance of functional affordances of information systems. ACIS 2012: Proceedings of the 23rd Australasian Conference on Information Systems 2012, (Melville 2010), pp.1–10.
Shen, W. et al., 2010. Systems integration and collaboration in architecture, engineering, construction, and facilities management: A review. Advanced Engineering Informatics, 24(2), pp.196–207.
Siggelkow, N., 2007. Persuasion with case studies. Academy of Management Journal, 50(1), pp.20–24.
Silver, M.S., Markus, M.L. & Beath, C.M., 1995. The information technology interaction model: a foundation for the MBA core course. MIS Quarterly, 19(3), pp.361–390.
Silverstone, R., 1992. Consuming technologies : Media and information in domestic spaces R. Silverstone & E. Hirch, eds., Routledge.
Stewart, J., 2003. The social consumption of information and communication technologies (ICTs): insights from research on the appropriation and consumption of new ICTs in the domestic environment. Cognition, Technology & Work, 5(1), pp.4–14.
Sørensen, K.H. & Williams, R., 2002. Shaping technology, guiding policy : Concepts, spaces and tools, UK: Edward Elgar.
Thyssen, M.H., 2011. Facilitating Value Creation and Delivery in Construction Projects. Technical University of Denmark (DTU).
Poul Ebbesen: Adding Value to FM with IT PhD Dissertation PART 1 January 2016
DTU Management 114
Tiwana, A., 2010. Systems Development Ambidexterity: Explaining the Complementary and Substitutive Roles of Formal and Informal Controls. Journal of Management Information Systems, 27(2), pp.87–126.
Tolman, A. et al., 2009. The benefits and obstacles of mobile technology in FM service procurement. Facilities, 27(11/12), pp.445–456.
Tolman, A. & Parkkila, T., 2009. FM tools to ensure healthy performance based buildings. Facilities, 27(11/12), pp.469–479.
Tulla, K. et al., 2009. RFID technology changes FM services deliveries. Facilities, 27(11/12), pp.457–468.
Vanlande, R. & Nicolle, C., 2008. Context DataModel Framework: semantic facilities management. International Journal of Product Lifecycle Management, 3(2/3), p.165.
Van de Ven, A.H., 2005. Alternative Approaches for Studying Organizational Change. Organization Studies, 26(9), pp.1377–1404.
Van de Ven, A.H. & Huber, G.P., 1990. Longitudinal field research methods for studying processes of organizational change. Organization Science, 1(3), pp.213–220.
Van de Ven, A.H. & Poole, M.S., 2005. Alternative Approaches for Studying Organizational Change. Organization Studies, 26(9), pp.1377–1404.
Verdinelli, S. & Scagnoli, N.I., 2013. Data Display in Qualitative Research. International Journal of Qualitative Methods, 12, pp.359–381.
Volk, R., Stengel, J. & Schultmann, F., 2014. Building Information Modeling (BIM) for existing buildings — Literature review and future needs. Automation in Construction, 38, pp.109–127.
WFMC, 2015. Terminology & Glossary. Workflow Management Coalition. Available at: http://www.aiai.ed.ac.uk/project/wfmc/ARCHIVE/DOCS/glossary/glossary.html.
Wikipedia, 2016. Management Information Systems. Wikipidea.org. Available at: https://en.wikipedia.org/wiki/Management_information_system.
Yin, R.K., 2003. Case Study Research: Design and Methods, SAGE Publications.
Yoshinaka, Y., 2012. Lecture notes on domestication of technology. DTU course 42640 sociotechnical design,
Zhang, X., Li, G. & Mao, J.-Y., 2013. Information Systems Development in a Low Methodology Maturity Environment: A Case Study from the Control Perspective. Frontiers of Business Research in China, 7(3), pp.382–401.
Zwass, V., 2015. Encyclopædia Britannica. Available at: http://global.britannica.com/topic/information-systemcom.
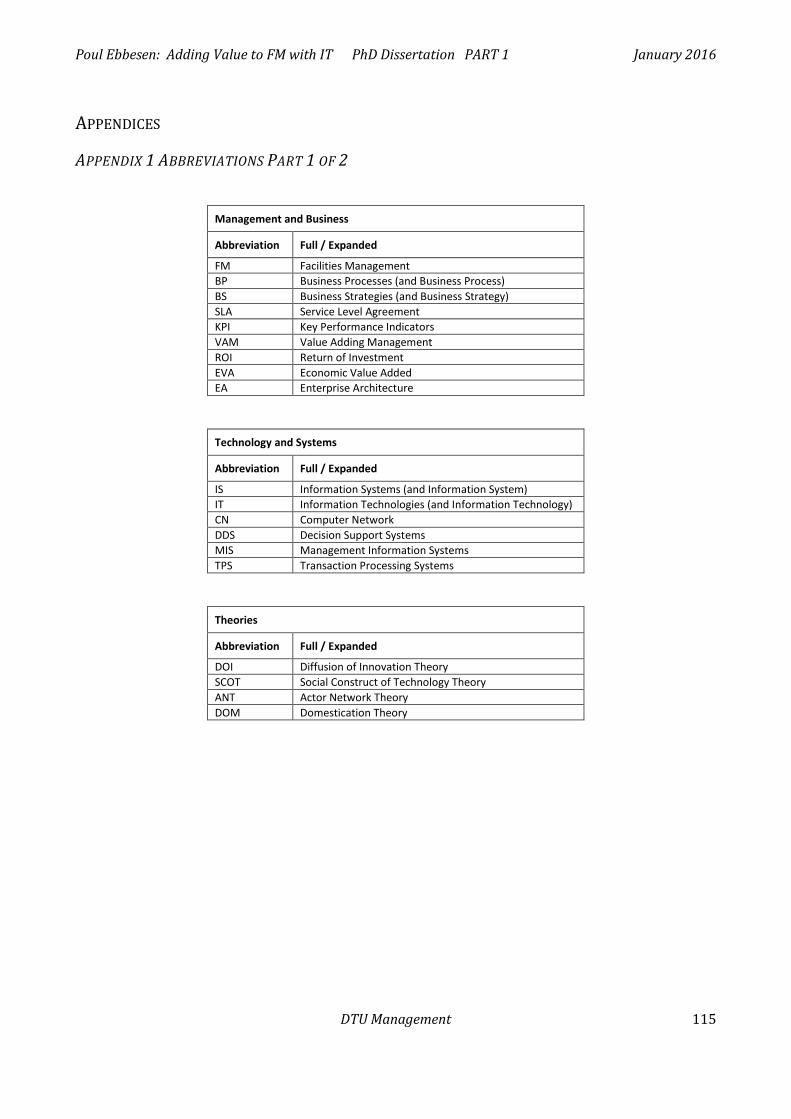
Poul Ebbesen: Adding Value to FM with IT PhD Dissertation PART 1 January 2016
DTU Management 115
APPENDICES
APPENDIX 1 ABBREVIATIONS PART 1 OF 2
Management and Business
Abbreviation Full / Expanded
FM Facilities Management BP Business Processes (and Business Process) BS Business Strategies (and Business Strategy) SLA Service Level Agreement KPI Key Performance Indicators VAM Value Adding Management ROI Return of Investment EVA Economic Value Added EA Enterprise Architecture
Technology and Systems
Abbreviation Full / Expanded
IS Information Systems (and Information System) IT Information Technologies (and Information Technology) CN Computer Network DDS Decision Support Systems MIS Management Information Systems TPS Transaction Processing Systems
Theories
Abbreviation Full / Expanded
DOI Diffusion of Innovation Theory SCOT Social Construct of Technology Theory ANT Actor Network Theory DOM Domestication Theory
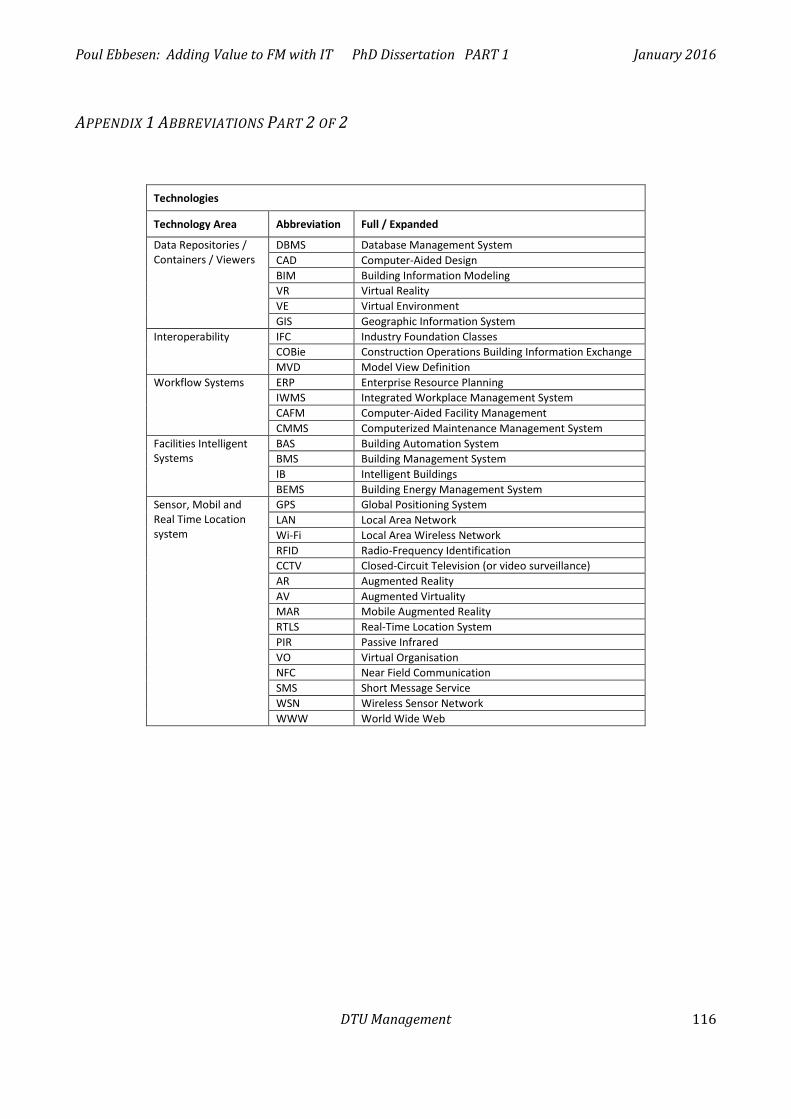
Poul Ebbesen: Adding Value to FM with IT PhD Dissertation PART 1 January 2016
DTU Management 116
APPENDIX 1 ABBREVIATIONS PART 2 OF 2
Technologies
Technology Area Abbreviation Full / Expanded
Data Repositories / Containers / Viewers
DBMS Database Management System CAD Computer-Aided Design BIM Building Information Modeling VR Virtual Reality VE Virtual Environment GIS Geographic Information System
Interoperability IFC Industry Foundation Classes COBie Construction Operations Building Information Exchange MVD Model View Definition
Workflow Systems ERP Enterprise Resource Planning IWMS Integrated Workplace Management System CAFM Computer-Aided Facility Management CMMS Computerized Maintenance Management System
Facilities Intelligent Systems
BAS Building Automation System BMS Building Management System IB Intelligent Buildings BEMS Building Energy Management System
Sensor, Mobil and Real Time Location system
GPS Global Positioning System LAN Local Area Network Wi-Fi Local Area Wireless Network RFID Radio-Frequency Identification CCTV Closed-Circuit Television (or video surveillance) AR Augmented Reality AV Augmented Virtuality MAR Mobile Augmented Reality RTLS Real-Time Location System PIR Passive Infrared VO Virtual Organisation NFC Near Field Communication SMS Short Message Service WSN Wireless Sensor Network WWW World Wide Web
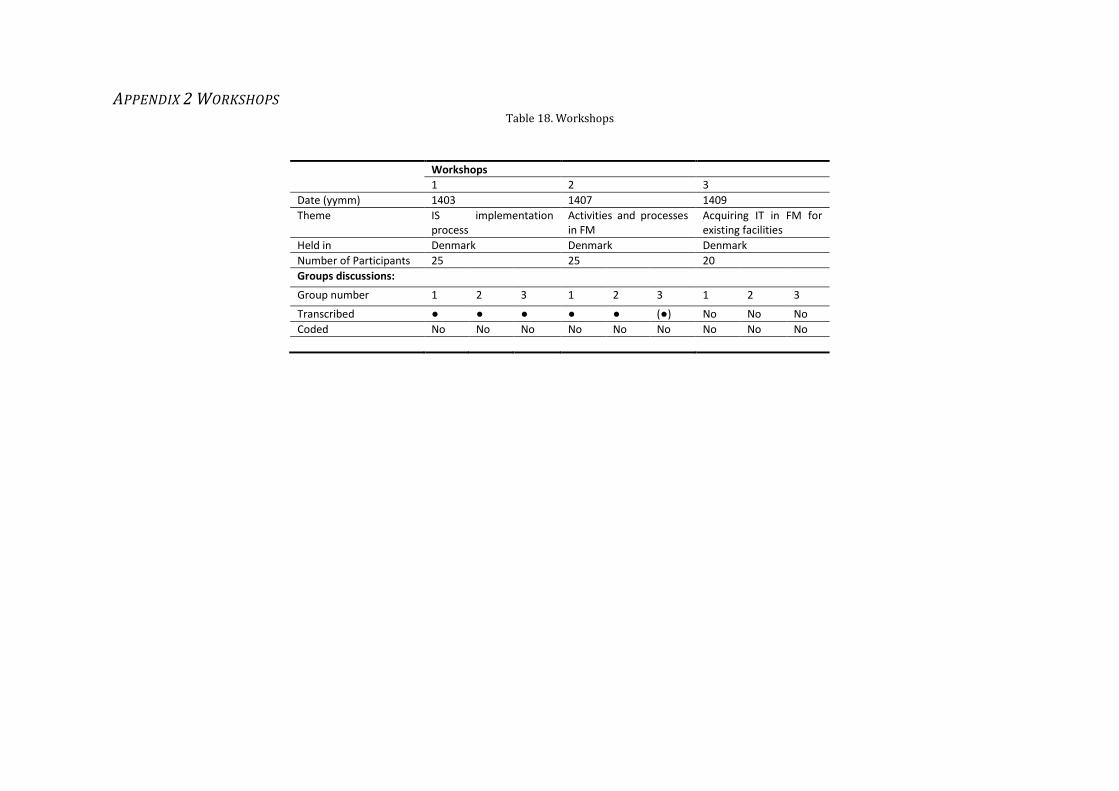
APPENDIX 2 WORKSHOPS Table 18. Workshops
Workshops 1 2 3 Date (yymm) 1403 1407 1409 Theme IS implementation
process Activities and processes in FM
Acquiring IT in FM for existing facilities
Held in Denmark Denmark Denmark Number of Participants 25 25 20 Groups discussions:
Group number 1 2 3 1 2 3 1 2 3
Transcribed ● ● ● ● ● (●) No No No Coded No No No No No No No No No
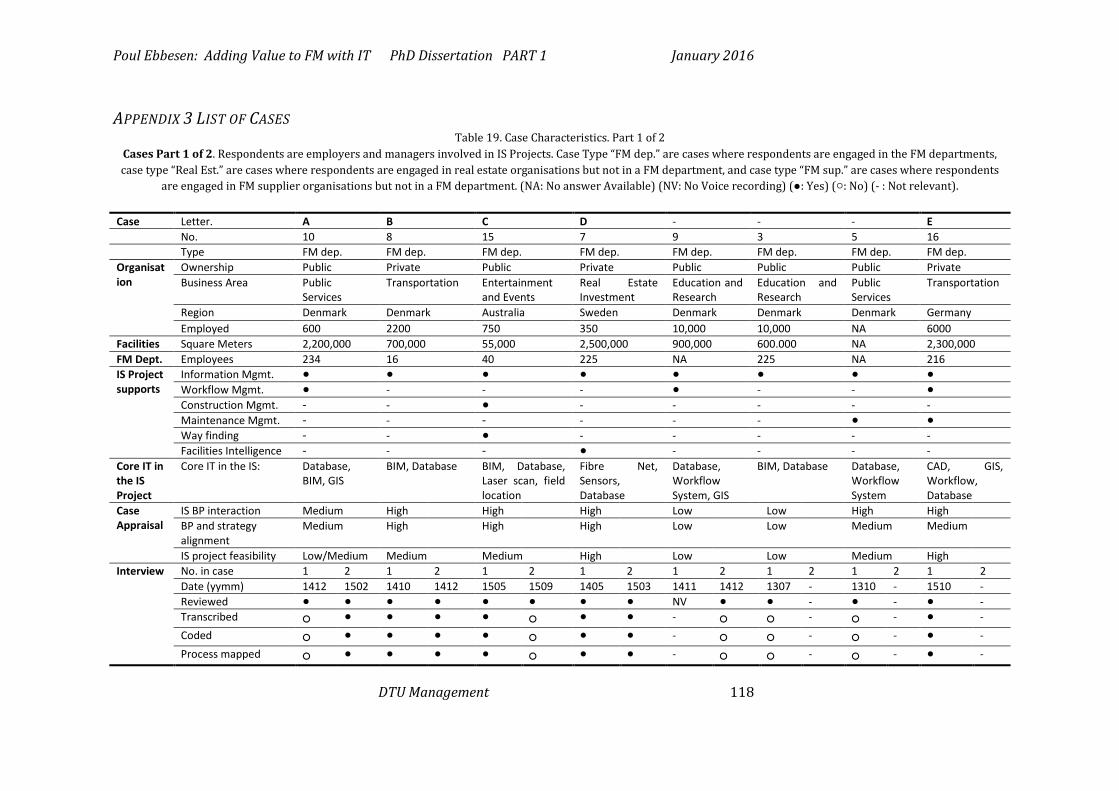
Poul Ebbesen: Adding Value to FM with IT PhD Dissertation PART 1 January 2016
DTU Management 118
APPENDIX 3 LIST OF CASES Table 19. Case Characteristics. Part 1 of 2
Cases Part 1 of 2. Respondents are employers and managers involved in IS Projects. Case Type “FM dep.” are cases where respondents are engaged in the FM departments, case type “Real Est.” are cases where respondents are engaged in real estate organisations but not in a FM department, and case type “FM sup.” are cases where respondents
are engaged in FM supplier organisations but not in a FM department. (NA: No answer Available) (NV: No Voice recording) (●: Yes) (○: No) (- : Not relevant). Case Letter. A B C D - - - E No. 10 8 15 7 9 3 5 16 Type FM dep. FM dep. FM dep. FM dep. FM dep. FM dep. FM dep. FM dep. Organisation
Ownership Public Private Public Private Public Public Public Private Business Area Public
Services Transportation Entertainment
and Events Real Estate Investment
Education and Research
Education and Research
Public Services
Transportation
Region Denmark Denmark Australia Sweden Denmark Denmark Denmark Germany Employed 600 2200 750 350 10,000 10,000 NA 6000
Facilities Square Meters 2,200,000 700,000 55,000 2,500,000 900,000 600.000 NA 2,300,000 FM Dept. Employees 234 16 40 225 NA 225 NA 216 IS Project supports
Information Mgmt. ● ● ● ● ● ● ● ● Workflow Mgmt. ● - - - ● - - ● Construction Mgmt. - - ● - - - - - Maintenance Mgmt. - - - - - - ● ● Way finding - - ● - - - - - Facilities Intelligence - - - ● - - - -
Core IT in the IS Project
Core IT in the IS: Database, BIM, GIS
BIM, Database BIM, Database, Laser scan, field location
Fibre Net, Sensors, Database
Database, Workflow System, GIS
BIM, Database Database, Workflow System
CAD, GIS, Workflow, Database
Case Appraisal
IS BP interaction Medium High High High Low Low High High BP and strategy alignment
Medium High High High Low Low Medium Medium
IS project feasibility Low/Medium Medium Medium High Low Low Medium High Interview No. in case 1 2 1 2 1 2 1 2 1 2 1 2 1 2 1 2
Date (yymm) 1412 1502 1410 1412 1505 1509 1405 1503 1411 1412 1307 - 1310 - 1510 - Reviewed ● ● ● ● ● ● ● ● NV ● ● - ● - ● - Transcribed ○ ● ● ● ● ○ ● ● - ○ ○ - ○ - ● - Coded ○ ● ● ● ● ○ ● ● - ○ ○ - ○ - ● - Process mapped ○ ● ● ● ● ○ ● ● - ○ ○ - ○ - ● -
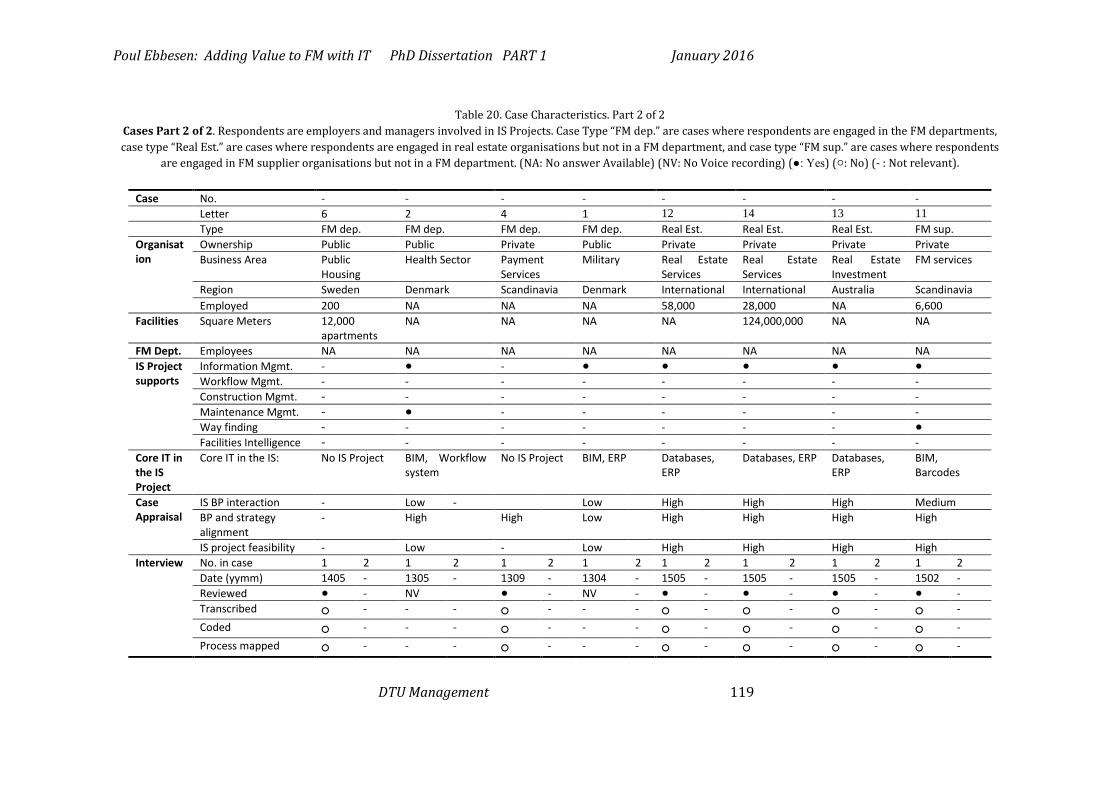
Poul Ebbesen: Adding Value to FM with IT PhD Dissertation PART 1 January 2016
DTU Management 119
Table 20. Case Characteristics. Part 2 of 2 Cases Part 2 of 2. Respondents are employers and managers involved in IS Projects. Case Type “FM dep.” are cases where respondents are engaged in the FM departments, case type “Real Est.” are cases where respondents are engaged in real estate organisations but not in a FM department, and case type “FM sup.” are cases where respondents
are engaged in FM supplier organisations but not in a FM department. (NA: No answer Available) (NV: No Voice recording) (●: Yes) (○: No) (- : Not relevant).
Case No. - - - - - - - - Letter 6 2 4 1 12 14 13 11 Type FM dep. FM dep. FM dep. FM dep. Real Est. Real Est. Real Est. FM sup. Organisation
Ownership Public Public Private Public Private Private Private Private Business Area Public
Housing Health Sector Payment
Services Military Real Estate
Services Real Estate Services
Real Estate Investment
FM services
Region Sweden Denmark Scandinavia Denmark International International Australia Scandinavia Employed 200 NA NA NA 58,000 28,000 NA 6,600
Facilities Square Meters 12,000 apartments
NA NA NA NA 124,000,000 NA NA
FM Dept. Employees NA NA NA NA NA NA NA NA IS Project supports
Information Mgmt. - ● - ● ● ● ● ● Workflow Mgmt. - - - - - - - - Construction Mgmt. - - - - - - - - Maintenance Mgmt. - ● - - - - - - Way finding - - - - - - - ● Facilities Intelligence - - - - - - - -
Core IT in the IS Project
Core IT in the IS: No IS Project BIM, Workflow system
No IS Project BIM, ERP Databases, ERP
Databases, ERP Databases, ERP
BIM, Barcodes
Case Appraisal
IS BP interaction - Low - Low High High High Medium BP and strategy alignment
- High High Low High High High High
IS project feasibility - Low - Low High High High High Interview No. in case 1 2 1 2 1 2 1 2 1 2 1 2 1 2 1 2
Date (yymm) 1405 - 1305 - 1309 - 1304 - 1505 - 1505 - 1505 - 1502 - Reviewed ● - NV ● - NV - ● - ● - ● - ● - Transcribed ○ - - - ○ - - - ○ - ○ - ○ - ○ - Coded ○ - - - ○ - - - ○ - ○ - ○ - ○ - Process mapped ○ - - - ○ - - - ○ - ○ - ○ - ○ -
Poul Ebbesen: Adding Value to FM with IT PhD Dissertation PART 1 January 2016
DTU Management 120
APPENDIX 4 INTERVIEW GUIDE AND QUESTIONS
Intro
The interview is split in four parts: 1. Survey Questionnaires with detailed questions 2. Questions regarding IT in use 3. Questions regarding a main IT implementation case 4. Final questions
Bring: Voice recorder This questionnaire
1. Survey Questionnaire with focus on quantitative information
Before the interview the respondents have been asked to answer a web survey questionnaire with focus on more quantitative information about them self, their department, their organisation, the use of information technology and systems in their department, and information technology and systems currently being implemented in their department. Alternatively the web survey questionnaire is introduced in the first part of the meeting so the respondents can answer the survey questionnaire after completion of the interview.
4 Finale questions
After the interview the respondents are asked to answer some general questions regarding: • Other relevant people to talk to (SCOT) • If they will show how they use some of the IT in the FM organisation • If pictures may be taken • If they may be contacted again • Please complete the survey questionnaire
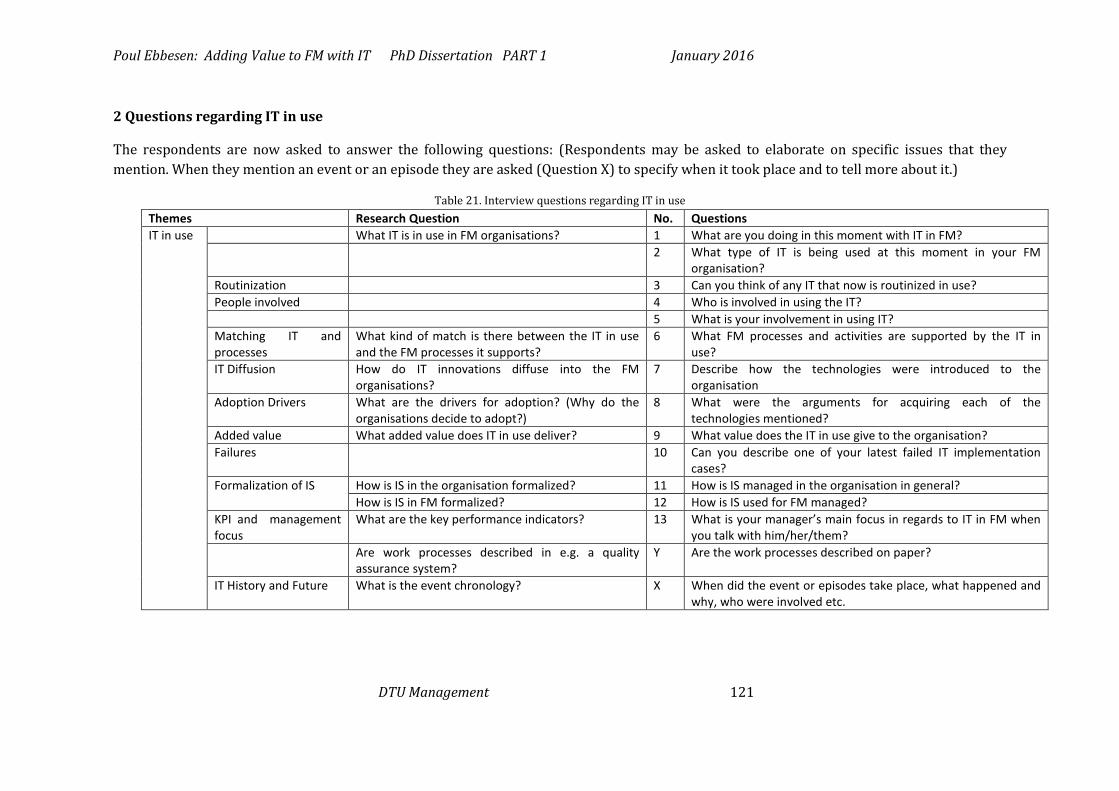
Poul Ebbesen: Adding Value to FM with IT PhD Dissertation PART 1 January 2016
DTU Management 121
2 Questions regarding IT in use
The respondents are now asked to answer the following questions: (Respondents may be asked to elaborate on specific issues that they mention. When they mention an event or an episode they are asked (Question X) to specify when it took place and to tell more about it.)
Table 21. Interview questions regarding IT in use Themes Research Question No. Questions IT in use What IT is in use in FM organisations? 1 What are you doing in this moment with IT in FM?
2 What type of IT is being used at this moment in your FM organisation?
Routinization 3 Can you think of any IT that now is routinized in use? People involved 4 Who is involved in using the IT? 5 What is your involvement in using IT? Matching IT and processes
What kind of match is there between the IT in use and the FM processes it supports?
6 What FM processes and activities are supported by the IT in use?
IT Diffusion How do IT innovations diffuse into the FM organisations?
7 Describe how the technologies were introduced to the organisation
Adoption Drivers What are the drivers for adoption? (Why do the organisations decide to adopt?)
8 What were the arguments for acquiring each of the technologies mentioned?
Added value What added value does IT in use deliver? 9 What value does the IT in use give to the organisation? Failures 10 Can you describe one of your latest failed IT implementation
cases? Formalization of IS How is IS in the organisation formalized? 11 How is IS managed in the organisation in general?
How is IS in FM formalized? 12 How is IS used for FM managed? KPI and management focus
What are the key performance indicators? 13 What is your manager’s main focus in regards to IT in FM when you talk with him/her/them?
Are work processes described in e.g. a quality assurance system?
Y Are the work processes described on paper?
IT History and Future What is the event chronology? X When did the event or episodes take place, what happened and why, who were involved etc.
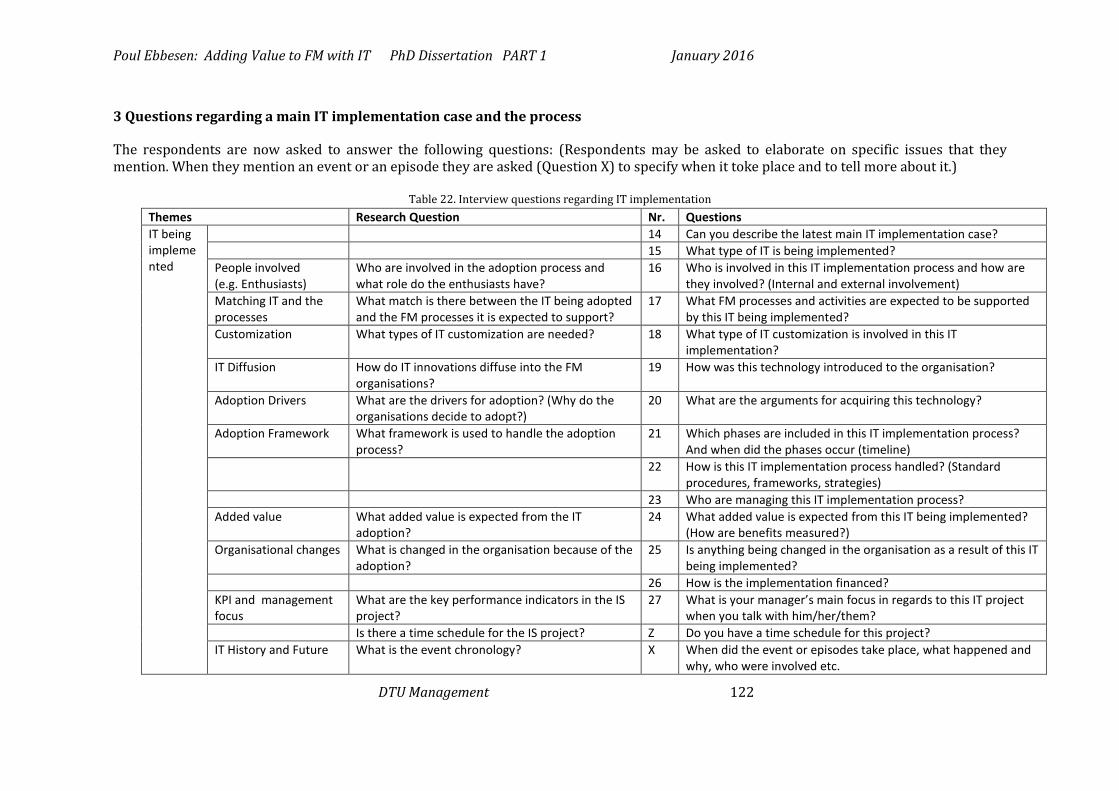
Poul Ebbesen: Adding Value to FM with IT PhD Dissertation PART 1 January 2016
DTU Management 122
3 Questions regarding a main IT implementation case and the process
The respondents are now asked to answer the following questions: (Respondents may be asked to elaborate on specific issues that they mention. When they mention an event or an episode they are asked (Question X) to specify when it toke place and to tell more about it.)
Table 22. Interview questions regarding IT implementation Themes Research Question Nr. Questions IT being implemented
14 Can you describe the latest main IT implementation case? 15 What type of IT is being implemented? People involved (e.g. Enthusiasts)
Who are involved in the adoption process and what role do the enthusiasts have?
16 Who is involved in this IT implementation process and how are they involved? (Internal and external involvement)
Matching IT and the processes
What match is there between the IT being adopted and the FM processes it is expected to support?
17 What FM processes and activities are expected to be supported by this IT being implemented?
Customization What types of IT customization are needed?
18 What type of IT customization is involved in this IT implementation?
IT Diffusion How do IT innovations diffuse into the FM organisations?
19 How was this technology introduced to the organisation?
Adoption Drivers What are the drivers for adoption? (Why do the organisations decide to adopt?)
20 What are the arguments for acquiring this technology?
Adoption Framework What framework is used to handle the adoption process?
21 Which phases are included in this IT implementation process? And when did the phases occur (timeline)
22 How is this IT implementation process handled? (Standard procedures, frameworks, strategies)
23 Who are managing this IT implementation process? Added value What added value is expected from the IT
adoption? 24 What added value is expected from this IT being implemented?
(How are benefits measured?) Organisational changes What is changed in the organisation because of the
adoption? 25 Is anything being changed in the organisation as a result of this IT
being implemented? 26 How is the implementation financed? KPI and management focus
What are the key performance indicators in the IS project?
27 What is your manager’s main focus in regards to this IT project when you talk with him/her/them?
Is there a time schedule for the IS project? Z Do you have a time schedule for this project? IT History and Future What is the event chronology? X When did the event or episodes take place, what happened and
why, who were involved etc.
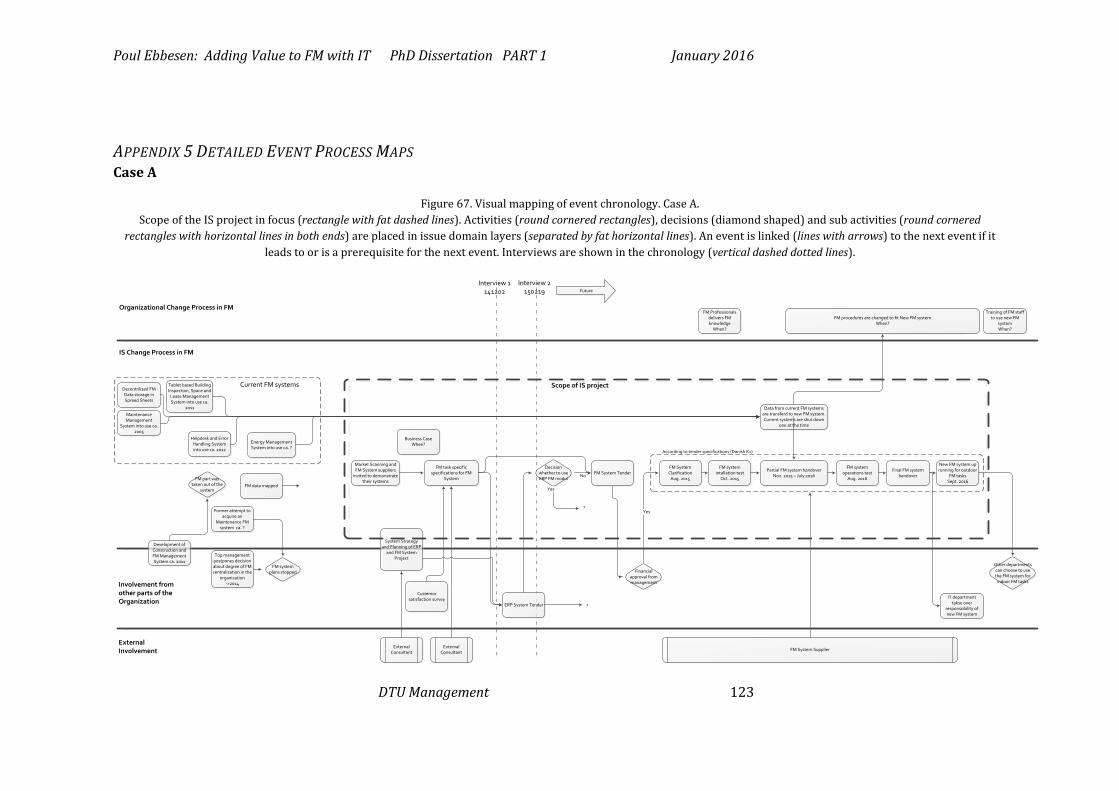
Poul Ebbesen: Adding Value to FM with IT PhD Dissertation PART 1 January 2016
DTU Management 123
APPENDIX 5 DETAILED EVENT PROCESS MAPS Case A
Figure 67. Visual mapping of event chronology. Case A. Scope of the IS project in focus (rectangle with fat dashed lines). Activities (round cornered rectangles), decisions (diamond shaped) and sub activities (round cornered
rectangles with horizontal lines in both ends) are placed in issue domain layers (separated by fat horizontal lines). An event is linked (lines with arrows) to the next event if it leads to or is a prerequisite for the next event. Interviews are shown in the chronology (vertical dashed dotted lines).
Market Scanning and FM System suppliers
invited to demonstrate their systems
FM task specific specifications for FM
System
External Consultant
FM data mapped
FM System TenderFM System Clarification
Aug. 2015
FM System Supplier
Interview 2 150219
Custemor satisfaction survey
Former attempt to acquire an
Maintenance FM system ca. ?
Top management postpones decision about degree of FM centralization in the
organization ->2014
FM system plans stopped
New FM system up running for outdoor
FM tasksSept. 2016
Other departments can choose to use the FM system for
indoor FM tasks
Maintenance Management
System into use ca. 2005
Tablet based Building Inspection, Space and
Lease Management System into use ca.
2011
Helpdesk and Error Handling System into use ca. 2012
Energy Management System into use ca. ?
Development of Construction and FM Management System ca. 2011
FM part was taken out of the
system
FutureInterview 1
141202
Involvement from other parts of the Organization
External Involvement
ERP System Tender
System Strategy and Planning of ERP
and FM System Project
External Consultant
Decision whether to use ERP FM modul
No
Yes
Financial approval from management
Yes
FM procedures are changed to fit New FM system When?
Scope of IS projectDecentrilized FM Data storage in Spreed Sheets
IS Change Process in FM
Organizational Change Process in FMFM Professionals
delivers FM knowledge
When?
Data from current FM systems are transferd to new FM system. Current systems are shut down
one at the time
Current FM systems
FM system intallation test
Oct. 2015
Partial FM system handover Nov. 2015 – July 2016
FM system operations test
Aug. 2016
Final FM system handover
?
?
According to tender specifications (Danish K1)
Training of FM staff to use new FM
systemWhen?
IT department takse over
responsobility of new FM system
Business Case When?
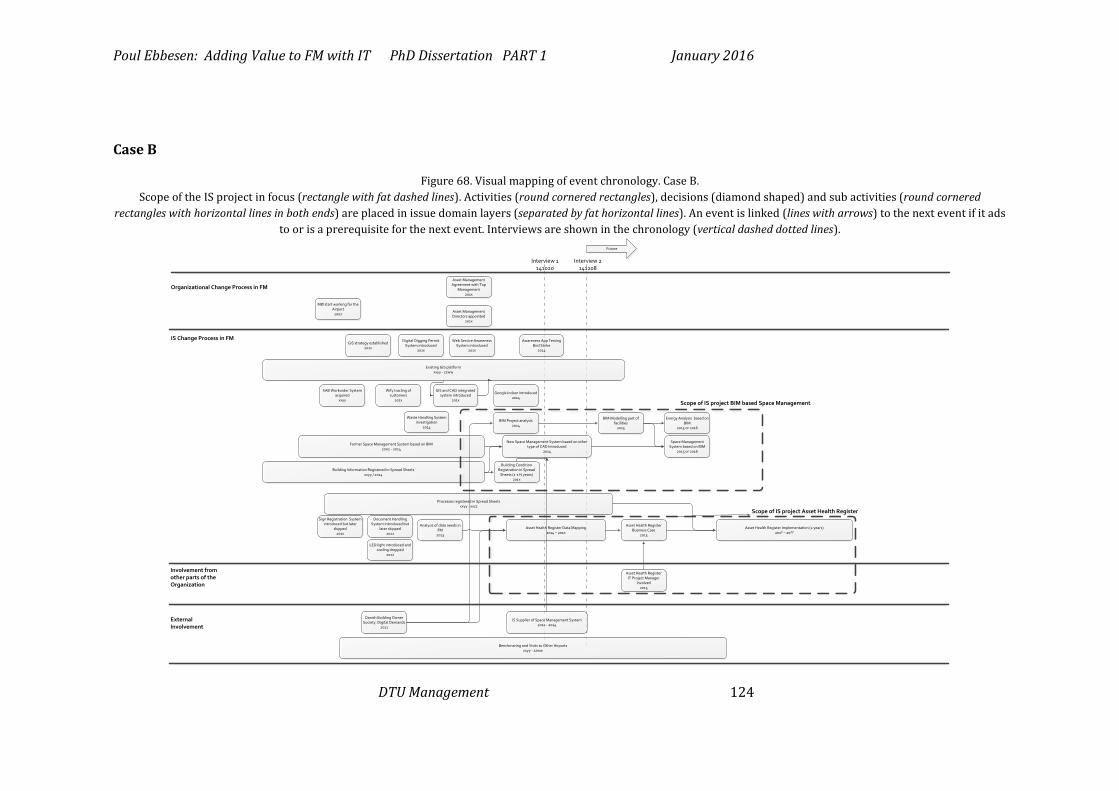
Poul Ebbesen: Adding Value to FM with IT PhD Dissertation PART 1 January 2016
DTU Management 124
Case B
Figure 68. Visual mapping of event chronology. Case B. Scope of the IS project in focus (rectangle with fat dashed lines). Activities (round cornered rectangles), decisions (diamond shaped) and sub activities (round cornered
rectangles with horizontal lines in both ends) are placed in issue domain layers (separated by fat horizontal lines). An event is linked (lines with arrows) to the next event if it ads to or is a prerequisite for the next event. Interviews are shown in the chronology (vertical dashed dotted lines).
Future
Interview 1 141020
Involvement from other parts of the Organization
External Involvement
IS Change Process in FM
Organizational Change Process in FM
Scope of IS project Asset Health Register
BIM Project analysis 2014
Interview 2141208
SAB Workorder System acquired
xxyy
Processes registered in Spread Sheets xxyy - xxzz
Asset Health Register Implementation (2 years)201? – 20??
Asset Management Directors appointed
201x
Asset Management Agreement with Top
Management 201x
GIS and CAD integrated system introduced
201x
Asset Health Register Business Case
2015
Asset Health Register IT Project Manager
Involved2015
Asset Health Register Data Mapping2014 – 201x
Analysis of data needs in FM
2013
GIS strategy established201x
BIM Modelling part of facilities
2015
Wify tracling of customers
201x
Google Indoor introduced2014
Danish Building Owner Society. Digital Demands
2011
New Space Management System based on other type of CAD Introduced
2014
Space Management System based on BIM
2015 or 2016
LED light introduced and cooling dropped
2012
Energy Analysis based on BIM
2015 or 2016
Building Information Registered in Spread Sheetsxxyy / 2014
Digital Digging Permit System introduced
201x
Web Service Awareness System introduced
201x
Former Space Management System based on BIM2002 - 2014
Existing GIS platform xxyy - zzww
Awareness App Testing Bird Strike
2014
Scope of IS project BIM based Space Management
Waste Handling System investigation
2014
Benchmaring and Visits to Other Airportsxxyy - zzww
Document Handling System introduced but
later skipped 2012
Sign Registration System introduced but later
skipped 201x
Building Condition Registration in Spread
Sheets (1-1½ years) 201x
MØ start working for the Airport
2007
IS Supplier of Space Management System201x - 2014
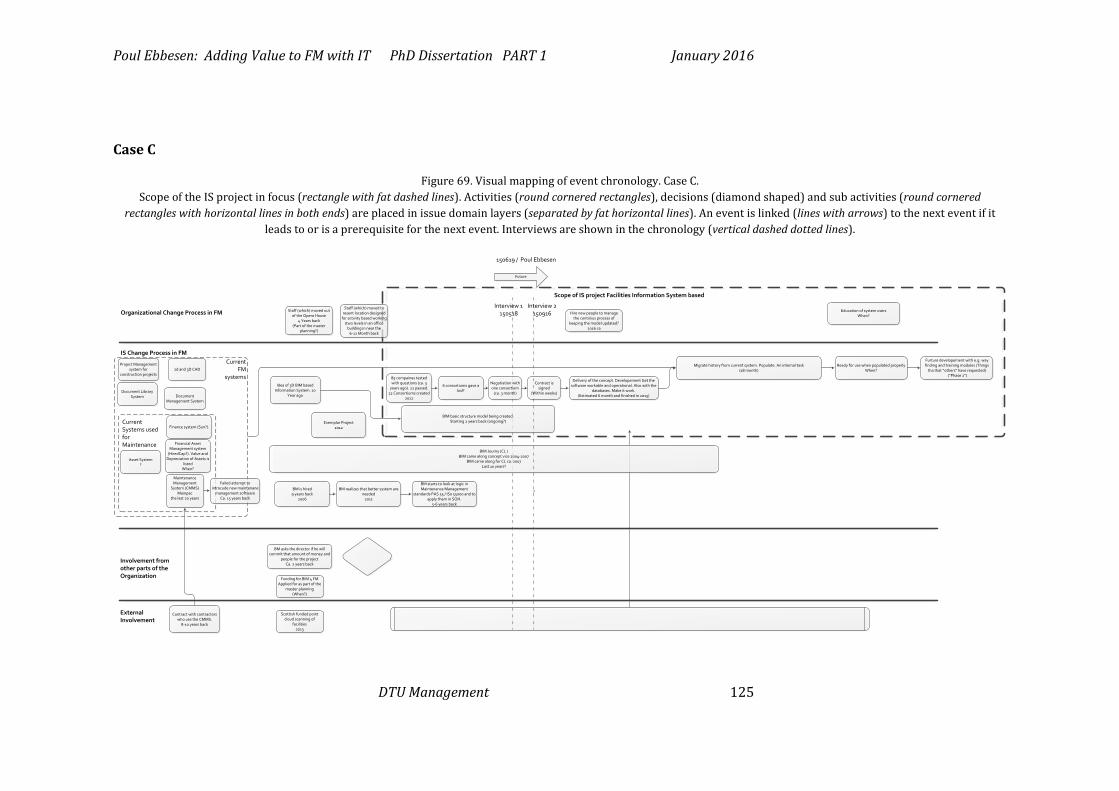
Poul Ebbesen: Adding Value to FM with IT PhD Dissertation PART 1 January 2016
DTU Management 125
Case C
Figure 69. Visual mapping of event chronology. Case C. Scope of the IS project in focus (rectangle with fat dashed lines). Activities (round cornered rectangles), decisions (diamond shaped) and sub activities (round cornered
rectangles with horizontal lines in both ends) are placed in issue domain layers (separated by fat horizontal lines). An event is linked (lines with arrows) to the next event if it leads to or is a prerequisite for the next event. Interviews are shown in the chronology (vertical dashed dotted lines).
150619 / Poul Ebbesen
Idea of 3D BIM based Information System. 10
Year ago
Maintenance Management
System (CMMS) Mainpac
the last 20 years
Document Management System
Finance system (Sun?).
Future
Interview 1 150518
Involvement from other parts of the Organization
External Involvement
BM starts to look at logic in Maintenance Management
standards PAS 55 / IS0 55000 and to apply them in SOH.
5-6 years back
Scope of IS project Facilities Information System based
Document Library System
IS Change Process in FM
Organizational Change Process in FM
Negotiation with one consortium
(ca. 3 month)
Current FM
systems
?
Ready for use when populated properly When?2d and 3D CAD
6 consortiums gave a bid?
Financial Asset Management system
(HiredCap?). Value and Depreciation of Assets is
listed When?
Delivery of the concept. Developement Get the software workable and operational. Also with the
databases. Make it work.(Estimated 6 month and finished in 2015)
Contract with contractors who use the CMMS.
8-10 years back
Education of system usersWhen?
BIM Journy (CL )BIM came along concept vice 2004-2007
BIM came along for CL ca. 2007Last 10 years?
Migrate history from current system. Populate. An internal task(18 month)
Project Management system for
construction projects
Current Systems used for Maintenance
BM is hired 9 years back
2006
BM realizes that better system are needed
2011
85 compaines tested with questions (ca. 3
years ago). 22 passed. 12 Consortiums created
2012
BM asks the director if he will commit that amount of money and
people for the projectCa. 2 years back
Hire new people to manage the continius process of
keeping the model updated?2016 ca
Failed attempt to introcude new maintenane
management software Ca. 15 years back
Staff (which) moved out of the Opera House
4 Years back(Part of the master
planning?)
Asset System ?
Contract is signed
(Within weeks)
Furture developement with e.g. way finding and training modules (Things
tha that ”others” have requested) (”Phase 2")
Staff (which) moved to resent location designed
for activity based working (two levels in an office
building in near the 6-12 Month back
BIM basic structure model being created. Starting 2 years back (ongoing?)
Funding for BIM 4 FM Applied for as part of the
master planning(When?)
Exemplar Project 2012
Scottish funded point cloud scanning of
facilities2013
Interview 2 150916
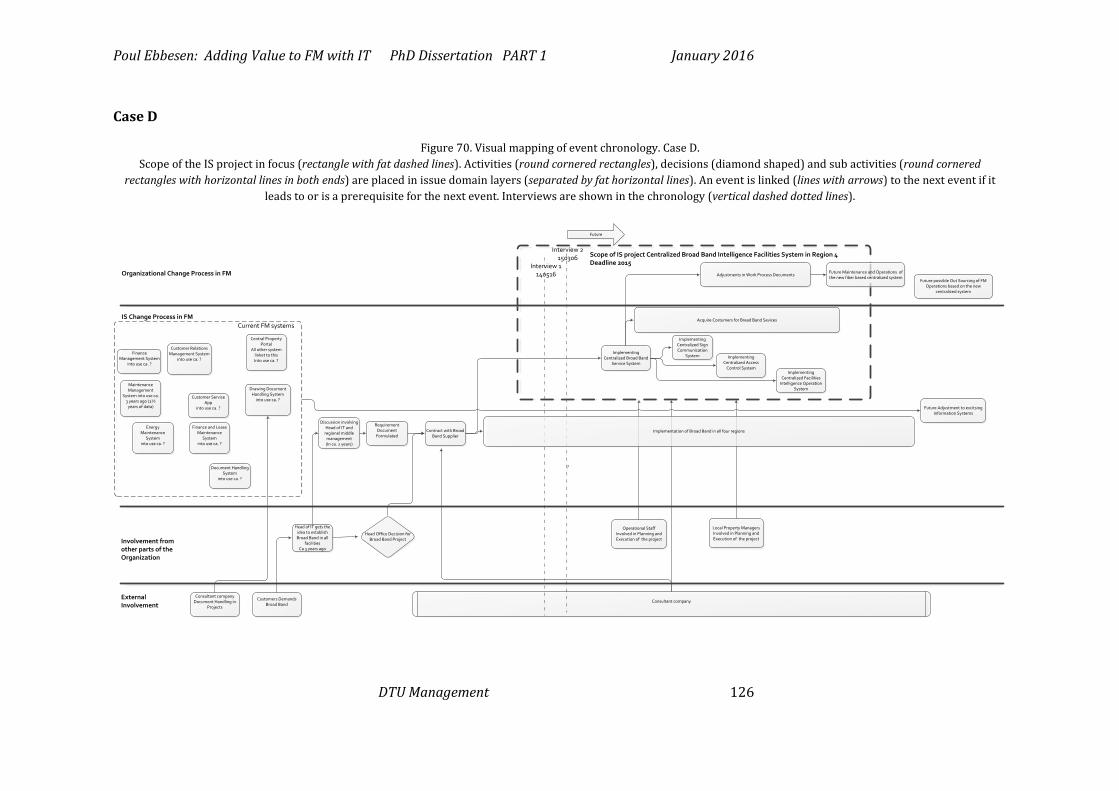
Poul Ebbesen: Adding Value to FM with IT PhD Dissertation PART 1 January 2016
DTU Management 126
Case D
Figure 70. Visual mapping of event chronology. Case D. Scope of the IS project in focus (rectangle with fat dashed lines). Activities (round cornered rectangles), decisions (diamond shaped) and sub activities (round cornered
rectangles with horizontal lines in both ends) are placed in issue domain layers (separated by fat horizontal lines). An event is linked (lines with arrows) to the next event if it leads to or is a prerequisite for the next event. Interviews are shown in the chronology (vertical dashed dotted lines).
Consultant company
Interview 2 150306
Operational StaffInvolved in Planning and Execution of the project
Requirement Document
Formulated
Maintenance Management
System into use ca. 3 years ago (2½
years of data)
Customer Relations Management System
into use ca. ?
Customer Service App
into use ca. ?
Drawing Document Handling System
into use ca. ?
Consultant company Document Handling in
Projects
Future
Interview 1 140516
Involvement from other parts of the Organization
External Involvement
Head of IT gets the idea to establish Broad Band in all
facilitiesCa 3 years ago
Scope of IS project Centralized Broad Band Intelligence Facilities System in Region 4Deadline 2015
Finance Management System
into use ca. ?
IS Change Process in FM
Organizational Change Process in FM
Implementing Centralized Sign Communication
System
Future Adjustment to excitsing Information Systems
Current FM systems
?
Future possible Out Sourcing of FM Operations based on the new
centralized system
Central Property Portal
All other system linket to this Into use ca. ?
Energy Maintenance
System into use ca. ?
Finance and Lease Maintenance
System into use ca. ?
Document Handling System
into use ca. ?
Implementing Centralized Facilities
Intelligence Operation System
Implementing Centralized Broad Band
Service System
Customers Demands Broad Band
Implementing Centralized Access
Control System
Head Office Decision for Broad Band Project
Contract with Broad Band Supplier
Local Property Managers Involved in Planning and Execution of the project
Future Maintenance and Operations of the new fiber based centralized system
Adjustments in Work Process Documents
Implementation of Broad Band in all four regions
Discussion involving Head of IT and
regional middle management (In ca. 2 years)
Acquire Costumers for Bread Band Sevices
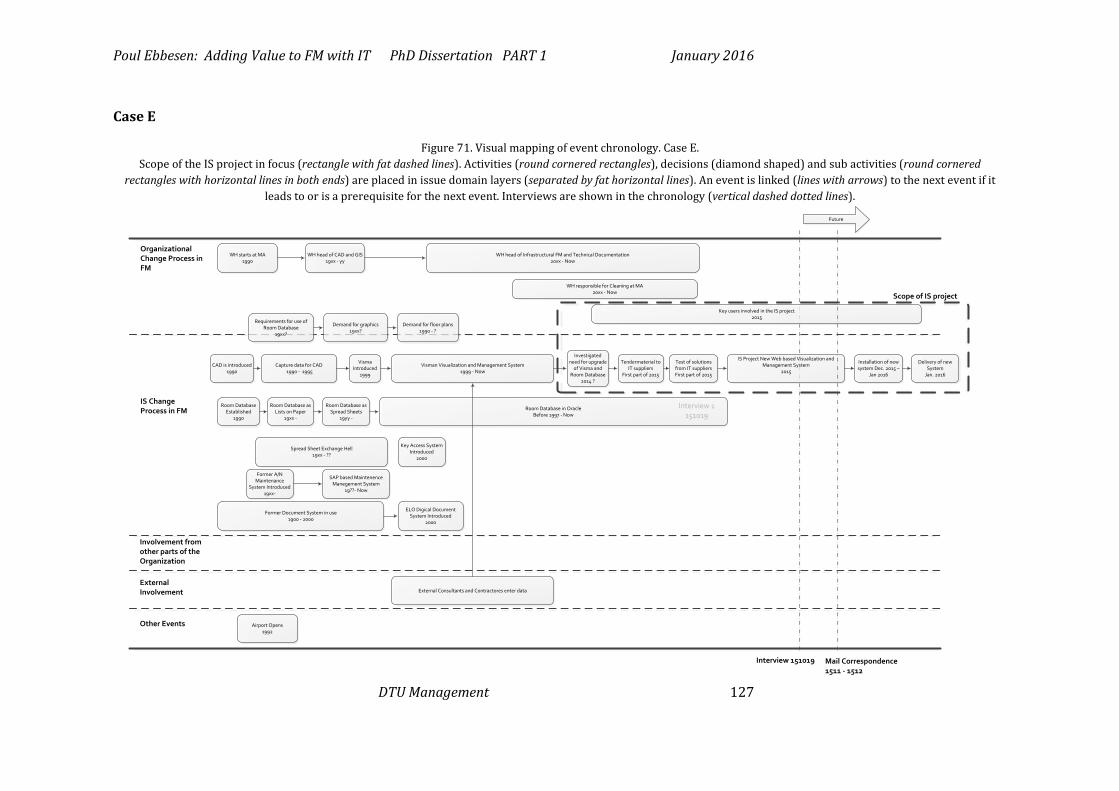
Poul Ebbesen: Adding Value to FM with IT PhD Dissertation PART 1 January 2016
DTU Management 127
Case E
Figure 71. Visual mapping of event chronology. Case E. Scope of the IS project in focus (rectangle with fat dashed lines). Activities (round cornered rectangles), decisions (diamond shaped) and sub activities (round cornered
rectangles with horizontal lines in both ends) are placed in issue domain layers (separated by fat horizontal lines). An event is linked (lines with arrows) to the next event if it leads to or is a prerequisite for the next event. Interviews are shown in the chronology (vertical dashed dotted lines).
Future
Interview 1 151019
Involvement from other parts of the Organization
External Involvement
Scope of IS project
IS Change Process in FM
Organizational Change Process in FM
CAD is introduced1990
WH starts at MA1990
Capture data for CAD 1990 - 1995
WH head of CAD and GIS19xx - yy
WH head of Infrastructural FM and Technical Documentation20xx - Now
WH responsible for Cleaning at MA20xx - Now
Tendermaterial to IT suppliers
First part of 2015
Room Database Established
1990
Room Database as Lists on Paper
19xx -
Room Database as Spread Sheets
19yy -
Room Database in OracleBefore 1997 - Now
Visman Visualization and Management System1999 - Now
Key Access System Introduced
2000
Spread Sheet Exchange Hell19xx - ??
Former Document System in use1900 - 2000
ELO Digical Document System Introduced
2000
External Consultants and Contractores enter data
Other Events Airport Opens1992
Demand for floor plans1990 - ?
Requirements for use of Room Database
19xx?
Demand for graphics19xx?
Investigated need for upgrade
of Visma and Room Database
2014 ?
IS Project New Web based Visualization and Management System
2015
Test of solutions from IT suppliers First part of 2015
Interview 151019
Delivery of new System
Jan. 2016
Installation of new system Dec. 2015 –
Jan 2016
Key users involved in the IS project2015
Visma Introduced
1999
Former A/N Maintenance
System Introduced19xx-
SAP based Maintenence Manegement System
19??- Now
Mail Correspondence 1511 - 1512
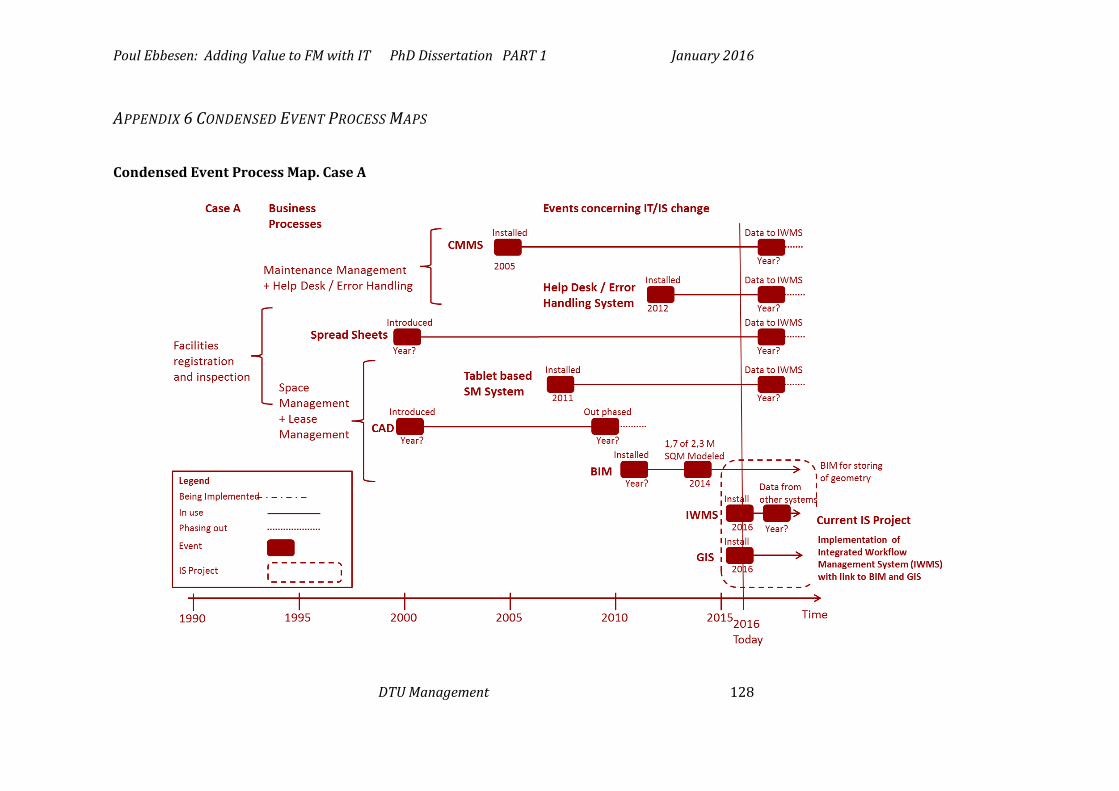
Poul Ebbesen: Adding Value to FM with IT PhD Dissertation PART 1 January 2016
DTU Management 128
APPENDIX 6 CONDENSED EVENT PROCESS MAPS
Condensed Event Process Map. Case A
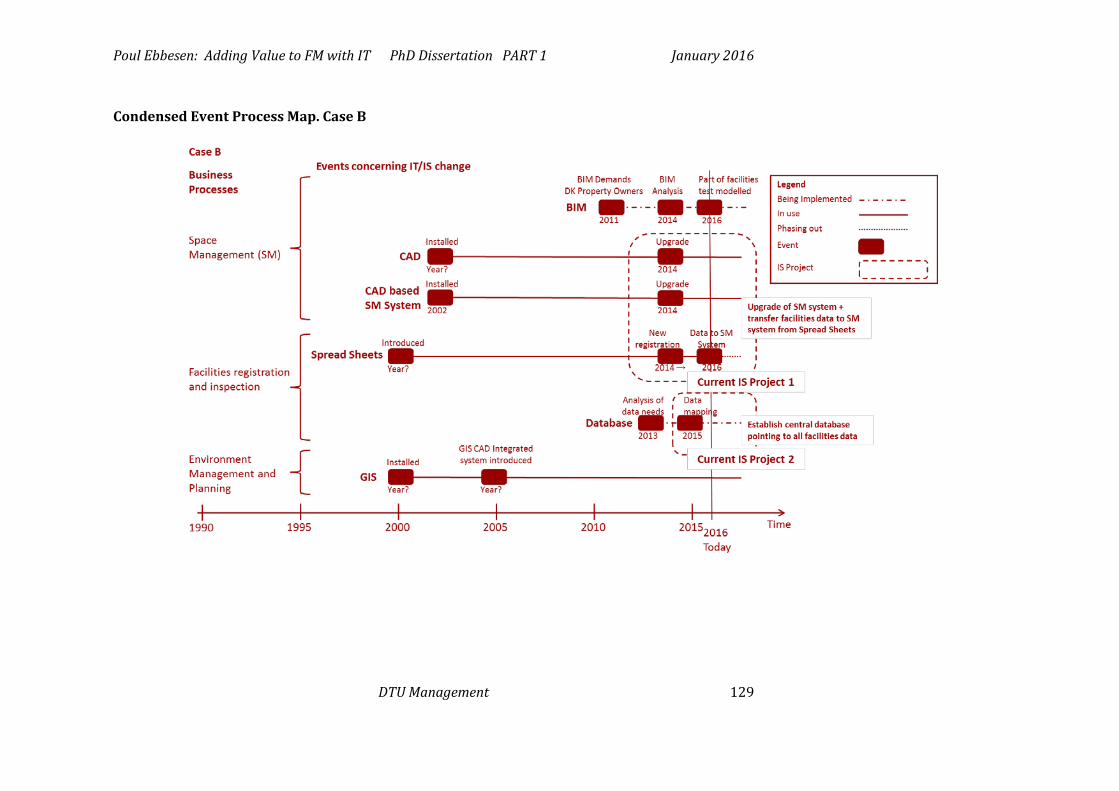
Poul Ebbesen: Adding Value to FM with IT PhD Dissertation PART 1 January 2016
DTU Management 129
Condensed Event Process Map. Case B
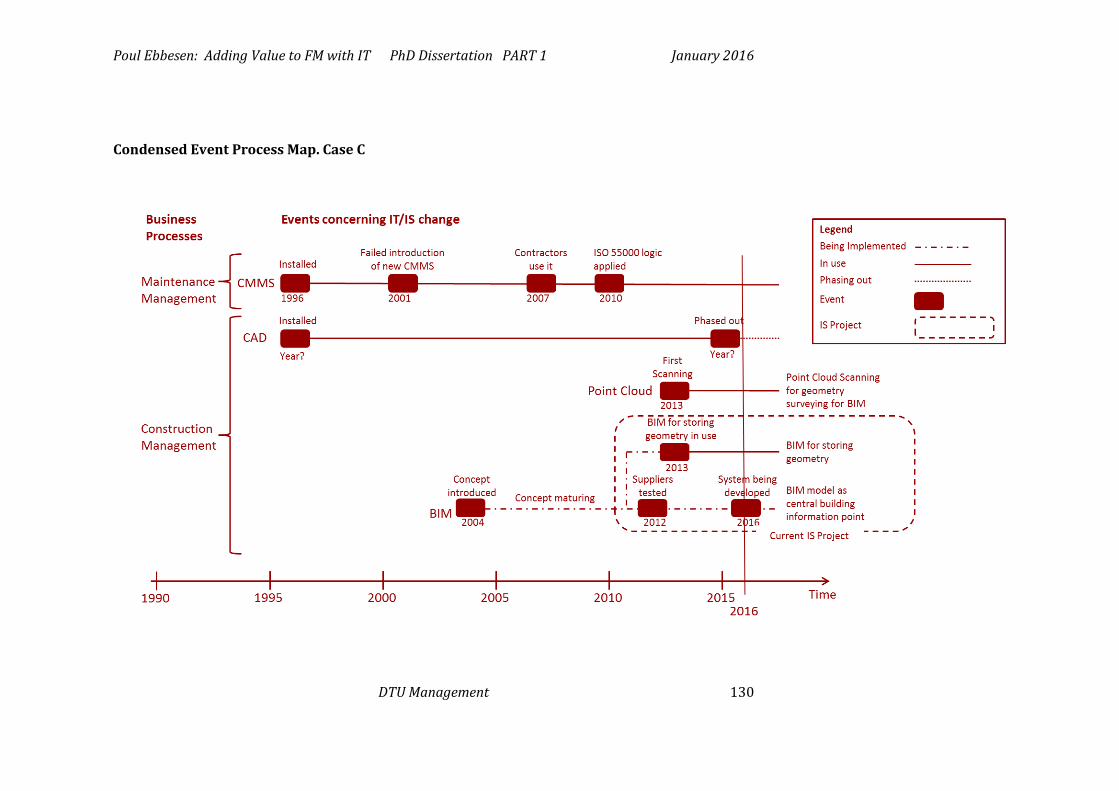
Poul Ebbesen: Adding Value to FM with IT PhD Dissertation PART 1 January 2016
DTU Management 130
Condensed Event Process Map. Case C

Poul Ebbesen: Adding Value to FM with IT PhD Dissertation PART 1 January 2016
DTU Management 131
Condensed Event Process Map. Case D
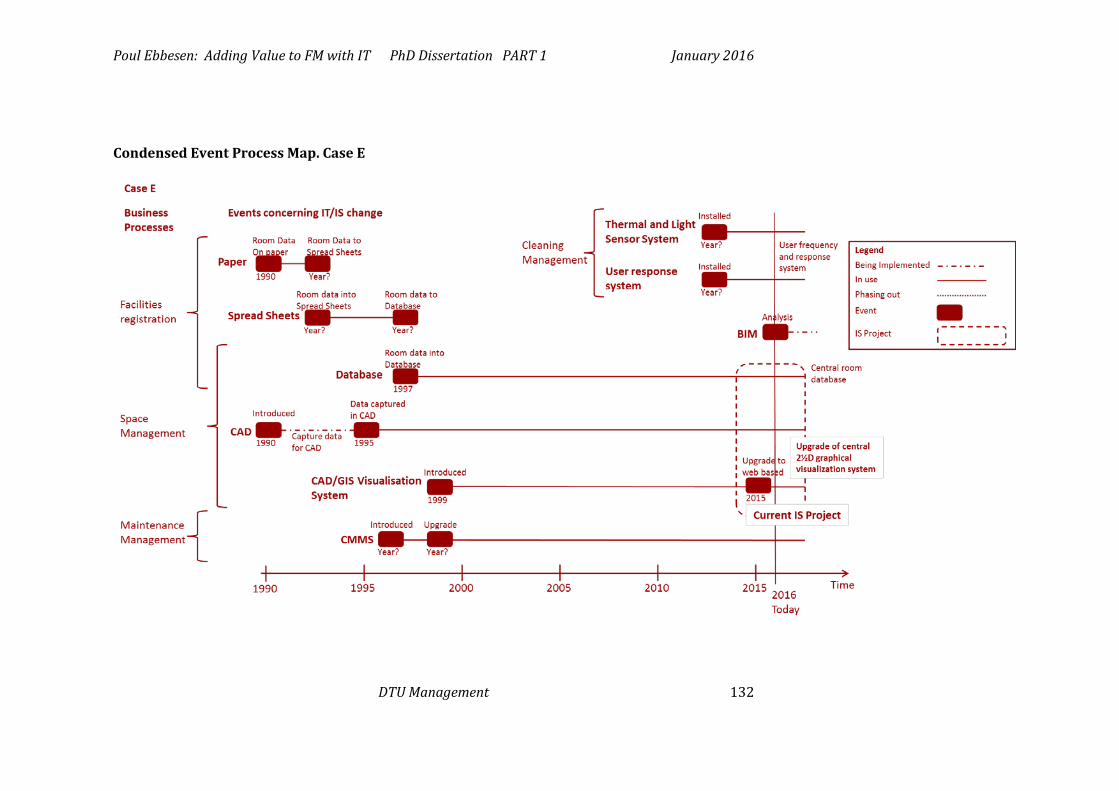
Poul Ebbesen: Adding Value to FM with IT PhD Dissertation PART 1 January 2016
DTU Management 132
Condensed Event Process Map. Case E
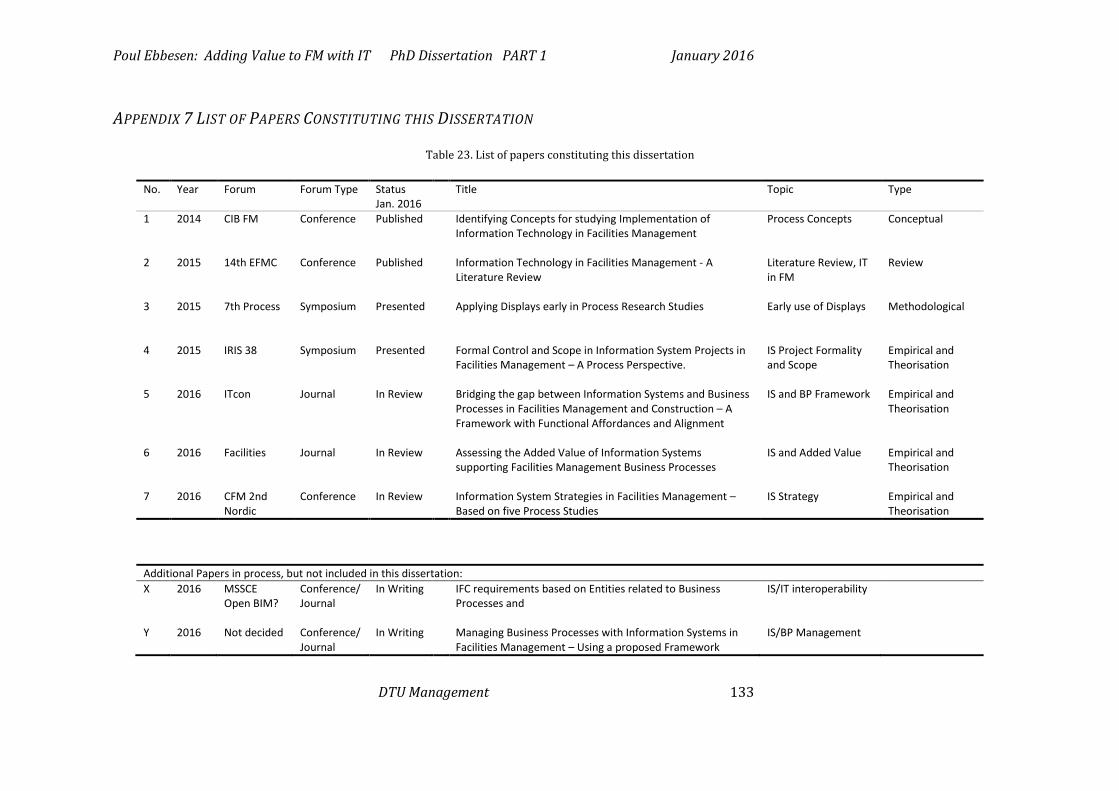
Poul Ebbesen: Adding Value to FM with IT PhD Dissertation PART 1 January 2016
DTU Management 133
APPENDIX 7 LIST OF PAPERS CONSTITUTING THIS DISSERTATION
Table 23. List of papers constituting this dissertation
No. Year Forum Forum Type Status Jan. 2016
Title Topic Type
1 2014 CIB FM Conference Published Identifying Concepts for studying Implementation of Information Technology in Facilities Management
Process Concepts Conceptual
2 2015 14th EFMC Conference Published Information Technology in Facilities Management - A Literature Review
Literature Review, IT in FM
Review
3 2015 7th Process Symposium Presented Applying Displays early in Process Research Studies
Early use of Displays Methodological
4 2015 IRIS 38 Symposium Presented Formal Control and Scope in Information System Projects in Facilities Management – A Process Perspective.
IS Project Formality and Scope
Empirical and Theorisation
5 2016 ITcon Journal In Review Bridging the gap between Information Systems and Business Processes in Facilities Management and Construction – A Framework with Functional Affordances and Alignment
IS and BP Framework Empirical and Theorisation
6 2016 Facilities Journal In Review Assessing the Added Value of Information Systems supporting Facilities Management Business Processes
IS and Added Value
Empirical and Theorisation
7 2016 CFM 2nd Nordic
Conference In Review
Information System Strategies in Facilities Management – Based on five Process Studies
IS Strategy Empirical and Theorisation
Additional Papers in process, but not included in this dissertation: X 2016 MSSCE
Open BIM? Conference/Journal
In Writing IFC requirements based on Entities related to Business Processes and
IS/IT interoperability
Y 2016 Not decided Conference/ Journal
In Writing Managing Business Processes with Information Systems in Facilities Management – Using a proposed Framework
IS/BP Management
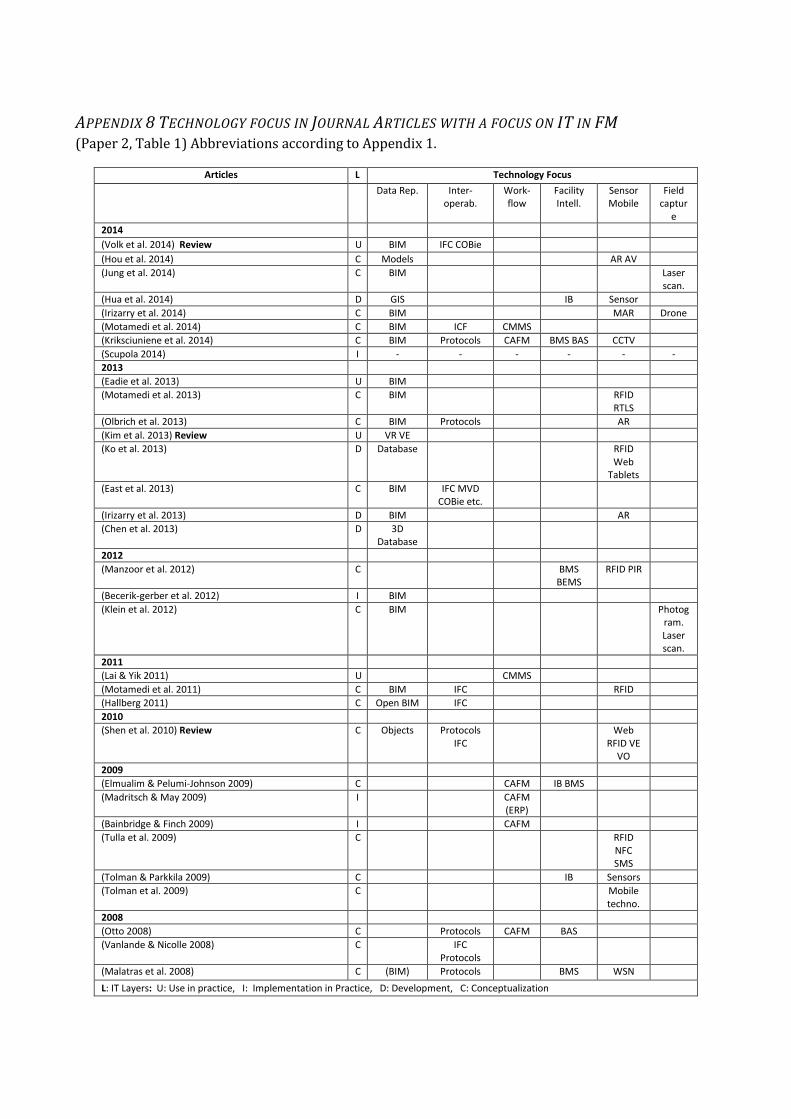
APPENDIX 8 TECHNOLOGY FOCUS IN JOURNAL ARTICLES WITH A FOCUS ON IT IN FM (Paper 2, Table 1) Abbreviations according to Appendix 1.
Articles L Technology Focus
Data Rep. Inter- operab.
Work-flow
Facility Intell.
Sensor Mobile
Field captur
e 2014 (Volk et al. 2014) Review U BIM IFC COBie (Hou et al. 2014) C Models AR AV (Jung et al. 2014) C BIM Laser
scan. (Hua et al. 2014) D GIS IB Sensor (Irizarry et al. 2014) C BIM MAR Drone (Motamedi et al. 2014) C BIM ICF CMMS (Kriksciuniene et al. 2014) C BIM Protocols CAFM BMS BAS CCTV (Scupola 2014) I - - - - - - 2013 (Eadie et al. 2013) U BIM (Motamedi et al. 2013) C BIM RFID
RTLS
(Olbrich et al. 2013) C BIM Protocols AR (Kim et al. 2013) Review U VR VE (Ko et al. 2013) D Database RFID
Web Tablets
(East et al. 2013) C BIM IFC MVD COBie etc.
(Irizarry et al. 2013) D BIM AR (Chen et al. 2013) D 3D
Database
2012 (Manzoor et al. 2012) C BMS
BEMS RFID PIR
(Becerik-gerber et al. 2012) I BIM (Klein et al. 2012) C BIM Photog
ram. Laser scan.
2011 (Lai & Yik 2011) U CMMS (Motamedi et al. 2011) C BIM IFC RFID (Hallberg 2011) C Open BIM IFC 2010 (Shen et al. 2010) Review C Objects Protocols
IFC Web
RFID VE VO
2009 (Elmualim & Pelumi-Johnson 2009) C CAFM IB BMS (Madritsch & May 2009) I
CAFM
(ERP)
(Bainbridge & Finch 2009) I CAFM (Tulla et al. 2009) C RFID
NFC SMS
(Tolman & Parkkila 2009) C IB Sensors (Tolman et al. 2009) C Mobile
techno.
2008 (Otto 2008) C Protocols CAFM BAS (Vanlande & Nicolle 2008) C IFC
Protocols
(Malatras et al. 2008) C (BIM) Protocols BMS WSN L: IT Layers: U: Use in practice, I: Implementation in Practice, D: Development, C: Conceptualization
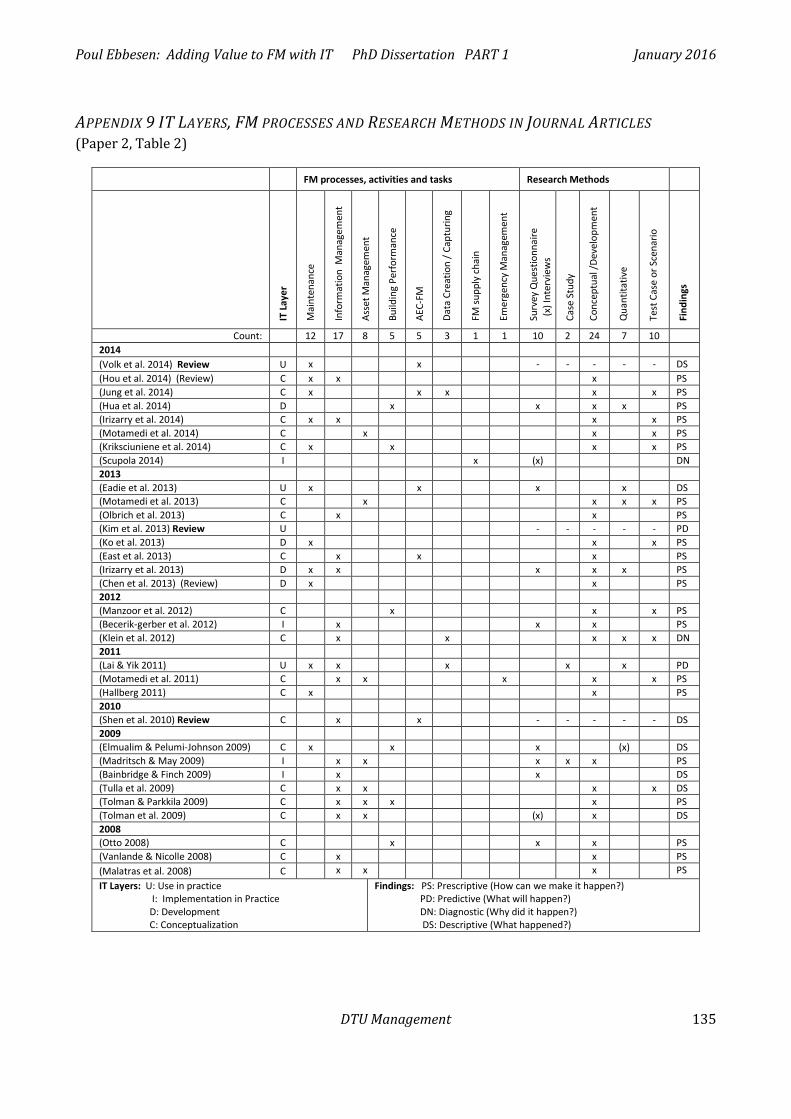
Poul Ebbesen: Adding Value to FM with IT PhD Dissertation PART 1 January 2016
DTU Management 135
APPENDIX 9 IT LAYERS, FM PROCESSES AND RESEARCH METHODS IN JOURNAL ARTICLES (Paper 2, Table 2)
FM processes, activities and tasks Research Methods
IT L
ayer
Mai
nten
ance
Info
rmat
ion
Man
agem
ent
Asse
t Man
agem
ent
Build
ing
Perf
orm
ance
AEC-
FM
Data
Cre
atio
n / C
aptu
ring
FM su
pply
cha
in
Emer
genc
y M
anag
emen
t
Surv
ey Q
uest
ionn
aire
(
x) In
terv
iew
s
Case
Stu
dy
Conc
eptu
al /D
evel
opm
ent
Qua
ntita
tive
Test
Cas
e or
Sce
nario
Find
ings
Count: 12 17 8 5 5 3 1 1 10 2 24 7 10 2014 (Volk et al. 2014) Review U x x - - - - - DS (Hou et al. 2014) (Review) C x x x PS (Jung et al. 2014) C x x x x x PS (Hua et al. 2014) D x x x x PS (Irizarry et al. 2014) C x x x x PS (Motamedi et al. 2014) C x x x PS (Kriksciuniene et al. 2014) C x x x x PS (Scupola 2014) I x (x) DN 2013 (Eadie et al. 2013) U x x x x DS (Motamedi et al. 2013) C x x x x PS (Olbrich et al. 2013) C x x PS (Kim et al. 2013) Review U - - - - - PD (Ko et al. 2013) D x x x PS (East et al. 2013) C x x x PS (Irizarry et al. 2013) D x x x x x PS (Chen et al. 2013) (Review) D x x PS 2012 (Manzoor et al. 2012) C x x x PS (Becerik-gerber et al. 2012) I x x x PS (Klein et al. 2012) C x x x x x DN 2011 (Lai & Yik 2011) U x x x x x PD (Motamedi et al. 2011) C x x x x x PS (Hallberg 2011) C x x PS 2010 (Shen et al. 2010) Review C x x - - - - - DS 2009 (Elmualim & Pelumi-Johnson 2009) C x x x (x) DS (Madritsch & May 2009) I x x x x x PS (Bainbridge & Finch 2009) I x x DS (Tulla et al. 2009) C x x x x DS (Tolman & Parkkila 2009) C x x x x PS (Tolman et al. 2009) C x x (x) x DS 2008 (Otto 2008) C x x x PS (Vanlande & Nicolle 2008) C x x PS (Malatras et al. 2008) C x x x PS IT Layers: U: Use in practice I: Implementation in Practice D: Development C: Conceptualization
Findings: PS: Prescriptive (How can we make it happen?) PD: Predictive (What will happen?) DN: Diagnostic (Why did it happen?) DS: Descriptive (What happened?)

Poul Ebbesen: Adding Value to FM with IT PhD Dissertation PART 1 January 2016
DTU Management 136
PART 2 THE PAPERS (AND THE JOINT AUTHOR STATEMENTS)

Poul Ebbesen: Adding Value to FM with IT PhD Dissertation PART 2 January 2016
PART 2 THE PAPERS (AND THE JOINT AUTHOR STATEMENTS)
DTU Management

PAPER 1 IDENTIFYING CONCEPTS
Ebbesen & Bonke 2014. Identifying Concepts for studying Implementation of Information Technology in Facilities Management. In CIB Facilities Management Conference. pp. 417-429.
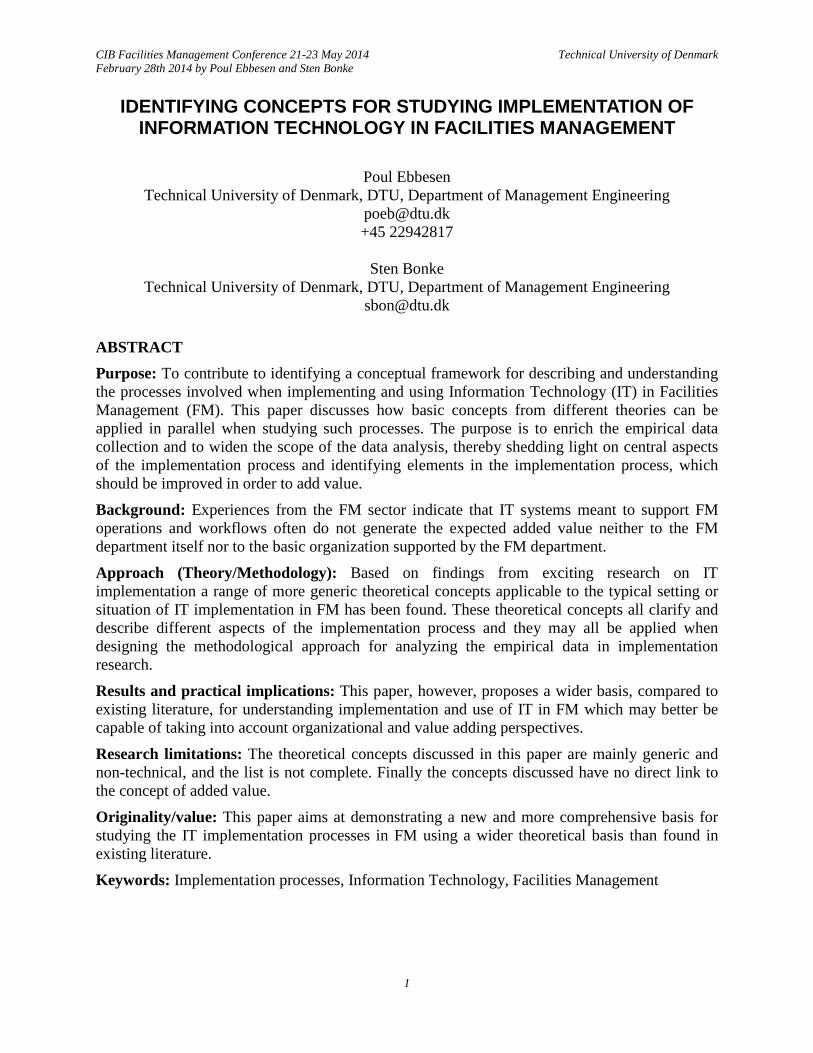
CIB Facilities Management Conference 21-23 May 2014 February 28th 2014 by Poul Ebbesen and Sten Bonke
Technical University of Denmark
IDENTIFYING CONCEPTS FOR STUDYING IMPLEMENTATION OF INFORMATION TECHNOLOGY IN FACILITIES MANAGEMENT
Poul Ebbesen
Technical University of Denmark, DTU, Department of Management Engineering [email protected] +45 22942817
Sten Bonke
Technical University of Denmark, DTU, Department of Management Engineering [email protected]
ABSTRACT Purpose: To contribute to identifying a conceptual framework for describing and understanding the processes involved when implementing and using Information Technology (IT) in Facilities Management (FM). This paper discusses how basic concepts from different theories can be applied in parallel when studying such processes. The purpose is to enrich the empirical data collection and to widen the scope of the data analysis, thereby shedding light on central aspects of the implementation process and identifying elements in the implementation process, which should be improved in order to add value.
Background: Experiences from the FM sector indicate that IT systems meant to support FM operations and workflows often do not generate the expected added value neither to the FM department itself nor to the basic organization supported by the FM department.
Approach (Theory/Methodology): Based on findings from exciting research on IT implementation a range of more generic theoretical concepts applicable to the typical setting or situation of IT implementation in FM has been found. These theoretical concepts all clarify and describe different aspects of the implementation process and they may all be applied when designing the methodological approach for analyzing the empirical data in implementation research.
Results and practical implications: This paper, however, proposes a wider basis, compared to existing literature, for understanding implementation and use of IT in FM which may better be capable of taking into account organizational and value adding perspectives.
Research limitations: The theoretical concepts discussed in this paper are mainly generic and non-technical, and the list is not complete. Finally the concepts discussed have no direct link to the concept of added value.
Originality/value: This paper aims at demonstrating a new and more comprehensive basis for studying the IT implementation processes in FM using a wider theoretical basis than found in existing literature.
Keywords: Implementation processes, Information Technology, Facilities Management
1
CIB Facilities Management Conference 21-23 May 2014 February 28th 2014 by Poul Ebbesen and Sten Bonke
Technical University of Denmark
1 INTRODUCTION This paper introduces a range of applicable theories, concepts, models and methodologies relevant when studying the complex process of implementation of information technology in Facilities Management organizations. It frames and describes a conceivable theoretical basis for identifying methods, which can ensure added value when implementing and using IT in FM organizations.
Implementing IT in organizations involves many aspects and entities in and outside the organization such as actors/staff, the specific IT being implemented, operations, workflows, added value, organizational structure, standards and the implementation process itself. In this paper the effectiveness of the implementation process is assumed to be essential when striving for maximum added value. This process is therefore regarded as the most important empirical phenomenon to be studied. The focus is on the internal processes in organizations but framed in a context also including the outside environment. Jensen and Scupola (2010) conclude that organizational, technological and external environments influence the spread of IT in the FM supply chain. This paper aims at complementing the more technical and management oriented research in this area, e.g. Madritsch and May (2009).
1.1 The typical setting when implementing IT in FM Software typically included when FM departments invest in new IT or upgrade existing IT can roughly be divided into Data Containers (e.g. FTP servers, databases, BIM and GIS) and Workflow Systems (e.g. CMMS, CAFM and IWMS). Investments in IT will often include improvements in data: Improving interoperability (e.g. with IFC/COBie), transparency (e.g. with web based GIS) and reliability (e.g. including data cleaning and QA procedures).
Most often existing, relatively ready for use, software solutions on the market are chosen. Some FM departments however choose to adopt systems already in use in other parts of the organization, such as ERP systems (Redlein & Zobl, 2013) or GIS. Therefore no, or only a limited, development and design phase is included. Often the main effort lies in creating and inserting data into the system and in deploying the system. Often persons from quite different professions and from different levels in the organizational hierarchy are involved, but often only a limited number of persons are involved and also only few persons are expected to use the system.
2 RELEVANT THEORIES AND CONCEPTS
2.1 Criteria for identifying relevant theories Despite intensive research in implementation and adoption of IT during the last three decades, no significant increase in the success rate of implementation projects is observed. New ways of viewing and understanding this research area is apparently needed. A comprehensive literature review conducted by Korpelainen (2011) shows that the four dominating theories used between 1999 and 2010 in the most sited literature articles in this area were the technology acceptance model (TAM), theory of reasoned actions (TRA), diffusion of innovations (DOI), and theory of planned behavior (TPB). Korbelainen (2011) concludes inter alias that a broader view should be applied and that socio technical frameworks and change management perspectives also should be considered in future research.
2
CIB Facilities Management Conference 21-23 May 2014 February 28th 2014 by Poul Ebbesen and Sten Bonke
Technical University of Denmark
Criteria for identifying the theories and concepts suggested in this paper are built partly upon Korpelainen’s recommendations, but also by accepting that the theoretical concepts must be relevant and applicable to the typical setting as described above. The theories can be used in parallel and each of them is contributing a specific focus and a way of approaching, framing and investigating the different issues in implementation processes. While not assuming full coverage specific relevant concepts and models within each of the theoretical frameworks will be described in the following, and it will be discussed how each concept can be made operational, that is how it can be applied to the research methodology.
2.2 Implementation from an innovation perspective 2.2.1 Innovation Theory The work of Joseph Schumpeter has greatly influenced theories of innovation. He argued that economic development is driven by innovation through a dynamic process in which new technologies replace the old (Keklik, 2003). An innovation can be regarded as the implementation of a new or significantly improved product (good or service), or process, a new marketing method, or a new organizational method in business practices, workplace organization or external relations. Four types of innovations can be distinguished between: product, process, marketing and organizational innovation (OECD, 2005).
The process of implementing IT in an FM organization can involve improvements and changes of the technology (product innovation) and of the work processes which the technology is meant to support (process innovation). The implementation process can also cause or require improvements and changes in the organization (organizational innovation). Parameters such as employees’ educational level and the organization’s support for education / training may indicate an organization’s innovation capability. Likewise, in FM organizations the innovation strategies will also influence the innovation capability (Scupola & Tuunaininen, 2011). Data on these parameters and the different types of innovations during the implementation process can be collected via interviews and longitudinal studies.
2.2.2 Diffusion of Innovations Theory (DOI) Diffusion of Innovations Theory as described by Rogers (2003) deals with the many variables determining the rate of diffusion and adoption of innovations. DOI can be applied when studying smaller social groups, e.g. a FM department or an organization. Rogers (2003) defines an innovation as an idea, practice, or object perceived as new by an individual or other units of adoption – thus differing from the OECD definition mentioned above.
Some of the relevant DOI elements found in Rogers (2003) are stages and variables determining the innovation-decision process, variables determining the rate of adoption, variables related to organizational innovativeness, and stages in the innovation process in organizations. Rate of adoption variables may help predict or explain the duration of an implementation process. One such variable, which easily can be made operational, is “Complexity” belonging to the variable group “Perceived attributes of Innovations”. The theory states that a high level of complexity results in a lower rate of adoption within a social group. By simply asking people involved in the implementation process how they perceive the technology being implemented, they will reveal rather precise information on complexity level (e.g. using the Likert-type scale). Another variable determining the rate adoption is “Norm” belonging to the group of variables “Nature of Social System”. Norm is not as easily made operational. One cannot put the concept norm on a scale, but by studying an implementation process one may find things indicating norms among
3
CIB Facilities Management Conference 21-23 May 2014 February 28th 2014 by Poul Ebbesen and Sten Bonke
Technical University of Denmark
people involved, relevant for understanding aspects of the implementation process. If for instance it is perceived as acceptable and regarded as a norm among employees to resist learning new things, this will obviously have great impact on the implementation process and can prolong the process significantly.
In DOI the diffusion and adoption process is regarded as linear, starting when the innovation first occurs on the agenda and ending when the whole social group being studied has adopted the innovation. DOI deals with innovations (e.g. new IT) as something static, which to some extent complies with the normal setting as described above. DOI does not take into account the interaction between people and technology and the transformation of the actors involved. For studying the nonlinear interaction which takes place between human actors or social groups and technology, and the transformation of the actors, sociotechnical theories can be applied.
2.3 Socio-technical understanding of implementation 2.3.1 Social Construction of Technology (SCOT) Social construction of technology (SCOT) as defined by Bijker (1995) is a theory and a methodology within the research field of Social Shaping of Technology (SST). SCOT is primarily used to map and explain development of technology from a social science standpoint. It states that technology and human actions are mutually shaped by each other. It treats technological successes and failures symmetrically, insisting on the same sort of explanation for both (Sørensen & Williams, 2002). It is by trying to understand the context of the social world (norms, culture, politics, economics and technology) in which the technology is embedded, one finds the explanation for a technology’s success or failure (principal of symmetry). Relevant social groups with competing interpretations of available technologies (principal of interpretative flexibility) determine which technology is taken for granted (principal of closure) and chosen. In SCOT social groups are defined according to the meanings attached by the social groups to the specific technology (attributes of meanings). A social group can perceive a technology as working or not working. Each social group constructs problems attached to the technical artifact, which can lead to different demands and developments of a given technology (social shaping of technology).
According to SCOT social groups cannot be defined a priori. The researcher must start by interviewing actors involved and ask what meanings they attach to the technology. At the end of each interview one can ask which other actors are involved (snowball sampling). When no new actors are mentioned all relevant social groups has probably been detected. The actors can then be placed in different social groups according to the meanings they attach the technology.
The following example could serve as an illustration on how to apply the SCOT methodology in practice: multiple IT solutions are known to be available for supporting a specific work process in an FM department, and the actors involved decides on technology X. To better understand why technology X is chosen, and what consequences the decision may have, each actor are asked for her or his meanings attached to this technology. Technology X may be found to be energy reducing by one group of actors (social group A) and user friendly by another group (social group B) and finally impossible to learn (e.g. difficult) by a third group (social group C). One could say that group A and B find the technology operable and C finds it not operable. If group A and B can unite and override/exclude group C in the decision process, this may contribute to explaining why technology X is chosen. Now, if people in group C were meant to become the
4
CIB Facilities Management Conference 21-23 May 2014 February 28th 2014 by Poul Ebbesen and Sten Bonke
Technical University of Denmark
primary users of the IT system, which they found too difficult to learn, the system will quite certainly fail to be effectively adopted in the organization.
2.3.2 Actor-Network Theory (ANT) Like SCOT Actor-Network Theory (ANT), as defined by Latour (1999), is a theory and a methodology within SST. ANT is used to study and map how actors influence each other, are connected and interact with each other. ANT follows the strategies and actions of central actors as they attempt to establish resources necessary for a project, particularly by enrolling other actors (Sørensen & Williams, 2002). In ANT a technology is an emerging and increasingly stabilized network of human and non-human (e.g. an IT system) actors (or actants to indicate the human and non-human nature of the entities involved). The connected actants (e.g. a FM department and an IT system) leads to a hybrid actant that does not necessarily practice the sum of the characteristics of the original actants. The objectives for investing in IT in an FM department can change considerably after the IT has been adopted. The ANT principle of goal translation may explain a typical situation, where the final goal (Goal 3) of connected actants (e.g. the hybrid actant “IT staff” or “staff IT”) can differ from the original goal (Goal 1) of the people involved and the inscribed goal or function (Goal 2) of the IT. IT systems are inscribed with the designers and programmers own ideas of how people should work and utilize the system. This is particularly important to be aware of when implementing existing and ready to use IT systems.
All actants are part of a collective. The FM department could be replaced by “all FM businesses” and the IT system could be replaced by “what the main suppliers of IT for FM can deliver of IT”. The responsibility for action must be shared among various actants in the collectives. An actant will always be part of one or more groups. Actants form groups called actor-networks within ANT. A group must be deconstructed in order to see what is going on inside.
ANT focuses on connections between actants and on how these connections are established and formed. From empirical fieldwork connections between actants can be traced and described. These connections can create hybrid actants.
For ANT truth does not exist. Truth should be understood as a state of affairs that can change over time (or essence can change). In the FM business, for instance, the statement that IT adds value could be regarded as true. A decade ago the same statement might have been regarded as not true. Therefor the researcher should focus on the forces that shape the essence. What made people in the FM business regard IT as value adding? What actants have been connected to shape this “goal” or understanding, and how where these actants brought together? Actions we are trying to measure are subject to blackboxing. An IT system can be taken for granted as a point (punctualization) in a sequence of actions. But alone it is a complex thing with many elements, and many actants can be involved to fix it, if it does not work. How many actants are really out there? In ANT an intermediary is something that does not act, but that is being acted upon. A person (an actor) uses a code (an intermediary) to get access to the IT system (could be an actor). A more operational version of the intermediary concept is discussed below.
2.3.3 Boundary Objects A Boundary Object (BO) is a theoretical concept based on both SCOT and ANT and first defined by Star and Griesemer (1989). It is an entity (e.g. physical artifact, document, set of data, concept etc.) shared by different groups of professionals but understood differently by each group. One group does not necessarily understand the full context of use of the BO by another social group.
5
CIB Facilities Management Conference 21-23 May 2014 February 28th 2014 by Poul Ebbesen and Sten Bonke
Technical University of Denmark
A BO serves as a common point of reference, mediation, conversation and negotiation. Groups of professionals involved in a process collaborate and exchange knowledge around BOs, which are flexible, epistemic artifacts inhabiting several intersecting social worlds and satisfying the information requirements of each of them (Star & Griesemer, 1989).
IT implementation projects in FM are most often cross-disciplinary: thereby making BOs relevant. Entities such as the project itself, the IT system or a document with the project time schedule can function as BOs. BOs may be essential for efficient collaboration and exchange of information between the different professional groups (e.g. management, consultants, FM administratives and technical staff in the FM department and future users in the organization) during the implementation process. If a BO can be identified in an IT implementation project, it can be studied how the involved groups relate to the BO, thereby shedding light on the nature of collaboration and exchange of information in the project.
Although BOs are seen to play an important role in coordinating cross-disciplinary work, boundary-spanning activities (such as face-to-face meetings, visits to each other’s loci of practice, or internships) are necessary to support their role (Levina & Vaast, 2005). BOs make cross-disciplinary work possible and they perform at least three types of work in this context: motivate collaboration, allow participants to work across different types of boundaries and constitute the fundamental infrastructure of the activity (Nicolini, Mengis, & Swan, 2012).
2.3.4 Domestication theory Domestication theory is also based on SCOT and ANT. It explains how foreign artifacts introduced into a preexisting context of practice gradually are “tamed” and appropriated and becomes a natural part of the (transformed) practice (Yoshinaka, 2012). Domestication of technology unfolds a series of ongoing processes or phases: appropriation, objectification, incorporation and conversion. Appropriation deals with the active process through which people adopt and use technology (Stewart, 2003), in other words how the technology is acquired and brought in to the context of practice. Objectification describes the change and adaptation of users and their environment. In general it deals with the acquisition, placement and organization of the technology in the heterogeneous context of practice and actions, and the strategies and goals concerning the technology once is has been acquired. Objectification is a process where the value by which the technology is perceived upon its appropriation is manifested (Yoshinaka, 2012). There is a multitude of strategies available for users when integrating a technology. Therefore technology will be objectificated differently across different sites and practices. Incorporation interprets the everyday usage of the technology and shows how it comes to play its role in the practice-setting. Here the technology is integrated into practice and routines - as taken for granted. Conversion involves the change of meanings and values with the technology, its symbolic new value or the general impression of the technology in the practice-setting. Operationalizing domestication theory when studying an implementation process could be done by focusing on specific themes connected to each of the phases mentioned above.
2.3.5 Intermediaries Intermediaries can be regarded as actors offering intermediation services between other actors. Intermediaries can change intent, meaning and form of technology through their acts of mediating the technology between actors (Stewart & Hyysalo, 2008). The concept of intermediaries used here is a more active role in contrast to the passive role in ANT as described above.
6
CIB Facilities Management Conference 21-23 May 2014 February 28th 2014 by Poul Ebbesen and Sten Bonke
Technical University of Denmark
Intermediaries between supply and use of IT play an important role in the process of implementing IT in organizations. Steward and Hyysalo (2008) explore the role of intermediaries in the development and appropriation of new technologies and deliver an operational method for mapping intermediaries. They define differences in profiles and in consequent mediating capacity of intermediaries. Length indicates reach between supply and use and width indicates content e.g. knowledge. Knowledge can flow between intermediaries.
Intermediaries can have different functions (Howells, 2006) and carry out different activities (Bessant & Rush, 1995). Bessant and Ruch (1995) identify four generic roles within these functions and roles: transfer of knowledge, sharing knowledge across user community, acting as brokering to a range of suppliers and diagnostic/innovation role in trying to identify what end users actually want. All which involve knowledge creation, translation and dissemination. Three distinct roles in social learning are fundamental different facets in the actions of intermediaries: facilitating, configuring and brokering (Stewart & Hyysalo, 2008).
According to Steward and Hyysalo (2008) configuring is not only technical but also symbolic: intermediaries provide an interpretation of the product, the meanings that people give to a technology (similar to attributes of meanings in SCOT). Brokering is e.g. raising support for the appropriation process from sponsors and suppliers. Facilitating is e.g. providing the computers, the software, the training and instructions needed to use it. The experience and knowledge which they supply to the users is as important as the actual technology.
Intermediaries, their activities, role and function in IT implementation projects can be identified by interviewing the different actors involved (also the intermediaries). The snow ball sampling method can be used to identify the intermediaries. Subsequently, their niches, reach, content and flow of knowledge can be mapped. An intermediary with a short reach, a thin content and little flow of knowledge may give limited added value to the implementation process. Intermediaries may prefer certain options and suppress others and thereby, in SCOT terminology, influence the shaping of technology. Some intermediaries may try to make themselves obligatory point of passage.
A typical IT implementation project in FM can involve intermediaries such as trade associations, user groups, IT consultants, system operators, user side intermediaries who buy and pay the IT, user side intermediaries who are involved in the implementation process and help colleagues use the system, and finally user side proxy users who learn to use the system in order to teach colleagues how to use the system as end users.
2.4 Organizational structuring of implementation 2.4.1 An organizational Configuration model According to Mintzberg (2009) an organization can consist of five basic parts: operating core, strategic apex or top management, middle line or supervising management, technostructure or administration and standardization, and finally support staff outside the operating core flow. The structure of an organization can be explained by using the five basic organizational configurations models: simple structure based on direct supervision from the strategic apex, machine bureaucracy based on standardization of work processes defined by the technostructure, professional bureaucracy based on standardization of skills defined by the operating core, divisionalized form based on standardization of outputs defined by the middle line, and adhocracy based on mutual adjustment defined by the supporting staff. Five internal coordination mechanisms evolve as work becomes more complicated in an organization: mutual
7
CIB Facilities Management Conference 21-23 May 2014 February 28th 2014 by Poul Ebbesen and Sten Bonke
Technical University of Denmark
adjustment, direct supervision, standardization of work processes, standardization of outputs and standardization of skills/knowledge. The five configurations models represents a set of five internal forces, exercised by the basic parts of the organization pulling an organization in five different directions: strategic apex pull to centralize, technostructure pull to standardize, operating core pull to professionalize, middle management pull to divisionalize/Balkanize and support staff pull toward collaboration and innovation in decision making.
Of special interest in regards to organizational configuration is the localization of Facilities Management within the five basic parts. This depends on the configuration of the organization and the tasks assigned to the FM department. A FM department in a machine bureaucracy, e.g. a production company, involved in maintenance of building facilities could be placed in the support staff. If the FM department is also involved in maintenance of machines used by the operation core, it could at the same time be placed in the techno structure. A FM department in a divisionalized organization, e.g. a municipality where facilitating public buildings is one of the core tasks, the FM department could be regarded as its own division in the operating core. Also of interest is which pull is activated when the FM department implements IT. When implementing a work flow system to support facilities maintenance, it could e.g. contribute to the pull from the techno structure to standardize. 2.4.2 An Organizational Diagnostic model Several Organizational Diagnostic models used to collect information about an organization in order to establish the basis for appropriate organizational changes are available (Faletta, 2008). One of the basic, first proposed by Leavitt (1965), is the “diamond model” where the organization is conceptualized as consisting of four interacting components: people/actors, technology, tasks and structure. Change in one component will affect the other components, therefore requiring changes in all other components. The diamond model is a “closed system” which does not address the role of external environment (Falletta, 2008). In contrast Open System Theory offers models, where the organization is regarded as a social system dependent upon the environment in which it exist. The organization is subject to repeated cycles of input from the environment, transformation within the organization and output to the environment. The diamond model can be modified to also include other components, informal structures, and influence from the environment.
When implementing new IT a change is made in the technological component (according to Leavitt) and thereby triggering changes in the other components of the organization. Identifying which changes will occur and which changes should be made can be very complicated. One way to operationalize these premises, when studying the implementation process, could be to collect data on expected and planned changes in the organization and to observe changes during the implementation process. Discrepancy between expected, planned and observed changes may explain some of the problems which can occur during an implementation process.
2.5 Managing implementation processes 2.5.1 Project Management Like any other project an IT implementation must be managed. Project Management can be seen as a series of phases (e.g. initiating, planning, implementing, controlling and closing), each containing different tasks connected to different themes (e.g. resources, time, cost, risk etc.) (DS/ISO, 2012, Table 1). Which phase in the project management process an implementation
8
CIB Facilities Management Conference 21-23 May 2014 February 28th 2014 by Poul Ebbesen and Sten Bonke
Technical University of Denmark
project has reached and to which extent the project management tasks actually are being performed is relevant for studying.
2.5.2 Change Management Change Management deals with handling changes in organizations, such as changes inevitably taking place when implementing IT. It is a multi-disciplinary linear oriented and descriptive approach following a series of steps in the processes. A conceptual framework presented by (Hayes, 2010) involves the following main “steps of change”: recognizing need and start of the change process, diagnosis (review present state and identify future state), plan and prepare change, implement the change and sustain the change. In parallel with these steps issues regarding the people involved must be handled and the process must be reviewed according to planned schedule. Lewin argues that any level of behavior is maintained in a condition of quasi-stationary equilibrium by a force field comprising a balance of forces pushing for and resisting change. This level of behavior can be changed by either adding forces for change in the desired direction, and thereby increasing the tension, or by diminishing the opposing or resisting forces and thereby achieving a state of relatively low tension (Hayes, 2010, p. 43). Removing the restraining forces, rather than adding forces, in e.g. an organization is more likely to result in a more permanent change. Another basic concept applicable to change management is Lewin’s concept of permanency, which states that successful change requires three steps: unfreezing, movement and refreezing. Unfreezing means destabilizing the balance of driving and restraining forces, movement means modifying the balance of driving and restraining forces to change the equilibrium to a new state. Refreezing involves reinforcing the new state and avoiding a relapse. When studying an implementation process at a given time, is it relevant to know which step of change is being conducted and to which degree the concepts of quasi-stationary equilibrium and permanency is being applied to the management of change.
2.6 Theories specifically aimed at IT implementation Other, in this context, relevant theoretical approaches specifically developed to study IT in organizations are Structurational model of technology, Technology Acceptance Model (TAM) and Success and failure models. TAM developed by Davis (1989) aims to predict and explain IT usage behavior, that is what causes potential adopters to accept or reject the use of IT. The two theoretical constructs- perceived usefulness and perceived ease of use- are fundamental determinants (Korpelainen, 2011, p. 14).
Structurational model of technology developed by Orlikowski (1991) is based on Giddon’s theory of structuration. The model delivers a frame for studying the relationship and influence between the three components human agents, technology and institutional properties of organizations. One important concept in this regard is the technological frame, which is a person’s assumptions, expectations and knowledge about a technology. If persons have significantly different or unaligned technological frames (incongruence) it may lead to difficulties and conflicts, when implementing the technology (Orlikowski & Gash, 1994).
Success and failure models: Most failures in IT projects can be attributed to a series of known root causes and most of the symptoms of IT project failures belong to the project management root cause (Al-Ahmad et al., 2009). In the same way, as with failures, successes in IT projects can be attributed to a series of known causes or factors that fall into a series of categories, such as system quality, information quality, information use, user satisfaction, individual impact and organizational impact (DeLone & McLean, 1992). When studying the implementation process
9
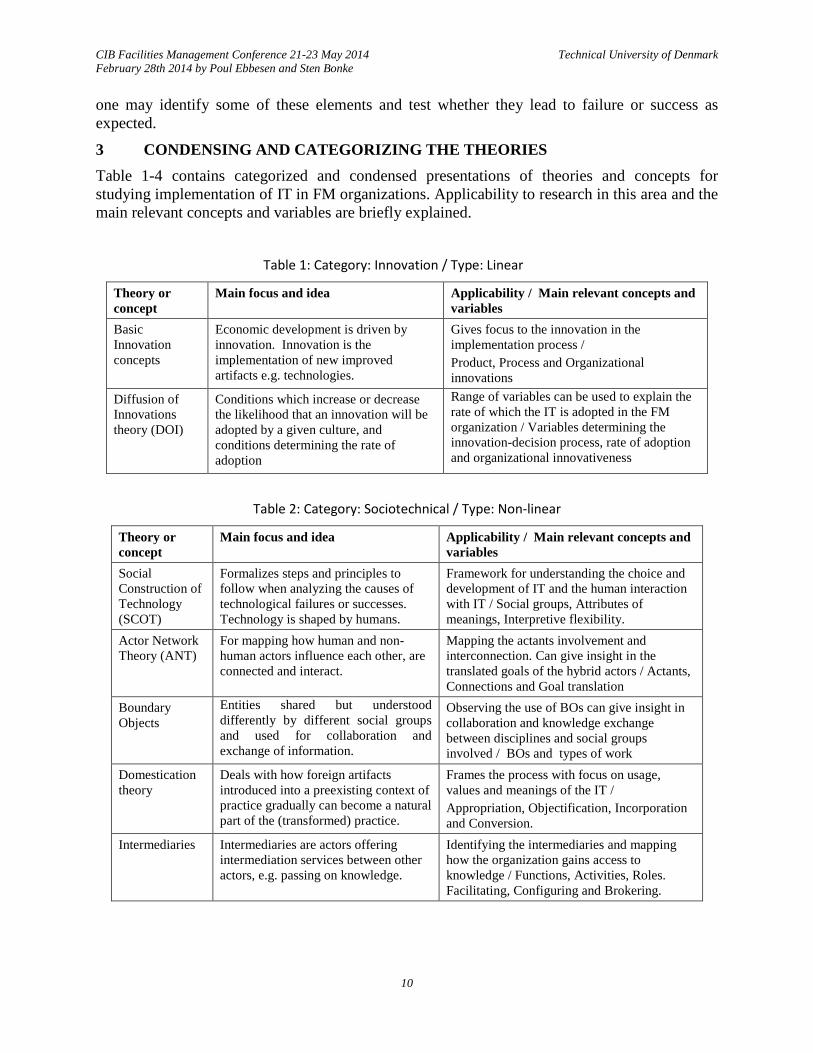
CIB Facilities Management Conference 21-23 May 2014 February 28th 2014 by Poul Ebbesen and Sten Bonke
Technical University of Denmark
one may identify some of these elements and test whether they lead to failure or success as expected.
3 CONDENSING AND CATEGORIZING THE THEORIES Table 1-4 contains categorized and condensed presentations of theories and concepts for studying implementation of IT in FM organizations. Applicability to research in this area and the main relevant concepts and variables are briefly explained.
Table 1: Category: Innovation / Type: Linear
Table 2: Category: Sociotechnical / Type: Non-linear
Theory or concept
Main focus and idea Applicability / Main relevant concepts and variables
Basic Innovation concepts
Economic development is driven by innovation. Innovation is the implementation of new improved artifacts e.g. technologies.
Gives focus to the innovation in the implementation process / Product, Process and Organizational innovations
Diffusion of Innovations theory (DOI)
Conditions which increase or decrease the likelihood that an innovation will be adopted by a given culture, and conditions determining the rate of adoption
Range of variables can be used to explain the rate of which the IT is adopted in the FM organization / Variables determining the innovation-decision process, rate of adoption and organizational innovativeness
Theory or concept
Main focus and idea Applicability / Main relevant concepts and variables
Social Construction of Technology (SCOT)
Formalizes steps and principles to follow when analyzing the causes of technological failures or successes. Technology is shaped by humans.
Framework for understanding the choice and development of IT and the human interaction with IT / Social groups, Attributes of meanings, Interpretive flexibility.
Actor Network Theory (ANT)
For mapping how human and non-human actors influence each other, are connected and interact.
Mapping the actants involvement and interconnection. Can give insight in the translated goals of the hybrid actors / Actants, Connections and Goal translation
Boundary Objects
Entities shared but understood differently by different social groups and used for collaboration and exchange of information.
Observing the use of BOs can give insight in collaboration and knowledge exchange between disciplines and social groups involved / BOs and types of work
Domestication theory
Deals with how foreign artifacts introduced into a preexisting context of practice gradually can become a natural part of the (transformed) practice.
Frames the process with focus on usage, values and meanings of the IT / Appropriation, Objectification, Incorporation and Conversion.
Intermediaries Intermediaries are actors offering intermediation services between other actors, e.g. passing on knowledge.
Identifying the intermediaries and mapping how the organization gains access to knowledge / Functions, Activities, Roles. Facilitating, Configuring and Brokering.
10
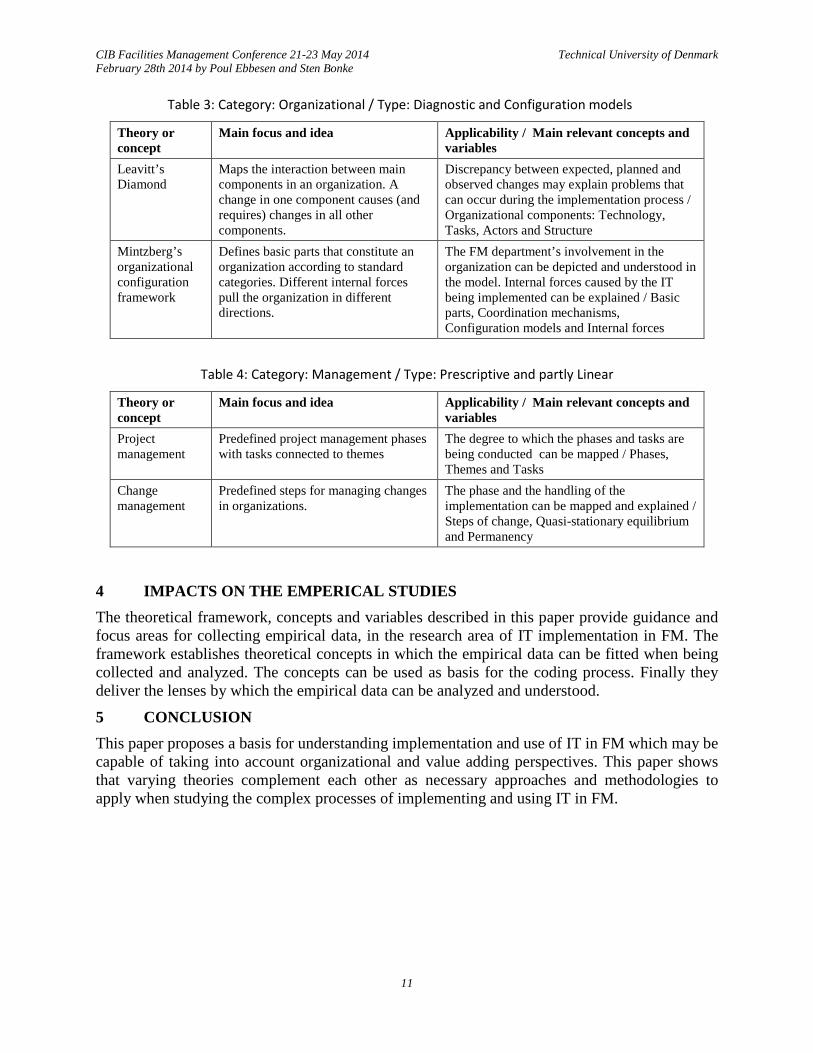
CIB Facilities Management Conference 21-23 May 2014 February 28th 2014 by Poul Ebbesen and Sten Bonke
Technical University of Denmark
Table 3: Category: Organizational / Type: Diagnostic and Configuration models
Table 4: Category: Management / Type: Prescriptive and partly Linear
4 IMPACTS ON THE EMPERICAL STUDIES The theoretical framework, concepts and variables described in this paper provide guidance and focus areas for collecting empirical data, in the research area of IT implementation in FM. The framework establishes theoretical concepts in which the empirical data can be fitted when being collected and analyzed. The concepts can be used as basis for the coding process. Finally they deliver the lenses by which the empirical data can be analyzed and understood.
5 CONCLUSION This paper proposes a basis for understanding implementation and use of IT in FM which may be capable of taking into account organizational and value adding perspectives. This paper shows that varying theories complement each other as necessary approaches and methodologies to apply when studying the complex processes of implementing and using IT in FM.
Theory or concept
Main focus and idea Applicability / Main relevant concepts and variables
Leavitt’s Diamond
Maps the interaction between main components in an organization. A change in one component causes (and requires) changes in all other components.
Discrepancy between expected, planned and observed changes may explain problems that can occur during the implementation process / Organizational components: Technology, Tasks, Actors and Structure
Mintzberg’s organizational configuration framework
Defines basic parts that constitute an organization according to standard categories. Different internal forces pull the organization in different directions.
The FM department’s involvement in the organization can be depicted and understood in the model. Internal forces caused by the IT being implemented can be explained / Basic parts, Coordination mechanisms, Configuration models and Internal forces
Theory or concept
Main focus and idea Applicability / Main relevant concepts and variables
Project management
Predefined project management phases with tasks connected to themes
The degree to which the phases and tasks are being conducted can be mapped / Phases, Themes and Tasks
Change management
Predefined steps for managing changes in organizations.
The phase and the handling of the implementation can be mapped and explained / Steps of change, Quasi-stationary equilibrium and Permanency
11
CIB Facilities Management Conference 21-23 May 2014 February 28th 2014 by Poul Ebbesen and Sten Bonke
Technical University of Denmark
REFERENCES Al-Ahmad, W., Al-Fagih, W. et al (2009). A taxonomy of an IT project failure: Root causes. International Management Review, 5(1), 93-104. Bessant, J., & Rush, H. (1995). Building bridges for innovation: The role of consultants in technology transfer. Rearch Policy, 24(1), 97-114. Bijker, W. E. (1995). Of bicycles, bakelites, and bulbs. toward a theory of sociotechnical change. Cambridge, MA: MIT Press. Davis, F. D. (1989). Perveived usefulness, perceived ease of use, ans user acceptance of information technology. MIS Quarterly, 13(3), 319-340. DeLone, W., & McLean, E. R. (1992). Information systems success: The quest for the dependent variable. Information Systems Research, 3(1), 60-95. DS/ISO. (2012). DS/ISO 21500. vejledning i projektledelse, guidance on project management. København: Dansk Standard. Falletta, S. (2008). Organizational diagnostic models, A review & synthesis. . Sacramento CA: Leadersphere. Hayes, J. (2010). The theory and practice of change management (3rd ed.). Basingstoke: Palgrave Macmillan. Howells, J. (2006). Intermediation and the role of intermediaries in innovation. Research Policy, 35(5), 715-728. Jensen, P. A., & Scupola, A. (2010). ICT adoption in the danish facilities management supply chain - what are the factors that matter? Keklik, M. (2003). Shumpeter, innovation and growth, long-cycle dynamics in the post-WWII american manufacturing industries. England: Ashgate Publishing Limited. Korpelainen, E. (2011). Theories of ICT system implementation and adoption - A critical review. Aalto University publication series SCIENCE + TECHNOLOGY, 9/2011: Aalto Print Helsinki. Latour, B. (1999). A collective of humans and nonhumans. Pandora's hope : Essays on the reality of science studies (pp. 174-198). Cambridge, MA: Harvard University Press. Leavitt, H. J. (1965). Applied organizational change in industry: Structural, technical and humanistic approaches . In J. G. March (Ed.), Handbook of organizations (pp. 1144) Levina, N., & Vaast, E. (2005). The emergence of boundary spanning competence in practice. implications for implementation and use of information systems. MIS Quarterly, 29(2), 335-363. Madritsch, T., & May, M. (2009). Successful IT implementation in facility management. Facilities, 27(11), 429-444. Mintzberg, M. (2009). Structure in fives. designing effective organizations. Edinburgh: Pearson Education Limited. Nicolini, D., Mengis, J., & Swan, J. (2012). Understanding the role of objects in cross-disciplinary collaboration. Organization Science, 23(3), 612-629. OECD. (2005). Guidelines for collecting and interpreting innovation data, 3ed edition, oslo manual. OECD Publishing. Orlikowski, W. J., & Gash, D. C. (1994). Technological frames - making sence of information technology in organizations. ACM Transactions on Information Systems, 12(2), 174-207. Orlikowski, W. J. (1991). The duality of technology : Rethinking the concept of technology in organizations. Cambridge, Mass: Massachusetts Institute of Technology. Redlein, A., & Zobl, M. (2013). ERP systems within facility management. The 2nd Year of Advanced Research in Scientific Areas , 153-155. Rogers, E. M. (2003). Diffusion of innovations. NY: Free Press.
12
CIB Facilities Management Conference 21-23 May 2014 February 28th 2014 by Poul Ebbesen and Sten Bonke
Technical University of Denmark
Scupola, A., & Tuunaininen, V. K. (2011). Open innovation and role of ICT in business-to-business services: Empirical evidence from facility management services. Proceedings of SIGSVC Workshop . Sprouts: Working Papers on Information Systems, 11, 158. Sørensen, K. H., & Williams, R. (2002). Shaping technology, guiding policy : Concepts, spaces and tools. UK: Edward Elgar. Star, S. L., & Griesemer, J. R. (1989). Institutional ecology, 'translations' and boundary objects: Amateurs and professionals in berkeley's museum of vertebrate zoology, 1907-39. Social Studies of Science, 19(3), 387-420. Stewart, J. (2003). The social consumption of information and communication technologies (ICTs): Insight from research on appropriation and consumption of new ICTs in the domestic environment. Cogn Tech Work, 5, 4. Stewart, J., & Hyysalo, S. (2008). Intermediaries, users and social learning in technological innovation. International Journal of Innovation Management, 12(3), 295-325. Yoshinaka, Y. (2012). Lecture notes on domestication of technology. DTU course 42640 sciotechnical design. DTU, Copenhagen.
13

PAPER 2 LITERATURE REVIEW
Ebbesen 2015b. Information Technology in Facilities Management - A Literature Review. In 14th EuroFM Research Symposium.
14thh EuroFM Research Symposium EuroFM Research Papers 2015
Information Technology in Facilities Management - A Literature Review
Poul Ebbesen Technical University of Denmark, DTU, Department of Management Engineering
[email protected] +45 22942817
ABSTRACT Purpose: The aim of this paper is to present the state of the art of research in Information Technology (IT) in Facilities Management (FM).
Background: Initial studies indicate that investments into IT in FM often do not add the expected value, neither to the FM department itself nor to the organisation supported by the FM department. A basis for further research into this complex and inter-disciplinary area is therefore needed. This literature review will contribute to this basis.
Approach, Theory/Methodology: Based on a Systematic Literature Review (SLR) method, journal articles, with a focus on IT in FM were found. Relevant articles were organized in categories according to focus on 1. technology, 2. IT layer, 3. FM process, 4. theory and research method applied, and 5. type of findings. Finally research gaps were identified.
Results and practical implications: There seems to be a general belief in technology combinations as a way to speed up the rather slow IT diffusion process in FM. It is documented that current research into IT in FM has an unbalanced focus on few specific technologies, IT layers and FM processes, and that further research should focus more on the IT implementation process and use. Knowledge from implementation and use could be fed back into (and strengthen) conceptualization and development, thereby adding more value to FM.
Research limitations: The review is limited to the period 2008-2013. Only the search engine Scopus is used.
Originality/value: This is the first review paper focusing on IT in general in FM, giving an overview of the area and delivering a basis for further research.
Keywords Facilities Management, Information Technology, ICT, Information Systems, Literature Review
1 INTRODUCTION This paper presents current research with focus on Information Technology in Facility Management, published as journal articles since 2007. Considerable resources are invested in implementing and using IT systems supporting FM work processes and activities. Initial studies indicate that these investments often do not add the expected value, neither to the FM department itself nor to the organisation supported by the FM department. A basis for further research into this complex and inter-disciplinary area is therefore needed. This literature review will contribute to this basis.
Page 1 of 14
14thh EuroFM Research Symposium EuroFM Research Papers 2015
The systematic literature review (SLR) method used in this article is explained in section 2 Method. In 3 Finding the Literature the criteria for finding the literature and the approach using the search engine Scopus is explained. How data is extracted from the found literature is described in 4 Extracting data from the literature. Data analysis is placed in section 5 Analysis of current research on IT in FM
2 METHOD This systematic literature review (SLR) is based on criteria in Okoli & Schabram (2010) supplemented by elements in Webster & Watson (2002). This SLR includes the following four stages including eight steps: Planning stage: Purpose and goal, Selection stage: Searching the literature + Practical screening, Extraction stage: Quality Appraisal + Data Extraction and Execution stage: Analysis and Findings + Writing the Review. This paper demonstrates the Protocol for this SLR, where only the author of this paper has been involved.
Based on a set of key words, identified through an initial snowball sampling, a broader search was conducted to find journal articles, with a focus on IT in FM. Relevant articles were grouped into categories according to focus on 1. technology, 2. IT layer, 3. FM process, 4. theory and research method applied, and 5. type of findings. The categories, which are based on an interpretation of the content in the articles, were listed in tables, thereby creating a basis for a quantitative and systematic analysis approach to the data extracted from the literature. Finally research gaps were identified.
3 FINDING THE LITERATURE 3.1 Search key words To identify relevant IT related search key words, an initial search for articles published after 2007 within the area of IT in FM was conducted in the FM journal “Facilities”, using the search engine Scopus. For each article found with a focus on IT in FM, the author key words were added to the search string. This snowball sampling of search key words led to a search string, resulting in N=17 articles found. The search was done in title, author key words and indexed key words. The period chosen covering the last 6 years is found acceptable, taken the rapid development in IT into account.
Based on the above mentioned search string a final search was now done in all English journals, resulting in N=100 articles found. The search key words relating to FM were “Facilities Management” and “Facility Management”, the rest relate to IT. The search in “Facilities” N=17 and the search in all journals N=100 overlapped with N=5, thereby the total number of articles found was N=112. Data in Scopus about the articles were exported to an Excel spread sheet, where the screening and categorization was done.
3.2 Criteria for including literature Abstracts in all N=112 articles found were now screened based on the following criteria: 1. Level of focus on IT in FM, 2. written in English language and 3. Journal articles. The articles were placed in one of three groups, primarily depending on their level of focus on the topic of IT in the operation phase of the facilities lifecycle. Articles with a main focus on the topic (N=32) were put in the first group, but also articles, with a content assessed to be of main relevance for
Page 2 of 14
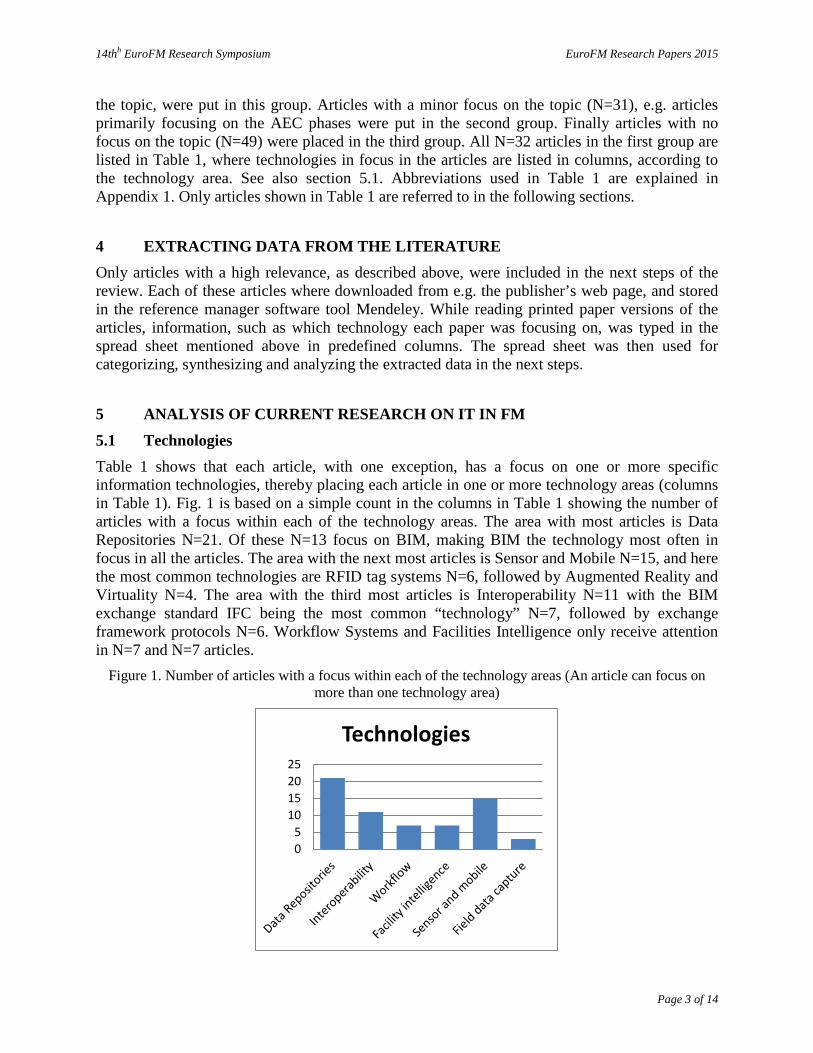
14thh EuroFM Research Symposium EuroFM Research Papers 2015
the topic, were put in this group. Articles with a minor focus on the topic (N=31), e.g. articles primarily focusing on the AEC phases were put in the second group. Finally articles with no focus on the topic (N=49) were placed in the third group. All N=32 articles in the first group are listed in Table 1, where technologies in focus in the articles are listed in columns, according to the technology area. See also section 5.1. Abbreviations used in Table 1 are explained in Appendix 1. Only articles shown in Table 1 are referred to in the following sections.
4 EXTRACTING DATA FROM THE LITERATURE Only articles with a high relevance, as described above, were included in the next steps of the review. Each of these articles where downloaded from e.g. the publisher’s web page, and stored in the reference manager software tool Mendeley. While reading printed paper versions of the articles, information, such as which technology each paper was focusing on, was typed in the spread sheet mentioned above in predefined columns. The spread sheet was then used for categorizing, synthesizing and analyzing the extracted data in the next steps.
5 ANALYSIS OF CURRENT RESEARCH ON IT IN FM 5.1 Technologies Table 1 shows that each article, with one exception, has a focus on one or more specific information technologies, thereby placing each article in one or more technology areas (columns in Table 1). Fig. 1 is based on a simple count in the columns in Table 1 showing the number of articles with a focus within each of the technology areas. The area with most articles is Data Repositories N=21. Of these N=13 focus on BIM, making BIM the technology most often in focus in all the articles. The area with the next most articles is Sensor and Mobile N=15, and here the most common technologies are RFID tag systems N=6, followed by Augmented Reality and Virtuality N=4. The area with the third most articles is Interoperability N=11 with the BIM exchange standard IFC being the most common “technology” N=7, followed by exchange framework protocols N=6. Workflow Systems and Facilities Intelligence only receive attention in N=7 and N=7 articles.
Figure 1. Number of articles with a focus within each of the technology areas (An article can focus on more than one technology area)
05
10152025
Technologies
Page 3 of 14
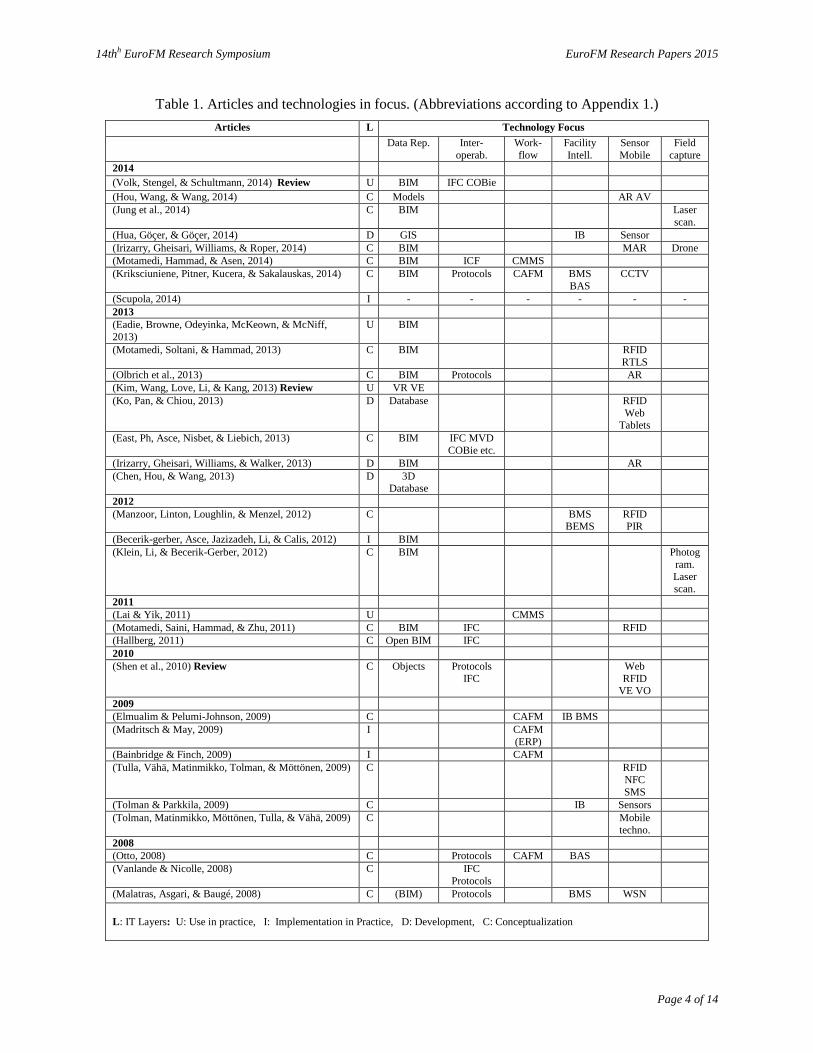
14thh EuroFM Research Symposium EuroFM Research Papers 2015
Table 1. Articles and technologies in focus. (Abbreviations according to Appendix 1.) Articles L Technology Focus
Data Rep. Inter- operab.
Work-flow
Facility Intell.
Sensor Mobile
Field capture
2014 (Volk, Stengel, & Schultmann, 2014) Review U BIM IFC COBie (Hou, Wang, & Wang, 2014) C Models AR AV (Jung et al., 2014) C BIM Laser
scan. (Hua, Göçer, & Göçer, 2014) D GIS IB Sensor (Irizarry, Gheisari, Williams, & Roper, 2014) C BIM MAR Drone (Motamedi, Hammad, & Asen, 2014) C BIM ICF CMMS (Kriksciuniene, Pitner, Kucera, & Sakalauskas, 2014) C BIM Protocols CAFM BMS
BAS CCTV
(Scupola, 2014) I - - - - - - 2013 (Eadie, Browne, Odeyinka, McKeown, & McNiff, 2013)
U BIM
(Motamedi, Soltani, & Hammad, 2013) C BIM RFID RTLS
(Olbrich et al., 2013) C BIM Protocols AR (Kim, Wang, Love, Li, & Kang, 2013) Review U VR VE (Ko, Pan, & Chiou, 2013) D Database RFID
Web Tablets
(East, Ph, Asce, Nisbet, & Liebich, 2013) C BIM IFC MVD COBie etc.
(Irizarry, Gheisari, Williams, & Walker, 2013) D BIM AR (Chen, Hou, & Wang, 2013) D 3D
Database
2012 (Manzoor, Linton, Loughlin, & Menzel, 2012) C BMS
BEMS RFID PIR
(Becerik-gerber, Asce, Jazizadeh, Li, & Calis, 2012) I BIM (Klein, Li, & Becerik-Gerber, 2012) C BIM Photog
ram. Laser scan.
2011 (Lai & Yik, 2011) U CMMS (Motamedi, Saini, Hammad, & Zhu, 2011) C BIM IFC RFID (Hallberg, 2011) C Open BIM IFC 2010 (Shen et al., 2010) Review C Objects Protocols
IFC Web
RFID VE VO
2009 (Elmualim & Pelumi-Johnson, 2009) C CAFM IB BMS (Madritsch & May, 2009) I
CAFM
(ERP)
(Bainbridge & Finch, 2009) I CAFM (Tulla, Vähä, Matinmikko, Tolman, & Möttönen, 2009) C RFID
NFC SMS
(Tolman & Parkkila, 2009) C IB Sensors (Tolman, Matinmikko, Möttönen, Tulla, & Vähä, 2009) C Mobile
techno.
2008 (Otto, 2008) C Protocols CAFM BAS (Vanlande & Nicolle, 2008) C IFC
Protocols
(Malatras, Asgari, & Baugé, 2008) C (BIM) Protocols BMS WSN L: IT Layers: U: Use in practice, I: Implementation in Practice, D: Development, C: Conceptualization
Page 4 of 14
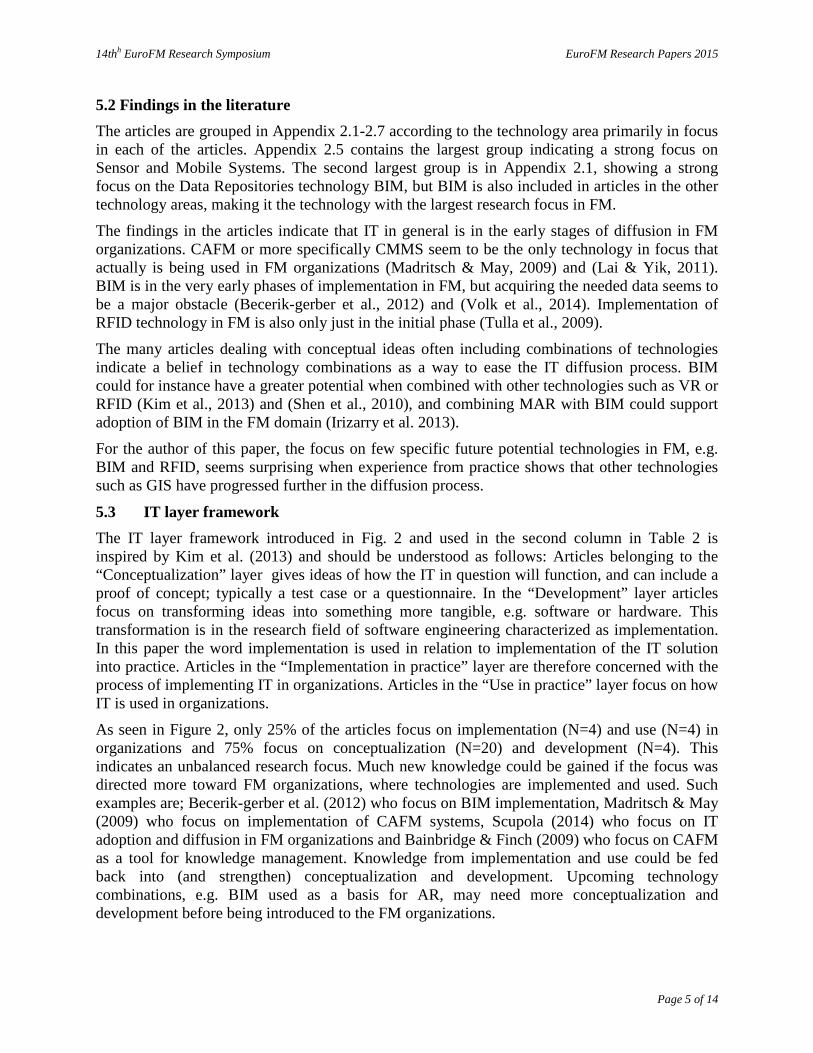
14thh EuroFM Research Symposium EuroFM Research Papers 2015
5.2 Findings in the literature The articles are grouped in Appendix 2.1-2.7 according to the technology area primarily in focus in each of the articles. Appendix 2.5 contains the largest group indicating a strong focus on Sensor and Mobile Systems. The second largest group is in Appendix 2.1, showing a strong focus on the Data Repositories technology BIM, but BIM is also included in articles in the other technology areas, making it the technology with the largest research focus in FM.
The findings in the articles indicate that IT in general is in the early stages of diffusion in FM organizations. CAFM or more specifically CMMS seem to be the only technology in focus that actually is being used in FM organizations (Madritsch & May, 2009) and (Lai & Yik, 2011). BIM is in the very early phases of implementation in FM, but acquiring the needed data seems to be a major obstacle (Becerik-gerber et al., 2012) and (Volk et al., 2014). Implementation of RFID technology in FM is also only just in the initial phase (Tulla et al., 2009).
The many articles dealing with conceptual ideas often including combinations of technologies indicate a belief in technology combinations as a way to ease the IT diffusion process. BIM could for instance have a greater potential when combined with other technologies such as VR or RFID (Kim et al., 2013) and (Shen et al., 2010), and combining MAR with BIM could support adoption of BIM in the FM domain (Irizarry et al. 2013).
For the author of this paper, the focus on few specific future potential technologies in FM, e.g. BIM and RFID, seems surprising when experience from practice shows that other technologies such as GIS have progressed further in the diffusion process.
5.3 IT layer framework The IT layer framework introduced in Fig. 2 and used in the second column in Table 2 is inspired by Kim et al. (2013) and should be understood as follows: Articles belonging to the “Conceptualization” layer gives ideas of how the IT in question will function, and can include a proof of concept; typically a test case or a questionnaire. In the “Development” layer articles focus on transforming ideas into something more tangible, e.g. software or hardware. This transformation is in the research field of software engineering characterized as implementation. In this paper the word implementation is used in relation to implementation of the IT solution into practice. Articles in the “Implementation in practice” layer are therefore concerned with the process of implementing IT in organizations. Articles in the “Use in practice” layer focus on how IT is used in organizations.
As seen in Figure 2, only 25% of the articles focus on implementation (N=4) and use (N=4) in organizations and 75% focus on conceptualization (N=20) and development (N=4). This indicates an unbalanced research focus. Much new knowledge could be gained if the focus was directed more toward FM organizations, where technologies are implemented and used. Such examples are; Becerik-gerber et al. (2012) who focus on BIM implementation, Madritsch & May (2009) who focus on implementation of CAFM systems, Scupola (2014) who focus on IT adoption and diffusion in FM organizations and Bainbridge & Finch (2009) who focus on CAFM as a tool for knowledge management. Knowledge from implementation and use could be fed back into (and strengthen) conceptualization and development. Upcoming technology combinations, e.g. BIM used as a basis for AR, may need more conceptualization and development before being introduced to the FM organizations.
Page 5 of 14
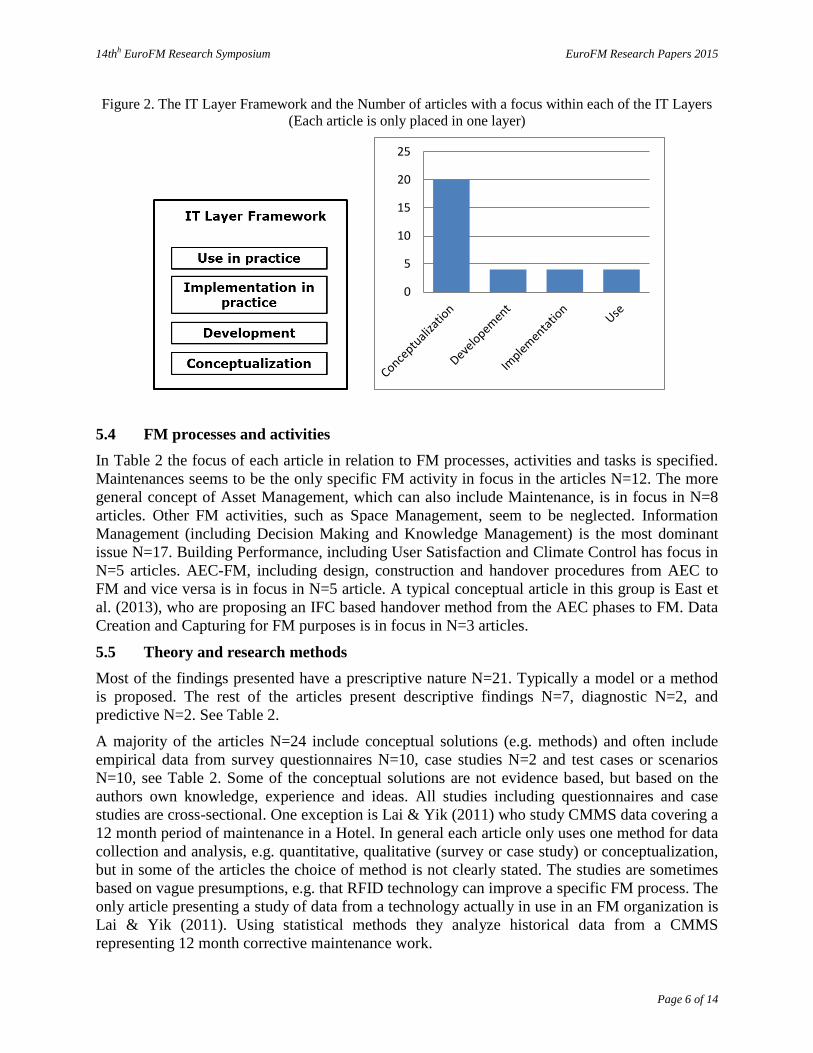
14thh EuroFM Research Symposium EuroFM Research Papers 2015
Figure 2. The IT Layer Framework and the Number of articles with a focus within each of the IT Layers (Each article is only placed in one layer)
5.4 FM processes and activities In Table 2 the focus of each article in relation to FM processes, activities and tasks is specified. Maintenances seems to be the only specific FM activity in focus in the articles N=12. The more general concept of Asset Management, which can also include Maintenance, is in focus in N=8 articles. Other FM activities, such as Space Management, seem to be neglected. Information Management (including Decision Making and Knowledge Management) is the most dominant issue N=17. Building Performance, including User Satisfaction and Climate Control has focus in N=5 articles. AEC-FM, including design, construction and handover procedures from AEC to FM and vice versa is in focus in N=5 article. A typical conceptual article in this group is East et al. (2013), who are proposing an IFC based handover method from the AEC phases to FM. Data Creation and Capturing for FM purposes is in focus in N=3 articles.
5.5 Theory and research methods Most of the findings presented have a prescriptive nature N=21. Typically a model or a method is proposed. The rest of the articles present descriptive findings N=7, diagnostic N=2, and predictive N=2. See Table 2.
A majority of the articles N=24 include conceptual solutions (e.g. methods) and often include empirical data from survey questionnaires N=10, case studies N=2 and test cases or scenarios N=10, see Table 2. Some of the conceptual solutions are not evidence based, but based on the authors own knowledge, experience and ideas. All studies including questionnaires and case studies are cross-sectional. One exception is Lai & Yik (2011) who study CMMS data covering a 12 month period of maintenance in a Hotel. In general each article only uses one method for data collection and analysis, e.g. quantitative, qualitative (survey or case study) or conceptualization, but in some of the articles the choice of method is not clearly stated. The studies are sometimes based on vague presumptions, e.g. that RFID technology can improve a specific FM process. The only article presenting a study of data from a technology actually in use in an FM organization is Lai & Yik (2011). Using statistical methods they analyze historical data from a CMMS representing 12 month corrective maintenance work.
0
5
10
15
20
25
Page 6 of 14
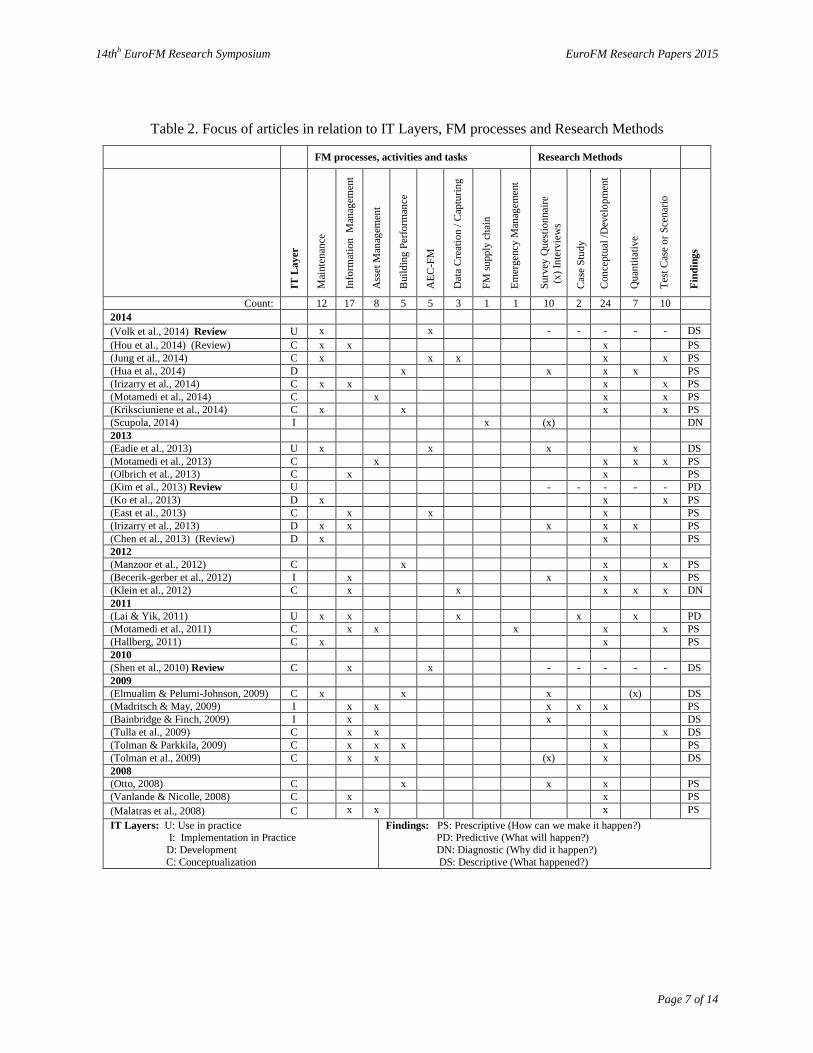
14thh EuroFM Research Symposium EuroFM Research Papers 2015
Table 2. Focus of articles in relation to IT Layers, FM processes and Research Methods
FM processes, activities and tasks Research Methods
IT L
ayer
Mai
nten
ance
Info
rmat
ion
Man
agem
ent
Ass
et M
anag
emen
t
Bui
ldin
g Pe
rform
ance
AEC
-FM
Dat
a C
reat
ion
/ Cap
turin
g
FM su
pply
cha
in
Emer
genc
y M
anag
emen
t
Surv
ey Q
uesti
onna
ire
(x)
Inte
rvie
ws
Cas
e St
udy
Con
cept
ual /
Dev
elop
men
t
Qua
ntita
tive
Test
Cas
e or
Sce
nario
Find
ings
Count: 12 17 8 5 5 3 1 1 10 2 24 7 10 2014 (Volk et al., 2014) Review U x x - - - - - DS (Hou et al., 2014) (Review) C x x x PS (Jung et al., 2014) C x x x x x PS (Hua et al., 2014) D x x x x PS (Irizarry et al., 2014) C x x x x PS (Motamedi et al., 2014) C x x x PS (Kriksciuniene et al., 2014) C x x x x PS (Scupola, 2014) I x (x) DN 2013 (Eadie et al., 2013) U x x x x DS (Motamedi et al., 2013) C x x x x PS (Olbrich et al., 2013) C x x PS (Kim et al., 2013) Review U - - - - - PD (Ko et al., 2013) D x x x PS (East et al., 2013) C x x x PS (Irizarry et al., 2013) D x x x x x PS (Chen et al., 2013) (Review) D x x PS 2012 (Manzoor et al., 2012) C x x x PS (Becerik-gerber et al., 2012) I x x x PS (Klein et al., 2012) C x x x x x DN 2011 (Lai & Yik, 2011) U x x x x x PD (Motamedi et al., 2011) C x x x x x PS (Hallberg, 2011) C x x PS 2010 (Shen et al., 2010) Review C x x - - - - - DS 2009 (Elmualim & Pelumi-Johnson, 2009) C x x x (x) DS (Madritsch & May, 2009) I x x x x x PS (Bainbridge & Finch, 2009) I x x DS (Tulla et al., 2009) C x x x x DS (Tolman & Parkkila, 2009) C x x x x PS (Tolman et al., 2009) C x x (x) x DS 2008 (Otto, 2008) C x x x PS (Vanlande & Nicolle, 2008) C x x PS (Malatras et al., 2008) C x x x PS IT Layers: U: Use in practice I: Implementation in Practice D: Development C: Conceptualization
Findings: PS: Prescriptive (How can we make it happen?) PD: Predictive (What will happen?) DN: Diagnostic (Why did it happen?) DS: Descriptive (What happened?)
Page 7 of 14
14thh EuroFM Research Symposium EuroFM Research Papers 2015
5.6 Chronology The focus on BIM starts in 2011 and has been unbroken since (Table 1). Being a BIM data drop concept, it is not surprising to see a focus on COBie starting in 2013; two years after BIM came in focus. Also in 2013 focus on Augmented Reality (AR) starts. The focus on other technologies such as IFC, CMMS/CAFM, BMS and RFID has been evenly distributed since 2008, but none ever as intense as with BIM. Other technologies used in practice already, such as GIS, could get more focus, if more studies focus on implementation and use.
5.7 Journals and their research scope The research field/scope of each journal, where the articles are published, is mapped in Appendix 3. The journals are mainly within the research fields of Information Systems (IS), Computer Science, Management, Construction Engineering and Facilities Management. It is not surprising to find “IT in FM” articles in IS and Computer Science Journals, likewise it is not surprising to find them in Management and FM journals. In a lifecycle perspective FM can be regarded as closely linked to Construction Management, which can explain why articles on IT in FM also are found in journals in the Construction research field.
6 CONCLUSION This review shows that 75% of the articles have a focus on conceptualization and development while only 25% focus on implementation and use in organizations. Most of the findings presented have a prescriptive nature. This indicates an unbalanced research focus. Much new knowledge could be gained if focus shifted towards FM organizations, where technologies are being implemented and used. Knowledge from implementation and use could be fed back into and strengthen conceptualization and development, thereby adding more value to FM. Upcoming technology combinations, e.g. BIM used as a basis for AR, may need further conceptualization and development before being introduced to the FM organizations.
The technologies most in focus are BIM, followed by RFID. Most of the articles focus on combinations of different technologies, indicating a general belief in technology combinations as a way to speed up the rather slow IT diffusion process in FM. Other technologies used in practice already, such as GIS, would probably get more into focus, if more studies focused on implementation and use in practice.
Some of the conceptual solutions presented are not evidence based, but seem to rely on the authors own knowledge, experience and ideas. The choice of method is often not clearly stated in the articles. The studies are sometimes based on vague presumptions e.g. that RFID technology can improve a specific FM process.
The suggested IT solutions are most often aimed at supporting Information Management in FM, followed by Maintenance and Asset Management. Some common FM activities, such as Space Management, seem to be neglected.
Findings in the articles indicate that IT in general is in its early stages of diffusion into FM organizations.
Page 8 of 14
14thh EuroFM Research Symposium EuroFM Research Papers 2015
REFERENCES
Bainbridge, M., & Finch, E. F. (2009). Getting the attention the facilities manager deserves. Facilities, 27(7/8), 277–290.
Becerik-gerber, B., Asce, A. M., Jazizadeh, F., Li, N., & Calis, G. (2012). Application Areas and Data Requirements for BIM-Enabled Facilities Management, (March), 431–443.
Chen, H.-M., Hou, C.-C., & Wang, Y.-H. (2013). A 3D visualized expert system for maintenance and management of existing building facilities using reliability-based method. Expert Systems with Applications, 40(1), 287–299.
Eadie, R., Browne, M., Odeyinka, H., McKeown, C., & McNiff, S. (2013). BIM implementation throughout the UK construction project lifecycle: An analysis. Automation in Construction, 36(2013), 145–151.
East, E. W., Ph, D., Asce, F., Nisbet, N., & Liebich, T. (2013). Facility Management Handover Model View, (February), 61–67.
Elmualim, A., & Pelumi-Johnson, A. (2009). Application of computer-aided facilities management (CAFM) for intelligent buildings operation. Facilities, 27(11/12), 421–428.
Hallberg, D. (2011). On the use of open BIM and 4D visualisation in a predictive life cycle management system for construction works. Journal of Information Technology in Construction, 16, 445–466.
Hou, L., Wang, Y., & Wang, X. (2014). Combining Photogrammetry and Augmented Reality Towards an Integrated Facility Management System for the Oil Industry. Proceedings of the …, 102(2).
Hua, Y., Göçer, Ö., & Göçer, K. (2014). Spatial mapping of occupant satisfaction and indoor environment quality in a LEED platinum campus building. Building and Environment, 79, 124–137.
Irizarry, J., Gheisari, M., Williams, G., & Roper, K. (2014). Ambient intelligence environments for accessing building information: A healthcare facility management scenario. Facilities, 32(3), 120–138.
Irizarry, J., Gheisari, M., Williams, G., & Walker, B. N. (2013). InfoSPOT: A mobile Augmented Reality method for accessing building information through a situation awareness approach. Automation in Construction, 33(2013), 11–23.
Jung, J., Hong, S., Jeong, S., Kim, S., Cho, H., Hong, S., & Heo, J. (2014). Productive modeling for development of as-built BIM of existing indoor structures. Automation in Construction, 42, 68–77.
Kim, M. J., Wang, X., Love, P., Li, H., & Kang, S. (2013). Virtual reality for the built environment : A critical review of recent advances, 18(August), 279–305.
Klein, L., Li, N., & Becerik-Gerber, B. (2012). Imaged-based verification of as-built documentation of operational buildings. Automation in Construction, 21(2012), 161–171.
Ko, C.-H., Pan, N.-F., & Chiou, C.-C. (2013). Web-based radio frequency identification facility management systems. Structure and Infrastructure Engineering, 9(5), 465–480.
Kriksciuniene, D., Pitner, T., Kucera, A., & Sakalauskas, V. (2014). Data analysis in the intelligent building environment. International Journal of Computer Science and Applications, 11(1), 1–17.
Lai, J. H., & Yik, F. W. (2011). A probe into the facilities maintenance data of a hotel. Building Services Engineering Research and Technology, 33(2), 141–157.
Madritsch, T., & May, M. (2009). Successful IT implementation in facility management. Facilities, 27(11/12), 429–444.
Malatras, A., Asgari, A. H., & Baugé, T. (2008). Web Enabled Wireless Sensor Networks for Facilities Management. IEEE Systems Journal, 2(December), 500–512.
Manzoor, F., Linton, D., Loughlin, M., & Menzel, K. (2012). RFID based efficient lighting control, 4, 1–21. Motamedi, A., Hammad, A., & Asen, Y. (2014). Knowledge-assisted BIM-based visual analytics for failure root
cause detection in facilities management. Automation in Construction, 43, 73–83. Motamedi, A., Saini, R., Hammad, A., & Zhu, B. (2011). Role-based access to facilities lifecycle information on
RFID tags. Advanced Engineering Informatics, 25(3), 559–568. Motamedi, A., Soltani, M. M., & Hammad, A. (2013). Localization of RFID-equipped assets during the operation
phase of facilities. Advanced Engineering Informatics, 27(4), 566–579. Okoli, C., & Schabram, K. (2010). Working Papers on Information Systems A Guide to Conducting a Systematic
Literature Review of Information Systems Research (Vol. 10). Retrieved from http://sprouts.aisnet.org/10-26 Olbrich, M., Graf, H., Kahn, S., Engelke, T., Keil, J., Riess, P., … Picinbono, G. (2013). Augmented reality
supporting user-centric building information management. The Visual Computer, 29(10), 1093–1105. Otto, J. (2008). Implementation of future service requirements in building management. International Journal of
Environment and Pollution, 35(2/3/4), 265.
Page 9 of 14
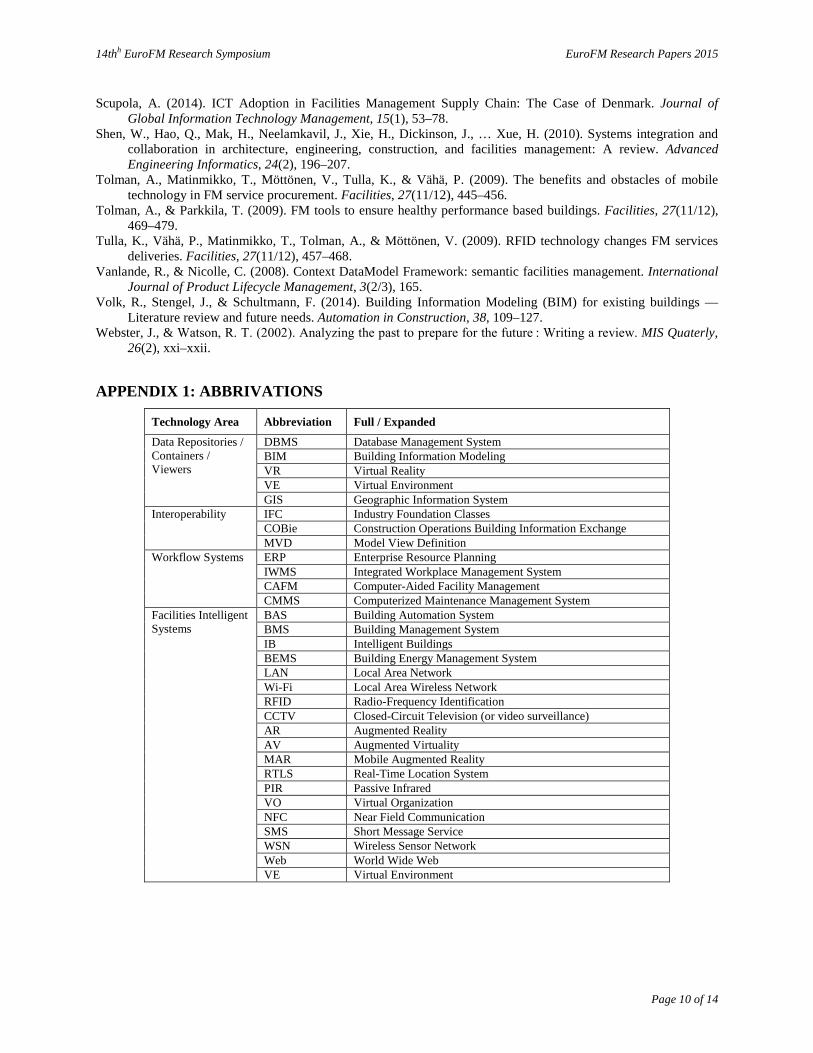
14thh EuroFM Research Symposium EuroFM Research Papers 2015
Scupola, A. (2014). ICT Adoption in Facilities Management Supply Chain: The Case of Denmark. Journal of Global Information Technology Management, 15(1), 53–78.
Shen, W., Hao, Q., Mak, H., Neelamkavil, J., Xie, H., Dickinson, J., … Xue, H. (2010). Systems integration and collaboration in architecture, engineering, construction, and facilities management: A review. Advanced Engineering Informatics, 24(2), 196–207.
Tolman, A., Matinmikko, T., Möttönen, V., Tulla, K., & Vähä, P. (2009). The benefits and obstacles of mobile technology in FM service procurement. Facilities, 27(11/12), 445–456.
Tolman, A., & Parkkila, T. (2009). FM tools to ensure healthy performance based buildings. Facilities, 27(11/12), 469–479.
Tulla, K., Vähä, P., Matinmikko, T., Tolman, A., & Möttönen, V. (2009). RFID technology changes FM services deliveries. Facilities, 27(11/12), 457–468.
Vanlande, R., & Nicolle, C. (2008). Context DataModel Framework: semantic facilities management. International Journal of Product Lifecycle Management, 3(2/3), 165.
Volk, R., Stengel, J., & Schultmann, F. (2014). Building Information Modeling (BIM) for existing buildings — Literature review and future needs. Automation in Construction, 38, 109–127.
Webster, J., & Watson, R. T. (2002). Analyzing the past to prepare for the future : Writing a review. MIS Quaterly, 26(2), xxi–xxii.
APPENDIX 1: ABBRIVATIONS
Technology Area Abbreviation Full / Expanded
Data Repositories / Containers / Viewers
DBMS Database Management System BIM Building Information Modeling VR Virtual Reality VE Virtual Environment GIS Geographic Information System
Interoperability IFC Industry Foundation Classes COBie Construction Operations Building Information Exchange MVD Model View Definition
Workflow Systems ERP Enterprise Resource Planning IWMS Integrated Workplace Management System CAFM Computer-Aided Facility Management CMMS Computerized Maintenance Management System
Facilities Intelligent Systems
BAS Building Automation System BMS Building Management System IB Intelligent Buildings BEMS Building Energy Management System LAN Local Area Network Wi-Fi Local Area Wireless Network RFID Radio-Frequency Identification CCTV Closed-Circuit Television (or video surveillance) AR Augmented Reality AV Augmented Virtuality MAR Mobile Augmented Reality RTLS Real-Time Location System PIR Passive Infrared VO Virtual Organization NFC Near Field Communication SMS Short Message Service WSN Wireless Sensor Network Web World Wide Web VE Virtual Environment
Page 10 of 14
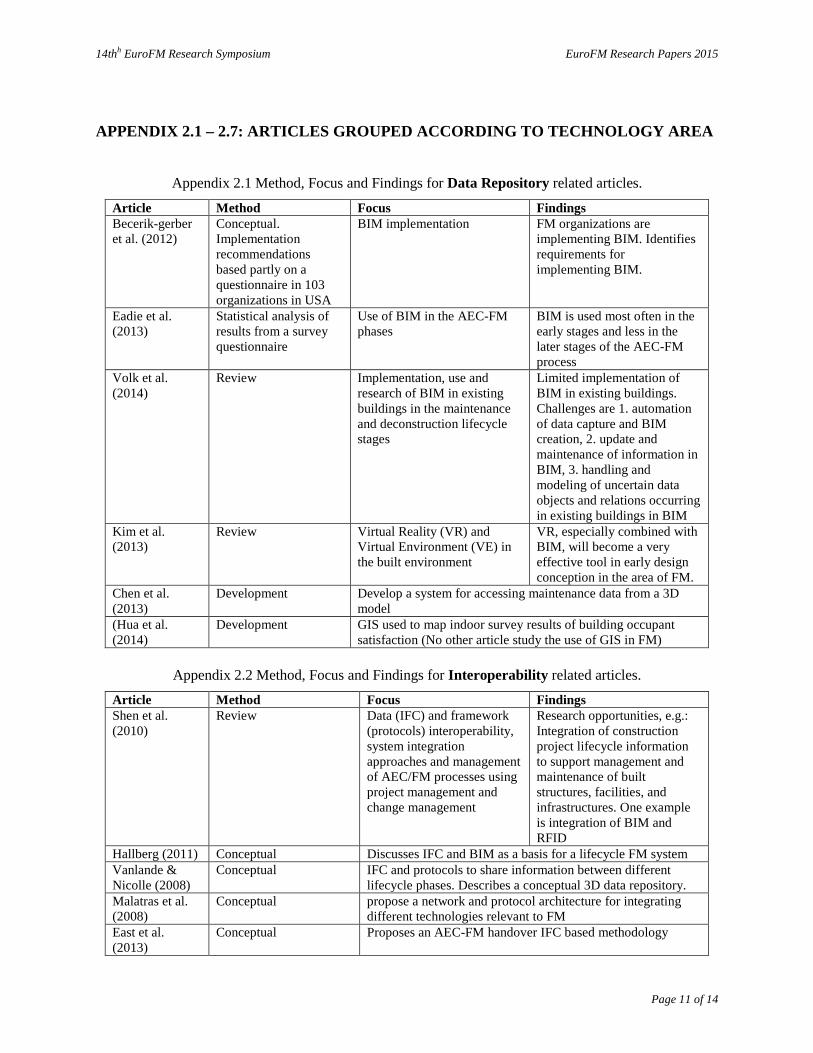
14thh EuroFM Research Symposium EuroFM Research Papers 2015
APPENDIX 2.1 – 2.7: ARTICLES GROUPED ACCORDING TO TECHNOLOGY AREA
Appendix 2.1 Method, Focus and Findings for Data Repository related articles.
Article Method Focus Findings Becerik-gerber et al. (2012)
Conceptual. Implementation recommendations based partly on a questionnaire in 103 organizations in USA
BIM implementation FM organizations are implementing BIM. Identifies requirements for implementing BIM.
Eadie et al. (2013)
Statistical analysis of results from a survey questionnaire
Use of BIM in the AEC-FM phases
BIM is used most often in the early stages and less in the later stages of the AEC-FM process
Volk et al. (2014)
Review Implementation, use and research of BIM in existing buildings in the maintenance and deconstruction lifecycle stages
Limited implementation of BIM in existing buildings. Challenges are 1. automation of data capture and BIM creation, 2. update and maintenance of information in BIM, 3. handling and modeling of uncertain data objects and relations occurring in existing buildings in BIM
Kim et al. (2013)
Review Virtual Reality (VR) and Virtual Environment (VE) in the built environment
VR, especially combined with BIM, will become a very effective tool in early design conception in the area of FM.
Chen et al. (2013)
Development Develop a system for accessing maintenance data from a 3D model
(Hua et al. (2014)
Development GIS used to map indoor survey results of building occupant satisfaction (No other article study the use of GIS in FM)
Appendix 2.2 Method, Focus and Findings for Interoperability related articles.
Article Method Focus Findings Shen et al. (2010)
Review Data (IFC) and framework (protocols) interoperability, system integration approaches and management of AEC/FM processes using project management and change management
Research opportunities, e.g.: Integration of construction project lifecycle information to support management and maintenance of built structures, facilities, and infrastructures. One example is integration of BIM and RFID
Hallberg (2011) Conceptual Discusses IFC and BIM as a basis for a lifecycle FM system Vanlande & Nicolle (2008)
Conceptual IFC and protocols to share information between different lifecycle phases. Describes a conceptual 3D data repository.
Malatras et al. (2008)
Conceptual propose a network and protocol architecture for integrating different technologies relevant to FM
East et al. (2013)
Conceptual Proposes an AEC-FM handover IFC based methodology
Page 11 of 14
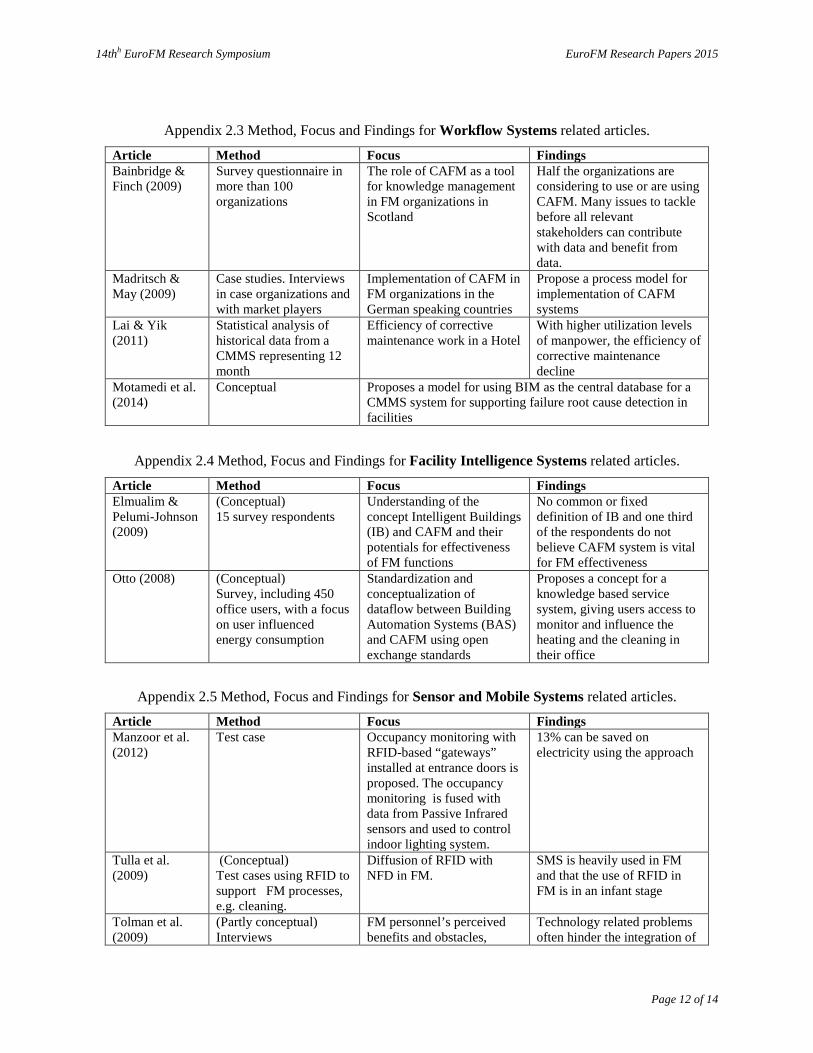
14thh EuroFM Research Symposium EuroFM Research Papers 2015
Appendix 2.3 Method, Focus and Findings for Workflow Systems related articles.
Article Method Focus Findings Bainbridge & Finch (2009)
Survey questionnaire in more than 100 organizations
The role of CAFM as a tool for knowledge management in FM organizations in Scotland
Half the organizations are considering to use or are using CAFM. Many issues to tackle before all relevant stakeholders can contribute with data and benefit from data.
Madritsch & May (2009)
Case studies. Interviews in case organizations and with market players
Implementation of CAFM in FM organizations in the German speaking countries
Propose a process model for implementation of CAFM systems
Lai & Yik (2011)
Statistical analysis of historical data from a CMMS representing 12 month
Efficiency of corrective maintenance work in a Hotel
With higher utilization levels of manpower, the efficiency of corrective maintenance decline
Motamedi et al. (2014)
Conceptual Proposes a model for using BIM as the central database for a CMMS system for supporting failure root cause detection in facilities
Appendix 2.4 Method, Focus and Findings for Facility Intelligence Systems related articles.
Article Method Focus Findings Elmualim & Pelumi-Johnson (2009)
(Conceptual) 15 survey respondents
Understanding of the concept Intelligent Buildings (IB) and CAFM and their potentials for effectiveness of FM functions
No common or fixed definition of IB and one third of the respondents do not believe CAFM system is vital for FM effectiveness
Otto (2008) (Conceptual) Survey, including 450 office users, with a focus on user influenced energy consumption
Standardization and conceptualization of dataflow between Building Automation Systems (BAS) and CAFM using open exchange standards
Proposes a concept for a knowledge based service system, giving users access to monitor and influence the heating and the cleaning in their office
Appendix 2.5 Method, Focus and Findings for Sensor and Mobile Systems related articles.
Article Method Focus Findings Manzoor et al. (2012)
Test case Occupancy monitoring with RFID-based “gateways” installed at entrance doors is proposed. The occupancy monitoring is fused with data from Passive Infrared sensors and used to control indoor lighting system.
13% can be saved on electricity using the approach
Tulla et al. (2009)
(Conceptual) Test cases using RFID to support FM processes, e.g. cleaning.
Diffusion of RFID with NFD in FM.
SMS is heavily used in FM and that the use of RFID in FM is in an infant stage
Tolman et al. (2009)
(Partly conceptual) Interviews
FM personnel’s perceived benefits and obstacles,
Technology related problems often hinder the integration of
Page 12 of 14
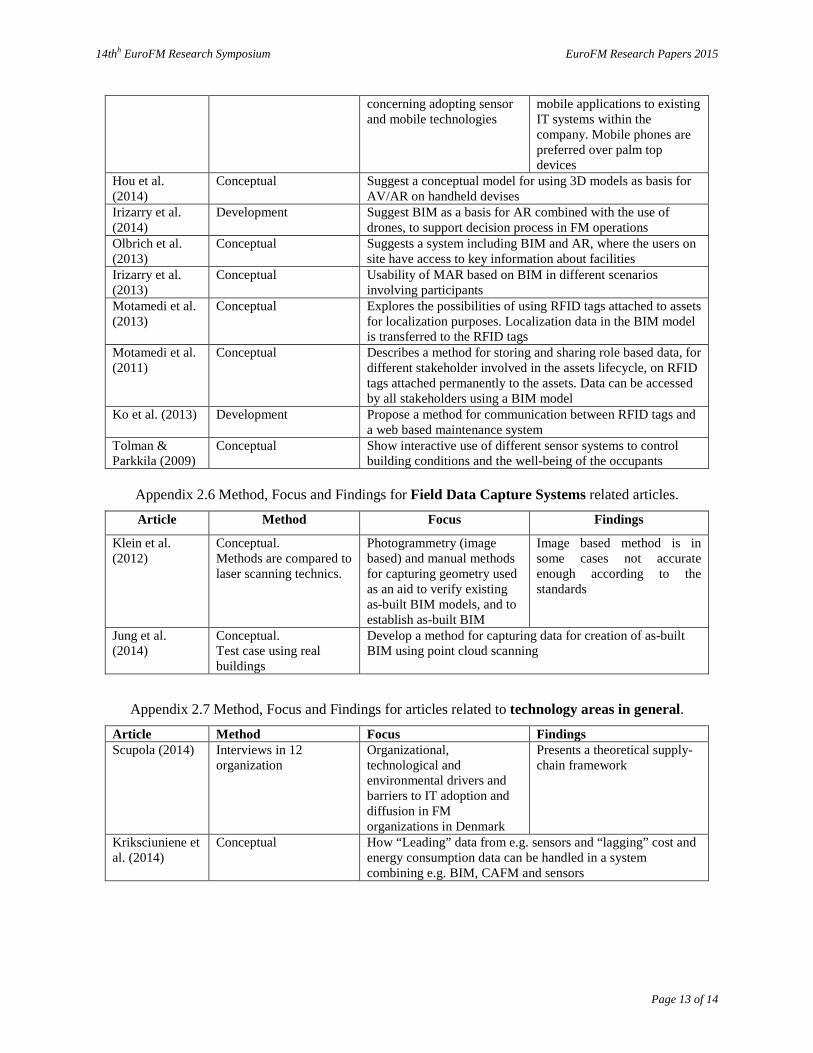
14thh EuroFM Research Symposium EuroFM Research Papers 2015
concerning adopting sensor and mobile technologies
mobile applications to existing IT systems within the company. Mobile phones are preferred over palm top devices
Hou et al. (2014)
Conceptual Suggest a conceptual model for using 3D models as basis for AV/AR on handheld devises
Irizarry et al. (2014)
Development Suggest BIM as a basis for AR combined with the use of drones, to support decision process in FM operations
Olbrich et al. (2013)
Conceptual Suggests a system including BIM and AR, where the users on site have access to key information about facilities
Irizarry et al. (2013)
Conceptual Usability of MAR based on BIM in different scenarios involving participants
Motamedi et al. (2013)
Conceptual Explores the possibilities of using RFID tags attached to assets for localization purposes. Localization data in the BIM model is transferred to the RFID tags
Motamedi et al. (2011)
Conceptual Describes a method for storing and sharing role based data, for different stakeholder involved in the assets lifecycle, on RFID tags attached permanently to the assets. Data can be accessed by all stakeholders using a BIM model
Ko et al. (2013) Development Propose a method for communication between RFID tags and a web based maintenance system
Tolman & Parkkila (2009)
Conceptual Show interactive use of different sensor systems to control building conditions and the well-being of the occupants
Appendix 2.6 Method, Focus and Findings for Field Data Capture Systems related articles.
Article Method Focus Findings
Klein et al. (2012)
Conceptual. Methods are compared to laser scanning technics.
Photogrammetry (image based) and manual methods for capturing geometry used as an aid to verify existing as-built BIM models, and to establish as-built BIM
Image based method is in some cases not accurate enough according to the standards
Jung et al. (2014)
Conceptual. Test case using real buildings
Develop a method for capturing data for creation of as-built BIM using point cloud scanning
Appendix 2.7 Method, Focus and Findings for articles related to technology areas in general.
Article Method Focus Findings Scupola (2014) Interviews in 12
organization Organizational, technological and environmental drivers and barriers to IT adoption and diffusion in FM organizations in Denmark
Presents a theoretical supply-chain framework
Kriksciuniene et al. (2014)
Conceptual How “Leading” data from e.g. sensors and “lagging” cost and energy consumption data can be handled in a system combining e.g. BIM, CAFM and sensors
Page 13 of 14
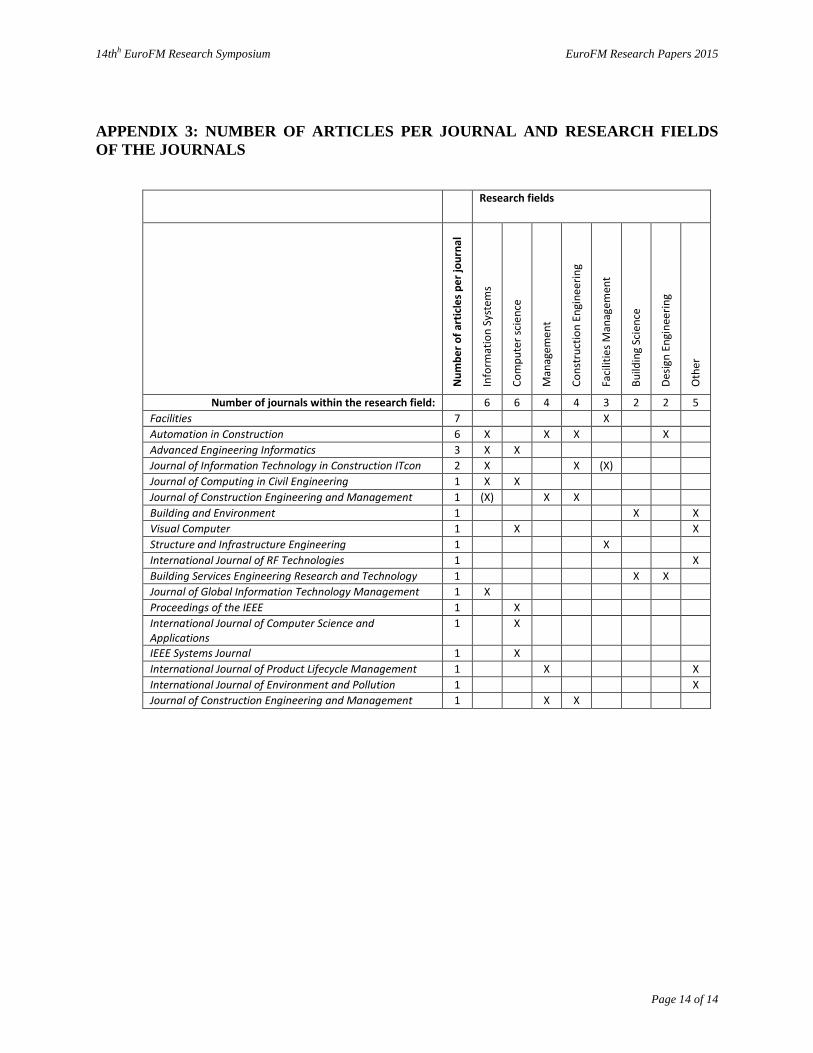
14thh EuroFM Research Symposium EuroFM Research Papers 2015
APPENDIX 3: NUMBER OF ARTICLES PER JOURNAL AND RESEARCH FIELDS OF THE JOURNALS
Research fields
Num
ber o
f art
icle
s per
jour
nal
Info
rmat
ion
Syst
ems
Com
pute
r sci
ence
Man
agem
ent
Cons
truc
tion
Engi
neer
ing
Faci
litie
s Man
agem
ent
Build
ing
Scie
nce
Desig
n En
gine
erin
g
Oth
er
Number of journals within the research field: 6 6 4 4 3 2 2 5 Facilities 7 X Automation in Construction 6 X X X X Advanced Engineering Informatics 3 X X Journal of Information Technology in Construction ITcon 2 X X (X) Journal of Computing in Civil Engineering 1 X X Journal of Construction Engineering and Management 1 (X) X X Building and Environment 1 X X Visual Computer 1 X X Structure and Infrastructure Engineering 1 X International Journal of RF Technologies 1 X Building Services Engineering Research and Technology 1 X X Journal of Global Information Technology Management 1 X Proceedings of the IEEE 1 X International Journal of Computer Science and Applications
1 X
IEEE Systems Journal 1 X International Journal of Product Lifecycle Management 1 X X International Journal of Environment and Pollution 1 X Journal of Construction Engineering and Management 1 X X
Page 14 of 14

PAPER 3 APPLYING DISPLAYS EARLY
Ebbesen 2015a. Applying Displays early in Process Research Studies. In 7th International Process Symposium.
Paper for the Researching Process Workshop (b) at the Seventh International Symposium on Process Organization Studies 2015 Poul Ebbesen / June 15, 2015
APPLYING DISPLAYS EARLY IN PROCESS RESEARCH STUDIES
Poul Ebbesen Technical University of Denmark, DTU, Department of Management Engineering
[email protected] DTU, Produktionstorvet, 2800 Kongens Lyngby, Denmark
Abstract
Literature on qualitative studies tends to be frontend oriented, that is being predominantly focused on the early stages of the research process, therefore leaving less focus e.g. on how data and findings should be disseminated and displayed. This paper aims to propose and present an approach focusing on how to present research results, by introducing visual displays in the frontend stages of the research process. The proposed Early Display Introduction (EDI) approach can help to reveal patterns and relationships in data already during the data collection stage and early in the data analysis stage. The approach is applied to a current qualitative study in information system (IS) implementation processes in facilities management (FM) departments.
Keywords: Visual Displays, Qualitative Research, Process Research, Implementation Processes, Information Systems, Facilities Management
1. Introduction
Literature on qualitative studies tends to be frontend oriented, that is being mostly focused on the early stages of the research process, and therefore leaving less focus on e.g. how data and findings should be displayed.
An early focus on presentation of research results can be achieved by using displays, which in this paper is understood according to Miles and Hubermann (1994 in Dahler-Larsen, 2008: 111): “displays are constructed to present a complete set of data in one place, simultaneously facilitating an answer to the research question”. Displays exist in various forms and they are often developed specifically to fit the research. Different types of displays can be found e.g. in Miles, Huberman, & Saldaña (1985), Williamson & Long (2005), Dahler-Larsen (2008) and Dahler-Larsen (2010). A flow-chart is an example of a display useful in process research (Langley, 1999), but many other types of displays can be useful, such as matrix displays.
The aim of this paper is to propose and present a method where displays are introduced early in the research process, thereby guiding the research and helping condensing the often large amount of qualitative empirical data. This focus in the early stages of a study, on how to present research results, can reveal patterns and relationships in data already during the data collection stage and early in the data analysis stage.
1
Paper for the Researching Process Workshop (b) at the Seventh International Symposium on Process Organization Studies 2015 Poul Ebbesen / June 15, 2015 Such use of displays early in the research process is exemplified by describing how the method was applied to the author’s current PhD research project. The project has a focus on IS implementation processes.
The structure of this paper is as follows. In section 2. “State of the art / Displays in Process Research” some main types of displays used in qualitative research and specifically in process research is presented. Furthermore a method often used in process research is described. In 3. “Early Introduction of Displays” the proposed method is presented and juxtaposed with the more traditional late display introduction method. How the choice of display introduction affects the research approach, e.g. inductive or deductive research approaches, is also discussed. Section 4. “Applying Early Introduction of Displays - A Research Case” is reviewing how the method was used in a current study. In 5. “Discussion/Conclusion” the method is discussed and additional suggestions for further research are given.
2. State of the art / Displays in Process Research
Displays A display is a visual format which presents information systematically so that the user can draw conclusions and take needed action (Miles et al., 2014: 108). A main goal of data displays is to provide ready access to information and convey a message. Displays can also be used as visual representations of emerging theories (Verdinelli & Scagnoli, 2013). In this paper visual displays and displays covers the same concept and a data display is understood as a sup type.
Displays in Qualitative Research A common choice of standard visual modes of presentation does not exist for qualitative inquiries (Kvale & Brinkmann, 2008: 208). Types and formats of quantitative visual displays are well established. For instance, they can be categorized in 11 different kinds of displays: bar graphs, histograms, line graphs, plots, drawings, combination graphs, pie graphs, dendrograms, stem-and-leaf plots, charts and photographs (Nicola and Pexman 2010) in (Verdinelli & Scagnoli, 2013). This is not the case in qualitative research where there is no consistency in the literature with regards to labelling specific visual displays (Verdinelli & Scagnoli, 2013).
In the well know guide book for qualitative research by Miles et al. (2014) focus is on two specific types of families of formats for displaying qualitative data; matrices and networks. They also investigate the different types of data entries or content which can be inserted into displays such as text, variable labels, codes, symbolic figures, lines, arrows etc. Display format and content depends on what the researcher is trying to understand: a general situation, detailed chronologies, the action of people in different roles, the interplay of variables etc. Format must always be driven by the research questions and the developing concepts. Formatting determines which variable will be analysed in which way. And it depends on how far along the researcher is in the study process and on which priority it has a the specific moment (Miles et al., 2014: 109).
In Dahler-Larsen (2008) three general rules for using displays are suggested; rule of authenticity, rule of inclusion and rule of transparency. The use of these rules is exemplified with display types
2
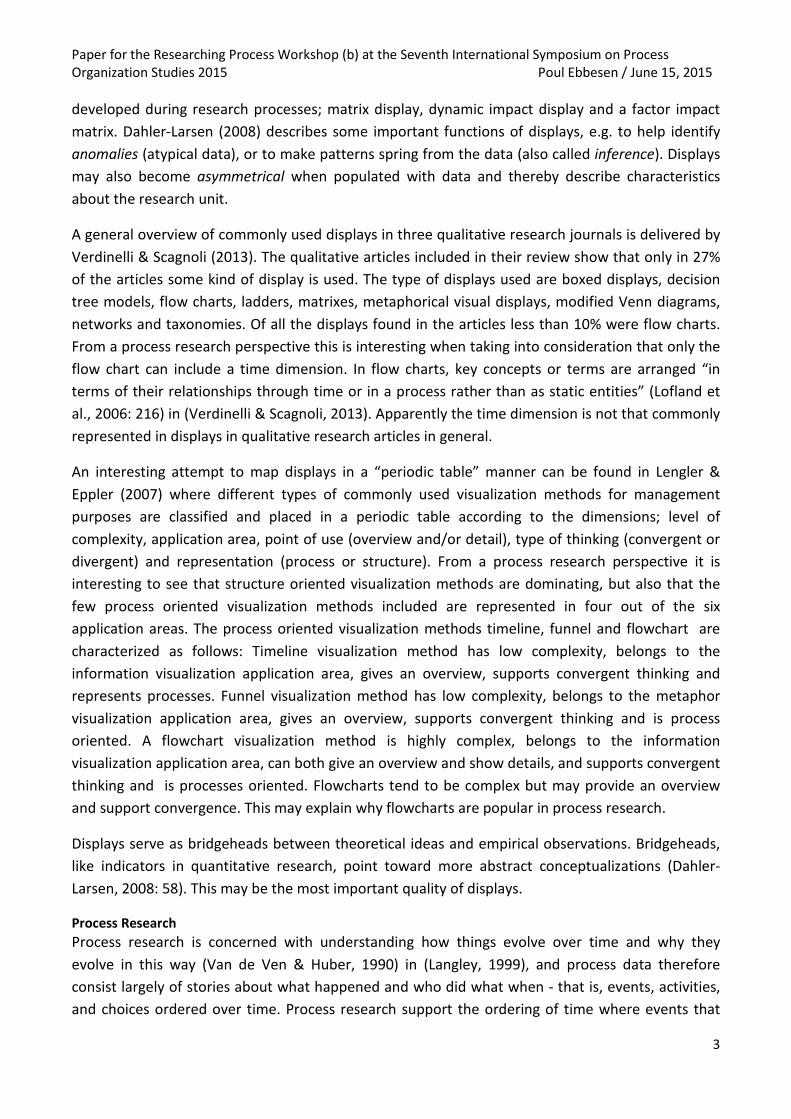
Paper for the Researching Process Workshop (b) at the Seventh International Symposium on Process Organization Studies 2015 Poul Ebbesen / June 15, 2015 developed during research processes; matrix display, dynamic impact display and a factor impact matrix. Dahler-Larsen (2008) describes some important functions of displays, e.g. to help identify anomalies (atypical data), or to make patterns spring from the data (also called inference). Displays may also become asymmetrical when populated with data and thereby describe characteristics about the research unit.
A general overview of commonly used displays in three qualitative research journals is delivered by Verdinelli & Scagnoli (2013). The qualitative articles included in their review show that only in 27% of the articles some kind of display is used. The type of displays used are boxed displays, decision tree models, flow charts, ladders, matrixes, metaphorical visual displays, modified Venn diagrams, networks and taxonomies. Of all the displays found in the articles less than 10% were flow charts. From a process research perspective this is interesting when taking into consideration that only the flow chart can include a time dimension. In flow charts, key concepts or terms are arranged “in terms of their relationships through time or in a process rather than as static entities” (Lofland et al., 2006: 216) in (Verdinelli & Scagnoli, 2013). Apparently the time dimension is not that commonly represented in displays in qualitative research articles in general.
An interesting attempt to map displays in a “periodic table” manner can be found in Lengler & Eppler (2007) where different types of commonly used visualization methods for management purposes are classified and placed in a periodic table according to the dimensions; level of complexity, application area, point of use (overview and/or detail), type of thinking (convergent or divergent) and representation (process or structure). From a process research perspective it is interesting to see that structure oriented visualization methods are dominating, but also that the few process oriented visualization methods included are represented in four out of the six application areas. The process oriented visualization methods timeline, funnel and flowchart are characterized as follows: Timeline visualization method has low complexity, belongs to the information visualization application area, gives an overview, supports convergent thinking and represents processes. Funnel visualization method has low complexity, belongs to the metaphor visualization application area, gives an overview, supports convergent thinking and is process oriented. A flowchart visualization method is highly complex, belongs to the information visualization application area, can both give an overview and show details, and supports convergent thinking and is processes oriented. Flowcharts tend to be complex but may provide an overview and support convergence. This may explain why flowcharts are popular in process research.
Displays serve as bridgeheads between theoretical ideas and empirical observations. Bridgeheads, like indicators in quantitative research, point toward more abstract conceptualizations (Dahler-Larsen, 2008: 58). This may be the most important quality of displays.
Process Research Process research is concerned with understanding how things evolve over time and why they evolve in this way (Van de Ven & Huber, 1990) in (Langley, 1999), and process data therefore consist largely of stories about what happened and who did what when - that is, events, activities, and choices ordered over time. Process research support the ordering of time where events that
3
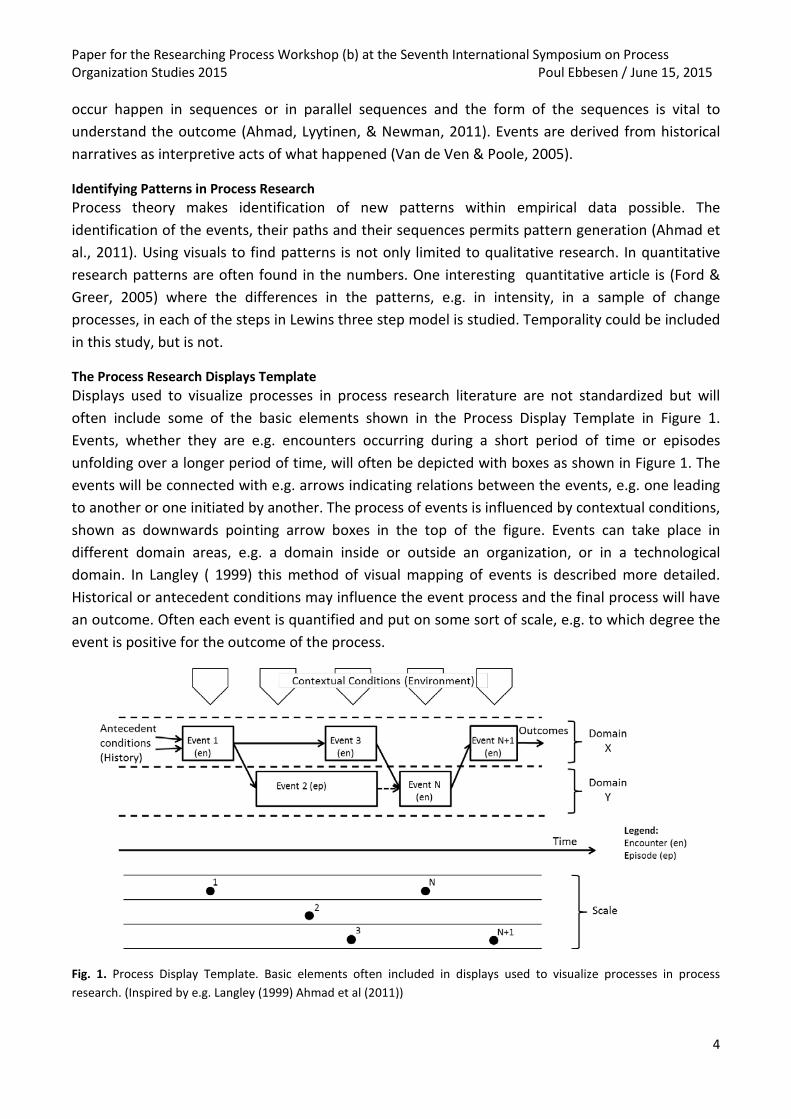
Paper for the Researching Process Workshop (b) at the Seventh International Symposium on Process Organization Studies 2015 Poul Ebbesen / June 15, 2015 occur happen in sequences or in parallel sequences and the form of the sequences is vital to understand the outcome (Ahmad, Lyytinen, & Newman, 2011). Events are derived from historical narratives as interpretive acts of what happened (Van de Ven & Poole, 2005).
Identifying Patterns in Process Research Process theory makes identification of new patterns within empirical data possible. The identification of the events, their paths and their sequences permits pattern generation (Ahmad et al., 2011). Using visuals to find patterns is not only limited to qualitative research. In quantitative research patterns are often found in the numbers. One interesting quantitative article is (Ford & Greer, 2005) where the differences in the patterns, e.g. in intensity, in a sample of change processes, in each of the steps in Lewins three step model is studied. Temporality could be included in this study, but is not.
The Process Research Displays Template Displays used to visualize processes in process research literature are not standardized but will often include some of the basic elements shown in the Process Display Template in Figure 1. Events, whether they are e.g. encounters occurring during a short period of time or episodes unfolding over a longer period of time, will often be depicted with boxes as shown in Figure 1. The events will be connected with e.g. arrows indicating relations between the events, e.g. one leading to another or one initiated by another. The process of events is influenced by contextual conditions, shown as downwards pointing arrow boxes in the top of the figure. Events can take place in different domain areas, e.g. a domain inside or outside an organization, or in a technological domain. In Langley ( 1999) this method of visual mapping of events is described more detailed. Historical or antecedent conditions may influence the event process and the final process will have an outcome. Often each event is quantified and put on some sort of scale, e.g. to which degree the event is positive for the outcome of the process.
Fig. 1. Process Display Template. Basic elements often included in displays used to visualize processes in process research. (Inspired by e.g. Langley (1999) Ahmad et al (2011))
4
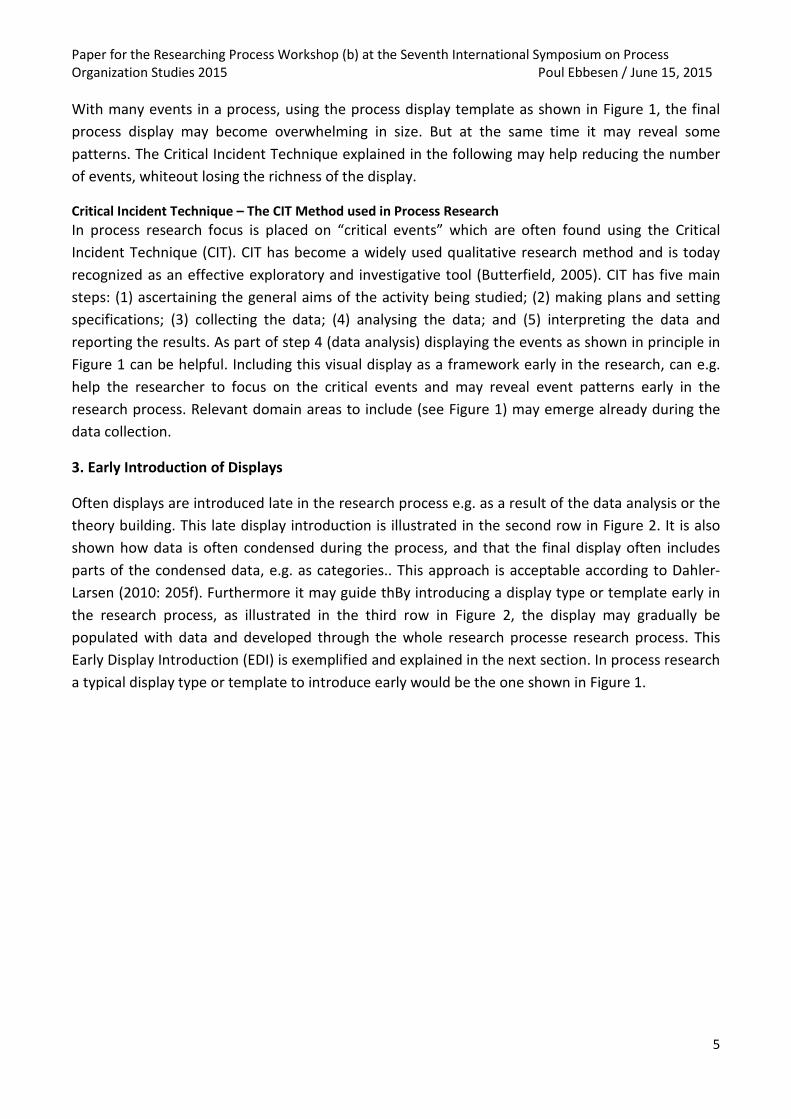
Paper for the Researching Process Workshop (b) at the Seventh International Symposium on Process Organization Studies 2015 Poul Ebbesen / June 15, 2015 With many events in a process, using the process display template as shown in Figure 1, the final process display may become overwhelming in size. But at the same time it may reveal some patterns. The Critical Incident Technique explained in the following may help reducing the number of events, whiteout losing the richness of the display.
Critical Incident Technique – The CIT Method used in Process Research In process research focus is placed on “critical events” which are often found using the Critical Incident Technique (CIT). CIT has become a widely used qualitative research method and is today recognized as an effective exploratory and investigative tool (Butterfield, 2005). CIT has five main steps: (1) ascertaining the general aims of the activity being studied; (2) making plans and setting specifications; (3) collecting the data; (4) analysing the data; and (5) interpreting the data and reporting the results. As part of step 4 (data analysis) displaying the events as shown in principle in Figure 1 can be helpful. Including this visual display as a framework early in the research, can e.g. help the researcher to focus on the critical events and may reveal event patterns early in the research process. Relevant domain areas to include (see Figure 1) may emerge already during the data collection.
3. Early Introduction of Displays
Often displays are introduced late in the research process e.g. as a result of the data analysis or the theory building. This late display introduction is illustrated in the second row in Figure 2. It is also shown how data is often condensed during the process, and that the final display often includes parts of the condensed data, e.g. as categories.. This approach is acceptable according to Dahler-Larsen (2010: 205f). Furthermore it may guide thBy introducing a display type or template early in the research process, as illustrated in the third row in Figure 2, the display may gradually be populated with data and developed through the whole research processe research process. This Early Display Introduction (EDI) is exemplified and explained in the next section. In process research a typical display type or template to introduce early would be the one shown in Figure 1.
5
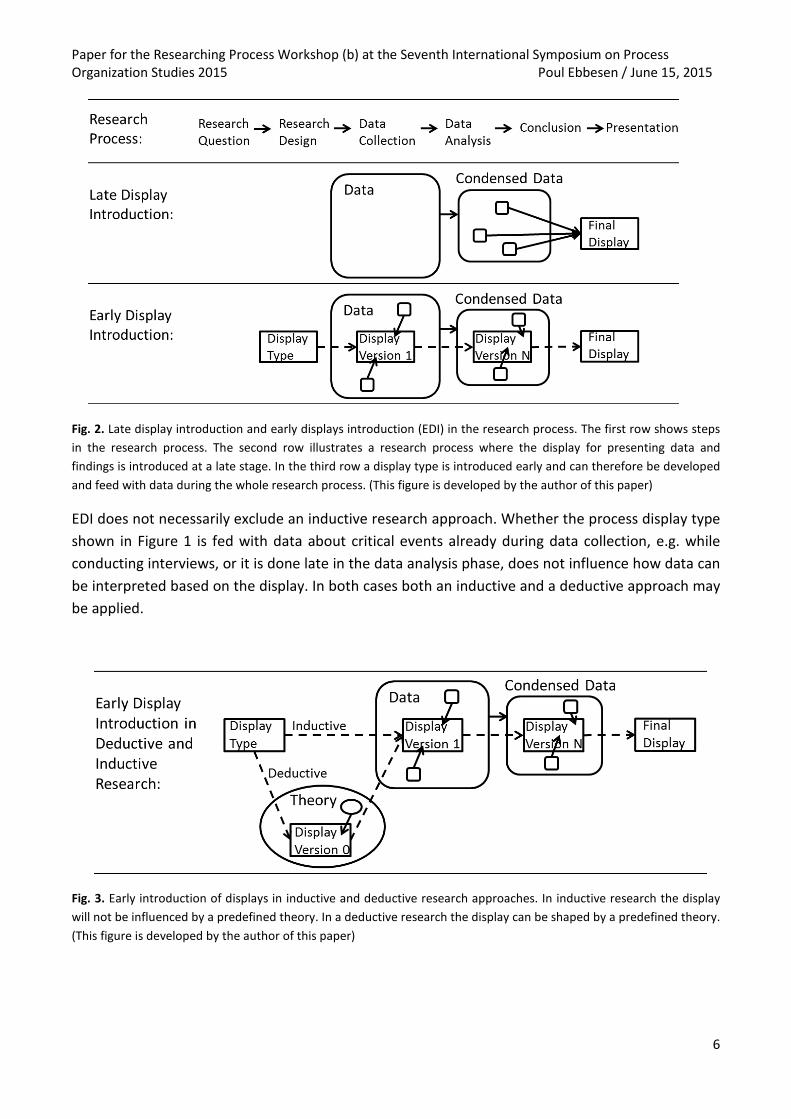
Paper for the Researching Process Workshop (b) at the Seventh International Symposium on Process Organization Studies 2015 Poul Ebbesen / June 15, 2015
Fig. 2. Late display introduction and early displays introduction (EDI) in the research process. The first row shows steps in the research process. The second row illustrates a research process where the display for presenting data and findings is introduced at a late stage. In the third row a display type is introduced early and can therefore be developed and feed with data during the whole research process. (This figure is developed by the author of this paper)
EDI does not necessarily exclude an inductive research approach. Whether the process display type shown in Figure 1 is fed with data about critical events already during data collection, e.g. while conducting interviews, or it is done late in the data analysis phase, does not influence how data can be interpreted based on the display. In both cases both an inductive and a deductive approach may be applied.
Fig. 3. Early introduction of displays in inductive and deductive research approaches. In inductive research the display will not be influenced by a predefined theory. In a deductive research the display can be shaped by a predefined theory. (This figure is developed by the author of this paper)
6
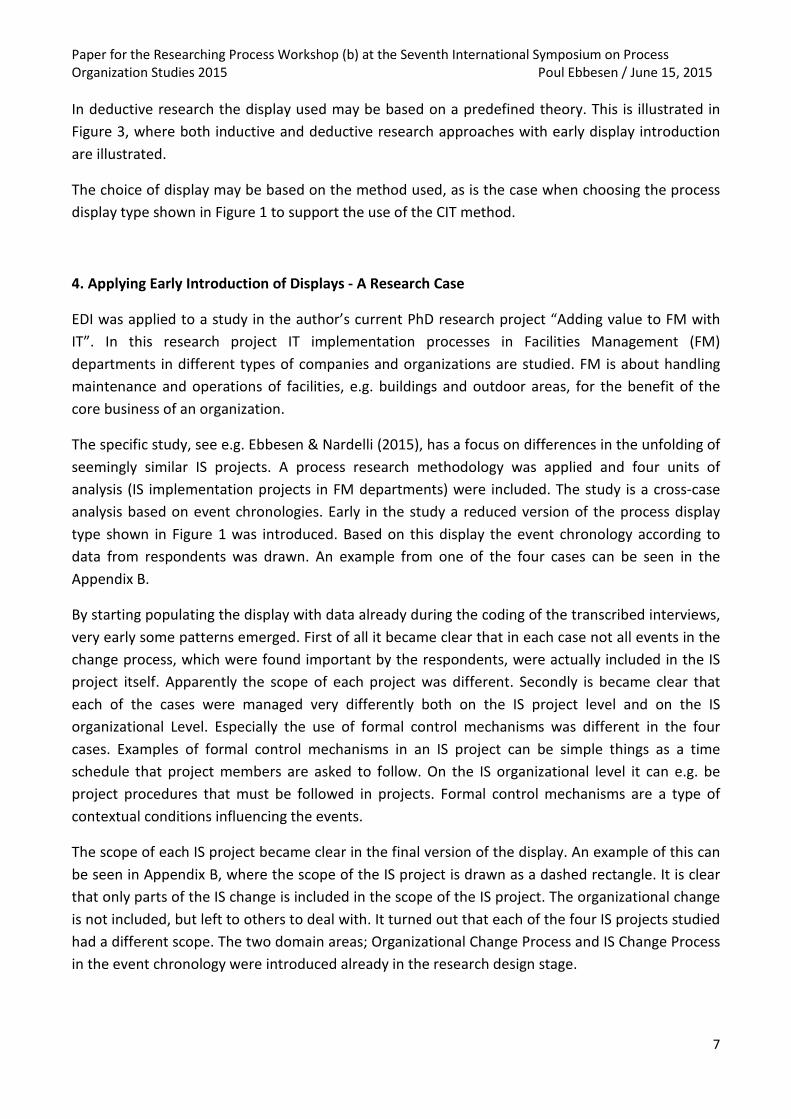
Paper for the Researching Process Workshop (b) at the Seventh International Symposium on Process Organization Studies 2015 Poul Ebbesen / June 15, 2015 In deductive research the display used may be based on a predefined theory. This is illustrated in Figure 3, where both inductive and deductive research approaches with early display introduction are illustrated.
The choice of display may be based on the method used, as is the case when choosing the process display type shown in Figure 1 to support the use of the CIT method.
4. Applying Early Introduction of Displays - A Research Case
EDI was applied to a study in the author’s current PhD research project “Adding value to FM with IT”. In this research project IT implementation processes in Facilities Management (FM) departments in different types of companies and organizations are studied. FM is about handling maintenance and operations of facilities, e.g. buildings and outdoor areas, for the benefit of the core business of an organization.
The specific study, see e.g. Ebbesen & Nardelli (2015), has a focus on differences in the unfolding of seemingly similar IS projects. A process research methodology was applied and four units of analysis (IS implementation projects in FM departments) were included. The study is a cross-case analysis based on event chronologies. Early in the study a reduced version of the process display type shown in Figure 1 was introduced. Based on this display the event chronology according to data from respondents was drawn. An example from one of the four cases can be seen in the Appendix B.
By starting populating the display with data already during the coding of the transcribed interviews, very early some patterns emerged. First of all it became clear that in each case not all events in the change process, which were found important by the respondents, were actually included in the IS project itself. Apparently the scope of each project was different. Secondly is became clear that each of the cases were managed very differently both on the IS project level and on the IS organizational Level. Especially the use of formal control mechanisms was different in the four cases. Examples of formal control mechanisms in an IS project can be simple things as a time schedule that project members are asked to follow. On the IS organizational level it can e.g. be project procedures that must be followed in projects. Formal control mechanisms are a type of contextual conditions influencing the events.
The scope of each IS project became clear in the final version of the display. An example of this can be seen in Appendix B, where the scope of the IS project is drawn as a dashed rectangle. It is clear that only parts of the IS change is included in the scope of the IS project. The organizational change is not included, but left to others to deal with. It turned out that each of the four IS projects studied had a different scope. The two domain areas; Organizational Change Process and IS Change Process in the event chronology were introduced already in the research design stage.
7
Paper for the Researching Process Workshop (b) at the Seventh International Symposium on Process Organization Studies 2015 Poul Ebbesen / June 15, 2015 The differences in use of formal control mechanisms in the four cases could not be illustrated in an good way in the process display type. Therefore a new matrix display was introduced late in the study process (in the analysis phase). The final version of this display was named Formality Matrix. See Appendix A.
5. Discussion / Conclusion
In general displays shows connections between data, communicate findings, promote transparency of the analysis process, assist data analysis and theory building (Williamson & Long, 2005). Early introducing of displays may speed up such goals.
But how can a display, fit to be introduced early in a study, be identified? Deciding which display(s) to choose must be made against the underlying aims of the research study (Williamson & Long, 2005). So already during the research design the researcher should consider which display to use. The case study included in this paper shows that even when introducing a “standard” display early in the process, some unexpected patterns may occur that point towards interesting findings. The study case also shows that displays introduced early can be modified to fit these patterns; scope was added to the event chronology display. Other types of displays may become relevant to be introduced later if theorizing is done during the research process; the formality matrix was introduced late in the research process.
A main criteria for a display introduced early appears to be the match with the chosen research method. A display introduced early in process research should e.g. have a timeline. A deductive research approach may require displays based on the theory applied. If differences in use of formal control mechanisms on the two levels had been assumed before the data was analysed, then a display based on this assumption or theory could have been introduced early in the case study.
What are the pitfalls when introducing displays early? “One of the negative side effects of a display may be that at an early stage it ends up working as a Procrustean bed that data is forcefully fitted into, and that there is too much focus on the mechanical aspects rather than the epistemological aspects of an inquiry” (Dahler-Larsen, 2008). In other words, there is a risk that data is forcefully manipulated to fit the display, and that relevant data not fit for the display is left out.
With the large amount of data often included in qualitative research, approaches such as Early Display Introduction (EDI) are needed to help create an overview and to condense data. How to cope with possible pitfalls should be studied in further research. Further research should also focus on methods and criteria for choosing and creating displays suitable for early introduction.
8
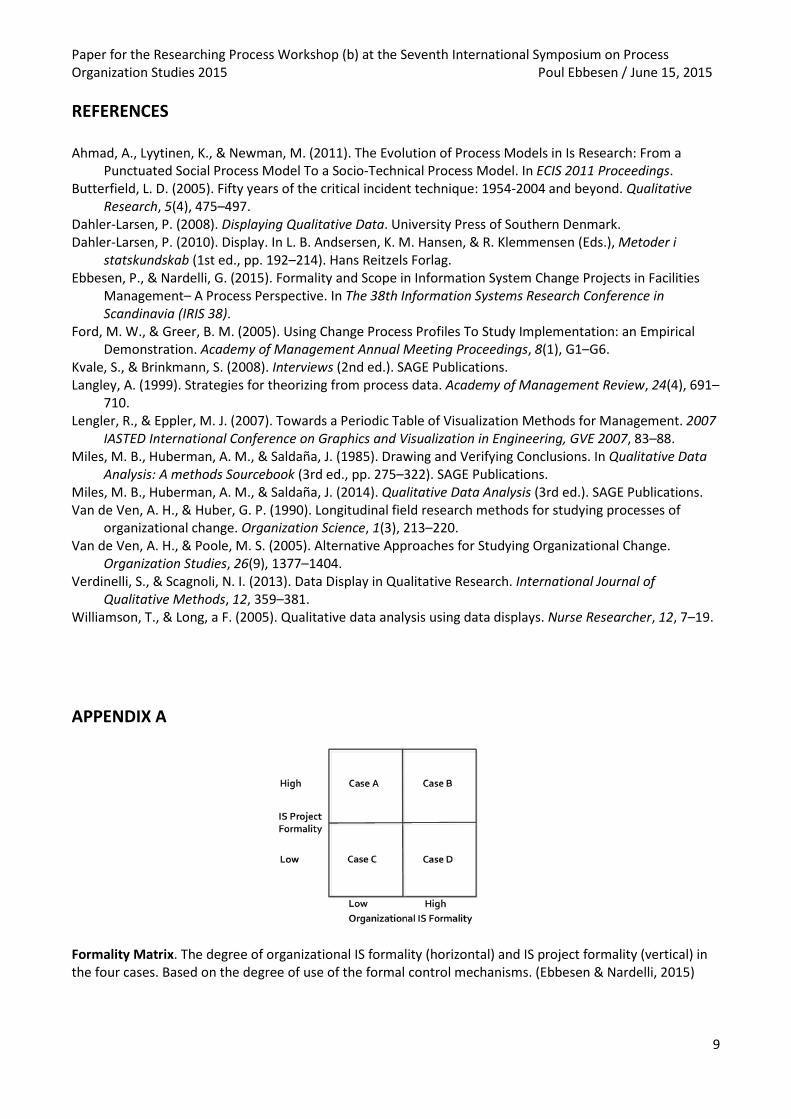
Paper for the Researching Process Workshop (b) at the Seventh International Symposium on Process Organization Studies 2015 Poul Ebbesen / June 15, 2015 REFERENCES
Ahmad, A., Lyytinen, K., & Newman, M. (2011). The Evolution of Process Models in Is Research: From a Punctuated Social Process Model To a Socio-Technical Process Model. In ECIS 2011 Proceedings.
Butterfield, L. D. (2005). Fifty years of the critical incident technique: 1954-2004 and beyond. Qualitative Research, 5(4), 475–497.
Dahler-Larsen, P. (2008). Displaying Qualitative Data. University Press of Southern Denmark. Dahler-Larsen, P. (2010). Display. In L. B. Andsersen, K. M. Hansen, & R. Klemmensen (Eds.), Metoder i
statskundskab (1st ed., pp. 192–214). Hans Reitzels Forlag. Ebbesen, P., & Nardelli, G. (2015). Formality and Scope in Information System Change Projects in Facilities
Management– A Process Perspective. In The 38th Information Systems Research Conference in Scandinavia (IRIS 38).
Ford, M. W., & Greer, B. M. (2005). Using Change Process Profiles To Study Implementation: an Empirical Demonstration. Academy of Management Annual Meeting Proceedings, 8(1), G1–G6.
Kvale, S., & Brinkmann, S. (2008). Interviews (2nd ed.). SAGE Publications. Langley, A. (1999). Strategies for theorizing from process data. Academy of Management Review, 24(4), 691–
710. Lengler, R., & Eppler, M. J. (2007). Towards a Periodic Table of Visualization Methods for Management. 2007
IASTED International Conference on Graphics and Visualization in Engineering, GVE 2007, 83–88. Miles, M. B., Huberman, A. M., & Saldaña, J. (1985). Drawing and Verifying Conclusions. In Qualitative Data
Analysis: A methods Sourcebook (3rd ed., pp. 275–322). SAGE Publications. Miles, M. B., Huberman, A. M., & Saldaña, J. (2014). Qualitative Data Analysis (3rd ed.). SAGE Publications. Van de Ven, A. H., & Huber, G. P. (1990). Longitudinal field research methods for studying processes of
organizational change. Organization Science, 1(3), 213–220. Van de Ven, A. H., & Poole, M. S. (2005). Alternative Approaches for Studying Organizational Change.
Organization Studies, 26(9), 1377–1404. Verdinelli, S., & Scagnoli, N. I. (2013). Data Display in Qualitative Research. International Journal of
Qualitative Methods, 12, 359–381. Williamson, T., & Long, a F. (2005). Qualitative data analysis using data displays. Nurse Researcher, 12, 7–19.
APPENDIX A
Formality Matrix. The degree of organizational IS formality (horizontal) and IS project formality (vertical) in the four cases. Based on the degree of use of the formal control mechanisms. (Ebbesen & Nardelli, 2015)
9
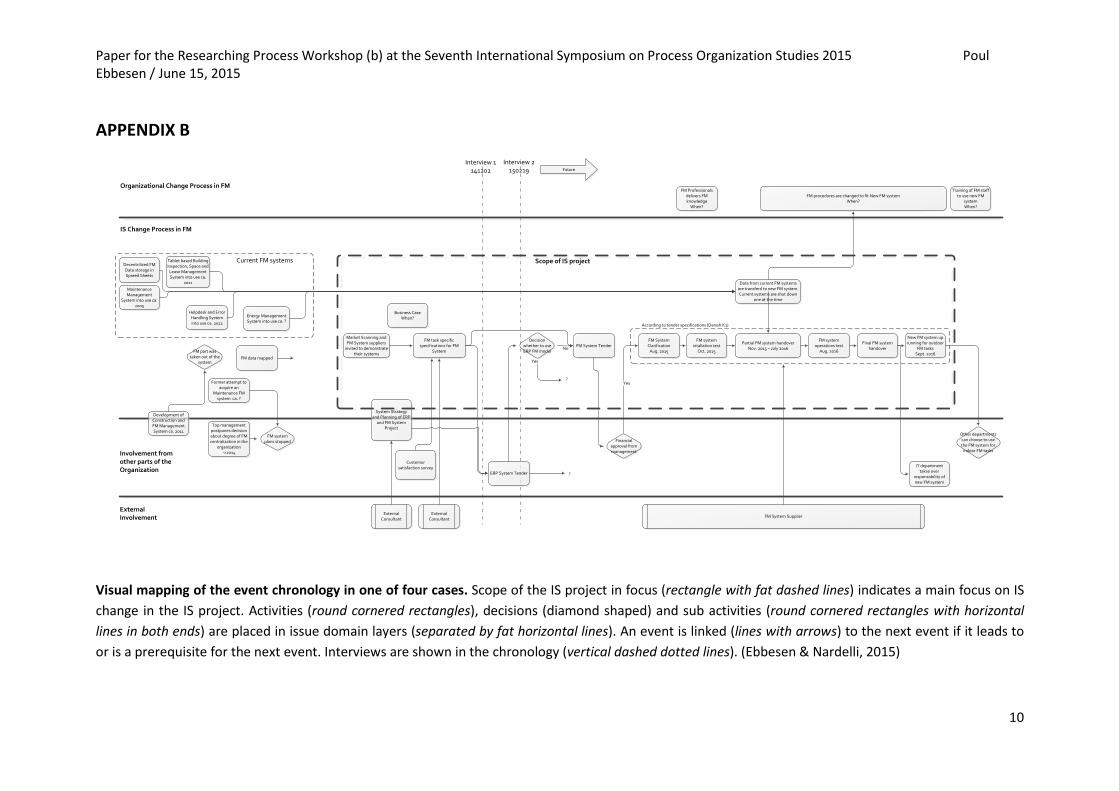
Paper for the Researching Process Workshop (b) at the Seventh International Symposium on Process Organization Studies 2015 Poul Ebbesen / June 15, 2015
APPENDIX B
Market Scanning and FM System suppliers
invited to demonstrate their systems
FM task specific specifications for FM
System
External Consultant
FM data mapped
FM System TenderFM System Clarification
Aug. 2015
FM System Supplier
Interview 2 150219
Custemor satisfaction survey
Former attempt to acquire an
Maintenance FM system ca. ?
Top management postpones decision about degree of FM centralization in the
organization ->2014
FM system plans stopped
New FM system up running for outdoor
FM tasksSept. 2016
Other departments can choose to use the FM system for
indoor FM tasks
Maintenance Management
System into use ca. 2005
Tablet based Building Inspection, Space and
Lease Management System into use ca.
2011
Helpdesk and Error Handling System into use ca. 2012
Energy Management System into use ca. ?
Development of Construction and FM Management System ca. 2011
FM part was taken out of the
system
FutureInterview 1
141202
Involvement from other parts of the Organization
External Involvement
ERP System Tender
System Strategy and Planning of ERP
and FM System Project
External Consultant
Decision whether to use ERP FM modul
No
Yes
Financial approval from management
Yes
FM procedures are changed to fit New FM system When?
Scope of IS projectDecentrilized FM Data storage in Spreed Sheets
IS Change Process in FM
Organizational Change Process in FMFM Professionals
delivers FM knowledge
When?
Data from current FM systems are transferd to new FM system. Current systems are shut down
one at the time
Current FM systems
FM system intallation test
Oct. 2015
Partial FM system handover Nov. 2015 – July 2016
FM system operations test
Aug. 2016
Final FM system handover
?
?
According to tender specifications (Danish K1)
Training of FM staff to use new FM
systemWhen?
IT department takse over
responsobility of new FM system
Business Case When?
Visual mapping of the event chronology in one of four cases. Scope of the IS project in focus (rectangle with fat dashed lines) indicates a main focus on IS change in the IS project. Activities (round cornered rectangles), decisions (diamond shaped) and sub activities (round cornered rectangles with horizontal lines in both ends) are placed in issue domain layers (separated by fat horizontal lines). An event is linked (lines with arrows) to the next event if it leads to or is a prerequisite for the next event. Interviews are shown in the chronology (vertical dashed dotted lines). (Ebbesen & Nardelli, 2015)
10

PAPER 4 FORMAL CONTROL AND SCOPE
Ebbesen, P. & Nardelli, G., 2015. Formal Control and Scope in Information System Projects in Facilities Management – A Process Perspective. In The 38th Information System Research Conference in Scandinavia (IRIS 38).
Paper for IRIS 38. Final Version. Poul Ebbesen May 31, 2015
Formal Control and Scope in Information System Projects in Facilities Management– A Process Perspective
Poul Ebbesen1 and Giulia Nardelli2
1 Technical University of Denmark, DTU, Department of Management Engineering,
2 Technical University of Denmark, DTU, Department of Management Engineering, [email protected]
Abstract. Some organisations are prone to continuous Information System (IS) renewal and others struggle with IS change processes. Despite existing research addressing IS change in a variety of ways, few studies have adopted a process perspective to investigate how IS change unfolds over time. Using a process model including both the IS change process and the organizational change process, this paper investigates how the concepts of formal control and scope can shed light over the unfolding of IS projects. This is done by investigating how such processes vary across Facilities Management (FM) organisations. Using a process research methodology the IS implementation process in four FM entities was visually mapped. Based on the visual maps patterns concerning the scope of the IS projects were found. These patterns were then analyzed in relation to the used formal control mechanisms. This Work-in-Progress study indicates that the scope of IS projects might vary based on the use of formal control mechanisms on the organizational IS level and the IS project level. A formality matrix which illustrates how FM organisations deal with IS projects is proposed.
Keywords: Implementation Strategies, Information Systems, Process Research, Facilities Management, Formality, Formal Control Mechanisms, Project Scope, Information System Implementation
1 Introduction
Information System (IS) projects represent complex processes and unfold in a variety of ways. Even IS change projects which content wise seem to have much in common, may unfold differently.
Many studies have a focus on how the level of different control mechanisms impact the outcome of IS projects, but few studies focus on how control mechanisms
Paper for IRIS 38. Final Version. Poul Ebbesen May 31, 2015
influence the unfolding of IS project process. This paper seeks to contribute to this lack of knowledge by investigating how formal control mechanisms in combination with project scope can be used to explain differences in the unfolding of IS projects.
The research question is this paper is “How can formal control mechanisms and project scope be used to better understand the differences in the unfolding of IS projects”.
A distinction is normally made between formal and informal control mechanisms [1]. Formal control mechanisms can e.g. be procedures and methods that must be followed. Informal control mechanisms can e.g. be common values and beliefs that control our behaviour. In this study formal control mechanisms (FCM’s) on the general organizational IS level and on the IS project level is included.
Scope includes project scope and product scope. Project scope is the work that needs to be accomplished and product scope is the features and functions that characterize the product that is delivered [2]. This paper focus on scope, understood as what is included in the IS project.
This study applies a multiple cases approach (using four entities) and a process research methodology. The unit of analysis is the process of the IS project in the Facilities Management (FM) department. The way IS is being managed in the organization in general and on the IS project level is also studied. In this paper both the IS change process and the organizational change process constitutes the process of an IS project.
Four cases in different organizations are included. In each case a new IS is in the process of being implemented in the FM department of the organization.
FM departments offer FM services, which are services that ensure the correct functioning of an organization by supporting its employees in the daily implementation of their tasks [3]. FM departments are typically responsible for tasks not directly related to the core business of the organization, such as management of buildings and outdoor facilities.
Besides the general IS’s, used by the whole organization, such as office and accounting systems, FM departments invest in and use IS’s designed specifically to support FM tasks and work processes. These IS’s, often referred to as FM systems, can include data repositories, workflow systems, facilities intelligence systems, sensor/monitoring systems and communication systems. IS suppliers offer a variety of such integrated ready-to-use IS’s requiring limited customization.
The structure of this paper is as follows: In the “Background Literature” section process theory, process models and the concepts of scope and FCM’s are presented and the use of these constructs in this study is explained. In ”Methodology” the process research methodology, the data collection, the coding and the visual mapping is explained. In “The four Cases” the organizations, the FM departments and the IS being implemented in the four cases is presented. In “Analysis” the scope of the mapped processes are analysed in relation to the FCM’s used. Perspectives on this study and the results are elaborated in “Discussion”. Main findings are presented in “Conclusion”.
2
Paper for IRIS 38. Final Version. Poul Ebbesen May 31, 2015
2 Background Literature
2.1 Process Models in IS Research and in this Research
In [4] a chronicle of the evolution of process models is delivered and it is studied how process models can improve our understanding of IS implementation and its connection with organizational change. It is stated that the final difference between variance and process theory is the concept of time-ordering. Variance theory rejects time ordering. Process theory, on the other hand, supports the ordering of time where events that occur happen in sequence and the form of the sequence is vital to understanding of outcomes. Process theories make identification of new patterns within empirical data possible, which is what this paper attempts to do.
The most significant extension of the process model within IS research is the incorporation of Leavitt's (1964) socio-technical model [4]. In Leavitt’s model a change in one element (technology, structure, tasks or people) will result in changes in the other elements. Another example of an extended version of the process model can be found in [6] where a model, that treats IS implementation processes as a series of sequential events involving recursive interactions between the project organization, the information system and its supporters, is delivered. Events are categorized into three types: positive, ambiguous and negative. The sequence (order) of the critical events is visualized with references to the factors affecting the IS implementation.
The process model used in this paper does not include such extensions, but it is acknowledged that events can create gaps between elements, such as described in Leavitt’s model. The model in this paper is a simple change state model, which illustrates the change process initiated by an IS project. See Figure 1. The IS project can include an IS change process, where the IS in the organization is changed from one state to another. The IS project can also include an organizational change process. These two change processes are often processing simultaneously and can interact during the life of the IS project. The process model in Figure 1 is based on Lewin’s classical state model. First, the organisation is assessed and diagnosed. Then, it goes through an unfreeze stage where old patterns are loosened. In the third stage, the actual changes in routines and roles are performed, while the new structure is refreezed in the fourth stage in [7]. In this process the state changes from the actual state to the future state.
In [7] Bygstad and Nielsen use a similar process model to study the interaction between a software development process and the parallel process of organizational change. They regard the business change and the development of the information systems as separate processes and with different scopes. In this paper the IS change and the parallel organizational change is not regarded as necessarily separate processes, but as processes that can be more or less included in the scope of the IS project.
3

Paper for IRIS 38. Final Version. Poul Ebbesen May 31, 2015
Fig. 1. The Process Model used in this paper. It illustrates the change process initiated by an IS Project. The change can include an Organizational Change Process and an IS Change Process (two large horizontal arrows), leading from an Actual State to a Future State (boxes to the left and right). Interaction between the two change processes may occur (oblique smaller arrow).
2.2 Scope in IS Projects and in this Research
The concept of scope includes both project scope and product scope. Project scope is the work that needs to be accomplished to deliver a product, service, or result with the specified features and functions. Product scope is the features and functions that characterize a product, service, or result [2].
Applying the concept of scope to the process model used in this paper (Figure 1) can be a bit tricky. Project scope could include the IS change process and the organizational change process, and product scope could be understood as the change occurring when moving from the actual to the future state. There is one problem with this approach; An IS project can also include dealing with the actual state and the future state. IS projects can e.g. include dealing with monitoring the use of the IS for a period of time after the IS change and the organizational change has been introduced. In addition IS projects in some cases only deals with parts of the change, e.g. only the IS change process.
Therefor a more flexible interpretation of scope of IS projects is applied in this study; Scope is what is included in an IS project. Scope is not only a matter of which predefined phases, such as IS acquisition, installation and deployment, that are intended to be taken care of in an IS change project. Scope also deals with to what extent the organizational change process is dealt with. In Figure 2 the scope of two different IS projects are shown based on the process model in Figure 1. IS project 1 includes all elements of the change process, whereas IS project 2 only deals with elements in the IS change process. Note that IS project 1 also includes involvement in the actual and future states. IS project 1 has a wider scope and IS project 2 has a more narrow scope, leaving more of the change process to others.
4
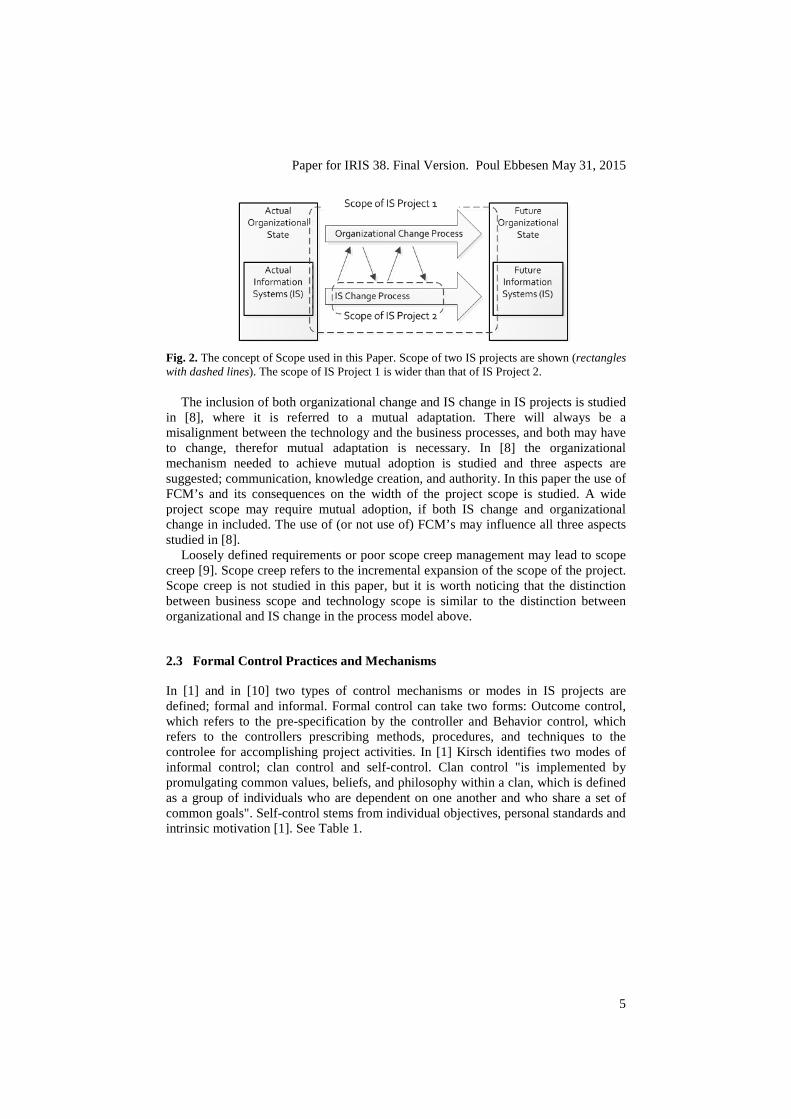
Paper for IRIS 38. Final Version. Poul Ebbesen May 31, 2015
Fig. 2. The concept of Scope used in this Paper. Scope of two IS projects are shown (rectangles with dashed lines). The scope of IS Project 1 is wider than that of IS Project 2.
The inclusion of both organizational change and IS change in IS projects is studied in [8], where it is referred to a mutual adaptation. There will always be a misalignment between the technology and the business processes, and both may have to change, therefor mutual adaptation is necessary. In [8] the organizational mechanism needed to achieve mutual adoption is studied and three aspects are suggested; communication, knowledge creation, and authority. In this paper the use of FCM’s and its consequences on the width of the project scope is studied. A wide project scope may require mutual adoption, if both IS change and organizational change in included. The use of (or not use of) FCM’s may influence all three aspects studied in [8].
Loosely defined requirements or poor scope creep management may lead to scope creep [9]. Scope creep refers to the incremental expansion of the scope of the project. Scope creep is not studied in this paper, but it is worth noticing that the distinction between business scope and technology scope is similar to the distinction between organizational and IS change in the process model above.
2.3 Formal Control Practices and Mechanisms
In [1] and in [10] two types of control mechanisms or modes in IS projects are defined; formal and informal. Formal control can take two forms: Outcome control, which refers to the pre-specification by the controller and Behavior control, which refers to the controllers prescribing methods, procedures, and techniques to the controlee for accomplishing project activities. In [1] Kirsch identifies two modes of informal control; clan control and self-control. Clan control "is implemented by promulgating common values, beliefs, and philosophy within a clan, which is defined as a group of individuals who are dependent on one another and who share a set of common goals". Self-control stems from individual objectives, personal standards and intrinsic motivation [1]. See Table 1.
5
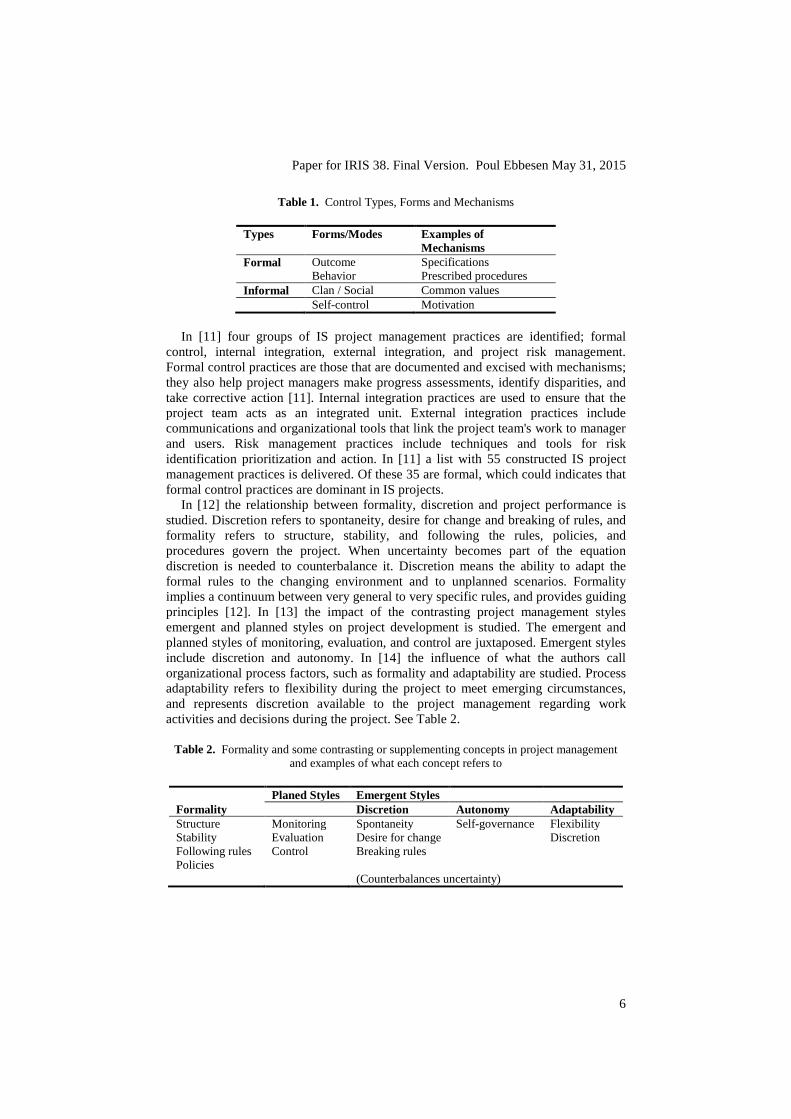
Paper for IRIS 38. Final Version. Poul Ebbesen May 31, 2015
Table 1. Control Types, Forms and Mechanisms
Types Forms/Modes Examples of Mechanisms
Formal Outcome Specifications Behavior Prescribed procedures Informal Clan / Social Common values Self-control Motivation
In [11] four groups of IS project management practices are identified; formal
control, internal integration, external integration, and project risk management. Formal control practices are those that are documented and excised with mechanisms; they also help project managers make progress assessments, identify disparities, and take corrective action [11]. Internal integration practices are used to ensure that the project team acts as an integrated unit. External integration practices include communications and organizational tools that link the project team's work to manager and users. Risk management practices include techniques and tools for risk identification prioritization and action. In [11] a list with 55 constructed IS project management practices is delivered. Of these 35 are formal, which could indicates that formal control practices are dominant in IS projects.
In [12] the relationship between formality, discretion and project performance is studied. Discretion refers to spontaneity, desire for change and breaking of rules, and formality refers to structure, stability, and following the rules, policies, and procedures govern the project. When uncertainty becomes part of the equation discretion is needed to counterbalance it. Discretion means the ability to adapt the formal rules to the changing environment and to unplanned scenarios. Formality implies a continuum between very general to very specific rules, and provides guiding principles [12]. In [13] the impact of the contrasting project management styles emergent and planned styles on project development is studied. The emergent and planned styles of monitoring, evaluation, and control are juxtaposed. Emergent styles include discretion and autonomy. In [14] the influence of what the authors call organizational process factors, such as formality and adaptability are studied. Process adaptability refers to flexibility during the project to meet emerging circumstances, and represents discretion available to the project management regarding work activities and decisions during the project. See Table 2.
Table 2. Formality and some contrasting or supplementing concepts in project management and examples of what each concept refers to
Planed Styles Emergent Styles Formality Discretion Autonomy Adaptability Structure Monitoring Spontaneity Self-governance Flexibility Stability Following rules Policies
Evaluation Control
Desire for change Breaking rules
Discretion
(Counterbalances uncertainty)
6
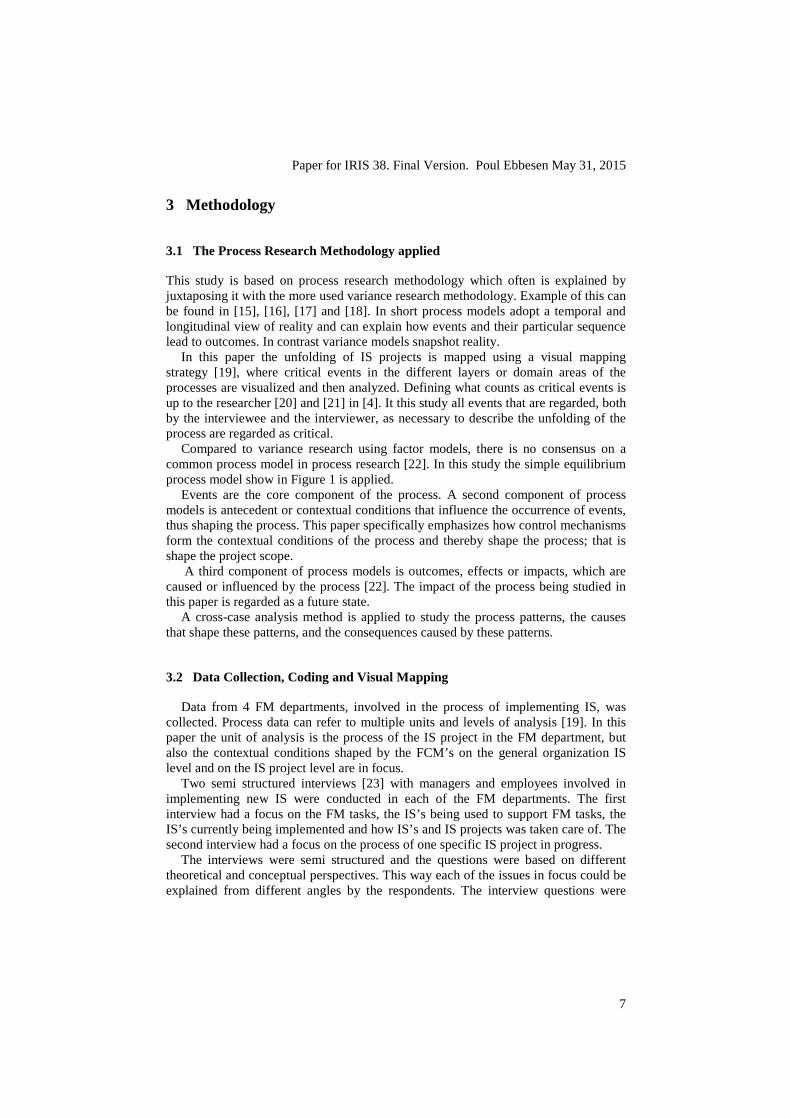
Paper for IRIS 38. Final Version. Poul Ebbesen May 31, 2015
3 Methodology
3.1 The Process Research Methodology applied
This study is based on process research methodology which often is explained by juxtaposing it with the more used variance research methodology. Example of this can be found in [15], [16], [17] and [18]. In short process models adopt a temporal and longitudinal view of reality and can explain how events and their particular sequence lead to outcomes. In contrast variance models snapshot reality.
In this paper the unfolding of IS projects is mapped using a visual mapping strategy [19], where critical events in the different layers or domain areas of the processes are visualized and then analyzed. Defining what counts as critical events is up to the researcher [20] and [21] in [4]. It this study all events that are regarded, both by the interviewee and the interviewer, as necessary to describe the unfolding of the process are regarded as critical.
Compared to variance research using factor models, there is no consensus on a common process model in process research [22]. In this study the simple equilibrium process model show in Figure 1 is applied.
Events are the core component of the process. A second component of process models is antecedent or contextual conditions that influence the occurrence of events, thus shaping the process. This paper specifically emphasizes how control mechanisms form the contextual conditions of the process and thereby shape the process; that is shape the project scope.
A third component of process models is outcomes, effects or impacts, which are caused or influenced by the process [22]. The impact of the process being studied in this paper is regarded as a future state.
A cross-case analysis method is applied to study the process patterns, the causes that shape these patterns, and the consequences caused by these patterns.
3.2 Data Collection, Coding and Visual Mapping
Data from 4 FM departments, involved in the process of implementing IS, was collected. Process data can refer to multiple units and levels of analysis [19]. In this paper the unit of analysis is the process of the IS project in the FM department, but also the contextual conditions shaped by the FCM’s on the general organization IS level and on the IS project level are in focus.
Two semi structured interviews [23] with managers and employees involved in implementing new IS were conducted in each of the FM departments. The first interview had a focus on the FM tasks, the IS’s being used to support FM tasks, the IS’s currently being implemented and how IS’s and IS projects was taken care of. The second interview had a focus on the process of one specific IS project in progress.
The interviews were semi structured and the questions were based on different theoretical and conceptual perspectives. This way each of the issues in focus could be explained from different angles by the respondents. The interview questions were
7
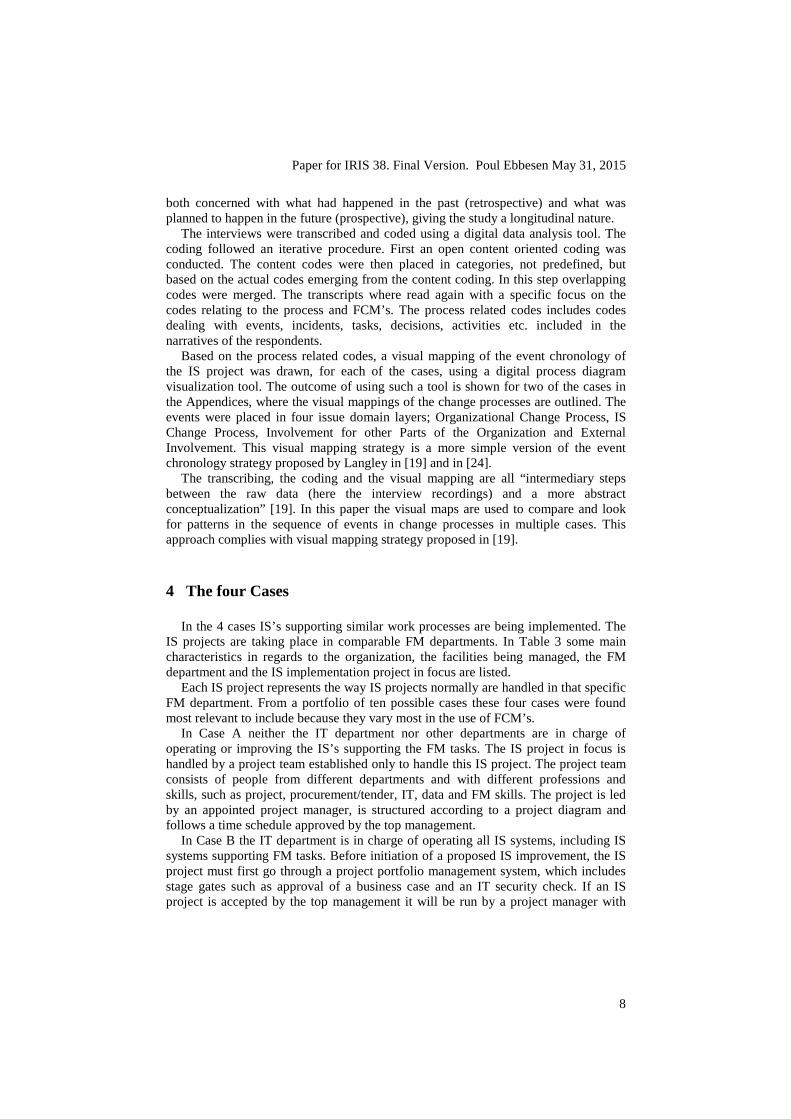
Paper for IRIS 38. Final Version. Poul Ebbesen May 31, 2015
both concerned with what had happened in the past (retrospective) and what was planned to happen in the future (prospective), giving the study a longitudinal nature.
The interviews were transcribed and coded using a digital data analysis tool. The coding followed an iterative procedure. First an open content oriented coding was conducted. The content codes were then placed in categories, not predefined, but based on the actual codes emerging from the content coding. In this step overlapping codes were merged. The transcripts where read again with a specific focus on the codes relating to the process and FCM’s. The process related codes includes codes dealing with events, incidents, tasks, decisions, activities etc. included in the narratives of the respondents.
Based on the process related codes, a visual mapping of the event chronology of the IS project was drawn, for each of the cases, using a digital process diagram visualization tool. The outcome of using such a tool is shown for two of the cases in the Appendices, where the visual mappings of the change processes are outlined. The events were placed in four issue domain layers; Organizational Change Process, IS Change Process, Involvement for other Parts of the Organization and External Involvement. This visual mapping strategy is a more simple version of the event chronology strategy proposed by Langley in [19] and in [24].
The transcribing, the coding and the visual mapping are all “intermediary steps between the raw data (here the interview recordings) and a more abstract conceptualization” [19]. In this paper the visual maps are used to compare and look for patterns in the sequence of events in change processes in multiple cases. This approach complies with visual mapping strategy proposed in [19].
4 The four Cases
In the 4 cases IS’s supporting similar work processes are being implemented. The IS projects are taking place in comparable FM departments. In Table 3 some main characteristics in regards to the organization, the facilities being managed, the FM department and the IS implementation project in focus are listed.
Each IS project represents the way IS projects normally are handled in that specific FM department. From a portfolio of ten possible cases these four cases were found most relevant to include because they vary most in the use of FCM’s.
In Case A neither the IT department nor other departments are in charge of operating or improving the IS’s supporting the FM tasks. The IS project in focus is handled by a project team established only to handle this IS project. The project team consists of people from different departments and with different professions and skills, such as project, procurement/tender, IT, data and FM skills. The project is led by an appointed project manager, is structured according to a project diagram and follows a time schedule approved by the top management.
In Case B the IT department is in charge of operating all IS systems, including IS systems supporting FM tasks. Before initiation of a proposed IS improvement, the IS project must first go through a project portfolio management system, which includes stage gates such as approval of a business case and an IT security check. If an IS project is accepted by the top management it will be run by a project manager with
8
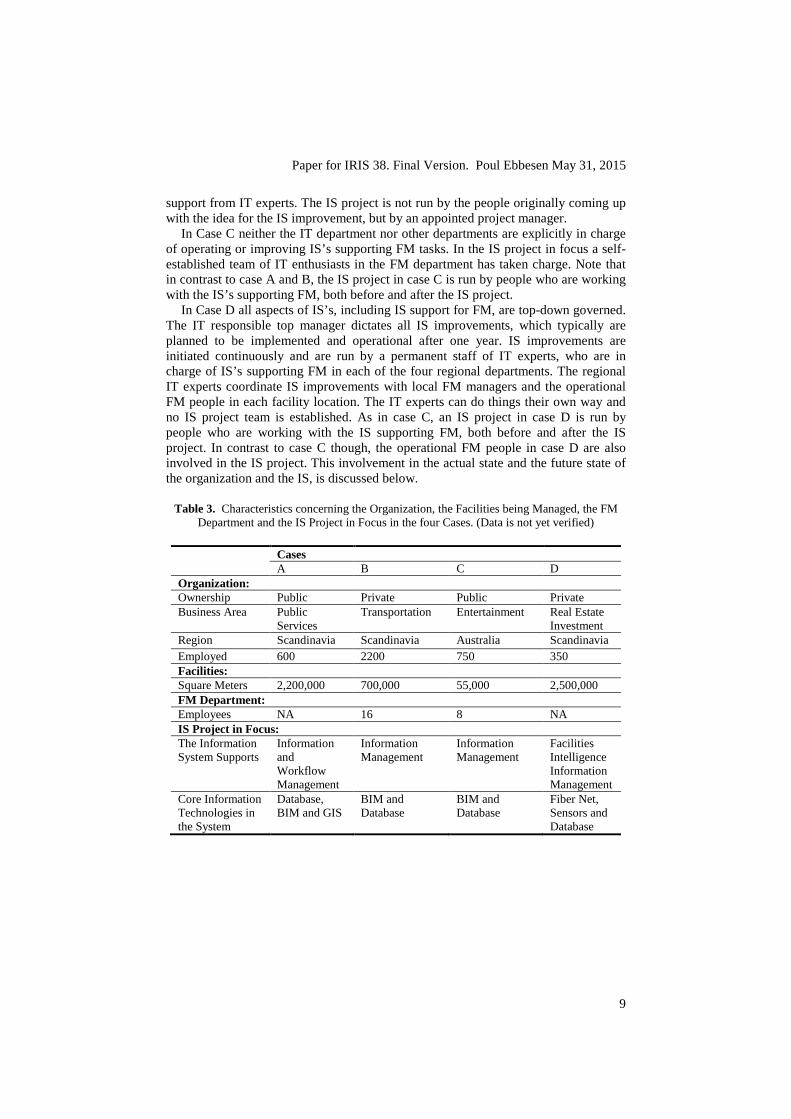
Paper for IRIS 38. Final Version. Poul Ebbesen May 31, 2015
support from IT experts. The IS project is not run by the people originally coming up with the idea for the IS improvement, but by an appointed project manager.
In Case C neither the IT department nor other departments are explicitly in charge of operating or improving IS’s supporting FM tasks. In the IS project in focus a self-established team of IT enthusiasts in the FM department has taken charge. Note that in contrast to case A and B, the IS project in case C is run by people who are working with the IS’s supporting FM, both before and after the IS project.
In Case D all aspects of IS’s, including IS support for FM, are top-down governed. The IT responsible top manager dictates all IS improvements, which typically are planned to be implemented and operational after one year. IS improvements are initiated continuously and are run by a permanent staff of IT experts, who are in charge of IS’s supporting FM in each of the four regional departments. The regional IT experts coordinate IS improvements with local FM managers and the operational FM people in each facility location. The IT experts can do things their own way and no IS project team is established. As in case C, an IS project in case D is run by people who are working with the IS supporting FM, both before and after the IS project. In contrast to case C though, the operational FM people in case D are also involved in the IS project. This involvement in the actual state and the future state of the organization and the IS, is discussed below.
Table 3. Characteristics concerning the Organization, the Facilities being Managed, the FM Department and the IS Project in Focus in the four Cases. (Data is not yet verified)
Cases A B C D Organization: Ownership Public Private Public Private Business Area Public
Services Transportation Entertainment Real Estate
Investment Region Scandinavia Scandinavia Australia Scandinavia Employed 600 2200 750 350 Facilities: Square Meters 2,200,000 700,000 55,000 2,500,000 FM Department: Employees NA 16 8 NA IS Project in Focus: The Information System Supports
Information and Workflow Management
Information Management
Information Management
Facilities Intelligence Information Management
Core Information Technologies in the System
Database, BIM and GIS
BIM and Database
BIM and Database
Fiber Net, Sensors and Database
9
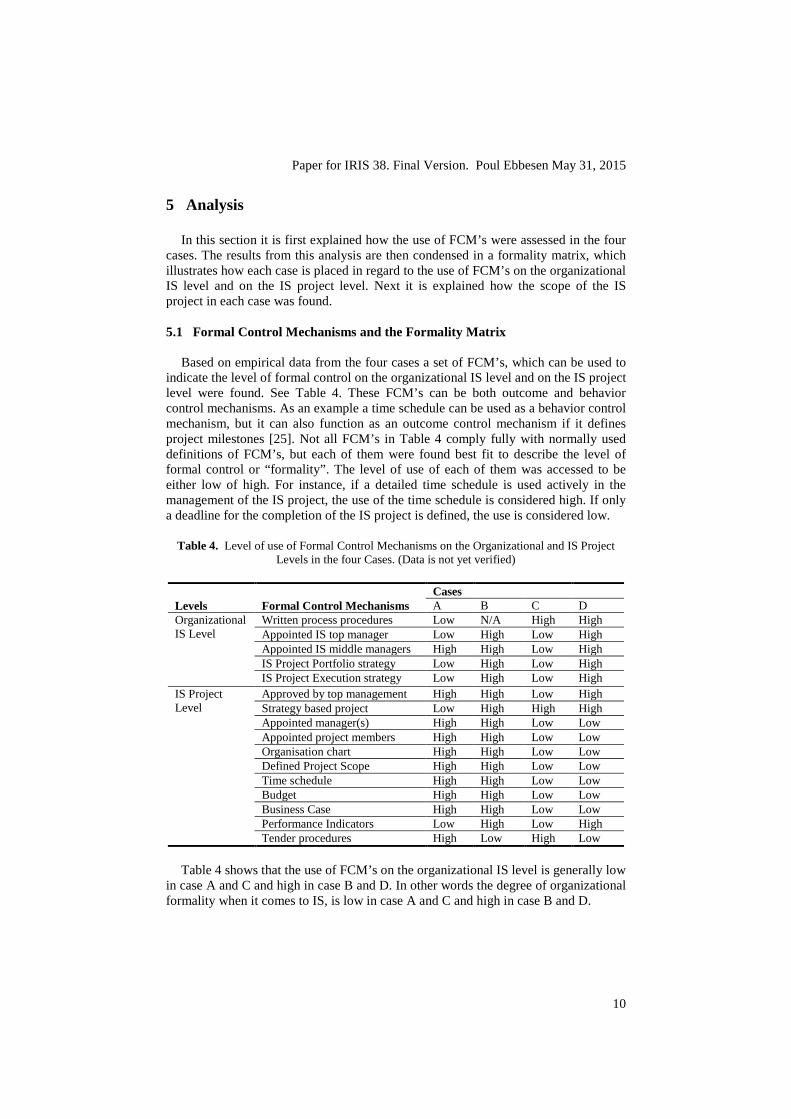
Paper for IRIS 38. Final Version. Poul Ebbesen May 31, 2015
5 Analysis
In this section it is first explained how the use of FCM’s were assessed in the four cases. The results from this analysis are then condensed in a formality matrix, which illustrates how each case is placed in regard to the use of FCM’s on the organizational IS level and on the IS project level. Next it is explained how the scope of the IS project in each case was found. 5.1 Formal Control Mechanisms and the Formality Matrix
Based on empirical data from the four cases a set of FCM’s, which can be used to indicate the level of formal control on the organizational IS level and on the IS project level were found. See Table 4. These FCM’s can be both outcome and behavior control mechanisms. As an example a time schedule can be used as a behavior control mechanism, but it can also function as an outcome control mechanism if it defines project milestones [25]. Not all FCM’s in Table 4 comply fully with normally used definitions of FCM’s, but each of them were found best fit to describe the level of formal control or “formality”. The level of use of each of them was accessed to be either low of high. For instance, if a detailed time schedule is used actively in the management of the IS project, the use of the time schedule is considered high. If only a deadline for the completion of the IS project is defined, the use is considered low.
Table 4. Level of use of Formal Control Mechanisms on the Organizational and IS Project Levels in the four Cases. (Data is not yet verified)
Cases Levels Formal Control Mechanisms A B C D Organizational IS Level
Written process procedures Low N/A High High Appointed IS top manager Low High Low High Appointed IS middle managers High High Low High IS Project Portfolio strategy Low High Low High IS Project Execution strategy Low High Low High
IS Project Level
Approved by top management High High Low High Strategy based project Low High High High Appointed manager(s) High High Low Low Appointed project members High High Low Low Organisation chart High High Low Low Defined Project Scope High High Low Low Time schedule High High Low Low Budget High High Low Low Business Case High High Low Low Performance Indicators Low High Low High Tender procedures High Low High Low
Table 4 shows that the use of FCM’s on the organizational IS level is generally low
in case A and C and high in case B and D. In other words the degree of organizational formality when it comes to IS, is low in case A and C and high in case B and D.
10
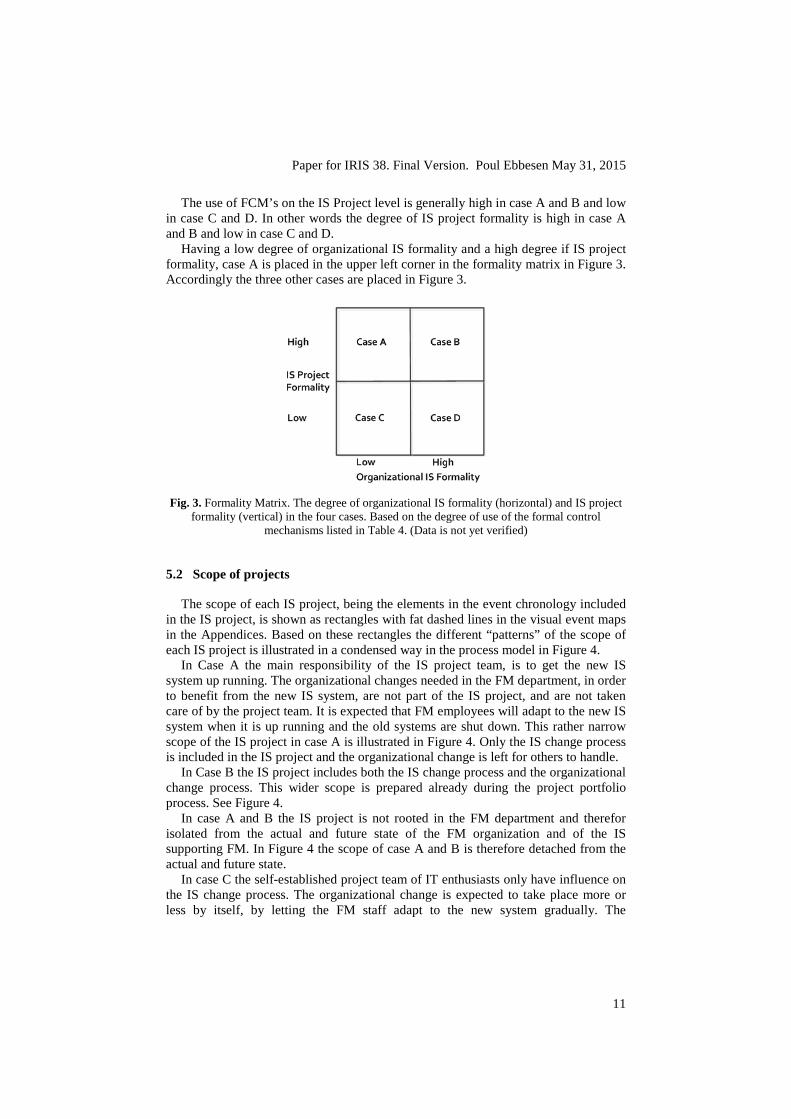
Paper for IRIS 38. Final Version. Poul Ebbesen May 31, 2015
The use of FCM’s on the IS Project level is generally high in case A and B and low in case C and D. In other words the degree of IS project formality is high in case A and B and low in case C and D.
Having a low degree of organizational IS formality and a high degree if IS project formality, case A is placed in the upper left corner in the formality matrix in Figure 3. Accordingly the three other cases are placed in Figure 3.
Fig. 3. Formality Matrix. The degree of organizational IS formality (horizontal) and IS project
formality (vertical) in the four cases. Based on the degree of use of the formal control mechanisms listed in Table 4. (Data is not yet verified)
5.2 Scope of projects
The scope of each IS project, being the elements in the event chronology included in the IS project, is shown as rectangles with fat dashed lines in the visual event maps in the Appendices. Based on these rectangles the different “patterns” of the scope of each IS project is illustrated in a condensed way in the process model in Figure 4.
In Case A the main responsibility of the IS project team, is to get the new IS system up running. The organizational changes needed in the FM department, in order to benefit from the new IS system, are not part of the IS project, and are not taken care of by the project team. It is expected that FM employees will adapt to the new IS system when it is up running and the old systems are shut down. This rather narrow scope of the IS project in case A is illustrated in Figure 4. Only the IS change process is included in the IS project and the organizational change is left for others to handle.
In Case B the IS project includes both the IS change process and the organizational change process. This wider scope is prepared already during the project portfolio process. See Figure 4.
In case A and B the IS project is not rooted in the FM department and therefor isolated from the actual and future state of the FM organization and of the IS supporting FM. In Figure 4 the scope of case A and B is therefore detached from the actual and future state.
In case C the self-established project team of IT enthusiasts only have influence on the IS change process. The organizational change is expected to take place more or less by itself, by letting the FM staff adapt to the new system gradually. The
11
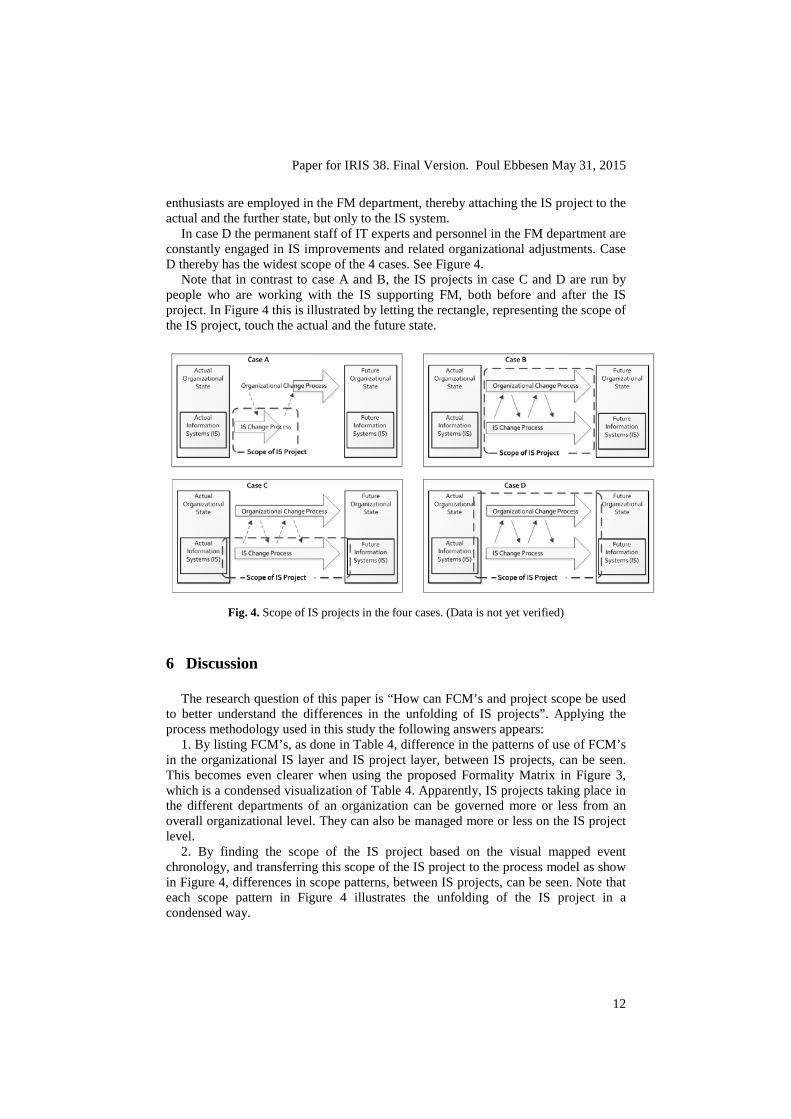
Paper for IRIS 38. Final Version. Poul Ebbesen May 31, 2015
enthusiasts are employed in the FM department, thereby attaching the IS project to the actual and the further state, but only to the IS system.
In case D the permanent staff of IT experts and personnel in the FM department are constantly engaged in IS improvements and related organizational adjustments. Case D thereby has the widest scope of the 4 cases. See Figure 4.
Note that in contrast to case A and B, the IS projects in case C and D are run by people who are working with the IS supporting FM, both before and after the IS project. In Figure 4 this is illustrated by letting the rectangle, representing the scope of the IS project, touch the actual and the future state.
Fig. 4. Scope of IS projects in the four cases. (Data is not yet verified)
6 Discussion
The research question of this paper is “How can FCM’s and project scope be used to better understand the differences in the unfolding of IS projects”. Applying the process methodology used in this study the following answers appears:
1. By listing FCM’s, as done in Table 4, difference in the patterns of use of FCM’s in the organizational IS layer and IS project layer, between IS projects, can be seen. This becomes even clearer when using the proposed Formality Matrix in Figure 3, which is a condensed visualization of Table 4. Apparently, IS projects taking place in the different departments of an organization can be governed more or less from an overall organizational level. They can also be managed more or less on the IS project level.
2. By finding the scope of the IS project based on the visual mapped event chronology, and transferring this scope of the IS project to the process model as show in Figure 4, differences in scope patterns, between IS projects, can be seen. Note that each scope pattern in Figure 4 illustrates the unfolding of the IS project in a condensed way.
12
Paper for IRIS 38. Final Version. Poul Ebbesen May 31, 2015
3. Clamming some sort of relation between where in the Formality Matrix an IS project is placed and the shape of the scope of the IS project, requires more cases than included in this study. Despite this limitation some suggested relations are proposed in the following based on a comparison between the Formality Matrix in Figure 3 and the scope patterns shown in Figure 4:
3a. Organizations with a more formalized organizational IS governance, such as case B and D, tend to include both IS change and organizational change, which allows for a wider IS project scope. In other words they are more prone to a wider IS project scope. On the other hand, organizations with an less formalized organizational IS management, such as case A and C, seem to miss the capability of including the whole change process, and thereby be more prone to a more narrow IS project scope.
3b. IS projects with a less formalized management, such as in case C and D, seem to be better attached or linked to the actual and future state of the IS, and in case D also to the actual and further state of the organization. The reason could be that only people who are familiar with the actual conditions, e.g. who work in the FM department, are able to run a IS project in the FM department in an informal manner. Both in case C and D the same group of people are involved in not only the IS projects in focus, but in all IS projects in the FM department. The only difference is that in case D a framework or a structure, wherein the project can be managed has been established by the organization.
Note that the transition in the start and the end of the scope of an IS project may be vital for the level of success of the IS project. In case A and C, where the organizational change process is not included in the scope, the transition in the end may reveal some challenges.
Future research should uncover how the proposed Formality Matrix and the proposed visualization of scope of IS projects can be used to better understand the unfolding of IS projects. It should also be studied what replaces formal control mechanism, is it e.g. discretion or self-control?
7 Conclusion
This study shows that IS projects are handled and unfold quite differently in different FM departments.
This study suggests that in organizations with a formal organizational IS management, both IS change and organizational change tend to be included in IS projects, which allows for a wider IS project scope.
Organizations with an informal organizational IS management seem to miss the capability of including the whole change process, and thereby be more prone to a more narrow IS project scope.
IS projects with a more informal management seem to be better attached to the actual and future state of the IS system.
The transition in the start and the end of the project scope may be vital for the level of success of the IS project.
13
Paper for IRIS 38. Final Version. Poul Ebbesen May 31, 2015
References
1. Kirsch, L.J.: Portfolios of Control Modes and IS Project Management. Inf. Syst. Res. 8, 215–239 (1997).
2. PMI: A Guide to the Project Management Body of Knowledge (PMBOK Guide). Project Management Institute (2008).
3. Jensen, P.A.: Facilities Management for students and practitioners. (2008). 4. Ahmad, A., Lyytinen, K., Newman, M.: the Evolution of Process Models in Is
Research: From a Punctuated Social Process Model To a Socio-Technical Process Model. ECIS 2011 Proc. (2011).
5. Leavitt, H.J.: Applied organization change in industry: structural, technical, and human approaches. In: Cooper, W.W., Leavitt, H.J., and Shelly, M.W.I. (eds.) New Perspectives in Organization Research. pp. 55–77 (1964).
6. Pan, G., Hackney, R., Pan, S.L.: Information Systems implementation failure: Insights from prism. Int. J. Inf. Manage. 28, 259–269 (2008).
7. Bygstad, B., Nielsen, P.: Understanding and managing process interaction in IS development projects. Nord. Contrib. IS Res. 1–19 (2012).
8. Bygstad, B.: Managing the dynamics of mutual adaptation of technology and organisation in information systems development projects. Softw. Process Improv. Pract. 10, 341–353 (2005).
9. Chen, C.C., Law, C.C.H., Yang, S.C.: Managing ERP Implementation Failure: A project Management Perspective. IEEE Trans. Eng. Manag. 56, 157–170 (2009).
10. Tiwana, A.: Systems Development Ambidexterity: Explaining the Complementary and Substitutive Roles of Formal and Informal Controls. J. Manag. Inf. Syst. 27, 87–126 (2010).
11. Mignerat, M., Rivard, S.: The institutionalization of information system project management practices. Inf. Organ. 22, 125–153 (2012).
12. Naveh, E.: Formality and discretion in successful R&D projects. J. Oper. Manag. 25, 110–125 (2007).
13. Lewis, M.W., Ann Welsh, M., Dehler, G.E., Green, S.G.: Product development tensions: Exploring contrasting styles of project management. Acad. Manag. J. 45, 546–564 (2002).
14. Tatikonda, M. V., Montoya-Weiss, M.M.: Integrating Operations and Marketing Perspectives of Product Innovation: The Influence of Organizational Process Factors and Capabilities on Development Performance. Manage. Sci. 47, 151–172 (2001).
15. Olsen, T., Welke, R.: Understanding Events , Critical Incidents , and Punctuation in Process Theory. Proceedings of the Nineteenth Americas Conference on Information Systems, Chicago, Illinois. (2013).
16. Van de Ven, A.H., Huber, G.P.: Longitudinal field research methods for studying processes of organizational change. Organ. Sci. 1, 213–220 (1990).
17. Mohr, L.B.: Explaining organizational behavior. Jossey-Bass San Francisco (1982). 18. Van de Ven, A.H., Poole, M.S.: Alternative Approaches for Studying Organizational
Change. Organ. Stud. 26, 1377–1404 (2005). 19. Langley, A.: Strategies for theorizing from process data. Acad. Manag. Rev. 24, 691–
710 (1999). 20. Newman, M., Robey, D.: A Social Process Model of User- Analyst Relationships.
249–267 (1992). 21. Robey, D., Newman, M.: Sequential patterns in information systems development: an
application of a social process model. ACM Trans. Inf. Syst. 14, 30–63 (1996). 22. Radeke, F.: How To Rigorously Develop Process Theory Using Case Research.
European Conference on Information Systems (ECIS) (2010). 23. Kvale, S., Brinkmann, S.: Interviews. SAGE Publications (2008).
14

Paper for IRIS 38. Final Version. Poul Ebbesen May 31, 2015
24. Langley, A., Truax, J.: A Process Study of New Technology Adoption in Smaller Manufacturing Firms. J. Manag. Stud. 31, 619–652 (1994).
25. Zhang, X., Li, G., Mao, J.-Y.: Information Systems Development in a Low Methodology Maturity Environment: A Case Study from the Control Perspective. Front. Bus. Res. China. 7, 382–401 (2013).
15
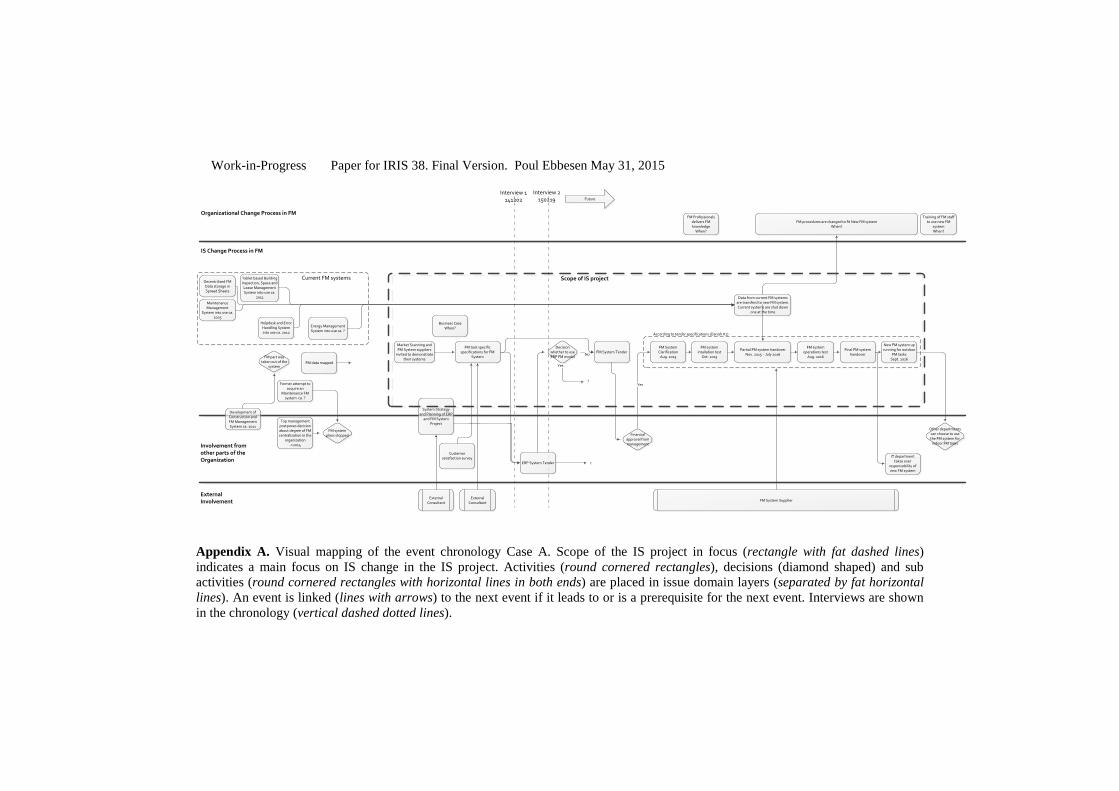
Work-in-Progress Paper for IRIS 38. Final Version. Poul Ebbesen May 31, 2015
Market Scanning and FM System suppliers
invited to demonstrate their systems
FM task specific specifications for FM
System
External Consultant
FM data mapped
FM System TenderFM System Clarification
Aug. 2015
FM System Supplier
Interview 2 150219
Custemor satisfaction survey
Former attempt to acquire an
Maintenance FM system ca. ?
Top management postpones decision about degree of FM centralization in the
organization ->2014
FM system plans stopped
New FM system up running for outdoor
FM tasksSept. 2016
Other departments can choose to use the FM system for
indoor FM tasks
Maintenance Management
System into use ca. 2005
Tablet based Building Inspection, Space and
Lease Management System into use ca.
2011
Helpdesk and Error Handling System into use ca. 2012
Energy Management System into use ca. ?
Development of Construction and FM Management System ca. 2011
FM part was taken out of the
system
FutureInterview 1
141202
Involvement from other parts of the Organization
External Involvement
ERP System Tender
System Strategy and Planning of ERP
and FM System Project
External Consultant
Decision whether to use ERP FM modul
No
Yes
Financial approval from management
Yes
FM procedures are changed to fit New FM system When?
Scope of IS projectDecentrilized FM Data storage in Spreed Sheets
IS Change Process in FM
Organizational Change Process in FMFM Professionals
delivers FM knowledge
When?
Data from current FM systems are transferd to new FM system. Current systems are shut down
one at the time
Current FM systems
FM system intallation test
Oct. 2015
Partial FM system handover Nov. 2015 – July 2016
FM system operations test
Aug. 2016
Final FM system handover
?
?
According to tender specifications (Danish K1)
Training of FM staff to use new FM
systemWhen?
IT department takse over
responsobility of new FM system
Business Case When?
Appendix A. Visual mapping of the event chronology Case A. Scope of the IS project in focus (rectangle with fat dashed lines) indicates a main focus on IS change in the IS project. Activities (round cornered rectangles), decisions (diamond shaped) and sub activities (round cornered rectangles with horizontal lines in both ends) are placed in issue domain layers (separated by fat horizontal lines). An event is linked (lines with arrows) to the next event if it leads to or is a prerequisite for the next event. Interviews are shown in the chronology (vertical dashed dotted lines).
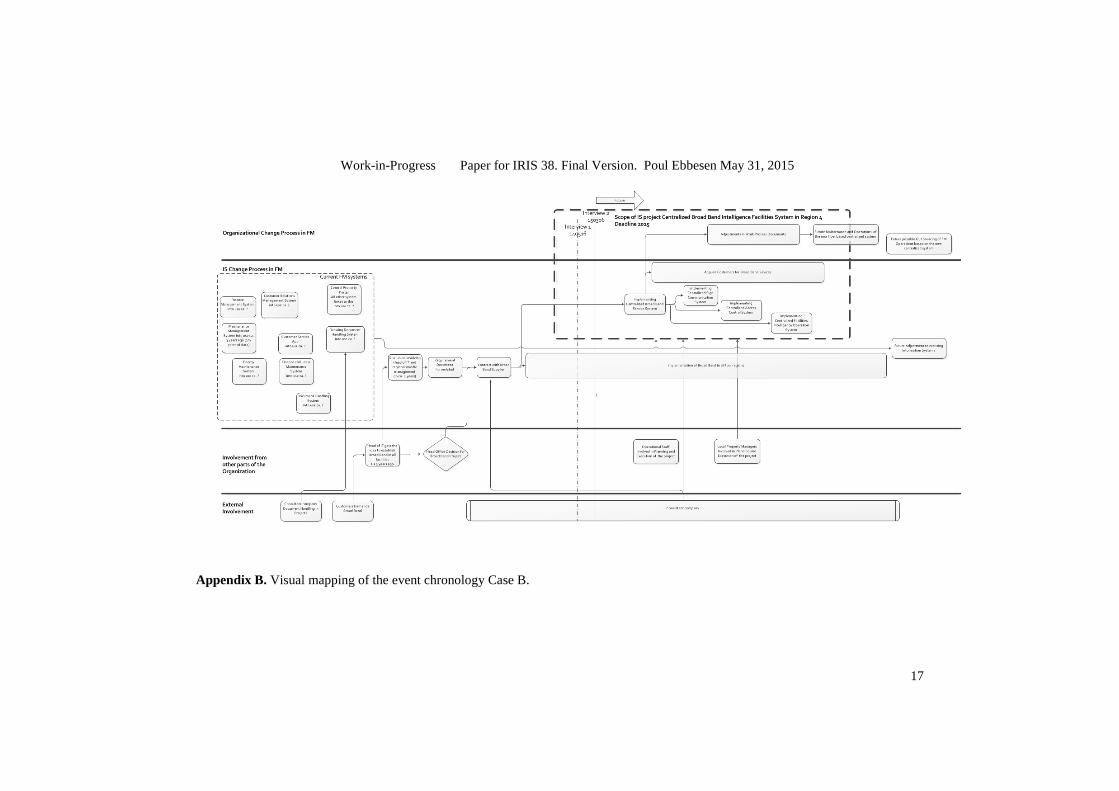
Work-in-Progress Paper for IRIS 38. Final Version. Poul Ebbesen May 31, 2015
Appendix B. Visual mapping of the event chronology Case B.
17

PAPER 5 IS- BP FRAMEWORK
Ebbesen, P., 2016. Bridging the gap between Information Systems and Business Processes – A Framework with Functional Affordances and Alignment. ITcon, In Review.
Poul Ebbesen First Submission (version 2) ITcon December 11, 2015
BRIDGING THE GAP BETWEEN INFORMATION SYSTEMS AND BUSINESS PROCESSES IN FACILITIES MANAGEMENT AND CONSTRUCTION – A FRAMEWORK WITH FUNCTIONAL AFFORDANCES AND ALIGNMENT
Poul Ebbesen, Technical University of Denmark, DTU, Department of Management Engineering [email protected]
SUMMARY:
Purpose: To propose a framework connecting Business Strategies (BS) and Business Processes (BP) with the supporting Information Systems (IS) in Facilities Management (FM) and Construction.
Background: A current study of IS implementation projects in the Facilities Management (FM) domain shows an unbalanced focus on mainly technological changes. The study also reveals an underlying structure of the interacting technological and organisational elements being changed in the implementation process. The structure is visualized and explained in this paper as a framework which shows how IS and BP are two separated and district phenomena that can be connected through functional affordances of the IS and requirements or needs of the BP. Furthermore the framework also shows how BP and organisational strategies can be aligned.
Approach (Theory/Methodology): Implementation and use of IS in more than ten FM departments within different types of organisations were investigated. Analysis of the empirical data from these cases reveals an implicit but uniform IS and BP structure. Based on elements and concepts, from existing literature on IS and BP models and frameworks, a general framework has been established. In this paper the framework is tested and used as an analytical tool by applying it to a case where an IS based on Building Information Modeling (BIM) was implemented to support management of construction and refurbishment projects in the FM department.
Results and practical implications: It is demonstrated that a “complete” IS implementation case should include all elements in the framework. It is argued that the framework has potentials as a generic analytical tool, as the framework may lead to a more holistic and balanced focus on both business processes and technology if used as a basis for planning and managing IS implementation projects in the FM and Construction domains.
Research limitations: The framework is based on investigations of IS implementation in the FM business domain. Testing in other domains could consolidate the framework.
Originality/value: This is the first paper presenting a generic IS and BP framework for the FM and Construction domains specifically stressing the importance of understanding IS and BP each as distinct but interrelated phenomena, and each including unique work processes.
KEYWORDS: Information Systems, Business Processes, Framework, Functional Affordances, Alignment, Implementation, Facilities Management, Construction, Refurbishment, BIM
ITcon Vol. 0 (1994), Turk, pg. 1
Poul Ebbesen First Submission (version 2) ITcon December 11, 2015
1. INTRODUCTION The framework presented in this paper emerged as an implicit and underlying common structure during the study of the unfolding of Information System (IS) implementation processes in more than ten cases of Information System (IS) implementation processes in Facilities Management (FM) departments in different organisations and countries. The purpose was to study how IS implementation processes in FM unfold. This observed structure consists of interacting elements which constitute the Information System (IS), the Business Process (BP) and Business Strategy (BS). The structure furthermore includes Computer Network (CN) elements.
Facilities are often undergoing constant changes because of maintenance and refurbishment projects, which are normally tied to and managed by the FM department of an organisation. Refurbishment projects are often managed as regular construction projects. Maintenance, refurbishment and construction projects in the existing facilities of an organisation often require knowledge of both FM operations and core business operations to be managed properly and to minimize disrupting core business operations, which is exactly why these projects often are handled by in-house people from the FM department; They know what is going on in the facilities. The framework proposed in this paper is applied to such a case where an IS supports construction projects (the business process) managed by the FM department.
In a majority of the cases studied there was a strong focus on the technological changes and to lesser extent focus on the organizational changes, e.g. changes in BP. In some cases there seemed to be a missing link between the IS system being implemented and the tasks and services that the IS system was intended to support. In other words a missing link between the IS and the BP which the IS was intended to support.
The framework proposed in this paper visualises and explains the interaction between the elements constituting the BP and the IS. It shows how IS and BP are two separate and distinct phenomena which can be connected through functional affordances of the IS and requirements or needs of the BP. The framework also shows how BP can be aligned with organisational/business strategies (BS). This paper argues that the concepts of affordances and alignment are central to understanding the distinct but interacting phenomena of IS and BP. The two concepts bind the parts in the framework together.
The framework is tested and used as an analytical tool by applying it to a case where an IS based on Building Information Modeling (BIM) was implemented to support management of construction and refurbishment projects. The business process (BP) in this case is Construction Management.
The structure of this paper is as follows: In the next section literature on IS and BP frameworks are reviewed, including literature on FM and IS. Furthermore the concept of functional affordances of IS and the concept of alignment of BP and BS is explained and discussed. In “Methodology” the research approach revealing the structure and leading to the framework is presented. In “The proposed Framework” the framework is introduced and each element is explained. In “Applying the Framework to a Case” the applicability of the framework is demonstrated by testing it against a specific case involving implementation of a BIM based IS in a FM department. Also in this section the FM domain and the use of IS/IT in FM is briefly described. In “Discussion and Conclusions” the usability of the framework for different purposes is discussed, and it is argued that the framework can promote a higher degree of completeness in IS implementation. Furthermore it is discussed how the framework can be used as an analytical tool/approach for understanding and improving the use of IS for support of BP. Finally it is discussed how the framework can improve our understanding of the use of IS (in this case based on BIM) for support of business processes (in this case construction management) in the FM domain.
ITcon Vol. 0 (1994), Turk, pg. 2
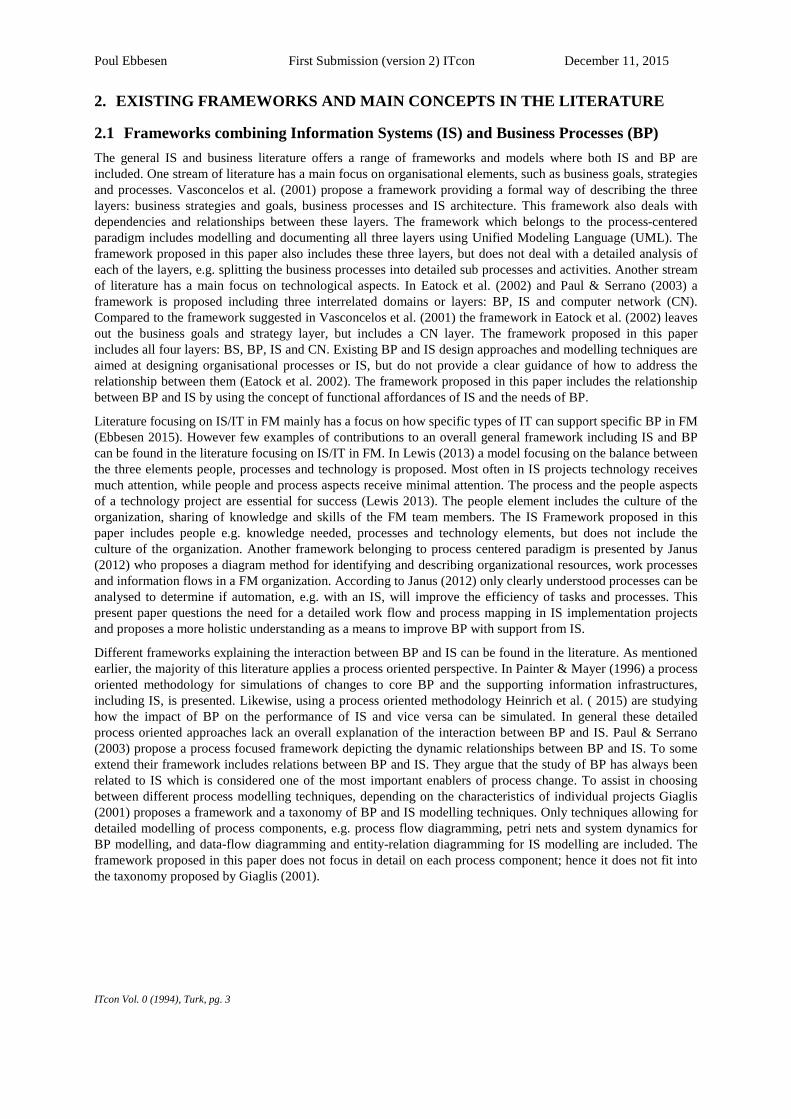
Poul Ebbesen First Submission (version 2) ITcon December 11, 2015
2. EXISTING FRAMEWORKS AND MAIN CONCEPTS IN THE LITERATURE
2.1 Frameworks combining Information Systems (IS) and Business Processes (BP) The general IS and business literature offers a range of frameworks and models where both IS and BP are included. One stream of literature has a main focus on organisational elements, such as business goals, strategies and processes. Vasconcelos et al. (2001) propose a framework providing a formal way of describing the three layers: business strategies and goals, business processes and IS architecture. This framework also deals with dependencies and relationships between these layers. The framework which belongs to the process-centered paradigm includes modelling and documenting all three layers using Unified Modeling Language (UML). The framework proposed in this paper also includes these three layers, but does not deal with a detailed analysis of each of the layers, e.g. splitting the business processes into detailed sub processes and activities. Another stream of literature has a main focus on technological aspects. In Eatock et al. (2002) and Paul & Serrano (2003) a framework is proposed including three interrelated domains or layers: BP, IS and computer network (CN). Compared to the framework suggested in Vasconcelos et al. (2001) the framework in Eatock et al. (2002) leaves out the business goals and strategy layer, but includes a CN layer. The framework proposed in this paper includes all four layers: BS, BP, IS and CN. Existing BP and IS design approaches and modelling techniques are aimed at designing organisational processes or IS, but do not provide a clear guidance of how to address the relationship between them (Eatock et al. 2002). The framework proposed in this paper includes the relationship between BP and IS by using the concept of functional affordances of IS and the needs of BP.
Literature focusing on IS/IT in FM mainly has a focus on how specific types of IT can support specific BP in FM (Ebbesen 2015). However few examples of contributions to an overall general framework including IS and BP can be found in the literature focusing on IS/IT in FM. In Lewis (2013) a model focusing on the balance between the three elements people, processes and technology is proposed. Most often in IS projects technology receives much attention, while people and process aspects receive minimal attention. The process and the people aspects of a technology project are essential for success (Lewis 2013). The people element includes the culture of the organization, sharing of knowledge and skills of the FM team members. The IS Framework proposed in this paper includes people e.g. knowledge needed, processes and technology elements, but does not include the culture of the organization. Another framework belonging to process centered paradigm is presented by Janus (2012) who proposes a diagram method for identifying and describing organizational resources, work processes and information flows in a FM organization. According to Janus (2012) only clearly understood processes can be analysed to determine if automation, e.g. with an IS, will improve the efficiency of tasks and processes. This present paper questions the need for a detailed work flow and process mapping in IS implementation projects and proposes a more holistic understanding as a means to improve BP with support from IS.
Different frameworks explaining the interaction between BP and IS can be found in the literature. As mentioned earlier, the majority of this literature applies a process oriented perspective. In Painter & Mayer (1996) a process oriented methodology for simulations of changes to core BP and the supporting information infrastructures, including IS, is presented. Likewise, using a process oriented methodology Heinrich et al. ( 2015) are studying how the impact of BP on the performance of IS and vice versa can be simulated. In general these detailed process oriented approaches lack an overall explanation of the interaction between BP and IS. Paul & Serrano (2003) propose a process focused framework depicting the dynamic relationships between BP and IS. To some extend their framework includes relations between BP and IS. They argue that the study of BP has always been related to IS which is considered one of the most important enablers of process change. To assist in choosing between different process modelling techniques, depending on the characteristics of individual projects Giaglis (2001) proposes a framework and a taxonomy of BP and IS modelling techniques. Only techniques allowing for detailed modelling of process components, e.g. process flow diagramming, petri nets and system dynamics for BP modelling, and data-flow diagramming and entity-relation diagramming for IS modelling are included. The framework proposed in this paper does not focus in detail on each process component; hence it does not fit into the taxonomy proposed by Giaglis (2001).
ITcon Vol. 0 (1994), Turk, pg. 3
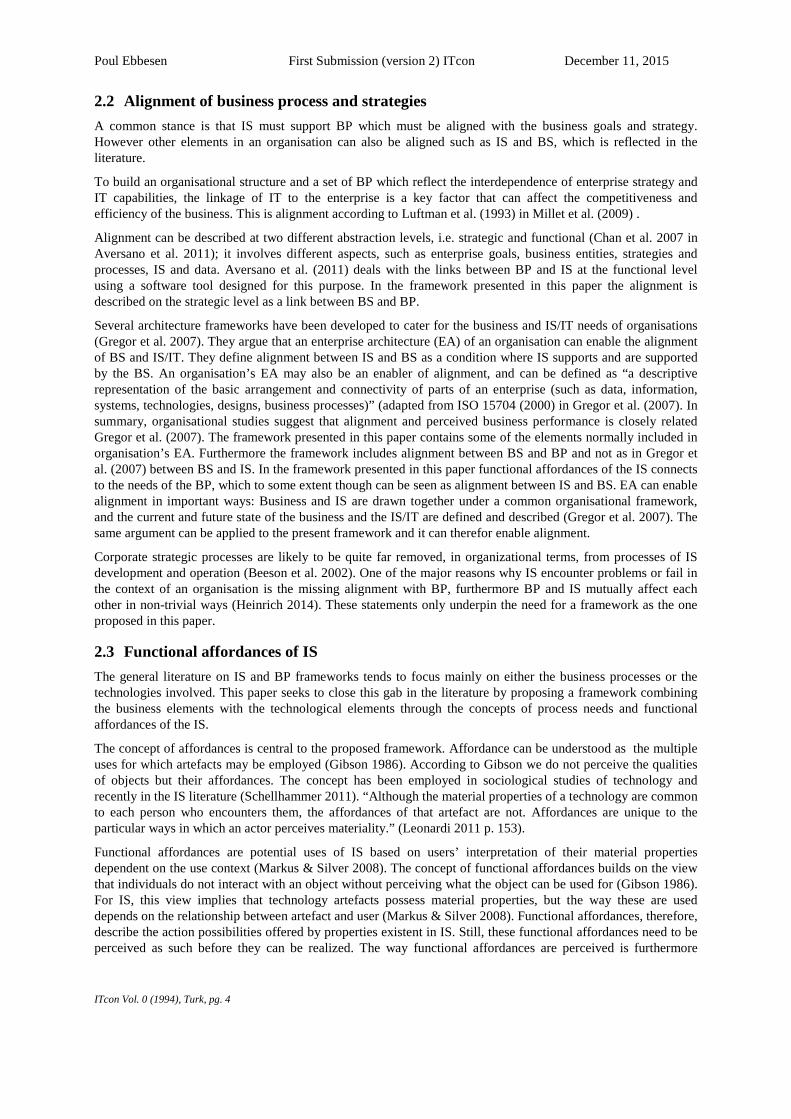
Poul Ebbesen First Submission (version 2) ITcon December 11, 2015
2.2 Alignment of business process and strategies A common stance is that IS must support BP which must be aligned with the business goals and strategy. However other elements in an organisation can also be aligned such as IS and BS, which is reflected in the literature.
To build an organisational structure and a set of BP which reflect the interdependence of enterprise strategy and IT capabilities, the linkage of IT to the enterprise is a key factor that can affect the competitiveness and efficiency of the business. This is alignment according to Luftman et al. (1993) in Millet et al. (2009) .
Alignment can be described at two different abstraction levels, i.e. strategic and functional (Chan et al. 2007 in Aversano et al. 2011); it involves different aspects, such as enterprise goals, business entities, strategies and processes, IS and data. Aversano et al. (2011) deals with the links between BP and IS at the functional level using a software tool designed for this purpose. In the framework presented in this paper the alignment is described on the strategic level as a link between BS and BP.
Several architecture frameworks have been developed to cater for the business and IS/IT needs of organisations (Gregor et al. 2007). They argue that an enterprise architecture (EA) of an organisation can enable the alignment of BS and IS/IT. They define alignment between IS and BS as a condition where IS supports and are supported by the BS. An organisation’s EA may also be an enabler of alignment, and can be defined as “a descriptive representation of the basic arrangement and connectivity of parts of an enterprise (such as data, information, systems, technologies, designs, business processes)” (adapted from ISO 15704 (2000) in Gregor et al. (2007). In summary, organisational studies suggest that alignment and perceived business performance is closely related Gregor et al. (2007). The framework presented in this paper contains some of the elements normally included in organisation’s EA. Furthermore the framework includes alignment between BS and BP and not as in Gregor et al. (2007) between BS and IS. In the framework presented in this paper functional affordances of the IS connects to the needs of the BP, which to some extent though can be seen as alignment between IS and BS. EA can enable alignment in important ways: Business and IS are drawn together under a common organisational framework, and the current and future state of the business and the IS/IT are defined and described (Gregor et al. 2007). The same argument can be applied to the present framework and it can therefor enable alignment.
Corporate strategic processes are likely to be quite far removed, in organizational terms, from processes of IS development and operation (Beeson et al. 2002). One of the major reasons why IS encounter problems or fail in the context of an organisation is the missing alignment with BP, furthermore BP and IS mutually affect each other in non-trivial ways (Heinrich 2014). These statements only underpin the need for a framework as the one proposed in this paper.
2.3 Functional affordances of IS The general literature on IS and BP frameworks tends to focus mainly on either the business processes or the technologies involved. This paper seeks to close this gab in the literature by proposing a framework combining the business elements with the technological elements through the concepts of process needs and functional affordances of the IS.
The concept of affordances is central to the proposed framework. Affordance can be understood as the multiple uses for which artefacts may be employed (Gibson 1986). According to Gibson we do not perceive the qualities of objects but their affordances. The concept has been employed in sociological studies of technology and recently in the IS literature (Schellhammer 2011). “Although the material properties of a technology are common to each person who encounters them, the affordances of that artefact are not. Affordances are unique to the particular ways in which an actor perceives materiality.” (Leonardi 2011 p. 153).
Functional affordances are potential uses of IS based on users’ interpretation of their material properties dependent on the use context (Markus & Silver 2008). The concept of functional affordances builds on the view that individuals do not interact with an object without perceiving what the object can be used for (Gibson 1986). For IS, this view implies that technology artefacts possess material properties, but the way these are used depends on the relationship between artefact and user (Markus & Silver 2008). Functional affordances, therefore, describe the action possibilities offered by properties existent in IS. Still, these functional affordances need to be perceived as such before they can be realized. The way functional affordances are perceived is furthermore
ITcon Vol. 0 (1994), Turk, pg. 4
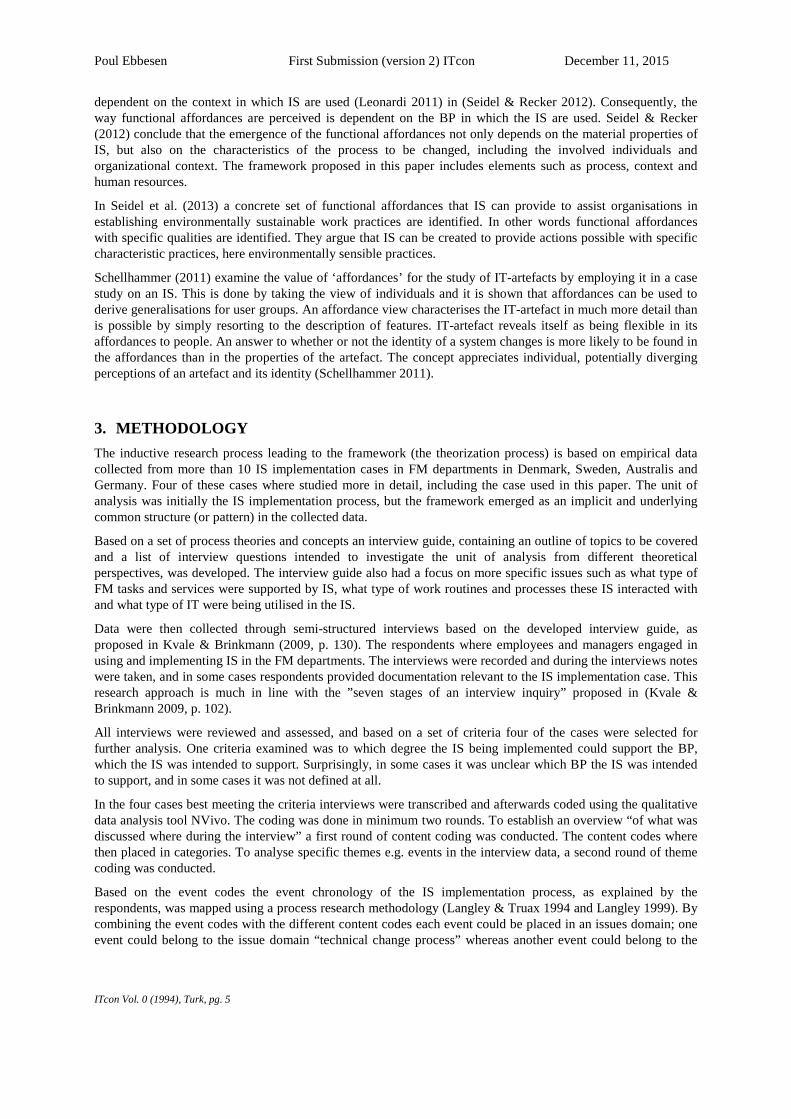
Poul Ebbesen First Submission (version 2) ITcon December 11, 2015
dependent on the context in which IS are used (Leonardi 2011) in (Seidel & Recker 2012). Consequently, the way functional affordances are perceived is dependent on the BP in which the IS are used. Seidel & Recker (2012) conclude that the emergence of the functional affordances not only depends on the material properties of IS, but also on the characteristics of the process to be changed, including the involved individuals and organizational context. The framework proposed in this paper includes elements such as process, context and human resources.
In Seidel et al. (2013) a concrete set of functional affordances that IS can provide to assist organisations in establishing environmentally sustainable work practices are identified. In other words functional affordances with specific qualities are identified. They argue that IS can be created to provide actions possible with specific characteristic practices, here environmentally sensible practices.
Schellhammer (2011) examine the value of ‘affordances’ for the study of IT-artefacts by employing it in a case study on an IS. This is done by taking the view of individuals and it is shown that affordances can be used to derive generalisations for user groups. An affordance view characterises the IT-artefact in much more detail than is possible by simply resorting to the description of features. IT-artefact reveals itself as being flexible in its affordances to people. An answer to whether or not the identity of a system changes is more likely to be found in the affordances than in the properties of the artefact. The concept appreciates individual, potentially diverging perceptions of an artefact and its identity (Schellhammer 2011).
3. METHODOLOGY The inductive research process leading to the framework (the theorization process) is based on empirical data collected from more than 10 IS implementation cases in FM departments in Denmark, Sweden, Australis and Germany. Four of these cases where studied more in detail, including the case used in this paper. The unit of analysis was initially the IS implementation process, but the framework emerged as an implicit and underlying common structure (or pattern) in the collected data.
Based on a set of process theories and concepts an interview guide, containing an outline of topics to be covered and a list of interview questions intended to investigate the unit of analysis from different theoretical perspectives, was developed. The interview guide also had a focus on more specific issues such as what type of FM tasks and services were supported by IS, what type of work routines and processes these IS interacted with and what type of IT were being utilised in the IS.
Data were then collected through semi-structured interviews based on the developed interview guide, as proposed in Kvale & Brinkmann (2009, p. 130). The respondents where employees and managers engaged in using and implementing IS in the FM departments. The interviews were recorded and during the interviews notes were taken, and in some cases respondents provided documentation relevant to the IS implementation case. This research approach is much in line with the ”seven stages of an interview inquiry” proposed in (Kvale & Brinkmann 2009, p. 102).
All interviews were reviewed and assessed, and based on a set of criteria four of the cases were selected for further analysis. One criteria examined was to which degree the IS being implemented could support the BP, which the IS was intended to support. Surprisingly, in some cases it was unclear which BP the IS was intended to support, and in some cases it was not defined at all.
In the four cases best meeting the criteria interviews were transcribed and afterwards coded using the qualitative data analysis tool NVivo. The coding was done in minimum two rounds. To establish an overview “of what was discussed where during the interview” a first round of content coding was conducted. The content codes where then placed in categories. To analyse specific themes e.g. events in the interview data, a second round of theme coding was conducted.
Based on the event codes the event chronology of the IS implementation process, as explained by the respondents, was mapped using a process research methodology (Langley & Truax 1994 and Langley 1999). By combining the event codes with the different content codes each event could be placed in an issues domain; one event could belong to the issue domain “technical change process” whereas another event could belong to the
ITcon Vol. 0 (1994), Turk, pg. 5
Poul Ebbesen First Submission (version 2) ITcon December 11, 2015
issue domain “organisational change process”. This event mapping in issue domains is explained and illustrated in Ebbesen & Nardelli (2015).
During this event mapping the structure or the patterns which are representing the basis for the framework, proposed in this paper, emerged. As an example, it became clear that in all four cases there were routines strictly related to the BP and routines strictly related to the IS, in other words two separate sets of routines. Furthermore the elements common to all four cases, which constitutes the IS and the BS and the connections between the IS and the BP, emerged.
At this stage additional existing theory on IS and BP frameworks, as explained in the previous section, was included in the study. It became clear that the observed connection between IS and BP could be explained using the concept of functional affordances of IS. The connection between the BP and the BS could then be explained using the concept of alignment.
This research follows the methodology outlined in Eisenhardt & Graebner (2007). It builds theory and theory constructs based on studies of multiple cases, and theory is developed inductively from the collected data. The theory is emergent in the sense that it is situated and developed by recognizing patterns of relationships among constructs within and across the cases and their underlying logical arguments (Eisenhardt & Graebner 2007).
The definitive framework emerging from this study is illustrated and explained in the next section.
ITcon Vol. 0 (1994), Turk, pg. 6
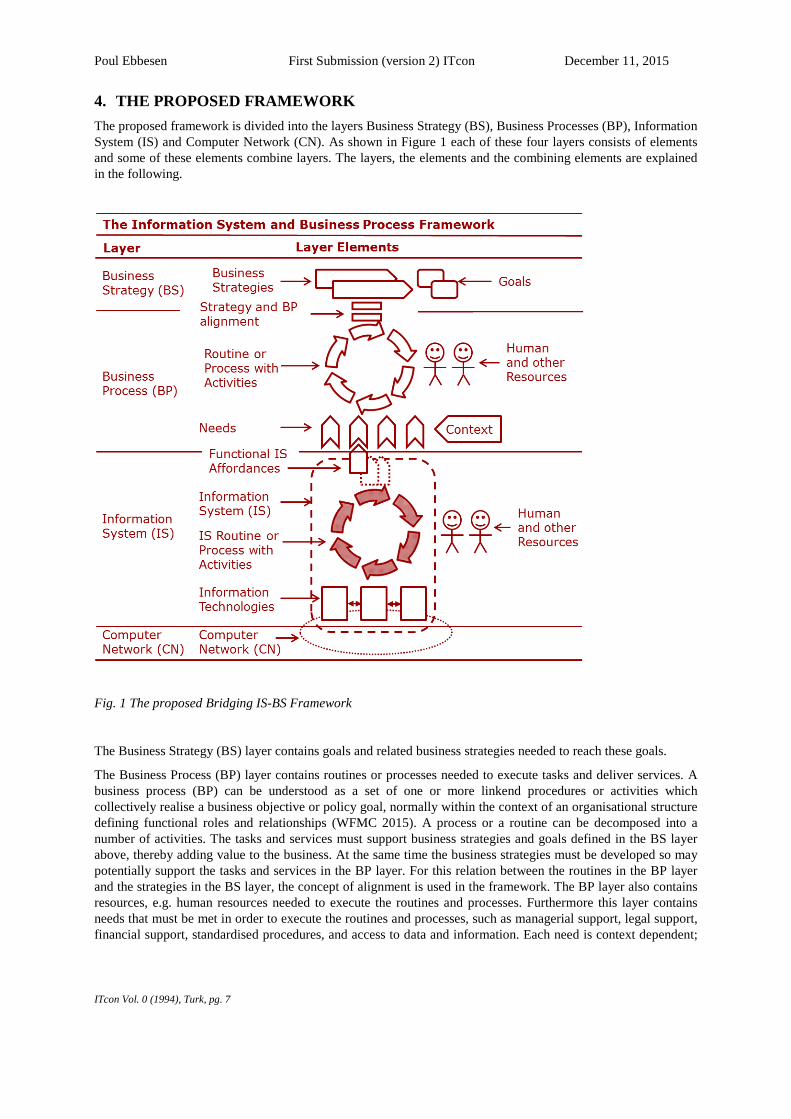
Poul Ebbesen First Submission (version 2) ITcon December 11, 2015
4. THE PROPOSED FRAMEWORK The proposed framework is divided into the layers Business Strategy (BS), Business Processes (BP), Information System (IS) and Computer Network (CN). As shown in Figure 1 each of these four layers consists of elements and some of these elements combine layers. The layers, the elements and the combining elements are explained in the following.
Fig. 1 The proposed Bridging IS-BS Framework
The Business Strategy (BS) layer contains goals and related business strategies needed to reach these goals.
The Business Process (BP) layer contains routines or processes needed to execute tasks and deliver services. A business process (BP) can be understood as a set of one or more linkend procedures or activities which collectively realise a business objective or policy goal, normally within the context of an organisational structure defining functional roles and relationships (WFMC 2015). A process or a routine can be decomposed into a number of activities. The tasks and services must support business strategies and goals defined in the BS layer above, thereby adding value to the business. At the same time the business strategies must be developed so may potentially support the tasks and services in the BP layer. For this relation between the routines in the BP layer and the strategies in the BS layer, the concept of alignment is used in the framework. The BP layer also contains resources, e.g. human resources needed to execute the routines and processes. Furthermore this layer contains needs that must be met in order to execute the routines and processes, such as managerial support, legal support, financial support, standardised procedures, and access to data and information. Each need is context dependent;
ITcon Vol. 0 (1994), Turk, pg. 7
Poul Ebbesen First Submission (version 2) ITcon December 11, 2015
it depends on e.g. the type of organisation or type of facilities (at least when dealing with IS used in FM departments).
The IS layer contains the IS, which include IS routines or processes and one or more interacting IT. The IS routines and processes also require human resources and cannot rely only on the technologies to be executed. The IS layer creates IS affordances, or functional IS affordances, typically data or information type of affordances. One or more of these functional IS affordances can match one or more of the needs in the BP layer above, typically data or information types of needs. This match does however rely on the context Leonardi (2011) and on how the functional affordances are perceived by the human recourses or individuals involved in the BP.
Finally the CN layer contains the network which is the infrastructure wherein data can be transmitted and exchanged between technologies in the IS layer.
Coherent layers interact with each other. The CN layer delivers the basis for running the technologies in the IS layer. In the IS layer functional affordances are created, typically meeting the needs for data and information in the BP layer. Finally, if the processes in the BP layer are aligned with the strategies in the BS layer, the BP layer can add value to the business by delivering the routines and processes and executing the tasks and services needed to reach the goals set in the BS layer as defined in the strategies. If needs in the BP layer are meet by functional affordances in the IS layer, in other words if the BP layer is supported by the IS layer, this should add further value to the BS layer.
This interaction between the layers not only goes upwards. The business strategies and goals set in the BS layer define the type of tasks and services that are required in the BP layer (alignment). These tasks and services in the BP layer require certain type of data and information which subsequently defines which functional affordances are relevant to create in the IS layer. Finally, the IS in the IS layer requires a certain type of network, as a defining input to the CN layer.
It should be noticed that there may be multiple instances of each element in the framework, e.g. more than one routine in the IS layer, more than one functional affordance which is used in the BP layer, more than one routine in the BP layer etc.
5. APPLYING THE FRAMEWORK TO A CASE In this section the proposed framework is applied to one of the four selected cases. To provide an overall picture of the general context, first a brief introduction to the FM domain and the IS/IT being used in FM is given. Next the case is presented and finally the framework is applied to the case.
5.1 Facilities Management (FM) Most organisations are located in and use physical facilities, which often are managed by a Facilities Management (FM) department within the organisation. FM departments offer FM services to ensure the correct functioning of an organization by supporting its employees in the daily execution of their tasks (Jensen 2008). FM departments are typically responsible for tasks not directly related to the core business of the organization, but rather oriented toward management of buildings (e.g. management of maintenance, refurbishment and in some cases regular construction projects) and other facilities and related services.
5.2 IS/IT in FM Besides the general IS, used by the whole organization, such as office and accounting systems, FM departments invest in and use IS designed to support FM tasks and work processes. These IS can include information technologies (IT) such as data repositories (e.g. BIM), workflow systems, facilities intelligence systems, sensor/monitoring systems and communication systems (Ebbesen 2015).
ITcon Vol. 0 (1994), Turk, pg. 8
Poul Ebbesen First Submission (version 2) ITcon December 11, 2015
5.3 The Case The case is constituted by an Australian organisation which manages cultural events. The organisation is owned by the public, has 750 employees and it is situated in 55,000 m2 facilities. The FM department employs 40 people who are in charge of all operations and changes of the facilities. Most of the functions are outsourced and the FM department therefore relies heavily on external suppliers such as consultants, contractors and service providers to operate and adjust the facilities according to the needs of the core business. The facilities are intensely exploited and used every day all year round. The facilities are constantly undergoing alterations; there are constantly ongoing construction and refurbishment projects in the facilities. The facilities are geometrically complicated and they are classified as protected buildings and subject to strict constraints to any changes. Hence a constant need for accurate and updated geometrical data.
As indicated the suppliers involved in the alterations of the facilities are in constant need of accurate and updated geometrical building information. To minimize the time spent to find and deliver updated information, the FM department during the last 10 years has been in the process of implementing an IS based on Building Information Modeling (BIM), where updated geometrical building data and other building related information is available, and where changes in the physical facilities are reported back and updated in the 3D BIM model. The process of implementing the IS, which is now fully completed, has taken ten years. This includes building up the needed knowledge in the FM department and scanning the IS market for possible solutions. New employees with IS and BIM competences have been hired to build up the 3D model and to manage the routines and processes of the IS. The IS routines include keeping the 3D model up-to-date and delivering needed data for the construction projects. The IS runs on an internal network. Only people in charge of the IS have access to the internal network within which the updated master model is located. Through the internet external suppliers have access to a simple version of the model and to other information and drawings. At the end of each alteration in the facilities it is required that suppliers upload a new version of the model, including the changes they have applied to the physical facilities. The IS managers can then change the master model accordingly. The external suppliers are also required to do cloud scanning of the changed areas of the facilities, and to deliver the cloud scanning files together with the new version of the model.
ITcon Vol. 0 (1994), Turk, pg. 9
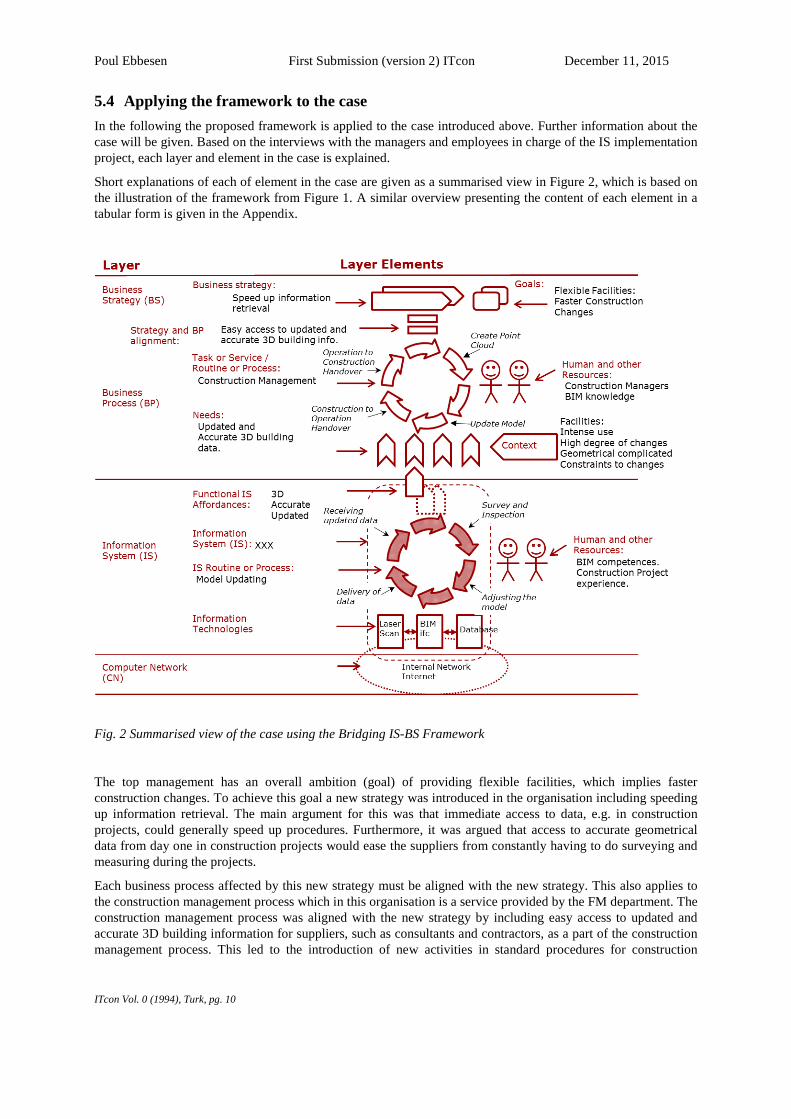
Poul Ebbesen First Submission (version 2) ITcon December 11, 2015
5.4 Applying the framework to the case In the following the proposed framework is applied to the case introduced above. Further information about the case will be given. Based on the interviews with the managers and employees in charge of the IS implementation project, each layer and element in the case is explained.
Short explanations of each of element in the case are given as a summarised view in Figure 2, which is based on the illustration of the framework from Figure 1. A similar overview presenting the content of each element in a tabular form is given in the Appendix.
Fig. 2 Summarised view of the case using the Bridging IS-BS Framework
The top management has an overall ambition (goal) of providing flexible facilities, which implies faster construction changes. To achieve this goal a new strategy was introduced in the organisation including speeding up information retrieval. The main argument for this was that immediate access to data, e.g. in construction projects, could generally speed up procedures. Furthermore, it was argued that access to accurate geometrical data from day one in construction projects would ease the suppliers from constantly having to do surveying and measuring during the projects.
Each business process affected by this new strategy must be aligned with the new strategy. This also applies to the construction management process which in this organisation is a service provided by the FM department. The construction management process was aligned with the new strategy by including easy access to updated and accurate 3D building information for suppliers, such as consultants and contractors, as a part of the construction management process. This led to the introduction of new activities in standard procedures for construction
ITcon Vol. 0 (1994), Turk, pg. 10
Poul Ebbesen First Submission (version 2) ITcon December 11, 2015
management such as “handover of a building information model from operations to construction” in the early phase of construction, “scanning and creating a point cloud of the changed parts of the building”, “updating the model based on the point cloud” and finally near the end of construction period “handover of the updated model from construction to operations”. These new activities affected all external suppliers, and standard contracts were therefore rewritten to also include these activities.
To execute the mentioned new activities some data related needs must be met. Data must be constantly prepared for use; data must be updated and be accurate. The context is an important element when considering what needs should be met. As mentioned the facilities are intensely exploited, often undergoing alterations, are geometrically complicated and there are strict constraints to any changes.
To meet these needs it was decided to invest in a BIM based IS. To meet the specific need of access to accurate geometrical data, and at the same time take into account the special context of having to do with geometrical complicated facilities, it was decided to laser scan the geometrically most complicated parts of the facilities. To meet the specific need of having constantly updated data, people with IS and BIM skills where hired to run the IS routines. The IS, as shown in Figure 2, creates the functional affordances of delivering accurate and updated 3D information. These affordances cover the data related needs of the new activities “operations to construction handover” and “construction to operations handover” in the construction management routine in the BP layer. The IS routine includes activities such as “receiving updated data from construction”, “survey and inspection”, adjustment of the master model” and “delivery of data to construction”.
6. DISCUSSION AND CONCLUSIONS The bridging framework presented in this paper shows that IS and BP are two separate and distinct phenomena. This implies a distinction between the routines in the BP layer and the routines in the IS layer. Both routines include activities which require manpower and other resources, but they are two separate entities. The IS and BP layers are connected through functional affordances of the IS and requirements or needs of the BP.
To some extent the framework is based on a teleological system notion rather than on an ontological system notion (Dietz & Albani 2005). The teleological system notion is about the function or purpose of the system. The corresponding type of model is the black-box model with a set of input variables and a set of output variables. The ontological system notion is about the construction and operation of a system with no focus of the function of the system. The associated type of model is the white-box model which can be decomposed. Using this terminology each layer in the framework can be seen as black-boxes. It is the function, the purpose of the layers and the relations between the layers which are brought forward in the framework, not the many individual activities in the routines in the BP layer or in the IS layer. This is somewhat in contrast to the many detailed process oriented models found in the literature.
When applied to a case, as it is done in this paper, the framework can show to what degree an existing IS or an IS implementation project is “complete” or “robust”. If one or more of the elements in the framework are missing or not defined, the IS implementation is likely to run in to trouble. If for instance in the routine in the IS layer, it is unclear which activities create the functional affordances needed in the BP layer, it may not be possible to support the routine in the BP layer. Each element is needed and must be clarified in order to add value to the organisation from IS investments.
The framework can be used as an analytical framework to investigate use and implementation of IS in organisations, and it can be used to compare such cases. As shown this paper also represents a methodological contribution.
The bridging framework provides a more holistic view in the planning and execution of IS implementation projects, forcing one to see the broader picture.
The framework can be further developed. It lacks the concept of value, i.e. how IS can add value to the organisation. It also lacks a conceptual link between the CN layer and the IS layer. This could be the concept of interoperability, which not only includes data exchange between different IT and exchange of data in networks, but also exchange of data in work processes.
ITcon Vol. 0 (1994), Turk, pg. 11

Poul Ebbesen First Submission (version 2) ITcon December 11, 2015
The costly part in the framework is the work routines and processes. Keeping these running and compliant to standards in the BP layer requires highly specialized skills. Adding an IS layer with its own routines and processes to the equation, it becomes even more costly and complicated. As mentioned in the description of the case, new staff were hired to run the routines in the IS layer.
Although many different routines and processes are needed to keep facilities operating efficiently it is often challenging to actually implement these in an existing FM organization (Lewis et al. 2010). If routines and processes in the BP layer are not in place, it will be difficult to support them with an IS. This may jeopardize an IS project. In some cases though the IS implementation is used to force a profitable standardization into routines and processes in the BP Layer (Ebbesen & Nardelli 2015).
This paper applies the framework to a case where an IS based on BIM is used to support construction management (the BP) in FM. By doing so it helps us understand how FM can benefit from the data produced during both design and construction, and how this data should be handed over to the FM side of the table. We must understand the specific context and respect the way the FM department normally handles and use data from construction projects.
Although the framework is based on data from the FM domain, it is generic and should be applicable to other domains as well.
ITcon Vol. 0 (1994), Turk, pg. 12
Poul Ebbesen First Submission (version 2) ITcon December 11, 2015
7. REFERENCES Aversano, L., Grasso, C. & Tortorella, M., 2011. ALBIS - ALigning Business Processes and Information Systems: A
Case Study. In Enterprise Information Systems. pp. 286–296.
Beeson, I. et al., 2002. Linking Business Processes and Information Systems Provision in a Dynamic Environment. Information Systems Frontiers, 4(3), pp.317–329.
Dietz, J.L.G. & Albani, A., 2005. Basic notions regarding business processes and supporting information systems. Requirements Engineering, 10(3), pp.175–183.
Eatock, J., Paul, R.J. & Serrano, A., 2002. Developing a Theory to Explain the Insights Gained Concerning Information Systems and Business Process Behaviour: The ASSESS-IT Project. Information Systems Frontiers, 4(3), pp.303–316.
Ebbesen, P., 2015. Information Technology in Facilities Management - A Literature Review. In 14th EuroFM Research Symposium.
Ebbesen, P. & Nardelli, G., 2015. Formal Control and Scope in Information System Projects in Facilities Management – A Process Perspective. In The 38th Information Systems Research Conference in Scandinavia (IRIS 38). pp. 1–17.
Eisenhardt, K.M. & Graebner, M.E., 2007. Theory Building From Cases : Opportunities and Challenges. Academy of Management Journal, 50(1), pp.25–32.
Giaglis, G.M., 2001. A taxonomy of business process modeling and information systems modeling techniques. The International Journal of Flexible Manufacturing Systems, 13(2), pp.209–228.
Gibson, J.J., 1986. The ecological approach to visual perception, Lawrence Erlbaum Associates.
Gregor, S., Hart, D. & Martin, N., 2007. Enterprise architectures: enablers of business strategy and IS/IT alignment in government. Information Technology & People, 20(2), pp.96–120.
Heinrich, R., 2014. Aligning Business Processes and Information Systems, Springer Vieweg.
Heinrich, R. et al., 2015. Integrating business process simulation and information system simulation for performance prediction. Software & Systems Modeling.
ISO 15704, 2000. Industrial automation systems -- Requirements for enterprise-reference architectures and methodologies,
Janus, K., 2012. FM Business Processes and their IT Implementation. In M. May & G. Williams, eds. The Facilitiy Manager’s Guide to Information Technology. GEFMA, pp. 159–165.
Jensen, P.A., 2008. Facilities Management for students and practitioners, Lyngby Denmark: Centre for Facilities Management - Realdania Research, DTU Management Engineering and Polyteknisk Forlag.
Kvale, S. & Brinkmann, S., 2009. Interviews 2nd ed., SAGE Publications.
Langley, A., 1999. Strategies for theorizing from process data. Academy of Management Review, 24(4), pp.691–710.
Langley, A. & Truax, J., 1994. A Process Study of New Technology Adoption in Smaller Manufacturing Firms. Journal of Management Studies, 31(September), pp.619–652.
ITcon Vol. 0 (1994), Turk, pg. 13
Poul Ebbesen First Submission (version 2) ITcon December 11, 2015
Leonardi, P.M., 2011. When flexible routines meet flexible technologies: affordance, constraint, and the imbrication of human and material agencies. , 35(1), pp.147–167.
Lewis, A., 2013. The Role of People and Process in Technology. In E. Teicholz, ed. Technology for Facilities Management. IFMA, pp. 229–244.
Lewis, A., Riley, D. & Elmualim, A., 2010. Defining High Performance Buildings for Operations and Maintenance. International Journal of Facility Management, 1(2), pp.1–16.
Markus, M.L. & Silver, M.S., 2008. A Foundation for the Study of IT Effects : A New Look at DeSanctis and Poole ’ s Concepts of Structural Features and Spirit. Journal of the Association for Information Systems, 9(10/11), pp.609–632.
Millet, P.-A., Schmitt, P. & Botta-Genoulaz, V., 2009. The SCOR model for the alignment of business processes and information systems. Enterprise Information Systems, 3(4), pp.393–407.
Painter, M.K. & Mayer, R.J., 1996. A Methodology for Integrating Business Process and Information Infrastructure Models. In Proceedings of the 1996 Winter Simulation Conference.
Paul, R.J. & Serrano, A., 2003. Simulation for business processes and information systems design. In Proceedings of the 2003 Winter Simulation Conference. pp. 1787–1796.
Schellhammer, S., 2011. Affordances Of Interorganisational Information Systems ( IOIS ) – A Pharmacist ’ S Perspective. Pacis 2011.
Seidel, S. & Recker, J., 2012. Implementing green business processes: the importance of functional affordances of information systems. ACIS 2012: Proceedings of the 23rd Australasian Conference on Information Systems 2012, (Melville 2010), pp.1–10.
Seidel, S., Recker, J. & Vom Brocke, J., 2013. Sensemaking and Sustainable Practicing: Functional Affordances of Information Systems in Green Transformations. MIS Quarterly, 37(4), pp.1275–1299.
Vasconcelos, a. et al., 2001. A framework for modeling strategy, business processes andinformation systems. Proceedings Fifth IEEE International Enterprise Distributed Object Computing Conference, pp.69–80.
WFMC, 2015. Terminology & Glossary. Workflow Management Coalition. Available at: http://www.aiai.ed.ac.uk/project/wfmc/ARCHIVE/DOCS/glossary/glossary.html.
ITcon Vol. 0 (1994), Turk, pg. 14
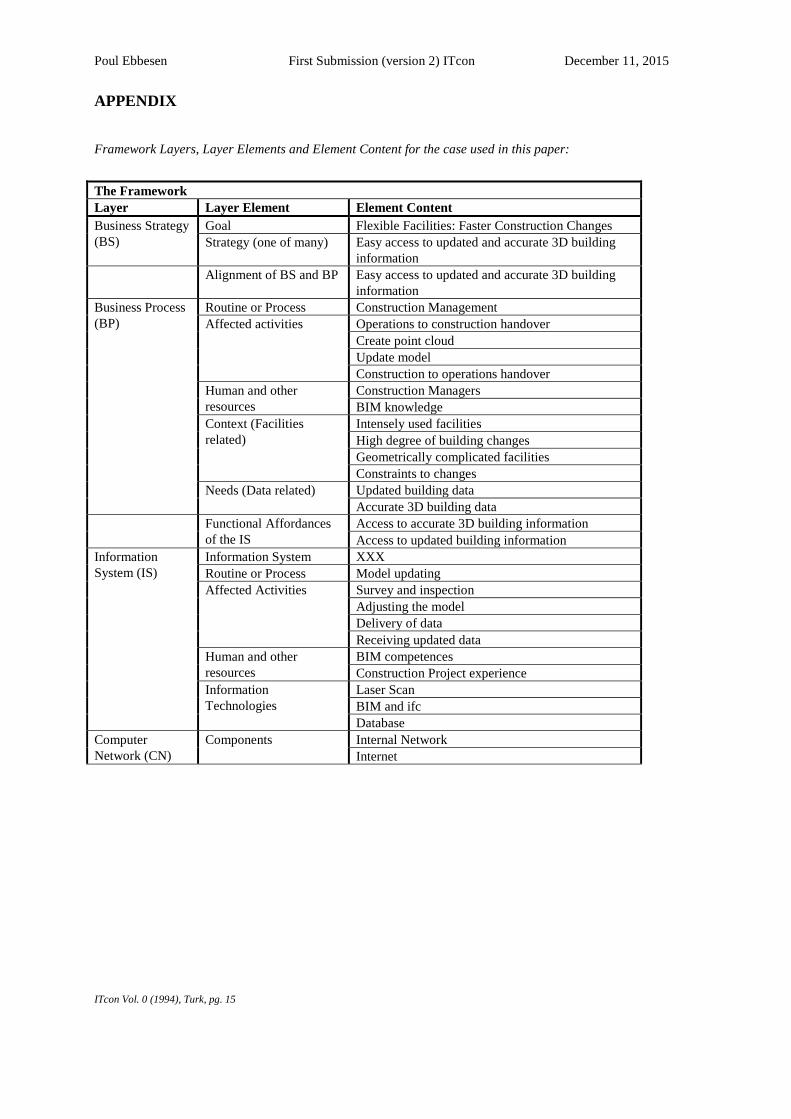
Poul Ebbesen First Submission (version 2) ITcon December 11, 2015
APPENDIX
Framework Layers, Layer Elements and Element Content for the case used in this paper:
The Framework Layer Layer Element Element Content Business Strategy (BS)
Goal Flexible Facilities: Faster Construction Changes Strategy (one of many) Easy access to updated and accurate 3D building
information Alignment of BS and BP Easy access to updated and accurate 3D building
information Business Process (BP)
Routine or Process Construction Management Affected activities Operations to construction handover
Create point cloud Update model Construction to operations handover
Human and other resources
Construction Managers BIM knowledge
Context (Facilities related)
Intensely used facilities High degree of building changes Geometrically complicated facilities Constraints to changes
Needs (Data related) Updated building data Accurate 3D building data
Functional Affordances of the IS
Access to accurate 3D building information Access to updated building information
Information System (IS)
Information System XXX Routine or Process Model updating Affected Activities Survey and inspection
Adjusting the model Delivery of data Receiving updated data
Human and other resources
BIM competences Construction Project experience
Information Technologies
Laser Scan BIM and ifc Database
Computer Network (CN)
Components Internal Network Internet
ITcon Vol. 0 (1994), Turk, pg. 15

PAPER 6 IS AND ADDED VALUE
Ebbesen, P. & Jensen, P.A., 2016. Assessing the Added Value of Information Systems supporting Facilities Management Business Processes, Facilities, In Review.
First Draft Version for Journal: Facilities (Not in anonymous version: Poul Ebbesen & Per Anker Jensen) Dec. 8, 15
Assessing the Added Value of Information Systems supporting Facilities Management Business Processes
ABSTRACT Purpose: To present a method for assessing the added value of Information Systems (IS) in Facilities Management (FM). The method is based on a supply chain management model of FM, general value dimensions such as efficiency and effectiveness, the concept of Value Adding Management (VAM) and the concept of Functional Affordances of IS.
Approach (Theory/Methodology): Based on case studies of IS implementation processes in FM department in organisations in different countries, a general picture of the expressed added value of IS in FM was established. Based on this insight a general method for assessing the added value of IS in FM was developed. The proposed method is applied to one of the cases.
Results and practical implication: This study contributes to the often complex task of accessing the added value of IS in general and specifically in FM.
Research limitations: The method is only tested on one case and this study only includes a limited number of value dimensions. The method can be further developed.
Originality/value: This is the first paper using a supply chain management model of FM, general value dimensions, VAM and Functional Affordances of IS to access the added value of IS in FM.
Keywords: Information Systems, Added Value, Facilities Management, Business Processes, Supply Chain, Functional Affordances
Page 1 of 16
First Draft Version for Journal: Facilities (Not in anonymous version: Poul Ebbesen & Per Anker Jensen) Dec. 8, 15
1 Introduction Assessing the added value from the effort of implementing IS supporting FM processes is associated with major challenges. It is often unclear what added value is expected and what part of the supply chain of FM deliveries that benefits from the IS. One reason for this might be that the concept of value is not well defined and as a consequence can be difficult to use as a sole parameter. Furthermore it is often not understood very well how the parts in the supply chain of FM deliveries are interconnected. This paper therefore proposes a general method for assessing the added value of IS in FM.
This paper applies an added value perspective on Information Systems (IS) and IS change processes in Facilities Management (FM). The underlying research question of this paper is: How can the added value of IS supporting FM business processes be assessed?
To readers not familiar with FM: FM is a service management discipline. Most organisations are located in and use physical facilities, which often are managed by a FM department within the organisation. FM departments offer FM services to ensure the correct functioning of an organization by supporting its employees in the daily execution of their tasks (Jensen 2008). FM departments are typically responsible for tasks not directly related to the core business of the organization, but rather oriented toward management of buildings, other facilities and related services. FM is a management discipline and this study therefore has a focus on how the management of FM business processes can be improved with IS.
The structure of this paper is as follows: In the next section different value concepts and dimensions relevant for this paper are presented. The following section presents the concept of Value Adding Management (VAM) and the Supply Chain Management Model of FM. In “Expressed added value” an overview of the added value from IS as expressed by respondents in five IS implementation cases is given. It shows that only parts of the value picture are explicitly expressed, and that there is a need for a general model for assessing the value of IS. In “Methodology” the research leading to the development of the method is explained. In “Proposed Method for assessing the Added Value of IS in FM” the method, which is the core of this paper, for assessing the value of IS supporting FM business processes is explained stepwise. In “The IS implementation Case” the case used to exemplify the proposed model is presented. In “Assessing the value added in the IS implementation case” the added value of the case is assessed based on the proposed method. In “Discussion and Conclusions” the assessment method is discussed and conclusions are summarized.
2 Value Concepts In this section different value concepts and dimensions that constitutes the basis of the proposed IS value assessment method is presented. This paper draws on general theory and concepts on value in the literature, and on value concepts used in the FM and IS research domains.
There is no commonly accepted definition of value (Thyssen 2011, p. 53). The plural version ”values” is often related to ethics or moral issues. In this paper value is understood as benefits to the business. There are of course many types of benefits. To achieve value, or to add value, often some sort of effort or sacrifice is required. Examples of benefits from the effort or sacrifice of implementing an IS can e.g. be increased efficiency and improved effectiveness of the business processes, and improved Interoperability. But implementing an IS in an organisation, can of course also have many other types of benefits, e.g.
Page 2 of 16
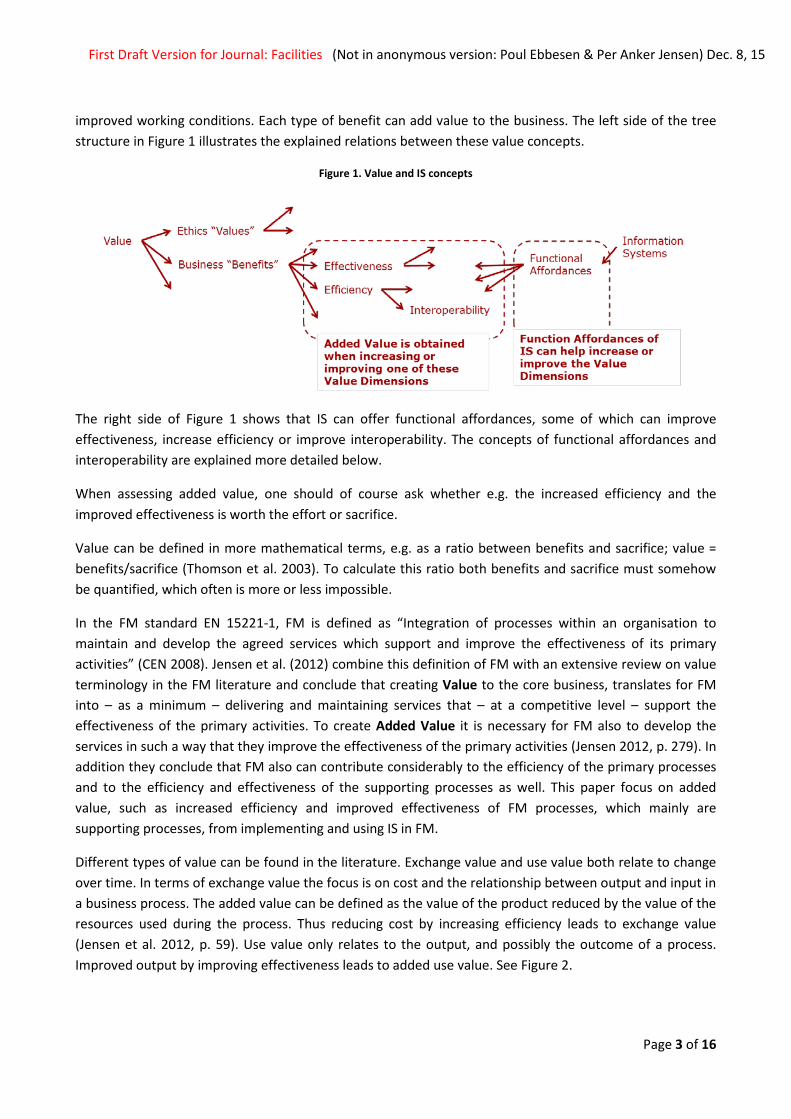
First Draft Version for Journal: Facilities (Not in anonymous version: Poul Ebbesen & Per Anker Jensen) Dec. 8, 15
improved working conditions. Each type of benefit can add value to the business. The left side of the tree structure in Figure 1 illustrates the explained relations between these value concepts.
Figure 1. Value and IS concepts
The right side of Figure 1 shows that IS can offer functional affordances, some of which can improve effectiveness, increase efficiency or improve interoperability. The concepts of functional affordances and interoperability are explained more detailed below.
When assessing added value, one should of course ask whether e.g. the increased efficiency and the improved effectiveness is worth the effort or sacrifice.
Value can be defined in more mathematical terms, e.g. as a ratio between benefits and sacrifice; value = benefits/sacrifice (Thomson et al. 2003). To calculate this ratio both benefits and sacrifice must somehow be quantified, which often is more or less impossible.
In the FM standard EN 15221-1, FM is defined as “Integration of processes within an organisation to maintain and develop the agreed services which support and improve the effectiveness of its primary activities” (CEN 2008). Jensen et al. (2012) combine this definition of FM with an extensive review on value terminology in the FM literature and conclude that creating Value to the core business, translates for FM into – as a minimum – delivering and maintaining services that – at a competitive level – support the effectiveness of the primary activities. To create Added Value it is necessary for FM also to develop the services in such a way that they improve the effectiveness of the primary activities (Jensen 2012, p. 279). In addition they conclude that FM also can contribute considerably to the efficiency of the primary processes and to the efficiency and effectiveness of the supporting processes as well. This paper focus on added value, such as increased efficiency and improved effectiveness of FM processes, which mainly are supporting processes, from implementing and using IS in FM.
Different types of value can be found in the literature. Exchange value and use value both relate to change over time. In terms of exchange value the focus is on cost and the relationship between output and input in a business process. The added value can be defined as the value of the product reduced by the value of the resources used during the process. Thus reducing cost by increasing efficiency leads to exchange value (Jensen et al. 2012, p. 59). Use value only relates to the output, and possibly the outcome of a process. Improved output by improving effectiveness leads to added use value. See Figure 2.
Page 3 of 16
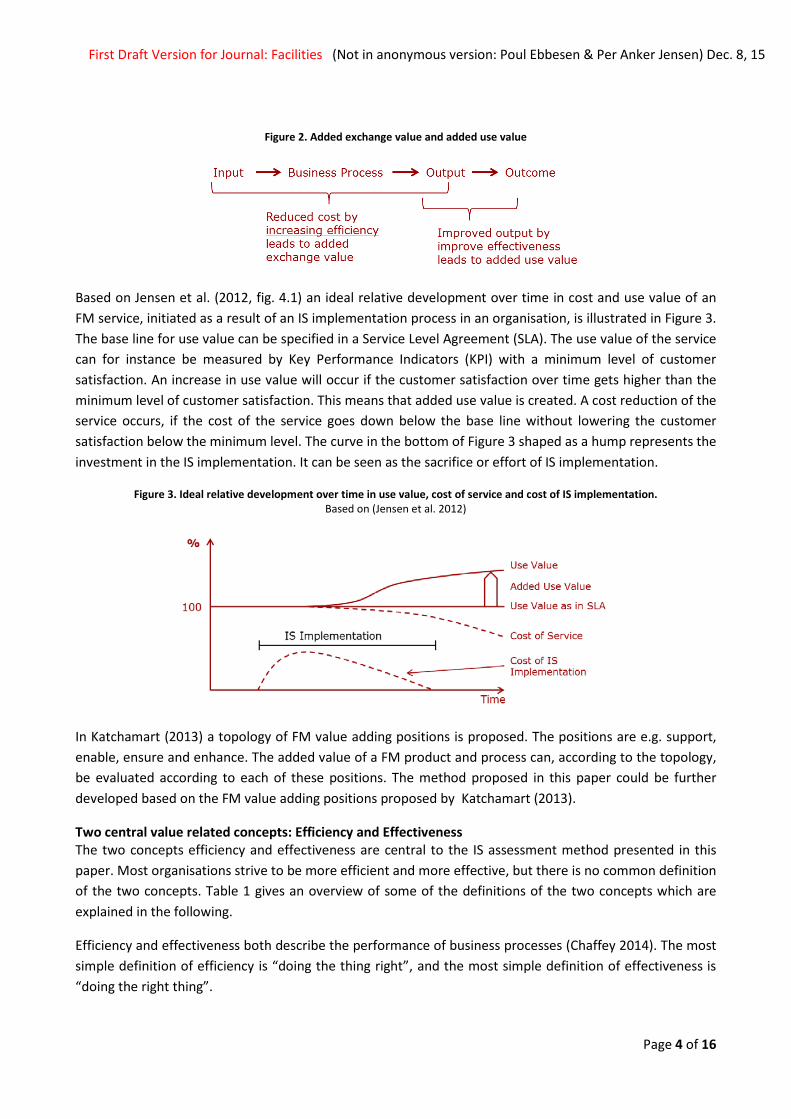
First Draft Version for Journal: Facilities (Not in anonymous version: Poul Ebbesen & Per Anker Jensen) Dec. 8, 15
Figure 2. Added exchange value and added use value
Based on Jensen et al. (2012, fig. 4.1) an ideal relative development over time in cost and use value of an FM service, initiated as a result of an IS implementation process in an organisation, is illustrated in Figure 3. The base line for use value can be specified in a Service Level Agreement (SLA). The use value of the service can for instance be measured by Key Performance Indicators (KPI) with a minimum level of customer satisfaction. An increase in use value will occur if the customer satisfaction over time gets higher than the minimum level of customer satisfaction. This means that added use value is created. A cost reduction of the service occurs, if the cost of the service goes down below the base line without lowering the customer satisfaction below the minimum level. The curve in the bottom of Figure 3 shaped as a hump represents the investment in the IS implementation. It can be seen as the sacrifice or effort of IS implementation.
Figure 3. Ideal relative development over time in use value, cost of service and cost of IS implementation. Based on (Jensen et al. 2012)
In Katchamart (2013) a topology of FM value adding positions is proposed. The positions are e.g. support, enable, ensure and enhance. The added value of a FM product and process can, according to the topology, be evaluated according to each of these positions. The method proposed in this paper could be further developed based on the FM value adding positions proposed by Katchamart (2013).
Two central value related concepts: Efficiency and Effectiveness The two concepts efficiency and effectiveness are central to the IS assessment method presented in this paper. Most organisations strive to be more efficient and more effective, but there is no common definition of the two concepts. Table 1 gives an overview of some of the definitions of the two concepts which are explained in the following.
Efficiency and effectiveness both describe the performance of business processes (Chaffey 2014). The most simple definition of efficiency is “doing the thing right”, and the most simple definition of effectiveness is “doing the right thing”.
Page 4 of 16
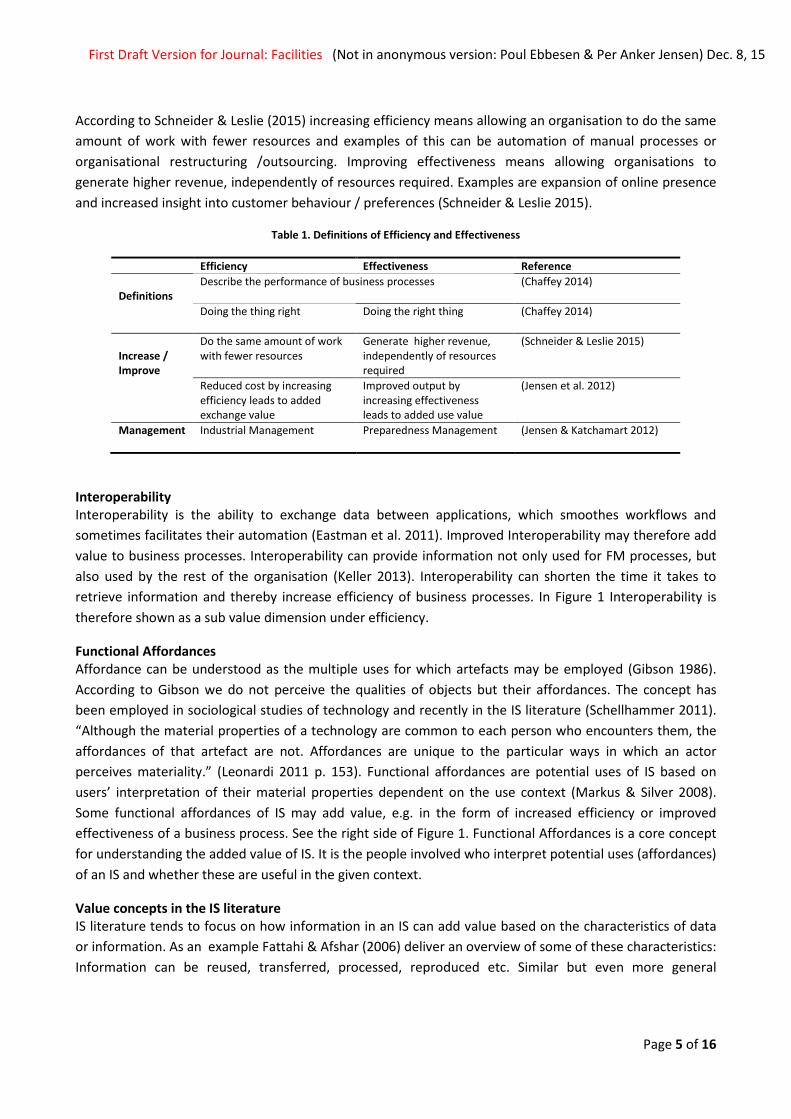
First Draft Version for Journal: Facilities (Not in anonymous version: Poul Ebbesen & Per Anker Jensen) Dec. 8, 15
According to Schneider & Leslie (2015) increasing efficiency means allowing an organisation to do the same amount of work with fewer resources and examples of this can be automation of manual processes or organisational restructuring /outsourcing. Improving effectiveness means allowing organisations to generate higher revenue, independently of resources required. Examples are expansion of online presence and increased insight into customer behaviour / preferences (Schneider & Leslie 2015).
Table 1. Definitions of Efficiency and Effectiveness
Efficiency Effectiveness Reference Definitions
Describe the performance of business processes
(Chaffey 2014)
Doing the thing right Doing the right thing (Chaffey 2014)
Increase / Improve
Do the same amount of work with fewer resources
Generate higher revenue, independently of resources required
(Schneider & Leslie 2015)
Reduced cost by increasing efficiency leads to added exchange value
Improved output by increasing effectiveness leads to added use value
(Jensen et al. 2012)
Management Industrial Management
Preparedness Management (Jensen & Katchamart 2012)
Interoperability Interoperability is the ability to exchange data between applications, which smoothes workflows and sometimes facilitates their automation (Eastman et al. 2011). Improved Interoperability may therefore add value to business processes. Interoperability can provide information not only used for FM processes, but also used by the rest of the organisation (Keller 2013). Interoperability can shorten the time it takes to retrieve information and thereby increase efficiency of business processes. In Figure 1 Interoperability is therefore shown as a sub value dimension under efficiency.
Functional Affordances Affordance can be understood as the multiple uses for which artefacts may be employed (Gibson 1986). According to Gibson we do not perceive the qualities of objects but their affordances. The concept has been employed in sociological studies of technology and recently in the IS literature (Schellhammer 2011). “Although the material properties of a technology are common to each person who encounters them, the affordances of that artefact are not. Affordances are unique to the particular ways in which an actor perceives materiality.” (Leonardi 2011 p. 153). Functional affordances are potential uses of IS based on users’ interpretation of their material properties dependent on the use context (Markus & Silver 2008). Some functional affordances of IS may add value, e.g. in the form of increased efficiency or improved effectiveness of a business process. See the right side of Figure 1. Functional Affordances is a core concept for understanding the added value of IS. It is the people involved who interpret potential uses (affordances) of an IS and whether these are useful in the given context.
Value concepts in the IS literature IS literature tends to focus on how information in an IS can add value based on the characteristics of data or information. As an example Fattahi & Afshar (2006) deliver an overview of some of these characteristics: Information can be reused, transferred, processed, reproduced etc. Similar but even more general
Page 5 of 16
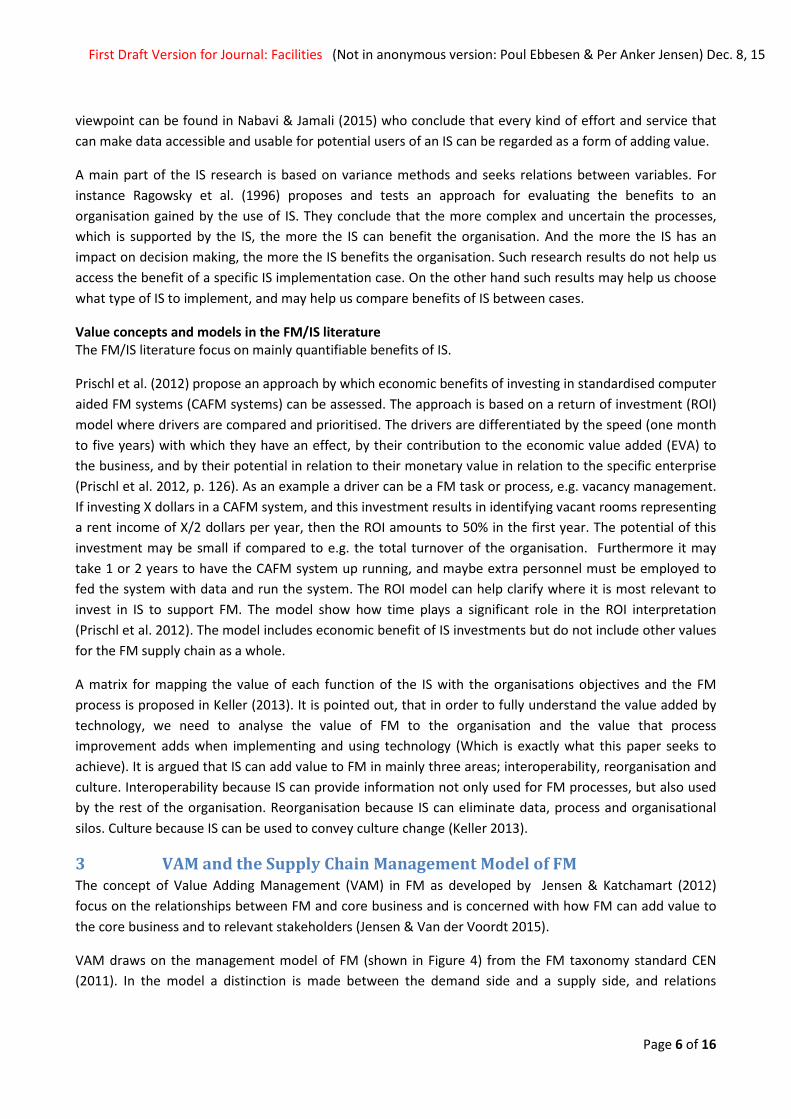
First Draft Version for Journal: Facilities (Not in anonymous version: Poul Ebbesen & Per Anker Jensen) Dec. 8, 15
viewpoint can be found in Nabavi & Jamali (2015) who conclude that every kind of effort and service that can make data accessible and usable for potential users of an IS can be regarded as a form of adding value.
A main part of the IS research is based on variance methods and seeks relations between variables. For instance Ragowsky et al. (1996) proposes and tests an approach for evaluating the benefits to an organisation gained by the use of IS. They conclude that the more complex and uncertain the processes, which is supported by the IS, the more the IS can benefit the organisation. And the more the IS has an impact on decision making, the more the IS benefits the organisation. Such research results do not help us access the benefit of a specific IS implementation case. On the other hand such results may help us choose what type of IS to implement, and may help us compare benefits of IS between cases.
Value concepts and models in the FM/IS literature The FM/IS literature focus on mainly quantifiable benefits of IS.
Prischl et al. (2012) propose an approach by which economic benefits of investing in standardised computer aided FM systems (CAFM systems) can be assessed. The approach is based on a return of investment (ROI) model where drivers are compared and prioritised. The drivers are differentiated by the speed (one month to five years) with which they have an effect, by their contribution to the economic value added (EVA) to the business, and by their potential in relation to their monetary value in relation to the specific enterprise (Prischl et al. 2012, p. 126). As an example a driver can be a FM task or process, e.g. vacancy management. If investing X dollars in a CAFM system, and this investment results in identifying vacant rooms representing a rent income of X/2 dollars per year, then the ROI amounts to 50% in the first year. The potential of this investment may be small if compared to e.g. the total turnover of the organisation. Furthermore it may take 1 or 2 years to have the CAFM system up running, and maybe extra personnel must be employed to fed the system with data and run the system. The ROI model can help clarify where it is most relevant to invest in IS to support FM. The model show how time plays a significant role in the ROI interpretation (Prischl et al. 2012). The model includes economic benefit of IS investments but do not include other values for the FM supply chain as a whole.
A matrix for mapping the value of each function of the IS with the organisations objectives and the FM process is proposed in Keller (2013). It is pointed out, that in order to fully understand the value added by technology, we need to analyse the value of FM to the organisation and the value that process improvement adds when implementing and using technology (Which is exactly what this paper seeks to achieve). It is argued that IS can add value to FM in mainly three areas; interoperability, reorganisation and culture. Interoperability because IS can provide information not only used for FM processes, but also used by the rest of the organisation. Reorganisation because IS can eliminate data, process and organisational silos. Culture because IS can be used to convey culture change (Keller 2013).
3 VAM and the Supply Chain Management Model of FM The concept of Value Adding Management (VAM) in FM as developed by Jensen & Katchamart (2012) focus on the relationships between FM and core business and is concerned with how FM can add value to the core business and to relevant stakeholders (Jensen & Van der Voordt 2015).
VAM draws on the management model of FM (shown in Figure 4) from the FM taxonomy standard CEN (2011). In the model a distinction is made between the demand side and a supply side, and relations
Page 6 of 16
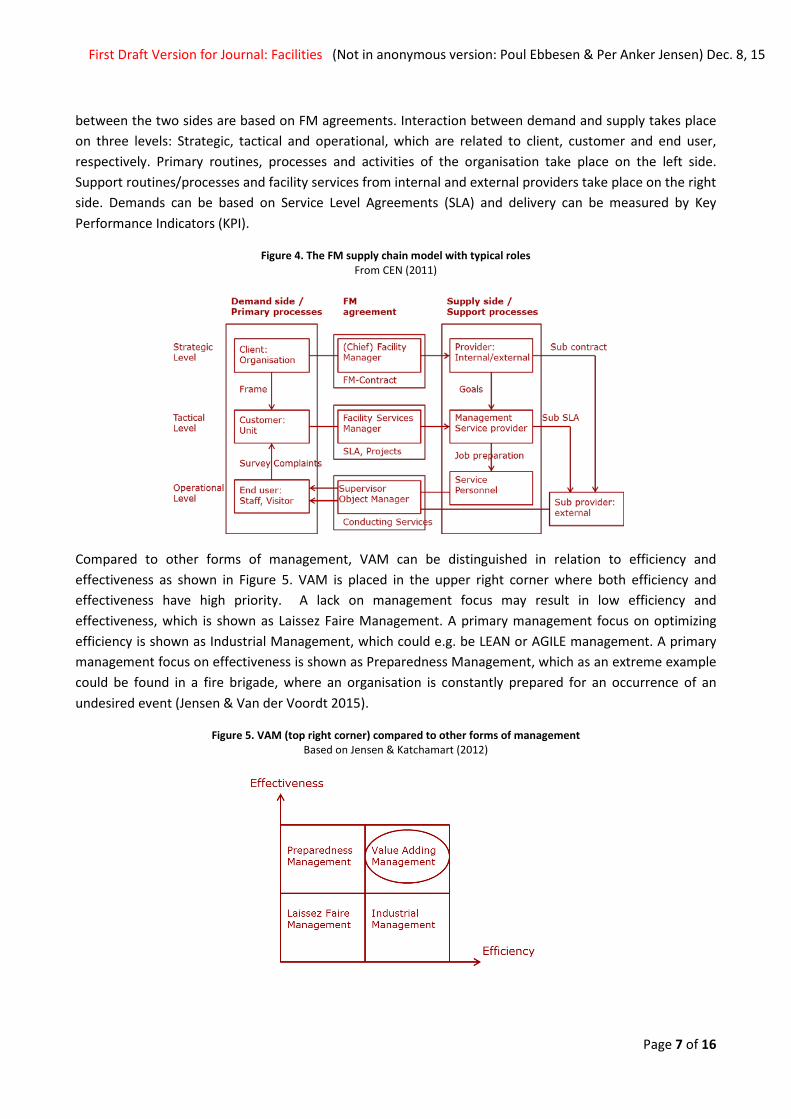
First Draft Version for Journal: Facilities (Not in anonymous version: Poul Ebbesen & Per Anker Jensen) Dec. 8, 15
between the two sides are based on FM agreements. Interaction between demand and supply takes place on three levels: Strategic, tactical and operational, which are related to client, customer and end user, respectively. Primary routines, processes and activities of the organisation take place on the left side. Support routines/processes and facility services from internal and external providers take place on the right side. Demands can be based on Service Level Agreements (SLA) and delivery can be measured by Key Performance Indicators (KPI).
Figure 4. The FM supply chain model with typical roles From CEN (2011)
Compared to other forms of management, VAM can be distinguished in relation to efficiency and effectiveness as shown in Figure 5. VAM is placed in the upper right corner where both efficiency and effectiveness have high priority. A lack on management focus may result in low efficiency and effectiveness, which is shown as Laissez Faire Management. A primary management focus on optimizing efficiency is shown as Industrial Management, which could e.g. be LEAN or AGILE management. A primary management focus on effectiveness is shown as Preparedness Management, which as an extreme example could be found in a fire brigade, where an organisation is constantly prepared for an occurrence of an undesired event (Jensen & Van der Voordt 2015).
Figure 5. VAM (top right corner) compared to other forms of management Based on Jensen & Katchamart (2012)
Page 7 of 16
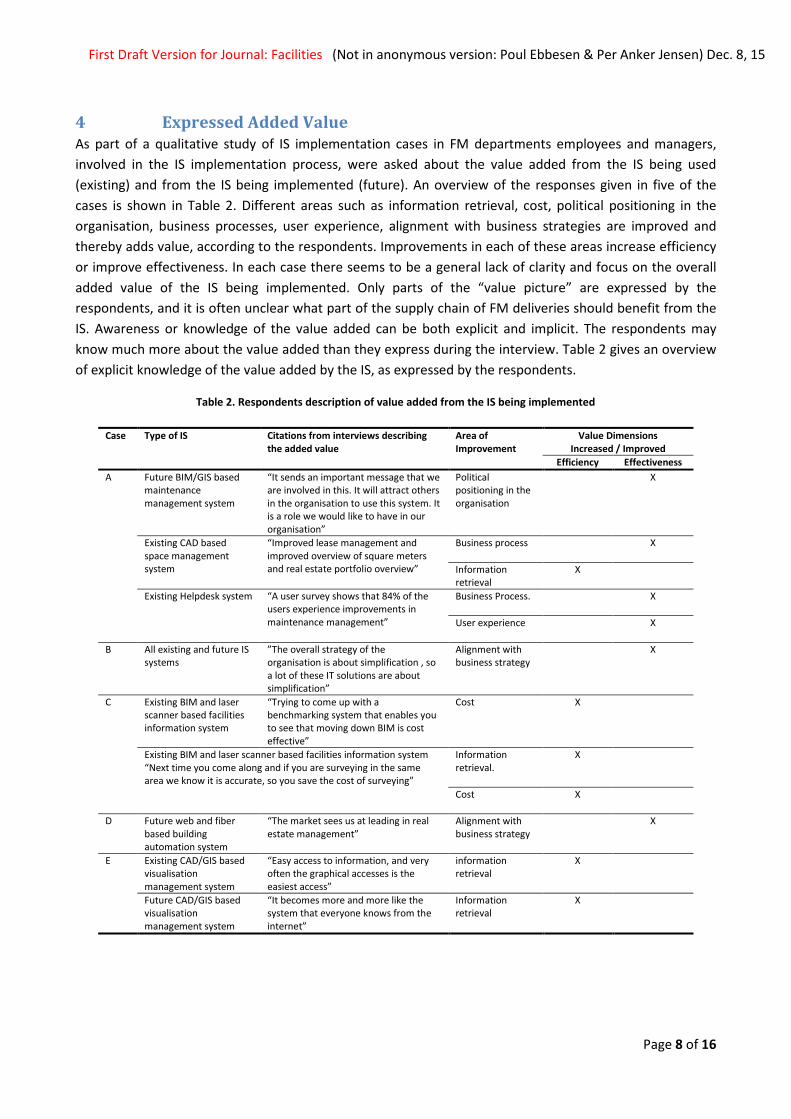
First Draft Version for Journal: Facilities (Not in anonymous version: Poul Ebbesen & Per Anker Jensen) Dec. 8, 15
4 Expressed Added Value As part of a qualitative study of IS implementation cases in FM departments employees and managers, involved in the IS implementation process, were asked about the value added from the IS being used (existing) and from the IS being implemented (future). An overview of the responses given in five of the cases is shown in Table 2. Different areas such as information retrieval, cost, political positioning in the organisation, business processes, user experience, alignment with business strategies are improved and thereby adds value, according to the respondents. Improvements in each of these areas increase efficiency or improve effectiveness. In each case there seems to be a general lack of clarity and focus on the overall added value of the IS being implemented. Only parts of the “value picture” are expressed by the respondents, and it is often unclear what part of the supply chain of FM deliveries should benefit from the IS. Awareness or knowledge of the value added can be both explicit and implicit. The respondents may know much more about the value added than they express during the interview. Table 2 gives an overview of explicit knowledge of the value added by the IS, as expressed by the respondents.
Table 2. Respondents description of value added from the IS being implemented
Case Type of IS Citations from interviews describing the added value
Area of Improvement
Value Dimensions Increased / Improved
Efficiency Effectiveness A Future BIM/GIS based
maintenance management system
“It sends an important message that we are involved in this. It will attract others in the organisation to use this system. It is a role we would like to have in our organisation”
Political positioning in the organisation
X
Existing CAD based space management system
“Improved lease management and improved overview of square meters and real estate portfolio overview”
Business process
X
Information retrieval
X
Existing Helpdesk system “A user survey shows that 84% of the users experience improvements in maintenance management”
Business Process.
X
User experience
X
B All existing and future IS systems
”The overall strategy of the organisation is about simplification , so a lot of these IT solutions are about simplification”
Alignment with business strategy
X
C Existing BIM and laser scanner based facilities information system
“Trying to come up with a benchmarking system that enables you to see that moving down BIM is cost effective”
Cost X
Existing BIM and laser scanner based facilities information system “Next time you come along and if you are surveying in the same area we know it is accurate, so you save the cost of surveying”
Information retrieval.
X
Cost
X
D Future web and fiber based building automation system
“The market sees us at leading in real estate management”
Alignment with business strategy
X
E Existing CAD/GIS based visualisation management system
“Easy access to information, and very often the graphical accesses is the easiest access”
information retrieval
X
Future CAD/GIS based visualisation management system
“It becomes more and more like the system that everyone knows from the internet”
Information retrieval
X
Page 8 of 16
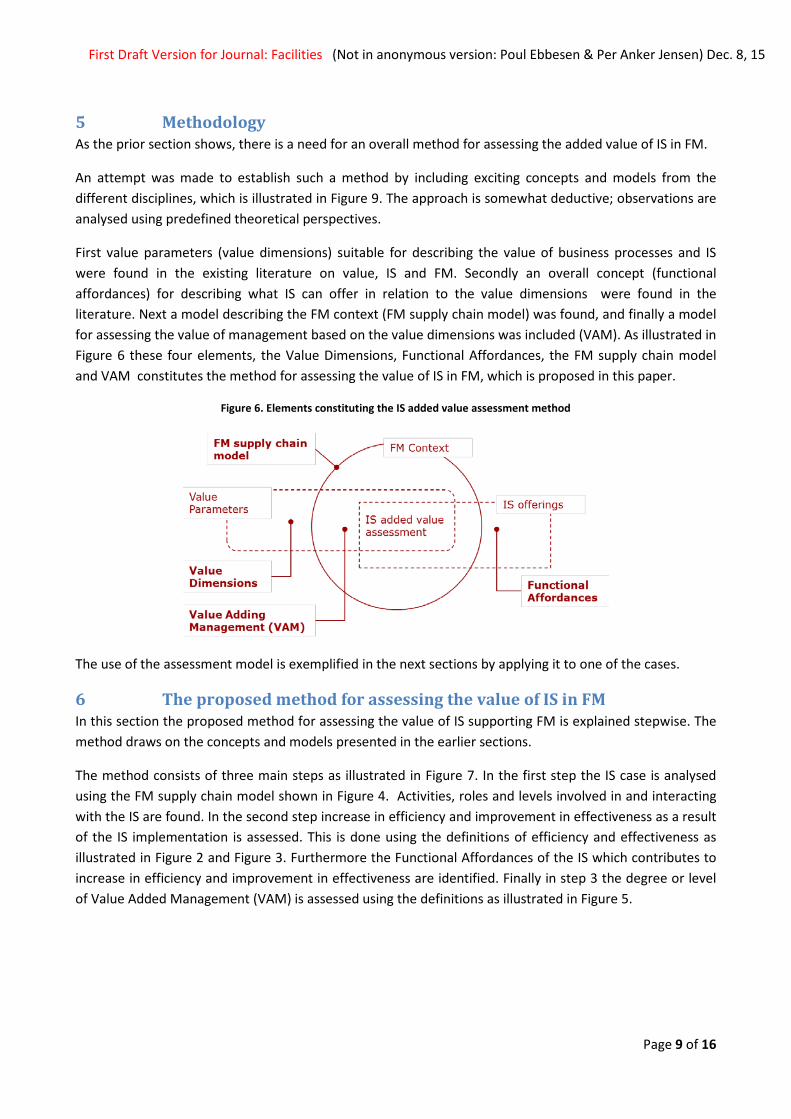
First Draft Version for Journal: Facilities (Not in anonymous version: Poul Ebbesen & Per Anker Jensen) Dec. 8, 15
5 Methodology As the prior section shows, there is a need for an overall method for assessing the added value of IS in FM.
An attempt was made to establish such a method by including exciting concepts and models from the different disciplines, which is illustrated in Figure 9. The approach is somewhat deductive; observations are analysed using predefined theoretical perspectives.
First value parameters (value dimensions) suitable for describing the value of business processes and IS were found in the existing literature on value, IS and FM. Secondly an overall concept (functional affordances) for describing what IS can offer in relation to the value dimensions were found in the literature. Next a model describing the FM context (FM supply chain model) was found, and finally a model for assessing the value of management based on the value dimensions was included (VAM). As illustrated in Figure 6 these four elements, the Value Dimensions, Functional Affordances, the FM supply chain model and VAM constitutes the method for assessing the value of IS in FM, which is proposed in this paper.
Figure 6. Elements constituting the IS added value assessment method
The use of the assessment model is exemplified in the next sections by applying it to one of the cases.
6 The proposed method for assessing the value of IS in FM In this section the proposed method for assessing the value of IS supporting FM is explained stepwise. The method draws on the concepts and models presented in the earlier sections.
The method consists of three main steps as illustrated in Figure 7. In the first step the IS case is analysed using the FM supply chain model shown in Figure 4. Activities, roles and levels involved in and interacting with the IS are found. In the second step increase in efficiency and improvement in effectiveness as a result of the IS implementation is assessed. This is done using the definitions of efficiency and effectiveness as illustrated in Figure 2 and Figure 3. Furthermore the Functional Affordances of the IS which contributes to increase in efficiency and improvement in effectiveness are identified. Finally in step 3 the degree or level of Value Added Management (VAM) is assessed using the definitions as illustrated in Figure 5.
Page 9 of 16
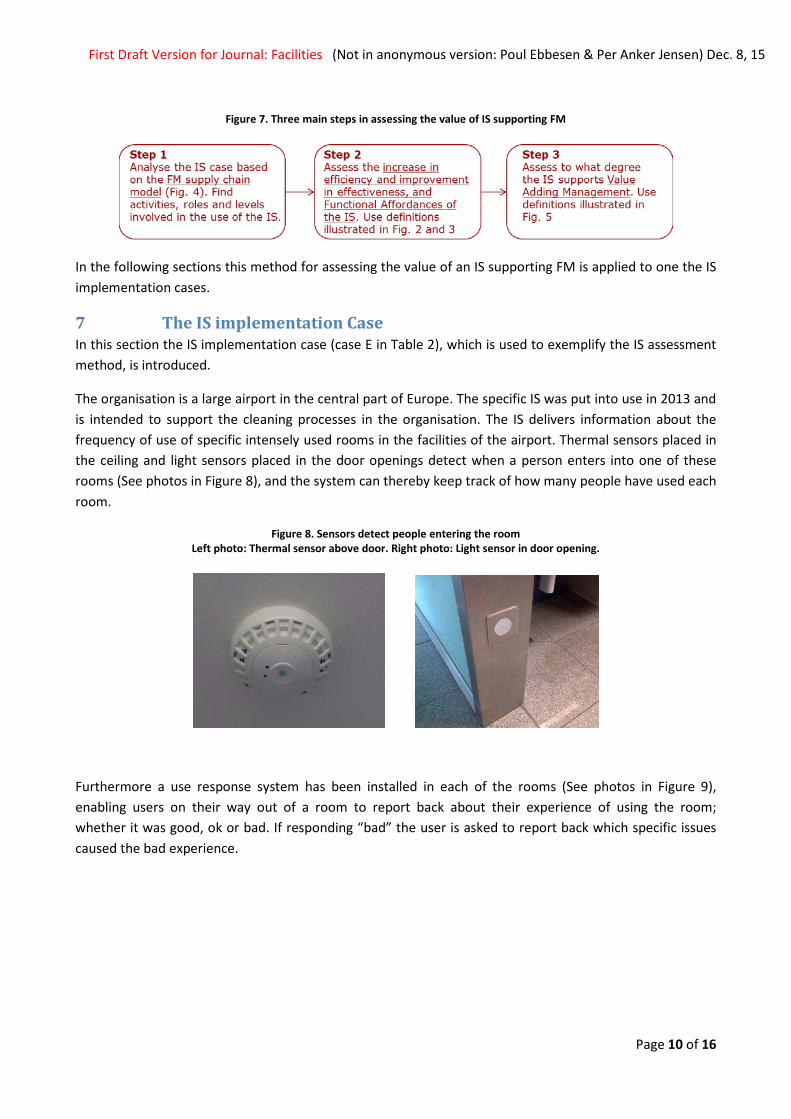
First Draft Version for Journal: Facilities (Not in anonymous version: Poul Ebbesen & Per Anker Jensen) Dec. 8, 15
Figure 7. Three main steps in assessing the value of IS supporting FM
In the following sections this method for assessing the value of an IS supporting FM is applied to one the IS implementation cases.
7 The IS implementation Case In this section the IS implementation case (case E in Table 2), which is used to exemplify the IS assessment method, is introduced.
The organisation is a large airport in the central part of Europe. The specific IS was put into use in 2013 and is intended to support the cleaning processes in the organisation. The IS delivers information about the frequency of use of specific intensely used rooms in the facilities of the airport. Thermal sensors placed in the ceiling and light sensors placed in the door openings detect when a person enters into one of these rooms (See photos in Figure 8), and the system can thereby keep track of how many people have used each room.
Figure 8. Sensors detect people entering the room Left photo: Thermal sensor above door. Right photo: Light sensor in door opening.
Furthermore a use response system has been installed in each of the rooms (See photos in Figure 9), enabling users on their way out of a room to report back about their experience of using the room; whether it was good, ok or bad. If responding “bad” the user is asked to report back which specific issues caused the bad experience.
Page 10 of 16
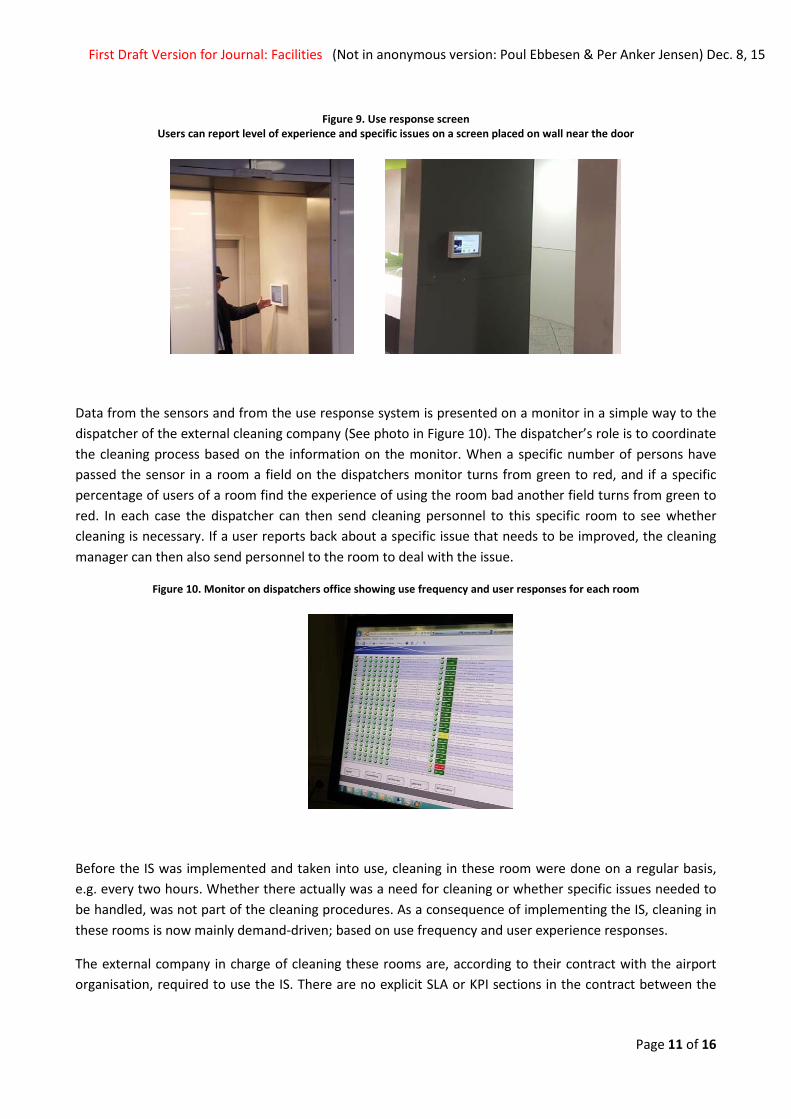
First Draft Version for Journal: Facilities (Not in anonymous version: Poul Ebbesen & Per Anker Jensen) Dec. 8, 15
Figure 9. Use response screen Users can report level of experience and specific issues on a screen placed on wall near the door
Data from the sensors and from the use response system is presented on a monitor in a simple way to the dispatcher of the external cleaning company (See photo in Figure 10). The dispatcher’s role is to coordinate the cleaning process based on the information on the monitor. When a specific number of persons have passed the sensor in a room a field on the dispatchers monitor turns from green to red, and if a specific percentage of users of a room find the experience of using the room bad another field turns from green to red. In each case the dispatcher can then send cleaning personnel to this specific room to see whether cleaning is necessary. If a user reports back about a specific issue that needs to be improved, the cleaning manager can then also send personnel to the room to deal with the issue.
Figure 10. Monitor on dispatchers office showing use frequency and user responses for each room
Before the IS was implemented and taken into use, cleaning in these room were done on a regular basis, e.g. every two hours. Whether there actually was a need for cleaning or whether specific issues needed to be handled, was not part of the cleaning procedures. As a consequence of implementing the IS, cleaning in these rooms is now mainly demand-driven; based on use frequency and user experience responses.
The external company in charge of cleaning these rooms are, according to their contract with the airport organisation, required to use the IS. There are no explicit SLA or KPI sections in the contract between the
Page 11 of 16
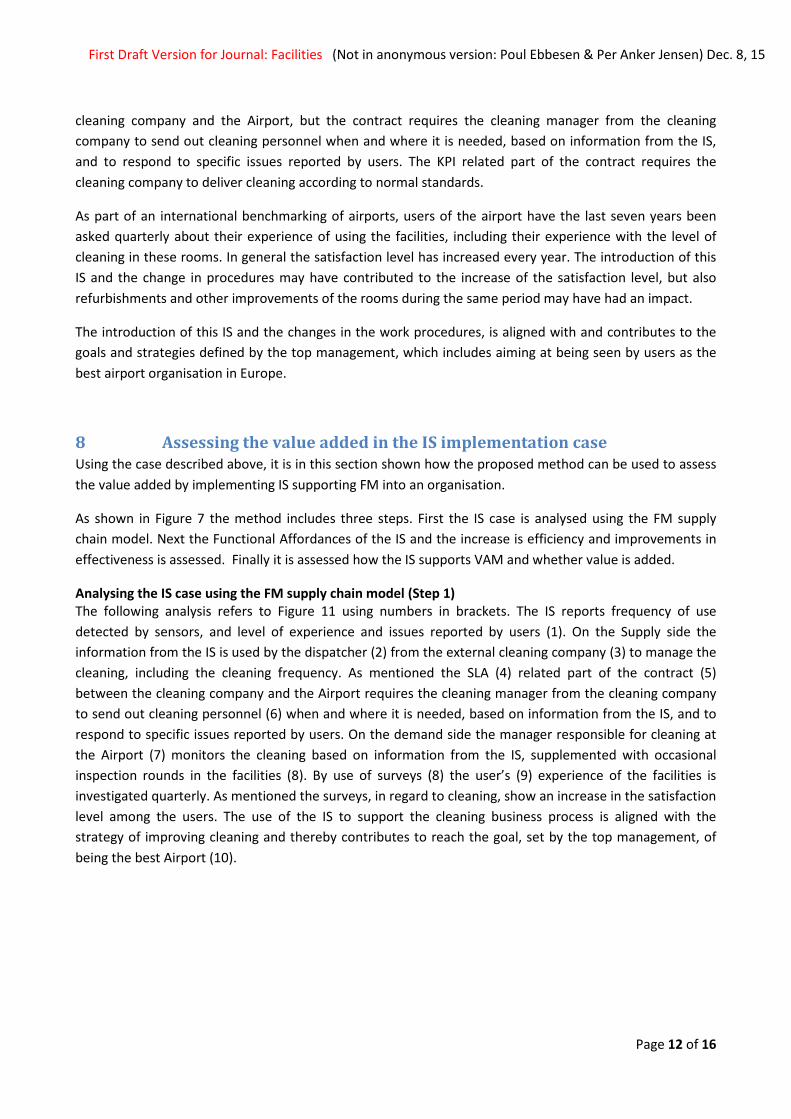
First Draft Version for Journal: Facilities (Not in anonymous version: Poul Ebbesen & Per Anker Jensen) Dec. 8, 15
cleaning company and the Airport, but the contract requires the cleaning manager from the cleaning company to send out cleaning personnel when and where it is needed, based on information from the IS, and to respond to specific issues reported by users. The KPI related part of the contract requires the cleaning company to deliver cleaning according to normal standards.
As part of an international benchmarking of airports, users of the airport have the last seven years been asked quarterly about their experience of using the facilities, including their experience with the level of cleaning in these rooms. In general the satisfaction level has increased every year. The introduction of this IS and the change in procedures may have contributed to the increase of the satisfaction level, but also refurbishments and other improvements of the rooms during the same period may have had an impact.
The introduction of this IS and the changes in the work procedures, is aligned with and contributes to the goals and strategies defined by the top management, which includes aiming at being seen by users as the best airport organisation in Europe.
8 Assessing the value added in the IS implementation case Using the case described above, it is in this section shown how the proposed method can be used to assess the value added by implementing IS supporting FM into an organisation.
As shown in Figure 7 the method includes three steps. First the IS case is analysed using the FM supply chain model. Next the Functional Affordances of the IS and the increase is efficiency and improvements in effectiveness is assessed. Finally it is assessed how the IS supports VAM and whether value is added.
Analysing the IS case using the FM supply chain model (Step 1) The following analysis refers to Figure 11 using numbers in brackets. The IS reports frequency of use detected by sensors, and level of experience and issues reported by users (1). On the Supply side the information from the IS is used by the dispatcher (2) from the external cleaning company (3) to manage the cleaning, including the cleaning frequency. As mentioned the SLA (4) related part of the contract (5) between the cleaning company and the Airport requires the cleaning manager from the cleaning company to send out cleaning personnel (6) when and where it is needed, based on information from the IS, and to respond to specific issues reported by users. On the demand side the manager responsible for cleaning at the Airport (7) monitors the cleaning based on information from the IS, supplemented with occasional inspection rounds in the facilities (8). By use of surveys (8) the user’s (9) experience of the facilities is investigated quarterly. As mentioned the surveys, in regard to cleaning, show an increase in the satisfaction level among the users. The use of the IS to support the cleaning business process is aligned with the strategy of improving cleaning and thereby contributes to reach the goal, set by the top management, of being the best Airport (10).
Page 12 of 16
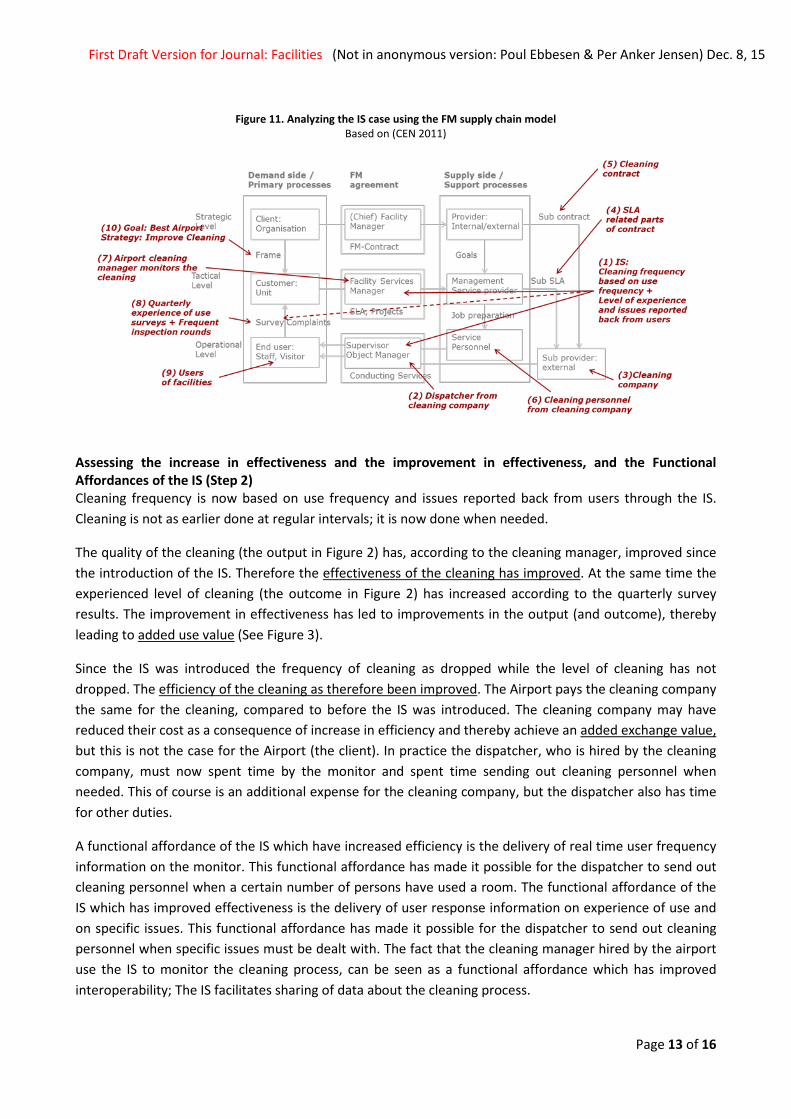
First Draft Version for Journal: Facilities (Not in anonymous version: Poul Ebbesen & Per Anker Jensen) Dec. 8, 15
Figure 11. Analyzing the IS case using the FM supply chain model Based on (CEN 2011)
Assessing the increase in effectiveness and the improvement in effectiveness, and the Functional Affordances of the IS (Step 2) Cleaning frequency is now based on use frequency and issues reported back from users through the IS. Cleaning is not as earlier done at regular intervals; it is now done when needed.
The quality of the cleaning (the output in Figure 2) has, according to the cleaning manager, improved since the introduction of the IS. Therefore the effectiveness of the cleaning has improved. At the same time the experienced level of cleaning (the outcome in Figure 2) has increased according to the quarterly survey results. The improvement in effectiveness has led to improvements in the output (and outcome), thereby leading to added use value (See Figure 3).
Since the IS was introduced the frequency of cleaning as dropped while the level of cleaning has not dropped. The efficiency of the cleaning as therefore been improved. The Airport pays the cleaning company the same for the cleaning, compared to before the IS was introduced. The cleaning company may have reduced their cost as a consequence of increase in efficiency and thereby achieve an added exchange value, but this is not the case for the Airport (the client). In practice the dispatcher, who is hired by the cleaning company, must now spent time by the monitor and spent time sending out cleaning personnel when needed. This of course is an additional expense for the cleaning company, but the dispatcher also has time for other duties.
A functional affordance of the IS which have increased efficiency is the delivery of real time user frequency information on the monitor. This functional affordance has made it possible for the dispatcher to send out cleaning personnel when a certain number of persons have used a room. The functional affordance of the IS which has improved effectiveness is the delivery of user response information on experience of use and on specific issues. This functional affordance has made it possible for the dispatcher to send out cleaning personnel when specific issues must be dealt with. The fact that the cleaning manager hired by the airport use the IS to monitor the cleaning process, can be seen as a functional affordance which has improved interoperability; The IS facilitates sharing of data about the cleaning process.
Page 13 of 16
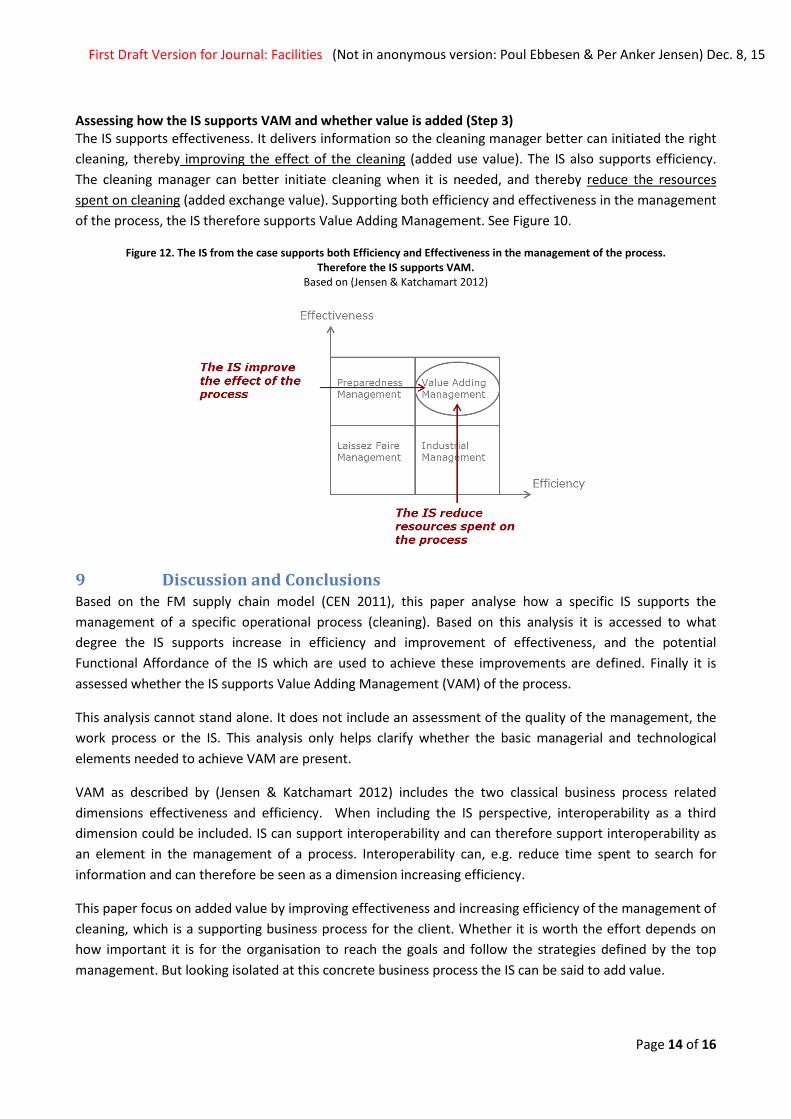
First Draft Version for Journal: Facilities (Not in anonymous version: Poul Ebbesen & Per Anker Jensen) Dec. 8, 15
Assessing how the IS supports VAM and whether value is added (Step 3) The IS supports effectiveness. It delivers information so the cleaning manager better can initiated the right cleaning, thereby improving the effect of the cleaning (added use value). The IS also supports efficiency. The cleaning manager can better initiate cleaning when it is needed, and thereby reduce the resources spent on cleaning (added exchange value). Supporting both efficiency and effectiveness in the management of the process, the IS therefore supports Value Adding Management. See Figure 10.
Figure 12. The IS from the case supports both Efficiency and Effectiveness in the management of the process. Therefore the IS supports VAM.
Based on (Jensen & Katchamart 2012)
9 Discussion and Conclusions Based on the FM supply chain model (CEN 2011), this paper analyse how a specific IS supports the management of a specific operational process (cleaning). Based on this analysis it is accessed to what degree the IS supports increase in efficiency and improvement of effectiveness, and the potential Functional Affordance of the IS which are used to achieve these improvements are defined. Finally it is assessed whether the IS supports Value Adding Management (VAM) of the process.
This analysis cannot stand alone. It does not include an assessment of the quality of the management, the work process or the IS. This analysis only helps clarify whether the basic managerial and technological elements needed to achieve VAM are present.
VAM as described by (Jensen & Katchamart 2012) includes the two classical business process related dimensions effectiveness and efficiency. When including the IS perspective, interoperability as a third dimension could be included. IS can support interoperability and can therefore support interoperability as an element in the management of a process. Interoperability can, e.g. reduce time spent to search for information and can therefore be seen as a dimension increasing efficiency.
This paper focus on added value by improving effectiveness and increasing efficiency of the management of cleaning, which is a supporting business process for the client. Whether it is worth the effort depends on how important it is for the organisation to reach the goals and follow the strategies defined by the top management. But looking isolated at this concrete business process the IS can be said to add value.
Page 14 of 16
First Draft Version for Journal: Facilities (Not in anonymous version: Poul Ebbesen & Per Anker Jensen) Dec. 8, 15
Even though the added value in the example case was vaguely expressed by the respondents, the IS apparently adds value when assessed using the proposed method.
Because of the way the cleaning process is organised the potential of the functional affordances of the IS can be exploited. The IS contributes to added value because the dispatcher actually use the information offered by the IS, and because the cleaning work process is organised so that this information can be used. The functional affordances of the IS where seen as use full in this specific context in the strive for VAM.
In future cleaning contracts the Airport could obtain a share in the potential cost reduction gained by implementing the IS. This could be done by redefining the SLA in the contract.
This paper illustrates that a well organised management setup is required to gain value from IS. It is also illustrated that implementing IS includes both organisational and technological changes.
The system described in this paper is being further developed. For inspections rounds a tablet based inspection report system is being developed, including testing different types of tablets for the purpose. Furthermore is has been considered to equip the cleaning personnel with tablets, so that information from the IS can be sent directly to the cleaning personnel and thereby obviating the dispatcher role.
The system keeps track of the state of the cleaning and can be used by the demand side to monitor the quality of the delivery of cleaning.
The use of the IS as described definitely adds value to the secondary process cleaning. Because of the increase of the user experience of the cleaning level, which is aligned with the strategy of improving cleaning in order to become the best airport, the use of the IS also adds value to a primary process of the organisation.
References CEN, 2008. EN 15221-1:2006 Facility Management - Part 1: Terms and definitions,
CEN, 2011. EN 15221-4:2011 Facility Management - Part 4: Taxonomy, Classification and Structures in Facility Management,
Chaffey, D., 2014. What is the difference between efficiency and effectiveness marketing measures? - Smart Insights Digital Marketing Advice.
Eastman, C. et al., 2011. BIM Handbook: A Guide to Building Information Modeling for Owners, Managers, Designers, Engineers and Contractors, Wiley.
Fattahi, R. & Afshar, E., 2006. Added value of information and information systems: a conceptual approach. Library Review, 55(2), pp.132–147.
Gibson, J.J., 1986. The ecological approach to visual perception, Lawrence Erlbaum Associates.
Jensen, P.A., 2008. Facilities Management for students and practitioners, Lyngby Denmark: Centre for Facilities Management - Realdania Research, DTU Management Engineering and Polyteknisk Forlag.
Jensen, P.A., 2012. The added value og facilities management. Concepts, findings and perspectives, Lyngby Denmark: Polyteknisk Forlag.
Jensen, P.A. & Katchamart, A., 2012. Value Adding Management: A concept and a case. In P. A. Jensen, T. van der Voordt, & C. Coenen, eds. The Added Value of Facilities Management - Concepts, Findings and
Page 15 of 16
First Draft Version for Journal: Facilities (Not in anonymous version: Poul Ebbesen & Per Anker Jensen) Dec. 8, 15
Perspectives. Centre for Facilities Management - Realdania Research, DTU Management Engineering.
Jensen, P.A. & Van der Voordt, T., 2015. How can FM create Value to Organisations?,
Jensen, P.A., Van der Voordt, T. & Coenen, C. eds., 2012. The Added Value of Facilities Management. Concepts, Findings and Perspectives, Polyteknisk Forlag.
Katchamart, A., 2013. Mapping value added positions in facilities management by using a product-process matrix. Journal of Facilities Management, 11(3), pp.226–252.
Keller, C., 2013. CAFM/IWMS - Balancing Technology, Processes and Objectives. In E. Teicholz, ed. Technology for Facilities Management. The Impact on Cutting-Edge Technology on Facility Management. IFMA.
Leonardi, P.M., 2011. When flexible routines meet flexible technologies: affordance, constraint, and the imbrication of human and material agencies. MIS Quarterly, 35(1), pp.147–167.
Markus, M.L. & Silver, M.S., 2008. A Foundation for the Study of IT Effects : A New Look at DeSanctis and Poole ’ s Concepts of Structural Features and Spirit. Journal of the Association for Information Systems, 9(10/11), pp.609–632.
Nabavi, M. & Jamali, H.R., 2015. Adding value to information systems: A new model. Business Information Review, 32(1), pp.53–59.
Prischl, P. et al., 2012. Economic benefits of a CAFM implementation. In G. Williams & M. May, eds. The Facilitiy Manager’s Guide to Information Technology. IFMA.
Ragowsky, A., Ahituv, N. & Neumann, S., 1996. Identifying the value and importance of an information system application. Information and Management, 31(2), pp.89–102.
Schellhammer, S., 2011. Affordances Of Interorganisational Information Systems ( IOIS ) – A Pharmacist ’ S Perspective. Pacis 2011.
Schneider, T. & Leslie, B., 2015. Efficiency vs . Effectiveness : Defining the Difference, Available at: http://www.switchpointllc.com/.
Thomson, D.S. et al., 2003. Managing value and quality in design. Building Research & Information, 31(5), pp.334–345.
Thyssen, M.H., 2011. Facilitating Value Creation and Delivery in Construction Projects. Technical University of Denmark (DTU).
Page 16 of 16

PAPER 7 IS STRATEGY
Ebbesen, P. et al., 2016. Information System Strategies in Facilities Management – Based on five Process Studies, In CFM Second Nordic Conference. In Review.
CFM Second Nordic Conference 29-30 August 2016. Final first version sent to review. January 2016
Technical University of Denmark
INFORMATION SYSTEM STRATEGIES IN FACILITIES MANAGEMENT – BASED ON FIVE PROCESS STUDIES
Poul Ebbesen
Technical University of Denmark, DTU Management [email protected] +45 22942817
Jan Karlshøj
Technical University of Denmark, DTU Civil [email protected]
Sten Bonke
Technical University of Denmark, DTU Management [email protected]
Per Anker Jensen
Technical University of Denmark, DTU Management [email protected]
ABSTRACT Purpose: To present observed Information System (IS) strategies in Facilities Management (FM).
Background and Relevance: It is generally recognised that IS implementation and use should support the business strategy of an organisation. To gain more insight into this issue in the FM domain, this paper presents an analysis of how business strategies are supported by IS implementation and use in five cases.
Approach (Theory/Methodology): This paper applies the view of IS strategy as the use of IS to support business strategy. Based on chronological event maps concerning implementation and use of IS, the use of IS to support business strategies is studied and illustrated in an Information System – Business Process (IS-BP) framework.
Results and practical implication: It is found that IS strategy dictating use of IS with a high degree of uniformity, interoperability and data reliability can support more advanced and externally oriented business strategies.
Research limitations: This study is based on two interviews in each of the cases. More insights could be obtained if complete longitudinal studies and more cases were included.
Originality/value: This paper is the first research based contribution to development of an overview of IS strategies in FM. The purpose is to suggest a methodology for establishing such strategies based on studies of events during the past 25 years and using an IS-BP framework. Keywords Information Systems, Implementation, Facilities Management, Process Research, IS Strategy
1
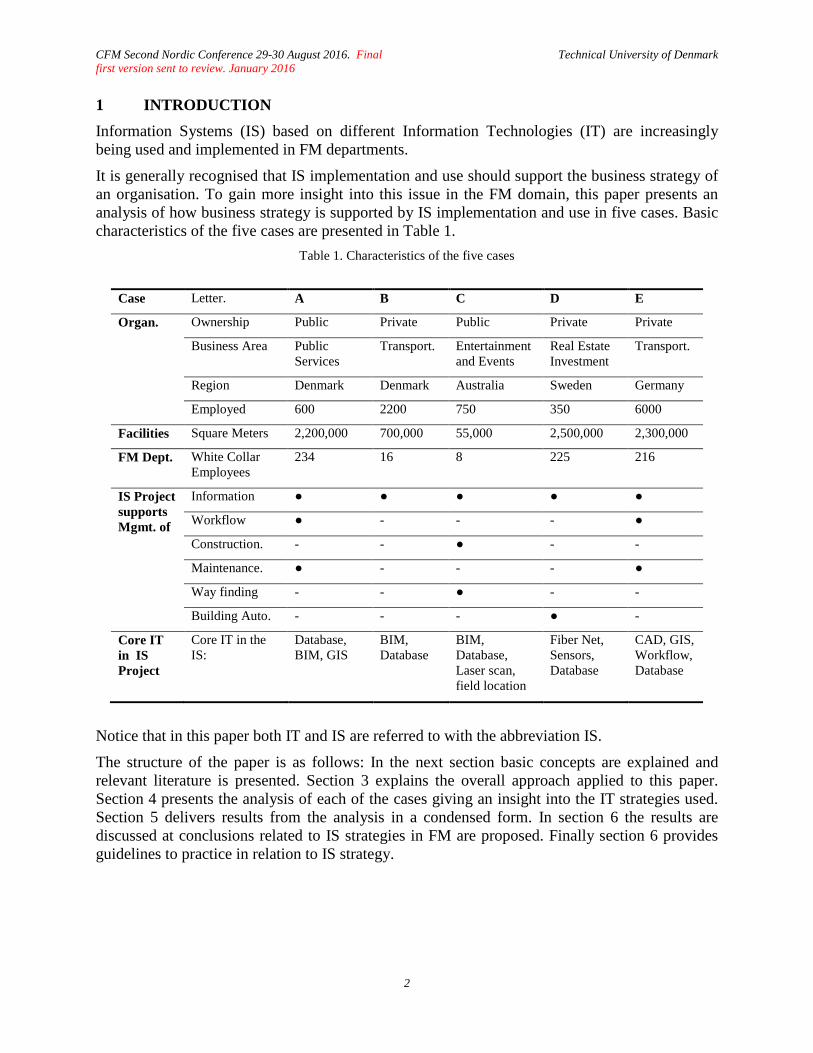
CFM Second Nordic Conference 29-30 August 2016. Final first version sent to review. January 2016
Technical University of Denmark
1 INTRODUCTION Information Systems (IS) based on different Information Technologies (IT) are increasingly being used and implemented in FM departments.
It is generally recognised that IS implementation and use should support the business strategy of an organisation. To gain more insight into this issue in the FM domain, this paper presents an analysis of how business strategy is supported by IS implementation and use in five cases. Basic characteristics of the five cases are presented in Table 1.
Table 1. Characteristics of the five cases
Case Letter. A B C D E
Organ. Ownership Public Private Public Private Private
Business Area Public Services
Transport. Entertainment and Events
Real Estate Investment
Transport.
Region Denmark Denmark Australia Sweden Germany
Employed 600 2200 750 350 6000
Facilities Square Meters 2,200,000 700,000 55,000 2,500,000 2,300,000
FM Dept. White Collar Employees
234 16 8 225 216
IS Project supports Mgmt. of
Information ● ● ● ● ●
Workflow ● - - - ●
Construction. - - ● - -
Maintenance. ● - - - ●
Way finding - - ● - -
Building Auto. - - - ● -
Core IT in IS Project
Core IT in the IS:
Database, BIM, GIS
BIM, Database
BIM, Database, Laser scan, field location
Fiber Net, Sensors, Database
CAD, GIS, Workflow, Database
Notice that in this paper both IT and IS are referred to with the abbreviation IS.
The structure of the paper is as follows: In the next section basic concepts are explained and relevant literature is presented. Section 3 explains the overall approach applied to this paper. Section 4 presents the analysis of each of the cases giving an insight into the IT strategies used. Section 5 delivers results from the analysis in a condensed form. In section 6 the results are discussed at conclusions related to IS strategies in FM are proposed. Finally section 6 provides guidelines to practice in relation to IS strategy.
2
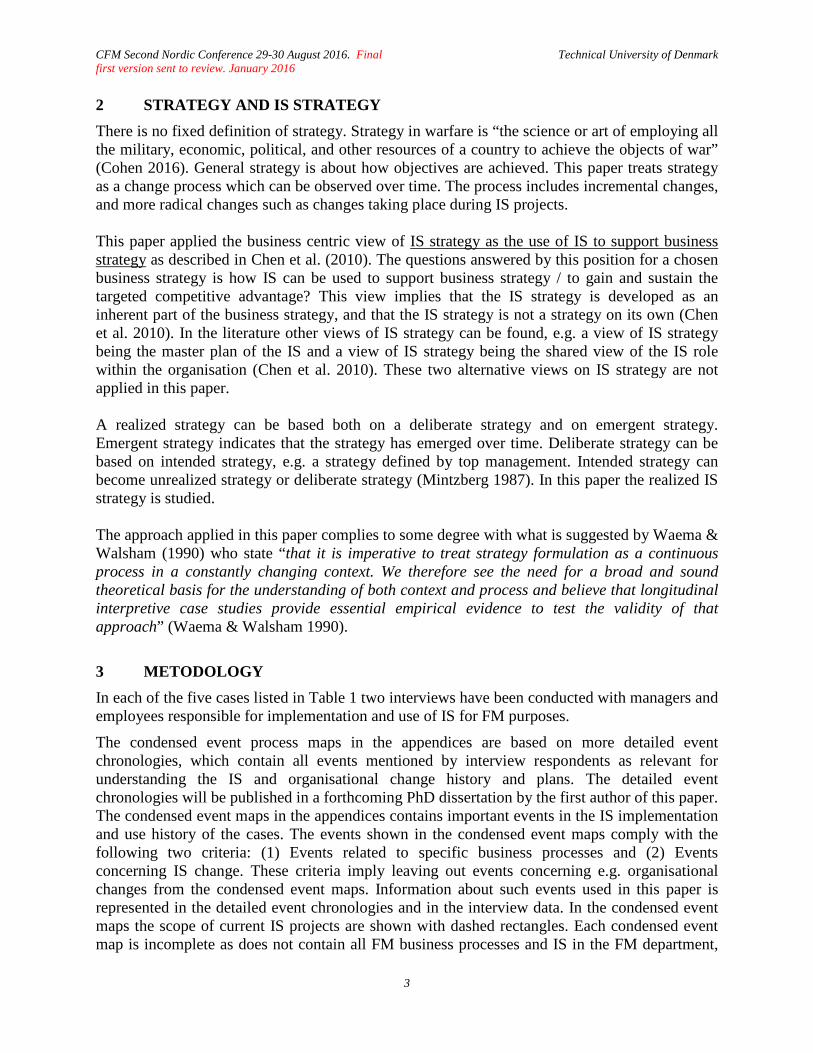
CFM Second Nordic Conference 29-30 August 2016. Final first version sent to review. January 2016
Technical University of Denmark
2 STRATEGY AND IS STRATEGY There is no fixed definition of strategy. Strategy in warfare is “the science or art of employing all the military, economic, political, and other resources of a country to achieve the objects of war” (Cohen 2016). General strategy is about how objectives are achieved. This paper treats strategy as a change process which can be observed over time. The process includes incremental changes, and more radical changes such as changes taking place during IS projects. This paper applied the business centric view of IS strategy as the use of IS to support business strategy as described in Chen et al. (2010). The questions answered by this position for a chosen business strategy is how IS can be used to support business strategy / to gain and sustain the targeted competitive advantage? This view implies that the IS strategy is developed as an inherent part of the business strategy, and that the IS strategy is not a strategy on its own (Chen et al. 2010). In the literature other views of IS strategy can be found, e.g. a view of IS strategy being the master plan of the IS and a view of IS strategy being the shared view of the IS role within the organisation (Chen et al. 2010). These two alternative views on IS strategy are not applied in this paper. A realized strategy can be based both on a deliberate strategy and on emergent strategy. Emergent strategy indicates that the strategy has emerged over time. Deliberate strategy can be based on intended strategy, e.g. a strategy defined by top management. Intended strategy can become unrealized strategy or deliberate strategy (Mintzberg 1987). In this paper the realized IS strategy is studied. The approach applied in this paper complies to some degree with what is suggested by Waema & Walsham (1990) who state “that it is imperative to treat strategy formulation as a continuous process in a constantly changing context. We therefore see the need for a broad and sound theoretical basis for the understanding of both context and process and believe that longitudinal interpretive case studies provide essential empirical evidence to test the validity of that approach” (Waema & Walsham 1990).
3 METODOLOGY In each of the five cases listed in Table 1 two interviews have been conducted with managers and employees responsible for implementation and use of IS for FM purposes.
The condensed event process maps in the appendices are based on more detailed event chronologies, which contain all events mentioned by interview respondents as relevant for understanding the IS and organisational change history and plans. The detailed event chronologies will be published in a forthcoming PhD dissertation by the first author of this paper. The condensed event maps in the appendices contains important events in the IS implementation and use history of the cases. The events shown in the condensed event maps comply with the following two criteria: (1) Events related to specific business processes and (2) Events concerning IS change. These criteria imply leaving out events concerning e.g. organisational changes from the condensed event maps. Information about such events used in this paper is represented in the detailed event chronologies and in the interview data. In the condensed event maps the scope of current IS projects are shown with dashed rectangles. Each condensed event map is incomplete as does not contain all FM business processes and IS in the FM department,
3
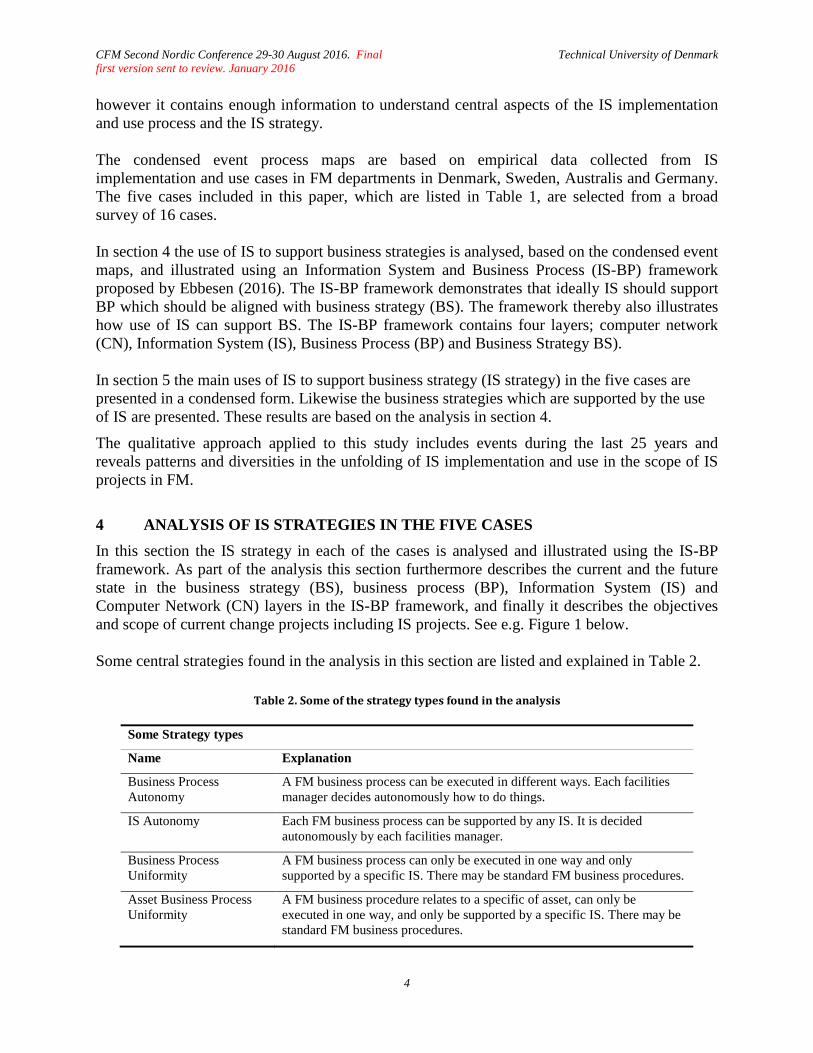
CFM Second Nordic Conference 29-30 August 2016. Final first version sent to review. January 2016
Technical University of Denmark
however it contains enough information to understand central aspects of the IS implementation and use process and the IS strategy. The condensed event process maps are based on empirical data collected from IS implementation and use cases in FM departments in Denmark, Sweden, Australis and Germany. The five cases included in this paper, which are listed in Table 1, are selected from a broad survey of 16 cases. In section 4 the use of IS to support business strategies is analysed, based on the condensed event maps, and illustrated using an Information System and Business Process (IS-BP) framework proposed by Ebbesen (2016). The IS-BP framework demonstrates that ideally IS should support BP which should be aligned with business strategy (BS). The framework thereby also illustrates how use of IS can support BS. The IS-BP framework contains four layers; computer network (CN), Information System (IS), Business Process (BP) and Business Strategy BS). In section 5 the main uses of IS to support business strategy (IS strategy) in the five cases are presented in a condensed form. Likewise the business strategies which are supported by the use of IS are presented. These results are based on the analysis in section 4.
The qualitative approach applied to this study includes events during the last 25 years and reveals patterns and diversities in the unfolding of IS implementation and use in the scope of IS projects in FM.
4 ANALYSIS OF IS STRATEGIES IN THE FIVE CASES In this section the IS strategy in each of the cases is analysed and illustrated using the IS-BP framework. As part of the analysis this section furthermore describes the current and the future state in the business strategy (BS), business process (BP), Information System (IS) and Computer Network (CN) layers in the IS-BP framework, and finally it describes the objectives and scope of current change projects including IS projects. See e.g. Figure 1 below. Some central strategies found in the analysis in this section are listed and explained in Table 2.
Table 2. Some of the strategy types found in the analysis
Some Strategy types
Name Explanation
Business Process Autonomy
A FM business process can be executed in different ways. Each facilities manager decides autonomously how to do things.
IS Autonomy Each FM business process can be supported by any IS. It is decided autonomously by each facilities manager.
Business Process Uniformity
A FM business process can only be executed in one way and only supported by a specific IS. There may be standard FM business procedures.
Asset Business Process Uniformity
A FM business procedure relates to a specific of asset, can only be executed in one way, and only be supported by a specific IS. There may be standard FM business procedures.
4
CFM Second Nordic Conference 29-30 August 2016. Final first version sent to review. January 2016
Technical University of Denmark
4.1 Case A In case A, a variety of IS, each supporting specific FM business processes, have been implemented during the years in the FM department. Appendix A shows the event chronology of the IS supporting the business processes maintenance management, help desk and error handling, facilities registration and inspection, space management and lease management. The IS/IT supporting these business processes include a Computer Added Maintenance Management System (CMMS), Spreadsheets, a Help Desk / Error Handling System and a Tablet based Space Management (SM) System. These IS are not internally connected and do not interact. Furthermore there are no standard procedures for exchange of data between the IS and no common exchange formats. In other words the IS has a low degree of interoperability. With no automated data exchange or sharing possibilities, the IS now contain redundant and inaccurate data about the facilities. This is seen as a major challenge in the execution of the different business processes. The concept of interoperability is a basic concept and used several times in this paper. Interoperability is the ability to exchange data between applications, which smoothes workflows and sometimes facilitates their automation (Eastman et al. 2011).
During years the facilities managers responsible for the FM business processes have been allowed to implement special IS only supporting their specific FM business process. The facilities managers have not been required to choose solutions complying with overall organisational requirements. So far this “IS autonomy” has been a more or less deliberate strategy which was found as implicit information in the empirical data of this study, e.g. by analysing the condensed event process map. This aspect was not directly addressed by the interview respondents and is not included in an overall well defined IS strategy of the organisation. For each FM business process differences in work procedures have developed over the years. Whether the use of different IS for the same business process, e.g. the use of both spreadsheets and a SM system in the execution of the business processes, facilities registration and inspection, have had an influence on this is unclear, but it is seen as a problem by the management of the FM department. In short this business process issue can be defined as a lack of standard business procedures. In all the execution of FM business processes had an autonomous character and “business process autonomy” had become the norm within the FM organisation. It was then decided to change this so that business processes in the future would be executed in a uniform manner, which implies that facilities managers in the future will be forced to follow standard business procedures. As a tool to change to “business process uniformity” it was decided to replace the different IS, hitherto supporting the FM business processes maintenance management, help desk and error handling, facilities registration and inspection, space management and lease management with a new Integrated Workplace Management System (IWMS). The IS project set up to handle this only included the IS change, and the objective of the IS project was to reduce the number of IS used within the organisation. It is expected that implementing the new IS will
5
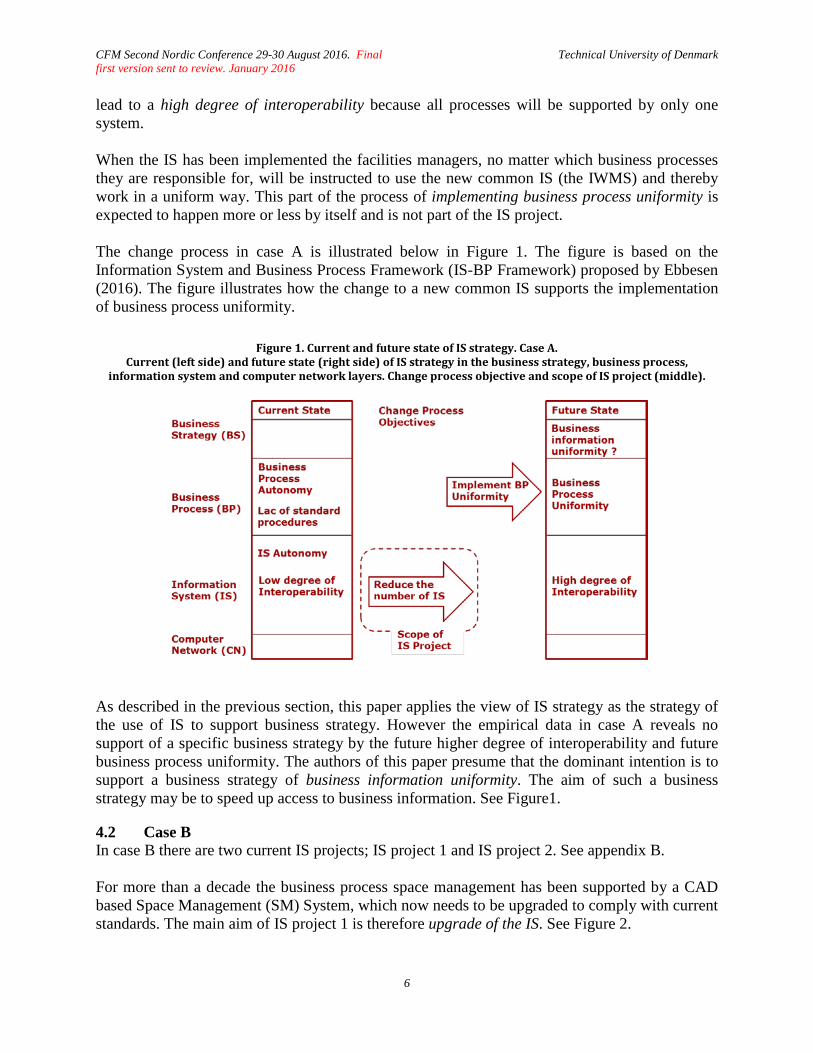
CFM Second Nordic Conference 29-30 August 2016. Final first version sent to review. January 2016
Technical University of Denmark
lead to a high degree of interoperability because all processes will be supported by only one system. When the IS has been implemented the facilities managers, no matter which business processes they are responsible for, will be instructed to use the new common IS (the IWMS) and thereby work in a uniform way. This part of the process of implementing business process uniformity is expected to happen more or less by itself and is not part of the IS project. The change process in case A is illustrated below in Figure 1. The figure is based on the Information System and Business Process Framework (IS-BP Framework) proposed by Ebbesen (2016). The figure illustrates how the change to a new common IS supports the implementation of business process uniformity.
Figure 1. Current and future state of IS strategy. Case A. Current (left side) and future state (right side) of IS strategy in the business strategy, business process,
information system and computer network layers. Change process objective and scope of IS project (middle).
As described in the previous section, this paper applies the view of IS strategy as the strategy of the use of IS to support business strategy. However the empirical data in case A reveals no support of a specific business strategy by the future higher degree of interoperability and future business process uniformity. The authors of this paper presume that the dominant intention is to support a business strategy of business information uniformity. The aim of such a business strategy may be to speed up access to business information. See Figure1. 4.2 Case B In case B there are two current IS projects; IS project 1 and IS project 2. See appendix B. For more than a decade the business process space management has been supported by a CAD based Space Management (SM) System, which now needs to be upgraded to comply with current standards. The main aim of IS project 1 is therefore upgrade of the IS. See Figure 2.
6
CFM Second Nordic Conference 29-30 August 2016. Final first version sent to review. January 2016
Technical University of Denmark
FM operations in the organisation have recently been reorganised. From being managed from one FM unit, FM operations are now managed from multiple FM units each responsible for specific types of assets. In the future assets of the same kind, e.g. electrical installations, will all be operated in the same way, and related business processes, e.g. maintenance of electrical installations, will each be supported by their own IS. For each type of asset there is now only one way of doing things, including only one way of using IS to support the operations of the asset. The new IS strategy can be expressed as asset business process uniformity. The IS strategy applied before the reorganisation was similar to the new IS strategy in case A. For each business process in case B there was only one right way of doing things. The former IS strategy can therefore be expressed as business process uniformity. The reorganisation has created a need for easier access to facilities related data. Data currently stored in repositories such as Databases Systems and Spreadsheets placed in various parts of the organisation are difficult to access. Just as in case A, these systems are not connected and there are no standard procedures for exchange of data between the systems. Low degree of degree of interoperability therefore applies to case B as it did in case A. To deal with this issue facilities related data, supporting the business processes facilities registration and inspection, were therefore, as a part of IS project 1, transferred from the Spreadsheets (where the data had been stored until now) into the upgraded SM System. This additional objective of IS project 1 is to reduce number of IS in use. Reducing the number of IS is expected to lead to a high degree of interoperability because these business processes in the future will be supported mainly only by the upgraded SM System. The additional IS project (IS project 2) is initiated to deal once and for all with the low degree of interoperability. IS project 2 is based on an analysis of the many different repositories in the organisation for storing data related to the facilities. In IS Project 2 a central database point will be established with links to all existing data repositories. The objective of IS project 2 is thus to establish a central point of data access. Figure 2 below illustrates how the change process of reducing the number of IS and establishing a central point of data assess support the implementation of asset business process uniformity.
7
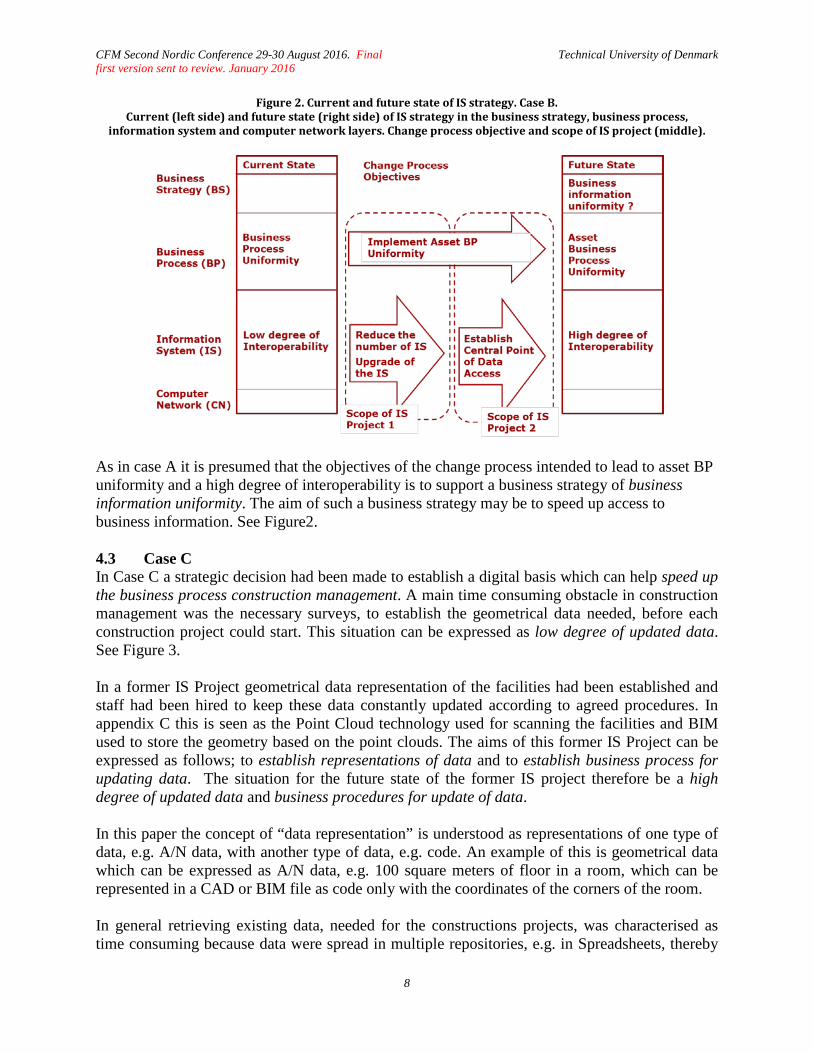
CFM Second Nordic Conference 29-30 August 2016. Final first version sent to review. January 2016
Technical University of Denmark
Figure 2. Current and future state of IS strategy. Case B. Current (left side) and future state (right side) of IS strategy in the business strategy, business process,
information system and computer network layers. Change process objective and scope of IS project (middle).
As in case A it is presumed that the objectives of the change process intended to lead to asset BP uniformity and a high degree of interoperability is to support a business strategy of business information uniformity. The aim of such a business strategy may be to speed up access to business information. See Figure2. 4.3 Case C In Case C a strategic decision had been made to establish a digital basis which can help speed up the business process construction management. A main time consuming obstacle in construction management was the necessary surveys, to establish the geometrical data needed, before each construction project could start. This situation can be expressed as low degree of updated data. See Figure 3. In a former IS Project geometrical data representation of the facilities had been established and staff had been hired to keep these data constantly updated according to agreed procedures. In appendix C this is seen as the Point Cloud technology used for scanning the facilities and BIM used to store the geometry based on the point clouds. The aims of this former IS Project can be expressed as follows; to establish representations of data and to establish business process for updating data. The situation for the future state of the former IS project therefore be a high degree of updated data and business procedures for update of data. In this paper the concept of “data representation” is understood as representations of one type of data, e.g. A/N data, with another type of data, e.g. code. An example of this is geometrical data which can be expressed as A/N data, e.g. 100 square meters of floor in a room, which can be represented in a CAD or BIM file as code only with the coordinates of the corners of the room. In general retrieving existing data, needed for the constructions projects, was characterised as time consuming because data were spread in multiple repositories, e.g. in Spreadsheets, thereby
8
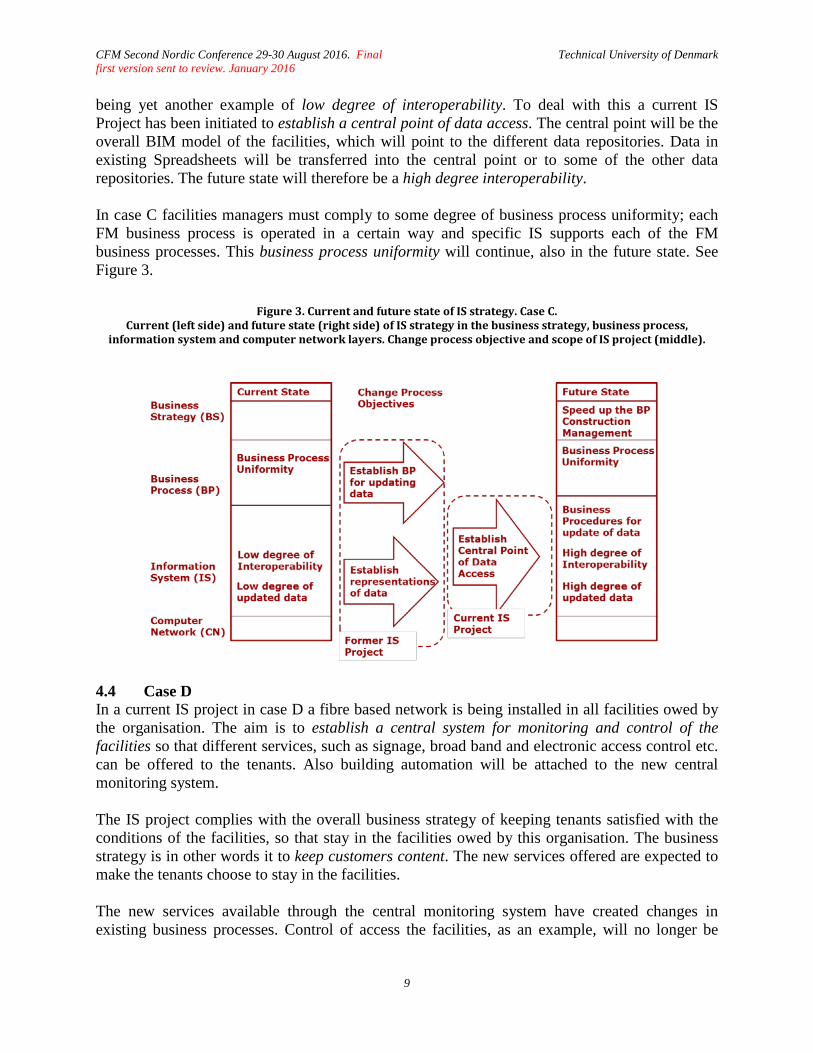
CFM Second Nordic Conference 29-30 August 2016. Final first version sent to review. January 2016
Technical University of Denmark
being yet another example of low degree of interoperability. To deal with this a current IS Project has been initiated to establish a central point of data access. The central point will be the overall BIM model of the facilities, which will point to the different data repositories. Data in existing Spreadsheets will be transferred into the central point or to some of the other data repositories. The future state will therefore be a high degree interoperability. In case C facilities managers must comply to some degree of business process uniformity; each FM business process is operated in a certain way and specific IS supports each of the FM business processes. This business process uniformity will continue, also in the future state. See Figure 3.
Figure 3. Current and future state of IS strategy. Case C.
Current (left side) and future state (right side) of IS strategy in the business strategy, business process, information system and computer network layers. Change process objective and scope of IS project (middle).
4.4 Case D In a current IS project in case D a fibre based network is being installed in all facilities owed by the organisation. The aim is to establish a central system for monitoring and control of the facilities so that different services, such as signage, broad band and electronic access control etc. can be offered to the tenants. Also building automation will be attached to the new central monitoring system. The IS project complies with the overall business strategy of keeping tenants satisfied with the conditions of the facilities, so that stay in the facilities owed by this organisation. The business strategy is in other words it to keep customers content. The new services offered are expected to make the tenants choose to stay in the facilities. The new services available through the central monitoring system have created changes in existing business processes. Control of access the facilities, as an example, will no longer be
9
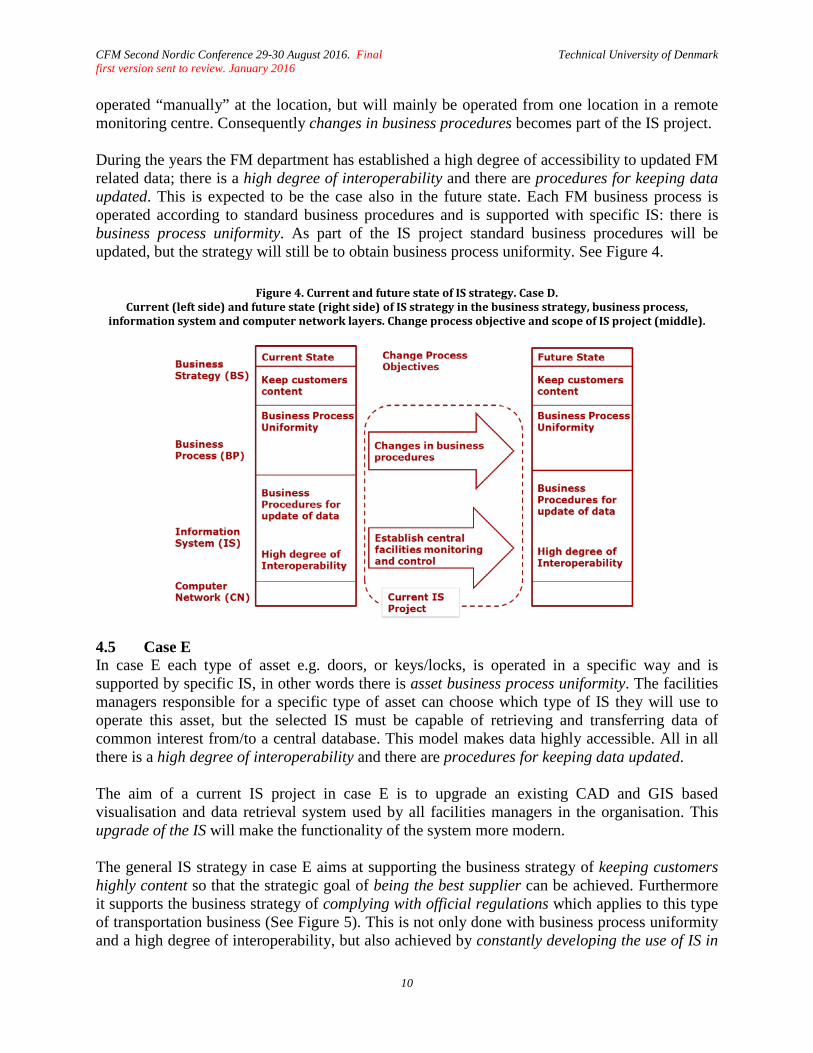
CFM Second Nordic Conference 29-30 August 2016. Final first version sent to review. January 2016
Technical University of Denmark
operated “manually” at the location, but will mainly be operated from one location in a remote monitoring centre. Consequently changes in business procedures becomes part of the IS project. During the years the FM department has established a high degree of accessibility to updated FM related data; there is a high degree of interoperability and there are procedures for keeping data updated. This is expected to be the case also in the future state. Each FM business process is operated according to standard business procedures and is supported with specific IS: there is business process uniformity. As part of the IS project standard business procedures will be updated, but the strategy will still be to obtain business process uniformity. See Figure 4.
Figure 4. Current and future state of IS strategy. Case D. Current (left side) and future state (right side) of IS strategy in the business strategy, business process,
information system and computer network layers. Change process objective and scope of IS project (middle).
4.5 Case E In case E each type of asset e.g. doors, or keys/locks, is operated in a specific way and is supported by specific IS, in other words there is asset business process uniformity. The facilities managers responsible for a specific type of asset can choose which type of IS they will use to operate this asset, but the selected IS must be capable of retrieving and transferring data of common interest from/to a central database. This model makes data highly accessible. All in all there is a high degree of interoperability and there are procedures for keeping data updated. The aim of a current IS project in case E is to upgrade an existing CAD and GIS based visualisation and data retrieval system used by all facilities managers in the organisation. This upgrade of the IS will make the functionality of the system more modern. The general IS strategy in case E aims at supporting the business strategy of keeping customers highly content so that the strategic goal of being the best supplier can be achieved. Furthermore it supports the business strategy of complying with official regulations which applies to this type of transportation business (See Figure 5). This is not only done with business process uniformity and a high degree of interoperability, but also achieved by constantly developing the use of IS in
10
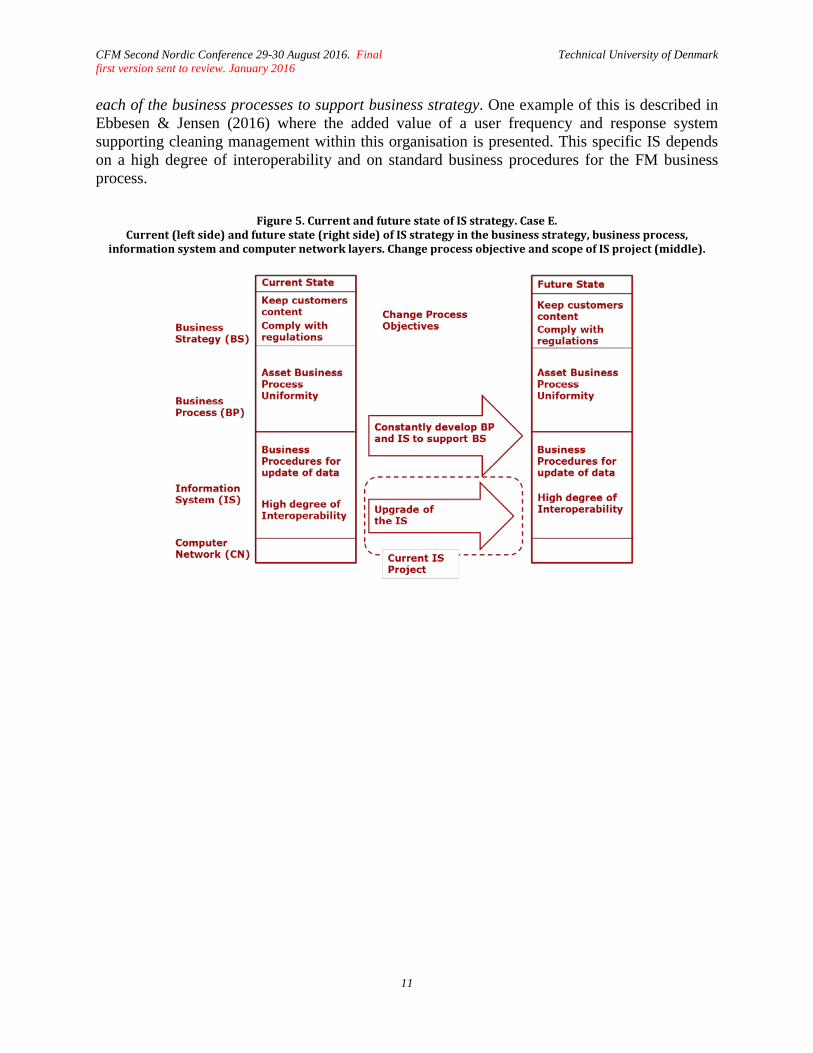
CFM Second Nordic Conference 29-30 August 2016. Final first version sent to review. January 2016
Technical University of Denmark
each of the business processes to support business strategy. One example of this is described in Ebbesen & Jensen (2016) where the added value of a user frequency and response system supporting cleaning management within this organisation is presented. This specific IS depends on a high degree of interoperability and on standard business procedures for the FM business process.
Figure 5. Current and future state of IS strategy. Case E. Current (left side) and future state (right side) of IS strategy in the business strategy, business process,
information system and computer network layers. Change process objective and scope of IS project (middle).
11
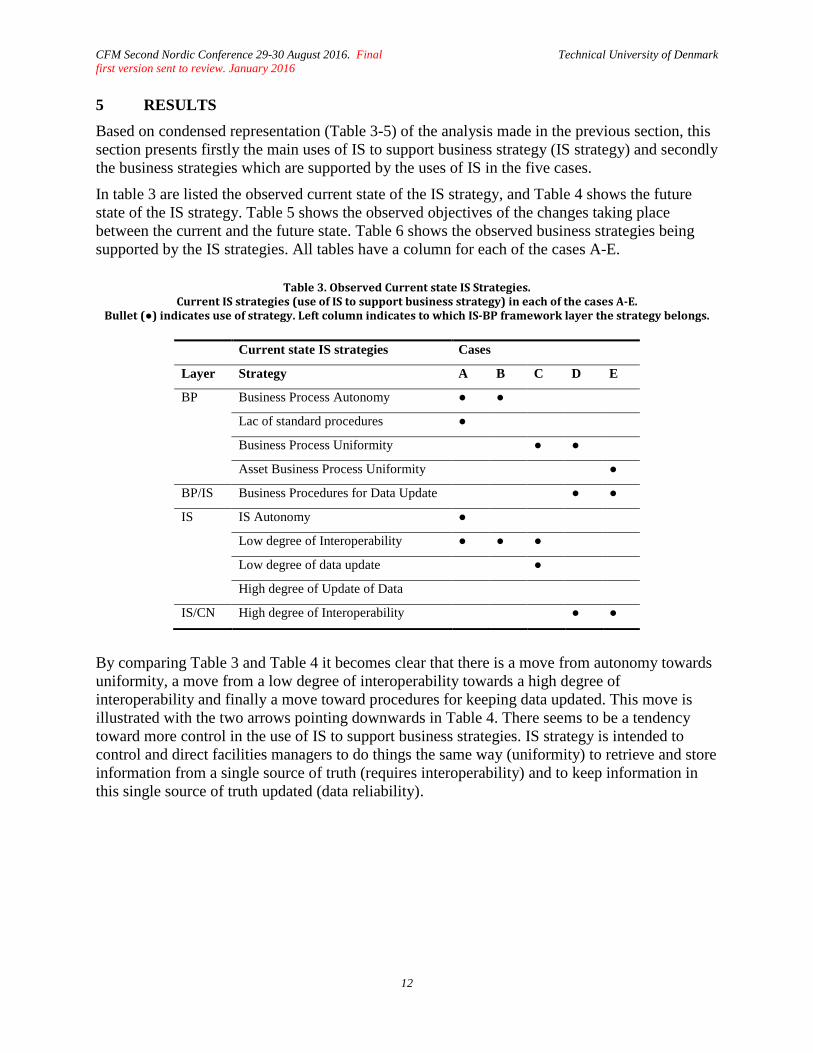
CFM Second Nordic Conference 29-30 August 2016. Final first version sent to review. January 2016
Technical University of Denmark
5 RESULTS Based on condensed representation (Table 3-5) of the analysis made in the previous section, this section presents firstly the main uses of IS to support business strategy (IS strategy) and secondly the business strategies which are supported by the uses of IS in the five cases.
In table 3 are listed the observed current state of the IS strategy, and Table 4 shows the future state of the IS strategy. Table 5 shows the observed objectives of the changes taking place between the current and the future state. Table 6 shows the observed business strategies being supported by the IS strategies. All tables have a column for each of the cases A-E.
Table 3. Observed Current state IS Strategies.
Current IS strategies (use of IS to support business strategy) in each of the cases A-E. Bullet (●) indicates use of strategy. Left column indicates to which IS-BP framework layer the strategy belongs.
Current state IS strategies Cases
Layer Strategy A B C D E
BP Business Process Autonomy ● ●
Lac of standard procedures ●
Business Process Uniformity ● ●
Asset Business Process Uniformity ●
BP/IS Business Procedures for Data Update ● ●
IS IS Autonomy ●
Low degree of Interoperability ● ● ●
Low degree of data update ●
High degree of Update of Data
IS/CN High degree of Interoperability ● ●
By comparing Table 3 and Table 4 it becomes clear that there is a move from autonomy towards uniformity, a move from a low degree of interoperability towards a high degree of interoperability and finally a move toward procedures for keeping data updated. This move is illustrated with the two arrows pointing downwards in Table 4. There seems to be a tendency toward more control in the use of IS to support business strategies. IS strategy is intended to control and direct facilities managers to do things the same way (uniformity) to retrieve and store information from a single source of truth (requires interoperability) and to keep information in this single source of truth updated (data reliability).
12
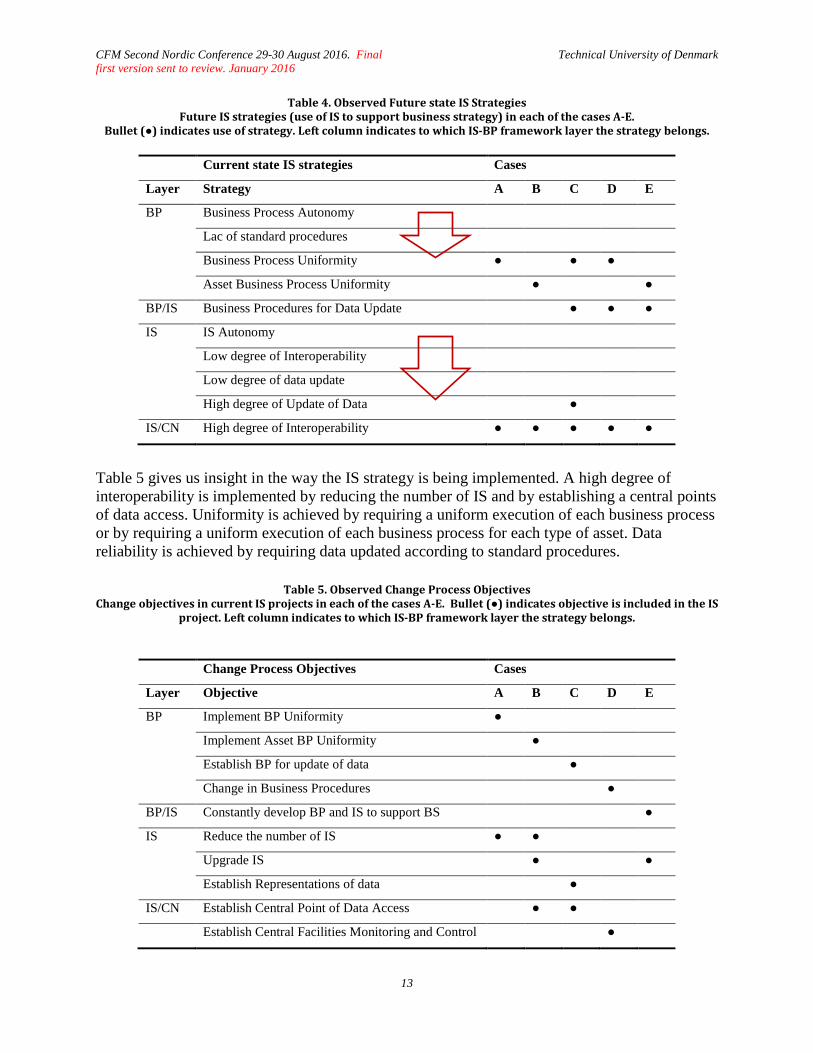
CFM Second Nordic Conference 29-30 August 2016. Final first version sent to review. January 2016
Technical University of Denmark
Table 4. Observed Future state IS Strategies Future IS strategies (use of IS to support business strategy) in each of the cases A-E.
Bullet (●) indicates use of strategy. Left column indicates to which IS-BP framework layer the strategy belongs.
Current state IS strategies Cases
Layer Strategy A B C D E
BP Business Process Autonomy
Lac of standard procedures
Business Process Uniformity ● ● ●
Asset Business Process Uniformity ● ●
BP/IS Business Procedures for Data Update ● ● ●
IS IS Autonomy
Low degree of Interoperability
Low degree of data update
High degree of Update of Data ●
IS/CN High degree of Interoperability ● ● ● ● ●
Table 5 gives us insight in the way the IS strategy is being implemented. A high degree of interoperability is implemented by reducing the number of IS and by establishing a central points of data access. Uniformity is achieved by requiring a uniform execution of each business process or by requiring a uniform execution of each business process for each type of asset. Data reliability is achieved by requiring data updated according to standard procedures.
Table 5. Observed Change Process Objectives
Change objectives in current IS projects in each of the cases A-E. Bullet (●) indicates objective is included in the IS project. Left column indicates to which IS-BP framework layer the strategy belongs.
Change Process Objectives Cases
Layer Objective A B C D E
BP Implement BP Uniformity ●
Implement Asset BP Uniformity ●
Establish BP for update of data ●
Change in Business Procedures ●
BP/IS Constantly develop BP and IS to support BS ●
IS Reduce the number of IS ● ●
Upgrade IS ● ●
Establish Representations of data ●
IS/CN Establish Central Point of Data Access ● ●
Establish Central Facilities Monitoring and Control ●
13
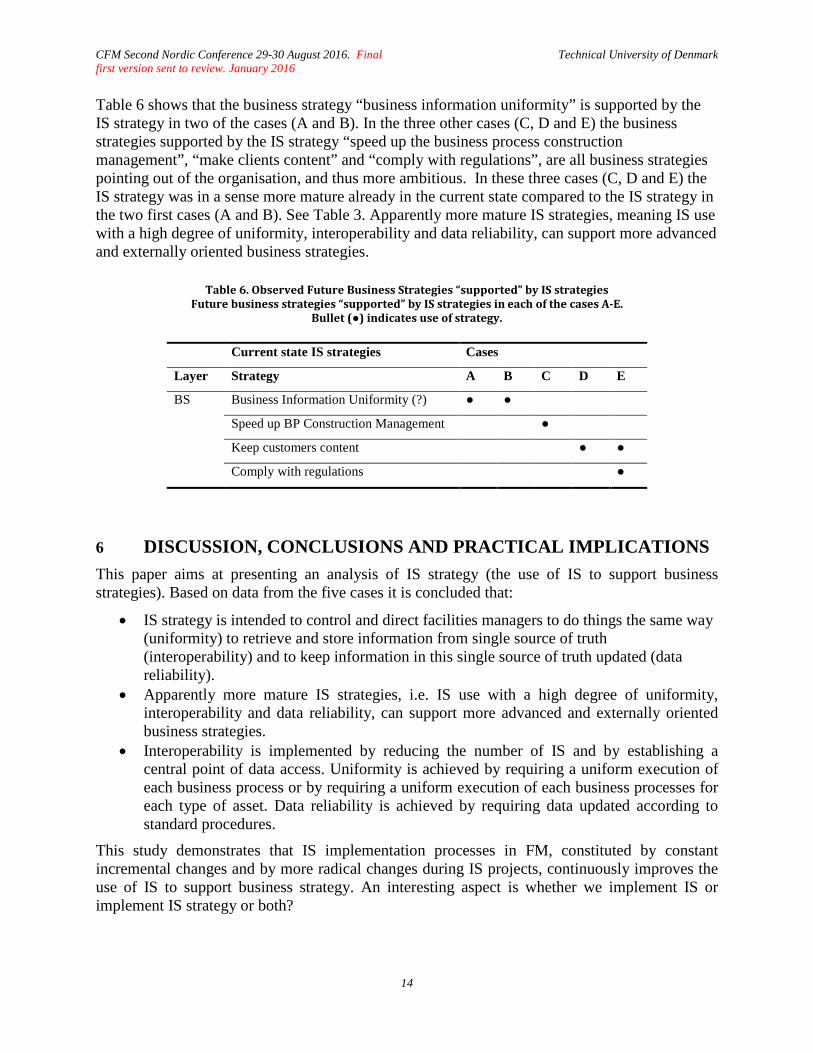
CFM Second Nordic Conference 29-30 August 2016. Final first version sent to review. January 2016
Technical University of Denmark
Table 6 shows that the business strategy “business information uniformity” is supported by the IS strategy in two of the cases (A and B). In the three other cases (C, D and E) the business strategies supported by the IS strategy “speed up the business process construction management”, “make clients content” and “comply with regulations”, are all business strategies pointing out of the organisation, and thus more ambitious. In these three cases (C, D and E) the IS strategy was in a sense more mature already in the current state compared to the IS strategy in the two first cases (A and B). See Table 3. Apparently more mature IS strategies, meaning IS use with a high degree of uniformity, interoperability and data reliability, can support more advanced and externally oriented business strategies.
Table 6. Observed Future Business Strategies “supported” by IS strategies
Future business strategies “supported” by IS strategies in each of the cases A-E. Bullet (●) indicates use of strategy.
Current state IS strategies Cases
Layer Strategy A B C D E
BS Business Information Uniformity (?) ● ●
Speed up BP Construction Management ●
Keep customers content ● ●
Comply with regulations ●
6 DISCUSSION, CONCLUSIONS AND PRACTICAL IMPLICATIONS This paper aims at presenting an analysis of IS strategy (the use of IS to support business strategies). Based on data from the five cases it is concluded that:
• IS strategy is intended to control and direct facilities managers to do things the same way (uniformity) to retrieve and store information from single source of truth (interoperability) and to keep information in this single source of truth updated (data reliability).
• Apparently more mature IS strategies, i.e. IS use with a high degree of uniformity, interoperability and data reliability, can support more advanced and externally oriented business strategies.
• Interoperability is implemented by reducing the number of IS and by establishing a central point of data access. Uniformity is achieved by requiring a uniform execution of each business process or by requiring a uniform execution of each business processes for each type of asset. Data reliability is achieved by requiring data updated according to standard procedures.
This study demonstrates that IS implementation processes in FM, constituted by constant incremental changes and by more radical changes during IS projects, continuously improves the use of IS to support business strategy. An interesting aspect is whether we implement IS or implement IS strategy or both?
14
CFM Second Nordic Conference 29-30 August 2016. Final first version sent to review. January 2016
Technical University of Denmark
This study is based on observed realised IS strategies, which can be both deliberate and/or emergent. Each IS strategy may have emerged over time as a result of many events and decisions, and may not have been deliberate.
The methodology applied in this paper can be used to establish IS strategies in practice. Using the IS-BP framework the current state, the future states and the change process, e.g. the IS project, can be mapped. Thereby illustrating how the change in the use of IS can lead to more support of the business strategy. This study demonstrates that IS implementation projects in FM are not delimited and isolated projects. Rather they appear to be interwoven and linked to past and concurrent IS implementation. Recognising this when planning and executing IS projects in FM is anticipated to strengthen the IS implementation process.
REFERENCES Chen, D.Q. et al., 2010. Information systems strategy: reconceptualization, measurement, and
implications. MIS Quarterly, 34(2), pp.233–259. Cohen, E.A., 2016. Strategy. Encyclopædia Britannica. Available at:
http://global.britannica.com.globalproxy.cvt.dk/topic/strategy-military. Eastman, C. et al., 2011. BIM Handbook: A Guide to Building Information Modeling for Owners,
Managers, Designers, Engineers and Contractors, Wiley. Ebbesen, P., 2016. Bridging the gap between Information Systems and Business Processes – A
Framework with Functional Affordances and Alignment. ITcon, In Review. Ebbesen, P. & Jensen, P.A., 2016. Assessing the Added Value of Information Systems
supporting Facilities Management Business Processes. Facilities, In Review. Mintzberg, H., 1987. The Strategy Concept I: Five Ps For Strategy. California Management
Review, 30(1), pp.11–24. Waema, T. & Walsham, G., 1990. Information systems strategy formulation. Information &
Management, 18(1), pp.29–39.
15
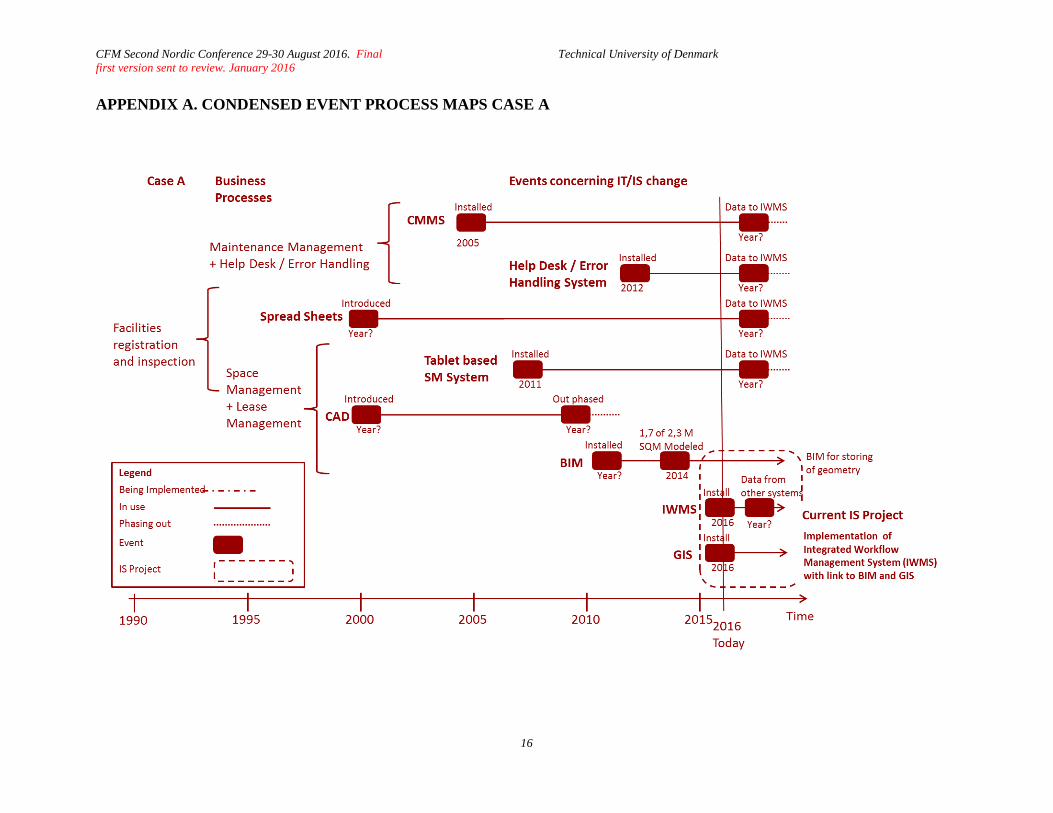
CFM Second Nordic Conference 29-30 August 2016. Final first version sent to review. January 2016
Technical University of Denmark
APPENDIX A. CONDENSED EVENT PROCESS MAPS CASE A
16
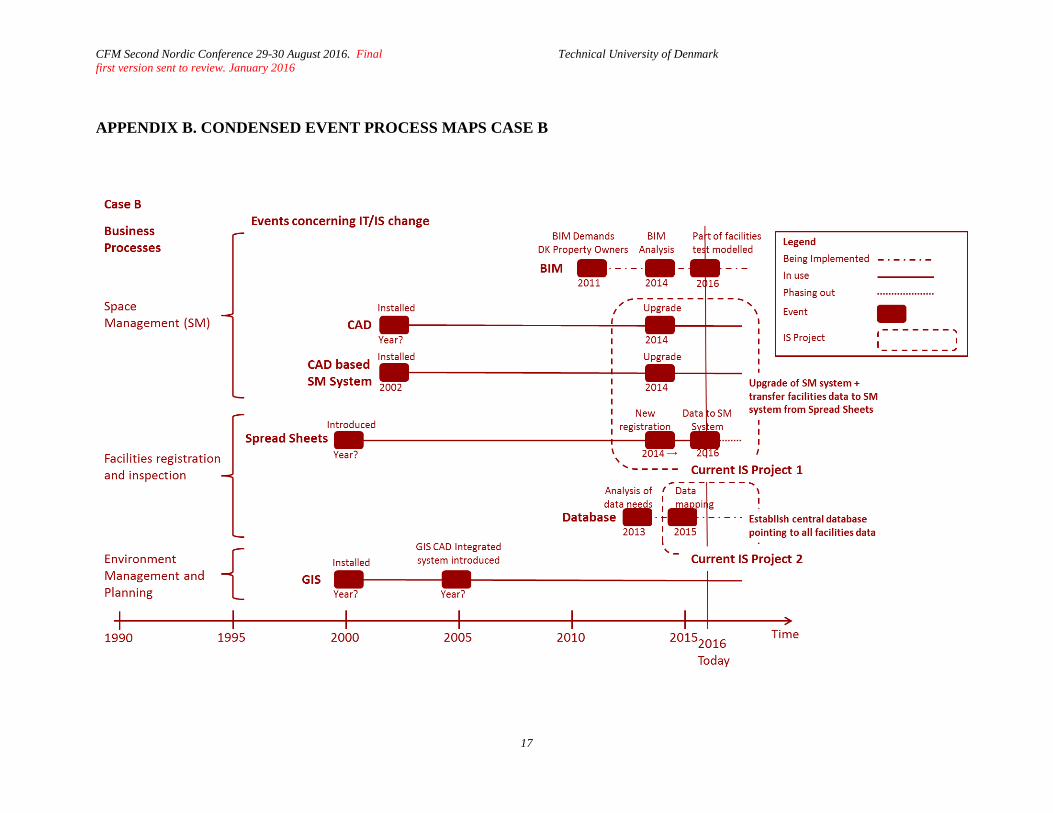
CFM Second Nordic Conference 29-30 August 2016. Final first version sent to review. January 2016
Technical University of Denmark
APPENDIX B. CONDENSED EVENT PROCESS MAPS CASE B
17
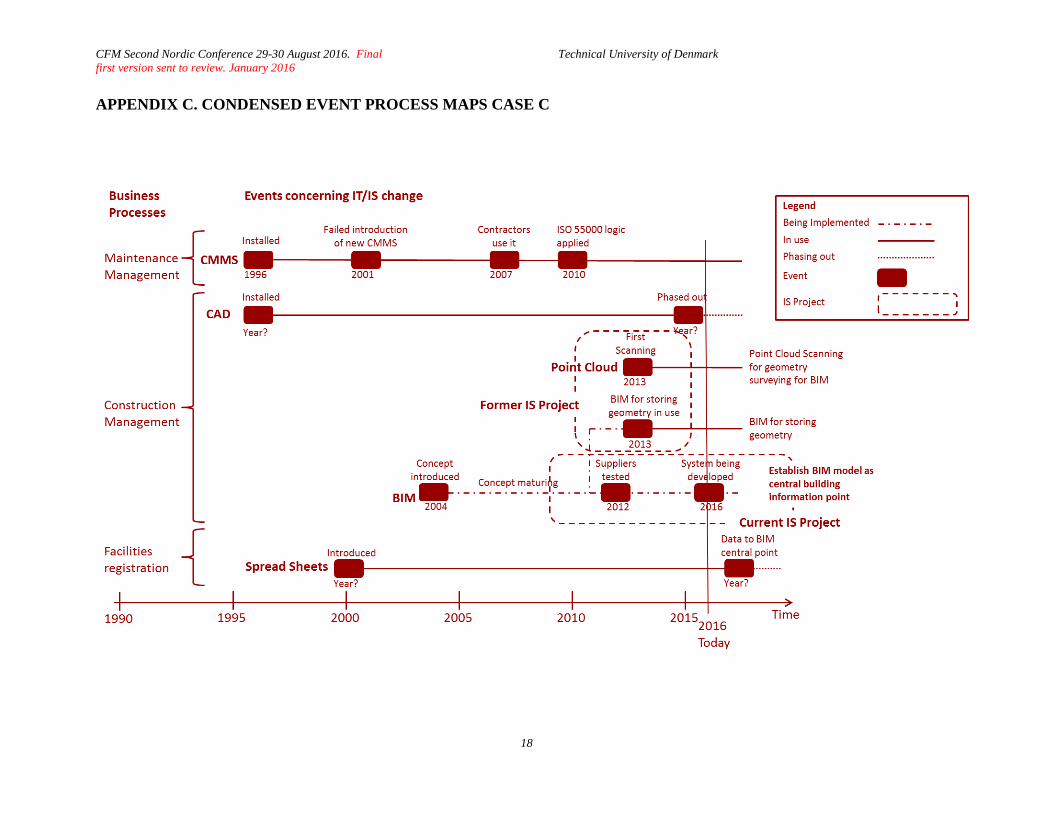
CFM Second Nordic Conference 29-30 August 2016. Final first version sent to review. January 2016
Technical University of Denmark
APPENDIX C. CONDENSED EVENT PROCESS MAPS CASE C
18
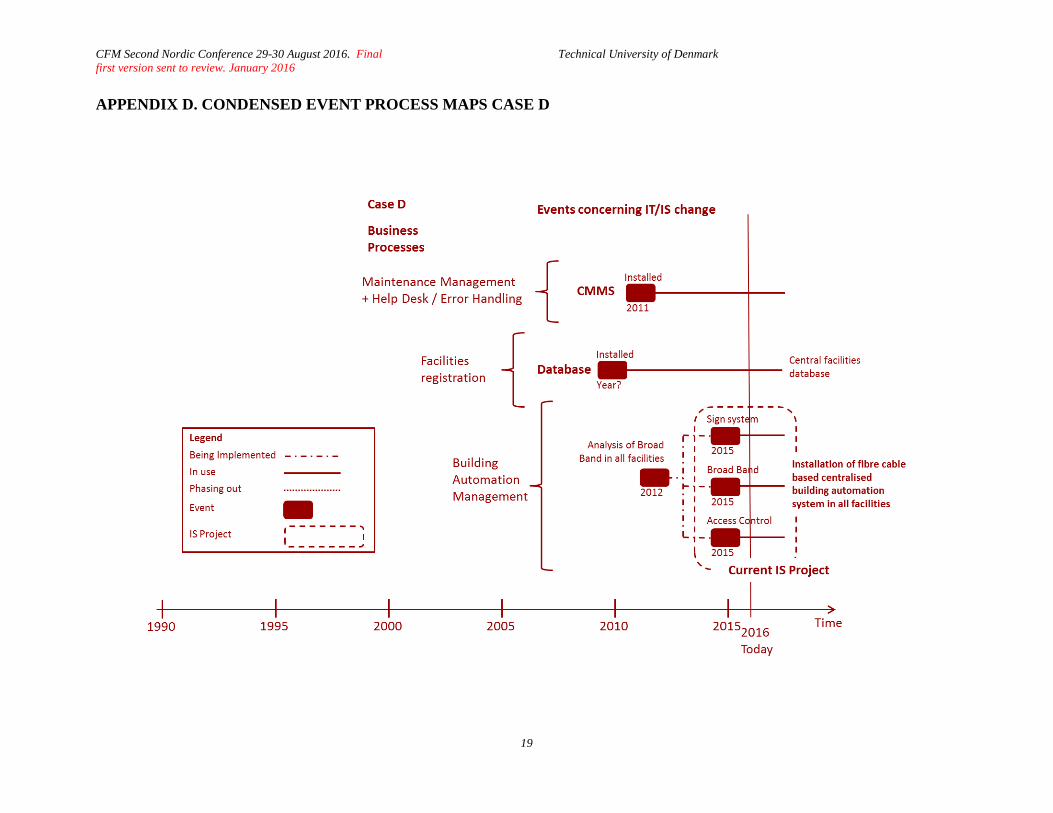
CFM Second Nordic Conference 29-30 August 2016. Final first version sent to review. January 2016
Technical University of Denmark
APPENDIX D. CONDENSED EVENT PROCESS MAPS CASE D
19
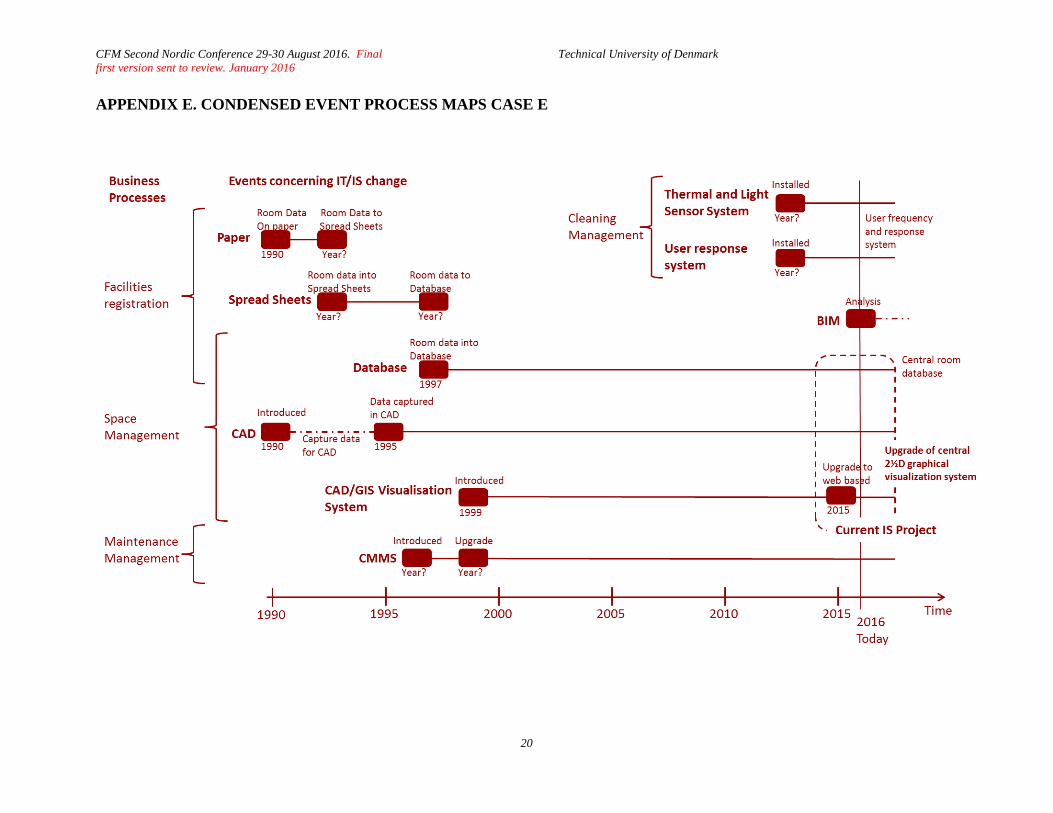
CFM Second Nordic Conference 29-30 August 2016. Final first version sent to review. January 2016
Technical University of Denmark
APPENDIX E. CONDENSED EVENT PROCESS MAPS CASE E
20