added-value utility formulation in palm oil supply chain based on
TRANSCRIPT

International Journal of Business and Economics Research 2014; 3(6-1): 57-64 Published online December 09, 2014 (http://www.sciencepublishinggroup.com/j/ijber) doi: 10.11648/j.ijber.s.2014030601.19 ISSN: 2328-7543 (Print); ISSN: 2328-756X (Online)
Added-Value utility formulation in palm oil supply chain based on risk, investment and technology
Syarif Hidayat*, Nunung Nurhasanah
Industrial Engineering Department, The University Al Azhar Indonesia, Jakarta, Indonesia
Email address: [email protected] (S. Hidayat), [email protected] (N. Nurhasanah)
To cite this article: Syarif Hidayat, Nunung Nurhasanah. Added-Value Utility Formulation in Palm Oil Supply Chain Based on Risk, Investment and Technology.
International Journal of Business and Economics Research. Special Issue: Supply Chain Management: Its Theory and Applications.
Vol. 3, No. 6-1, 2014, pp. 57-64. doi: 10.11648/j.ijber.s.2014030601.19
Abstract: In palm oil supply chain (POSC) the operational risk, investment and technology levels between the actors may
not be proportionately rewarded by the same levels of added value. Each actor will attempt to obtain the highest reward.
However, each actor must consider the level of added-value obtained by other actors so as to maintain the fair balance in the
overall supply chain profitability. Otherwise any of the least profitable actor will withdraw itself from the supply chain and the
supply chain will collapse. In this study the authors proposed a formula to calculate the utility function based added-value for
each of the actors in the POSC. The utility function is a formula based on the risk, investment and technology levels of each of
the POSC actors. Permutation of the three factors was used while seeking their combination that give the highest utility
function added-value. To optimize the added-value distribution between the agents the concept of stakeholder dialogue was
used. This research is important because the developed models offer a workable algorithm to seek optimum weight level of
underlying factors while calculating utility added-value that satisfy the POSC as a whole. Agent-based modeling approach was
used for this purpose to facilitate the negotiation between all actors to reach the balanced added-values. Netlogo software was
used in developing the models. The proposed utility function model provided the means to find the weight values, while the
optimization model proved to be practical to calculate the expected negotiated prices between all the actors. Application of the
models to other types of commodity and different supply chain model will need some adjustments in the calculation.
Keywords: Added-Value, Palm Oil Supply Chain, Permutation, Agent Based Modeling, Netlogo Software
1. Introduction
In a supply chain interdependent companies operate in
sequence and cooperate in handling, improving and
controlling the flows of goods, money and information. It
begins with the supplier in the upstream and goes all the way
downstream until the end consumers ([1, 2]). The principal
roles of the supply chain is to add value to the products by
moving them from one to another location, or to perform the
modification processes [3]. The value adding processes may
be applied to the quality, costs, delivery activities,
flexibilities in sending the products, and innovations [4].
1.1. Palm Oil Supply Chain
One of the most important supply chains in Indonesia is
the palm oil supply chain (POSC). Export of palm oil and its
derivatives has always been increasing. In 2010 the export
value was USD 15,6 billions, which has shown an increase of
34,6 % compared to 2009. The export tax was US$ 2,8
billion [5]. This value came second only to oil export. Figure
1 shows the 6 actors in the POSC. The smallholder farmers
sell their fresh fruit bunch (FFB) to CPO Factory through
traders. CPO Factory converts the FFB into crude palm oil
(CPO). CPO is sold to the refinery, who converts CPO into
frying oil and sends the product to the distributors. Although
CPO can be converted into many types of popular consumer
products, for simplicity in this study only frying oil refinery
is discussed. The distributors subsequently sell them to the
consumers. The farmers as a group supply the required FFB
raw materials to the CPO factory through the traders. This is
required to ensure the consistent quantitative operating levels
along the POSC from the upstream to the downstream.
The business scale of each of the POSC actor is different
from each other. The risks faced by each actor are different in
type and level. The investment as well as the technology
employed by each actor is also different in level. These three
factors influence the capacity and the opportunity to create

58 Syarif Hidayat and Nunung Nurhasanah: Added-Value Utility Formulation in Palm Oil Supply Chain Based on Risk, Investment and Technology
added value in each of the actors. The sum of the added value
created by each actor produces the total added value for
overall supply chain.
Figure 1. Palm oil supply chain actors
Due to the monopsonistic market conditions palm oil
farmers bargaining power was low. [6] reported the sad
conditions about small farmers suffering from low
productivity compared to very high profit per hectare for the
large estates, the low accessability to financial and technical
supports, and lacking in representation in the decision
making processes. [7] described the low prices of FFB by the
farmers despite their high risks.
The objective of this study is to design a utility added
value model based on the level and weight of the risks,
investment, and the technology faced or employed by the
POSC actors. To achieve this objective some theories,
methodologies, and an alorithm are utilized.
1.2. Theories Used in the Study
The first theory is about added value. Added value may be
defined as the incremental value to a commodity as it
undergoes processing in the production stream [8]. [9]
defined added value as the “difference between output value
and the input costs”. Added value concept is the increase in
the value due to the growth of the value as functional input is
affected to the commodity. Functional input is the treatment
and services that causes increments in the utility and the
value of the commodity [10]. Added value is the main
motivation for the establishment and the growth of an
enterprise. Without this no investor or businessman is willing
to invest in or nurture a business. This kind of motive is the
strongest one that push a person or an organization to get
involved in supply chain [11]. [12] mentioned that the unfair
cost and benefit distribution along an agroindustry supply
chain will endanger its survival, as it hampers the efforts to
modernize the agriculture and subsequently it will hamper
the growth of the industry. The motives for the investor or
the businessman to engage in any enterprise including the
agroindustry is the fair and just arrangement of risk and
benefit [1].
Added value formula is written as follows [13]:
Π = TR – TC (1)
TR = P * Q (2)
TC = TFC + TVC (3)
where
Π = profit = added value
TR = total revenue
P = price per unit
Q = quantity sold
TC = total cost
TFC = total fixed cost
TVC = total variable cost
The second theory is about negotiation behavior between
POSC actors. Actors will need to interact very closely to
obtain either raw materials or sell their products. They need
to do this at the most efficient and economical manners to
maintain their continuous financial objectives. They have to
consider supply chain factors such as inbound lead times &
associated variability, supply chain risk, protection of supply
& logistics costs as well as risk & inventory costs [14].
During negotiation stages there are additional factors that
need to be considered [15]. They are : the level of
dependence perceived by each negotiator (both customers
and suppliers were measured); the cooperative orientation of
each negotiator (both customers and suppliers are measured);
the cooperative orientation of each negotiator; the level of
coercion implemented in the negotiation; and the level of
contract formality implemented in the negotiation. In this
study, the negotiation will consider the concept of fairness as
introduced by stakeholder dialogue concept. Basically the
method is a structured discussions between the
representatives of business partners or companies [16].
The third theory discussed in this study is the utility
formulation to describe added value calculation. The selling
prices are negotiated between the actors until each actor
reaches a satisfactory value, which is ruled by the levels of
optimum added value utility. The concept about the utility
function is that all of the tangible and intangible outputs of
various business processes, represent inputs into the intrinsic
satisfactions, or else they represent goods and services that
add to the stock of wealth available for the production of
future satisfactions of the actor [17]. With satisfaction the
author is referring to the optimization of the added value
obtained from the business negotiation in the POSC. In this
research the utility function is written in an exponential
format.
2. Methods
In line with the objective, this study is organized into
several parts as follows: (1) identification of the actors, with
relevant risk, investment and technology factors in the POSC,
(2) formulation of the added values in the POSC, (3)
formulation of the negotiation behavior in the POSC, (4)
formulation of permutation and iterative algorithm using the
three factors, and (5) development of the solution models
using Agent Based approach and Netlogo software.
2.1. Identification of POSC Actors, Risk, Investment and
Technology Levels
All information and data needed for this study are obtained
and identified from recent literatures and by interviewing
relevant managers in the palm oil industries. Risk,
investment and technology levels for each actor are obtained
from replies to questionnaires, as well as from secondary
International Journal of Business and Economics Research 2014; 3(6-1): 57-64 59
resources. Most quantitative results are taken from the
author’s previous study in the POSC [18]. Calculation of
input material quantities, investment and maintenance costs
follow modified Hayami Method. The technology levels are
defined as the combination of their sophistication, operation
personnel costs, and maintenance costs. Each are given a
weight factor, and later normalized to obtain a global score.
2.2. Formulation of added value for the POSC
Following [19] by common sense it was assumed that if
the risk is higher then the added value should be higher.
Likewise, the higher the investment level and the technology
employed, the higher the added value. The level of risk,
investment, and technology will never be zero. Nowadays for
any real business there are always risk faced by the industry,
need for investment, and some technology, although with
some differences in their level. An exponential utility
function is the best representation of this logic. This
assumption is written as a functional exponential utility
formula for added value shown in (4).
AV = f (investment, risk, technology)
= α e (w1i*x1i+w2i*x2i+w3i*x3i) α (4)
where :
AV = Utility based added value
α = variable coefficient
w1i = risk weight level for i-th POSC actor
x1i = risk score for i-th POSC actor
w2i = investment weight level for i-th POSC actor
x2i = investment score for i-th POSC actor
w3i = technology weight level for i-th POSC actor
x3i = technology score for i-th POSC actor
i = 1, 2, 3, 4, 5, 6 the actors of the POSC, namely the
group of farmers, traders, CPO factory, Frying oil refinery,
distributors and the consumers, respectively.
Subject to the constraints:
0 < w1i, w2i, w3i < 1 (5)
w1i + w2i + w3i = 1 (6)
The total sum of weights should be equal to 1, while the
weight levels for risk, investment and technology are defined
to be less than 1. The value for α from previous research was
selected at 2.0 as this value provides sufficient visibility of
the graph movement.
In this study, the scores are obtained from the field. It is
the values of the weight level that we need to find that give
the optimum AV.
2.3. Identification of Negotiation Behavior
In agroindustry supply chain the business aims at
maintaining supply continuity and improve the raw materials
quality while balancing the financial interests for each actor.
The farmers want to get the highest price for their crops, but
the traders and factories demand the lowest cost for quality
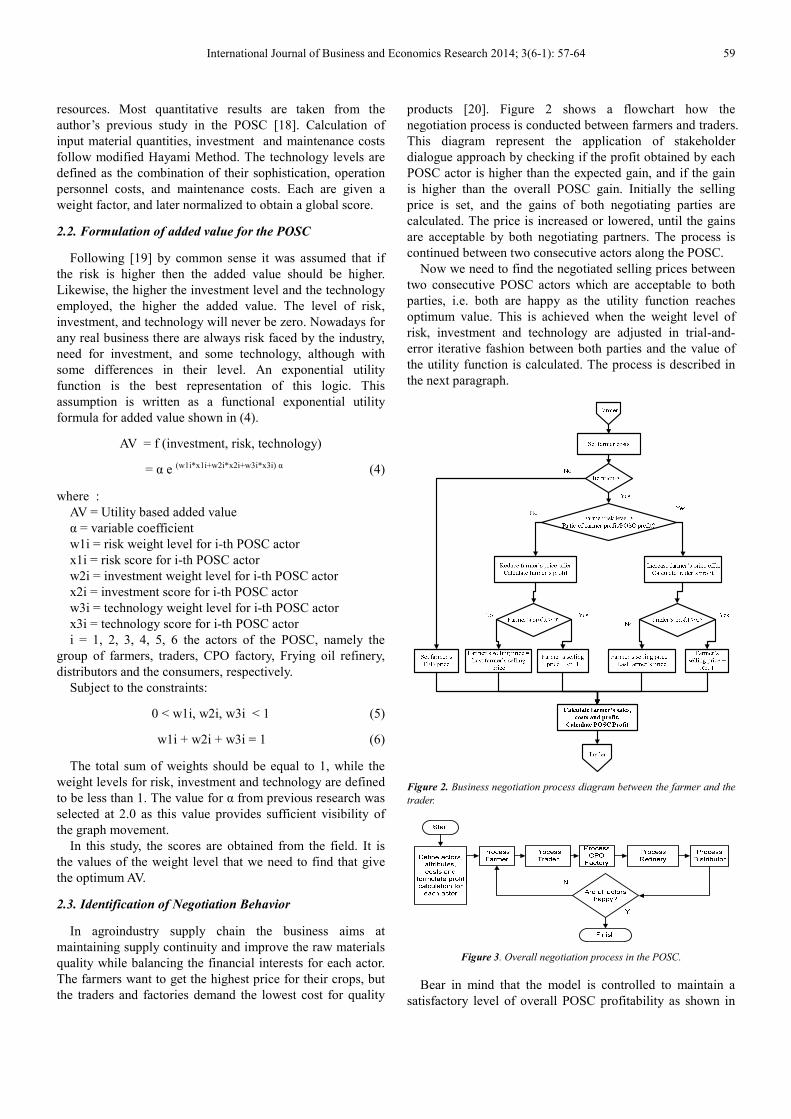
products [20]. Figure 2 shows a flowchart how the
negotiation process is conducted between farmers and traders.
This diagram represent the application of stakeholder
dialogue approach by checking if the profit obtained by each
POSC actor is higher than the expected gain, and if the gain
is higher than the overall POSC gain. Initially the selling
price is set, and the gains of both negotiating parties are
calculated. The price is increased or lowered, until the gains
are acceptable by both negotiating partners. The process is
continued between two consecutive actors along the POSC.
Now we need to find the negotiated selling prices between
two consecutive POSC actors which are acceptable to both
parties, i.e. both are happy as the utility function reaches
optimum value. This is achieved when the weight level of
risk, investment and technology are adjusted in trial-and-
error iterative fashion between both parties and the value of
the utility function is calculated. The process is described in
the next paragraph.
Figure 2. Business negotiation process diagram between the farmer and the
trader.
Figure 3. Overall negotiation process in the POSC.
Bear in mind that the model is controlled to maintain a
satisfactory level of overall POSC profitability as shown in

60 Syarif Hidayat and Nunung Nurhasanah: Added-Value Utility Formulation in Palm Oil Supply Chain Based on Risk, Investment and Technology
Figure 3. The negotiation process will only stop when
individual actor has reached satisfactory added value utility
level, therefore the overall POSC profitability is sustained.
The overall processes are then translated into Netlogo
software program.
2.4. Formulation of Permutation and Iterative Algorithm
While we have 3 factors to consider i.e. the weight levels
of risks, investments and technology for all five of the supply
chain actors, we use mathematical permutation to seek the
combinations of the factors which will provide the highest
added value of the POSC business. We start with assigning
the lowest possible value for one factor (0.001) and increase
this value step-by-step by 0.001 until it to reach the highest
value of 0.998. For the second factor we started with the
lowest value of 0.001, keep it at this level, while to the third
factor we assign the highest value of 0.998 because have
already assigned the initial value of 0.001 and 0.001 for the
first two factors, and that the sum must be equal to one.
Using the Netlogo modelling language we work out an
iteration in the following fashion. A represents the values for
risk factor; B represents the values for investment factor, and
C represents the values for technology factor. ABC means we
started the values of risk factor from 0.001. The value (= A)
is incremented with 0.001 gradually until it reaches 0.998.
The value for investment (= B) is kept constant at 0.001. The
technology factor, the third (= C) was started at 0.998,
decreased by 0.001 until it reaches 0.001. Next, the value A
is increased to 0.002, B stays at 0.001 and C starts at 0.997.
The process is then repeated. This is repeated until A starts at
0.998, B at 0.001 and C at 0.001.
This procedure is repeated for the other 5 permutation
namely ACB, BAC, BCA, CAB and CBA with the
corresponding changes in each iteration. Table 1 shows the
iteration steps for the permutation. We regard each iteration
as the realization of one negotiation cycle between the POSC
actors. In one negotiation cycle we adjust the levels of
weight risk, investment and technology and calculate the
related value of the utility function.
Table 1. Iteration steps
1st 2nd 3rd 4th 5th 6th 7th End value
Iteration for ABC
Risk A 0.001 0.002 0.003 0.004 0.005 0.006 0.007 0.998
Investment B 0.001 0.001 0.001 0.001 0.001 0.001 0.001 0.001
Technology C 0.998 0.997 0.996 0.995 0.994 0.993 0.992 0.001
Iteration for ACB
Risk A 0.001 0.002 0.003 0.004 0.005 0.006 0.007 0.998
Investment B 0.998 0.997 0.996 0.995 0.994 0.993 0.992 0.001
Technology C 0.001 0.001 0.001 0.001 0.001 0.001 0.001 0.001
Iteration for BAC
Risk A 0.001 0.001 0.001 0.001 0.001 0.001 0.001 0.001
Investment B 0.001 0.002 0.003 0.004 0.005 0.006 0.007 0.998
Technology C 0.998 0.997 0.996 0.995 0.994 0.993 0.992 0.001
Iteration for BCA
Risk A 0.998 0.997 0.996 0.995 0.994 0.993 0.992 0.001
Investment B 0.001 0.002 0.003 0.004 0.005 0.006 0.007 0.998
Technology C 0.001 0.001 0.001 0.001 0.001 0.001 0.001 0.001
Iteration for CAB
Risk A 0.001 0.001 0.001 0.001 0.001 0.001 0.001 0.001
Investment B 0.998 0.997 0.996 0.995 0.994 0.993 0.992 0.001
Technology C 0.001 0.002 0.003 0.004 0.005 0.006 0.007 0.998
Iteration for CBA
Risk A 0.998 0.997 0.996 0.995 0.994 0.993 0.992 0.001
Investment B 0.001 0.001 0.001 0.001 0.001 0.001 0.001 0.001
Technology C 0.001 0.002 0.003 0.004 0.005 0.006 0.007 0.998
2.5. Development of Netlogo Agent Based Modeling
Agent-based modeling approach is used for this purpose as
it provided the best means to identify and study the supply
chain actors (or agents) business and decision making
behaviors. The agent-based approach facilitates the
interaction between all the POSC actors with the
characteristics of autonomy, social interaction, reactive and
pro-active behaviours [21].
Netlogo open-source programming software is used to
develop the agent-based program due to its vast modeling
facilities, easy availability, and continuous development by
the diverse user communities. The programming language is
flexible and facilitate appropriate algorithm coding. It also
has the facility to write the numerical calculation output in an
excel-like format [22].
Two Netlogo models were developed, i.e. Utility model
and the Optimization model. The Utility model is used to
obtain the weight levels of risk, investment and technology
that give the optimum utility or added value. For each
permutation described in paragraph 2.4, say ABC, the Utility
model calculates the utility based added value for a
combination of score and weight level of risk, investment
and technology for all 5 POSC actors. While the weight
levels are being changed in the iteration, a plot is printed in
the output. The result for the complete iteration is a repetitive

International Journal of Business and Economics Research 2014; 3(6-1): 57-64 61
exponential graph as shown in Figure 4 and Figure 5.
To obtain the optimum level in trial-and-error iterative
fashion we plot the graph of one permutation, say ABC, and
plot another permutation, say ACB, side by side, and find
where the two graphs intersect. At this intersection we
consider that the risk, investment, and technology level meet
the optimum utility added value for all 5 POSC actors.
These weight levels then are entered into the Netlogo
Optimization model to find the selling prices and the
individual added values for each of the POSC actors. In this
Optimization model, the selling prices undergo the iterative
negotiation process again to achieve the most acceptable
added value level, following the logic shown in Figure 2. The
Optimization model is written to facilitate the calculation
following the process described in paragraph 2.4.
3. Results and Discussion
3.1. The actors in the POSC
The CPO factory in the study has a processing capacity of
30 tons of FFB per hour. To operate for a year (working 300
days per year and 20 hours per day) the factory needed
180.000.000 kg of FFB). This amount of FFB is produced
by a palm oil estate of 3.032 hectares. Assuming that one
farmer owns 2 hectares, then 1.516 farmers are involved in
producing the required FFB. However, the CPO factory is
supplied 50% of its FFB requirement from its own palm oil
estate. The respective operating maintenance costs, yields,
and added values were calculated using these capacity and
respective amount of FFB needs, to obtain corresponding
value-added or utility values.
3.2. Investment, Risk and Technology Levels
The scores of risk, investment and technology levels for
each actor in the POSC, i.e. x1i, x2i and x3i, were obtained
from the interviews with the selected respondents in previous
research [18]. Identified risks are shown in Table 2. The data
is processed using Fuzzy Analytical Hierarchy Processing
(FAHP) to give the final scores shown on the first row of
Table 3. The investment levels were identified from each of
the financial reports, further processed using modified
Hayami method [18] and normalized to result in the scores
shown on Tabel 3. The technology levels were defined as the
combination of their values, sophistication, and maintenance
costs. Each were given a weight factors, and later normalized
to obtain a global score.
Table 2. Identified risks and their final scores
Supply Chain Actor
Risk Type Farmer Trader CPO Fct Refinery Distributor Consumer Score
Price 0.119 0.145 0.045 0.076 0.137 0.221 0.108
Supply 0.082 0.198 0.208 0.197 0.146 0.087 0.152
Transportation 0.037 0.074 0.035 0.043 0.141 0.087 0.058
Information 0.050 0.062 0.044 0.046 0.049 0.057 0.050
Policy 0.037 0.040 0.034 0.031 0.048 0.057 0.039
Market 0.041 0.154 0.081 0.082 0.166 0.081 0.121
Warehousing 0.140 0.057 0.032 0.054 0.066 0.075 0.045
Production 0.100 0.037 0.138 0.156 0.037 0.060 0.098
Environment 0.072 0.025 0.060 0.054 0.031 0.061 0.054
Quality 0.166 0.065 0.138 0.156 0.066 0.129 0.129
Partnership 0.093 0.116 0.067 0.046 0.090 0.051 0.081
Technology 0.059 0.028 0.118 0.078 0.023 0.033 0.064
Table 3. POSC actors risk, investment and technology levels
Variable Farmer Trader CPO Factory Refinery Distributor
Risk 0.355 0.124 0.224 0.193 0.103
Investment 0.01 0.028 1.313 1.953 0.04
Technology 0.104 0.224 2.07 0.822 0.316
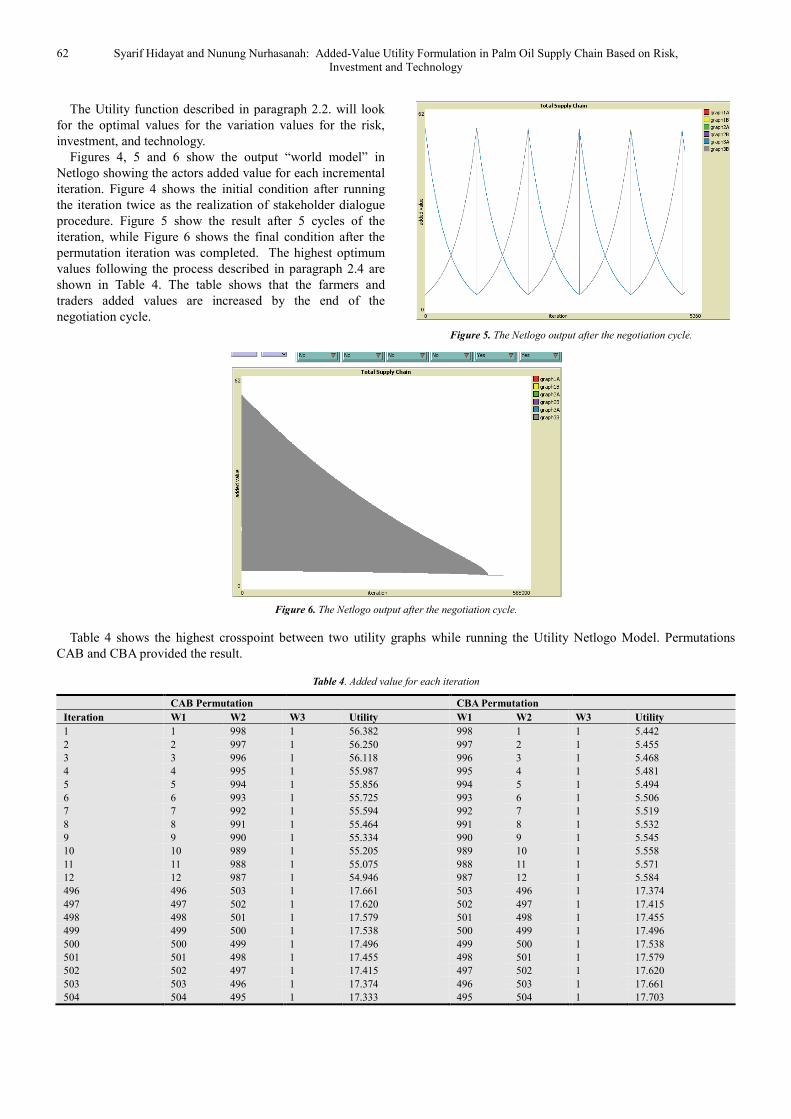
The Netlogo negotiation process model shows output
graphs as depicted in Figure 4, 5 and 6. They show the
movement of the utility added value figures following the
changes of each iteration as described in paragraph 2.5. The
vertical axis represent the movement of the added value (in
percentage of maximum value) for each actor until the
optimum stable selling price for each product is obtained. It
is obvious that the selling prices for the refinery and the
distributor are decreasing, while the selling prices of CPO
factory, farmers and the traders are increasing following the
relevant added values.
3.3. Calculation of Maximum Utility Formula
Figure 4. The Netlogo output after the negotiation cycle.
62 Syarif Hidayat and Nunung Nurhasanah
The Utility function described in paragraph 2.2.
for the optimal values for the variation values
investment, and technology.
Figures 4, 5 and 6 show the output “world model” in
Netlogo showing the actors added value for each incremental
iteration. Figure 4 shows the initial condition after running
the iteration twice as the realization of stakeholder dialogue
procedure. Figure 5 show the result after 5 cycles of
iteration, while Figure 6 shows the final condition after the
permutation iteration was completed. The
values following the process described in paragraph 2.4
shown in Table 4. The table shows that the farmers and
traders added values are increased by the end of the
negotiation cycle.
Figure 6.
Table 4 shows the highest crosspoint between two utility graphs while running the Utility Netlogo Model. Permutations
CAB and CBA provided the result.
CAB Permutation
Iteration W1 W2
1 1 998
2 2 997
3 3 996
4 4 995
5 5 994
6 6 993
7 7 992
8 8 991
9 9 990
10 10 989
11 11 988
12 12 987
496 496 503
497 497 502
498 498 501
499 499 500
500 500 499
501 501 498
502 502 497
503 503 496
504 504 495
Nunung Nurhasanah: Added-Value Utility Formulation in Palm Oil Supply Chain Based on Risk, Investment and Technology
Utility function described in paragraph 2.2. will look
optimal values for the variation values for the risk,
output “world model” in
actors added value for each incremental
Figure 4 shows the initial condition after running
the iteration twice as the realization of stakeholder dialogue
show the result after 5 cycles of the
shows the final condition after the
permutation iteration was completed. The highest optimum
following the process described in paragraph 2.4 are
t the farmers and
traders added values are increased by the end of the
Figure 5. The Netlogo output after the negotiation cycle.
Figure 6. The Netlogo output after the negotiation cycle.
the highest crosspoint between two utility graphs while running the Utility Netlogo Model. Permutations
Table 4. Added value for each iteration
CBA Permutation
W3 Utility W1 W2
1 56.382 998 1
1 56.250 997 2
1 56.118 996 3
1 55.987 995 4
1 55.856 994 5
1 55.725 993 6
1 55.594 992 7
1 55.464 991 8
1 55.334 990 9
1 55.205 989 10
1 55.075 988 11
1 54.946 987 12
1 17.661 503 496
1 17.620 502 497
1 17.579 501 498
1 17.538 500 499
1 17.496 499 500
1 17.455 498 501
1 17.415 497 502
1 17.374 496 503
1 17.333 495 504
Value Utility Formulation in Palm Oil Supply Chain Based on Risk,
The Netlogo output after the negotiation cycle.
the highest crosspoint between two utility graphs while running the Utility Netlogo Model. Permutations
W3 Utility
1 5.442
1 5.455
1 5.468
1 5.481
1 5.494
1 5.506
1 5.519
1 5.532
1 5.545
1 5.558
1 5.571
1 5.584
1 17.374
1 17.415
1 17.455
1 17.496
1 17.538
1 17.579
1 17.620
1 17.661
1 17.703

International Journal of Business and Economics Research 2014; 3(6-1): 57-64 63
The highest utility added value was 17.538, obtained for
iteration 499, with risk weight factor w1 = 499, investment
weight factor w2 = 500 and technology weight factor w3 = 1.
These weight factors apply to all 5 POSC actors.
3.4. Calculation of Maximum Selling Prices
The weight factor values from paragraph 3.3. were then
entered into the Optimization Netlogo Model to obtain the
individual product prices and added values for the respective
weight levels. Figure 7 shows the “world output” of the
Netlogo model after the negotiation cycle was completed at
iteration 720 where the iteration was stopped. The weight
levels for the risk, investment and the technology are shown
at the top. The selling prices changes in each iteration are
shown. The figure shows the calculated “should be” prices
and the relevant achieved added value (in ratio format) at
every iteration of price changes.
Figure 7. The Netlogo output after the negotiation cycle.
The result of running Optimization Netlogo Model using
these weight levels is shown in Table 5. The table shows the
gradual increase in the main products being sold along the
POSC. Selling prices before the models were run appears on
the first row, while the selling prices after the models were
run (= “the should be prices”) appear on the second row. The
selling prices show increases for the farmers, traders and
CPO factory, but decreases for the refinery and the
distributors. The total supply chain gain is reduced from
11,211 Rp/kg to 10,722 Rp/kg. The highest profit is obtained
by the refinery, CPO factory, group of farmers, traders, and
the distributor respectively. Although the selling price is
decreased, the refinery still gain the highest profit.
Table 5. The corresponding prices and profit ranks
Farmer Trader CPO Factory Refinery Distributor
Price (before) Rp/kg 1,209 1,423 1,162 12,000 12,420
Price (after) Rp/kg 1,397 1,500 6,753 11,889 12,119
Incr/Decr
16% 5% 481% -1% -2%
Profit rank
3 4 2 1 5
Change
188 77 5,592 (111) (301)
3. Conclusion
This study has managed to provide a utility added value
calculation computer model to obtain the maximum total
added value and for each of the POSC actors. The utility
model was a function of the risk, investment and technology
levels of each actor. The algorithm used to obtain maximum
value of the utility added value was based on the
mathematical permutation of the risk, investment and
technology factors, while changing the and weight levels in
iteration. While the factual figures might be different
considerably between the actors, we need to normalize their
figures to come up with feasible results. The business levels
among the POSC actors must be maintained to have fair flow
of materials as well as money. The balancing process was
initiated by optimizing the added value utility of each actor,
while considering the overall POSC business continuity.
The study indicated that the negotiation between all actors
in POSC need to consider overall supply chain sustainability

64 Syarif Hidayat and Nunung Nurhasanah: Added-Value Utility Formulation in Palm Oil Supply Chain Based on Risk, Investment and Technology
while conducting pairwise negotiation. Otherwise overall
sustainability of the supply chain may be endangered.
Many of the figures and values of the model were taken
from different sources and they might not represent the real
life values. The model still need to be tested to have a valid
value in real life.
The model may be extended to be used for other
commodity and different supply chain model with some
adjustments in the profitability calculation formula. The
model may also be extended to cover the most upstream of
the POSC namely the palm oil seed industry. The secondary
downstream industry may also include other products such as
margarine, soap, vitamin E and many other palm oil based
products.
Acknowledgements
The authors would like to express their gratitude to the
Higher Education General Directorate of the Education and
Culture Ministry of the Republic of Indonesia for providing
the financial support for the study.
References
[1] P.V. Preckel, A. Gray, M. Boehlje, and S. Kim, “Risk and value chains: Participant sharing of risk and rewards”. Journal on Chain and Network Services. 4(1), pp. 25-32. 2004.
[2] J.G.A.J. Van der Vorst, “Supply Chain Management: Theory and Practices. The Emerging World of Chains & Networks”, Elsevier, Hoofdstuk 2.1. Wageningen. 2004F. Bunte, “Pricing and Performance in Agri-Food Supply Chains First Edition”; 37-45. LEI, Wageningen University and Research Centre. Wageningen. 2006.
[3] A.M. Janvier-James, “A New Introduction to Supply Chains and Supply Chain Management: Definitions and Theories Perspective”. International Business Research Journal. 5(1), pp. 194-207. 2012.
[4] J.H. Trienekens, “Agricultural Value Chains in Developing Countries ; A Framework for Analysis”. Journal of International Food and Agribusiness Management Review. 14(2), pp. 51-82. 2011.
[5] [PKPN] Pusat Kebijakan Pendapatan Negara, “Kebijakan Restrukturisasi Tarif Bea Keluar Atas Kelapa Sawit, Minyak Sawit dan Produk Turunannya”. Badan Kebijakan Fiskal, Kementerian Keuangan. Jakarta. 2011.
[6] [CAO] Compliance Advisor / Ombudsman. “LAPORAN AUDIT Audit CAO atas IFC. C-I-R6-Y08-F096”. International Finance Corporation (IFC). Multilateral Investment Guarantee Agency (MIGA). Anggota Grup Bank Dunia. 2009.
[7] A. Mulyana, “Penetapan Harga Tandan Buah Segar Kelapa Sawit di Sumatera Selatan Dari Perspektif Pasar Monopoli Bilateral”. Jurusan Sosial Ekonomi PertanianFakultas
Pertanian dan Program Pascasarjana Universitas Sriwijaya. Palembang. 2004.
[8] D. Coltrain, D. Barton, M. Boland, “Value Added: Opportunities And Strategies. Arthur Capper Cooperative Center”. Department of Agricultural Economics. Kansas State University. Kansas City. 2000.
[9] T. Hines, “Supply Chain Strategies: Customer-driven and Customer-Focused”. Great Britain. Elsevier Butterworth. Heinemann. 2004.
[10] E. Harjanto, “Manajemen Produksi dan Operasi Edisi 2”. BPFE. Yogyakarta. 1999.
[11] W. Li, and Z. Yuanyuan, “A Game Analysis on Profit Distribution of Two-echelon Supply Chain with Principal and Subordinate”. School of Economics and Management, Jiangsu University of Science & Technology. Jiangsu. 2005.
[12] Bunte, F. “Pricing And Performance In Agri-Food Supply Chains First Edition”; 37-45. LEI, Wageningen University and Research Centre. Wageningen. 2006.
[13] D. Salvatore, “Managerial Economics in a Global Economy with Economic Applications Card”, 5th edition. South-Western. ISBN/ISSN :0-324-17187-0. Copenhagen. 2004.
[14] A.K. Goel, S.L. Gupta, S. Srinivasan, and B.K. Bha, “Integration of Supply Chain Management Using Multiagent System & Negotiation Model”. International Journal of Computer and Electrical Engineering, 3(3), pp 375-378. 2011.
[15] T.S. Atkin, and L.M. Rinehart, “Effect of Negotiation Practices on Suppliers and Customers”. Negotiation Journal January 2006. pp 47-65. 2006
[16] B. Palazzo, “An Introduction to Stakeholder Dialogue, Responsible Business” How to manage a CSR strategy successfully. John Wiley and Son; 17-42. Oxford. 2010.
[17] T. Juster, “Rethinking Utility Theory”. The Journal of Behavioral Economics, JAI Press Inc., vol. 19, Number 2, pp. 155-179, 1990.
[18] S. Hidayat, Marimin, A. Suryani, Sukardi, and M. Yani, “Model Penyeimbangan Nilai Tambah Berdasarkan Tingkat Risiko Pada Rantai Pasok Minyak Sawit”. PhD Thesis, Bogor Agricultural University (IPB). 2012.
[19] Suharjito, “Pemodelan Sistem Pendukung Pengambilan Keputusan Cerdas Manajemen Risiko Rantai Pasok Produksi/Komoditi Jagung”. PhD Thesis, Bogor Agricultural University (IPB). 2011.
[20] S. Awal, “Strategi Penyediaan Karbohidrat Bersumber dari Ubi Kayu”. PhD Thesis . Bogor Agricultural University (IPB). 2012.
[21] M. Wooldridge, and N.R. Jennings, “Intelligent agents : theory and practice”. Knowledge Engineering Review 10. London. 1995
[22] S. Tisue, and U. Wilenski, “NetLogo: Design and Implementation of a Multi-Agent Modeling Environment”. Center for Connected Learning and Computer-Based Modeling Northwestern University, Evanston, Illinois. 2006.