adapting agriculture to climate change and variability in chitwan: long-term trends and farmers’...
TRANSCRIPT
FULL-LENGTH RESEARCH ARTICLE
Adapting Agriculture to Climate Change and Variabilityin Chitwan: Long-Term Trends and Farmers’ Perceptions
Bibek Paudel • Bharat Sharma Acharya •
Rajan Ghimire • Khem Raj Dahal •
Prakriti Bista
Received: 20 August 2013 / Accepted: 31 March 2014 / Published online: 16 May 2014
� NAAS (National Academy of Agricultural Sciences) 2014
Abstract A study was conducted to detect climate change and variability using climate records and farmers’ perceptions
in Chitwan, Nepal, and to evaluate climatic impacts on small-holder agriculture. Forty years of climatic data (1968–2007)
from a weather station at the National Maize Research Program, Rampur, and 15 years of rice, maize, and wheat
productivity data (1992–2008) from the District Agriculture Development Office, Chitwan were collected and analyzed
using non-parametric Mann–Kendall test and regression analysis. Questionnaire survey was conducted on sixty randomly
selected households of Chitwan to understand farmers’ perceptions and adaptations in response to changing climate and
variability. Occurrence of extreme events and disasters was cross-validated with DesInventer, a disaster database available
for Nepal for 1971–2007. There has been no clear trend in the annual and seasonal rainfall of Chitwan during 1970–2007.
However, variation in temperature and a significant upward trend for both minimum (p = 0.014) and maximum tem-
perature (p = 0.018) was observed. The occurrence of extreme events and increased variability in temperature has
increased the vulnerability of crops to biotic and abiotic stresses and altered the timing of agricultural operations; thereby
affecting crop production. Despite growing attempts of local communities to adapt to changing climate and variability,
further planned adaptation aimed at a larger scale and longer duration is necessary to sustain the livelihood security of
small-holder farmers.
Keywords Climate change � Climate variability �Adaptation � Small-holder agriculture � Farmers’ perception
Introduction
Climate change and climatic variability present an
increasing challenge for developing countries such as
Nepal. Over the last century, the earth’s surface tempera-
ture has increased by about 0.74 �C on a global average.
The mean global temperature is projected to increase by
1.8–4 �C by the end of this century, depending upon the
scenario of greenhouse gas emissions [16].
According to IPCC [16], climate change is an
unequivocal phenomenon and refers to ‘‘any change in
climate over time, whether due to natural variability or as
a result of human activity,’’ whereas climatic variability
refers to ‘‘variations in the mean state and other statistics
(such as standard deviations, statistics of extremes, etc.) of
the climate on all temporal and spatial scales beyond that
individual weather events’’. Climate change and climate
B. Paudel � B. S. Acharya � R. Ghimire � K. R. Dahal � P. Bista
Institute of Agriculture and Animal Sciences,
Tribhuvan University, Rampur, Nepal
B. Paudel
Department of Applied Economics, Utah State University,
Logan, UT, USA
B. S. Acharya (&)
Department of Natural Resource Ecology and Management,
Oklahoma State University, 008C Agricultural Hall,
Stillwater, OK 74078, USA
e-mail: [email protected];
R. Ghimire
Columbia Basin Agricultural Research Center,
Oregon State University, Pendleton, OR, USA
P. Bista
Department of Plant Sciences, University of Wyoming,
Laramie, WY, USA
123
Agric Res (June 2014) 3(2):165–174
DOI 10.1007/s40003-014-0103-0
variability affect agriculture and the livelihood of farming
communities [16, 30, 32]. Direct effects of climate change
in agriculture result from an increase in ambient CO2
concentration and concomitant rise in temperature. In
addition, it affects crop and livestock production through
changes in insect-pests and disease incidence, soil meta-
bolic process, and soil water content [21, 35]. Rise in mean
annual temperature and increase in extreme weather events
affect the growing seasons of major crops, impose biotic,
and abiotic stresses on the crops, and alter soil nutrient
cycling [3, 7, 14, 31]. In addition, climate change and
variability affect income distribution and ultimately the
livelihood security of farming communities [20].
Climate change has been shown to drive positive effects
in some ecosystems [19, 22, 28]. Polley [28] reported that
increased CO2 levels can improve water-use efficiency of
crops by reducing evapotranspiration. Rise in temperature
favors crop production at higher altitudes allowing faster
cycling of soil organic matter (SOM) and nutrients, and
better development of roots. Similarly, Khanal [19] pointed
out the possibility of expanding and diversifying agricul-
ture with increasing temperature at higher altitudes. How-
ever, there are considerable uncertainties regarding
physiological responses of crops to an altered climate [30].
Nepal is a landlocked country surrounded by India on
the east, west, and south, and the Tibetan region of China
to the North. It encompasses a total area of 1, 47,181 km2
with an approximate population of 23.4 million. The
country is ecologically divided into three regions: Terai
(lowland), hills (mid hill), and mountains (upland). The
physiographic characteristics of different regions are pre-
sented in Table 1. Agriculture is the mainstay of the
Nepalese economy and accounts for 32 % of gross
domestic product [39]. Although eighty percent of the total
population depends on agriculture, the subsistence and
traditional farming makes the agricultural sector highly
vulnerable to the effects of climate change and variability.
In Nepal, rise in temperature by 1.8 �C was recorded
during 1975–2006 [22]. The average temperature is pro-
jected to increase by 5 �C over the next century if the
temperature continues to rise at the same rate. This would
have cascading impacts on small-holder agriculture and
natural resources [26]. Significant effects of climate change
have already been experienced by local communities [22,
27] where farmers are struggling to cope with increasing
adversities associated with the changes [15]. A large body
of literature points out the impacts of climate change in
different parts of Nepal (Table 2). Owing to limited alter-
natives for livelihood security, impacts are more pro-
nounced in small-holder agriculture where subsistence
farming provides the principal source of income. In the
absence of a national inventory for climate and food pro-
duction systems, alongside a strong research base on the
impacts of climate change on agriculture, most of the
published and unpublished information from Nepal to date
are primarily based on farmers’ observations and assess-
ments, or extrapolation from experiences of communities
from similar ecological regions [10, 11, 23, 29]. The goal
of this study was to detect climate change and variability in
Chitwan using climate records and farmers’ perceptions,
evaluate change in crop production and farming practices
in two locations of Chitwan, and study the relationship
between climate change and variability and crop produc-
tion in small-holder agriculture.
Table 1 Physiographic characteristics of different regions in Nepal (Adapted and modified from [1, 23] )
Region Altitude (meter
above sea level)
Percent of total
land area
Geology and soil Climate Temperature
(oC)
Terai 70 to 610 23 Gentle slope and recently deposited alluvium, fine
textured soils, highly fertile land
Humid tropical [ 25
Hills 610 to 4877 42 Sandstone, siltstone, steep slopes, course textured
soils, Quartzite in coniferous forest
Subtropical to subalpine 10 to 25
Mountains 4877 to 8848 35 Limestone and shale, stony soils Alpine to arctic \ 0 to 5
Table 2 Evidence of impacts of climate change and variability on livelihoods of local communities in Chitwan, Nepal
S. no. Study method Evidence of climate
change and variability
Period
(years)
Observed response and adaptation References
1 Field survey and results
from project reports
Flood, landslides and
crop failure
1966 - 2006 Transition from irrigated to dryland crops [11]
2 Review Soaring temperature,
flood and crop failure
– Crop production, crop rotations, and
varietal adjustments
[22]
3 Field survey and observations Flood and loss of crops 2007–2008 Change in cropping system, adoption of
Sloping Agriculture Land Technology
in the affected area
[10]
166 Agric Res (June 2014) 3(2):165–174
123
Materials and Methods
Study Sites
The study was conducted in Chitwan district, Nepal during
December 2007 to September 2008. The district is spread
across an area of 223,839 ha, and is inhabited by 472,048
people (male 50 % and female 50 %). Total number of
households for the district is 92,863 with an average
household size in the district being five persons per family
[5]. The study area was selected owing to the availability of
long-term ([15 years) climate and crop productivity data.
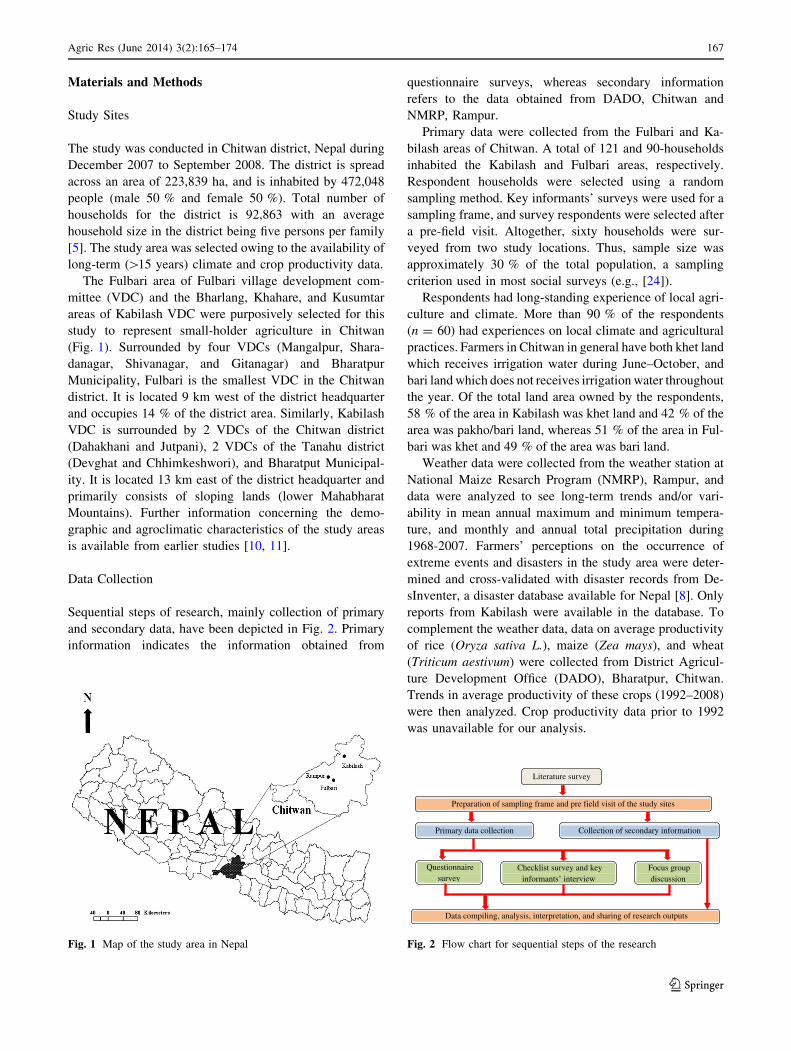
The Fulbari area of Fulbari village development com-
mittee (VDC) and the Bharlang, Khahare, and Kusumtar
areas of Kabilash VDC were purposively selected for this
study to represent small-holder agriculture in Chitwan
(Fig. 1). Surrounded by four VDCs (Mangalpur, Shara-
danagar, Shivanagar, and Gitanagar) and Bharatpur
Municipality, Fulbari is the smallest VDC in the Chitwan
district. It is located 9 km west of the district headquarter
and occupies 14 % of the district area. Similarly, Kabilash
VDC is surrounded by 2 VDCs of the Chitwan district
(Dahakhani and Jutpani), 2 VDCs of the Tanahu district
(Devghat and Chhimkeshwori), and Bharatput Municipal-
ity. It is located 13 km east of the district headquarter and
primarily consists of sloping lands (lower Mahabharat
Mountains). Further information concerning the demo-
graphic and agroclimatic characteristics of the study areas
is available from earlier studies [10, 11].
Data Collection
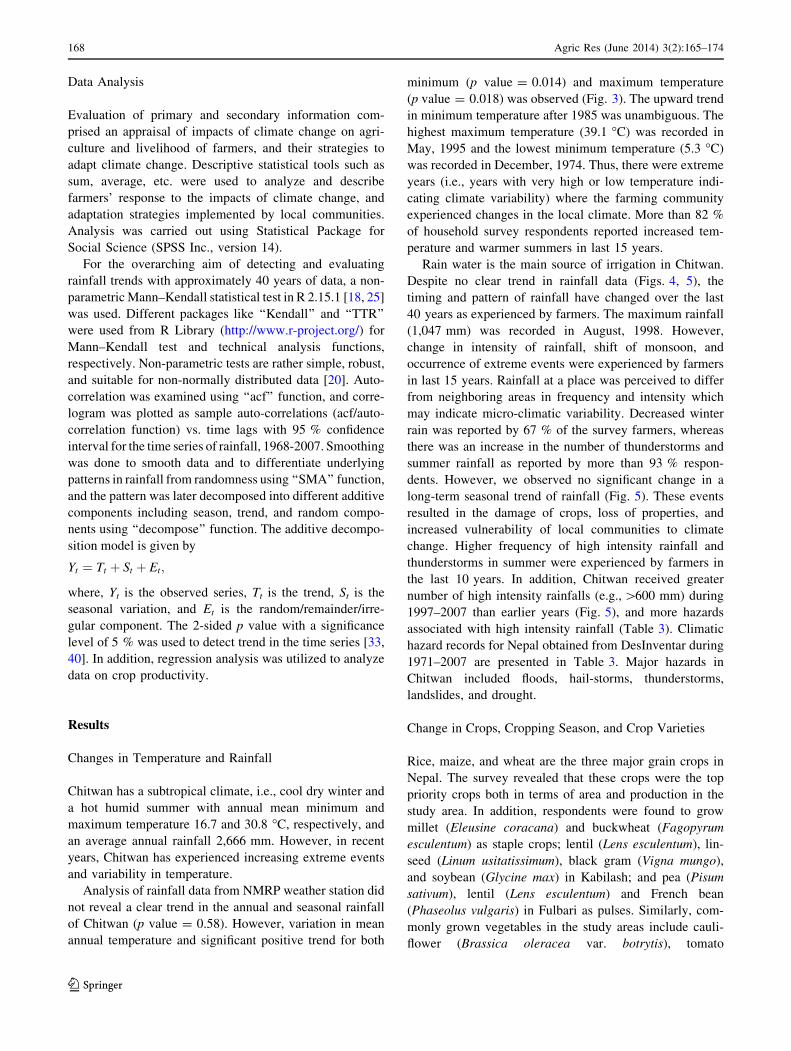
Sequential steps of research, mainly collection of primary
and secondary data, have been depicted in Fig. 2. Primary
information indicates the information obtained from
questionnaire surveys, whereas secondary information
refers to the data obtained from DADO, Chitwan and
NMRP, Rampur.
Primary data were collected from the Fulbari and Ka-
bilash areas of Chitwan. A total of 121 and 90-households
inhabited the Kabilash and Fulbari areas, respectively.
Respondent households were selected using a random
sampling method. Key informants’ surveys were used for a
sampling frame, and survey respondents were selected after
a pre-field visit. Altogether, sixty households were sur-
veyed from two study locations. Thus, sample size was
approximately 30 % of the total population, a sampling
criterion used in most social surveys (e.g., [24]).
Respondents had long-standing experience of local agri-
culture and climate. More than 90 % of the respondents
(n = 60) had experiences on local climate and agricultural
practices. Farmers in Chitwan in general have both khet land
which receives irrigation water during June–October, and
bari land which does not receives irrigation water throughout
the year. Of the total land area owned by the respondents,
58 % of the area in Kabilash was khet land and 42 % of the
area was pakho/bari land, whereas 51 % of the area in Ful-
bari was khet and 49 % of the area was bari land.
Weather data were collected from the weather station at
National Maize Resarch Program (NMRP), Rampur, and
data were analyzed to see long-term trends and/or vari-
ability in mean annual maximum and minimum tempera-
ture, and monthly and annual total precipitation during
1968-2007. Farmers’ perceptions on the occurrence of
extreme events and disasters in the study area were deter-
mined and cross-validated with disaster records from De-
sInventer, a disaster database available for Nepal [8]. Only
reports from Kabilash were available in the database. To
complement the weather data, data on average productivity
of rice (Oryza sativa L.), maize (Zea mays), and wheat
(Triticum aestivum) were collected from District Agricul-
ture Development Office (DADO), Bharatpur, Chitwan.
Trends in average productivity of these crops (1992–2008)
were then analyzed. Crop productivity data prior to 1992
was unavailable for our analysis.
Fig. 1 Map of the study area in Nepal
Literature survey
Primary data collection Collection of secondary information
Questionnaire survey
Preparation of sampling frame and pre field visit of the study sites
Checklist survey and key informants’ interview
Focus group discussion
Data compiling, analysis, interpretation, and sharing of research outputs
Fig. 2 Flow chart for sequential steps of the research
Agric Res (June 2014) 3(2):165–174 167
123
Data Analysis
Evaluation of primary and secondary information com-
prised an appraisal of impacts of climate change on agri-
culture and livelihood of farmers, and their strategies to
adapt climate change. Descriptive statistical tools such as
sum, average, etc. were used to analyze and describe
farmers’ response to the impacts of climate change, and
adaptation strategies implemented by local communities.
Analysis was carried out using Statistical Package for
Social Science (SPSS Inc., version 14).
For the overarching aim of detecting and evaluating
rainfall trends with approximately 40 years of data, a non-
parametric Mann–Kendall statistical test in R 2.15.1 [18, 25]
was used. Different packages like ‘‘Kendall’’ and ‘‘TTR’’
were used from R Library (http://www.r-project.org/) for
Mann–Kendall test and technical analysis functions,
respectively. Non-parametric tests are rather simple, robust,
and suitable for non-normally distributed data [20]. Auto-
correlation was examined using ‘‘acf’’ function, and corre-
logram was plotted as sample auto-correlations (acf/auto-
correlation function) vs. time lags with 95 % confidence
interval for the time series of rainfall, 1968-2007. Smoothing
was done to smooth data and to differentiate underlying
patterns in rainfall from randomness using ‘‘SMA’’ function,
and the pattern was later decomposed into different additive
components including season, trend, and random compo-
nents using ‘‘decompose’’ function. The additive decompo-
sition model is given by
Yt ¼ Tt þ St þ Et;
where, Yt is the observed series, Tt is the trend, St is the
seasonal variation, and Et is the random/remainder/irre-
gular component. The 2-sided p value with a significance
level of 5 % was used to detect trend in the time series [33,
40]. In addition, regression analysis was utilized to analyze
data on crop productivity.
Results
Changes in Temperature and Rainfall
Chitwan has a subtropical climate, i.e., cool dry winter and
a hot humid summer with annual mean minimum and
maximum temperature 16.7 and 30.8 �C, respectively, and
an average annual rainfall 2,666 mm. However, in recent
years, Chitwan has experienced increasing extreme events
and variability in temperature.
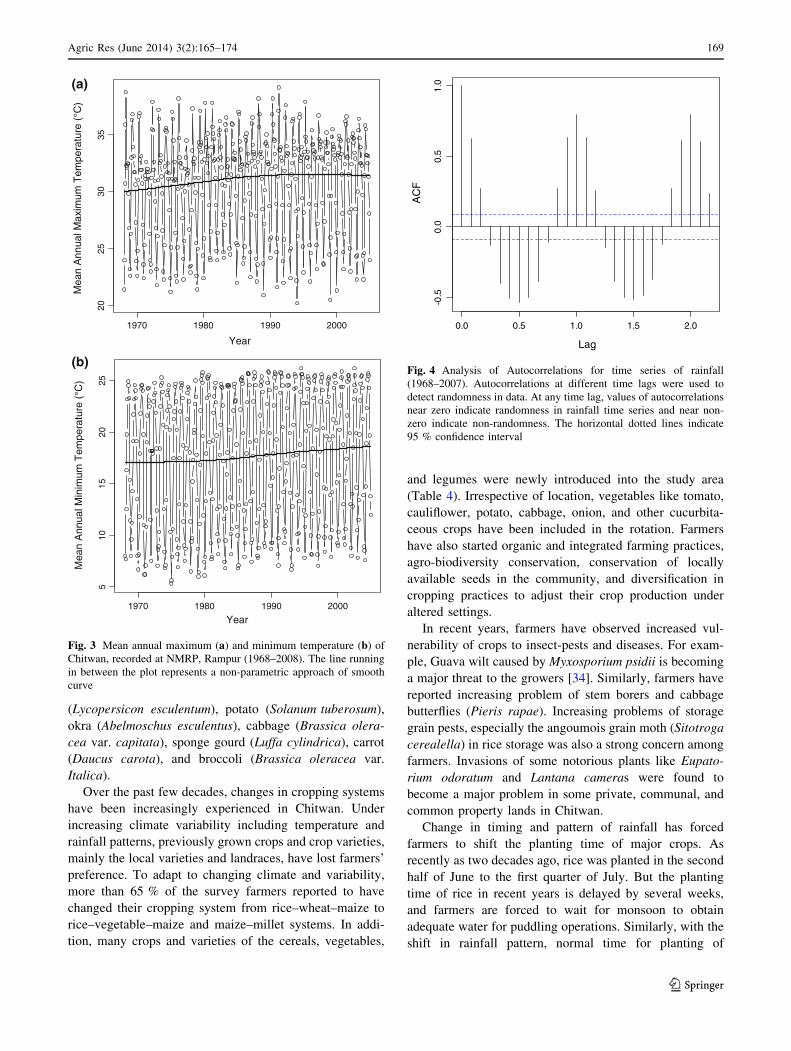
Analysis of rainfall data from NMRP weather station did
not reveal a clear trend in the annual and seasonal rainfall
of Chitwan (p value = 0.58). However, variation in mean
annual temperature and significant positive trend for both
minimum (p value = 0.014) and maximum temperature
(p value = 0.018) was observed (Fig. 3). The upward trend
in minimum temperature after 1985 was unambiguous. The
highest maximum temperature (39.1 �C) was recorded in
May, 1995 and the lowest minimum temperature (5.3 �C)
was recorded in December, 1974. Thus, there were extreme
years (i.e., years with very high or low temperature indi-
cating climate variability) where the farming community
experienced changes in the local climate. More than 82 %
of household survey respondents reported increased tem-
perature and warmer summers in last 15 years.
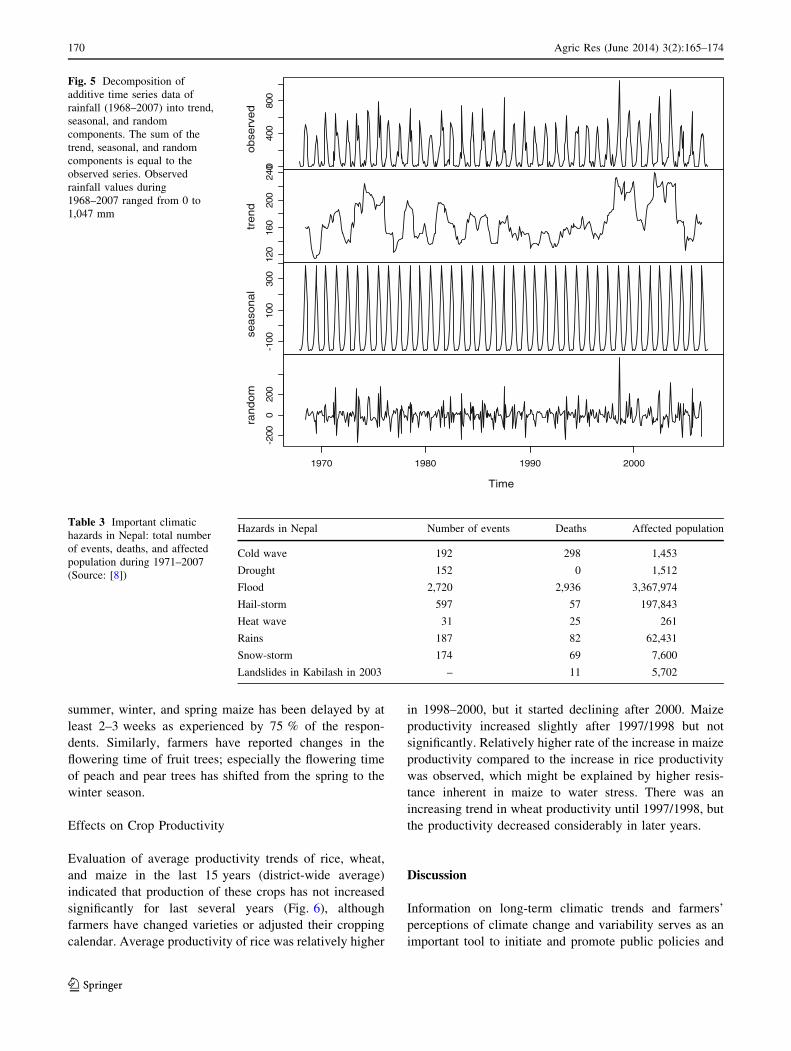
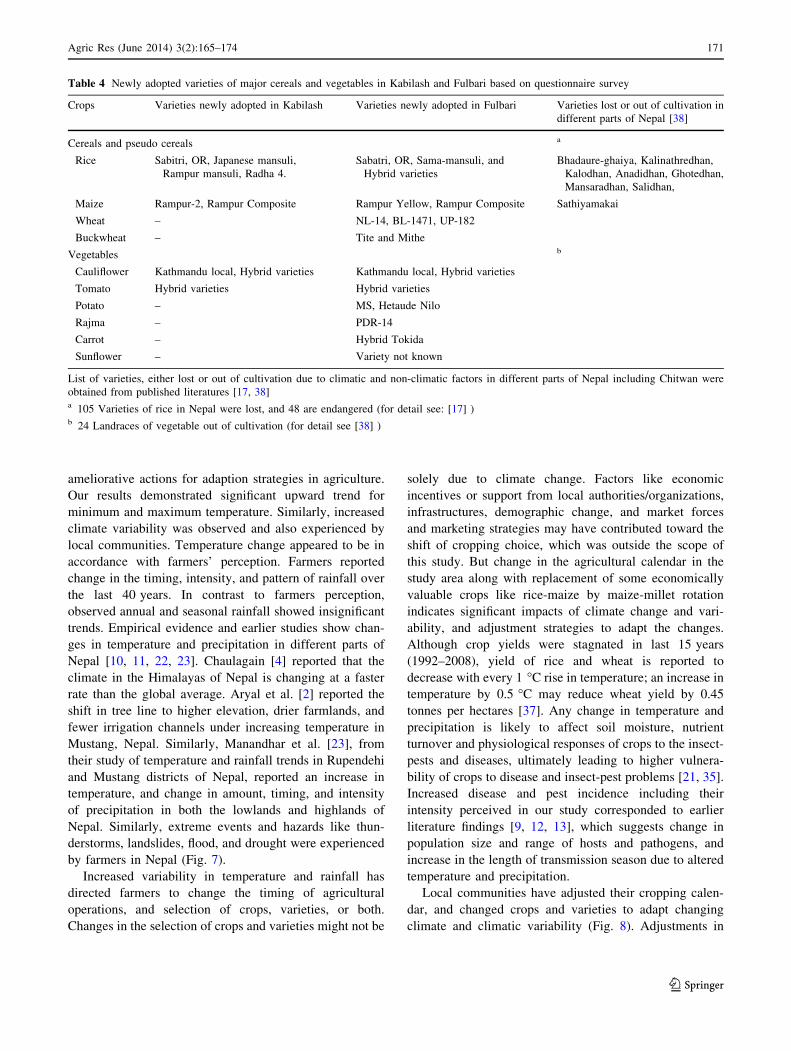
Rain water is the main source of irrigation in Chitwan.
Despite no clear trend in rainfall data (Figs. 4, 5), the
timing and pattern of rainfall have changed over the last
40 years as experienced by farmers. The maximum rainfall
(1,047 mm) was recorded in August, 1998. However,
change in intensity of rainfall, shift of monsoon, and
occurrence of extreme events were experienced by farmers
in last 15 years. Rainfall at a place was perceived to differ
from neighboring areas in frequency and intensity which
may indicate micro-climatic variability. Decreased winter
rain was reported by 67 % of the survey farmers, whereas
there was an increase in the number of thunderstorms and
summer rainfall as reported by more than 93 % respon-
dents. However, we observed no significant change in a
long-term seasonal trend of rainfall (Fig. 5). These events
resulted in the damage of crops, loss of properties, and
increased vulnerability of local communities to climate
change. Higher frequency of high intensity rainfall and
thunderstorms in summer were experienced by farmers in
the last 10 years. In addition, Chitwan received greater
number of high intensity rainfalls (e.g., [600 mm) during
1997–2007 than earlier years (Fig. 5), and more hazards
associated with high intensity rainfall (Table 3). Climatic
hazard records for Nepal obtained from DesInventar during
1971–2007 are presented in Table 3. Major hazards in
Chitwan included floods, hail-storms, thunderstorms,
landslides, and drought.
Change in Crops, Cropping Season, and Crop Varieties
Rice, maize, and wheat are the three major grain crops in
Nepal. The survey revealed that these crops were the top
priority crops both in terms of area and production in the
study area. In addition, respondents were found to grow
millet (Eleusine coracana) and buckwheat (Fagopyrum
esculentum) as staple crops; lentil (Lens esculentum), lin-
seed (Linum usitatissimum), black gram (Vigna mungo),
and soybean (Glycine max) in Kabilash; and pea (Pisum
sativum), lentil (Lens esculentum) and French bean
(Phaseolus vulgaris) in Fulbari as pulses. Similarly, com-
monly grown vegetables in the study areas include cauli-
flower (Brassica oleracea var. botrytis), tomato
168 Agric Res (June 2014) 3(2):165–174
123
(Lycopersicon esculentum), potato (Solanum tuberosum),
okra (Abelmoschus esculentus), cabbage (Brassica olera-
cea var. capitata), sponge gourd (Luffa cylindrica), carrot
(Daucus carota), and broccoli (Brassica oleracea var.
Italica).
Over the past few decades, changes in cropping systems
have been increasingly experienced in Chitwan. Under
increasing climate variability including temperature and
rainfall patterns, previously grown crops and crop varieties,
mainly the local varieties and landraces, have lost farmers’
preference. To adapt to changing climate and variability,
more than 65 % of the survey farmers reported to have
changed their cropping system from rice–wheat–maize to
rice–vegetable–maize and maize–millet systems. In addi-
tion, many crops and varieties of the cereals, vegetables,
and legumes were newly introduced into the study area
(Table 4). Irrespective of location, vegetables like tomato,
cauliflower, potato, cabbage, onion, and other cucurbita-
ceous crops have been included in the rotation. Farmers
have also started organic and integrated farming practices,
agro-biodiversity conservation, conservation of locally
available seeds in the community, and diversification in
cropping practices to adjust their crop production under
altered settings.
In recent years, farmers have observed increased vul-
nerability of crops to insect-pests and diseases. For exam-
ple, Guava wilt caused by Myxosporium psidii is becoming
a major threat to the growers [34]. Similarly, farmers have
reported increasing problem of stem borers and cabbage
butterflies (Pieris rapae). Increasing problems of storage
grain pests, especially the angoumois grain moth (Sitotroga
cerealella) in rice storage was also a strong concern among
farmers. Invasions of some notorious plants like Eupato-
rium odoratum and Lantana cameras were found to
become a major problem in some private, communal, and
common property lands in Chitwan.
Change in timing and pattern of rainfall has forced
farmers to shift the planting time of major crops. As
recently as two decades ago, rice was planted in the second
half of June to the first quarter of July. But the planting
time of rice in recent years is delayed by several weeks,
and farmers are forced to wait for monsoon to obtain
adequate water for puddling operations. Similarly, with the
shift in rainfall pattern, normal time for planting of
Year
Mea
n A
nnua
l Max
imum
Tem
pera
ture
(°C
)
2025
3035
(a)
(b)
Year
Mea
n A
nnua
l Min
imum
Tem
pera
ture
(°C
)
1970 1980 1990 2000
1970 1980 1990 2000
510
1520
25
Fig. 3 Mean annual maximum (a) and minimum temperature (b) of
Chitwan, recorded at NMRP, Rampur (1968–2008). The line running
in between the plot represents a non-parametric approach of smooth
curve
0.0 0.5 1.0 1.5 2.0
-0.5
0.0
0.5
1.0
Lag
AC
F
Fig. 4 Analysis of Autocorrelations for time series of rainfall
(1968–2007). Autocorrelations at different time lags were used to
detect randomness in data. At any time lag, values of autocorrelations
near zero indicate randomness in rainfall time series and near non-
zero indicate non-randomness. The horizontal dotted lines indicate
95 % confidence interval
Agric Res (June 2014) 3(2):165–174 169
123
summer, winter, and spring maize has been delayed by at
least 2–3 weeks as experienced by 75 % of the respon-
dents. Similarly, farmers have reported changes in the
flowering time of fruit trees; especially the flowering time
of peach and pear trees has shifted from the spring to the
winter season.
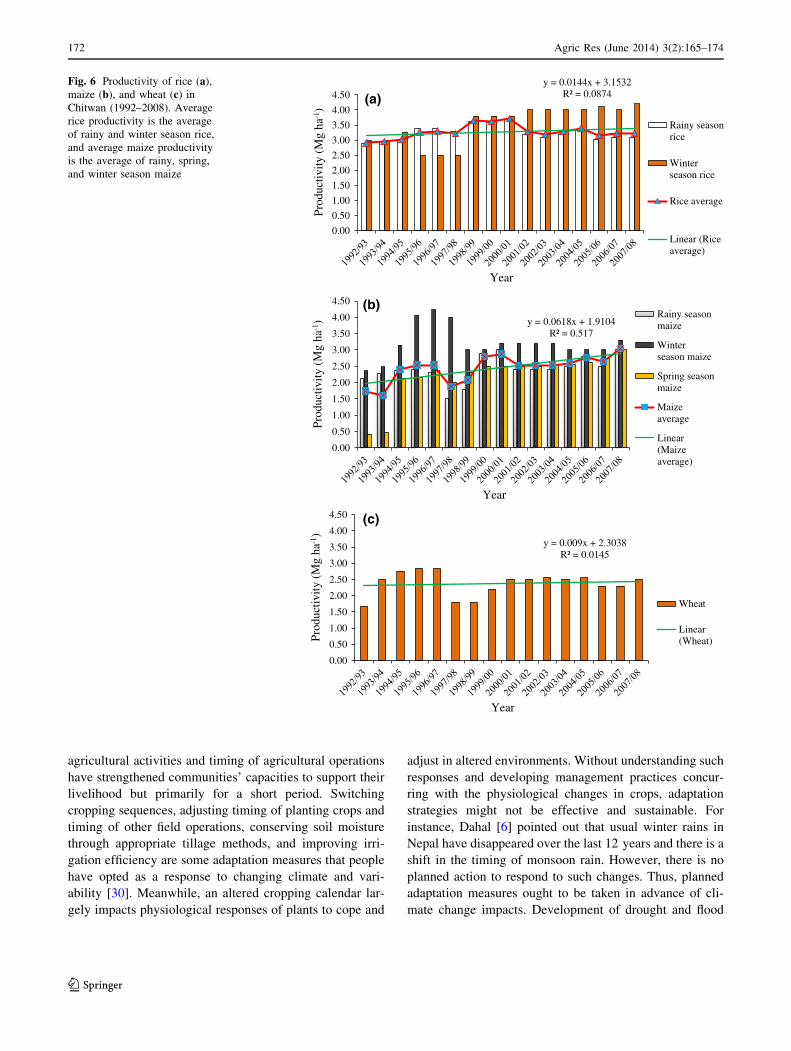
Effects on Crop Productivity
Evaluation of average productivity trends of rice, wheat,
and maize in the last 15 years (district-wide average)
indicated that production of these crops has not increased
significantly for last several years (Fig. 6), although
farmers have changed varieties or adjusted their cropping
calendar. Average productivity of rice was relatively higher
in 1998–2000, but it started declining after 2000. Maize
productivity increased slightly after 1997/1998 but not
significantly. Relatively higher rate of the increase in maize
productivity compared to the increase in rice productivity
was observed, which might be explained by higher resis-
tance inherent in maize to water stress. There was an
increasing trend in wheat productivity until 1997/1998, but
the productivity decreased considerably in later years.
Discussion
Information on long-term climatic trends and farmers’
perceptions of climate change and variability serves as an
important tool to initiate and promote public policies and
040
080
0
ob
serv
ed
120
160
200
240
tre
nd
-100
100
300
sea
son
al
-200
020
0
1970 1980 1990 2000
ran
do
m
Time
Fig. 5 Decomposition of
additive time series data of
rainfall (1968–2007) into trend,
seasonal, and random
components. The sum of the
trend, seasonal, and random
components is equal to the
observed series. Observed
rainfall values during
1968–2007 ranged from 0 to
1,047 mm
Table 3 Important climatic
hazards in Nepal: total number
of events, deaths, and affected
population during 1971–2007
(Source: [8])
Hazards in Nepal Number of events Deaths Affected population
Cold wave 192 298 1,453
Drought 152 0 1,512
Flood 2,720 2,936 3,367,974
Hail-storm 597 57 197,843
Heat wave 31 25 261
Rains 187 82 62,431
Snow-storm 174 69 7,600
Landslides in Kabilash in 2003 – 11 5,702
170 Agric Res (June 2014) 3(2):165–174
123
ameliorative actions for adaption strategies in agriculture.
Our results demonstrated significant upward trend for
minimum and maximum temperature. Similarly, increased
climate variability was observed and also experienced by
local communities. Temperature change appeared to be in
accordance with farmers’ perception. Farmers reported
change in the timing, intensity, and pattern of rainfall over
the last 40 years. In contrast to farmers perception,
observed annual and seasonal rainfall showed insignificant
trends. Empirical evidence and earlier studies show chan-
ges in temperature and precipitation in different parts of
Nepal [10, 11, 22, 23]. Chaulagain [4] reported that the
climate in the Himalayas of Nepal is changing at a faster
rate than the global average. Aryal et al. [2] reported the
shift in tree line to higher elevation, drier farmlands, and
fewer irrigation channels under increasing temperature in
Mustang, Nepal. Similarly, Manandhar et al. [23], from
their study of temperature and rainfall trends in Rupendehi
and Mustang districts of Nepal, reported an increase in
temperature, and change in amount, timing, and intensity
of precipitation in both the lowlands and highlands of
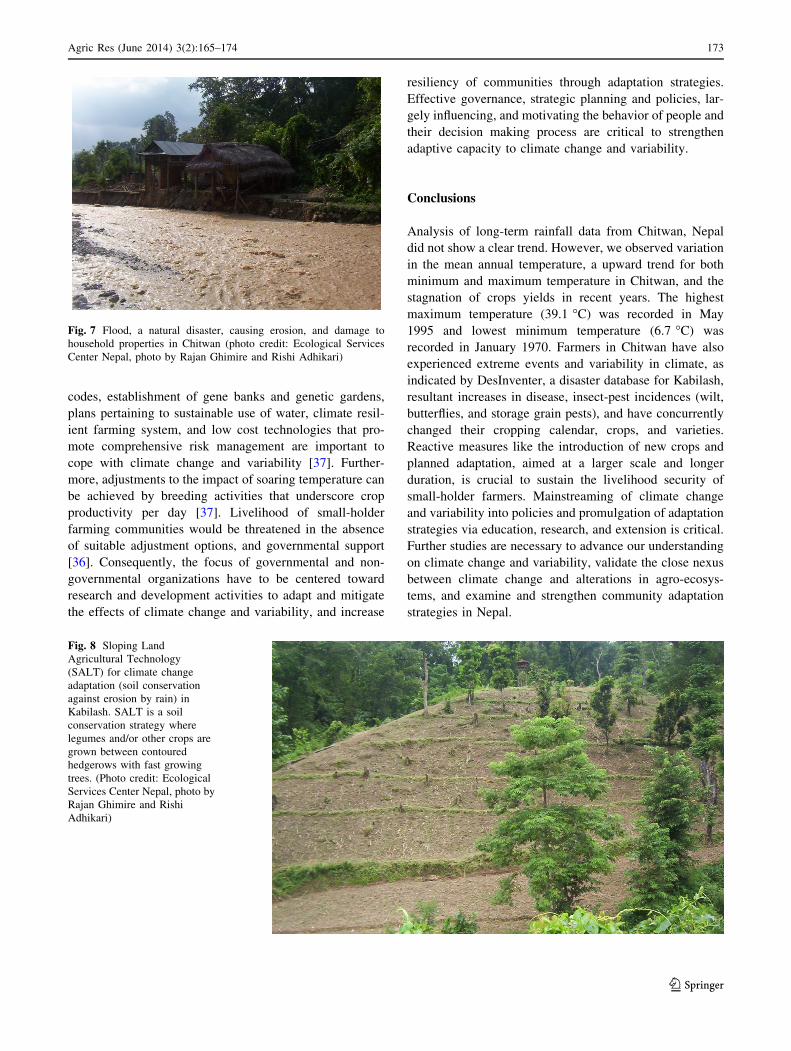
Nepal. Similarly, extreme events and hazards like thun-
derstorms, landslides, flood, and drought were experienced
by farmers in Nepal (Fig. 7).
Increased variability in temperature and rainfall has
directed farmers to change the timing of agricultural
operations, and selection of crops, varieties, or both.
Changes in the selection of crops and varieties might not be
solely due to climate change. Factors like economic
incentives or support from local authorities/organizations,
infrastructures, demographic change, and market forces
and marketing strategies may have contributed toward the
shift of cropping choice, which was outside the scope of
this study. But change in the agricultural calendar in the
study area along with replacement of some economically
valuable crops like rice-maize by maize-millet rotation
indicates significant impacts of climate change and vari-
ability, and adjustment strategies to adapt the changes.
Although crop yields were stagnated in last 15 years
(1992–2008), yield of rice and wheat is reported to
decrease with every 1 �C rise in temperature; an increase in
temperature by 0.5 �C may reduce wheat yield by 0.45
tonnes per hectares [37]. Any change in temperature and
precipitation is likely to affect soil moisture, nutrient
turnover and physiological responses of crops to the insect-
pests and diseases, ultimately leading to higher vulnera-
bility of crops to disease and insect-pest problems [21, 35].
Increased disease and pest incidence including their
intensity perceived in our study corresponded to earlier
literature findings [9, 12, 13], which suggests change in
population size and range of hosts and pathogens, and
increase in the length of transmission season due to altered
temperature and precipitation.
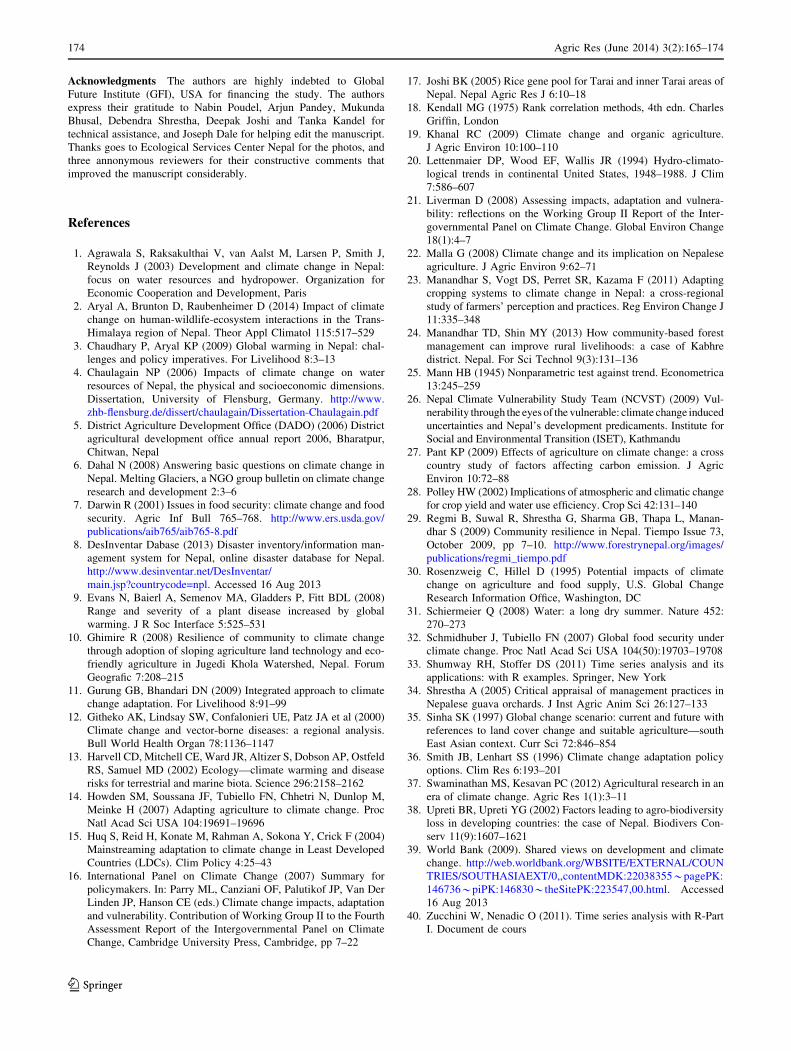
Local communities have adjusted their cropping calen-
dar, and changed crops and varieties to adapt changing
climate and climatic variability (Fig. 8). Adjustments in
Table 4 Newly adopted varieties of major cereals and vegetables in Kabilash and Fulbari based on questionnaire survey
Crops Varieties newly adopted in Kabilash Varieties newly adopted in Fulbari Varieties lost or out of cultivation in
different parts of Nepal [38]
Cereals and pseudo cereals a
Rice Sabitri, OR, Japanese mansuli,
Rampur mansuli, Radha 4.
Sabatri, OR, Sama-mansuli, and
Hybrid varieties
Bhadaure-ghaiya, Kalinathredhan,
Kalodhan, Anadidhan, Ghotedhan,
Mansaradhan, Salidhan,
Maize Rampur-2, Rampur Composite Rampur Yellow, Rampur Composite Sathiyamakai
Wheat – NL-14, BL-1471, UP-182
Buckwheat – Tite and Mithe
Vegetables b
Cauliflower Kathmandu local, Hybrid varieties Kathmandu local, Hybrid varieties
Tomato Hybrid varieties Hybrid varieties
Potato – MS, Hetaude Nilo
Rajma – PDR-14
Carrot – Hybrid Tokida
Sunflower – Variety not known
List of varieties, either lost or out of cultivation due to climatic and non-climatic factors in different parts of Nepal including Chitwan were
obtained from published literatures [17, 38]a 105 Varieties of rice in Nepal were lost, and 48 are endangered (for detail see: [17] )b 24 Landraces of vegetable out of cultivation (for detail see [38] )
Agric Res (June 2014) 3(2):165–174 171
123
agricultural activities and timing of agricultural operations
have strengthened communities’ capacities to support their
livelihood but primarily for a short period. Switching
cropping sequences, adjusting timing of planting crops and
timing of other field operations, conserving soil moisture
through appropriate tillage methods, and improving irri-
gation efficiency are some adaptation measures that people
have opted as a response to changing climate and vari-
ability [30]. Meanwhile, an altered cropping calendar lar-
gely impacts physiological responses of plants to cope and
adjust in altered environments. Without understanding such
responses and developing management practices concur-
ring with the physiological changes in crops, adaptation
strategies might not be effective and sustainable. For
instance, Dahal [6] pointed out that usual winter rains in
Nepal have disappeared over the last 12 years and there is a
shift in the timing of monsoon rain. However, there is no
planned action to respond to such changes. Thus, planned
adaptation measures ought to be taken in advance of cli-
mate change impacts. Development of drought and flood
y = 0.0144x + 3.1532R² = 0.0874
0.00
0.50
1.00
1.50
2.00
2.50
3.00
3.50
4.00
4.50
Prod
uctiv
ity (
Mg
ha-1
)
Year
Rainy seasonrice
Winterseason rice
Rice average
Linear (Riceaverage)
y = 0.0618x + 1.9104R² = 0.517
0.00
0.50
1.00
1.50
2.00
2.50
3.00
3.50
4.00
4.50
Prod
uctiv
ity (
Mg
ha-1
)
Year
Rainy seasonmaize
Winterseason maize
Spring seasonmaize
Maizeaverage
Linear(Maizeaverage)
y = 0.009x + 2.3038R² = 0.0145
0.00
0.50
1.00
1.50
2.00
2.50
3.00
3.50
4.00
4.50
Prod
uctiv
ity (
Mg
ha-1
)
Year
Wheat
Linear(Wheat)
(a)
(b)
(c)
Fig. 6 Productivity of rice (a),
maize (b), and wheat (c) in
Chitwan (1992–2008). Average
rice productivity is the average
of rainy and winter season rice,
and average maize productivity
is the average of rainy, spring,
and winter season maize
172 Agric Res (June 2014) 3(2):165–174
123
codes, establishment of gene banks and genetic gardens,
plans pertaining to sustainable use of water, climate resil-
ient farming system, and low cost technologies that pro-
mote comprehensive risk management are important to
cope with climate change and variability [37]. Further-
more, adjustments to the impact of soaring temperature can
be achieved by breeding activities that underscore crop
productivity per day [37]. Livelihood of small-holder
farming communities would be threatened in the absence
of suitable adjustment options, and governmental support
[36]. Consequently, the focus of governmental and non-
governmental organizations have to be centered toward
research and development activities to adapt and mitigate
the effects of climate change and variability, and increase
resiliency of communities through adaptation strategies.
Effective governance, strategic planning and policies, lar-
gely influencing, and motivating the behavior of people and
their decision making process are critical to strengthen
adaptive capacity to climate change and variability.
Conclusions
Analysis of long-term rainfall data from Chitwan, Nepal
did not show a clear trend. However, we observed variation
in the mean annual temperature, a upward trend for both
minimum and maximum temperature in Chitwan, and the
stagnation of crops yields in recent years. The highest
maximum temperature (39.1 �C) was recorded in May
1995 and lowest minimum temperature (6.7 �C) was
recorded in January 1970. Farmers in Chitwan have also
experienced extreme events and variability in climate, as
indicated by DesInventer, a disaster database for Kabilash,
resultant increases in disease, insect-pest incidences (wilt,
butterflies, and storage grain pests), and have concurrently
changed their cropping calendar, crops, and varieties.
Reactive measures like the introduction of new crops and
planned adaptation, aimed at a larger scale and longer
duration, is crucial to sustain the livelihood security of
small-holder farmers. Mainstreaming of climate change
and variability into policies and promulgation of adaptation
strategies via education, research, and extension is critical.
Further studies are necessary to advance our understanding
on climate change and variability, validate the close nexus
between climate change and alterations in agro-ecosys-
tems, and examine and strengthen community adaptation
strategies in Nepal.
Fig. 7 Flood, a natural disaster, causing erosion, and damage to
household properties in Chitwan (photo credit: Ecological Services
Center Nepal, photo by Rajan Ghimire and Rishi Adhikari)
Fig. 8 Sloping Land
Agricultural Technology
(SALT) for climate change
adaptation (soil conservation
against erosion by rain) in
Kabilash. SALT is a soil
conservation strategy where
legumes and/or other crops are
grown between contoured
hedgerows with fast growing
trees. (Photo credit: Ecological
Services Center Nepal, photo by
Rajan Ghimire and Rishi
Adhikari)
Agric Res (June 2014) 3(2):165–174 173
123
Acknowledgments The authors are highly indebted to Global
Future Institute (GFI), USA for financing the study. The authors
express their gratitude to Nabin Poudel, Arjun Pandey, Mukunda
Bhusal, Debendra Shrestha, Deepak Joshi and Tanka Kandel for
technical assistance, and Joseph Dale for helping edit the manuscript.
Thanks goes to Ecological Services Center Nepal for the photos, and
three annonymous reviewers for their constructive comments that
improved the manuscript considerably.
References
1. Agrawala S, Raksakulthai V, van Aalst M, Larsen P, Smith J,
Reynolds J (2003) Development and climate change in Nepal:
focus on water resources and hydropower. Organization for
Economic Cooperation and Development, Paris
2. Aryal A, Brunton D, Raubenheimer D (2014) Impact of climate
change on human-wildlife-ecosystem interactions in the Trans-
Himalaya region of Nepal. Theor Appl Climatol 115:517–529
3. Chaudhary P, Aryal KP (2009) Global warming in Nepal: chal-
lenges and policy imperatives. For Livelihood 8:3–13
4. Chaulagain NP (2006) Impacts of climate change on water
resources of Nepal, the physical and socioeconomic dimensions.
Dissertation, University of Flensburg, Germany. http://www.
zhb-flensburg.de/dissert/chaulagain/Dissertation-Chaulagain.pdf
5. District Agriculture Development Office (DADO) (2006) District
agricultural development office annual report 2006, Bharatpur,
Chitwan, Nepal
6. Dahal N (2008) Answering basic questions on climate change in
Nepal. Melting Glaciers, a NGO group bulletin on climate change
research and development 2:3–6
7. Darwin R (2001) Issues in food security: climate change and food
security. Agric Inf Bull 765–768. http://www.ers.usda.gov/
publications/aib765/aib765-8.pdf
8. DesInventar Dabase (2013) Disaster inventory/information man-
agement system for Nepal, online disaster database for Nepal.
http://www.desinventar.net/DesInventar/
main.jsp?countrycode=npl. Accessed 16 Aug 2013
9. Evans N, Baierl A, Semenov MA, Gladders P, Fitt BDL (2008)
Range and severity of a plant disease increased by global
warming. J R Soc Interface 5:525–531
10. Ghimire R (2008) Resilience of community to climate change
through adoption of sloping agriculture land technology and eco-
friendly agriculture in Jugedi Khola Watershed, Nepal. Forum
Geografic 7:208–215
11. Gurung GB, Bhandari DN (2009) Integrated approach to climate
change adaptation. For Livelihood 8:91–99
12. Githeko AK, Lindsay SW, Confalonieri UE, Patz JA et al (2000)
Climate change and vector-borne diseases: a regional analysis.
Bull World Health Organ 78:1136–1147
13. Harvell CD, Mitchell CE, Ward JR, Altizer S, Dobson AP, Ostfeld
RS, Samuel MD (2002) Ecology—climate warming and disease
risks for terrestrial and marine biota. Science 296:2158–2162
14. Howden SM, Soussana JF, Tubiello FN, Chhetri N, Dunlop M,
Meinke H (2007) Adapting agriculture to climate change. Proc
Natl Acad Sci USA 104:19691–19696
15. Huq S, Reid H, Konate M, Rahman A, Sokona Y, Crick F (2004)
Mainstreaming adaptation to climate change in Least Developed
Countries (LDCs). Clim Policy 4:25–43
16. International Panel on Climate Change (2007) Summary for
policymakers. In: Parry ML, Canziani OF, Palutikof JP, Van Der
Linden JP, Hanson CE (eds.) Climate change impacts, adaptation
and vulnerability. Contribution of Working Group II to the Fourth
Assessment Report of the Intergovernmental Panel on Climate
Change, Cambridge University Press, Cambridge, pp 7–22
17. Joshi BK (2005) Rice gene pool for Tarai and inner Tarai areas of
Nepal. Nepal Agric Res J 6:10–18
18. Kendall MG (1975) Rank correlation methods, 4th edn. Charles
Griffin, London
19. Khanal RC (2009) Climate change and organic agriculture.
J Agric Environ 10:100–110
20. Lettenmaier DP, Wood EF, Wallis JR (1994) Hydro-climato-
logical trends in continental United States, 1948–1988. J Clim
7:586–607
21. Liverman D (2008) Assessing impacts, adaptation and vulnera-
bility: reflections on the Working Group II Report of the Inter-
governmental Panel on Climate Change. Global Environ Change
18(1):4–7
22. Malla G (2008) Climate change and its implication on Nepalese
agriculture. J Agric Environ 9:62–71
23. Manandhar S, Vogt DS, Perret SR, Kazama F (2011) Adapting
cropping systems to climate change in Nepal: a cross-regional
study of farmers’ perception and practices. Reg Environ Change J
11:335–348
24. Manandhar TD, Shin MY (2013) How community-based forest
management can improve rural livelihoods: a case of Kabhre
district. Nepal. For Sci Technol 9(3):131–136
25. Mann HB (1945) Nonparametric test against trend. Econometrica
13:245–259
26. Nepal Climate Vulnerability Study Team (NCVST) (2009) Vul-
nerability through the eyes of the vulnerable: climate change induced
uncertainties and Nepal’s development predicaments. Institute for
Social and Environmental Transition (ISET), Kathmandu
27. Pant KP (2009) Effects of agriculture on climate change: a cross
country study of factors affecting carbon emission. J Agric
Environ 10:72–88
28. Polley HW (2002) Implications of atmospheric and climatic change
for crop yield and water use efficiency. Crop Sci 42:131–140
29. Regmi B, Suwal R, Shrestha G, Sharma GB, Thapa L, Manan-
dhar S (2009) Community resilience in Nepal. Tiempo Issue 73,
October 2009, pp 7–10. http://www.forestrynepal.org/images/
publications/regmi_tiempo.pdf
30. Rosenzweig C, Hillel D (1995) Potential impacts of climate
change on agriculture and food supply, U.S. Global Change
Research Information Office, Washington, DC
31. Schiermeier Q (2008) Water: a long dry summer. Nature 452:
270–273
32. Schmidhuber J, Tubiello FN (2007) Global food security under
climate change. Proc Natl Acad Sci USA 104(50):19703–19708
33. Shumway RH, Stoffer DS (2011) Time series analysis and its
applications: with R examples. Springer, New York
34. Shrestha A (2005) Critical appraisal of management practices in
Nepalese guava orchards. J Inst Agric Anim Sci 26:127–133
35. Sinha SK (1997) Global change scenario: current and future with
references to land cover change and suitable agriculture—south
East Asian context. Curr Sci 72:846–854
36. Smith JB, Lenhart SS (1996) Climate change adaptation policy
options. Clim Res 6:193–201
37. Swaminathan MS, Kesavan PC (2012) Agricultural research in an
era of climate change. Agric Res 1(1):3–11
38. Upreti BR, Upreti YG (2002) Factors leading to agro-biodiversity
loss in developing countries: the case of Nepal. Biodivers Con-
serv 11(9):1607–1621
39. World Bank (2009). Shared views on development and climate
change. http://web.worldbank.org/WBSITE/EXTERNAL/COUN
TRIES/SOUTHASIAEXT/0,,contentMDK:22038355*pagePK:
146736*piPK:146830*theSitePK:223547,00.html. Accessed
16 Aug 2013
40. Zucchini W, Nenadic O (2011). Time series analysis with R-Part
I. Document de cours
174 Agric Res (June 2014) 3(2):165–174
123