adapt/hmi effort for the integrated global-sun modeladapt/hmi effort for the integrated global-sun...
TRANSCRIPT

ADAPT/HMI Effort for theIntegrated Global-Sun Model
NASA TIM 2017
Carl Henney1, C. Nick Arge2, Kathleen Shurkin3,1
1. AFRL/Space Vehicles Directorate, KAFB, NM2. NASA Goddard Space Flight Center, Greenbelt, MD3. ISR, Boston College, Chestnut Hill, MA
2
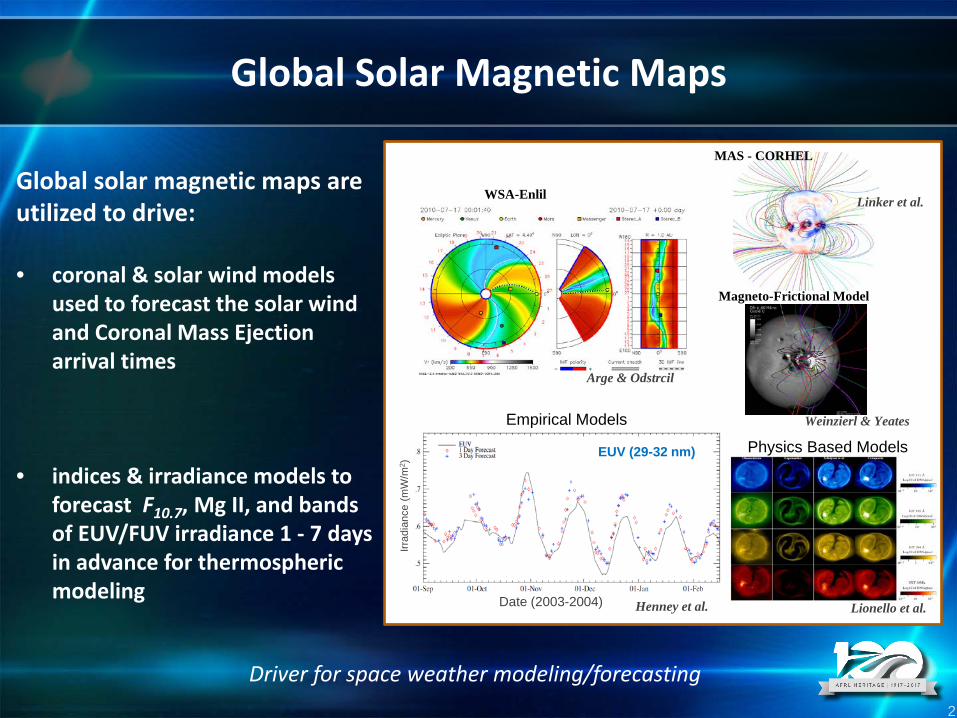
Global Solar Magnetic Maps
Global solar magnetic maps are utilized to drive:
• coronal & solar wind models used to forecast the solar wind and Coronal Mass Ejection arrival times
• indices & irradiance models to forecast F10.7, Mg II, and bands of EUV/FUV irradiance 1 - 7 days in advance for thermospheric modeling
WSA-Enlil
Empirical Models
Physics Based Models
MAS - CORHEL
Linker et al.
Magneto-Frictional Model
Weinzierl & Yeates
Arge & Odstrcil
Lionello et al. Date (2003-2004)
Irrad
ianc
e (m
W/m
2 )
EUV (29-32 nm)
Henney et al.
Driver for space weather modeling/forecasting

3
ADAPT* Model:modeling framework
L1 observation in “sky frame”at obs_time
Magnetogram data & uncertaintyremapped into heliographic coordinates:longitude vs. latitude (180 x 180 deg).
ADAPT pre-processing aligns all Brinput data (far & near) within model frame (i.e., 360x180; Carrington)
Forward ModelingDifferential Rotation
Meridional CirculationSupergranulation
30 June 2010 NSO SOLIS/VSM
Model ensemble from previous time step
Data Assimilation using EnLS
Method
Model ensemble at obs_time
Provided by each
Observatory(SDO/HMI, NSOGONG & VSM)
* ADAPT - Air Force Data Assimilative Photospheric Flux Transport
4
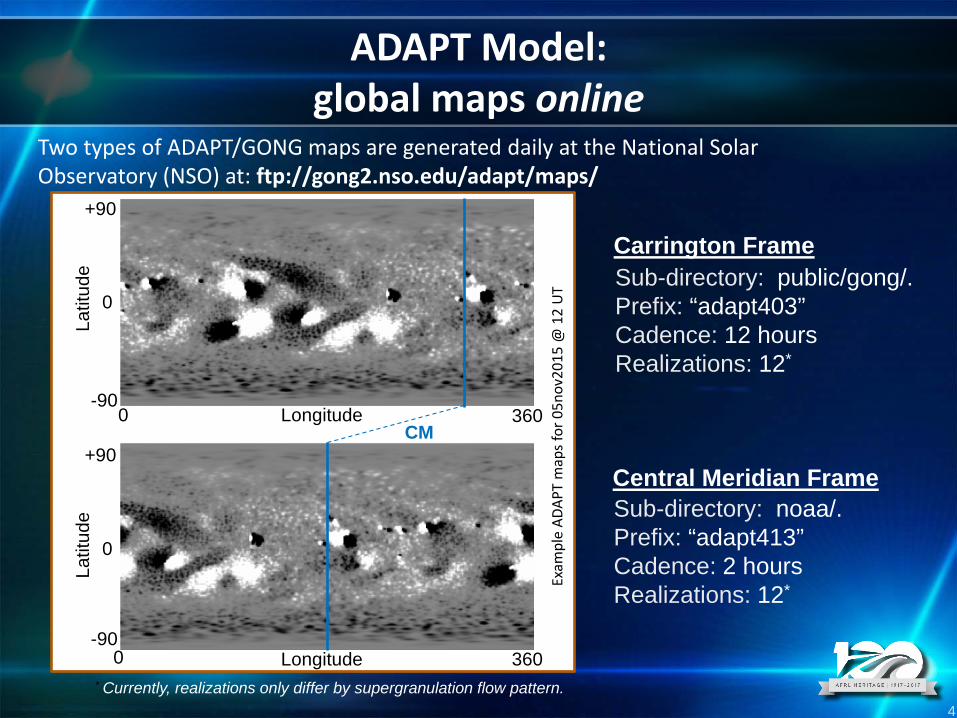
ADAPT Model:global maps online
Two types of ADAPT/GONG maps are generated daily at the National Solar Observatory (NSO) at: ftp://gong2.nso.edu/adapt/maps/
Carrington Frame
Central Meridian Frame
0-90
0
Latit
ude
+90
Longitude 360
-90
0
Latit
ude
+90CM
Sub-directory: public/gong/.Prefix: “adapt403”Cadence: 12 hoursRealizations: 12*
Sub-directory: noaa/.Prefix: “adapt413”Cadence: 2 hoursRealizations: 12*Ex
ampl
e AD
APT
map
s for
05n
ov20
15 @
12
UT
* Currently, realizations only differ by supergranulation flow pattern.
0 360Longitude

5
ADAPT Model: solar magnetogram sources
KPVT: 1977 – 2003[24 hr, single site, 868.8 nm]
VSM: 2003 – present[24 hr, single site, 630.2 nm]
GONG: 2006 – present[10 min, 6 sites, 676.8 nm]
HMI: 2010 – present[12 min, Sat-GEO, 617.3 nm]
Kitt Peak Vacuum Telescope
Vector SpectroMagnetograph Helioseimic and MagneticImager (on the Solar
Dynamics Observatory)
Global Oscillation Network Group
SDO
ADAPT maps can be generated with KPVT, VSM, GONG, and HMI

6
ADAPT with HMI
HMI: 900x900
HMI:180x180
ADAPT: 360x180
HMI heliographic 900x900 (latitude vs. longitude, i.e., “hmi.[Mrmap, bmap]_latlon_900x900_720s” ) maps* are available via the JSOC:
* remapped into fixed Carrington frame (Thanks Yang & Jeneen!)
July 13, 2010

7
WSA 4.2 ADAPT HMI-LOS:coronal solutions & solar wind solutions
Der
ived
CH
s (1
Rs)
Phot
osph
eric
Fiel
d (1
Rs)
Cor
onal
Fie
ld
(5.0
Rs)
Sola
r Win
d Sp
eed
(5.0
Rs)
Radial IMF Polarity at Earth
Solar Wind Speed at Earth (km s-1)
July
8, 2
010
@ 2
0 U
T

8
WSA 4.2 ADAPT HMI-Vector:coronal solutions & solar wind solutions
• ADAPT-HMI maps fully integrated into WSA 4.2• Working on tuning solar wind empirical relationshipD
eriv
ed C
Hs
(1R
s)Ph
otos
pher
icFi
eld
(1R
s)C
oron
al F
ield
(5
.0R
s)So
lar W
ind
Spee
d(5
.0R
s)
Radial IMF Polarity at Earth
Solar Wind Speed at Earth (km s-1)
July
8, 2
010
@ 2
0 U
T

9
Modeling EUV & F10.7
Solar Magnetic Image (SDO)Solar EUV (30.4 nm) Image (SDO)
EUV & radio 10.7 cm signal sources align with concentrations of magnetic flux Integrated full-disk singles are a contribution of strong & weak field regions
Solar 10.7 cm Image (VLA)
EUV, Magnetic, and 10.7 cm Full-Disk Images of the Sun
Credit: Stephen White (AFRL)
10
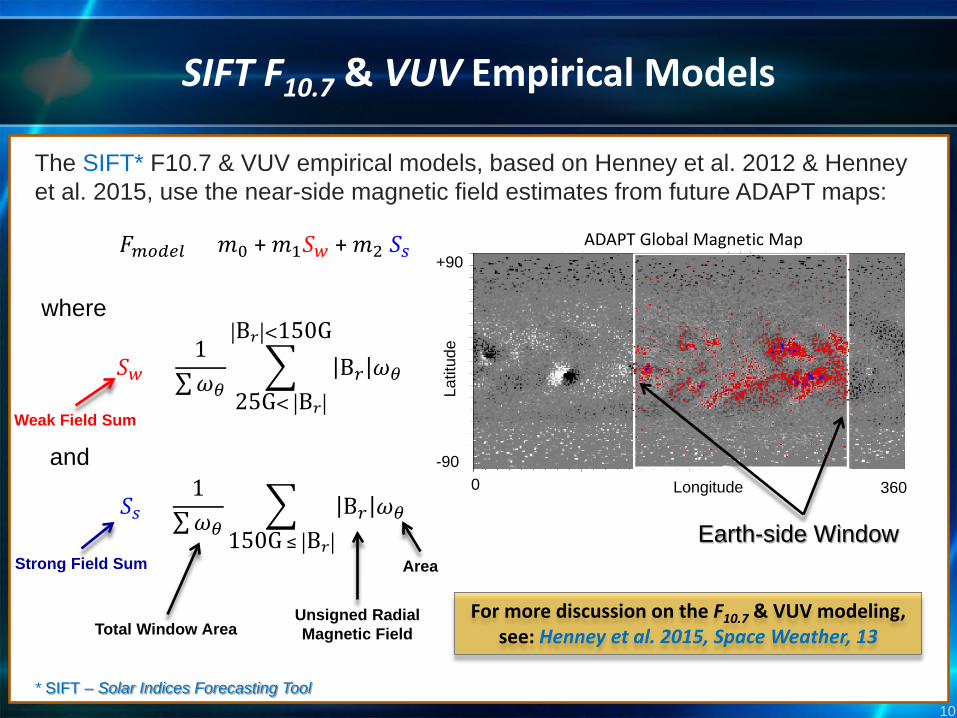
SIFT F10.7 & VUV Empirical Models
The SIFT* F10.7 & VUV empirical models, based on Henney et al. 2012 & Henney et al. 2015, use the near-side magnetic field estimates from future ADAPT maps:
For more discussion on the F10.7 & VUV modeling, see: Henney et al. 2015, Space Weather, 13
𝐹𝐹𝑚𝑚𝑚𝑚𝑚𝑚𝑚𝑚𝑚𝑚 = 𝑚𝑚0 + 𝑚𝑚1𝑆𝑆𝑤𝑤 + 𝑚𝑚2 𝑆𝑆𝑠𝑠
where
Weak Field Sum
Strong Field Sum
𝑆𝑆𝑤𝑤 =1
∑𝜔𝜔𝜃𝜃�
25G< B𝑟𝑟
B𝑟𝑟 <150GB𝑟𝑟 𝜔𝜔𝜃𝜃
𝑆𝑆𝑠𝑠 =1
∑𝜔𝜔𝜃𝜃�
150G ≤ B𝑟𝑟
B𝑟𝑟 𝜔𝜔𝜃𝜃
and
Total Window AreaUnsigned RadialMagnetic Field
Area
* SIFT – Solar Indices Forecasting Tool
-90La
titud
e
+90
Longitude 3600
Earth-side Window
ADAPT Global Magnetic Map

11
ADAPT/SIFT Forecasting: EUV
EUV (29–32 nm)
Date (day-month; 2003-2004)
Irrad
ianc
e (m
W/m
2 )
Henn
ey e
t al.
2015
, Spa
ce W
eath
er, 1
3, 1
41-1
53
• Observed solar irradiance measured by the Solar EUV Experiment (SEE) on NASA’s TIMED mission [Woods et al. 2002].

12
ADAPT/SIFT Forecasting: Mg II index
Date (day-month; 2003-2004)
Mg
II In
dex
Mg II Core-to-Wing Ratio

13
ADAPT/SIFT Predictions Online
ADAPT Maps and SIFT Forecasts are now online:• ADAPT runs 24/7 at the National Solar Observatory (NSO)
generating global maps every 2 hours• SIFT utilizes the ADAPT maps in near real-time, providing
1, 3, and 7 day advance forecast values of F10.7, SSN, & Mg II core to-wing
Exa
mpl
e S
IFT
F 10.
7Fo
reca
st F
ile
s.f.u
.
Date (day-month)
Maps & Forecasts available at: ftp://gong2.nso.edu/adapt

14
Future ADAPT Development:incorporating HMI far-side data
Far-side data provides an estimate of the:– magnetic field strength– position
The polarity distribution can be approximated with Hale’s rule & Joy’s rule.
|B| vs Far-Side Phase Shift
Φ(d
egre
es)
|B| (Gauss)
from
Gon
zale
z-He
rnan
dez e
t al.,
200
7Far-side detections from HMI:
Far-side signal(GONG 07/1/10)
New estimation merged with ADAPT map
New polarityestimation

15
Future ADAPT Development:direct far-side & polar observations
Solar Orbiter:• Expected launch Feb 2018 (previously Jul 2017)• Polarimetric and Helioseismic Imager (PHI):
• full-disk vector magnetograms• Far-side & high latitude observations• Telemetry limited to 4 to 8 hours daily
• observations stored on-board during outage
Preparing ADAPT for input from Solar Orbiter PHI Magnetograms

16
Future ADAPT Development:near-side AR emergence
7 Days of AR Evolution
• Besides helioseismic far-side detections, EUV/F10.7 and coronal & solar wind advance predictions require the modeling of AR evolution for near-side emergence. For example:

17
Future ADAPT Development:AFOSR supported research
ADAPT project activities currently include exploring how best to generate smoothly evolving maps, for example:
1) Forward model near-side & far-side active region emergence with a “model bipole”.
2) Reverse-model observed near-side active regions (near east-limb) to the estimated time of emergence.
3) And ultimately, combine near-side observations &far-side detections to produce smooth evolution within ADAPT global solar magnetic maps.
from Yeates et al., 2007

18
HMI ADAPT - Year 5
ADAPT Model Year 5 goals:• finish validation study using HMI data inputs (i.e., line-of-sight, far-side
emergence, and vector) by performing a systematic comparison of WSA predictions with observations using maps that incorporate the FEPT MHD results of flux emergence
• deliver updated version of ADAPT to NSO or CCMC
• deliver to CCMC a software tool that assimilates the flux emergence active region areas produced by the MHD FEPT model into ADAPT maps
• deliver latest WSA model version to the CCMC having the capability to ingest all ADAPT map products