adac accident research accident analysis based simulation ... · adac accident research –...
TRANSCRIPT
ADAC accident research –
accident analysis based
simulation of the most dangerous
scenarios
Christof Gauss, Dino Silvestro
ADAC Technik Zentrum T. Unger, J L Haslbeck, S A Schneider
ADAC accident research
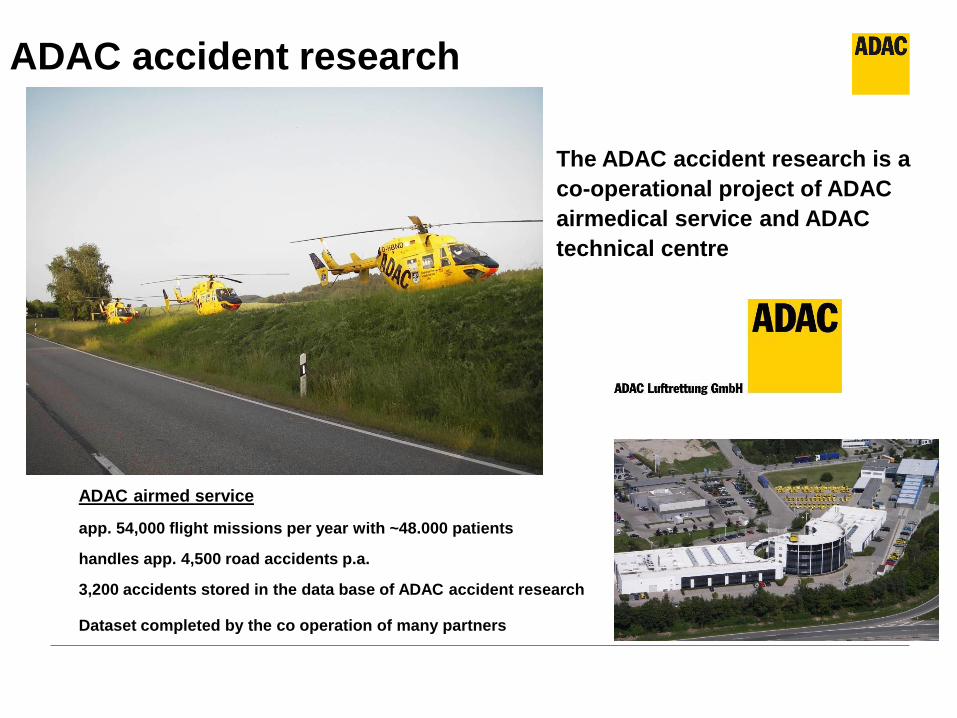
The ADAC accident research is a
co-operational project of ADAC
airmedical service and ADAC
technical centre
ADAC airmed service
app. 54,000 flight missions per year with ~48.000 patients
handles app. 4,500 road accidents p.a.
3,200 accidents stored in the data base of ADAC accident research
Dataset completed by the co operation of many partners
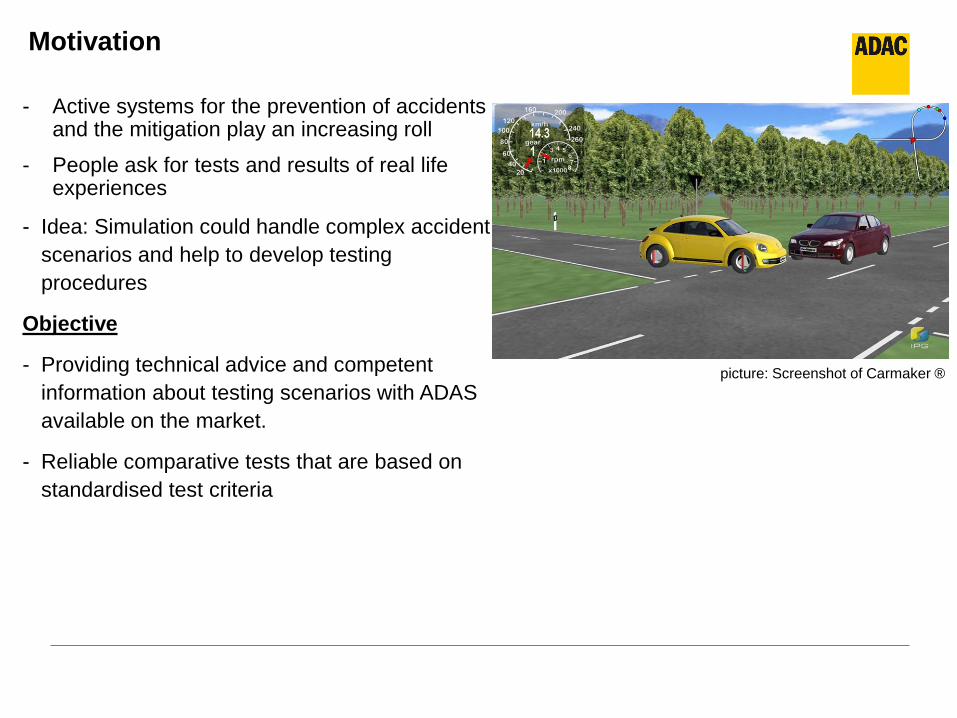
- Active systems for the prevention of accidents and the mitigation play an increasing roll
- People ask for tests and results of real life experiences
- Idea: Simulation could handle complex accident
scenarios and help to develop testing
procedures
Objective
- Providing technical advice and competent
information about testing scenarios with ADAS
available on the market.
- Reliable comparative tests that are based on
standardised test criteria
Motivation
picture: Screenshot of Carmaker ®
Accidentology
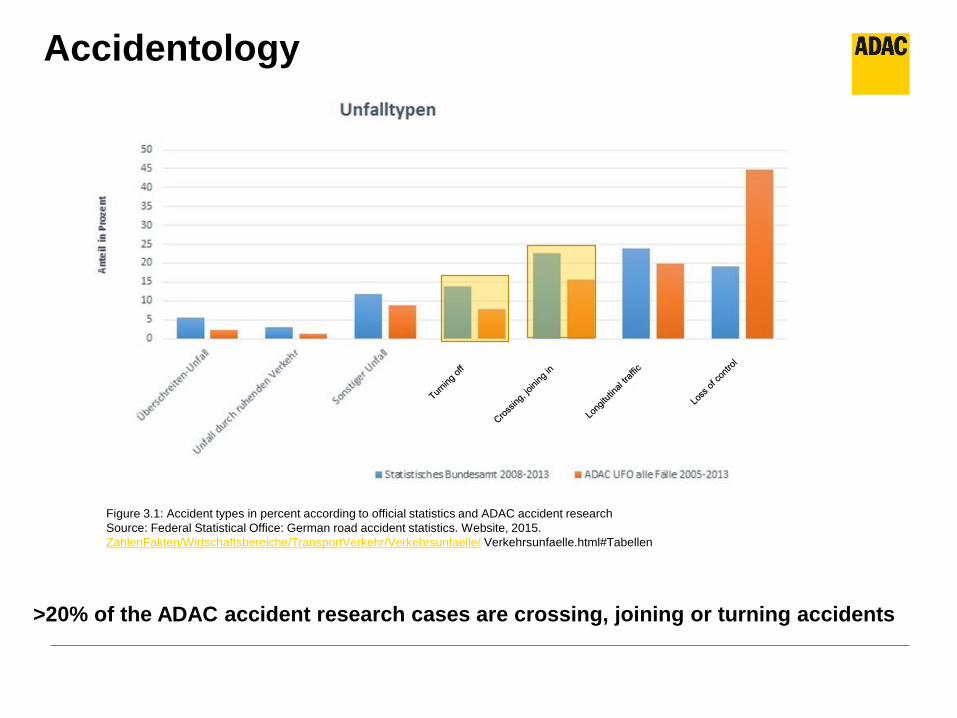
>20% of the ADAC accident research cases are crossing, joining or turning accidents
Figure 3.1: Accident types in percent according to official statistics and ADAC accident research
Source: Federal Statistical Office: German road accident statistics. Website, 2015.
ZahlenFakten/Wirtschaftsbereiche/TransportVerkehr/Verkehrsunfaelle/ Verkehrsunfaelle.html#Tabellen
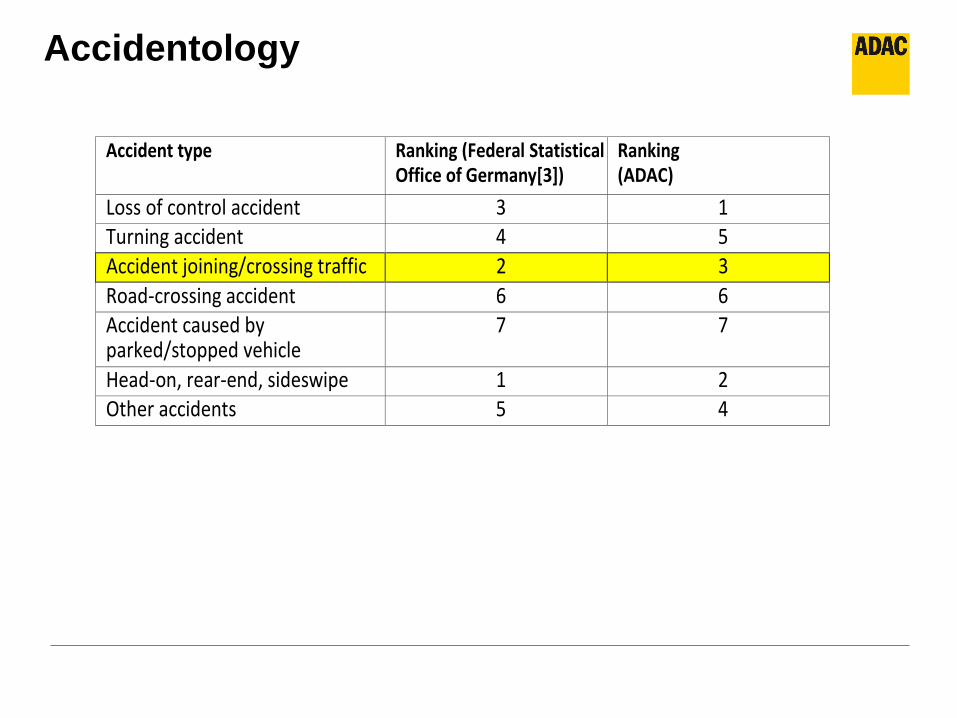
Accidentology
Accident type Ranking (Federal Statistical Office of Germany[3])
Ranking (ADAC)
Loss of control accident 3 1 Turning accident 4 5
Accident joining/crossing traffic 2 3
Road-crossing accident 6 6 Accident caused by parked/stopped vehicle
7 7
Head-on, rear-end, sideswipe accident
1 2 Other accidents 5 4
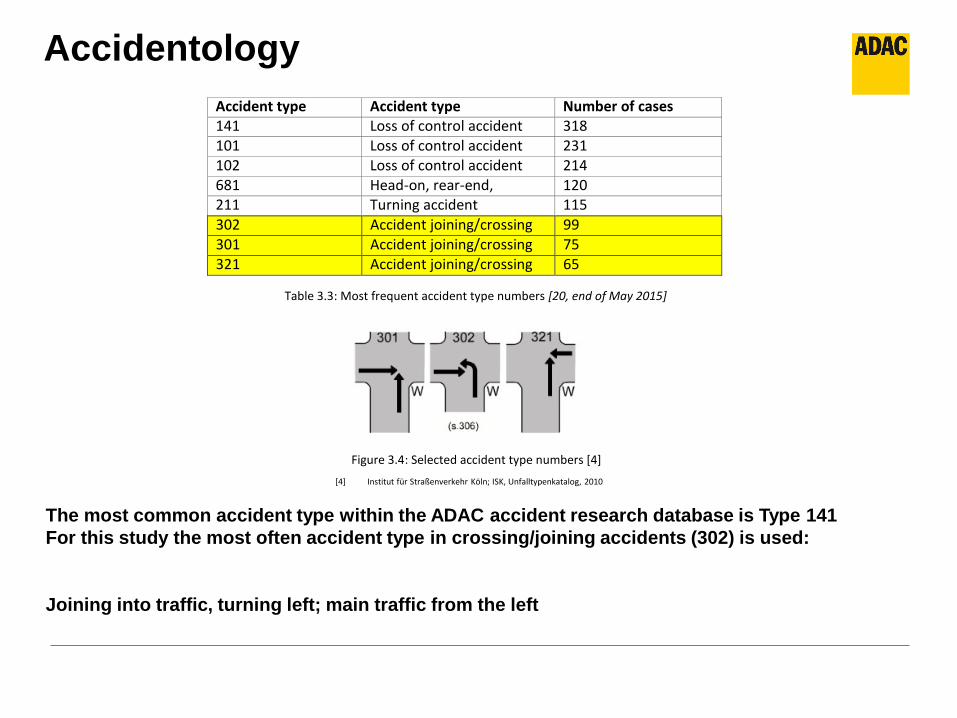
Accidentology
Accident type number
Accident type Number of cases 141 Loss of control accident 318 101 Loss of control accident 231 102 Loss of control accident 214 681 Head-on, rear-end,
sideswipe accident 120
211 Turning accident 115 302 Accident joining/crossing
traffic 99
301 Accident joining/crossing traffic
75 321 Accident joining/crossing
traffic 65
Table 3.3: Most frequent accident type numbers [20, end of May 2015]
Figure 3.4: Selected accident type numbers [4]
[4] Institut für Straßenverkehr Köln; ISK, Unfalltypenkatalog, 2010
The most common accident type within the ADAC accident research database is Type 141
For this study the most often accident type in crossing/joining accidents (302) is used:
Joining into traffic, turning left; main traffic from the left
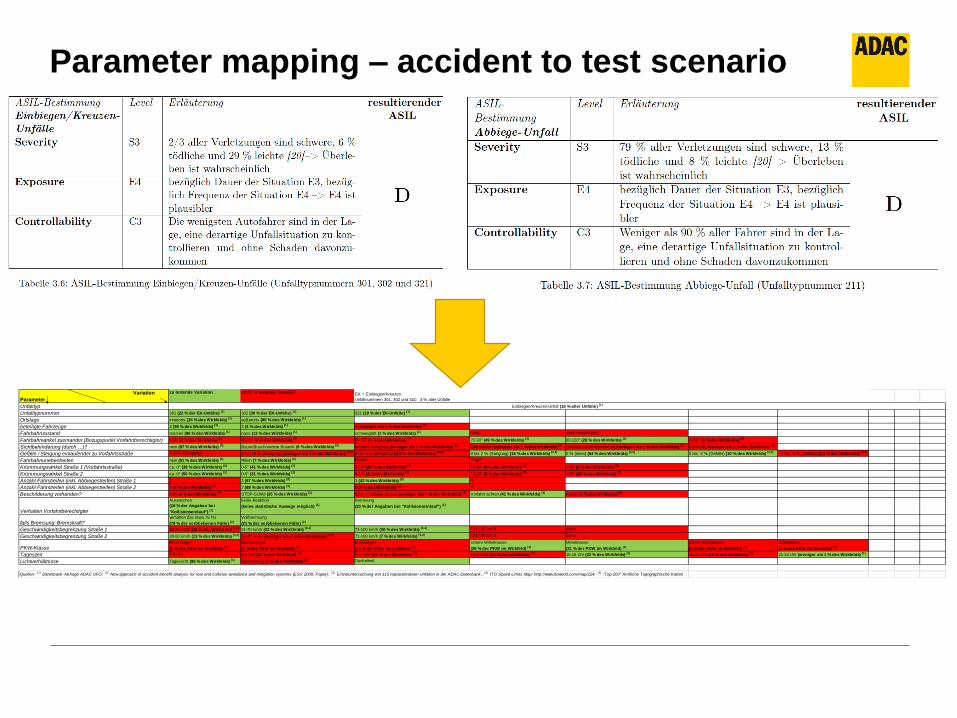
Parameter mapping – accident to test scenario
Variation
Parameter
zu testende Variation nicht zu testende Variation EK = Einbiegen/Kreuzen
Unfallnummern 301, 302 und 321: 3 % aller Unfälle
Unfalltyp
Unfalltypnummer 301 (22 % der EK-Unfälle) [1] 302 (30 % der EK-Unfälle) [1] 321 (19 % der EK-Unfälle) [1]
Ortslage innerorts (15 % des Wirkfelds) [1] außerorts (85 % des Wirkfelds) [1]
beteiligte Fahrzeuge 2 (96 % des Wirkfelds) [1] 3 (4 % des Wirkfelds) [1] 4 (weniger als 1 % des Wirkfelds) [1]
Fahrbahnzustand trocken (86 % des Wirkfelds) [1] nass (13 % des Wirkfelds) [1] schneeglatt (1 % des Wirkfelds) [1] eisig stark verschmutzt
Fahrbahnwinkel zueinander (Bezugspunkt Vorfahrtberechtigter) <45° (3 % des Wirkfelds) [3] 45-60° (8 % des Wirkfelds) [3] 60-75° (5 % des Wirkfelds) [3] 75-90° (49 % des Wirkfelds) [3] 90-120° (28 % des Wirkfelds) [3] >120° (6 % des Wirkfelds) [3]
Sichtbehinderung (durch …)? nein (87 % des Wirkfelds) [3] Baum/Busch/andere Botanik (6 % des Wirkfelds) [3] anderes Fahrzeug (weniger als 1 % des Wirkfelds) [3] Getreidefeld (weniger als 1 % des Wirkfelds) [3] sonstige Sichtbehinderung (weniger als 1 % des Wirkfelds) [3] Gebäude (weniger als 1 % des Wirkfelds) [3]
Gefälle / Steigung einlaufender zu Vorfahrtsstraße >10 % (Steigung) 5 bis 10 % (Steigung) (weniger als 1 % des Wirkfelds) [3,5] 2 bis 5 % (Steigung) (3,5 % des Wirkfelds) [3,5] 0 bis 2 % (Steigung) (18 % des Wirkfelds) [3,5] 0 % (eben) (64 % des Wirkfelds) [3,5] 0 bis -2 % (Gefälle) (10 % des Wirkfelds) [3,5] -2 bis -5 % (Gefälle) (3,5 % des Wirkfelds) [3,5]
Fahrbahnunebenheiten nein (91 % des Wirkfelds) [3] Rillen (7 % des Wirkfelds) [3] Wellen Hügel
Krümmungswinkel Straße 1 (Vorfahrtsstraße) ca. 0° (39 % des Wirkfelds) [3] 0-5° (41 % des Wirkfelds) [3] 5-10° (10 % des Wirkfelds) [3] 10-20° (4 % des Wirkfelds) [3] >20° (6 % des Wirkfelds) [3]
Krümmungswinkel Straße 2 ca. 0° (50 % des Wirkfelds) [3] 0-5° (31 % des Wirkfelds) [3] 5-10° (6 % des Wirkfelds) [3] 10-20° (2 % des Wirkfelds) [3] >20° (10 % des Wirkfelds) [3]
Anzahl Fahrstreifen (inkl. Abbiegestreifen) Straße 1 1 2 (57 % des Wirkfelds) [3] 3 (43 % des Wirkfelds) [3] 4
Anzahl Fahrstreifen (inkl. Abbiegestreifen) Straße 2 1 (8 % des Wirkfelds) [3] 2 (88 % des Wirkfelds) [3] 3 (4 % des Wirkfelds) [3] 4
Beschilderung vorhanden? nein (4 % des Wirkfelds) [3] STOP-Schild (25 % des Wirkfelds) [3] Stop + Vorfahrt achten (weniger als 1 % des Wirkfelds) [3] Vorfahrt achten (41 % des Wirkfelds) [3] Ampel (4 % des Wirkfelds) [3]
Verhalten Vorfahrtberechtigter
Ausweichen
(19 % der Angaben bei
"Kollisionseinlauf") [1]
keine Reaktion
(keine statistische Aussage möglich) [1]
Bremsung
(20 % der Angaben bei "Kollisionseinlauf") [1]
falls Bremsung: Bremskraft?verhalten (bis etwa 75 %)
(79 % der verbliebenen Fälle) [2]
Vollbremsung
(21 % der verbliebenen Fälle) [2]
Geschwindigkeitsbegrenzung Straße 1 30-50 km/h (10 % des Wirkfelds) [3,4] 51-70 km/h (23 % des Wirkfelds) [3,4] 71-100 km/h (30 % des Wirkfelds) [3,4] 101-120 km/h keine
Geschwindigkeitsbegrenzung Straße 2 30-50 km/h (13 % des Wirkfelds) [3,4] 51-70 km/h (weniger als 1 % des Wirkfelds) [3,4] 71-100 km/h (7 % des Wirkfelds) [3,4] 101-120 km/h keine
PKW-KlasseMicrowagen
(1 % der PKW im Wirkfeld) [1]
Kleinstwagen
(7 % der PKW im Wirkfeld) [1]
Kleinwagen
(23 % der PKW im Wirkfeld) [1]
Untere Mittelklasse
(28 % der PKW im Wirkfeld) [1]
Mittelklasse
(31 % der PKW im Wirkfeld) [1]
Obere Mittelklasse
(8 % der PKW im Wirkfeld) [1]
Oberklasse
(2 % der PKW im Wirkfeld) [1]
Tageszeit 0-6 Uhr 6-9 Uhr (11 % des Wirkfelds) [1] 9-12 Uhr (19 % des Wirkfelds) [1] 12-15 Uhr (23 % des Wirkfelds) [1] 15-18 Uhr (32 % des Wirkfelds) [1] 18-21 Uhr (15 % des Wirkfelds) [1] 21-24 Uhr (weniger als 1 % des Wirkfelds) [1]
Lichtverhältnisse Tageslicht (99 % des Wirkfelds) [1] Dämmerung (1 % des Wirkfelds) [1] Dunkelheit
Quellen: [1] Datenbank-Abfrage ADAC UFO; [2] New approach of accident benefit analysis for rear end collision avoidance and mitigation systems (ESV 2009, Paper); [3] Einzeluntersuchung von 115 repräsentativen Unfällen in der ADAC-Datenbank, [4] ITO Speed Limits Map: http://www.itoworld.com/map/124; [5] "Top 200" Amtliche Topographische Karten
Einbiegen/Kreuzen-Unfall (16 % aller Unfälle) [1]
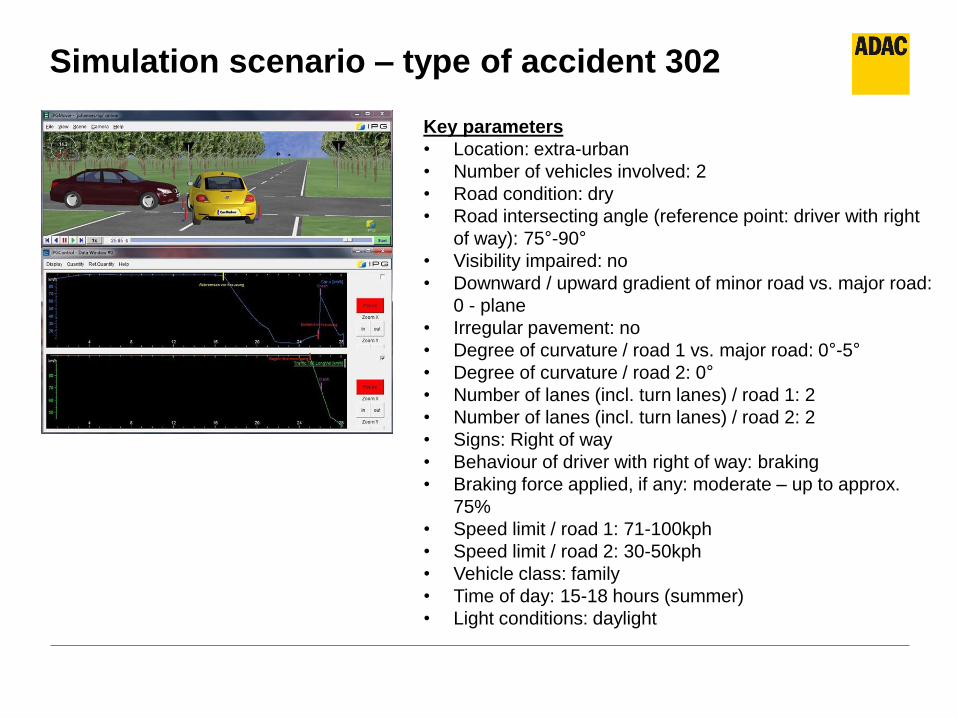
Simulation scenario – type of accident 302
Key parameters
• Location: extra-urban
• Number of vehicles involved: 2
• Road condition: dry
• Road intersecting angle (reference point: driver with right
of way): 75°-90°
• Visibility impaired: no
• Downward / upward gradient of minor road vs. major road:
0 - plane
• Irregular pavement: no
• Degree of curvature / road 1 vs. major road: 0°-5°
• Degree of curvature / road 2: 0°
• Number of lanes (incl. turn lanes) / road 1: 2
• Number of lanes (incl. turn lanes) / road 2: 2
• Signs: Right of way
• Behaviour of driver with right of way: braking
• Braking force applied, if any: moderate – up to approx.
75%
• Speed limit / road 1: 71-100kph
• Speed limit / road 2: 30-50kph
• Vehicle class: family
• Time of day: 15-18 hours (summer)
• Light conditions: daylight
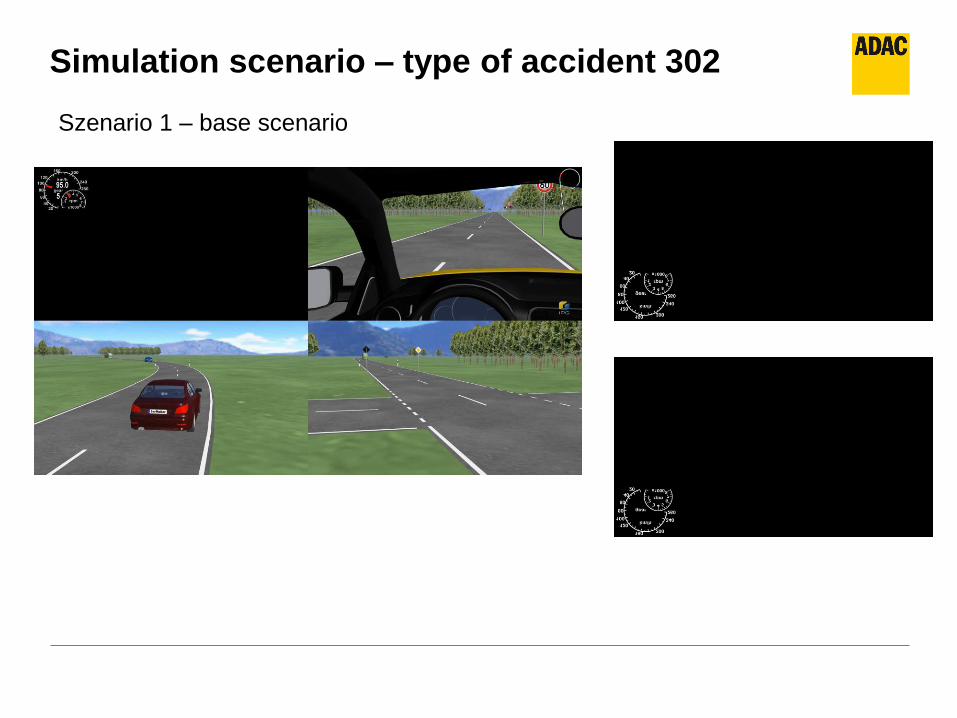
Simulation scenario – type of accident 302
Szenario 1 – base scenario
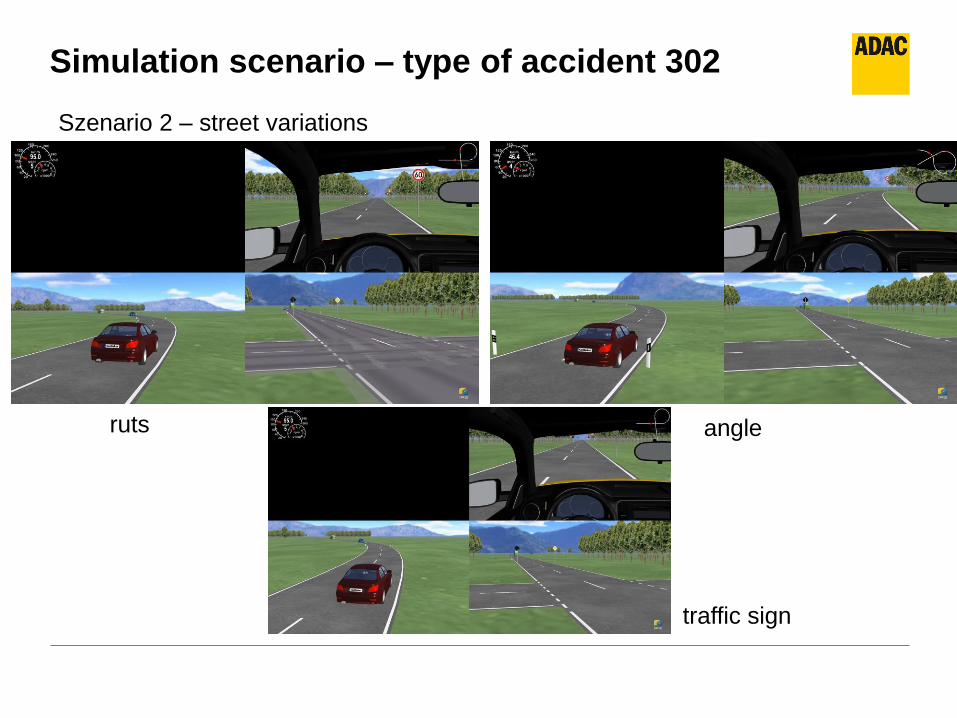
Simulation scenario – type of accident 302
Szenario 2 – street variations
ruts angle
traffic sign
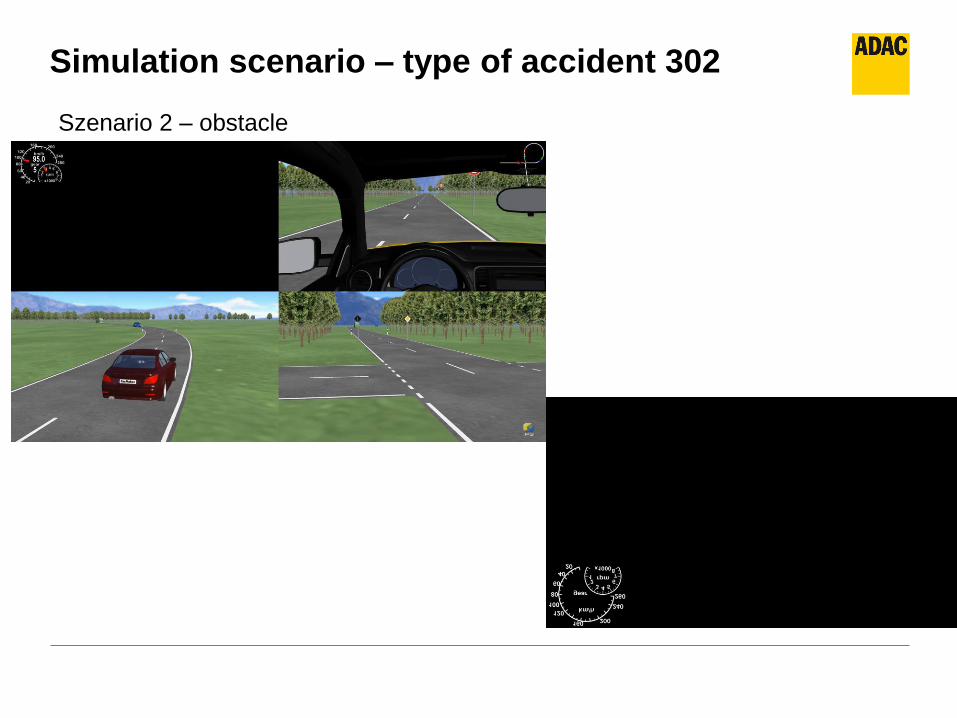
Simulation scenario – type of accident 302
Szenario 2 – obstacle
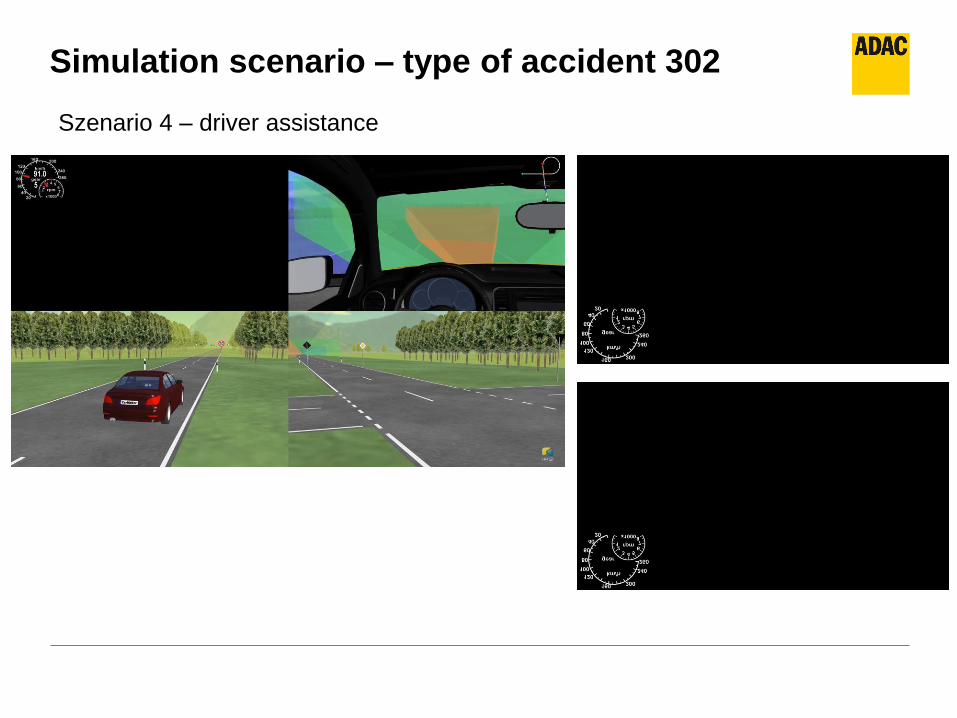
Simulation scenario – type of accident 302
Szenario 4 – driver assistance
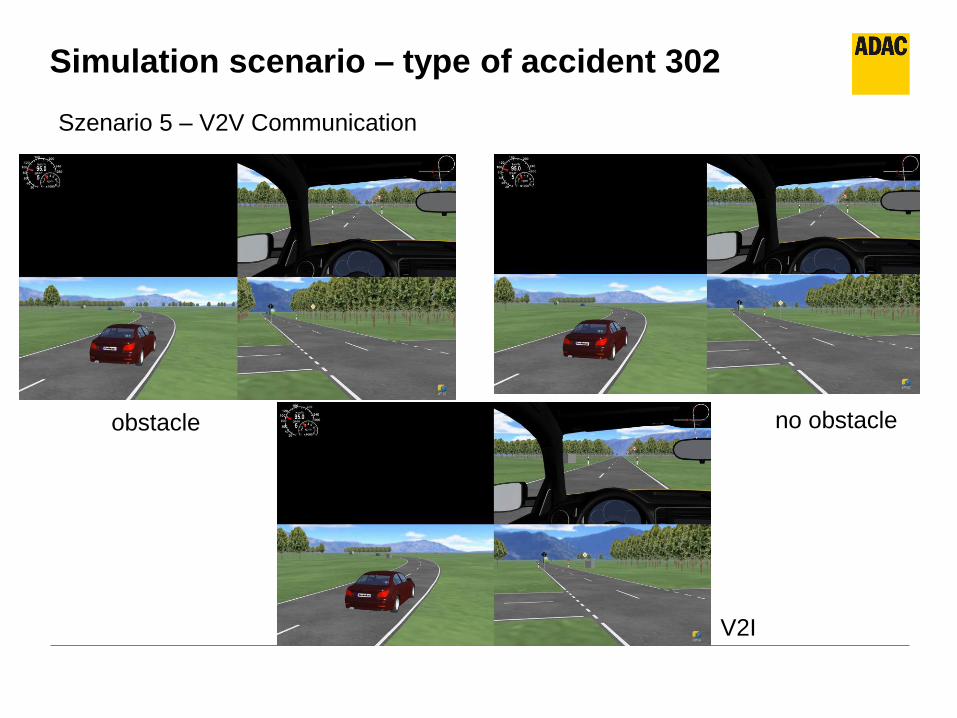
Simulation scenario – type of accident 302
Szenario 5 – V2V Communication
obstacle no obstacle
V2I
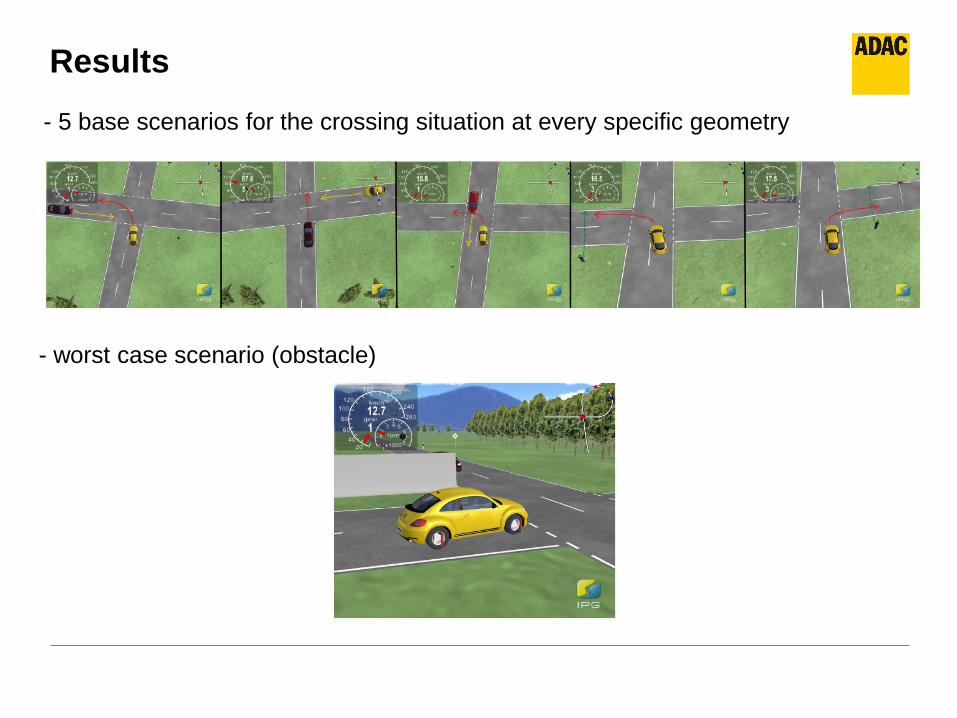
Results
- 5 base scenarios for the crossing situation at every specific geometry
- worst case scenario (obstacle)
Summary
ADAC testing procedure and assessment could be developed with simulation techniques
the testing scenarios are real life (accident) based
Outlook
Future test scenarios and safety discussions will be supported by simulations
Summary and Outlook

06.09.
2012
ADAC AEBS testing – ESAR 2012 –
Unger, Sandner, Gauss, Silvestro
Christof Gauss, Dino Silvestro
ADAC Technik Zentrum
Thank You