active labour market policy evaluations: a metaanalysis · active labour market policy evaluations:...
TRANSCRIPT
ACTIVE LABOUR MARKET POLICY EVALUATIONS:A META-ANALYSIS*
David Card, Jochen Kluve and Andrea Weber
This article presents a meta-analysis of recent microeconometric evaluations of active labour marketpolicies. We categorise 199 programme impacts from 97 studies conducted between 1995 and 2007.Job search assistance programmes yield relatively favourable programme impacts, whereas publicsector employment programmes are less effective. Training programmes are associated with positivemedium-term impacts, although in the short term they often appear ineffective. We also find that theoutcome variable used to measure programme impact matters, but neither the publication status of astudy nor the use of a randomised design is related to the sign or significance of the programmeestimate.
The effectiveness of active labour market policies – including subsidised employment,training and job search assistance – has been a matter of vigorous debate over the pasthalf century.1 While many aspects of the debate remain unsettled, some progress hasbeen made on the key question of how participation in an active labour marketprogramme (ALMP) affects the labour market outcomes of the participants them-selves.2 Progress has been facilitated by rapid advances in methodology and dataquality, and by a growing institutional commitment to evaluation in many countries,and has resulted in an explosion of professionally authored microeconometric evalu-ations. In their influential review Heckman et al. (1999) summarise approximately 75microeconometric evaluation studies from the US and other countries. A more recentreview by Kluve (forthcoming) includes nearly 100 separate studies from Europe alone,while Greenberg et al. (2003) survey 31 evaluations of government-funded programmesfor the disadvantaged in the US.
In this article we synthesise some of the main lessons in the recent microeconometricevaluation literature, using a new and comprehensive sample of programme estimatesfrom the latest generation of studies. Our sample is derived from responses to a surveyof 358 academic researchers affiliated with the Institute for the Study of Labour (IZA)and the National Bureau of Economic Research (NBER) in spring 2007. Theseresearchers and their colleagues authored a total of 97 studies of active labour market
* Corresponding author: David Card, University of California Berkeley. Email: [email protected].
We thank the authors who responded to our survey for their co-operation and assistance. We also thankfour anonymous referees for helpful suggestions, and participants of an IZA ⁄ World Bank workshop,participants of LAMES 2009 Buenos Aires, and seminar participants at the University of Chile and theInter-America Development Bank for comments on earlier versions of the article. Our research was funded bythe Center for Labor Economics at UC Berkeley, the German Science Foundation (DRG, SFB475), and theLeibniz Association (Pakt fur Foschung und Innovation).
1 In the US, for example, the direct public sector employment programmes initiated by the Works ProgressAdministration in 1935 were immediately controversial.
2 A key unsettled question is whether ALMPs affect the outcomes of those who do not participate, viadisplacement or other general equilibrium effects. See Johnson (1976) for an early but informative generalequilibrium analysis of public sector employment programmes and Calmfors (1994) for a more recentcritique, focusing on the European experience of the 1980s and early 1990s.
The Economic Journal, 120 (November), F452–F477. Doi: 10.1111/j.1468-0297.2010.02387.x. � 2010 The Author(s). The Economic Journal � 2010 Royal
Economic Society. Published by Blackwell Publishing, 9600 Garsington Road, Oxford OX4 2DQ, UK and 350 Main Street, Malden, MA 02148, USA.
[ F452 ]

policies between 1995 and 2007 that meet our inclusion criteria.3 We conduct a meta-analysis using a sample of 199 �programme estimates� – estimated effects for a particularprogramme on a specific group of participants – extracted from these studies.
Importantly, for about one-half of the sample we have both a short-term impactestimate – measuring the effect on participant outcomes approximately one year afterthe completion of the programme – and a medium-term estimate giving the effectapproximately 2 years after completion. We also have longer-term (3 year) impacts forone-quarter of the programmes. These estimates allow us to compare shorter andlonger-term effects of different types of programmes, and test whether certainprogramme features are associated with either a larger or smaller programme impact inthe short run than in the longer run.
In our main analysis we classify the estimates by whether the post-programme impacton the participants is found to be significantly positive, statistically insignificant orsignificantly negative. This simple classification of sign and significance allows us todraw comparisons across studies that use very different dependent variables – rangingfrom the duration of time in registered unemployment to average quarterly earnings –and very different econometric modelling strategies. As a check we also examine theestimated �effect sizes� from the largest subgroup of studies that focus on participants�employment probabilities and compare meta-analytic models for the estimated effectsize with those that use only the sign and significance of the programme effects. Wefind that the two approaches yield very similar conclusions about the role ofprogramme type, participant characteristics and the evaluation methodology on themeasured effectiveness of active labour market programmes.
Consistent with earlier summaries, our analysis suggests that subsidised public sectoremployment programmes are relatively ineffective, whereas job search assistance ( JSA)and related programmes have generally favourable impacts, especially in the short run.Classroom and on-the-job training programmes are not particularly effective in theshort run, but have more positive relative impacts after two years. Comparing acrossdifferent participant groups, we find that programmes for youths are less likely to yieldpositive impacts than untargeted programmes, although in contrast to some earlierreviews we find no large or systematic differences by gender (Bergemann and van denBerg, forthcoming). We also find that evaluations based on the duration of time inregistered unemployment are more likely to show positive short-term impacts thanthose based on direct labour market outcomes (i.e. employment or earnings).
An important issue in the ALMP evaluation literature is the difficulty of controllingfor selection biases that may lead to specious positive or negative programme effects.4
This concern led observers in the 1980s to call for randomised programme evaluations(e.g., Ashenfelter, 1987). In recent years a significant number of randomised trials havebeen conducted, and randomised designs account for nearly 10% of the estimatesin our sample. This feature allows us to compare the results of experimental andnon-experimental evaluations, while controlling for the nature of the programme and
3 Of these 97 studies, 37 were included in the evaluation by Kluve (forthcoming). Most of the others arevery recent – see below.
4 See, e.g., Ashenfelter (1978), Ashenfelter and Card (1985), Heckman and Robb (1985), Lalonde (1986),Heckman, Ichimura et al. (1998), and Heckman et al. (1999). Imbens and Wooldridge (2009) present a surveyof the most recent methodological advances in programme evaluation.
� 2010 The Author(s). The Economic Journal � 2010 Royal Economic Society
[ N O V E M B E R 2010] F453L A B O U R M A R K E T P O L I C Y E V A L U A T I O N S
its participants. We find that the mean differences between the experimental and non-experimental impact estimates are small and statistically insignificant (t < 0.5). We alsotest for potential �publication bias� (Easterbrook et al., 1991) by examining whetherpublished studies are more or less likely to find a positive effect but find no indicationof such a pattern.
The next Section of the article describes our sample of recent microeconometricevaluation studies and the criteria we used for including a study in our analysis sample.Section 2 presents a descriptive overview of the programme estimates we extractedfrom the included studies. Section 3 presents our main meta-analysis results. Section 4concludes the article.
1. Assembling a New Sample of ALMP Programme Estimates
1.1. Initial Survey of Researchers
To develop a comprehensive sample of recent ALMP evaluations we conducted a surveyof academic researchers affiliated with two leading research networks: the Institute forthe Study of Labour (IZA) and the National Bureau of Economic Research (NBER).5
We obtained the email list for IZA research fellows who had indicated an interest in theprogramme area �Evaluation of labour market programmes�, and the list of associates ofthe NBER Labour Studies programme. We sent each network member a personallyaddressed email with a cover letter explaining that we were trying to collect all therecent (post-1990) microeconometric programme evaluation studies that they or theirstudents or colleagues had written. In addition, we attached a questionnaire that weasked them to complete for each study they had produced.6
Our list of IZA fellows was extracted on January 25, 2007 and contained a total of 231names and valid email addresses (excluding the three of us). We emailed the survey onFebruary 21st, 2007. We followed a similar procedure for affiliates of the NBER LabourStudies Programme, extracting names and email addresses on March 20, 2007, andemailing the survey to 113 NBER affiliates who were not on the IZA list on March 22,2007. In our email we asked respondents to identify colleagues and students workingon microeconometric ALMP evaluations. We were forwarded a total of 14 additionalnames that constitute a third subgroup in our sample.
Table 1 summarises the responses to our survey. The overall response rate across the358 researchers we ultimately contacted was 55%. The response rate was somewhathigher for IZA fellows than NBER Associates and was quite high among the small groupof 14 additional researchers referred to us by the original sample members.7 Amongthe respondents, 57% reported that they had no relevant studies to contribute. Theremaining group of 84 researchers returned a total of 156 separate studies that formthe basis for our sample.
5 The formal meta-analysis literature stresses the importance of collecting a comprehensive sample ofstudies (e.g., Higgins and Green, 2008). Much of that literature is concerned with the problem of collectingunpublished studies or studies published in non-journal outlets (so-called �grey literature�). We believe that bysurveying the producers of relevant studies we have largely avoided this problem. In fact, only 64% of theprogramme estimates in our sample are derived from published studies.
6 The questionnaire is available on request.7 The response rate for the 17 NBER members who are also part of IZA was 47%.
F454 [ N O V E M B E RT H E E C O N O M I C J O U R N A L
� 2010 The Author(s). The Economic Journal � 2010 Royal Economic Society

1.2. Selection of Studies
The next step in our process was to define the types of active labour marketprogrammes and the types of evaluation methods that we would consider �in scope� forour meta-analysis. We imposed four restrictions on the kinds of programmes to beincluded. First, the ALMP had to be one of the following types:
• classroom or on-the-job training• job search assistance or sanctions for failing to search8
• subsidised private sector employment• subsidised public sector employment
or a combination of these types. Second, we narrowed the definition of private orpublic employment subsidies to include only individual-level subsidies. That is, weexcluded firm-level subsidy programmes that allow employers to select the individualswhose jobs are subsidised. Third, we restricted attention to time-limited programmes,eliminating open-ended entitlements like education grants and child careprogrammes. Fourth, we decided to focus on programmes with an explicit �active�component. Thus, we excluded purely financial programmes, such as manipulations ofthe benefits available to participants in unemployment insurance, welfare or disabilityprogrammes.
Methodologically, we decided to limit our attention to well-documented empiricalevaluation studies based on individual micro data. We also excluded a few studies thatlacked an explicit comparison group of people who were not subject to the programme(or who entered the programme at a later date).
Applying these rules, we eliminated 33 of the originally submitted studies that did notmeet our ALMP programme requirements and 18 that did not meet our methodologicalcriteria. We also eliminated 8 studies that were written in a language other thanEnglish,9 or had substantial overlap with other studies included in the sample (e.g.,
Table 1
Overview of Survey Responses
NumberContacted
NumberResponses
ResponseRate
Numberwith
1+ Papers
% ofContacts
with Papers
(1) (2) (3) (4) (5)
1. IZA Fellows 231 152 65.8 66 28.62. NBER Labor Studies Affiliates 113 33 29.2 6 5.33. Secondary Contacts 14 12 85.7 12 85.74. Total 358 197 55.0 84 23.5
Note. Results from survey of IZA members with interest in �Evaluation of Labour Market Programmes�,conducted January 2007, and of NBER Labour Studies affiliates, conducted March 2007.Secondary contacts were referred by original sample members.
8 A couple of programmes are actually based on the threat of assignment to a programme, which weinterpret as a form of sanction: see e.g., Hagglund (2007). Sanctions, threats and JSA programmes are allshort-term programmes with little (or no) �lock-in� or �incapacitation� effect – so participants can enter thelabour market very soon after entering the programme.
9 We included studies in other languages if the author(s) returned a completed questionnaire.
2010] F455L A B O U R M A R K E T P O L I C Y E V A L U A T I O N S
� 2010 The Author(s). The Economic Journal � 2010 Royal Economic Society
earlier versions of the same study), or were otherwise incomplete. The remaining 97studies (¼156�33�18�8) form the basis for our empirical analysis. A complete list ofthe studies included in our analysis sample is contained in the online Appendix.
1.3. Extraction of Programme Estimates and Other Information
The third step in our data collection process was to extract information about theprogramme and participants analysed in each study and the estimated programmeimpact(s). Although we initially intended to collect these data from the questionnairesdistributed in our email survey, we were unable to do so because only 38% of authorsreturned a questionnaire (and many of these were only partially complete). Ultimately,we decided to extract the information ourselves.10
Some variables were relatively straightforward to collect, including the type ofprogramme, the age and gender of the participant population, the type of dependentvariable used to measure the impact of the programme and the econometric meth-odology. It proved more difficult to find information on the comparability of thetreatment and control groups, and to gauge the plausibility of the econometricmethodology. Despite the emphasis that prominent methodologists have placed ondocumenting the degree of �overlap� between the characteristics of the participants andthe comparison group, for example, relatively few studies present detailed informationon the pre-programme characteristics of the participants and the comparison group.11
Another (surprising) fact is that very few studies provide information on programmecosts. We decided to use average programme duration as a rough proxy for the size ofthe investment represented by the programme.
The most difficult task, however, proved to be the development of a standardisedmeasure of programme impact that could be compared across studies. This is mainlydue to the wide variation in methodological approaches in the literature. For example,about one-third of the studies in our sample report treatment effects on the exit ratefrom registered unemployment. Very rarely do these studies include enoughinformation to infer the cumulated effect of the programme on the probability ofemployment at some date after the completion of the programme.
Faced with such a diverse set of outcome measures and modelling strategies weabandoned the preferred meta-analytic approach of extracting a standardised �effectsize� estimate from each study.12 Instead, we classified the estimates based on �sign andsignificance� into three categories: significantly positive, insignificantly different fromzero and significantly negative.13 Whenever possible, we extracted the sign andsignificance of the programme impact at three points: a short-term impact at approxi-
10 We found that even graduate-level research assistants had difficulty understanding the studies in detail,so we each read and classified about one-third of the studies. We acknowledge that there are likely to bemeasurement errors and errors of interpretation in the extraction of information from the studies.
11 See e.g., Heckman, Ichimura et al. (1998) and Heckman, Ichimura and Todd (1998).12 The effect size is usually defined as the ratio of the treatment effect on the treated population to the
standard deviation of the outcome variable. See Hedges and Olkin (1985).13 This is slightly different than the so-called �vote count� approach of classifying estimates by whether they
are significantly positive or not because estimates in our context can be significantly negative. Vote counting isproblematic when individual studies have low power (so an insignificant outcome is likely, even when the trueeffect is non-zero).
F456 [ N O V E M B E RT H E E C O N O M I C J O U R N A L
� 2010 The Author(s). The Economic Journal � 2010 Royal Economic Society

mately one year after completion of the programme, a medium-term impact roughly twoyears after programme completion and a long-term impact roughly three years afterprogramme completion.
While we were unable to extract standardised effect sizes from our full sample ofstudies, for a subset of 35 studies that measure programme effects on the probability ofemployment we were able to extract an estimated programme effect and the associatedemployment rate of the comparison group. For these studies we define the estimated�effect size� as the ratio of the estimated programme effect to the standard deviation ofemployment among the comparison group. In Section 3, below, we compare meta-analytic models fit to the programme estimates from this subset of studies using our�sign and significance� measure and the estimated effect size of the programme.
Many studies in our sample report separate impacts for different programme types(e.g., job training versus private sector employment) and ⁄ or for different participantsubgroups. Whenever possible, we extracted separate estimates for each programmetype and participant subgroup combination, classifying participant groups by gender(male, female, or mixed) and age (under 25, 25 and older, or mixed). Overall, weextracted a total of 199 �programme estimates� (estimates for a specific programmeand participant group) from the 97 studies in our sample.14 For many of the pro-gramme/subgroup combinations we have a short-term impact estimate and a mediumand/or long-term impact. Specifically, for 54% of the programme/subgroup combi-nations we have a short-term and medium-term programme impact, while for 24% wehave a short-term and a long-term impact estimate.
1.4. Sample Overview
Table 2 shows the distribution of our sample of programme estimates by the latestpublication date of the study (panel a) and by country (panel b).15 The studiesincluded in our sample are all relatively recent: 90% of the programme estimates comefrom articles or working papers dated 2000 or later and 50% from papers dated 2006 orlater. Just under two-thirds of the estimates are taken from published studies (meas-uring publication status as of January 2010). The estimates cover a total of 26 countries,with the largest numbers from Germany (45 estimates), Denmark (26 estimates),Sweden (19 estimates) and France (14 estimates).
2. Descriptive Analysis
2.1. Programme Types, Participant Characteristics, and Evaluation Methodology
Table 3 presents a summary of the programme types and participant characteristicsrepresented in our sample of 199 programme estimates. To facilitate discussion wehave defined three broad �country groups� that together account for about 70% of theprogramme estimates. Countries in each group share many important institutional
14 A total of 56 studies contribute a single programme estimate, 17 studies contribute 2 estimates, and 24studies contribute 3 or more estimates.
15 Note that 46% of the estimates are from unpublished studies. By �publication date� we mean the date onthe study, whether published or not.
2010] F457L A B O U R M A R K E T P O L I C Y E V A L U A T I O N S
� 2010 The Author(s). The Economic Journal � 2010 Royal Economic Society

features and also tend to have similar design features in their active labour marketprogrammes. The largest group of estimates is from Austria, Germany and Switzerland(AGS) with 67 programme estimates (column 2 of Table 3). The second largest groupis from the Nordic countries (Denmark, Finland, Norway and Sweden) with 53 pro-gramme estimates (column 3). A third distinct group is the �Anglo� countries (Australia,
Table 2
Distribution of Programme Estimates By Latest Date and Country
Number of Estimates % of Sample
(1) (2)
(a) By Latest Revison or Publication Date:1996 2 1.01997 2 1.01998 3 1.51999 13 6.52000 10 5.02001 4 2.02002 18 9.12003 13 6.52004 20 10.12005 12 6.02006 29 14.62007 39 19.62008 14 7.02009 13 6.52010 7 3.5Published Studies 128 64.3
(b) By Country of ProgrammeAustralia 2 1.0Austria 13 6.5Belgium 6 3.0Canada 1 0.5Czech Republic 1 0.5Denmark 25 12.6Dominican Republic 1 0.5Estonia 1 0.5Finland 2 1.0France 14 7.0Germany 45 22.6Hungary 1 0.5Israel 2 1.0Netherlands 4 2.0New Zealand 3 1.5Norway 7 3.5Peru 2 1.0Poland 5 2.5Portugal 2 1.0Romania 4 2.0Slovakia 13 6.5Spain 3 1.5Sweden 19 9.5Switzerland 9 4.5United Kingdom 4 2.0United States 10 5.0
Notes. Sample includes 199 estimates from 97 separate studies.
F458 [ N O V E M B E RT H E E C O N O M I C J O U R N A L
� 2010 The Author(s). The Economic Journal � 2010 Royal Economic Society
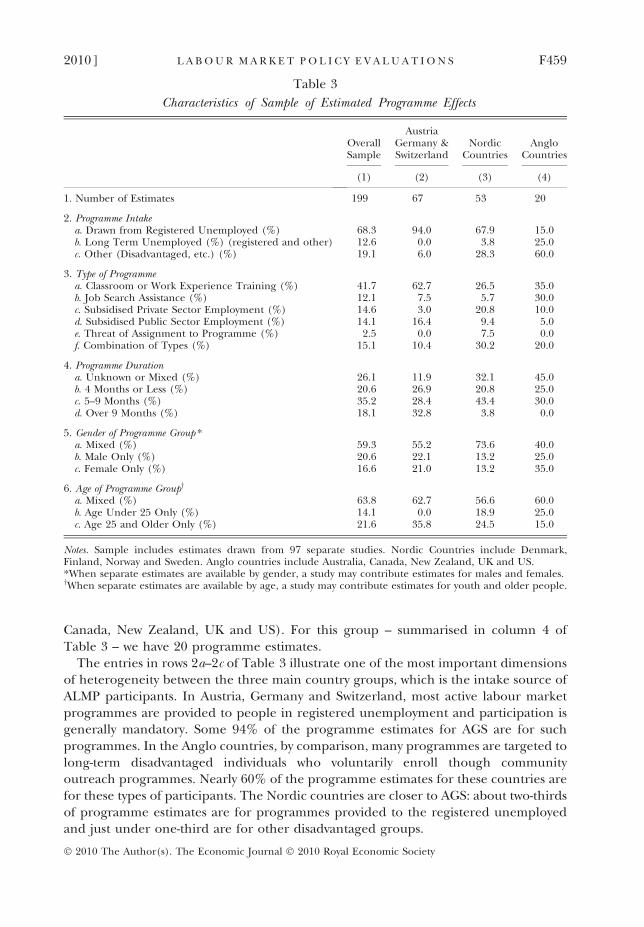
Canada, New Zealand, UK and US). For this group – summarised in column 4 ofTable 3 – we have 20 programme estimates.
The entries in rows 2a–2c of Table 3 illustrate one of the most important dimensionsof heterogeneity between the three main country groups, which is the intake source ofALMP participants. In Austria, Germany and Switzerland, most active labour marketprogrammes are provided to people in registered unemployment and participation isgenerally mandatory. Some 94% of the programme estimates for AGS are for suchprogrammes. In the Anglo countries, by comparison, many programmes are targeted tolong-term disadvantaged individuals who voluntarily enroll though communityoutreach programmes. Nearly 60% of the programme estimates for these countries arefor these types of participants. The Nordic countries are closer to AGS: about two-thirdsof programme estimates are for programmes provided to the registered unemployedand just under one-third are for other disadvantaged groups.
Table 3
Characteristics of Sample of Estimated Programme Effects
OverallSample
AustriaGermany &Switzerland
NordicCountries
AngloCountries
(1) (2) (3) (4)
1. Number of Estimates 199 67 53 20
2. Programme Intakea. Drawn from Registered Unemployed (%) 68.3 94.0 67.9 15.0b. Long Term Unemployed (%) (registered and other) 12.6 0.0 3.8 25.0c. Other (Disadvantaged, etc.) (%) 19.1 6.0 28.3 60.0
3. Type of Programmea. Classroom or Work Experience Training (%) 41.7 62.7 26.5 35.0b. Job Search Assistance (%) 12.1 7.5 5.7 30.0c. Subsidised Private Sector Employment (%) 14.6 3.0 20.8 10.0d. Subsidised Public Sector Employment (%) 14.1 16.4 9.4 5.0e. Threat of Assignment to Programme (%) 2.5 0.0 7.5 0.0f. Combination of Types (%) 15.1 10.4 30.2 20.0
4. Programme Durationa. Unknown or Mixed (%) 26.1 11.9 32.1 45.0b. 4 Months or Less (%) 20.6 26.9 20.8 25.0c. 5–9 Months (%) 35.2 28.4 43.4 30.0d. Over 9 Months (%) 18.1 32.8 3.8 0.0
5. Gender of Programme Group *a. Mixed (%) 59.3 55.2 73.6 40.0b. Male Only (%) 20.6 22.1 13.2 25.0c. Female Only (%) 16.6 21.0 13.2 35.0
6. Age of Programme Groupy
a. Mixed (%) 63.8 62.7 56.6 60.0b. Age Under 25 Only (%) 14.1 0.0 18.9 25.0c. Age 25 and Older Only (%) 21.6 35.8 24.5 15.0
Notes. Sample includes estimates drawn from 97 separate studies. Nordic Countries include Denmark,Finland, Norway and Sweden. Anglo countries include Australia, Canada, New Zealand, UK and US.*When separate estimates are available by gender, a study may contribute estimates for males and females.yWhen separate estimates are available by age, a study may contribute estimates for youth and older people.
2010] F459L A B O U R M A R K E T P O L I C Y E V A L U A T I O N S
� 2010 The Author(s). The Economic Journal � 2010 Royal Economic Society
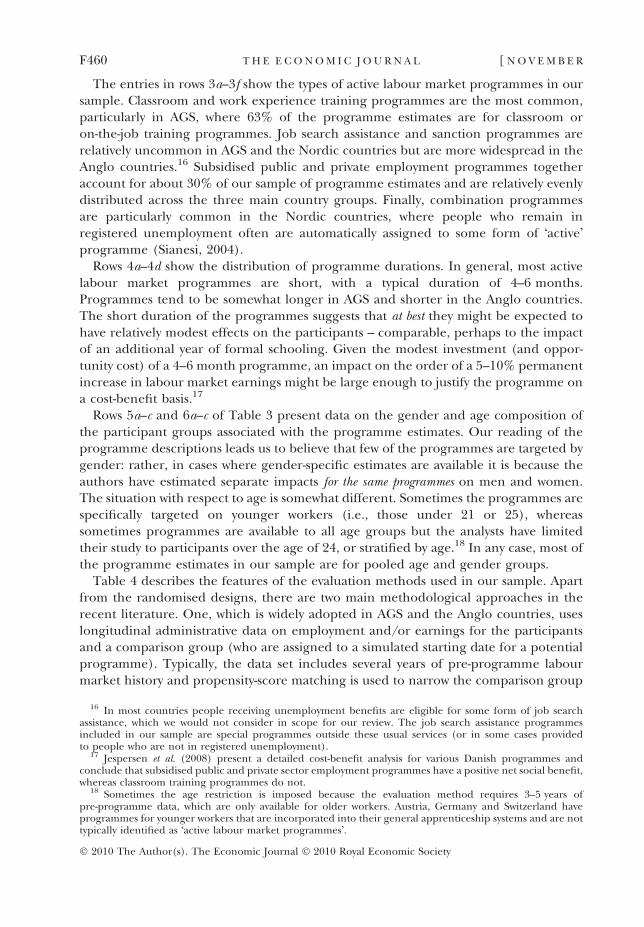
The entries in rows 3a–3f show the types of active labour market programmes in oursample. Classroom and work experience training programmes are the most common,particularly in AGS, where 63% of the programme estimates are for classroom oron-the-job training programmes. Job search assistance and sanction programmes arerelatively uncommon in AGS and the Nordic countries but are more widespread in theAnglo countries.16 Subsidised public and private employment programmes togetheraccount for about 30% of our sample of programme estimates and are relatively evenlydistributed across the three main country groups. Finally, combination programmesare particularly common in the Nordic countries, where people who remain inregistered unemployment often are automatically assigned to some form of �active�programme (Sianesi, 2004).
Rows 4a–4d show the distribution of programme durations. In general, most activelabour market programmes are short, with a typical duration of 4–6 months.Programmes tend to be somewhat longer in AGS and shorter in the Anglo countries.The short duration of the programmes suggests that at best they might be expected tohave relatively modest effects on the participants – comparable, perhaps to the impactof an additional year of formal schooling. Given the modest investment (and oppor-tunity cost) of a 4–6 month programme, an impact on the order of a 5–10% permanentincrease in labour market earnings might be large enough to justify the programme ona cost-benefit basis.17
Rows 5a–c and 6a–c of Table 3 present data on the gender and age composition ofthe participant groups associated with the programme estimates. Our reading of theprogramme descriptions leads us to believe that few of the programmes are targeted bygender: rather, in cases where gender-specific estimates are available it is because theauthors have estimated separate impacts for the same programmes on men and women.The situation with respect to age is somewhat different. Sometimes the programmes arespecifically targeted on younger workers (i.e., those under 21 or 25), whereassometimes programmes are available to all age groups but the analysts have limitedtheir study to participants over the age of 24, or stratified by age.18 In any case, most ofthe programme estimates in our sample are for pooled age and gender groups.
Table 4 describes the features of the evaluation methods used in our sample. Apartfrom the randomised designs, there are two main methodological approaches in therecent literature. One, which is widely adopted in AGS and the Anglo countries, useslongitudinal administrative data on employment and/or earnings for the participantsand a comparison group (who are assigned to a simulated starting date for a potentialprogramme). Typically, the data set includes several years of pre-programme labourmarket history and propensity-score matching is used to narrow the comparison group
16 In most countries people receiving unemployment benefits are eligible for some form of job searchassistance, which we would not consider in scope for our review. The job search assistance programmesincluded in our sample are special programmes outside these usual services (or in some cases providedto people who are not in registered unemployment).
17 Jespersen et al. (2008) present a detailed cost-benefit analysis for various Danish programmes andconclude that subsidised public and private sector employment programmes have a positive net social benefit,whereas classroom training programmes do not.
18 Sometimes the age restriction is imposed because the evaluation method requires 3–5 years ofpre-programme data, which are only available for older workers. Austria, Germany and Switzerland haveprogrammes for younger workers that are incorporated into their general apprenticeship systems and are nottypically identified as �active labour market programmes�.
F460 [ N O V E M B E RT H E E C O N O M I C J O U R N A L
� 2010 The Author(s). The Economic Journal � 2010 Royal Economic Society
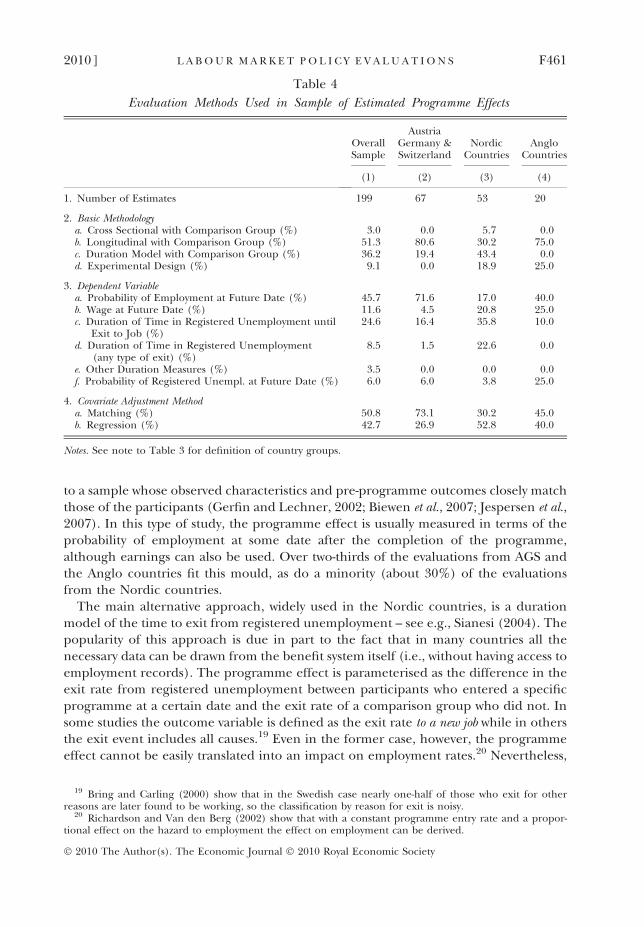
to a sample whose observed characteristics and pre-programme outcomes closely matchthose of the participants (Gerfin and Lechner, 2002; Biewen et al., 2007; Jespersen et al.,2007). In this type of study, the programme effect is usually measured in terms of theprobability of employment at some date after the completion of the programme,although earnings can also be used. Over two-thirds of the evaluations from AGS andthe Anglo countries fit this mould, as do a minority (about 30%) of the evaluationsfrom the Nordic countries.
The main alternative approach, widely used in the Nordic countries, is a durationmodel of the time to exit from registered unemployment – see e.g., Sianesi (2004). Thepopularity of this approach is due in part to the fact that in many countries all thenecessary data can be drawn from the benefit system itself (i.e., without having access toemployment records). The programme effect is parameterised as the difference in theexit rate from registered unemployment between participants who entered a specificprogramme at a certain date and the exit rate of a comparison group who did not. Insome studies the outcome variable is defined as the exit rate to a new job while in othersthe exit event includes all causes.19 Even in the former case, however, the programmeeffect cannot be easily translated into an impact on employment rates.20 Nevertheless,
Table 4
Evaluation Methods Used in Sample of Estimated Programme Effects
OverallSample
AustriaGermany &Switzerland
NordicCountries
AngloCountries
(1) (2) (3) (4)
1. Number of Estimates 199 67 53 20
2. Basic Methodologya. Cross Sectional with Comparison Group (%) 3.0 0.0 5.7 0.0b. Longitudinal with Comparison Group (%) 51.3 80.6 30.2 75.0c. Duration Model with Comparison Group (%) 36.2 19.4 43.4 0.0d. Experimental Design (%) 9.1 0.0 18.9 25.0
3. Dependent Variablea. Probability of Employment at Future Date (%) 45.7 71.6 17.0 40.0b. Wage at Future Date (%) 11.6 4.5 20.8 25.0c. Duration of Time in Registered Unemployment until
Exit to Job (%)24.6 16.4 35.8 10.0
d. Duration of Time in Registered Unemployment(any type of exit) (%)
8.5 1.5 22.6 0.0
e. Other Duration Measures (%) 3.5 0.0 0.0 0.0f. Probability of Registered Unempl. at Future Date (%) 6.0 6.0 3.8 25.0
4. Covariate Adjustment Methoda. Matching (%) 50.8 73.1 30.2 45.0b. Regression (%) 42.7 26.9 52.8 40.0
Notes. See note to Table 3 for definition of country groups.
19 Bring and Carling (2000) show that in the Swedish case nearly one-half of those who exit for otherreasons are later found to be working, so the classification by reason for exit is noisy.
20 Richardson and Van den Berg (2002) show that with a constant programme entry rate and a propor-tional effect on the hazard to employment the effect on employment can be derived.
2010] F461L A B O U R M A R K E T P O L I C Y E V A L U A T I O N S
� 2010 The Author(s). The Economic Journal � 2010 Royal Economic Society

the sign of the treatment effect is interpretable, since a programme that speeds theentry to a new job presumably increases the likelihood of employment and expectedearnings at all future dates. As shown in Table 4, about one-third of the programmeestimates in our sample, and nearly 60% of the estimates for the Nordic countries, arederived from models of this form.
2.2. Summary of Estimated Impacts
As discussed above, our main analysis focuses on the �sign and significance� of theprogramme estimates. Table 5 presents a tabular summary of programme estimatesin our overall sample and the three broad country groups, classified by whetherthe estimate is significantly positive, insignificant, or significantly negative. The entriesin row 1a show that on average the short-term impacts (measured roughly one yearafter programme completion) are slightly more likely to be significantly positive (39%of estimates) than significantly negative (25% of estimates). Thus, there appears to beconsiderable heterogeneity in the measured �success� of ALMPs. Second, the distribu-tion of medium and long-term outcomes is more favourable than the distribution ofshort-term outcomes. In the medium term, for example, 45% of the estimated impacts
Table 5
Summary of Estimated Impacts of ALM Programmes
Percent of Estimates that are:
SignificantlyPositive Insignificant
SignificantlyNegative
(1) (2) (3)
1. Short-term Impact Estimates (�12 Months After Completion of Programme)a. Overall Sample (N = 184) 39.1 36.4 24.5b. Austria, Germany & Switzerland (N = 59) 28.8 40.7 30.5c. Nordic Countries (N = 50) 46.0 30.0 24.0d. Anglo Countries (N = 18) 66.7 16.7 16.6e. Outcome Measure = Probability of Employment (N = 79) 25.3 41.7 33.0f. Median Effect Size for Estimates with Outcome =
Probability of Employment (N = 76)0.21 0.01 �0.21
2. Medium-term Impact Estimates (�24 Months After Completion of Programme)a. Overall Sample (N = 108) 45.4 44.4 10.2b. Austria, Germany & Switzerland (N = 45) 44.4 44.4 11.1c. Nordic Countries (N = 24) 37.5 50.0 12.5d. Anglo Countries (N = 15) 66.7 33.3 0.0e. Outcome Measure = Probability of Employment (N = 66) 39.4 47.0 13.6f. Median Effect Size for Estimates with Outcome = Probability
of Employment (N = 59)0.29 0.03 �0.20
3. Long-term Impact Estimates (36 + Months After Completion of Programme)a. Overall Sample (N = 51) 52.9 41.1 6.0b. Austria, Germany & Switzerland (N = 23) 60.9 39.1 0.0c. Nordic Countries (N = 15) 40.0 46.7 13.3d. Anglo Countries (N = 11) 45.5 45.5 9.0
Notes. See note to Table 3 for definition of country groups. Significance is based on t-ratio for estimate biggeror smaller than 2.0. Effect size for observations with outcome measure ¼ probablity of employment equalsestimated treatment effect divided by standard deviation of outcome in the control group.
F462 [ N O V E M B E RT H E E C O N O M I C J O U R N A L
� 2010 The Author(s). The Economic Journal � 2010 Royal Economic Society

are significantly positive versus 10% significantly negative. The distribution of longer-term (3 years after programme completion) impact estimates is even more favourable,although the sample size is smaller.
A third interesting conclusion from Table 5 is that there are systematic differencesacross country groups in the distribution of impact estimates. In particular, short-termimpacts appear to be relatively unfavourable in Austria, Germany and Switzerland butrelatively favourable in the Anglo countries. One explanation for this pattern is theheterogeneity across country groups in the types of programmes. In fact, as we discussbelow, once we control for the type of programme and other features, the cross-countrydifferences narrow and are no longer significant.
As mentioned earlier, we extracted standardised �effect size� estimates for asubsample of evaluations that use the post-programme probability of employment asthe outcome of interest. In this subsample the fraction of significantly positive short-term estimates is slightly lower than in the sample as a whole, while the fraction ofsignificantly negative estimates is slightly higher (compare row 1e with row 1a). Themedium-term impacts, however, have about the same distribution as in the overallsample (compare row 2e with row 2a). Row 1f of Table 5 shows the average short-termeffect sizes for employment-based studies in each of the three categories, while row 2fshows the average medium-term effect sizes among studies in each category.21 As mightbe expected, the mean effect size for the �insignificant� programme estimates is veryclose to 0. More surprising, perhaps, is that the mean effect size for significantly positiveshort-term estimates (0.21) is equal in magnitude but opposite in sign to the meaneffect size for significantly negative short-term estimates (�0.21). This symmetry isconsistent with the assumption that the t-statistic for a programme estimate isproportional to the effect size. As we discuss below, in this case an analysis of the signand significance of the programme estimates yields the same conclusions as an analysisof the effect size of different programmes.
The relationship between the programme impacts at different time horizons isillustrated in Tables 6a and 6b, which show cross-tabulations between short andmedium-term impacts (Table 6a) or short and long-term outcomes (Table 6b) for thesame programme. In both cases the estimated programme impacts appear to becomemore positive over time. For example, 31% of the programmes with a significantlynegative short-term impact have a significantly positive medium-term impact, whereasnone of the programmes with an insignificant or significantly positive short-termimpact has a significantly negative medium-term impact. Likewise, most of the pro-grammes with a significantly negative short-term impact show either a significantlypositive or insignificant long-term impact.
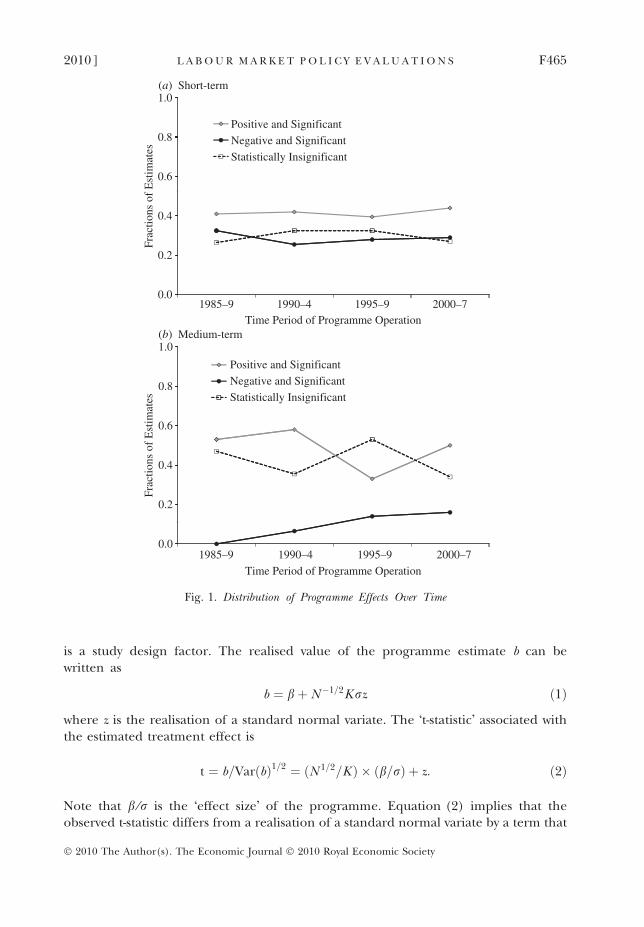
One important question in the evaluation literature is whether ALMPs have becomemore effective over time; see e.g., the discussion in Lechner and Wunsch (2006).Figures 1a and 1b present some simple evidence suggesting that the answer is �no�. TheFigures show the distributions of short-term and medium-term programme estimatesfor programmes operated in four time periods: the late 1980s, the early 1990s, the late1990s and the post-2000 period. While there is some variability over time, particularly in
21 Recall that the effect size is the estimated programme effect in the probability of employment, divided bythe average employment rate of the control group.
2010] F463L A B O U R M A R K E T P O L I C Y E V A L U A T I O N S
� 2010 The Author(s). The Economic Journal � 2010 Royal Economic Society

the distributions of medium term impacts, which are based on relatively small samples,there is no tendency for the most recent programmes to exhibit better or worse out-comes than programmes from the late 1980s.
3. Multivariate Models of the Sign/Significance of Programme Estimates
3.1. Meta-Analytic Model
We begin by discussing the conditions under which an analysis of the sign andsignificance of the programme estimates from a sample of studies is informative aboutthe actual effectiveness of the underlying programmes. Assume that the ith programmeestimate, b, is derived from an econometric procedure such that b is normally distrib-uted around the true treatment effect b with variance V 2⁄N, where N represents theoverall sample size used in the evaluation, i.e.,
b � Nðb;V 2=N Þ:
Assume that V ¼ Kr, where r is the standard deviation of the outcome variableused in the evaluation (e.g., r ¼ standard deviation of earnings per month) and K
Table 6b
Relation Between Short-term and Long-term Impacts of ALM Programmes
% of Long-term Estimates that are:
SignificantlyPositive Insignificant
SignificantlyNegative
(1) (2) (3)
Short-term Impact Estimate:a. Significantly Positive (N = 19) 73.7 21.1 5.3b. Insignificant (N = 13) 30.8 69.2 0.0c. Significantly Negative (N = 16) 43.8 43.8 12.5
Note. Sample includes studies that report short-term and long-term impact estimates for sameprogramme and same participant group.
Table 6a
Relation Between Short-term and Medium-term Impacts of ALM Programmes
% of Medium-term Estimates that are:
SignificantlyPositive Insignificant
SignificantlyNegative
(1) (2) (3)
Short-term Impact Estimate:a. Significantly Positive (N = 30) 90.0 10.0 0.0b. Insignificant (N = 28) 28.6 71.4 0.0c. Significantly Negative (N = 36) 30.6 41.7 27.8
Note. Sample includes studies that report short-term and medium-term impact estimates for sameprogramme and same participant group.
F464 [ N O V E M B E RT H E E C O N O M I C J O U R N A L
� 2010 The Author(s). The Economic Journal � 2010 Royal Economic Society
is a study design factor. The realised value of the programme estimate b can bewritten as
b ¼ bþ N �1=2Krz ð1Þ
where z is the realisation of a standard normal variate. The �t-statistic� associated withthe estimated treatment effect is
t ¼ b=VarðbÞ1=2 ¼ ðN 1=2=K Þ � ðb=rÞ þ z: ð2Þ
Note that b ⁄r is the �effect size� of the programme. Equation (2) implies that theobserved t-statistic differs from a realisation of a standard normal variate by a term that
1.0(a)
(b)
0.8Positive and Significant
Negative and Significant
0.6
Statistically Insignificant
0.4
0.2
Frac
tions
of
Est
imat
es
0.01985–9 1990–4
Time Period of Programme Operation
Time Period of Programme Operation
1995–9 2000–7
1.0Medium-term
Short-term
0.8
Positive and Significant
Negative and Significant
Statistically Insignificant
0.6
0.4
0.2
Frac
tions
of
Est
imat
es
0.01985–9 1990–4 1995–9 2000–7
Fig. 1. Distribution of Programme Effects Over Time
2010] F465L A B O U R M A R K E T P O L I C Y E V A L U A T I O N S
� 2010 The Author(s). The Economic Journal � 2010 Royal Economic Society

reflects a combination of the effect size of the programme, the sample size, and thedesign effect K.22
Suppose that in a sample of programme estimates the ratio N ½ ⁄K is constant, andthat the effect size of the ith programme depends on a set of observable covariates (X):
b=r ¼ Xa: ð3Þ
Under these assumptions an appropriate model for the observed t-statistic from the i thprogramme is
t ¼ Xa0 þ z; ð4Þ
where a0 = (N ½⁄K) a. Since z is normally distributed (with variance 1) (4) implies thatthe probability of observing a significantly negative programme estimate (t��2), aninsignificant estimate (�2 < t < 2) or a significantly positive estimate (t � 2) is givenby an ordered probit model with index function Xa0.
The value of N ½⁄K – which can be interpreted as the �effective sample size� under-lying a given programme estimate, taking account of sample size and design complexity– clearly varies across the evaluations included in our sample. Nevertheless, we believethat the tendency for researchers to use more complex research designs (with highervalues of K ) when bigger samples are available tends to largely offset the �mechanical�effect of sample size on the distribution of t-statistics. In this case an analysis of the �signand significance� of the programme estimates provides a useful guide to the determi-nants of the effectiveness of ALMPs.
We conduct two specification tests designed to evaluate the validity of our mainanalysis, based on sign and significance of the programme estimates. First, we estimatesimple probit models for the likelihood of significantly positive or significantly negativeprogramme effects that include the square root of the sample size as an additionalexplanatory variable. If the �effective� sample size systematically varies with the actualsample size (i.e., if N ½⁄K is increasing in N ) then we would expect to see more largepositive t-statistics and more large negative t-statistics from studies with larger samplesizes. In fact, as we show below, these simple probit models show no relationship betweenthe sample size and the probability of either a significantly positive or significantlynegative t-statistic, confirming that the �mechanical� effect of sample size is mitigated byother design factors.
As a second test, we fit an alternative meta-analysis model to the programmeestimates derived from the subsample of programmes that measure impacts of theprobability of employment. For these studies we extract an estimate of the effect sizeb ⁄ s, where s is the estimated standard deviation of the outcome of interest (employ-ment status) in the comparison group. Assuming that
b=s ¼ b=rþ e;
where e represents the sampling error for the estimated effect size in the i thprogramme, (3) implies that:
22 For example in a randomised evaluation with equal-sized treatment and control groups, if theprogramme causes a simple shift in the mean of the treatment group then K ¼ 2.
F466 [ N O V E M B E RT H E E C O N O M I C J O U R N A L
� 2010 The Author(s). The Economic Journal � 2010 Royal Economic Society

b=s ¼ Xaþ e: ð5Þ
We therefore fit a linear regression of the estimated effect sizes on the covariates X andcompare the vector of estimated coefficients to the estimates from our ordered probitspecification. If N ½ ⁄ K is indeed constant, then the coefficients from the orderedprobit model of sign and significance and the OLS model of effect sizes should beproportional (with a factor of proportionality ¼ a0/a ¼ N ½/K).
3.2. Main Estimation Results
Tables 7 and 8 present the main findings from our meta-analysis. Table 7 shows a seriesof models for the likelihood of a significantly positive, significantly negative, or insig-nificant short-run programme estimate, while Table 8 presents a parallel set of modelsfor the medium-term programme estimates, and for the change between the short-termand medium-term estimates. We begin in Table 7 by separately examining the fourmain dimensions of heterogeneity across the studies in our sample. The model incolumn 1 includes a set of dummy variables for the choice of outcome variable used inthe study. These are highly significant determinants of the short-term �success� of aprogramme (i.e., roughly one year after programme completion). In particular, pro-gramme estimates derived from models of the time in registered unemployment untilexit to a job (row 1), or the time in registered unemployment until any exit (row 2) orthe probability of being in registered unemployment (row 4) are more likely to yield asignificant positive t-statistic than those derived from models of post-programmeemployment (the omitted base group). We are unsure of the explanation for thisfinding, although discrepancies between results based on registered unemploymentand employment have been noted before in the literature (Card et al., 2007).23
The model in column 2 of Table 7 summarises the patterns of sign and significancefor different programme types. In the short run, classroom and on-the-job trainingprogrammes appear to be less successful than the omitted group (combined pro-grammes) while job search assistance programmes appear (weakly) more successful. The�least successful� programmes are subsidised public sector jobs programmes – a resultthat parallels the findings in Kluve�s (forthcoming) study of an earlier group of studies.
The model in column 3 compares programme estimates by age and gender. Inter-estingly, the programme estimates for people under 25 and those age 25 and over bothappear to be more negative than the estimates for mixed age groups. We suspect thispattern reflects some combination of programme characteristics and other factors thatare shared by the studies that estimate separate effects by age (rather than an effect ofparticipant age per se). In contrast to the results by age, the comparisons by gender arenever statistically significant.24 Finally, column 4 presents models that compare shorter
23 It is possible for example that assignment to an ALMP causes people to leave the benefit system withoutmoving to a job. In this case programmes will appear to be more effective in reducing registered unem-ployment than in increasing employment.
24 We were able to extract separate short-term programme estimates for men and women in the sameprogramme from a total of 28 studies. Within this subgroup, the estimates for the two gender groups have thesame sign ⁄ significance in 14 cases (50%); the women have a more positive outcome in 8 cases (29%); and thewomen have a less positive outcome in 6 cases (21%). The symmetry of these comparisons provides furtherevidence that programme outcomes tend to be very similar for women and men.
2010] F467L A B O U R M A R K E T P O L I C Y E V A L U A T I O N S
� 2010 The Author(s). The Economic Journal � 2010 Royal Economic Society

Table 7
Ordered Probit Models for Sign ⁄Significance of Estimated Short-term Programme Impacts
Dependent variable ¼ ordinal indicator forsign/significance of estimated impact
(1) (2) (3) (4) (5) (6)
Dummies for Dependent Variable (omitted = Post-programme employment )1. Time in Reg. Unemp. Until Exit to Job 0.47 – – – 0.34 0.18
(0.20) (0.24) (0.28)2. Time in Registered Unemp. 0.85 – – – 0.84 0.88
(0.36) (0.39) (0.49)3. Other Duration Measure 0.29 – – – 0.17 �0.07
(0.21) (0.31) (0.31)4. Prob. Of Registered Unemp. 1.38 – – – 1.22 0.92
(0.47) (0.58) (0.66)5. Post-programme Earnings 0.26 – – – 0.09 �0.07
(0.37) (0.38) (0.48)
Dummies for Type of Programme (omitted = Mixed and Other )6. Classroom or On-the-Job Training – �0.30 – – 0.04 0.22
(0.26) (0.30) (0.38)7. Job Search Assistance – 0.35 – – 0.41 0.72
(0.34) (0.36) (0.44)8. Subsidised Private Sector Job – �0.50 – – �0.25 �0.14
(0.31) (0.35) (0.42)9. Subsidised Public Sector Job – �0.67 – – �0.50 �0.31
(0.38) (0.37) (0.46)
Dummies for Age and Gender of Participants (omitted = Pooled Age, Pooled Gender )10. Age Under 25 Only – – �0.70 – �0.67 �0.69
(0.29) (0.28) (0.32)11. Age 25 and Older Only – – �0.55 – �0.57 �0.51
(0.25) (0.27) (0.30)12. Men Only – – �0.10 – �0.03 �0.11
(0.24) (0.22) (0.24)13. Women Only – – �0.03 – 0.00 �0.07
(0.23) (0.21) (0.25)
Dummies for Programme Duration (omitted = 5–9 month duration)14. Unknown or Mixed – – – 0.42 0.07 0.10
(0.24) (0.25) (0.28)15. Short (� 4 Months) – – – 0.33 �0.04 0.00
(0.22) (0.27) (0.29)16. Long (>9 Months) – – – �0.07 �0.24 �0.24
(0.31) (0.35) (0.38)17. Dummies for Intake Group and Timing of Programme No No No No No Yes18. Dummies for Country Group No No No No No Yes19. Dummy for Experimental Design – – – – – �0.06
(0.40)20. Square Root of Sample Size (Coefficient � 1000) – – – – – �0.02
(0.03)21. Dummy for Published – – – – – �0.18
(0.26)Pseudo R-squared 0.04 0.03 0.03 0.02 0.10 0.12
Notes. Standard errrors (clustered by study) in parentheses. Sample size for all models is 181 programmeestimates. Models are ordered probits, fit to ordinal data with value of +1 for significant positive estimate, 0 forinsignificant estimate, and �1 for significant negative estimate. Estimated cutpoints (2 for each model) arenot reported in the Table.
F468 [ N O V E M B E RT H E E C O N O M I C J O U R N A L
� 2010 The Author(s). The Economic Journal � 2010 Royal Economic Society

Table 8
Ordered Probit Models for Sign/Significance of Medium-term Impacts and Change inImpact from Short-term to Medium-term
Medium-termImpact
Change in Impact:Short-term toMedium-term
(1) (2) (3) (4)
Dummies for Dependent Variable (omitted ¼ Post-programme employment )1. Time in Reg. Unemp. Until Exit to Job 1.29 0.95 �0.10 0.66
(0.68) (1.04) (1.01) (1.30)2. Other Duration Measure 0.63 0.21 1.07 2.40
(0.46) (1.05) (0.43) (1.30)3. Prob. Of Registered Unemp. 0.59 0.15 �0.55 �0.97
(0.93) (1.04) (0.32) (0.51)4. Post-programme Earnings 0.45 0.65 0.18 �0.11
(0.34) (0.63) (0.32) (0.57)
Dummies for Type of Programme (omitted ¼ Mixed and Other )5. Classroom or On-the-Job Training 0.74 1.14 0.81 0.84
(0.49) (0.68) (0.34) (0.64)6. Job Search Assistance 0.49 1.16 0.38 0.42
(0.61) (0.85) (0.40) (0.88)7. Subsidised Private Sector Job 0.36 0.79 0.22 0.38
(0.62) (0.92) (0.58) (0.65)8. Subsidised Public Sector Job �0.92 �0.46 0.40 0.24
(0.57) (0.74) (0.43) (0.68)
Dummies for Age and Gender of Participants (omitted ¼ Pooled Age, Pooled Gender )9. Age Under 25 Only �0.82 �0.96 0.15 0.79
(0.28) (0.53) (0.30) (0.55)10. Age 25 and Older Only �0.92 �0.83 �0.12 �0.16
(0.41) (0.52) (0.44) (0.60)11. Men Only 0.03 �0.28 0.31 0.47
(0.32) (0.45) (0.31) (0.45)12. Women Only 0.32 0.17 0.34 0.29
(0.36) (0.44) (0.28) (0.44)
Dummies for Programme Duration (omitted ¼ 5–9 month duration)13. Unknown or Mixed �1.08 �1.57 �0.89 �1.00
(0.33) (0.46) (0.37) (0.46)14. Short (� 4 Months) �0.29 �0.41 �0.61 �0.35
(0.36) (0.46) (0.44) (0.52)15. Long (>9 Months) �0.34 �0.50 �0.30 �0.36
(0.30) (0.37) (0.50) (0.68)16. Dummy for Experimental Design 0.41 – �0.12
(0.83) (0.70)17. Square Root of Sample Size (Coefficient � 1000) 0.13 – �0.10
(0.13) (0.11)18. Dummy for Published �0.08 0.61
(0.34) (0.33)Pseudo R-squared 0.19 0.26 0.09 0.14
Notes. Standard errrors (clustered by study) in parentheses. Sample size for all models is 92 programme esti-mates. Models in columns 1 and 2 are ordered probit models, fit to ordinal data with value of +1 for significantpositive estimate, 0 for insignificant estimate, and�1 for significant negative estimate. Models in columns 3 and4 are ordered probit models, fit to ordinal data with values of +2, +1, 0, and �1, representing the change formthe short-term impact to the medium-term impact. Estimated cutpoints are not reported in the Table.
2010] F469L A B O U R M A R K E T P O L I C Y E V A L U A T I O N S
� 2010 The Author(s). The Economic Journal � 2010 Royal Economic Society
and longer duration programmes. There is no evidence here that longer durationprogrammes are more effective than short programmes.
Columns 5 and 6 of Table 7 present models that control for all four dimensions ofheterogeneity simultaneously. The extended specification in column 6 also includesdummies for the intake group (registered unemployed, disadvantaged workers, orlong-term unemployed), the time period of the programme (in 5-year intervals), andthe three main country groups, as well as controls for experimental design, sample size,and publication status. As in the simpler models, the coefficients from the multivariatemodels suggest that evaluations based on measures of registered unemployment aremore likely to show positive short-term impacts than those based on post-programmeemployment or earnings, while job search assistance programmes have more positiveimpacts than training or subsidised employment programmes. The gender andage effects in columns 5 and 6 are similar to those from the model in column 3, andthe programme duration effects are not too different from the effects in the model incolumn 4.
Although the coefficients are not reported in Table 7, another notable finding fromthe specification in column 6 is that the dummies for the country group are jointlyinsignificant.25 Thus, differences in the outcome variable, the type of programme andthe characteristics of programme participants appear to explain the rather largedifferences across countries that are apparent in rows 1b–1d of Table 5.
The estimated coefficients in column 6 associated with experimental designs, pub-lished studies and sample size are all small in magnitude and statistically insignificant.The estimate of the experimental design effect suggests that controlling for theoutcome measure, the programme type and the participant group, non-experimentalestimation methods tend to yield the same distribution of sign and significance asexperimental estimators.26 Likewise the estimated coefficient for published studiessuggests that these are no more (or less) likely to show significantly positive programmeeffects than their unpublished counterparts. The sample size effect is harder tointerpret, since if larger samples lead to more precise results we might expect offsettingeffects on the likelihood of obtaining significantly positive and significantly negativeeffects. We return to the sample size effect in the �one-sided� probit models below.
Columns 1 and 2 of Table 8 present a parallel set of ordered probit models for themedium-term programme effects (measured about 2 years after programme comple-tion). Given the smaller number of medium-term programme estimates (91 versus 180short-term estimates) the extended specification in column 2 of Table 8 includescontrols for sample size, experimental design and publication status but excludes thecontrols for intake group, time period and country group. Although the standarderrors are relatively large, the estimates point to several notable differences in thedeterminants of short-term and medium term impacts.
25 The estimated coefficients (and standard errors) are: AGS 0.06 (0.35); Nordic countries 0.23 (0.34);Anglo countries 0.05 (0.55), all relative to the omitted group of other countries.
26 Half of the experimental programme estimates use register-based outcomes. If we include an interactionbetween experimental design and register-based outcome the coefficient is insignificant (t ¼ 0.5), so there isno indication of a differential bias in studies that use register-based and other outcome measures, though thepower of the test is limited.
F470 [ N O V E M B E RT H E E C O N O M I C J O U R N A L
� 2010 The Author(s). The Economic Journal � 2010 Royal Economic Society

To evaluate these differences more carefully, we decided to fit a set of models forthe change in the relative �success� of a given programme from the short term to themedium term. Specifically we coded the change as +2 if the programme estimatechanged from significantly negative in the short term to significantly positive in themedium term, +1 if the estimate moved from significantly negative to insignificant, orfrom insignificant to significantly positive, 0 if the short-term and medium-termestimates were classified the same, and �1 if the estimate moved from significantlypositive to insignificant, or from insignificant to significantly negative. While thecoding system is somewhat arbitrary we believe it captures the trend over time inthe sign and significance of the impact estimates for any given programme.
Ordered probit models fitted to the change in impact measure are presented in col-umns 3 and 4 of Table 8. The results are somewhat imprecise but generally confirm theimpressions from a simple comparison of the short-term and medium-term models. Oneclear finding is that impact estimates from studies that look at the probability of regis-tered unemployment tend to fade between the short term and medium term, relative toimpact estimates from other methods (which on average become more positive). A secondfinding is that the impact of training programmes tends to rise between the short andmedium runs. Interestingly, a similar result has been reported in a recent long-termevaluation of welfare reform policies in the US (Hotz et al., 2006). This study concludesthat although job search assistance programmes dominate training in the short run, overlonger horizons the gains to human capital development policies are larger.
3.3. Evaluating the Meta-Analysis Model
One simple way to test the implicit restrictions of our ordered probit model is tofit separate probit models for the events of a significantly positive and significantlynegative impact estimate. As noted above, it is also interesting to include a measure ofsample size (specifically, the square root of the sample size) in these specifications,because unless researchers are adjusting their designs to hold effective sample sizeapproximately constant, one might expect more large negative t-statistics and morelarge positive t-statistics from evaluations that use larger samples.
Table 9 shows three specifications for short-run programme impact. Column 1reproduces the estimates from the ordered probit specification in column 5 of Table 7.Column 2 presents estimates from a probit model, fit to the event of a significantlypositive short-run impact. Column 3 presents estimates from a similar probit model, fitto the event of a significantly negative short-run impact. Under the assumption that theordered probit specification is correct, the coefficients in column 2 should be the sameas those in column 1, while the coefficients in column 3 should be equal in magnitudeand opposite in sign.27
Although the coefficients are not in perfect agreement with this prediction, ourreading is that the restrictions are qualitatively correct. In particular, the probitcoefficients for the covariates that have larger and more precisely estimated coefficientsin the ordered probit model (such as the coefficients in rows 2, 7, 9, 10, and 11 of
27 The full set of covariates cannot be included in the probit model for a significantly negative impactestimate because some covariates predict the outcome perfectly.
2010] F471L A B O U R M A R K E T P O L I C Y E V A L U A T I O N S
� 2010 The Author(s). The Economic Journal � 2010 Royal Economic Society
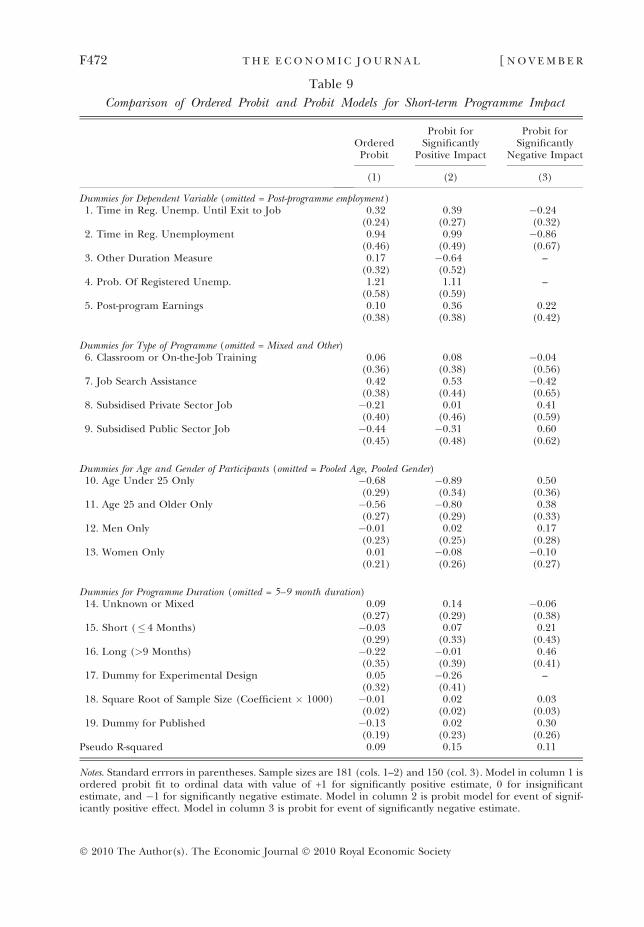
Table 9
Comparison of Ordered Probit and Probit Models for Short-term Programme Impact
OrderedProbit
Probit forSignificantly
Positive Impact
Probit forSignificantly
Negative Impact
(1) (2) (3)
Dummies for Dependent Variable (omitted = Post-programme employment )1. Time in Reg. Unemp. Until Exit to Job 0.32 0.39 �0.24
(0.24) (0.27) (0.32)2. Time in Reg. Unemployment 0.94 0.99 �0.86
(0.46) (0.49) (0.67)3. Other Duration Measure 0.17 �0.64 –
(0.32) (0.52)4. Prob. Of Registered Unemp. 1.21 1.11 –
(0.58) (0.59)5. Post-program Earnings 0.10 0.36 0.22
(0.38) (0.38) (0.42)
Dummies for Type of Programme (omitted = Mixed and Other)6. Classroom or On-the-Job Training 0.06 0.08 �0.04
(0.36) (0.38) (0.56)7. Job Search Assistance 0.42 0.53 �0.42
(0.38) (0.44) (0.65)8. Subsidised Private Sector Job �0.21 0.01 0.41
(0.40) (0.46) (0.59)9. Subsidised Public Sector Job �0.44 �0.31 0.60
(0.45) (0.48) (0.62)
Dummies for Age and Gender of Participants (omitted = Pooled Age, Pooled Gender)10. Age Under 25 Only �0.68 �0.89 0.50
(0.29) (0.34) (0.36)11. Age 25 and Older Only �0.56 �0.80 0.38
(0.27) (0.29) (0.33)12. Men Only �0.01 0.02 0.17
(0.23) (0.25) (0.28)13. Women Only 0.01 �0.08 �0.10
(0.21) (0.26) (0.27)
Dummies for Programme Duration (omitted = 5–9 month duration)14. Unknown or Mixed 0.09 0.14 �0.06
(0.27) (0.29) (0.38)15. Short (� 4 Months) �0.03 0.07 0.21
(0.29) (0.33) (0.43)16. Long (>9 Months) �0.22 �0.01 0.46
(0.35) (0.39) (0.41)17. Dummy for Experimental Design 0.05 �0.26 –
(0.32) (0.41)18. Square Root of Sample Size (Coefficient � 1000) �0.01 0.02 0.03
(0.02) (0.02) (0.03)19. Dummy for Published �0.13 0.02 0.30
(0.19) (0.23) (0.26)Pseudo R-squared 0.09 0.15 0.11
Notes. Standard errrors in parentheses. Sample sizes are 181 (cols. 1–2) and 150 (col. 3). Model in column 1 isordered probit fit to ordinal data with value of +1 for significantly positive estimate, 0 for insignificantestimate, and �1 for significantly negative estimate. Model in column 2 is probit model for event of signif-icantly positive effect. Model in column 3 is probit for event of significantly negative estimate.
F472 [ N O V E M B E RT H E E C O N O M I C J O U R N A L
� 2010 The Author(s). The Economic Journal � 2010 Royal Economic Society
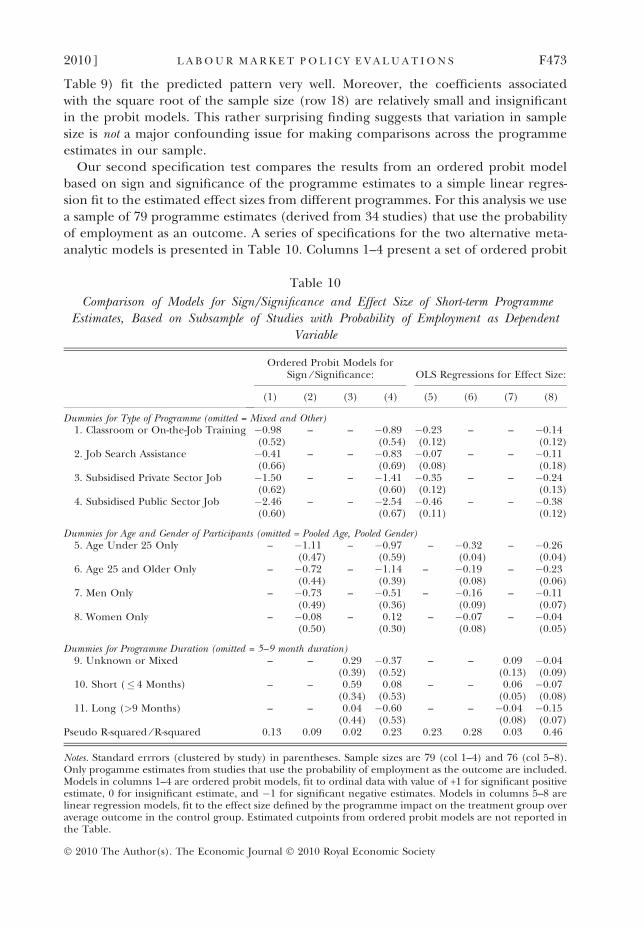
Table 9) fit the predicted pattern very well. Moreover, the coefficients associatedwith the square root of the sample size (row 18) are relatively small and insignificantin the probit models. This rather surprising finding suggests that variation in samplesize is not a major confounding issue for making comparisons across the programmeestimates in our sample.
Our second specification test compares the results from an ordered probit modelbased on sign and significance of the programme estimates to a simple linear regres-sion fit to the estimated effect sizes from different programmes. For this analysis we usea sample of 79 programme estimates (derived from 34 studies) that use the probabilityof employment as an outcome. A series of specifications for the two alternative meta-analytic models is presented in Table 10. Columns 1–4 present a set of ordered probit
Table 10
Comparison of Models for Sign/Significance and Effect Size of Short-term ProgrammeEstimates, Based on Subsample of Studies with Probability of Employment as Dependent
Variable
Ordered Probit Models forSign ⁄ Significance: OLS Regressions for Effect Size:
(1) (2) (3) (4) (5) (6) (7) (8)
Dummies for Type of Programme (omitted = Mixed and Other)1. Classroom or On-the-Job Training �0.98 – – �0.89 �0.23 – – �0.14
(0.52) (0.54) (0.12) (0.12)2. Job Search Assistance �0.41 – – �0.83 �0.07 – – �0.11
(0.66) (0.69) (0.08) (0.18)3. Subsidised Private Sector Job �1.50 – – �1.41 �0.35 – – �0.24
(0.62) (0.60) (0.12) (0.13)4. Subsidised Public Sector Job �2.46 – – �2.54 �0.46 – – �0.38
(0.60) (0.67) (0.11) (0.12)
Dummies for Age and Gender of Participants (omitted = Pooled Age, Pooled Gender)5. Age Under 25 Only – �1.11 – �0.97 – �0.32 – �0.26
(0.47) (0.59) (0.04) (0.04)6. Age 25 and Older Only – �0.72 – �1.14 – �0.19 – �0.23
(0.44) (0.39) (0.08) (0.06)7. Men Only – �0.73 – �0.51 – �0.16 – �0.11
(0.49) (0.36) (0.09) (0.07)8. Women Only – �0.08 – 0.12 – �0.07 – �0.04
(0.50) (0.30) (0.08) (0.05)
Dummies for Programme Duration (omitted = 5–9 month duration)9. Unknown or Mixed – – 0.29 �0.37 – – 0.09 �0.04
(0.39) (0.52) (0.13) (0.09)10. Short (� 4 Months) – – 0.59 0.08 – – 0.06 �0.07
(0.34) (0.53) (0.05) (0.08)11. Long (>9 Months) – – 0.04 �0.60 – – �0.04 �0.15
(0.44) (0.53) (0.08) (0.07)Pseudo R-squared ⁄ R-squared 0.13 0.09 0.02 0.23 0.23 0.28 0.03 0.46
Notes. Standard errrors (clustered by study) in parentheses. Sample sizes are 79 (col 1–4) and 76 (col 5–8).Only progamme estimates from studies that use the probability of employment as the outcome are included.Models in columns 1–4 are ordered probit models, fit to ordinal data with value of +1 for significant positiveestimate, 0 for insignificant estimate, and �1 for significant negative estimates. Models in columns 5–8 arelinear regression models, fit to the effect size defined by the programme impact on the treatment group overaverage outcome in the control group. Estimated cutpoints from ordered probit models are not reported inthe Table.
2010] F473L A B O U R M A R K E T P O L I C Y E V A L U A T I O N S
� 2010 The Author(s). The Economic Journal � 2010 Royal Economic Society

models that parallel the models in columns 2–5 of Table 7. Estimates from the subset ofstudies that use the probability of employment as an outcome measure are generallysimilar to the estimates from the wider sample: in particular, subsidised public sectorprogrammes appear to be relatively ineffective, while programme estimates forparticipants under age 25 and for age 25 and older both tend to be relatively un-favourable. More importantly, the estimates from the ordered probit models incolumns 1–4 appear to be very close to linear rescalings of the coefficients from theOLS models in columns 5–8 (with a scale factor of roughly 6), as would be predicted ifthe t-statistics for the programme estimates are proportional to the associated effectsizes. This consistency is illustrated in Figure 2, where we plot the ordered probitcoefficients from the model in column 4 of Table 10 against the corresponding OLScoefficients from the model in column 8. The two sets of estimates are very highlycorrelated (q ¼ 0.93) and lie on a line with slope of roughly 6.5 and intercept close to0. (The t-statistic for the test that the intercept is 0 is 1.32).
Overall, we interpret the estimates in Table 10 and the pattern of coefficients inFigure 2 as providing relatively strong support for the hypothesis that the t-statisticsassociated with the programme estimates in the recent ALMP evaluation literature areproportional to the underlying effect sizes. Under this assumption, a vote-countinganalysis (i.e., a probit analysis for the event of a significantly positive estimate), anordered probit analysis of sign and significance, and a regression analysis of the effectsize all yield the same conclusions about the determinants of programme success.Surprisingly, perhaps, this prediction is confirmed by the models in Tables 9 and 10.
3.4. Estimates for Germany
A concern with any meta-analysis that attempts to draw conclusions across studies frommany different countries is that the heterogeneity in institutional environments is so
–1.5
–1.0
–0.5
0.0
0.5
–3.0
–2.5
–2.0
–0.40 –0.35 –0.30 –0.25 –0.20 –0.15 –0.10 –0.05 0.00
Coe
ffic
ient
fro
m O
rder
ed P
robi
t Mod
elof
Sig
n/Si
gnif
ican
ce
Coefficient from OLS Model of Effect Size
Fitted Regression:Ordered Probit = 6.48 × OLS + 0.22
(0.48) (0.17)
Fig. 2. Comparison of Coefficients from Alternative Meta-Analysis Models
F474 [ N O V E M B E RT H E E C O N O M I C J O U R N A L
� 2010 The Author(s). The Economic Journal � 2010 Royal Economic Society

great as to render the entire exercise uninformative. Although the absence of large orsignificant country group effects in our pooled models suggests this may not be aparticular problem, we decided to attempt a within-country analysis for the countrywith the largest number of individual programme estimates in our sample: Germany.Since we have only 41 short-term impact estimates from Germany, and only 36 medium-term estimates, we adopted a relatively parsimonious model that included only 4 mainexplanatory variables: a dummy for classroom or on-the-job training programmes, adummy for programmes with only older (age 25 and over) participants, a measure ofprogramme duration (in months), and a dummy for programmes operated in theformer East Germany.
Results from fitting this specification are presented in Appendix Table A1. There arefour main findings. First, as in our overall sample, the short-run impact of classroom andon-the-job training programmes is not much different from other types of programmes.But, in the medium run, training programmes are associated with significantly morepositive impacts. Second, as in our larger sample, it appears that programmes for olderadults only are less likely to succeed – especially in the medium run – than more broadlytargeted programmes. Third, longer duration programmes are associated with signifi-cantly worse short-term impacts but weakly more positive medium-term impacts. Finally,the models show a negative impact for programmes operated in the former EastGermany. Overall, we interpret the results from this analysis as quite supportive of theconclusions from our cross-country models.
4. Summary and Conclusions
Our meta-analysis points to a number of important lessons in the most recent gen-eration of active labour market programme evaluations. One is that longer-termevaluations tend to be more favourable than short-term evaluations. Indeed, itappears that many programmes with insignificant or even negative impacts after onlya year have significantly positive impact estimates after 2 or 3 years. Classroom andon-the-job training programmes appear to be particularly likely to yield morefavourable medium-term than short-term impact estimates. A second lesson is thatthe data source used to measure programme impacts matters. Evaluations (includingrandomised experiments) that measure outcomes based on time in registeredunemployment appear to show more positive short-term results than evaluationsbased on employment or earnings. A third conclusion is that subsidised public sectorjobs programmes are generally less successful than other types of ALMPs. Here,our findings reinforce the conclusions of earlier literature summaries, includingHeckman et al. (1999), Kluve and Schmidt (2002), and Kluve (forthcoming). A fourthconclusion is that current ALMP programmes do not appear to have differentialeffects on men versus women. Finally, controlling for the programme type andcomposition of the participant group, we find only small and statistically insignificantdifferences in the distribution of positive, negative and insignificant programmeestimates from experimental and non-experimental evaluations, and between pub-lished and unpublished studies. The absence of an �experimental� effect suggests thatthe research designs used in recent non-experimental evaluations are not significantlybiased relative to the benchmark of an experimental design. The similarity between
2010] F475L A B O U R M A R K E T P O L I C Y E V A L U A T I O N S
� 2010 The Author(s). The Economic Journal � 2010 Royal Economic Society
published and unpublished studies likewise eases concern over the potential for�publication bias�.
Methodologically, our analysis points to a potentially surprising feature of the recentgeneration of programme estimates, which is that the t-statistics from the programmeestimates appear to be (roughly) proportional to the effect sizes, and independent ofthe underlying sample sizes used in the evaluation. In this case a simple �vote-countinganalysis� of significantly positive effects, or an ordered probit analysis of sign andsignificance, yield the same conclusions about the determinants of programme successas a more conventional meta-analytic model of programme effect sizes. We conjecturethat researchers tend to adopt more sophisticated research designs when larger samplesizes are available, offsetting the purely mechanical impact of sample size on thet-statistics that is emphasised in much of the meta-analysis literature.
Our reading of the ALMP literature also points to a number of limitations of themost recent generation of studies. Most importantly, few studies include enoughinformation to make even a crude assessment of the benefits of the programme relativeto its costs. Indeed, many studies completely ignore the �cost� side of the evaluationproblem. Moreover, the methodological designs adopted in the literature oftenpreclude a direct assessment of the programme effect on �welfare-relevant� outcomeslike earnings, employment, or hours of work. As the methodological issues in theALMP literature are resolved, we anticipate that future studies will adopt a moresubstantive focus, enabling policy makers to evaluate and compare the social returnsto investments in alternative active labour market policies.
University of California BerkeleyRWI – EssenUniversity of Mannheim and RWI-Essen
Supporting Information
Additional supporting information may be found in the online version of this article:
Appendix A: Analysis of Estimated Programme Impacts for Germany Only
Appendix B: List of Studies Included in Analysis Sample
Please note: The RES and Wiley-Blackwell are not responsible for the content orfunctionality of any supporting materials supplied by the authors. Any queries (otherthan missing materials) should be directed to the authors of the article.
References
Ashenfelter, O. (1978). �Estimating the effect of training programs on earnings�, Review of Economics andStatistics, vol. 60, pp. 47–57.
Ashenfelter, O. (1987). �The case for evaluating training programs with randomized trials�, Economics ofEducation Review, vol. 6, pp. 333–8.
Ashenfelter, O. and Card, D. (1985). �Using the longitudinal structure of earnings to estimate the effect oftraining programs�, Review of Economics and Statistics, vol. 67 (October), pp. 648–60.
Bergemann, A. and van den Berg, G. (forthcoming). �Active labour market policy effects for women inEurope: a survey�, Annales d �Economie et de Statistique.
F476 [ N O V E M B E RT H E E C O N O M I C J O U R N A L
� 2010 The Author(s). The Economic Journal � 2010 Royal Economic Society

Biewen, M., Fitzenberger, B., Osikominu, A. and Waller, M. (2007). �Which program for whom? Evidence onthe comparative effectiveness of public sponsored training programs in Germany�, IZA Discussion PaperNo. 2885, Bonn: Institute for the Study of Labour.
Bring, J. and Carling, K. (2000). �Attrition and misclassification of drop-outs in the analysis of unemploymentduration�, Journal of Official Statistics, vol. 4, pp. 321–30.
Calmfors, L. (1994). �Active labour market policy and unemployment – a framework for the analysis of crucialdesign features�, OECD Economic Studies, vol. 22, pp. 7–47.
Card, D, Chetty, R. and Weber, A. (2007). �The spike at benefit exhaustion: leaving the unemployment systemor starting a new job?�, American Economic Review Papers and Proceedings, vol. 97, pp. 113–8.
Easterbrook, P.J., Berlin, A., Gopalan, R. and Matthews, D.R. (1991). �Publication bias in clinical research�,Lancet, vol. 337, pp. 867–72.
Gerfin, M. and Lechner, M. (2002). �Microeconometric evaluation of the active labour market policy inSwitzerland�, Economic Journal, vol. 112, pp. 854–93.
Greenberg, D.H., Michalopoulos, C. and Robins, P.K. (2003). �A meta-analysis of government-sponsoredtraining programs�, Industrial and Labor Relations Review, vol. 57, pp. 31–53.
Hagglund, P. (2007). �Are there pre-programme effects of Swedish active labour market policies? Evidencefrom three randomized experiments�, Swedish Institute for Social Research Working Paper No. 2 ⁄ 2007,Stockholm: Stockholm University.
Heckman, J.J., Ichimura, H., Smith, J.A. and Todd, P. (1998). �Characterizing selection bias using experi-mental data�, Econometrica, vol. 66, pp. 1017–98.
Heckman, J.J., Ichimura, H. and Todd, P. (1998). �Matching as an econometric evaluation estimator�, Review ofEconomic Studies, vol. 65, pp. 261–94.
Heckman, J.J., Lalonde, R.J. and Smith, J.A. (1999). �The economics and econometrics of active labourmarket programs�, in (O. Ashenfelter and D. Card, eds), Handbook of Labour Economics, Volume 3A.pp. 1865–2095, Amsterdam and New York: Elsevier.
Heckman, J.J. and Robb, R. (1985). �Alternative methods for evaluating the impact of interventions�, in( J.J. Heckman and B. Singer, eds), Longitudinal Analysis of Labour Market Data, pp. 156–246, Cambridge:Cambridge University Press.
Hedges, L.V. and Olkin, I. (1985). Statistical Methods for Meta-Analysis, New York: Academic Press.Higgins, J.P.T. and Green, S. (editors) (2008). Cochrane Handbook for Systematic Reviews of Interventions, Version
5.0.1, available at http://www.cochrane-handbook.org.Hotz, V.J., Imbens, G. and Klerman, J (2006). �Evaluating the differential effects of alternative welfare-to-work
training components: a re-analysis of the California GAIN program�, Journal of Labour Economics, vol. 24,pp. 521–66.
Imbens, G. and Wooldridge, J.M. (2009). �Recent developments in the econometrics of program evaluation�,Journal of Economic Literature, vol. 47, pp. 5–86.
Jespersen, S.T., Munch, J.R. and Skipper, L. (2008). �Costs and benefits of Danish active labour marketprogrammes�, Labour Economics, vol. 15, pp. 859–84.
Johnson, G.P. (1976). �Evaluating the macroeconomic effects of public employment programs�, in (O.Ashenfelter and J. Blum, eds), Evaluating the Labor Market Effects of Social Programs, Princeton, NJ:Princeton University Industrial Relations Section.
Kluve, J. (forthcoming). �The effectiveness of European active labour market programs�, Labour Economics.Kluve, J. and Schmidt, C.M. (2002). �Can training and employment subsidies combat European unemploy-
ment?�, Economic Policy, vol. 35, pp. 409–48.Lalonde, R.J. (1986). �Evaluating the econometric evaluations of training programs with experimental data�,
American Economic Review, vol. 76, pp. 604–20.Lechner, M. and Wunsch, C. (2006). �Active labour market policy in East Germany: waiting for the economy
to take off�, IZA Working Paper No. 2363. Institute for the Study of Labour(IZA), Bonn.Richardson, K. and van den Berg, G.J. (2002). �The effect of vocational employment training on the individual
transition rate from unemployment to work�, IFAU Working Paper 2002:8. Institute for Labour MarketPolicy Evaluation, Uppsala.
Sianesi, B. (2004). �An evaluation of the Swedish system of active labour market programs in the 1990s�, Reviewof Economics and Statistics, vol. 86, pp. 133–55.
� 2010 The Author(s). The Economic Journal � 2010 Royal Economic Society
2010] F477L A B O U R M A R K E T P O L I C Y E V A L U A T I O N S